december 2000 geo-heat center quarterly bulletin
TRANSCRIPT

8/8/2019 December 2000 Geo-Heat Center Quarterly Bulletin
http://slidepdf.com/reader/full/december-2000-geo-heat-center-quarterly-bulletin 1/28

8/8/2019 December 2000 Geo-Heat Center Quarterly Bulletin
http://slidepdf.com/reader/full/december-2000-geo-heat-center-quarterly-bulletin 2/28
GEO-HEAT CENTER QUARTERLY BULLETINISSN 0276-1084
A Quarterly Progress and Development Report
on the Direct Utilization of Geothermal Resources
CONTENTS Page PUBLISHED BY
First GEA/GRC Geothermal 1 GEO-HEAT CENTER Excellence Award Oregon Institute of Technology
John W. Lund 3201 Campus Drive
Klamath Falls, Oregon 97601
Tawau Hill Park Springs, 3
Sabah, Malaysia All articles for the Bulletin are solicited. If you wish to
Harry Chong Lye Hin and Mohd. Noh Dalimin contribute a paper, please contact the editor at the above
address.
Operational Characteristics of 5
The Gaia Snow-Melting System
in Ninohe, Iwate, JapanKoji Morita and Makoto Tago EDITOR
Drilling Geothermal Well ISO 12 John W. Lund
I’SOT, Inc. and Burkhard Bohm Typesetting and Layout - Donna Gibson
Graphics - Tonya “Toni” Boyd
Energy Department Advancing 20
Geothermal Power in the West WEBSITE http://www.oit.edu/~geoheat
Geothermal Energy Association
FUNDINGBook Review - Stories From a 22
Heated Earth - Our Geothermal The Bulletin is provided compliments of the Geo-Heat
Heritage Center. This material was prepared with the support of
Pegamon and Ronald Dippo The U. S. Department of Energy (DOE Grant No. DE-
FG07-99-EE35098). However, any opinions, findings,
Geothermal Pipeline 25 conclusions, or recommendations expressed herein are
Progress and Development Update those of the author(s) and do not necessarily reflect the
From the Geothermal Progress Monitor the view of DOE.
SUBSCRIPTIONSThe Bulletin is mailed free of charge. Please send your
name and address to the GEO-HEAT CENTER for
addition to the mailing list.
If you wish to change your Bulletin subscription, please
complete the form below and return it to the CENTER.
Name _________________________________________
Cover: Top: Glass Geothermal Excellence
Award. Bottom Left: Klamath Falls City Hall, Address_______________________________________
geothermally-heated. Bottom Right: CalEnergy’s
V.P. of Operations, Jim Turner discussing the zinc _______________________________ Zip ___________
recovery plant with the 49-MWe Unit 5 geothermal
plant under construction in the background (photo Country ______________________________________
courtesy of Ted Clutter).
Vol. 21, No. 4 December 2000

8/8/2019 December 2000 Geo-Heat Center Quarterly Bulletin
http://slidepdf.com/reader/full/december-2000-geo-heat-center-quarterly-bulletin 3/28
FIRST GEA/GRC GEOTHERMAL
EXCELLENCE AWARD
John W. Lund
Geo-Heat Center
On September 26 at the GRC Annual Meeting inBurlingame, two Geothermal Excellence Awards were
presented for the first time jointly by the Geothermal EnergyAssociation and the Geothermal Resources Council
(GEA/GRC). These were presented live by Karl Gawell,Executive Director of GEA, over the Internet at the Town
Hall meeting in the GEA Trade Show Hall at the Annual
Meeting. The two awards, one for a Facility ExcellenceAward to the CalEnergy Minerals Recovery Plant in the
Imperial Valley, CA, and the other for a CommunityExcellence Award to the city of Klamath Falls for their
Community Geothermal Project, were announced at theTown Hall meeting. The CalEnergy award was accepted by
Jim Turner, General Manager of the Minerals Recovery Plantand the Klamath Falls award was accepted by Todd Kellstrom,
Mayor of Klamath Falls--both live over the Internet, since
neither person could be present at the Town Hall meeting.The award is of curved glass with the appropriate etched
lettering as shown below (Figure 1). The presentation can beviewed over the Internet at: <www.ishow.com/doe/>.
Figure 1. Geothermal Excellence Award.
Klamath Falls is located in southern Oregon on the
east flanks of the volcanic Cascades. Big Springs and DevilsTeakettle, hot springs that originally existed within the presentcity limits, were used by the Native Americans for over 10,000
years. They were then used by the early European settlers andmore recently for space heating of homes for the past 75 years.
There are over 500 geothermal wells in use for heatingindividual residences by means of a closed loop of pipe or
downhole heat exchangers–thus conserving the water
resource. The heat has also been used for pasteurizing milk
GHC BULLETIN, DECEMBER 2000
and ice cream, in a laundry; for swimming pools and pavement snow melting systems; for heating city, county,
state, federal government buildings, a hospital, churches,schools, a performing arts center and the Oregon Institute of
Technology (OIT) campus buildings. A geothermal districtheating system using over 200oF water is used to heat 20
downtown buildings and melt snow on the sidewalks (Figure
2). One of the side benefits to the geothermal industry in theU.S. and internationally, is the collocation of the Geo-Heat
Center (GHC) on the OIT campus. The local experience has been observed and documented by the GHC staff and has
become a show-place for visitors from all over the world (thecity’s sister city is Rotorua, New Zealand--also a
geothermally-heated city). This living laboratory, along withthe information dissemination and technical assistance
provided by the GHC, has promoted the direct use of geother-
mal energy worldwide. Two international geothermal con-ferences have been held on the OIT campus, and international
engineers have worked at the Center to gain added experience.The various geothermal uses in the community results in a
savings of about 85 GWh/yr (300 billion Btu/yr), which isequivalent to saving $2 million in equivalent fossil fuel use
annually. Additional information on the uses in Klamath Fallscan be found in the GHC Quarterly Bulletin, Vol. 20, No. 1
(March 1999).
Figure 2. Klamath Falls Mayor Todd Kellstrom
frying an egg on a geothermally-heated
sidewalk (photo courtesy of Lou Sennick).
1

8/8/2019 December 2000 Geo-Heat Center Quarterly Bulletin
http://slidepdf.com/reader/full/december-2000-geo-heat-center-quarterly-bulletin 4/28
Figure 3. CalEnergy Vice President of Operations Jim Turner describing the minerals recovery facility (photo
courtesy of Ted Clutter).
The CalEnergy Operating Corporation’s Minerals
Recovery Plant is part of a $400-million expansion of their
geothermal power complex on the shores of the Salton Sea insouthern California’s Imperial Valley. The new construction
includes nearly 60 MWe of new geothermal electric capacity,and a plant to recover commercial-grade zinc from the
geothermal brine produced for power generation. Unit 5, a49-MWe facility, utilizes high-temperature spent brine from
four other units to produce electricity for the mineralsrecovery operation. Only 20 MWe will be used for the zinc
production, with the excess power sold into the Californiaderegulated electricity market. The $280-million mineral
recovery facility (Figure 3) uses a combination of already
existing technologies that were modified for this project.
2
Besides ion exchange, the facility employs solvent extraction
and “electro-winning” to extract zinc from the spent brine that
is supplied at a flow rate of 20 million lbs/hr. The brinecontains 550 to 600 ppm of zinc, but high grade silica and
manganese may also be extracted. The result is nearly purezinc (99.99% pure) deposited on large cathodes; where, it is
then removed and melted into 2,400 lb ingots. The projectwill recover an estimated 30,000 metric tons (66 million lbs)
of zinc per year. Additional details on this unique “greenenergy” project combining geothermal electric power and an
industry can be found in an article by Ted Clutter in Vol. 21, No. 2 (June, 2000) of the GHC Quarterly Bulletin or from the
GRC Bulletin, Vol. 29, No. 1 (Jan./Feb. 2000).
GHC BULLETIN, DECEMBER 2000

8/8/2019 December 2000 Geo-Heat Center Quarterly Bulletin
http://slidepdf.com/reader/full/december-2000-geo-heat-center-quarterly-bulletin 5/28
TAWAU HILL PARK SPRINGS, SABAH, MALAYSIA
Harry Chong Lye Hin & Mohd. Noh Dalimin
School of Science & Technology
University Malaysia Sabah
Tawau Hill Park (N04o14'42.7'’, E117o53' 03.3'’) is
located 20 km north of Tawau town. This 280 km2 virgin
lowland dipterocarp forest has been advertized as a state park
since 1979 and it houses many interesting species such as
Phalaenopsis gigantea, Presbytis rubicunda, Tarsius
bancanus, Otus lempiji and the rhinoceros hornbill. Within a
few kilometres of the park headquarters itself, two waterfalls
and 11 warm sulphurous springs are found.
The natural setting of this park, made up of this
beautiful combination, has lured tourists regularly, especially
the local people of Tawau. Throughout the year of 1999,
17,624 tourists arrival had been recorded. This figure is
expected to rise further once the road-upgrading project is
completed.
One of the tourist attractions is the warm sulphuroussprings situated 3.2 km from the Bombalai Hostel. An hour
walking along the jungle track will lead you to the first spring
(labeled 2A). As seen in Figure 1, eleven warm sulphurous
springs (25-33.7oC) occur along the 250 m stretch of the
Upper Tawau River. The temperature distribution of the
springs is noteworthy; as the spring water got hotter to the
south. The elevation of this site is approximately 370 m above
sea level. The springs outlets are on the riverbed or by the
bank just below the water level. According to Limet. al .
Figure 1. Distribution of warm sulphurous springs
in Tawau Hill Park.
GHC BULLETIN, DECEMBER 2000
(1990), the northeasterly alignment of the springs indicates
structural control. The close proximity of these springs to
major northeasterly trenching lineaments observed on
LANDSAT imagery had been noted by Lim (1988).
The spring waters are acidic (pH 3.68-4.10). A
strong hydrogen sulphide smell can be detected at 150 m range
before reaching the first spring (2A). The waters of Spring
2A emerge from among boulders of rhyolitic rocks (Figure 2).
The boulders surrounding the springs are characteristically
sulphur coated (Figure 3).
Figure 2. Spring water emerging from boulders of
rhyolitic rocks.
It is not possible to obtain a total flow discharge of
this area; however, Spring 2B has a flow discharge of 0.15
L/s, a pH of 4.04 and a temperature of 31.5oC. The chemistry
of Spring 2B is summarized in Table 1. The temperature was
23.6oC and the pH 6.50 at 10 m downstream from this spring.
At 10 m upstream, the temperature was 23.1oC and the pH
3

8/8/2019 December 2000 Geo-Heat Center Quarterly Bulletin
http://slidepdf.com/reader/full/december-2000-geo-heat-center-quarterly-bulletin 6/28
Figure 3. The sulphur-coated boulders downstream
of the spring.
7.51. The Tawau River flow rate here is approximately 1,600
L/s. The temperature downstream of all the springs was
24.3oC and the pH 6.35. Upstream of all the springs, the
stream temperature was 23.1oC and the pH 7.51.
From the data available on these springs, they
indicate that there are heat transfer processes at deeper level
to a hydrothermal reservoir in the nearby region (Lim et. al .,1991). We do notice that the geothermal water is not hot
enough for any direct use in this region; however, we strongly
believe that these springs have an important role to play in the
nature tourism industry of Tawau Hill Park. According to the
local people, the spring water has its own medicinal properties
for skin treatment. Bathing in these springs is popular here.
4
Table 1. Chemistry Characteristic of Spring 2B (Lim, et
al., 1991)
Sample T2B
Site temp. oC
pH at 25oC
Dissolved SiO2
Total SiO2
Ca
MgK
Na
Li
HCO3
SO4
Cl
F
B
As
Fe
Mn
Total solids
TurbidityConductivity
31.5
3.7
Not analyzed
32 ppm
138.66 ppm
14.91 ppm3.55 ppm
14 ppm
Not detected
7.32 ppm
500 ppm
6 ppm
0.23 ppm
Not detected
5 ppm
1.4 ppm
0.4 ppm
64 mg/L
Not analyzed835 Fmhos
REFERENCES
Lim, P. S., 1988. “Geology and Geothermal Potential of the
Tawau Area, Sabah.” Geological Survey Malaysia
1987 Annual Report : 402-413.
Lim, P. S.; Intang, F. and F. O. Chan, 1991. “Geothermal
Prospecting in the Semporna Peninsula with
Emphasis on the Tawau Area.” Geological Society
Malaysia, Bulletin 29: 135-155.
Lim, P. S.; Intang, F. and F. O. Chan, 1990. “Geothermal
Prospecting in the Semporna Peninsula with
Emphasis on the Tawau Area.” Presented at GSM
Annual Geological Conference 1990.
GHC BULLETIN, DECEMBER 2000

8/8/2019 December 2000 Geo-Heat Center Quarterly Bulletin
http://slidepdf.com/reader/full/december-2000-geo-heat-center-quarterly-bulletin 7/28
OPERATIONAL CHARACTERISTICS OF
THE GAIA SNOW-MELTING SYSTEM
IN NINOHE, IWATE, JAPAN
DEVELOPMENT OF A SNOW-MELTING SYSTEM WHICH UTILIZES
THERMAL FUNCTIONS OF THE GROUND
Koji Morita1 and Makoto Tago21National Institute for Resources and Environment, 16-3 Onogawa, Tsukuba, Ibaraki 305-8569, Japan
2Akita University, 1-1 Tegatagakuencho, Akita City 010-8502, Japan
ABSTRACTThe authors have developed the Gaia Snow-Melting
System, which utilizes the ground as a heat source and heatstorage body. Another characteristic of the Gaia Snow-Melting System is the utilization of the Downhole CoaxialHeat Exchangers (DCHEs) proposed by the authors. In thissystem, solar heat absorbed in a pavement is recovered andstored in the ground over summertime. Hence, both geother-mal heat and solar heat are used for melting snow in winter.
The first Gaia Snow-Melting System was installed inDecember 1995 in Ninohe, Iwate Prefecture. The systemcovers an area of 266 m2. Three DCHEs, each 8.9 cm in outer diameter and 150.2 m long, and a heat pump driven by a 15-kW electric motor were used. Adjustments of the setting
parameters of the operation control system were performedduring the first winter and first summer of operation.Modifications of the control system were carried out beforethe second winter.
In winters (not including the first winter), the averagecoefficients of performance (COP) for the heat pump have
been 4.2 to 4.3 and the average specific heat extraction rates80 to 83 W/m. The Gaia system's annual electric power consumption per unit area has been less than 20% that of the
electric heating cable systems used in the same city.The cumulative heat charged into the ground from the
onset of operation until the end of November 1998 was greater than that extracted from the ground during the same period.Temperature profiles measured at an observation DCHE havechanged year by year. However, the average temperature inthe DCHE before the winter of 1998 was almost the same asthat of the initial temperature profile in the DCHE. A moreappropriate design and higher performance will be realized inthe next system.
INTRODUCTIONThe Japan Sea side of Japan from central Honshu
through Hokkaido is subject to heavy snowfall. Many snow-
melting apparatuses have been used over the past severaldecades and have been increasing in number. The oldest andmost utilized method for melting snow is the sprinkling of groundwater over roads. However, the associated problems of ground subsidence and the dropping of groundwater levelshave emerged. Apparatuses using electric heating cables and
boilers burning oil or gas have been increasing in number especially in northern Japan, where the sprinkling of ground-water is not applicable. This can lead to an increase in theconsumption of fossil fuels, and thereby, the emission of carbon dioxide.
GHC BULLETIN, DECEMBER 2000
The authors have developed the Gaia Snow-MeltingSystem, which utilizes the ground as a heat source and a heatstorage body. This system’s main heat source is thegeothermal heat contained in the shallow ground and itsauxiliary source is summertime solar heat. Another characteristic of the system is the utilization of the DownholeCoaxial Heat Exchangers (DCHEs) proposed by the authors(Morita, et al.,1985; Morita and Tago, 1995). The DCHEutilizes thermally insulated inner pipe and reverse circulation
(i.e., cold fluid flows down the annulus and warmer fluidflows up through the inner pipe) for efficient heat extraction.
The first Gaia Snow-Melting System was installed in Ninohe, Iwate Prefecture and has been in operation sinceDecember 1995. So far, this Gaia system has functionedeffectively and has eliminated accidents due to snow or ice.
THE GAIA SNOW-MELTING SYSTEMThe Gaia Snow-Melting System consists of DCHEs,
a heat pump and heating pipes embedded in the pavement(Fig. 1).
Figure 1. Conceptual drawing of the Gaia Snow- Melting System.
In winter, heat extracted from the ground with theDCHEs is transferred to the heat pump. After the heat pumpincreases the temperature, the thermal energy is transmitted toa heating medium circulating through a network of heating
5

8/8/2019 December 2000 Geo-Heat Center Quarterly Bulletin
http://slidepdf.com/reader/full/december-2000-geo-heat-center-quarterly-bulletin 8/28
pipes for melting snow. Antifreeze is used as both a heatextraction medium and a heating medium.
In summer, solar heat raises the temperature of the pavement, in which the heating pipes are embedded, up to be-tween 30 to 50EC. The solar heat is recovered from the pave-ment and charged into the ground by directly connecting theDCHEs and heating pipes, and by circulating antifreeze in thisloop. Forward circulation is employed for efficient heatcharging.
Thus, geothermal heat and summertime solar heat are
used for melting snow in winter.A newly developed control system operates the Gaia
system automatically when road conditions meet specifiedcriteria for melting snow or charging heat.
A numerical simulation code has been developed for predicting the operational behavior and performance of thesystem including DCHEs and a heat pump. This code wasused for designing the Gaia system in Ninohe and for
predicting its performance. Another code for analyzingtemperature behavior in the pavement and the roadbedsurrounding the heating pipes has been developed after theinstallation of the first Gaia Snow-Melting System. Thesetwo codes make it possible to design the system appropriately,meeting specific site conditions, and to predict the
performance of the system.
THE GAIA IN NINOHE Ninohe City is located about 500 km north of Tokyo.
The Gaia system was installed at the downhill section of acurved road with a 9% gradient in order to prevent accidentscaused by skidding and sliding vehicles in winter. The areacovered by the snow-melting system is 4 m wide and 65 mlong, covering a total area of 266 m2.
The formation consists of Tertiary sandy tuff.Preliminary numerical simulations for the first winter’s opera-tion indicated the effective thermal conductivity of theformation to be 1.3 W/m•K. The temperature at the bottom of one of the DCHEs, 150.8 m in depth, was 22.5EC before the
initial operation of the system, at one month after thecompletion of the DCHE.
Three DCHEs (Fig. 2), each 8.9 cm in outer diameter and 150.2 m long, a heat pump driven by a 15-kW electricmotor and two 0.75-kW circulation pumps are used. Poly-
butene pipes of 16 mm in inner diameter are used as heating pipes and were embedded in the asphalt concrete pavement at20 cm intervals. The depth of the top of the heating pipes is10 cm from the surface of the pavement. The thermal capacityof the Gaia System is approximately 50 kWt.
Snow-Melting OperationIn the current control system, the operation of the
Snow-Melting System in the snow-melting mode is controlled
utilizing information from a road surface temperature sensor and two road surface water detectors, one water detector witha heater inside and another without a heater. The heater is for melting snow or ice on the surface of the detector, and thus,snow or ice can be detected as water. The system begins itsoperation when the road surface temperature becomes lower than a specified value and one or both water detectors detectwater. When the road surface temperature is higher than thespecified value or when neither water detectors detect water,the system doesn’t operate or its operation is stopped. The
6
Figure 2. Structure of the DCHE.
sensitivity of these water detectors is so high that the operationof the system begins immediately after the onset of snowfall.
It has been demonstrated that the Gaia system is aneffective method to melt snow on roads. Figures 3 and 4show the snow-melting conditions on February 13, 1996. Sofar, four snow-melting seasons have passed since theinstallation of this system. The operational characteristics of the system in the snow-melting mode are introduced heremainly using data from the winter of 1997. The average lowtemperature for the month of January was –8.3EC in thatwinter in the city.
Figure 5 shows the daily snowdepth differences inthe winter of 1997 measured by a weather station of theAMeDAS (Automated Meteorological Data AcquisitionSystem) located in Ninohe City. This station is located about10 km east of the Gaia system. The daily snowdepth
difference is a positive difference between the snowdepth of a certain day and that of the previous day. Hence, the number of actual snowfall days is greater than the snowfall daysshown in Figure 5.
In Ninohe City, snow-melting operations begin at the beginning of December and end at the end of March(hereinafter, this period shall be called the snow-meltingseason). The total snowdepth difference for the 1997 snow-melting season was 223 cm.
GHC BULLETIN, DECEMBER 2000

8/8/2019 December 2000 Geo-Heat Center Quarterly Bulletin
http://slidepdf.com/reader/full/december-2000-geo-heat-center-quarterly-bulletin 9/28
Figure 3. Snow-melting condition at the upper section of the road on February 13, 1996.
Figure 4. Snow-melting conditin at the lower sectionof the road on February 13, 1996.
Figure 5. Daily snowdepth differences at theweather station in the 1997 snow-melting
season.
Figure 6 shows the changes in the daily operationtimes over the 1997 snow-melting season. The number of operation days in Figure 6 is greater than the snowfall daysshown in Figure 5. This is because of the nature of the dailysnowdepth difference and limitations in the resolution of theAMeDAS, which is 1 cm. Also, the system sometimes goesinto operation because of rain or condensation of water in theair on the road surface. The total operation time of the systemover the 1997 snow-melting season was 491.9 hours.
GHC BULLETIN, DECEMBER 2000
Figure 6. Daily operation time of the system in the1997 snow-melting season.
Figure 7 shows the changes in the antifreeze tempera-ture at the outlet of the observation DCHE and in the ambienttemperature at the weather station. The Gaia snow-meltingsystem normally works in an ambient temperature range
between the average and the low temperatures. Hence, theambient temperature ranges shown in Figure 7 are ranges be-tween the average and low temperatures. It can be seen that
the outlet temperatures of the DCHE are higher than theambient temperatures by 1.4 to 20.4EC.
Figure 7. Daily average outlet temperatures of DCHE and ambient temperatures in the1997 snow-melting season.
Figure 8 shows the changes in the deliverytemperatures of the heating medium from the heat pump to theheating pipes. Except in the case of short daily operationtimes, daily high temperatures of delivery temperaturesroughly ranged from 28 to 36EC and daily average tempera-tures 25 to 30EC.
Figure 9 shows the changes in the extracted heat withDCHEs and delivered heat from the heat pump to the heating
pipes in the 1997 snow-melting season. The total suppliedheat with this system was 21.8 MWth and extracted heat withthe DCHEs was 16.6 MWth (about 76% of the total suppliedheat of the system).
Figure 10 shows the changes in the thermal outputrate of the system and the heat extraction rate of the DCHEs.
Normally, both rates decrease after the onset of operation withthe progress of the season and recover after late January or early February. This tendency is associated with the decreaseand recovery in the outlet temperature of the DCHEs.Therefore, this figure indicates that the heat pump is mostly
7

8/8/2019 December 2000 Geo-Heat Center Quarterly Bulletin
http://slidepdf.com/reader/full/december-2000-geo-heat-center-quarterly-bulletin 10/28
Figure 8. Change in delivery temperatures in the1997 snow-melting season.
Figure 9. Thermal output of the system in the 1997 snow-melting season.
at full load in January and February, and thus, the selectedheat pump for the Gaia system was appropriate from the view
point of capacity.
Figure 10. Changes in thermal output rate of the system and DCHEs in the 1997 snow-melting season.
Table 1 summarizes the major characteristic valuesof the system in snow-melting operations for four winters.Despite a smaller total daily snowdepth difference, thesupplied heat in the 1996 snow-melting season was greater than that of the previous season. This is because of amodification in the temperature control unit and an increase in
the heat supply rate with this modification.In winters (except for the first winter), the average
supplied heat to the heating pipes per unit area of the snow-melting area over a snow-melting season ranged from 178 to185 W/m2, and the average specific heat extraction rates of theDCHEs ranged from 80 to 83 W/m. These high specific heatextraction rates at a low effective thermal conductivity of theformation is mainly due to the small operation rate of thesystem. Coefficients of performance (COP) ranged from 4.2to 4.3 for the heat pump and 3.4 to 3.6 for the whole system.
Table 1. Major Characteristic Values for Snow-Melting Seasons
Snow-Melting Season 1995 1996 1997 1998
Total Snowdepth Difference (cm)Avg. Low Temp. for January (oC)Operation Time of System (h)Operation time of HP (h)Avg. Inlet Temp. of DCHE (oC)Avg. Outlet Temp. of DCHE (oC)Avg. Delivery Temp. of HP (oC)Avg. Return Temp. to HP (oC)Extracted Heat (kWth)Supplied Heat (kW
t
h)Avg. Outlet of HP (kWt)Heat Supply Rate per Unit Area (Wt/m
2)Specific Heat Extraction Rate (Wt/m
w)Electric Power Consumption (kWeh)Power Consumption of HP (kWeh)Avg. COP of HP (-)Avg. COP of Total System (-)Seasonal Performance Factor (-)
234-7.1
460.0381.51.74.826.219.3
12,33016,230
42.516071.8
5,1643,8994.163.423.14
149-4.6
417.7393.42.15.326.619.4
14,74019,36049.218583.2
5,9394,6174.193.593.26
223-8.3
491.9460.70.23.4
26.219.2
16,60021,81047.317880.06,6415,2114.193.573.28
323-6.2
597.2507.31.14.3
25.418.5
18,87024,65048.618382.57,3635,7794.273.603.33
Note: Data for each winter are for a period from the first of December to the end of March except for the 1995 snow-meltingseason. Data for 1995 are for a period from December 27, 1995 to March 31, 1996.
8 GHC BULLETIN, DECEMBER 2000

8/8/2019 December 2000 Geo-Heat Center Quarterly Bulletin
http://slidepdf.com/reader/full/december-2000-geo-heat-center-quarterly-bulletin 11/28
Heat-Charging OperationIn heat-charging mode, the system kicks into
operation when the difference between the pavementtemperature and a bottom-hole temperature of the observationDCHE becomes greater than a specified value. The heat-charging operation is stopped when the difference between theinlet temperature and the outlet temperature of the DCHE
becomes smaller than a specified value.Here, the operational characteristics over the 1998
heat-charging season, the season after the 1997 snow-melting
season, are introduced.Figure 11 shows changes in operation time at
Japanese Standard Time. As shown in Figure 13, the dailyaverage heat charging rates were almost constant over most of the heat charging period. Hence, the daily charged heat wasessentially proportional to the daily operation times. Thelength of daily operation time was closely related to the totaldaily insolation, and most non-operation days in the periodfrom May to the middle of October coincided with the dayswhen no sunshine were observed at the weather station.
Figure 11. Operation time of the system at Japanese Standard Time in the 1998 heat-charging season.
Figure 12 shows changes in inlet temperature of theobservation DCHE and its bottom-hole temperature at 9 a.m.The bottom-hole temperature changed in a similar manner tothat of the inlet temperature. Gradual decrease in the bottom-hole temperature after the last heat-charging operation mighthave been due to self-circulation of the working fluid in theDCHEs.
Figure 12. Changes in inlet temperature of theobservation DCHE and its bottom-holetemperature in the 1998 heat-charging
season.
GHC BULLETIN, DECEMBER 2000
Figure 13 shows changes in the heat charging rate.The reason for the high heat charging rate in April, despite thelow inlet temperature of the DCHE, was mainly due to the lowformation temperature caused by heat extraction in the
preceding winter. An increase in the formation temperaturefollows that of the inlet temperature, and the temperaturedifference between the working fluid in the DCHEs and thesurrounding formation is limited in a narrow range.Therefore, the increase in the heat charging rate was verysmall from April to August.
Figure 13. Changes in heat charging rate in the 1998heat-charging season.
Table 2 summarizes the major characteristic valuesof the system over three heat-charging seasons. Becauseadjustment of setting parameters of the operation controlsystem was performed, values for the first season did not fullyreflect weather conditions. The average heat recovery rate per unit area of the snow-melting area was 92 to 113 W/m2. Theaverage specific heat charging rates of the DCHEs rangedfrom 54 to 67 W/m. Heat charging rates per unit electric
power consumption over a heat-charging season were 13.4 to23.8 kWth/kWeh.
System’s Behavior and PerformanceHeat Balance
Figure 14 shows the seasonal extracted and chargedheat since the onset of the operation of the system.
Figure 14. Charged heat and extracted heat up to March 31, 1999. Operation year is fromthe first of April to the end of March inthe next year.
9

8/8/2019 December 2000 Geo-Heat Center Quarterly Bulletin
http://slidepdf.com/reader/full/december-2000-geo-heat-center-quarterly-bulletin 12/28
Table 2. Major Characteristic Values for Heat-Charging Seasons
Heat-Charging Season 1996 1997 1998
Total Insolation (kWth/m2)Operation time of the System (h)Avg. Inlet Temp. of DCHE (oC)Avg. Outlet Temp. of DCHE (oC)Charged Heat (kWth)Recovered Heat per Unit Area (kWth/m2)Heat Recovering Rate (Wt/m
2)
Heat Charging Rate (kWt)Specific Heat Charging Rate (Wt/m)Electric Power Consumption (kWeh)Seasonal Performance Factor (-)
892339.226.722.3
8,27031.192
24.454.161913.4
925691.628.423.4
19,49073.3106
28.262.587222.4
870716.327.121.8
21,51080.9113
30.066.690323.8
The cumulative charged heat into the ground up tothe end of November 1998 was greater than the cumulativeextracted heat over the same period. It seems that the greater the extracted heat in preceding season, the greater the chargedheat in the successive season.
Changes in Temperature Profiles in a DCHEFigure 15 shows measured temperature profiles in the
observation DCHE at the beginning of the snow-meltingseason. As can be seen in this figure, temperature profileshave changed year by year. However, average temperaturesin the DCHE over a section from 10 m in depth to the bottom-hole have remained almost the same. The averagetemperatures for 1995, 1996, 1997 and 1998 were 17.04,16.95, 16.88 and 17.07EC, respectively. It is clear that theheat charging operation has been effective in preventingdeterioration of the ground’s function as a heat source.
Figure 15. Change in temperature profiles in theobservation DCHE.
10
The temperature profiles are becoming more verticalyear by year. This is mainly due to self-circulation in theDCHE and vertical redistribution of heat in it and in thesurrounding formation. Collected data from a flow meter inthe snow melting seasons indicate that self-circulation occursafter the end of each operation of the system.
Power Consumption and Electric Power CostsTable 3 shows the annual power consumption of the
Gaia System per unit area of the snow-melting area for theoperation years of 1996 to 1998, and the coinciding electric
power costs. Values for electric heating cable systems in thecity installed by the Iwate prefectural government are alsoshown in the table.
Table 3. Annual Power Consumption and PowerCost of the Gaia Snow-Melting Systemalong with Those of Electric HeatingCable Systems in Ninohe City (opera-tion year is from the first of April to theend of March in the next year).
Power Consumption
(kWh/m2/y)
Power Cost
(Vm2/y)
Operation
Year
Electric
Heating
Cable Gaia
Electric
Heating
Cable Gaia
1996
1997
1998
145.4
154.7
168.9
24.7 (17.0%)
28.3 (18.3%)
31.2 (18.5%)
4,1082.4
4,259.5
4,201.0
771.6 (18.9%)
809.8 (19.1%)
792.3 (18.9%)
The power consumptions of the Gaia System were 17to 19% those of the electric heating cable systems. Thismeans that more than an 80% decrease in fossil fuel consump-
tion or carbon dioxide emission can be obtained by replacingelectric cable systems with the Gaia System. Annual electric
power costs, including those for electric capacity and for power consumption, were about 19% those of the electriccable systems.
Modifications of the Control SystemBased on the experiences of the first snow-melting
season, modifications of the control system were made beforethe second winter.
GHC BULLETIN, DECEMBER 2000
8/8/2019 December 2000 Geo-Heat Center Quarterly Bulletin
http://slidepdf.com/reader/full/december-2000-geo-heat-center-quarterly-bulletin 13/28
Modification of the Operation Control UnitIn the initial control system, the operation of the Gaia
system was controlled using information from one roadsurface temperature sensor and one road surface water detector with a heater inside. In the first winter, it wasobserved several times that the system stopped before the roadsurface completely dried up and the surface froze instantly.This occurred on very cold days. The cause of this
phenomenon was that the water detector’s surface dried upearlier than the road surface, because of the heater installed in
the detector. Hence, another water detector without a heater was added to prevent the above phenomenon.
Modification in the Manner of Adjusting the Capacity of theHeater in the Water Detector
The capacity of the heater inside the water detector used to be manually adjustable at three degrees. In the firstwinter, the capacity was fixed at the medium degree. Themajor problem associated with this system was the freezing of the water detector’s surface at very low ambient temperatures.In the modified control system, the degree of the capacity isadjusted automatically referring to the ambient temperature.
Modification of the temperature control unit
Initially, it was designed so that the heat pumpoperates to keep the return temperature of the antifreeze, fromthe heating pipes to the heat pump, at a specified temperature.In the modified control system, the heat pump is operated sothat the temperature of the pavement is kept at another specified temperature. The major purposes of thismodification were:
! To increase the temperature of the pavement up to asufficient temperature level for melting snow as fastas the system's capacity allows, and
! To avoid intermittent operation of the heat pump. Inactuality, frequent and intermittent operation of theheat pump was observed in the first snow-melting
season.
FUTURE IMPROVEMENTSIn order to achieve higher performance than that
attained with the first system, the following modifications will be made in the next Gaia Snow-Melting System.
! Plastic pipes more thermally conductive than polybutene pipes will be used as heating pipes.
! The interval between heating pipes will be shortenedfrom 20 cm in the first system to 15 cm.
GHC BULLETIN, DECEMBER 2000
These two modifications will enable the supply of required heat flux for melting snow at lower heating mediumtemperatures by several degrees. This will result in a higher heat pump performance.
Also, a more efficient heat pump than that used in thefirst system will be employed, because the authors have learntthat is available on the commercial market.
CONCLUSIONSThrough several years of operation, it has been
demonstrated that the Gaia Snow-Melting System is aneffective system for melting snow and is environmentally
benign. Also, an economic analysis, which was carried outseparately, indicated that the Gaia System is economical.
The high load factor of the heat pump and a highspecific heat extraction rate attained with this system indicatedthat the design of the system was adequate. A more appro-
priate design and higher performance will be realized in thenext system.
The authors’ primary purpose is to promote theutilization of the thermal functions of the ground in Japan.Currently, the authors are carrying out the design andeconomic evaluation of systems. These systems are appliedfor melting snow, space heating and cooling, and for indoor
swimming pools. Some of them will be realized within thenext several years.
ACKNOWLEDGMENTThis article was originally presented in Proceedings
of the World Geothermal Congress 2000 on CD-ROM (pp.3511-16). We extend our appreciation to the authors and theInternational Geothermal Association for allowing us torepublish the article in this Bulletin.
REFERENCESMorita, K.; Matsubayashi, O. and K. Kusunoki, 1985.
“Down-hole Coaxial Heat Exchanger UsingInsulated Inner Pipe for Maximum Heat Extraction.”
GRC Transactions, Vol. 9, Part I, pp. 45-49.
Morita, K. and M. Tago, 1995. “Development of theDownhole Coaxial Heat Exchanger System:Potential for Fully Utilizing Geothermal Resources.”GRC Bulletin, Vol. 24, No. 3, pp. 83-92.
11

8/8/2019 December 2000 Geo-Heat Center Quarterly Bulletin
http://slidepdf.com/reader/full/december-2000-geo-heat-center-quarterly-bulletin 14/28
DRILLING GEOTHERMAL WELL ISO
Prepared for
I’SOT, Inc. PO Box 125, Canby, CA 96015
by
Burkhard Bohm
CA Certified Hydrogeologist No. 337
INTRODUCTION
This report was prepared for Mr. Dale Merrick of I’SOT, Inc. to document the process that led to drilling and
completion of their geothermal well ISO-1, located in Canby,
Modoc County, California. The drilling project wascompleted during the months of April, May and June 2000.
Construction of the well was partially funded by USDOE, and partially by I’SOT, Inc. This report does not include analysis
of well testing data.The report was prepared from the author’s notes
taken while being on site, and notes taken from phone reports by Dale Merrick and daily driller’s reports. The purpose of
this report is to document and analyze the data and documentwhat has been learned from this project.
DRILL SITE LOCATION AND FEASIBILITY
ANALYSIS
As is typical in such projects, the drilling site had to be selected based on practical considerations dictated by the
infrastructure of the I’SOT property. An empty lot wasselected, large enough to accommodate all drilling equipment,
and close to the facilities that would eventually be served bythe well. Subsequent aerial photo analysis hinted at the
presence of a lineament in close proximity to the well site,thereby verifying the suitability of the selected site.
Feasibility of the drilling project was based on anearlier analysis by the Geo-Heat Center, assuming a depth toreservoir of 1,600 ft, based on the data obtained in the 1970s
from the Kelley Hot Springs Area (KHS), located less thantwo miles to the east.
For the purpose of permitting and bidding, a synopsisof geologic and hydrogeologic information pertinent for this
drilling project was prepared. Pertinent reports and drillerslogs were reviewed to determine if:
• Water quality expected would be suitable for
disposal either in a wetland or the nearby Pit River,
• The desired temperatures can be found within the
proposed target depth of 1,600 ft, and• That depth can be reached with the proposed drilling
budget.
A number of reports were reviewed, copies of which
were obtained in 1990 from the State Division of Oil, Gas andGeothermal (CDOGG). Most of the data were drawn from a
report prepared by GeothermEx for Thermal Power Company,
dated March 1977. Other information included a report prepared by Eliot Allen (1986), local driller’s logs, and a
12
number of chemical analysis data sets. Much of this effort
also benefitted from what had been learned in the late-80s andearly-90s in the Alturas and Bieber drilling projects (PGH,
1992, GJ&A, 1987 and others).
Given the limited budget, no additional field work was conducted to gather additional data.
Based on data from the Kelley Hot Springs wells andthe Alturas, California city wells, the proposed well was
anticipated to be flowing artesian, producing out of fracturedlithified tuffs. Although the initially proposed target depth was
1,600 ft, it was recommended to plan for a minimum targetdepth of 2,000 ft, to assure flexibility to accommodate
unforeseen cold water zones above 1,600 ft, and theuncertainty of finding a water bearing zone at 1,600 ft. More
so it would have provided for sufficient resources to drill to an
aquifer that was at a temperature similar to the minimumobserved in the KHS wells.
GEOLOGIC CONDITIONS AT DEPTH
Based on geophysical, geochemical and drilling data, previous investigators concluded that the Kelly Hot Springs
area, including Canby is underlain by an extensive geothermalaquifer below 1,600 ft, reaching down to more than 3,000 ft
(GeothermEx, 1977). For example resistivity data suggest alow resistivity area extending several miles across Warm
Springs Valley from east to west.In the 1970s, at least two deep wells were drilled near
Kelley Hot Springs to depths exceeding 3,000 ft. The wells
were drilled in the 1960s and 1970s, by GRI and GPC. These bore holes penetrated clays, silts, sands and gravels and their
lithified equivalents, plus intermittent basaltic lava flows.Apparently the lithology extending east from KHS is relatively
consistent, and was assumed to be similar at the proposeddrilling location to the west.
The temperatures encountered by the KHSexploration wells were measured at 239oF maximum. This
temperature prevails below 1,600 ft down to more than 3,000
ft. Temperature gradients in several shallow temperature
gradient holes near KHS were more than 30o
F per 100 ft.The area where drilling was proposed as part of this
project has higher resistivity at depth, which could be
indicative of geothermal water diluted by river water, or alower permeability zone. This may have affected the success
of this well, symptomized in somewhat lower temperaturesand greater depth to a production zone.
In previous years, a number of wells were drilled
near the I’SOT geothermal well location, but these wells donot exceed 900 ft. Geologic conditions below that (i.e., down
GHC BULLETIN, DECEMBER 2000

8/8/2019 December 2000 Geo-Heat Center Quarterly Bulletin
http://slidepdf.com/reader/full/december-2000-geo-heat-center-quarterly-bulletin 15/28
to the proposed target depth of 1,600 ft, or deeper) were
extrapolated from the deep wells drilled near the Kelley HotSprings (KHS), and from the two temperature logs prepared
by Eliott Allen and Associates in 1984.
Gradients observed in the nearby Canby School Well No. 1 were up to 7 oF per 100 ft, similar as in the nearby I'SOT
test well drilled in 1985 (Eliot Allen, 1986). Assuming asurface temperature of 58oF and a gradient of 7oF per 100 ft,
the proposed well was expected to reach a temperature of
170o
F at 1,600 ft, assuming no major shallow aquifer(s) hadto be penetrated before target depth.The temperatures encountered by the KHS
exploration wells were measured at 239oF maximum. Thistemperature prevails below 1,600 ft down to more than 3,000
ft. Temperature gradients in several shallow temperature
gradient holes near KHS were more than 30oF per 100 ft.However, given the data from Eliot Allen & Associates (1986,
p. 75) from the I'SOT well, the temperature is more likely to be about 150oF.
DRILLING HISTORY
The drilling history is summarized in the Table 1.
The well was spudded on April 3, 2000. The contractor wasStory Drilling Services (SDS) of Klamath Falls (selected by
bidding).
Although initial drilling progress was reasonably
good below about 400 ft, drilling progress slowed downsignificantly due to the sticky clay (fine-grained tuffs)
formations, eventually forcing the driller to drill with a bladeauger bit. This problem, from the start, severely affected the
course of the drilling project, and added to the project’scontinuing budgetary problems.
On May 4, when the hole had reached a depth of 900ft, a temperature log was conducted. The results were
encouraging, suggesting a gradient of about 7oF per 100 ft, as
predicted. Although the gradient observed in this log was stillaffected by previous drilling mud circulation, the observed
temperature of 110oF at 850 ft reasonably well matched theexpected temperature of 150oF at 1,600 ft (assuming a
gradient of 7.14oF per 100 ft). In other words, up to thatdepth, the temperature gradient was as expected. Assuming a
desired resource temperature of 160oF, it was expected thetarget depth would still be 1,600 ft to obtain such a resource
(assuming there would be a water bearing zone at that depth).By May 11, a depth of 1,599 ft was reached. Although the
original target depth had been reached, no water bearing
formation was encountered and a decision had to be madewhether to drill deeper. At this time, another temperature log
was run. The results of this log were disappointing.However, given the fact that the lithology had not changed
significantly since 850 ft, it was assumed that these resultswere affected by inadequate temperature equilibration
following mud circulation. However, given the financialcommitment made so far, the operator felt uncomfortable
stopping short of a major resource. For that reason, it wasdecided to allocate more financial resources and to continue
drilling until a resource was found. Under the given gradient,
GHC BULLETIN, DECEMBER 2000
assuming a minimum reservoir temperature of 125o F, the
operator felt it was worth continuing drilling until a resourcewas found, presumably above 2,300 ft.
Given continuing concerns about potential sloughing
problems after more than five weeks of drilling, it was decidedto set and cement 6 5/8- inch casing (0.250” wall strength) to
1,600 ft before continuing with drilling. The casing stringincluded a 10-inch diameter pump chamber (10 ¾-inch OD,
0.280” wall) from surface to 251 ft, connected to the 6-inch
casing with a bell reducer.Drilling continued with a 5 7/8-inch bit. By May 31,a depth of 1,952 ft had been reached. Although still no
significant change in lithology was encountered, increasingoccurrence of partially lithified tuffs below 1830 ft. An
important observation was a red zone of lithified fine-grained
tuff at about 1,950 ft, suggesting maybe a fault zone.On June 5, another temperature log was conducted.
A bottom hole temperature of 208oF was measured at 1,908 ftwith a maximum mercury thermometer. The decrease of the
temperature gradient below 1,830 ft (obtained by Wellenco),was encouraging, suggesting a change in formation
characteristics, maybe associated with some fracturing.
By June 8, the hole had reached 2,100 ft--themaximum depth the contractor could drill to (due to limiteddrill pipe availability). At 2,048 ft, the hole began to lose
mud circulation, requiring addition of about 20 to 25 gpm of
water (plus bentonite) for more than six hours (i.e., the totalamount of drilling fluid lost was about 7,500 gallons or more).
Caliper and electrical logs run to 2,100 ft were encouraging,suggesting a significant water bearing zone below 2,075 ft.
After the hole was cleaned out, a 4-inch liner was set from1,531 to 2,100 ft, with perforations from 1,900 to 2,100 ft
(3/16 in. by 2.5 ft, eight slots per foot).Subsequent well development showed disappointing
results, and was hampered by the drill rig’s inability to airlift
more than 500 ft of water column to flush out the perforationsand/or fracture. Several options were considered, including
sounding the well to determine if cuttings had filled the hole,and then clean out the well with a cable tool rig with a 2,100
ft sand line or a larger air compressor and small diameter tubing.
Given the unobstructed installation of the liner, liner perforations being obstructed by cuttings was deemed unlikely
by the driller. Instead it was assumed that the fracture was plugged by drilling mud and/or cuttings. On June 15, under
directives of Ed Granados of Geothermex, Inc. (the consultant
working for SDS), the driller started to inject cold water intothe well, to flush out and dilute any remaining mud deposits
that would inhibit production of the well.Unfortunately, after more than four days of injecting
between 250 and 350 gpm at about 230 psi pressure, the hopefor decrease in injection pressure never occurred. Con-
sequently a sinker bar was lowered to the bottom of the well,which suggested that the well had filled up below 1,973 ft.
To clean out the fill SDS leased a high yieldcompressor and 2,100 ft of small diameter tubing, attached to
the drill string (small enough to fit inside the 4-inch liner
13

8/8/2019 December 2000 Geo-Heat Center Quarterly Bulletin
http://slidepdf.com/reader/full/december-2000-geo-heat-center-quarterly-bulletin 16/28
Table 1 - Geothermal Well ISO-1, Drilling History
4/3/00 Start drilling project: drill 12 1/4” pilot hole to 275’.
4/4 - 4/5 Ream to 18” diameter to 260’. Run 14” casing to 257’.
4/6/00 Pump cement, cement surface casing.
4/10-4/12 Rig up BOPE.
4/12/00 Pressure test BOPE. Tag cement at 220’. Drill out cement to 256’.
4/13-4/17 Drill with 9 7/8” bit to 495’. Drilling progress slowed due to clay rich formations.
4/17-4/23 Change to long tooth soft formation bit for clay formations. Drill to 709’.
4/24-5/2 Due to repeated problems with clay plugging long tooth tricone, changed 9 7/8” drag bit. Changed out drill bit at 895’, due to
problems with changing formation from clay to lava. Then back to blade bit.
5/3 Pull drill string, lay down. Ready the hole for temperature log.5/4/ Run temperature and caliper logs to 895’ by Geo-Hydrodata. Then trip back in.
5/5 Drill to 1411’ then change to mill tooth bit.
5/11 Drilled to 1599’. Temperature and caliper logging by Geo-Hydrodata.
5/12 Decision made to continue drilling.
5/14-5/25 Run 6” casing to 1599’, and cement casing, with Haliburton Co.
5/26-5/31 Tag cement at 1500’. Drill out of casing, drill to 1952’. Below 1830 ft increasingly partially fine-grained lithified tuffs are observed.
6/5/00 Down hole geophysical logging, temperature, caliper logs. A bottom hole temperature of 208F was measured 1908 ft. Temperature
gradient approximately 7.5F/100ft.
6/2 - 6/8 Continue drilling to 2100 ft.
6/13 - 6/15 Run 4 inch liner from 1600’ to 2100’, with perforations from 1900 to 2100 ft.
6/15 - 6/30 Attempt to clean out fracture zone by injecting cold water. Subsequently clean out obstruction (drill cuttings) from below 1973 ft,
and develop the well.
6/30 Drill rig released.
below 1600 ft). On June 28, the driller started airlifting the
well, slowly lowering the open end of the tubing to the depthof the obstruction. By June 30, the well had been cleared,
producing about 75 gpm at 140 to 158oF by airlift. Thematerial lifted to the surface turned out to be angular and sub
angular chips of lithified tuff (i.e., drill cuttings) presumablywashed in from the fracture and/or the annulus between
formation and blank liner.
The drill rig was released on June 30.
GEOLOGIC SECTION
The geologic section is made up almost entirely of unconsolidated fine-grained tuffs. One exception was a “lava
flow” between 890 and 900 ft depth. The lithologic log is
summarized in the Table 2.
Table 2 - Geothermal Well ISO-1, Canby, Modoc County, CA. Geologic profile:
(sample depths indicated in left column)
10 to 40 ft: Soil and alluvial deposits.
50 to 70 ft Fine-grained tuff
80 to 180 ft Lacustrine gravels, mixed with fine-grained tuffs.
190 to 590 ft Volcanic mud flow
600 to 660 ft Fine-grained tuff, partially lacustrine deposits.
670 to 780 ft Volcanic mud flow, probably lacustrine deposit.
790 ft Lithified fine-grained tuff.
800 to 880 ft Volcanic mud flow. Rock fragments, embedded in greenish-grey clay often rounded, coated with white non-carbonaceous
mineral deposits (alteration)
890 ft Lava, probably andesitic (less than 10 ft thick)
900 to 1380 ft Volcanic mud flow: greenish gray clay with subrounded and angular rock fragments. Slightly altered.
1390 ft Fine-grained tuff, partially lithified.
1400 to 1600 ft Volcanic mud flow.
1610 to 1620 ft No samples
1630 to 1680 ft Lacustrine sand: fine to very fine sand, angular zeolite crystals, and rounded rock fragments.
1690 to 1870 ft Fine-grained tuff (maybe occasionally lithified?)
1880 1930 ft Lithified tuff. Angular chips, of indurated (cemented) fine-grained tuff.
1940 ft Red tuff, fine-grained. Poor sample recovery. Sample recovered from drill bit, suggests fine-grained tuff.
1950 to 2040 ft Angular chips of fine-grained lithified tuff, embedded in reddish brown clay (tuff).
2050 to 2100 Chips, angular and sub angular, of fine-grained tuff embedded in dark gray clay. Sample from 2090 almost purely chips, no
clay. Chips show evidence of fractures, lined with pyrite and reddish-brown material, and white to greenish white deposits.
Sample from 2100 has again reddish brown clay matrix.
14 GHC BULLETIN, DECEMBER 2000
8/8/2019 December 2000 Geo-Heat Center Quarterly Bulletin
http://slidepdf.com/reader/full/december-2000-geo-heat-center-quarterly-bulletin 17/28
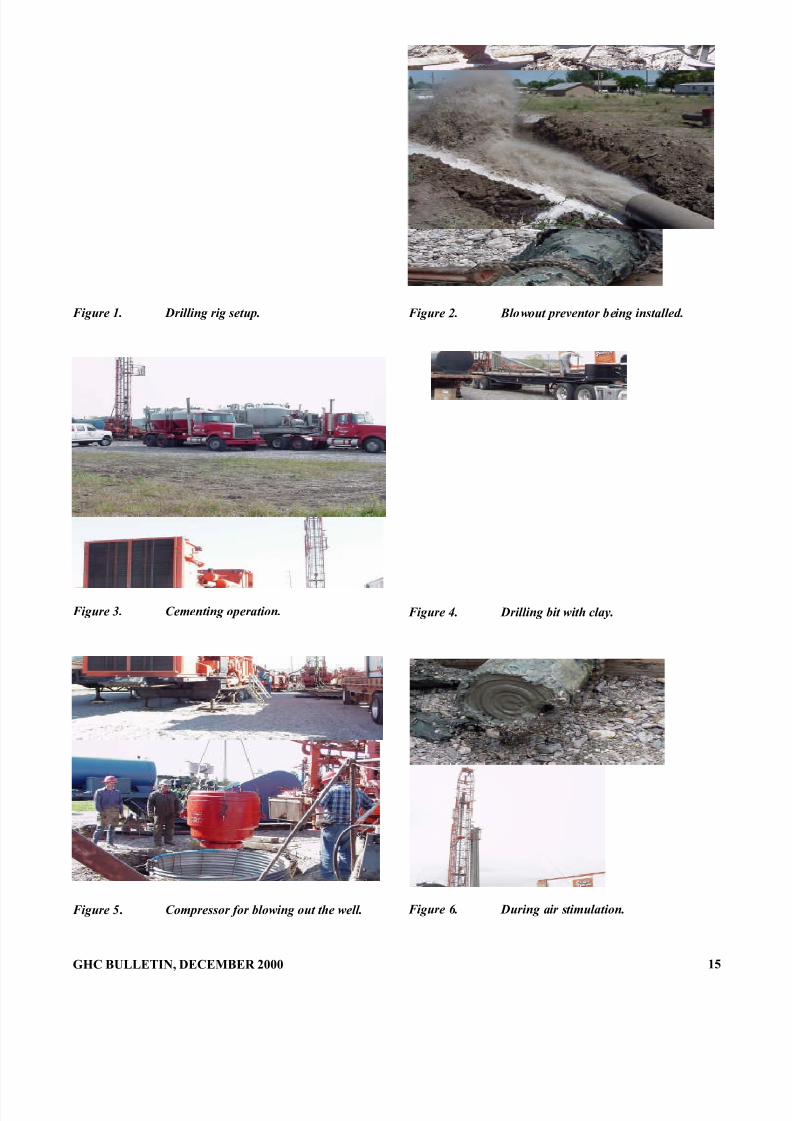
Figure 1. Drilling rig setup.
Figure 3. Cementing operation.
Figure 5. Compressor for blowing out the well.
GHC BULLETIN, DECEMBER 2000
Figure 2. Blowout preventor being installed.
Figure 4. Drilling bit with clay.
Figure 6. During air stimulation.
15

8/8/2019 December 2000 Geo-Heat Center Quarterly Bulletin
http://slidepdf.com/reader/full/december-2000-geo-heat-center-quarterly-bulletin 18/28
To summarize, several general observations can be made.
Lithology
The sequence of geologic formations consists almost
entirely of fine-grained tuffs (volcanic ash) and lahars(volcanic mud flows). The monotonous clay rich profile is
broken up only in two cases:
• A thin lava flow (less than 10 ft thick) between 890and 900 ft, which is probably andesitic, and
• A lacustrine sand layer (probably of volcanic origin) between 630 and 1,680 ft.
The fine-grained nature of the tuffs and lahars is
symptomized by the predominance of sticky gray-green clays,
which made drilling rather difficult and added to costoverruns.
The entire section is believed to have penetrated thelacustrine and volcanic sequences of the Alturas Formation.
As was the case in both Alturas wells (AL-1 and AL-2) andthe Bieber well, production in the ISO-1 well is from fractures
within lithified tuffs below 1,950 ft.
Alteration
Alteration (changes in mineral composition due toelevated temperatures) is evident throughout the entire profile
below 500 ft (if not 200 ft), as symptomized by occasional
silicic coatings on rock fragments, mineral deposits on vugslined with mineral deposits, and frequent greenish staining of
light colored rock fragments. In general, the “clays” (fine-grained tuffs) appear to be greenish in many sections,
suggesting chloritization, which is an indication of alteration.
Production from Lithified Sections
In Alturas and Bieber the fractured lithified sections
tended to produce hot water instead of fractured lava flows.Above 1,830 ft, the almost continuous sequence of fine-
grained tuffs (symptomized as clays) in the ISO-1 borehole ischaracterized almost completely by the absence of what could
be clearly interpreted as lithified sections that could producewater. However, the section below 1,830 ft contains
increasing evidence of lithification, and the section below1880 ft is even more lithified. Below 1,950, the fine grained
tuffs are probably entirely lithified. Though only very rarely,these lithified sections show occasional evidence of hairline
fractures filled with mineral deposits.
Below 1,940 ft, the cuttings are characterized by fine-
grained red tuff (a sample recovered from drill bit, suggestsfine-grained tuff). Below 1,950 ft, the predominance of
angular chips, and reddish brown clay (tuff) suggests analmost completely lithified fine-grained tuff. Chips from this
section were typically angular and sub angular. Occasionallythe chips show evidence of fractures, lined with pyrite and
reddish-brown material, and white to greenish white deposits.
For clarification, the term “lithification” suggests
grains being cemented together by mineral deposits in themicroscopic pore spaces. These mineral deposits originate
probably from water trapped in the sediment for extend
16
periods of time at elevated temperatures. Evidentlylithification occurs to a higher degree below 1,950 ft.
The increasing lithification in the lower ISO-1 borehole is encouraging from a standpoint of producing water.
It is possible that below 2,100 ft, the degree of lithification
may increase; gradually, leading to harder formations that are
even more promising for holding open water producing
fractures.
Comparison with Kelley Hot Springs Geologic Logs
This geologic profile matches only to an extent with
the one described for the Kelley Hot Springs wells. Both the
KHS and ISO-1 wells are similar in that they both intercepted
a very thick sequence of fine-grained tuffs, which are in part
lithified.
But, there are also some major differences. For example, while ISO-1 encountered only one thin lava flow at
890 ft, at Kelley Hot Springs at least five “basaltic lava flows”
were logged between 364 and 1980 ft, ranging in thickness
between 10 and 260 ft.
One lava flow logged at KHS as “granodiorite” between 1,088 and 1,148 maybe equivalent to the lava flow
logged between 890 and 900 ft in the I’SOT well (which inour opinion is probably andesitic, considering that
granodioritic intrusives are absent in this part of the Modoc
Plateau).
The KHS geologic logs also show severalinconsistencies. For example it repeatedly mentions what iscommonly referred to as “shale” by many drillers. These are
probably lithified fine-grained tuff, the kind of formation that
was also encountered below 1950 ft at ISO-1. Interestingly
the KHS records indicate that production is commonly
associated with these lithified tuffs, as was observed in ISO-1.
SYNOPSIS
A number of conclusions can be drawn based on theresults of this project. This brief discussion will address three
subject matters: geologic model, budget and projectmanagement.
Geologic Model
Evidently, ISO-1 barely penetrated only by about 200ft into a much larger geothermal resource at depth. Although
the lithified tuff sections were encountered at a depth similar
as in Alturas, it is certainly deeper than at Kelley Hot Springs.
This may very well explain the increasing resistivity aroundthe ISO-1 site, as mapped in the 1970s. Although the final
temperature estimate at bottom hole is still not determined, it
is clear that the temperature is at least close to the minimumtemperatures observed at KHS. It is likely that if ISO-1 had
been drill only a few hundred feet deeper a much better wellwould have been completed.
All three intermediate temperature geothermal
drilling efforts in the eastern Modoc Plateau (Bieber, Alturas
and Canby) suggest a number of common features:
GHC BULLETIN, DECEMBER 2000

8/8/2019 December 2000 Geo-Heat Center Quarterly Bulletin
http://slidepdf.com/reader/full/december-2000-geo-heat-center-quarterly-bulletin 19/28
• Production zones are associated with lithified tuffs.
These seem to occur at depths not shallower thanabout 1,800 ft,
• Temperature gradients above the lithified zones areabout 7oF per 100 ft, suggesting formations with very
similar thermal properties (confirmed by the geologiclogs), and
• Given the similarity in depth and gradients, the
reservoir temperatures must be similar in all three
areas.
These observations may lead a number of conclusions that should be considered in future drilling efforts
in the deep sedimentary basins of the Modoc Plateau:
• When planning a drilling project one should assume
that the target depth is about 2000 ft or deeper.
• At that depth the resource temperature is probably
greater than 185oF, if not more than 200oF.
• Assuming a conveniently lower resource temperature
to accommodate a lower drilling budget is probably
not warranted.
Project Management and Budget
The project budget clearly affected the outcome of
this project. Although the Alturas drilling experience hadclearly suggested that it is best to use a large rig, instead of a
common water well rig, the budget realities for this project led
to using a much smaller (water well) drilling rig.
Unfortunately, not having enough information athand the initial proponent of this project was not able to
develop a realistic budget. The initial bidding process hadmade it clear that, among other items, mobilization costs
would lead to significant cost overruns. The larger drillingcompanies are located in Reno and the Sacramento area, if not
southern California, which significantly increases mobilizationfees. Preliminary cost estimates from qualified drilling
consultants suggested that the cost for this well would be more
than $200,000, using a rig comparable to the one used at AL-2in Alturas. During the bidding process this estimate was
confirmed by the bigger drilling companies, although at leastone local small water well drilling company was able to bid
within the desired price range.
Unfortunately, contracting with a smaller rig turnedout to be as costly if not more costly than using a large rig, due
to slow drilling progress in the clay rich formations. Slow
drilling also eventually resulted in the hole becoming unstable,forcing the driller to run casing too early, thereby limiting
further drilling options at greater depth. Clearly this affectedthe ability to drill to sufficient depth (and eventually well
productivity). For example, instead of the anticipated threeweeks, it took almost three months to drill ISO-1 (and AL-1 in
1987); while, it took only 11 days to drill AL-2 (in 1991) toalmost the same depth. Evidently, being able to generate
higher mud pressures, a larger rig is more capable of dealingwith these difficult drilling conditions in the clay rich
formations, than a small one.
GHC BULLETIN, DECEMBER 2000
The trouble is that these problems are only
symptomatic of a much larger problem that is related to theinitial project budget planning. In the case of ISO-1 an
insufficient budget (funded by a federal grant) forced the
operator into making adjustments in the drilling program,
overly optimistic assumptions and greater financial
commitments than originally intended. To worsen matters,due to a policy decision at the state level, the operator was
forced to quickly come to a drilling decision, or otherwise
jeopardize California State (CEC) funds made available for retrofitting the heating system above ground. Not havingmore time, the operator was not able to secure further funds
for the project before the drilling started. Fortunately for this
project, the operator was determined enough to pull throughto the end and borrow money against equity to bring the
project to fruition. Our common experience is that drilling
usually takes more money than most people think, and if notenough money is committed to begin with all money spent
maybe wasted. Worst of all is when operators and drillers are
forced into risky “cost-saving” measures which usually in the
end come to haunt us by leading to even greater costs.
Once drilling started the commitment was made, andthe operator was forced to pull through, or otherwise lose not
only the funding for the retrofit, but also having wasted their matching funds already provided out of pocket. Sadly, any
drilling project that falls short of the minimum drilling target based on technical analysis, leads to a waste of significant
amounts of government and private money.
These observations symptomize what has been said
before. In the 1980s, the author of this report was involved inseveral geothermal drilling projects in northern California. It
was observed already then that the funding agencies fundedtoo conservatively. It led several drilling projects to be
conducted only to find that they had to stop short of reaching
a good resource. Often, this occurred when being withinreach of only several hundred feet of the target depth. This
was the case in the Bieber drilling project (Lassen County),the Clio and Indian Valley Hospital drilling projects (both in
Plumas County), and it almost happened in Alturas. In thelatter a reasonable drilling budget was put together by merging
two separate drilling projects (each one under budgeted)thereby eventually leading to one successful well, AL-1.
Sadly, in at least one project (Clio) the failed drilling
effort led to the probably unwarranted conclusion that there is
no resource, although the geophysical and geochemical dataanalysis came to rather optimistic prediction.
The lessons learned should be heeded for futurefunding of geothermal drilling projects in the Modoc Plateau.It maybe advisable that funding agencies base their fundingallocations on an independent and in-depth geologic and
budgetary analysis of the proposed project. It is important that
project management and well testing receive sufficientcontingencies (in our experience drilling decisions should not
be left entirely to a drilling contractor, but to a well balanced,constructive decision making process shared by driller and
geologist). After all, too many promising drilling projectshave turned into failures not because of a poor resource, but
17

8/8/2019 December 2000 Geo-Heat Center Quarterly Bulletin
http://slidepdf.com/reader/full/december-2000-geo-heat-center-quarterly-bulletin 20/28
Caliper Log and Electric Logs
Temperature Log
18 GHC BULLETIN, DECEMBER 2000
8/8/2019 December 2000 Geo-Heat Center Quarterly Bulletin
http://slidepdf.com/reader/full/december-2000-geo-heat-center-quarterly-bulletin 21/28
because of budget troubles. Not enough money spent on a
promising project without fruition, is money spent without benefit, whereas when an adequate amount of money results
in a successful project, it can be easily justified by its own
success story.
RECOMMENDATIONS
The immediate recommendations made for this
project are:
• The well should be tested to determine long term
production capacity. This would be best
accomplished with a constant discharge test,following a short step drawdown test. The constant
discharge test should be long enough until the dataconvincingly plot as a straight line on a Cooper-
Jacob plot (which may take up to a week or more).
• Water quality testing should be done during the latter half of this test. We also recommend to have a
sample analyzed for stable isotopes to be able to
compare this well with other geothermal waters inthe Modoc Plateau (including Kelley Hot Springs).
REFERENCES
Allen, Eliot, 1986. “Assessment of Geothermal Resources in
Modoc County, California, January 1986.” EliotAllen & Associates: with Geo-Mat.
GHC BULLETIN, DECEMBER 2000
GeothermEx, 1977. “Evaluation of Kelly Hot Springs
Prospect.” Memorandum report prepared for Thermal power Co. and Geothermal Power
Corporation. March 14, 1977.
GJ&A, 1985. “Preliminary Geothermal Resource Assessment
in Big Valley, Lassen and Modoc Counties, CA.”Report prepared by Gertsch, Juncal & Assoc.,
Milford, CA for Pit Resources Conservation District
and CA Energy Commission.
GJ&A, 1987. “Drilling and Testing of Geothermal Well BV-
3, Bieber, Lassen County, California.” Report
prepared by Gertsch, Juncal & Assoc., Milford, CAfor Pit Resources Conservation District and CA
Energy Commission.
GJ&A, 1988. “Siting, Drilling and Testing of ExploratoryGeothermal Well AL-1.” Technical summary report
prepared by Gertsch, Juncal & Assoc., Milford, CA
for Modoc Joint Unified School District, and the CAEnergy Commission.
PGH, 1992. “Drilling and Preliminary Testing of Geothermal
Well AL-2 at the Alturas Elementary School,Alturas, Modoc County, California.”
19

8/8/2019 December 2000 Geo-Heat Center Quarterly Bulletin
http://slidepdf.com/reader/full/december-2000-geo-heat-center-quarterly-bulletin 22/28
ENERGY DEPARTMENT ADVANCING
GEOTHERMAL POWER IN THE WEST
Geothermal Energy Association
GEA Washington Update
Washington, DC
August 9, 2000, Secretary of Energy Bill Richardson
joined Senator Harry Reid (D-NV) in Las Vegas to announcethe creation of 21 partnerships between the Department of
Energy (DOE) and private industry to support the
development and use of geothermal energy throughout thewestern United States. The projects will expand production
and use of energy generated from the earth’s heat to bringelectricity and geothermal heat to millions of homes and
businesses in California, New Mexico, Nevada and Utah.DOE and industry will share funding the projects over a three-
to-five year period.“Today’s projects move us one step closer toward our
goal of providing 10 percent of the electricity needs of thewestern states with geothermal resources by 2020,” said
Secretary Richardson. “Clean, reliable and renewable energy
sources such as geothermal energy can become a significantcontributor to the energy mix in the west, at a time when parts
of the region are experiencing power supply shortages.”The Energy Department will provide first-year
funding of $3.5 million to 21 companies to expand their geothermal activities. The research and development work
will be conducted in three areas:
• Small-Scale Geothermal Electric Power Plants
will demonstrate the capabilities of small generating
stations in a variety of settings. Each plant will produce between 300 kilowatts and one megawatt of
power.
• Enhanced Geothermal Systems Technology to
improve the electricity generating potential of geo-thermal systems at existing sites by increasing
production and extending their operating life.
• Geothermal Resources Exploration and
Definition to support the exploration and
development of new or previously undiscoveredgeothermal resources. Activities will focus on
surface exploration, exploratory well drilling, and
well testing.
In January, Secretary Richardson launched
GeoPowering the West , to expand the production of
geothermal energy activities in 19 western states. The goalsof the initiative include:
• Supplying at least 10 percent of the electricity needs
of the west by 2020 with 20,000 megawatts of geothermal energy installed;
• Supplying the electric power of heating needs of atleast seven million homes through geopower by
2010; and
• Doubling the number of states with geothermalelectric power facilities to eight by 2006.
A complete list of the DOE awards announced on
August 9 appears below.
DOE GEOTHERMAL POWER CONTRACTS ANNOUNCED AUGUST 9, 2000
Project Area Private Sector Partners Project Location
FY 2000 DOE
Funding Total DOE Funding
Private
Funding
Small-Scale Geothermal
Power Plants
Empire Energy LLC
Empire, NV
Empire, NV $150,000 prior
year money
$1,600,000/4 y ears $600,000
Exergy Inc.
Hayward, CA
Cotton City, NM $150,000 prior
year money
$1,700.000/4 years $1,600,000
Milgro Newcastle Inc.
Newcastle, UT
Newcastle, UT $150,000 prior
year money
$1,100,000/4 years $1,400,000
ORMAT International Inc.Sparks, NV
Lordsburg, NM $150,000 prior year money
$1,596,000/4 years $1,604,000
Vulcan Power Company
Bend, OR
Radium Springs, NM $150,000 prior
year money
$500,000/4 years $1,900,000
20 GHC BULLETIN, DECEMBER 2000

8/8/2019 December 2000 Geo-Heat Center Quarterly Bulletin
http://slidepdf.com/reader/full/december-2000-geo-heat-center-quarterly-bulletin 23/28
Enhanced Geothermal
System Technology
Americulture Inc.
Los Alamos, NM
Animas Valley, NM $177,000 Funding being
awarded through
evaluation **
Drilling Observation and
Sampling of Earth’s
Continental Crust, Inc., Salt
Lake City, UT
The Geysers,
Santa Rosa, CA
$199,917 Funding being
awarded through
evaluation **
Maurer Engineering, Inc.
Houston, TX
The Geysers,
Santa Rosa, CA
$194,554 Funding being
awarded through
evaluation **
Northern California Power
Agency, Middleton, CA
The Geysers,
Santa Rosa, CA
$174,584 Funding being
awarded through
evaluation **
ORMAT International, Inc.
Sparks, NV
Animas Valley, NM $200,000 Funding being
awarded through
evaluation **
Power Engineering, Inc.,
Hailey, ID
Roosevelt Hot
Springs, UT
$191,615 Funding being
awarded through
evaluation **
Steamboat Envirosystems,
LLC, West Palm Beach, FL
Reno, NV $199,805 Funding being
awarded through
evaluation **
ThermaSource, Inc.,
and RES Company, Santa
Rosa, CA
The Geysers,
Santa Rosa, CA
$198,630 Funding being
awarded through
evaluation
University of Utah,
Salt Lake City, UT
The Geysers,
Santa Rosa, CA
$199,973 Funding being
awarded through
evaluation **
Geothermal Resource
Exploration and Definition
Calpine Siskiyou Geothermal
Partners Limited Partnership,
Middletown, CA
Glass Mountain, CA $202,371 $1,102,371 / 3 years $275,593
Coso Operating Company of
Caithness Resources, Inc.,
Ridgecrest, CA
U-boat, NV $300,00 $1,875,000 / 3 years $500,000
Mount Wheeler Power
Company, Ely, NV
Rye Patch, NV $20,000 $1,620,000 / 3 years $405,000
Noramex Corporation,
Carson City, NV
Blue Mountain, NV $21,600 $656,736 / 3 years $164,184
ORMAT International, Inc.,Sparks, NV, and Lighting
Dock Geothermal Inc., Las
Cruces, NM
Animas Valley, NM $245,000 $913,000 / 3 years $245,500
SB Geo. Inc., Reno, NV Steamboat Springs,
NV
$14,792 $269,792 / 3 years $67,448
Utah Municipal Power
Agency, Spanish Forks, UT
Cove Fort-
Sulphurdale, UT
$23,057 $366,057 / 3 years $91,514
GHC BULLETIN, DECEMBER 2000 21

8/8/2019 December 2000 Geo-Heat Center Quarterly Bulletin
http://slidepdf.com/reader/full/december-2000-geo-heat-center-quarterly-bulletin 24/28
BOOK REVIEW
STORIES FROM A HEATED EARTH
OUR GEOTHERMAL HERITAGE
Pegamon
andRonald DiPippo
University of Massachusetts
Dartmouth, MA
Fact or fiction? People in several Korean
communities got so fed up with lepers and other diseased folks
over-running their villages to bathe in their hot springs that
they poisoned the springs with dead dogs and even buried the
springs so they could no longer be used.
Fact or fiction? Icelanders complained about the
nuisance of hot springs on their farms to convince the tax
assessor to set a low value on their properties.
Fact or fiction? The French Revolution nearly leadto the destruction of the geothermal district heating system at
Chaudes-Aigues that had been operating smoothly since the
1300s.
All of those are true and represent but a few of the
fascinating items to be found in Stories from a Heated Earth -
Our Geothermal Heritage. This handsome volume is a
collection of articles skillfully assembled into 34 chapters by
three editors well-known in the geothermal community: R.
Cataldi from Italy, S. F. Hodgson from California, and J. W.
Lund from Oregon. There are stories from at least 41
countries, written by 47 individual authors, within its 588
pages. The book is jointly published by the Geothermal
Resources Council and the International GeothermalAssociation.
This is indeed a weighty tome; the sewn paper-bound
volume measures 8.5 x 11 x 1.5 inches and weighs about 3.5
pounds. The book is most pleasing to the eye, beginning with
the handsome cover designed by J. Spriggs, a wood-block
print– Boy and Mount Fuji by Hokusai, depicting a lad seated
on a leaning tree branch, contemplating the majestic
mountain–set on a red background with elegant white
lettering. There are some 215 illustrations–photographs, line
drawings, paintings and sketches. These are mainly black and
white, but there are six in full color counting the cover.
The table of contents is well organized; the chapters
are arranged by region of the globe. The volume begins andends at Easter Island, and the stories travel around the planet
stopping at nearly all countries or areas that have geothermal
resources of any kind. Although the editors say that not all
countries are included, they have done a fine job of selecting
a most representative set to tell the tale of geothermal energy
around the world and through time.
The writers generally come from the countries or
regions described in each chapter, leading authenticity to the
stories. The job of organizing and editing such a collection
22
must have been formidable, given the fact that for most of the
authors, English is not their first language. M. Sekoka, the
author of the chapter on Japan, expressed his feelings in his
concluding section: “As the author is not an historian and
English is not his Mother Language, the author has gone
through all sorts of hardship.” To his and the editors’ credit,
the final product is well worth the hardship.
The format for each chapter is consistent and
effective. Each chapter begins with the title page on the rectoand a frontispiece on the verso. The frontispiece may be a
photograph, painting, piece of sculpture or other work of art.
While these are all arresting and valuable contributions, my
favorites are the photograph by William Henry Jackson of
“Bella, a Maori guide, sitting at the edge of the Rotorua
geysers” (p. 434) and the painting by Paul Kane entitled
“Mount St. Helens” showing a canoe carrying eight American
Indians watching a spectacular eruption of this famous
volcano (p. 6). Honorable mention goes to two others:
“Madam Pele” by Herb Kawainui Kane (p. 450) and the aerial
photograph of Mount Mayon by B. J. Barker (p. 406).
The title page carries an abstract and an introduction
together with a small map at the top of the page (Mercator projection) outlining the continents of the world. The map
highlights in black the country or area covered in the chapter.
This helps orient the reader as the stories progress around the
globe. Each chapter is amply illustrated with numerous
figures. The illustrations in nearly all chapters, however, are
not numbered which makes it awkward to refer to them,
particularly since there are cases of cross-references between
chapters. Most chapters include detailed maps to show the
specific sites discussed, but I still found myself often referring
to my atlas for more information.
Several chapters incorporate informative side-bars
and excerpts from other literature that add significantly to the
enjoyment and edification of the reader. Here we findquotations from many well-known authors, including Homer,
Seneca, Strabo, Shakespeare, Poe, Twain, John L. Stephens,
Frances Calderón de la Barca, and Garcilaso de la Vega.
Each chapter concludes with a summary and an
extensive list of references. It must be said, however, that the
references tend to be in the native language of the author, as
one would expect. Furthermore, many are in the so-called
“gray literature” and are probably inaccessible for the average
reader. For readers wishing to delve further into the material,
GHC BULLETIN, DECEMBER 2000
8/8/2019 December 2000 Geo-Heat Center Quarterly Bulletin
http://slidepdf.com/reader/full/december-2000-geo-heat-center-quarterly-bulletin 25/28
they may reach the authors directly since there is a complete
set of information on each author at the end of each chapter,
including telephone and facsimile numbers, and in most cases,
e-mail addresses. The lack of an index in a book of this size
and scope is disappointing.
Many of the chapters are reprints or re-writes of
previously published articles (18 out of 34) that have been
adapted for the present book. Most of the reprinted articles
first appeared in either the Proceedings of the World
Geothermal Congress, v. 1, sect. 2, 1995 or Geotermia, Revista Mexicana de Geoenergia, v. 8, n. 3, 1992.
The material is aimed at a general audience. One
need not be an archaeologist, anthropologist, geologist,
geochemist or engineer to understand the material. There is,
however, use of specialized terminology for a wide range of
fields for which a glossary would have been helpful. Since
the stories go back to prehistoric times, reference is often
made to various geologic periods. There are three helpful
charts in chapter 2 that relate the Lower Paleolithic, Upper
Paleolithic, Neolithic, the Stone Age, Metal Age, etc., to years
B.C., but since reference is made to these ages throughout the
texts, I found myself thumbing back to chapter 2 to get the
timing straight in my mind. While the language is generallyaccessible, there does appear the odd sesquipedalian here and
there, such as a word “autochthonous” that sent me running to
my unabridged dictionary–it means “indigenous” if you did
not know.
While there is not enough space in this review to
comment on every chapter of the volume, I will try to convey
the sense of the work and offer a few comments. The general
theme is the interaction between humans and geothermal
phenomena from the beginning of time, with emphasis on how
geothermal energy influenced the development of civilization.
This required the study of tales, legends and myths, gleaned
from ancient writings, official documents, pictorial
representations, and oral histories. In such matters, thedistinction between fact and fiction is often blurred, and the
key to understanding is interpretation.
While there is no shortage of myths and beliefs
surrounding “The Creation,” the first chapter offers yet a new
mythological version. Cataldi presents a geothermal-centered
explanation of the beginning of it all. He continues in this
vein in the next chapter by speculating on the nature of
humans’ first encounters with geothermal manifestations.
Chapter 3 on the African Rift, written by Oregonian
Lund (breaking the pattern mentioned earlier) unites the first
humans with the forces of geothermal energy. I believe it is
significant that the scientifically accepted cradle of life as we
know it corresponds to an active geothermal zone. Wehumans may owe a lot more to geothermal than we think.
This is followed by several excellent chapters on the
Middle East, Turkey, Greece and Macedonia. The reader is
treated to the oldest known depiction of a geothermal event–a
Turkish wall painting dating from 6200 B.C. that shows the
eruption of Çatal Höyük. The mural appears twice in the
volume, first in chapter 2 (p. 16) where a photo of the actual
GHC BULLETIN, DECEMBER 2000
mural is juxtaposed against a reconstruction and a modern
interpretation, and again in chapter 5 (p. 53) where only the
reconstruction is presented.
The book then focuses for the next seven chapters on
the Mediterranean region and specifically on Italy. The
attention given to Italy and in particular to Larderello (or, as
it was known in the early days, the Boraciferous Region) is
justified by the important advances that were made there in the
areas of chemical production (mainly boric acid), space
heating using geothermal fluids, integrated use of geothermalenergy for industrial processes, and the first commercial
generation of electricity from geothermal energy. Starting
from the time of the Etruscans in 800 B.C. to the present, Italy
has been at the center of geothermal development. It is an
interesting and important story. Since six of the chapters on
Italy are reprinted from other sources, there is considerably
overlapping and repetition. In my view, the bulk of the story
can be found in the excellent chapters 13 and 14 by P.D.
Burgassi and Burgassi, Cataldi and C. Donati, respectively.
The low-temperature resources of the Caucasus
region, Poland and France are described in the next several
chapters. The story of the French village of Chaudes-Aigues,
written by J. P. Gibert and F. Jaudin, is intriguing. Blessedwith one of the hottest springs in all of Europe (82oC), the
villagers have long put these waters to good use. Back in the
14th century, they built a district heating system that was
similar in principle to the ones in operation today at many
places. Water from their spring was channeled through the
village. Individual houses were connected to the main channel
by side channels controlled by sluice gates. Hot water flowed
through ducts under the floors of the houses, into and out of
a large pit dug under the house, eventually returning to the
main channel. When the house reached a comfortable
temperature, the gate could be closed. This system served
quite well until the French Revolution in 1789, after which
everyone (and no one) became responsible for its operation.Residents began filing lawsuits against one another as the
system fell into disrepair. The villagers soon realized that they
were about to lose a very valuable asset and this led them to
establish rules and regulations for the operation and use of the
waters. Most importantly, they placed an individual in charge
of running the system. The spring remains in use today, and
the town is the site of the Museum of Geothermics and Water
Cures established in 1993.
I. B. Fridleifsson relates Iceland’s history of
geothermal use in chapter 19. The island settlements got
started around the year 900 A.D. Unlike in other parts of the
world, early settlements were not sited close to hot springs.
Since the main livelihood of the Icelanders was fishing, they preferred to live close to the ocean. The hot springs were used
primarily for washing clothes, a task done by the women. The
convenience of the fishermen was paramount. The Icelandic
farmers disparaged the existence of hot springs on their land,
exaggerating their disadvantages, to lower the value of their
property in the eye of the assessor and thus, reduce their taxes.
This information comes from tax documents dating from
23

8/8/2019 December 2000 Geo-Heat Center Quarterly Bulletin
http://slidepdf.com/reader/full/december-2000-geo-heat-center-quarterly-bulletin 26/28
1709, but the strategy is easily recognizable and timeless. The
first attempt to capture the heat of the energy of the hot
springs for heating houses was in the 1200s, but it failed. No
further attempts were made for the next 700 years, a
surprisingly long time given Iceland’s cold climate. Of
course, today Iceland leads the world in the use of geothermal
energy for space heating.
A recurring story throughout the book is the
therapeutic benefits of thermal-mineral waters. Everywhere
the story is the same: soak your tired, weary, diseased body ingeothermal waters and be refreshed, rejuvenated, and cured.
There seems no end to the list of afflictions and diseases that
can allegedly be cured in this way: arthritis, rheumatism, gout,
syphilis, leprosy, goiter, paralysis including polio, dyspepsia,
leucoderma, rashes, burns, psoriasis, fibrous tissue syndrome,
eye infections, liver disease, dysentery, sexual dysfunction,
gynecological disorders, et cetera. Some cultures believed that
hot springs could restore virginity. Some myths would have
us believe that springs could even restore life to the dead. In
a remarkable passage in chapter 24, we learn that Korean
villagers poisoned their own hot springs to put an end to lepers
trying to cure themselves. B. W. Yum tells us that they would
throw dead dogs in the pools to discourage their use, and thatthey even filled in and buried springs to save their villages
from being overrun by these diseased outsiders who were
viewed as a health threat.
A story from Japan told by Sekioka in chapter 25
deals with the export and sale of hot spring water.
Entrepreneurs would scoop up and barrel water from the
springs for shipment to localities lacking hot springs. This
obviously was a rather inconvenient way to spread the benefits
of the waters, so an innovative fellow hit on the idea of
making artificial hot spring water. Following a carefully
devised formula of chemicals, he was able to reproduce the
alleged healing properties of natural waters. Unfortunately,
the product turned out to be too expensive for the averageconsumer. Undeterred, he simplified the formula–by
dissolving geyserite in salt water, he created his new,
improved artificial spring water. Presumably, his clients did
not notice any difference in the quality or effectiveness of the
product.
The holistic view of natural geothermal resources
held by indigenous peoples is another recurring theme. It is
exemplified by the Maoris of New Zealand (chapter 28 by C.
M. Severne) and Native Americans (chapter 29 by Lund), to
mention only two. Recurring themes in the oral histories of
diverse cultures serve to unite all the people of the world in
coping with mysterious and powerful natural forces. The
24
notion of stewardship of a divine gift to preserve it for future
generations is a commonly held principle. The conflict
between this belief and modern development has created a
number of adversarial situations. Several chapters deal with
this issue and point out ways of reconciling the opposing
positions.
The impact of geothermal energy on the early settlers
of Mesoamerica and South America is told vividly in chapters
31, 32 and 34. Although these regions were isolated from
Europe, Asia and Africa at the time, the similarity of thedevelopments is striking. Again, we see that there was a
common way of thinking about the great forces of nature that
permeated all early peoples, regardless of where or when they
lived.
Chapter 33 by Hodgson converts some current oral
history from Mexicans into the written record. The stories
related by A. G. Salazar are especially moving and poignant
for anyone who has ever worked, traveled or lived in active
geothermal areas.
The belief in animism is another of the common
features of the stories of many peoples. Physical features of
the landscape are thought to be alive. While hardly anyone
would doubt that a tree is alive, many would question whether a mountain is alive. We plant seedlings and watch tree grow;
we did not actually see how a mountain was born and
grew–we can only glimpse this through our intellect. It comes
down to a question of time-scale relative to our own lives. It
is easy to understand how indigenous peoples with a long
tradition of oral history can believe in the life of mountains
because the oral history lengthens the effective life of an
individual to that of all their ancestors. Thus, the eruption of
Mount Mazama and the creation of Crater Lake in
Oregon–witnessed by Native Americans some 7,700 years
ago–can be a part of the personal experience of a Native
American today.
Hodgson captures this idea in the last paragraph of chapter 33: “Birth and death. Like us, geothermal features
begin and end, moving through cycles of their own. We draw
towards them, lured by change, beauty and an unusual cast of
the familiar–water, rocks and heat. We search them for
answers to mysteries in our own lives, like birth and death.
We have done this through time, and geothermal stories are
the archives of our quest.”
The authors have succeeded in their objective,
namely, to show how “applications of geothermal resources
stand not alone but on an historical continuum.” Their unique
volume is a valuable addition to the historical literature of our
geothermal world.
GHC BULLETIN, DECEMBER 2000

8/8/2019 December 2000 Geo-Heat Center Quarterly Bulletin
http://slidepdf.com/reader/full/december-2000-geo-heat-center-quarterly-bulletin 27/28
GEOTHERMAL PIPELINEProgress and Development Update
from the Geothermal Progress Monitor
OREGON
BPA, Calpine in 49.9-MW Geothermal Power Deal
Bonneville Power Administration recently signed an
agreement to buy 49.9 MW of electric power from CalpineCorporation. The power will be produced at the Fourmile Hill
Geothermal Development Project at Medicine Lake (GlassMountain) in northern California. There has been strong
opposition by environmental groups, summer home owners
and Indian tribes, with a recent appeal to the agreement made by the Pit River Tribe. Exploratory drilling has already been
approved and the plant is expected to being operation in late2004. Exploratory drilling will probably begin next spring.
Calpine has received a $20.8 million award from theCalifornia Energy Commission under its new renewable
account to assist the project. BPA will pay about $57 a MW-hr for 20 years. (Source: Reuters, Dec. 1, 2000).
CHINA
Beijing Will Explore New Energy Resources
Beijing is exploring the use of new energy sources toimprove its energy efficiency and to reduce pollution of coal,
gas and oil in the this major metropolis. This will includegeothermal power , solar energy, bio-energy and wind power.
This will also benefits their goal to win the bid for the 2008Olympic games. Beijing has about 150 geothermal wells, cap-
able of producing 8.8 million cubic meters (2.3 billion gal)of hot water annually, of which about 400,000 cubic meters
(106 million gal) is being used for space heating. If the cityexplores for additional geothermal resources, the new energy
will heat an additional 20 to 30 million square meters (24 to36 million square yards) of floor space, equivalent to theconsumption of 3 million tonnes (3.3 million tons) of coal
annually. (Source: Xinhau News Agency, Dec. 1, 2000).
GERMANY
Energy Supply of the Reichstag Building in Berlin
The reconstruction of the Reichstag building (des-troyed in 1933), as the seat of the German Parliament, was
completed in 1999. This building has an innovative heatgeneration and cold storage system developed and planned by
GTN - Geothermie Neubrandenburg, Ltd of Germany. A bio-
diesel fired 1,600 kWe motor-driven heating and power station
forms the heart of the system and provides the co-generationof power and heat. In summer, excessive heat of the motor-driven heating and power station is fed at a temperature of
70oC (158oF) into a subsoil heat reservoir located 300 m(1,000 ft) beneath the Reichstag building. In periods of peak
demand in winter this heat can be directly recovered for thesupply of special low-temperature heating systems. A second
reservoir, about 50-m (165-ft) deep, is used for cold storage.
Groundwater cooled down to 5oC (41oF) by ambient cold in
GHC BULLETIN, DECEMBER 2000
winter is stored here and is supplied in summer, without any
additional driving energy, to the cooling system of the building. (source: Engineer and Geologist, 1999).
Neustadt-Glewe Geothermal Heating Station
Since 1995, the natural heat potential of the subsoilhas been utilized by the Erdwärme Neustadt-Glewe Ltd. for
the supply of heat to more than 1,100 households and
25

8/8/2019 December 2000 Geo-Heat Center Quarterly Bulletin
http://slidepdf.com/reader/full/december-2000-geo-heat-center-quarterly-bulletin 28/28
numerous industrial consumers at Neustadt-Glewe located in
western Germany near Mannheim. The geothermal loops of the station was planned by GTN - Geothermie
Neubrandenburg Ltd. By utilizing geothermal heat, which is
used exclusively in direct heat exchange, the emission of 6,500 tonnes (7,200 tons) of CO2 is avoided from a
conventional gas-fired heating station of the same capacity.The thermal water loops production depth is 2,250 m (7,400
ft) and provides a flow rate of 125 m3/h (33,000 gal/h) from
two wells. The station has an installed capacity of 10.7 MWtof which 6.5 MWt is geothermal and provides 23,700 MWhannually of which 22,200 MWh is provided by geothermal
energy. The reservoir temperature is 100oC (212oF) and thetemperature at the heat exchangers is 95oC (203oF). (Source:
Engineer and Geologist , date unknown)