high temperature heat exchanger project: quarterly
TRANSCRIPT

Publications (NSTD) Nuclear Science & Technology Division
9-30-2004
High Temperature Heat Exchanger Project: Quarterly Progress High Temperature Heat Exchanger Project: Quarterly Progress
Report July 1, 2004 through September 30, 2004 Report July 1, 2004 through September 30, 2004
Anthony Hechanova University of Nevada, Las Vegas, [email protected]
Follow this and additional works at: https://digitalscholarship.unlv.edu/hrc_nstd_pubs
Part of the Heat Transfer, Combustion Commons, Materials Science and Engineering Commons, and
the Nuclear Engineering Commons
Repository Citation Repository Citation Hechanova, A. (2004). High Temperature Heat Exchanger Project: Quarterly Progress Report July 1, 2004 through September 30, 2004. 1-49. Available at:Available at: https://digitalscholarship.unlv.edu/hrc_nstd_pubs/5
This Grant is protected by copyright and/or related rights. It has been brought to you by Digital Scholarship@UNLV with permission from the rights-holder(s). You are free to use this Grant in any way that is permitted by the copyright and related rights legislation that applies to your use. For other uses you need to obtain permission from the rights-holder(s) directly, unless additional rights are indicated by a Creative Commons license in the record and/or on the work itself. This Grant has been accepted for inclusion in Publications (NSTD) by an authorized administrator of Digital Scholarship@UNLV. For more information, please contact [email protected].

High Temperature Heat Exchanger Project
Under Financial Assistance DE-FG-04-01AL67358, Amendment 007
Awarded by the United States of America Acting Through the United States Department of Energy
Quarterly Progress Report July 1, 2004 through September 30, 2004
The UNLV Research Foundation 4505 Maryland Parkway
P. O. Box 452036 Las Vegas, NV 89154-2036
Anthony E. Hechanova, Ph.D. Project Manager (702) 895-1457
(702) 895-2354 (FAX) [email protected]

1
UNLV Research Foundation High Temperature Heat Exchanger (HTHX) Project
Quarterly Report (July 1, 2004 to September 30, 2004)
1.0 HTHX 3rd Quarter Highlights
• UNLV hosted a meeting on NHI Materials and Heat Exchanger Design on Monday, May 17. Paul Pickard (Sandia National Lab) and Bill Corwin (Oak Ridge National Lab) facilitated the meeting. The purpose of the meeting was to summarize the hydrogen materials and heat exchanger requirements and priorities for UNLV staff and their collaborators to support the research proposal solicitation for the UNLV Research Foundation HTHX program. Attendance was heavier than anticipated and required a change of venue to accommodate the crowd of over 30.
• A 2-D model of the helium-side of the offset strip fin heat plate exchanger baseline concept and a single module with periodic boundary conditions was completed at UNLV. As a follow-on study, instead of using a single module and periodic boundary conditions, a full-scale channel with respect to length was simulated (containing 37 modules). The results showed a significant difference in pressure drop (77 %) between the two cases. The conclusion is that using single module simulations with periodic boundary conditions to extrapolate out to 37 modules (the full length of the heat exchanger) may greatly underestimate pressure drop and therefore pumping requirements. Future research will only consider simulations using the full length of the heat exchanger.
• 3-D FLUENT modeling was performed at UNLV that includes a full-length simulation of both the molten salt and helium sides of the offset strip fin plate heat exchanger. Early results indicate a better performance than expected in terms of heat transfer but worse in terms of pressure drop. The Conjugate Heat Transfer option of FLUENT was validated for 3-D simulations using four test cases. The results were consistent with expectation indicating that the code is handling heat transfer properly.
• The results of tensile testing at UNLV indicate that very little loss in strength in terms of yield strength and ultimate tensile strength was observed in Waspaloy due to a change in testing temperature from ambient to 600 oC. Between 450 and 600 oC, a slight reduction in strength was observed for all three alloys. The ductility in terms of percent elongation was significantly enhanced at elevated temperatures for Alloys C-22 and 276, as expected.
• Fractographic evaluations of the tested tensile specimens by scanning electron microscopy at UNLV revealed dimpled microstructure, indicating ductile failures at all three testing temperatures.
• Stress corrosion cracking testing under constant-loading conditions involving all three alloys is in progress at UNLV in aqueous environments containing sulfuric acid and sodium iodide at 90 oC. No failures have yet been observed at applied stresses corresponding to 95 percent of the materials’ yield strength values.
2
• The preparation work for the helium permeation experiment for testing melt-infiltrated composite samples continued at UC Berkeley. The helium leakage rate was estimated to be economically feasible (0.1% of the total flow rate is taken as an acceptable leak rate). Test coupons prepared by DLR were received at UC Berkeley. These include 12 uncoated (splint based) SiSiC samples, 6 SiSiC samples coated with cordierite, and 12 uncoated C/C-SiC samples.
• Per Peterson (UCB) visited COI Composites at San Diego on April 9 and had a meeting with Andy Szweda and Tim Easler. The meeting was very informative. COI does most of its current work with polymer infiltration methods, but also has the capability to melt infiltration (MI). His discussions at COI created some cautions for the Polymer Infiltration and Pyrolysis (PIP) compared to MI.
• UC Berkeley performed a brief cost estimation for composite compact heat exchangers that suggests that the fabrication costs of the HX composites should be below $250 to $1250 per kilogram for typical thermal densities from 20MW/m3 to 120MW/m3, for total quantities in the range of 60 MT to 12 MT per 600 MW thermal plant.
• The temporary testing facility at General Atomics in Rm105, Bldg. 30 is in operation. A number of dry runs have been successfully completed and corrosion testing is underway. The testing is expected to be completed by late August. The legal requirement to procure HI aqueous solution has led to a scheduling delay. In addition, lab set up and safety requirement modifications has pushed back the starting test date.
• During the quarter ending June, 2004, General Atomics accomplished three primary work items on Task 1 (heat exchanger design). These were (1) completion of the review to identify the range of High Temperature Heat Exchanger (HTHX) applications required by the High Temperature Electrolysis (HTE) process for hydrogen production using nuclear energy; (2) the sizing requirements for the HTHXs required by the Sulfur-Iodine (S-I) process were revised and an alternative flow scheme was developed for the S-I process; and, (3) initial sizing calculations and heat exchanger design layouts were prepared for three key HTHXs required by the candidate S-I and HTE hydrogen production processes.
3
2.0 UNLV Design and Testing Group The University of Nevada, Las Vegas Design and Testing Group supports the following two activities in the UNLVRF High Temperature Heat Exchanger (HTHX) Project:
• HTHX Thermal Systems Design • Scaled HTHX Tests
2.1 HTHX Thermal Systems Design 2.1.1 HTHX Thermal Systems Design Objective and Scope The HTHX design studies have the following objectives and scope:
• Work with the U.S. Department of Energy Office of Nuclear Energy, Science and Technology (DOE NE) nuclear hydrogen research and development program elements on high temperature systems studies for hydrogen production.
• Identify the range of HTHX applications for Gen IV hydrogen production. • Develop thermal systems concepts/designs and overall heat/mass balances for the
range of Gen IV power conversion and hydrogen production concepts. • Develop design specifications for the intermediate heat exchanger and other HTHXs
used in the conceptual designs. • Undertake thermal hydraulic systems numerical modeling to establish and analyze
temperature, pressure, and flow rate requirements. • Perform thermal, thermal hydraulic, and structural analyses for selected advanced
HTHX concepts for hydrogen production. • Deliver detailed design for candidate intermediate heat exchanger concepts and
materials for hydrogen production requirements.
2.1.2 HTHX Thermal Systems Design Highlights • Materials and Heat Exchanger Design Workshop. UNLV hosted a meeting on
NHI Materials and Heat Exchanger Design on Monday, May 17. Paul Pickard (Sandia National Lab) and Bill Corwin (Oak Ridge National Lab) facilitated the meeting. The purpose of the meeting was to summarize the hydrogen materials and heat exchanger requirements and priorities for UNLV staff and their collaborators to support the research proposal solicitation for the UNLV HTHX program. The meeting also provided an opportunity to communicate NHI priorities and help focus the proposal process. The morning session included speakers Paul Pickard on objectives, Bill Corwin on summary of materials requirements, Per Peterson (UC Berkeley) on advanced designs and materials, Merril Wilson (Ceramatec) on ceramic heat exchangers, and Anthony Hechanova (UNLV RF) on the proposal process. The afternoon consisted of two breakout sessions (materials and heat exchangers) to discuss in more detail potential research concepts and collaborations. Attendance was heavier than anticipated and required a change of venue to accommodate the crowd of over 30.
• 2-D Model Development. A 2-D model of the helium-side of the offset strip fin heat exchanger baseline concept and a single module with periodic boundary conditions was completed. The friction factor using FLUENT simulations differed from analytical calculations based on empirical correlations by 23% for rectangular fins
4
and 24% for curved fins. To evaluate the effect of the fin thickness coefficient which takes into account the curved as opposed to rectangular shape of the leading and trailing edges of the fins, only the helium side of the heat exchanger was considered. The ratio of the pressure drops between the rectangular shaped versus curved shaped fins was found to be 0.72 which compares closely to the analytical calculation of 0.74 for the same ratio. It was found that the coefficient does not impact heat transfer results very much but has a significant impact on the friction factor and resulting pressure drop. As a follow-on study, instead of using a single module and periodic boundary conditions, a full-scale channel with respect to length was simulated (containing 37 modules). The results showed a significant difference in pressure drop (77 %) between the two cases. The conclusion is that using single module simulations with periodic boundary conditions to extrapolate out to 37 modules (the full length of the heat exchanger) may greatly underestimate pressure drop and therefore pumping requirements. Future research will only consider simulations using the full length of the heat exchanger.
• 3-D Model Development. 3-D FLUENT modeling was accomplished that includes a full-length simulation of both the molten salt and helium sides of the heat exchanger. Early results indicate a better performance than expected in terms of heat transfer but worse in terms of pressure drop. The Conjugate Heat Transfer option of FLUENT was validated for 3-D simulations using four test cases. The results were consistent with expectation indicating that the code is handling heat transfer properly.
2.1.3 HTHX Thermal Systems Design Technical Summary 2.1.3.1 2-D Numerical Simulations for the Helium Side of the Heat Exchanger Channel (Periodic Module). Initially, a periodic module was considered and then the full heat exchanger channel with 37 modules was considered (see next section). The periodic module was used to solve for both the hydrodynamics and the heat transfer with periodic boundary conditions being used as the modules repeat themselves in the flow direction. Symmetric boundary conditions were used in the span wise directions. Laminar flow and constant wall temperature heat transfer boundary conditions were used along the fin walls. The dimensions were those of the U.C. Berkeley concept dimensions with curved fin edges. The results obtained from the FLUENT numerical simulation (see Figure 2.1) for one module were as follows:
Uave = 15.2 m/s (velocity) Umax = 21.6 m/s (velocity) Δ p = 14.8 kPa (pressure drop) f = 0.0475 (friction factor)

5
Figure 2.1: Velocity contours for curved fin edge case Although the pressure drop across each module is periodic, the temperature drop is not periodic. As a subsequent calculation, convective heat transfer boundary conditions were used instead of the constant wall temperature boundary conditions for solving the energy equation. The results which were obtained were different from the previous temperature profiles. Also, the heat transfer coefficients along the fin walls were plotted and the plots obtained were consistent and the results were compared by varying the dimensions of the fins. The formation of vortices at the trailing edge of the fins were analyzed and compared using different cases of Reynolds numbers and the stream line plots were made for each case. Different turbulence models are under study in order to solve the problem in the turbulent regime. Intense literature review is underway to gather any information regarding the use of turbulent models in similar problems. According to the FLUENT manual the K-epsilon model might be best suited for the problem. The fin thickness coefficient (Cfin) was studied and a sensitivity analysis done using the empirical correlations. It was found that the parameter has less effect on heat transfer but a bigger effect on the pressure drop, which emphasizes the need for determining the proper coefficient. The U.C. Berkeley team assumed the coefficient to be 0.5 for their analytical calculations. In the present work, the coefficients were assumed to be 1.0 and 0.5 respectively for the analytical calculations for both the helium side as well as the molten salt side. The pressure drop ratio for the helium side was found to be 0.74 while it was 0.54 for the molten salt side. This was done in order to judge the amount of effect the coefficient has on pressure drop. As a part of the task in determining a proper Cfin value, numerical simulation with the same boundary conditions and material properties were performed for the helium side heat exchanger channel with rectangular fin edges. The results which were obtained (see Figure 2.2) are as follows:
Uave = 15.20 m/s

6
Umax = 21.4 m/s Δ p = 20.7 kPa f = 0.065
Figure 2.2: Velocity contours for rectangular fin edge case Using the FLUENT simulations, the pressure drop ratio for the helium side was found to be 0.72 between the curved fin case versus rectangular fin case which is consistent with the value found using the empirical correlations of 0.74. 2-D calculations were not performed for the molten salt case because the height of the channel was considered to be too short to neglect 3-D phenomena. The Cfin effected will be evaluated for molten salt in the 3-D work. Analytical calculations were done with Cfin = 1.0 (the rectangular case) and Cfin = 0.5 (the curved fin case). The results of the friction factor f were compared with those obtained from numerical simulations. The value of the friction factor varied by 24% for the rectangular fin case between the FLUENT results and the analytical results. The value of the friction factor varied by 23% for the curved fin case. It is concluded that the Cfin needs to be introduced in the correlations when curved fins are used and that the variation may be attributed due to negligence of friction on upper and lower walls in 2-D case numerical simulations. 2.1.3.2 2-D Numerical Simulations for the Helium Side of the Heat Exchanger Channel (37 Modules). Numerical simulation was performed for the 37 modules of the heat exchanger channel. As an initial start, only flow dynamics were studied. This was performed using a journal file generating code. For inlet boundary condition, a velocity value of 16.98 m/s was used and at the pressure outlet boundary the gauge pressure was input to be 70.6 kPa. Post processing of results was done using TECPLOT. Other material properties that were used were similar to
7
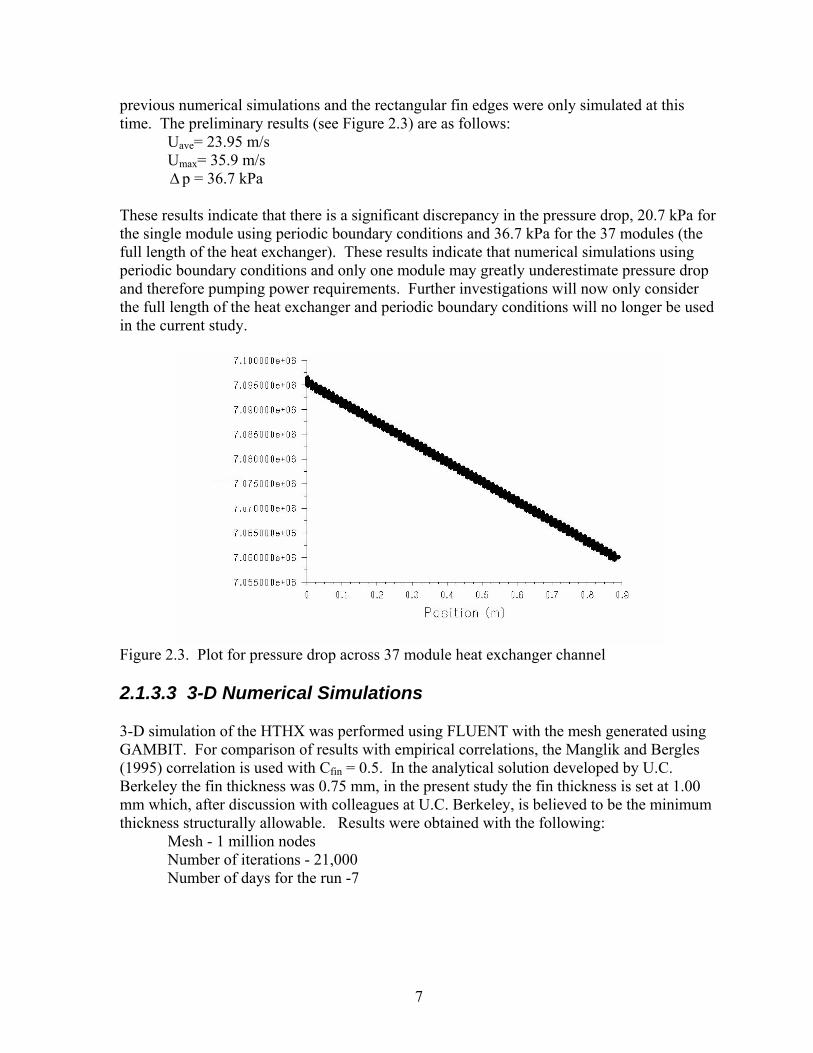
previous numerical simulations and the rectangular fin edges were only simulated at this time. The preliminary results (see Figure 2.3) are as follows:
Uave= 23.95 m/s Umax= 35.9 m/s Δ p = 36.7 kPa
These results indicate that there is a significant discrepancy in the pressure drop, 20.7 kPa for the single module using periodic boundary conditions and 36.7 kPa for the 37 modules (the full length of the heat exchanger). These results indicate that numerical simulations using periodic boundary conditions and only one module may greatly underestimate pressure drop and therefore pumping power requirements. Further investigations will now only consider the full length of the heat exchanger and periodic boundary conditions will no longer be used in the current study.
Figure 2.3. Plot for pressure drop across 37 module heat exchanger channel 2.1.3.3 3-D Numerical Simulations 3-D simulation of the HTHX was performed using FLUENT with the mesh generated using GAMBIT. For comparison of results with empirical correlations, the Manglik and Bergles (1995) correlation is used with Cfin = 0.5. In the analytical solution developed by U.C. Berkeley the fin thickness was 0.75 mm, in the present study the fin thickness is set at 1.00 mm which, after discussion with colleagues at U.C. Berkeley, is believed to be the minimum thickness structurally allowable. Results were obtained with the following:
Mesh - 1 million nodes Number of iterations - 21,000 Number of days for the run -7
8
Table 2.1. Comparison of results with empirical correlations FLUENT simulation Empirical correlations Specified Inlet temperature (He) 1000 °C 1000 °C Calculated outlet temperature (He) 610 °C 632 °C Specified Inlet temperature (MS) 560 °C 560 °C Calculated outlet temperature (MS)
927 °C 975 °C
Log-mean Temperature Difference between inlet and outlet conditions
60.8 °C 44.4 °C
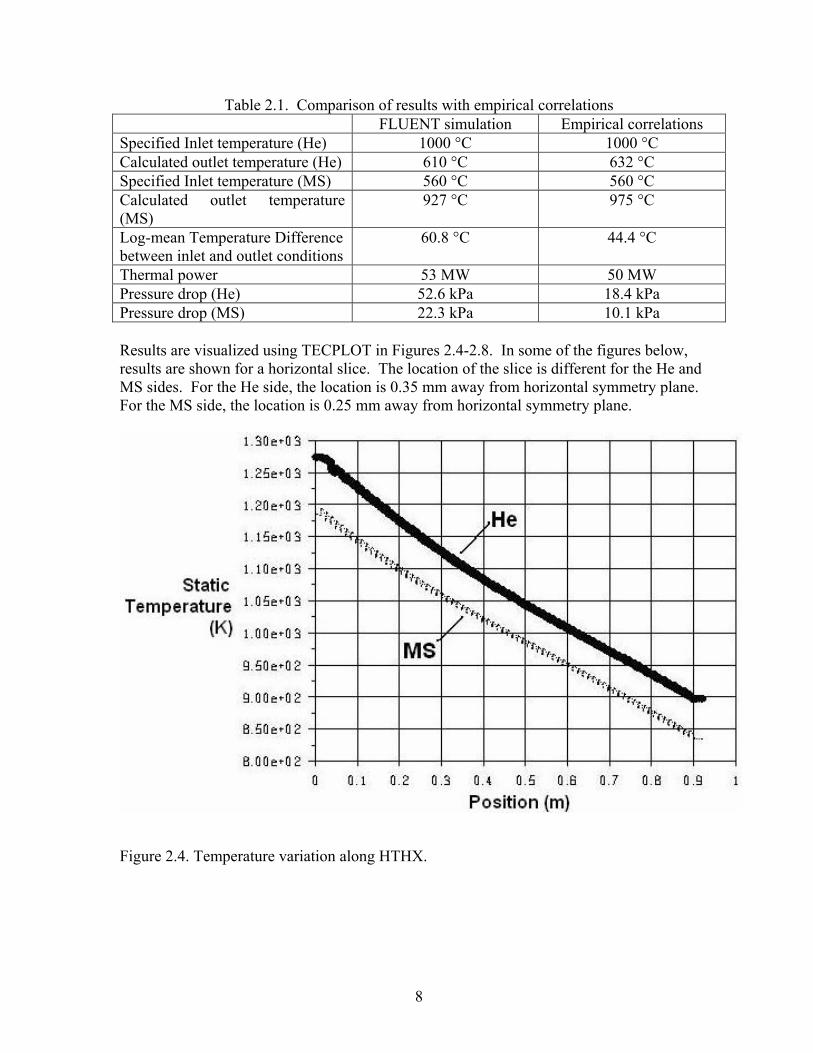
Thermal power 53 MW 50 MW Pressure drop (He) 52.6 kPa 18.4 kPa Pressure drop (MS) 22.3 kPa 10.1 kPa Results are visualized using TECPLOT in Figures 2.4-2.8. In some of the figures below, results are shown for a horizontal slice. The location of the slice is different for the He and MS sides. For the He side, the location is 0.35 mm away from horizontal symmetry plane. For the MS side, the location is 0.25 mm away from horizontal symmetry plane.
Figure 2.4. Temperature variation along HTHX.
9
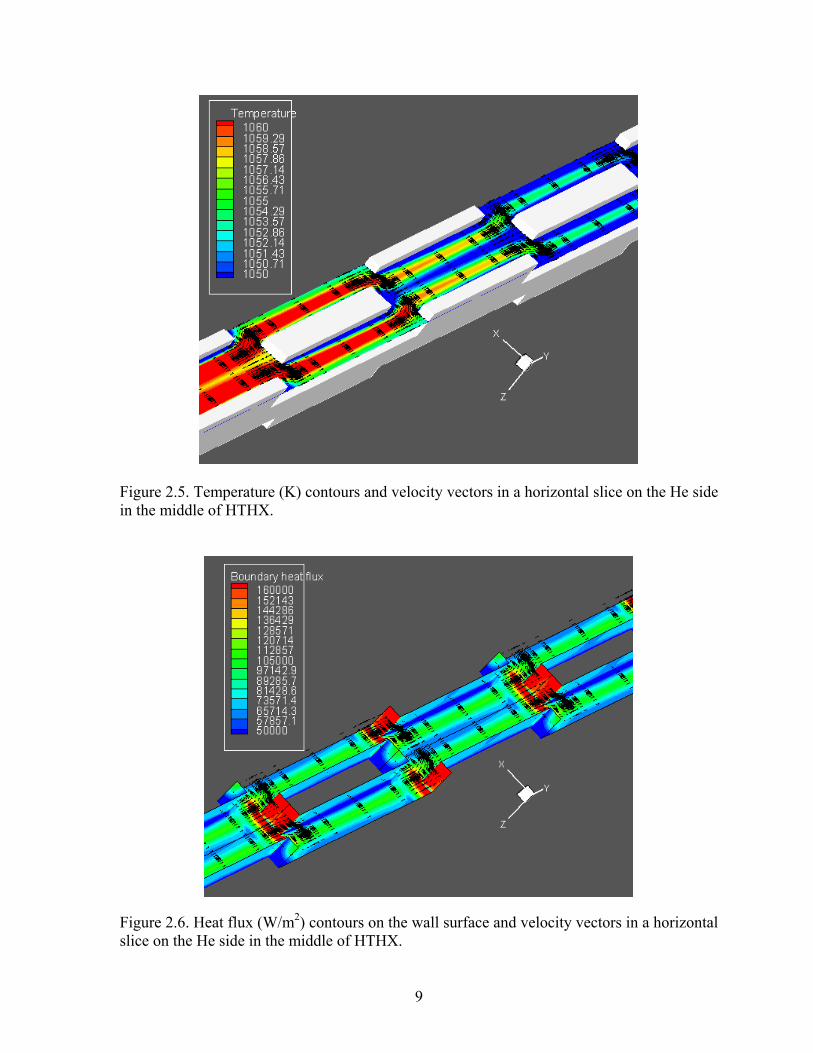
Figure 2.5. Temperature (K) contours and velocity vectors in a horizontal slice on the He side in the middle of HTHX.
Figure 2.6. Heat flux (W/m2) contours on the wall surface and velocity vectors in a horizontal slice on the He side in the middle of HTHX.
10
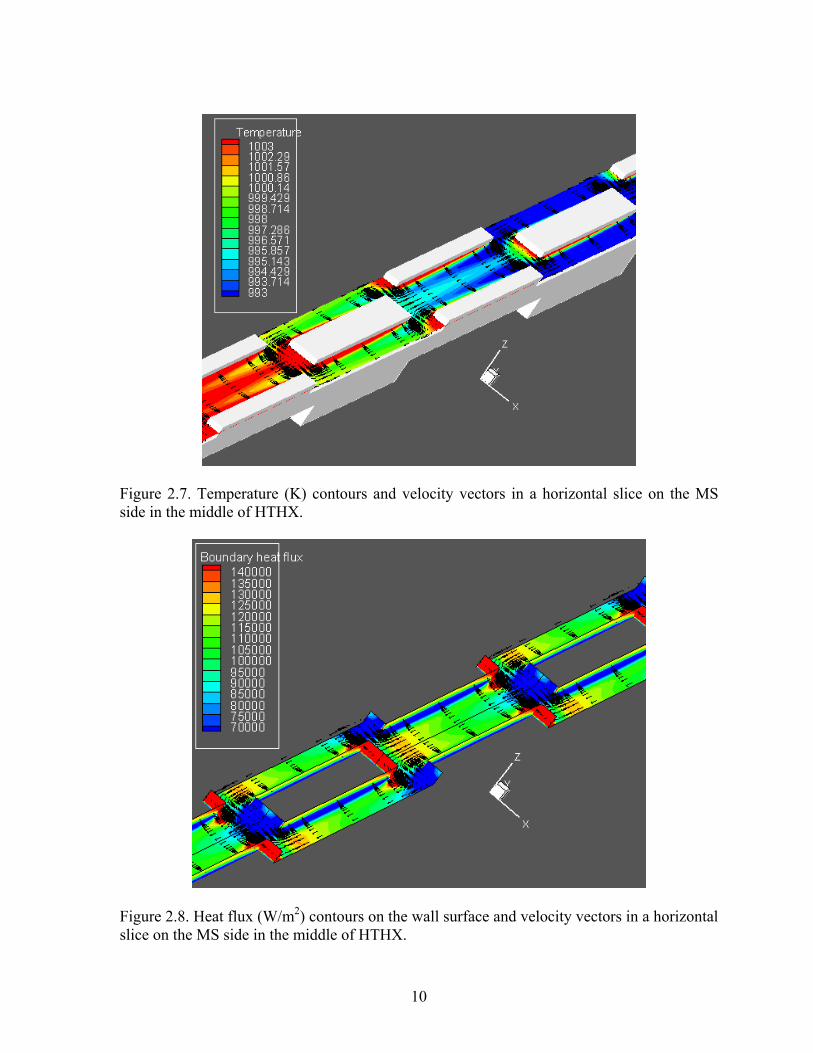
Figure 2.7. Temperature (K) contours and velocity vectors in a horizontal slice on the MS side in the middle of HTHX.
Figure 2.8. Heat flux (W/m2) contours on the wall surface and velocity vectors in a horizontal slice on the MS side in the middle of HTHX.
11
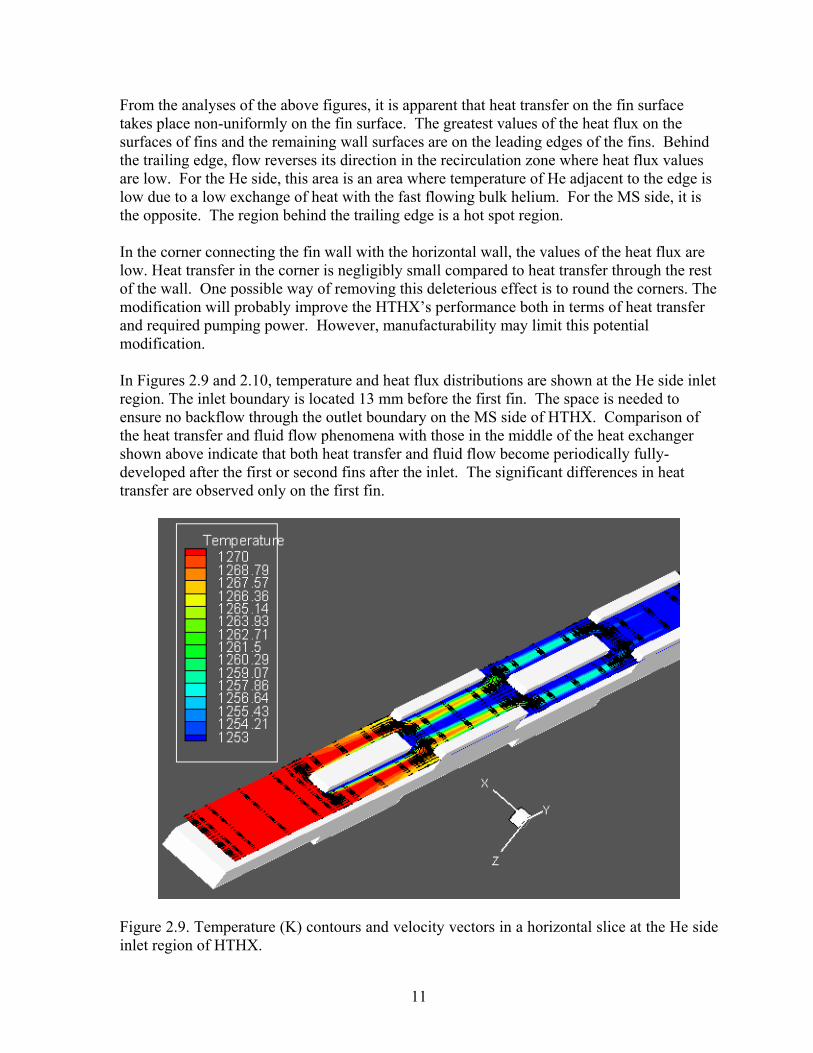
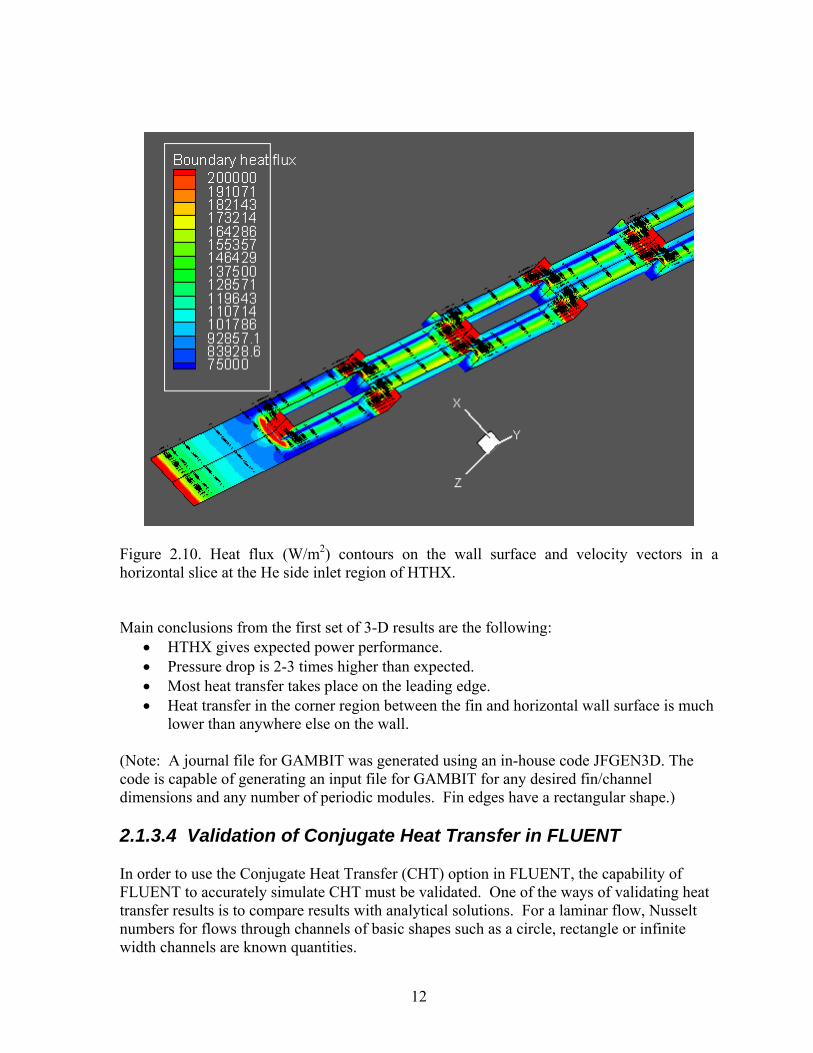
From the analyses of the above figures, it is apparent that heat transfer on the fin surface takes place non-uniformly on the fin surface. The greatest values of the heat flux on the surfaces of fins and the remaining wall surfaces are on the leading edges of the fins. Behind the trailing edge, flow reverses its direction in the recirculation zone where heat flux values are low. For the He side, this area is an area where temperature of He adjacent to the edge is low due to a low exchange of heat with the fast flowing bulk helium. For the MS side, it is the opposite. The region behind the trailing edge is a hot spot region. In the corner connecting the fin wall with the horizontal wall, the values of the heat flux are low. Heat transfer in the corner is negligibly small compared to heat transfer through the rest of the wall. One possible way of removing this deleterious effect is to round the corners. The modification will probably improve the HTHX’s performance both in terms of heat transfer and required pumping power. However, manufacturability may limit this potential modification. In Figures 2.9 and 2.10, temperature and heat flux distributions are shown at the He side inlet region. The inlet boundary is located 13 mm before the first fin. The space is needed to ensure no backflow through the outlet boundary on the MS side of HTHX. Comparison of the heat transfer and fluid flow phenomena with those in the middle of the heat exchanger shown above indicate that both heat transfer and fluid flow become periodically fully-developed after the first or second fins after the inlet. The significant differences in heat transfer are observed only on the first fin.
Figure 2.9. Temperature (K) contours and velocity vectors in a horizontal slice at the He side inlet region of HTHX.
12
Figure 2.10. Heat flux (W/m2) contours on the wall surface and velocity vectors in a horizontal slice at the He side inlet region of HTHX. Main conclusions from the first set of 3-D results are the following:
• HTHX gives expected power performance. • Pressure drop is 2-3 times higher than expected. • Most heat transfer takes place on the leading edge. • Heat transfer in the corner region between the fin and horizontal wall surface is much
lower than anywhere else on the wall. (Note: A journal file for GAMBIT was generated using an in-house code JFGEN3D. The code is capable of generating an input file for GAMBIT for any desired fin/channel dimensions and any number of periodic modules. Fin edges have a rectangular shape.) 2.1.3.4 Validation of Conjugate Heat Transfer in FLUENT In order to use the Conjugate Heat Transfer (CHT) option in FLUENT, the capability of FLUENT to accurately simulate CHT must be validated. One of the ways of validating heat transfer results is to compare results with analytical solutions. For a laminar flow, Nusselt numbers for flows through channels of basic shapes such as a circle, rectangle or infinite width channels are known quantities.
13
Test 1 A counter-flow heat exchanger having two parallel channels of a constant height and an infinite width separated from each other by a solid material has been selected. The fluids moving opposite one another in these channels are He and MS. The heights of the channels are identical to those of the offset strip fin HTHX (He: 2 mm, MS: 1 mm). The thickness of the separating solid material (LSI carbon-carbon composite) is also identical to the offset strip fin HTHX design, i.e. 1 mm. For laminar fully-developed flow, the Nusselt number is a known quantity and can be taken from Kays and London (1984, Table 6.1, p. 120) for both the constant wall temperature (Nu=7.54) and constant wall heat flux (Nu=8.235) boundary conditions. Thus, the convective heat transfer coefficients can be calculated (He: h1=1593 W/m2·K, MS: h2=8400 W/m2·K). It is possible to represent heat transfer from a hot fluid (He) to a cold fluid (MS) using an electric circuit analogy. The thermal resistances to heat transfer can be placed into a network that would include two convective conditions and one conductive condition. The convective thermal resistances become (He: 1/h1 = 6.28·10-4m2·K/W, MS: 1/h2 = 1.19·10-4 m2·K/W). The conductive thermal resistance is L/kLSI=1·10-4 m2·K/W. The average temperature on the He side is 816 °C and on the MS side is 767.5 °C. If we take these temperatures as T∞,1 and T∞,2, then the wall surface temperatures are calculated (He: Ts,1 = 780 °C, MS: Ts,2 = 774.3 °C). The numerical solution should agree with these wall surface temperatures. In order to get fully-developed conditions in the channels, two periodic flows must be considered. FLUENT allows imposing only one pair of periodic boundary conditions, thus this method of reaching a fully-developed state in FLUENT is not possible. Another way is to take a very long channel, and impose uniform temperature and velocity at the inlet so that fully-developed conditions will be reached after a certain entrance length. This approach was selected. The length of the channel could be potentially taken as the length of the actual HTHX of 0.9 m. However, for channel heights of 1 mm and 2 mm, it would require a very lengthy domain and a great number of nodal points. A fully developed condition could also be reached on a shorter domain, say, equal to 0.06 m. In the actual HTHX, the temperature would decrease by 184 °C per 0.45 m length on the He side, and increase by 207.5 °C per the same length on the MS side. This is equivalent to increase by 12 °C per 0.03 m on the He side, and decrease by 14 °C per the same length on the MS side. Thus the inlet temperatures are taken as follows: He: Tin = 828 °C, MS: Tin = 754 °C. In the middle of the channels, numerical simulation should give the desired wall surface temperatures, Ts,1, Ts,2. The computed values are very close but not identical (Ts,1 = 774 °C, Ts,2 = 769 °C vs Ts,1 = 780 °C, Ts,2 = 774 °C obtained analytically). The discrepancy is most likely due to a nonlinear fluid temperature variation along the He and MS channels. Even though the absolute values of Ts,1, Ts,2 do not match precisely, the temperature drop through the wall is quite close.
Test 2 In Test 1, the analytical solution for Ts,1, Ts,2 was derived based on the Nusselt number for the constant heat flux boundary condition (Nu = 8.235). To see a difference from selecting the

14
Nusselt number for the constant temperature boundary condition (Nu = 7.54), the analytical solution was derived again, and gave (Ts,1 = 780 °C, Ts,2 = 774 °C). The values are rather close to the values for the constant heat flux boundary conditions, and the temperature drop through the wall makes up 5.3 °C, thus the numerical value of 5 °C is correct.
Test 3 In Test 1, the network of thermal resistances included only three thermal resistances, with only one resistance (convection) on each fluid side. The energy equation that FLUENT solves numerically for each fluid side has both convective and conductive terms, and the influence of conductive terms on the surface wall temperature values could also be significant. Therefore, in the analytical solution, it would also be reasonable to include the influence of conduction from the fluid to the wall in order to see if this would eliminate the previous discrepancy in the wall surface temperatures, or would make the discrepancy even larger. The conduction acts in parallel with convection, and therefore the thermal resistances in the fluid become smaller due to additional heat transfer paths by conduction. The analytical solution for the case of constant heat flux boundary conditions (Nu = 8.235) included in parallel conductive thermal resistances on each fluid side gave Ts,1 = 781 °C and Ts,2 = 774 °C), which are still very close values, thus the influence of conduction through the fluid on the overall heat transfer can be neglected.
Test 4 In this test, the fluid flow on the MS side was not calculated, but instead, it was considered that the material of the wall along which He flows is exposed to the “atmosphere” of MS having bulk temperature T∞,2 equal to the average temperature of MS (T∞,2=1040.65 K), and convective heat transfer coefficient h2 = 8400 W/m2·K, calculated based on the Nusselt number for a constant heat flux boundary condition (Nu2 = 8.235). In FLUENT, this is associated with the convective boundary condition. The fluid flow in the channel must reach a fully-developed state before the exit since the channel length is 450 hydraulic diameters. Likewise, it is expected that the thermal boundary layer also reaches a fully-developed state before the exit. The solution showed that the velocity boundary layer reaches a fully-developed state in 0.1-0.2 meters (50-100 hydraulic diameters). This can be evidenced by a stabilized pressure gradient, and an unchanging shape of the velocity profile. However, the shape of the temperature profile as well as the temperature distribution within the solid material does not reach a constant condition. The difference in the wall temperature and axial fluid temperature decreases from 82 °C in the middle of the channel to 30.5 °C at the end of the channel. The temperature gradient through the wall also keeps decreasing throughout the channel length without reaching a constant value. The exit temperature on the external wall (Ts,2 = 770 °C) exposed to the MS “atmosphere” comes quite close to the bulk temperature of the MS (T∞,2 = 768 °C). The exit temperature on the internal wall adjacent to He (Ts,1 = 771 °C) and the exit bulk temperature of He (T∞,1 = 790 °C) can be easily seen in FLUENT. The exit heat transfer coefficient on the He side becomes h1 = 900 W/m2·K, and the exit Nusselt number (Nu1 = 4.7) is almost twice less than the anticipated value of Nu1 = 8.235 for a
15
constant wall heat flux situation or Nu1 = 7.54 for a constant wall temperature situation. Such a low value of the Nusselt number can be likely explained by an indirect influence of the large wall thickness, which is only twice less than the He channel height. Similarly to the previous validation study, the found values of the bulk temperatures (T∞,1 = 790 °C, T∞,2 = 768 °C) and the heat transfer coefficients (h1 = 900 W/m2·K, h2 = 8400 W/m2·K) along with the thermal conductivity of the composite material (kLSI = 10 W/m·K) could be used to find analytically the wall surface temperatures, Ts,1, Ts,2. The analytical values are the same (Ts,1 = 771 °C, Ts,2 = 770 °C versus Ts,1 = 771 °C, Ts,2 = 770°C found numerically) to conclude that FLUENT accurately handles the CHT conditions. 2.2 Scaled HTHX Tests 2.2.1 Scaled HTHX Tests Objective and Scope The Scaled HTHX Tests have the following objectives and scope:
• Work with DOE NE R&D program to identify highest priority candidates for HTHX designs for Gen IV hydrogen production.
• Design and fabricate scaled HTHX section designs. • Conduct heat transfer and performance testing of HTHX components for lab-scale
and pilot plant conditions. • Interface with Very High Temperature Reactor demonstration project.
2.2.2 Scaled HTHX Tests Highlights • Heat Exchanger Design and Testing Meeting. Communications took place
between collaborators from the national NHI program and UNLV faculty members.
2.2.3 Scaled HTHX Tests Technical Summary UNLV Mechanical Engineering Professors Samir Moujaes and Robert Boehm are developing a FY04 proposal to start an HTHX Testing program to complement the current Materials and Design groups. The proposal will be submitted to the UNLV Research Foundation HTHX Summer/Fall 2004 proposal solicitation.

16
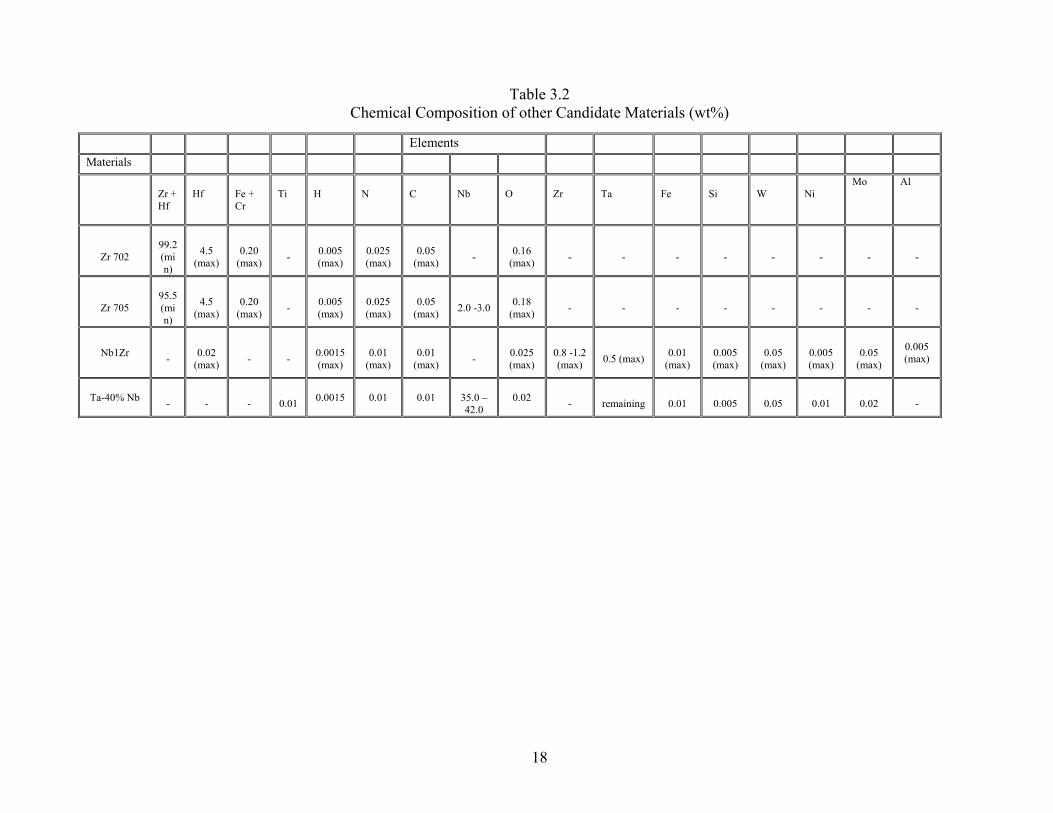
3.0 UNLV Materials Selection and Characterization Group 3.1 Introduction Selection of structural metallic materials and alloys for high-temperature heat exchangers to generate hydrogen using nuclear energy poses a major challenge to scientific and engineering communities. These materials must possess excellent resistance to numerous environment-induced degradation and superior high-temperature metallurgical properties. Since the inception of this project, preliminary experimental work involving three nickel-base alloys, namely Alloy C-22, Alloy C-276 and Waspaloy has been initiated. Tensile properties of all three alloys have been determined at ambient temperature, 450 and 600oC in the presence of nitrogen using the existing Material Testing System (MTS) machine at UNLV’s Mechanical Engineering Department. Further, the evaluation of the stress corrosion cracking (SCC) susceptibility of all three alloys in an aqueous solution containing sulfuric acid and sodium iodide under a constant-loading condition is in progress in the UNLV’s Materials Performance Laboratory. Fractographic evaluations of the tested tensile specimens by scanning electron microscopy (SEM) have also been performed. Based on the review of literature gathered from numerous materials-related meetings held at ORNL and UNLV during the past few months, three additional engineering alloys have been identified. They are Incoloy 800H, Incoloy 800HT and AL 610. Round bars of Incoloy 800H and 800HT have been ordered to prepare tensile and corrosion testing specimens. In addition to the work-scope associated with the present investigation, the following two subtasks have been proposed to perform collaborative research with the General Atomics, Inc. (GA) to evaluate prospective structural materials for application in Hydroiodic Acid (HI) decomposition:.
• Corrosion Studies of Candidate Structural Materials in HIx Environment as Functions of Metallurgical Variables
• Crack Growth Studies of Materials in HIx Environment at Elevated Temperatures and Pressures
The materials identified for these two subtasks are Zr 702, Zr 705, Nb1Zr and Ta-40%Nb. Three new Graduate Assistants have been selected to assist in experimental work associated with these two subtasks. The detailed budgets for these subtasks have been included in the proposal entitled “University Consortium for Materials Compatibility and Performance Research,” which was submitted to the UNLV Research Foundation. 3.2 Test Materials under Consideration The chemical compositions of nickel-base and other materials identified as structural materials for HTHX applications are given in Tables 3.1 and 3.2, respectively. Their standard ambient-temperature tensile properties are also shown in Tables 3.3 and 3.4, respectively.

17
Table 3.1 Chemical Composition of Nickel-Containing Materials (wt%)
Elements
Materials
Ni
Cr
Mo
C
Fe
Co
W
Si
Mn
V
P
S
Bo
Zr
Al
Ti
Cu
Alloy* C-276
Bal
14.5 to
16.5
15.0 to
17.0
0.01
(max)
4.0 to 7.0
2. 5
(max)
3.0 to 4.5
0.08
(max)
1.0
(max)
0. 35 (max)
0.02
(max)
0.01
(max)
-
-
-
-
-
Alloy* C-22
Bal
20.0 to
22.5
12.5 to
14.5
0.01
(max)
2.0 to 6.0
2. 5
(max)
2.5 to 3.5
0.08
(max)
0. 5
(max)
-
-
-
-
-
-
-
-
Waspaloy*
Bal
18.0 to
21.0
3.5 to 5.0
0.02 to
0.10
2.0
(max)
12.0 to
15.0
-
0.75
(max)
1.0
(max)
-
0.03
(max)
0.03
(max)
0.003
to 0.01
0.02 to
1.60
1.20 to
1.60
2.75 to
3.25
0. 5
(max)
AL 610
14.0 to
15.5
17 to
18.5
0.20 (max)
0.018 (max)
Bal
-
-
3. 70
to 4. 30
2.00 (max)
-
0.020 (max)
0.020 (max)
-
-
-
-
0. 50
Incoloy 800H
30.0 to
35.0
19.0 to
23.0
-
0.05 to
0.10
Bal
2.00 (max)
-
1.00 (max)
1. 50 (max)
-
-
0.015 (max)
-
-
0.15 to
0.60
0.15 to
0.60
0.75 (max)
Incoloy 800HT
30.0 to
35.0
19.0 to 23.
-
0.06 to
0.10
39. 5 (min)
-
-
1.0 (max)
0.2 to 0.6
-
-
0.015 (max)
-
-
0.15 to 1.6
0. 3 To 0.6
18
Table 3.2 Chemical Composition of other Candidate Materials (wt%)
Elements Materials
Zr + Hf
Hf
Fe + Cr
Ti
H
N
C
Nb
O
Zr
Ta
Fe
Si
W
Ni
Mo Al
Zr 702
99.2 (min)
4.5
(max)
0.20
(max)
-
0.005 (max)
0.025 (max)
0.05
(max)
-
0.16
(max)
-
-
-
-
-
-
-
-
Zr 705
95.5 (min)
4.5
(max)
0.20
(max)
-
0.005 (max)
0.025 (max)
0.05
(max)
2.0 -3.0
0.18
(max)
-
-
-
-
-
-
-
-
Nb1Zr
-
0.02
(max)
-
-
0.0015 (max)
0.01
(max)
0.01
(max)
-
0.025 (max)
0.8 -1.2 (max)
0.5 (max)
0.01
(max)
0.005 (max)
0.05
(max)
0.005 (max)
0.05
(max)
0.005 (max)
Ta-40% Nb
-
-
-
0.01
0.0015
0.01
0.01
35.0 – 42.0
0.02
-
remaining
0.01
0.005
0.05
0.01
0.02
-

19
Table 3.3 Standard Tensile Properties of Nickel-Containing Materials at Ambient Temperature
Material/ Heat treatment
YS (ksi)
UTS (ksi)
% El % RA Hardness
Alloy C- 276/ Solution Annealed
50.0 114.0 64 % 81 % 87 RB
Alloy C- 22/ Solution Annealed
53.0 113.0 62 % 83 % 86 RB
Waspaloy/ Solution Annealed
110.0 185.0 40 % 43 % 36 RC
AL 610/ -
46.8 103 58 % -- 86 RB
Incoloy 800H/ Solution Annealed
25 65 30 % -- 126 RB
Incoloy 800HT/ Annealed
35 80 45 % -- 126 RB

20
Table 3.4
Standard Tensile Properties of other Materials at ambient Temperature
3.3 Accomplishments
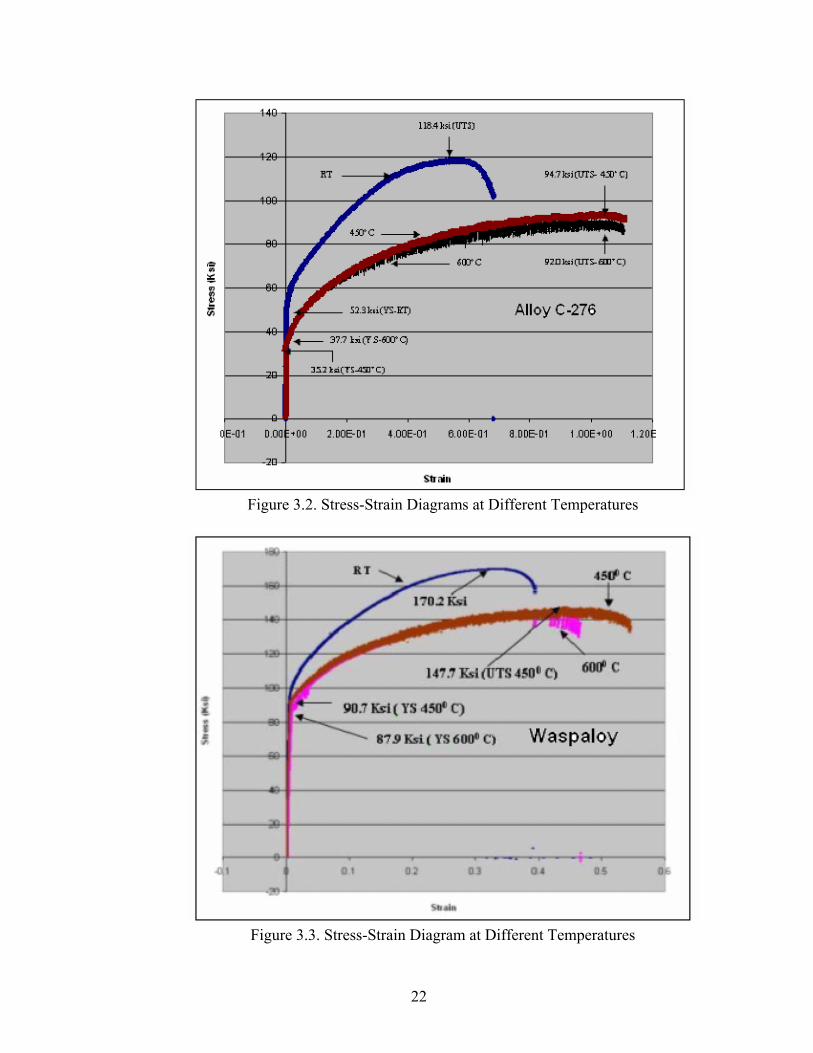
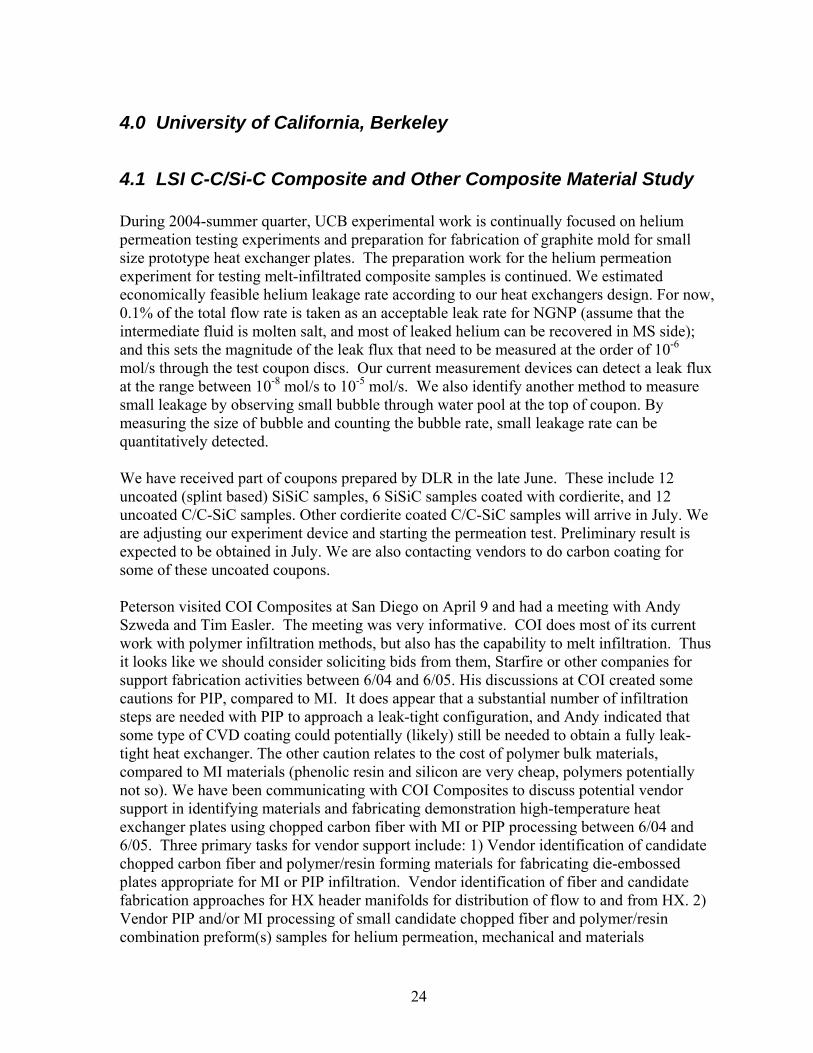
● The results of tensile testing, shown in Table 3.5, indicate that very little loss in strength in terms of yield strength (YS) and ultimate tensile strength (UTS) was observed in Waspaloy due to a change in testing temperature from ambient to 600 oC. Between 450 and 600 oC, slight reduction in strength was observed for all three alloys. The ductility in terms of percent elongation (%El) was significantly enhanced at elevated temperatures for Alloys C-22 and 276, as expected. The stress versus strain diagrams for all three tested materials are shown in Figures 3.1 through 3.3.
● Fractographic evaluations of the tested tensile specimens by scanning electron
microscopy revealed dimpled microstructure, indicating ductile failures at all three testing temperatures. The SEM micrographs are shown in Figures 3.4 – 3.6.
● SCC testing under constant-loading conditions involving all three alloys is in
progress in aqueous environments containing sulfuric acid and sodium iodide at 90 oC. No failures have yet been observed at applied stresses corresponding to 95 percent of the materials’ YS values.
● Quotations for equipment needed to perform the desired mechanical, corrosion and
electrochemical testing have been submitted to the UNLV Research Foundation for approval and subsequent procurement.
● Significant interactions took place with research personnel at General Atomics that
resulted in two collaborative research proposals to address numerous materials-related issues for successful applications in HTHX. A number of potential graduate students to pursue the related research activities have also been identified.
● Sample preparation using other types of structural materials is ongoing to evaluate
their properties.
Material/ Heat treatment
YS (ksi)
UTS % El
Zr 702/ Annealed 46.6 67.9 28.9
Zr 705/ Annealed 73.4 89.2 18.8
Ta-40% Nb/ Annealed 20 40 20

21
Table 3.5 Results of Tensile Testing
Average YS
Average UTS
Average %El
Test Temperature Test Temperature Test Temperature
Material
RT
450oC
600oC
RT
450oC
600oC
RT
450oC
600oC
Waspaloy
100.23
89.2
84.05
167.9
145.75
143.4
40.55
49.26
43.15
Alloy C-22
52.46
36.6
34.6
113.73
89.45
84.45
66.26
80.04
79.99
Alloy C-276
53.16
37.05
36.6
116.96
94.6
90.4
66.49
80.03
80
Figure 3.1. Stress-Strain Diagrams at Different Temperatures
22
Figure 3.2. Stress-Strain Diagrams at Different Temperatures
Figure 3.3. Stress-Strain Diagram at Different Temperatures

23
Figure 3.4. SEM Micrographs of Waspaloy
Figure 3.5. SEM Micrographs of Alloy C-22
Figure 3.6. SEM Micrographs of Alloy C-276
24
4.0 University of California, Berkeley
4.1 LSI C-C/Si-C Composite and Other Composite Material Study During 2004-summer quarter, UCB experimental work is continually focused on helium permeation testing experiments and preparation for fabrication of graphite mold for small size prototype heat exchanger plates. The preparation work for the helium permeation experiment for testing melt-infiltrated composite samples is continued. We estimated economically feasible helium leakage rate according to our heat exchangers design. For now, 0.1% of the total flow rate is taken as an acceptable leak rate for NGNP (assume that the intermediate fluid is molten salt, and most of leaked helium can be recovered in MS side); and this sets the magnitude of the leak flux that need to be measured at the order of 10-6 mol/s through the test coupon discs. Our current measurement devices can detect a leak flux at the range between 10-8 mol/s to 10-5 mol/s. We also identify another method to measure small leakage by observing small bubble through water pool at the top of coupon. By measuring the size of bubble and counting the bubble rate, small leakage rate can be quantitatively detected. We have received part of coupons prepared by DLR in the late June. These include 12 uncoated (splint based) SiSiC samples, 6 SiSiC samples coated with cordierite, and 12 uncoated C/C-SiC samples. Other cordierite coated C/C-SiC samples will arrive in July. We are adjusting our experiment device and starting the permeation test. Preliminary result is expected to be obtained in July. We are also contacting vendors to do carbon coating for some of these uncoated coupons. Peterson visited COI Composites at San Diego on April 9 and had a meeting with Andy Szweda and Tim Easler. The meeting was very informative. COI does most of its current work with polymer infiltration methods, but also has the capability to melt infiltration. Thus it looks like we should consider soliciting bids from them, Starfire or other companies for support fabrication activities between 6/04 and 6/05. His discussions at COI created some cautions for PIP, compared to MI. It does appear that a substantial number of infiltration steps are needed with PIP to approach a leak-tight configuration, and Andy indicated that some type of CVD coating could potentially (likely) still be needed to obtain a fully leak-tight heat exchanger. The other caution relates to the cost of polymer bulk materials, compared to MI materials (phenolic resin and silicon are very cheap, polymers potentially not so). We have been communicating with COI Composites to discuss potential vendor support in identifying materials and fabricating demonstration high-temperature heat exchanger plates using chopped carbon fiber with MI or PIP processing between 6/04 and 6/05. Three primary tasks for vendor support include: 1) Vendor identification of candidate chopped carbon fiber and polymer/resin forming materials for fabricating die-embossed plates appropriate for MI or PIP infiltration. Vendor identification of fiber and candidate fabrication approaches for HX header manifolds for distribution of flow to and from HX. 2) Vendor PIP and/or MI processing of small candidate chopped fiber and polymer/resin combination preform(s) samples for helium permeation, mechanical and materials
25
compatibility testing. CVD carbon or SiC coating of the surface of samples may be needed. 3) Vendor PIP or MI processing of selected material to fabricate small test HX (composed of several plates, approximately 50 mm x 100 mm x 3mm, with a simple tube-type inlet and outlet manifold). CVD carbon or SiC coating of inside surfaces of HX may be required. Peterson did a brief cost estimation for composite compact heat exchangers. For NGNP with a total capital cost around $500/kW thermal, to be a reasonable fraction of the total plant cost, heat exchangers would need to be below perhaps $25/kW thermal. That suggests that we need to be able to fabricate HX composites at costs below $250 to $1250 per kilogram for typical thermal densities from 20MW/m3 to 120MW/m3, for total quantities in the range of 60 MT to 12 MT per 600 MW thermal plant. The fact that disc brakes based on chopped carbon fiber are becoming commercially viable could be an important consideration for our work, since the cost and commercialization models for this application could be similar to that for nuclear applications. If nuclear components can be designed that use similar bulk materials and fabrication methods as are being applied for this larger disc brake market, the ability to commercialize the nuclear components could be simplified because they could be fabricated at lower cost during the initial deployment phase, until they would become a substantial commercial market by themselves. We took part in the H2 materials meeting at UNLV on May 17th. Peterson gave a presentation about UCB’s progress in C-C/SiC composite HX study.
4.2 Thermal Design Study and Review We are preparing to do complete heat exchangers mechanical and thermal stress designs, such as stresses at the header and manifold connection points. Because it is computationally prohibitive to model the individual fins, we are planning to model them using an effective, anisotropic elastic modulus, derived from unit-cell calculations. We are currently designing fin-patterns for HX plates, and will be fabricating molds with graphite. During these three months, we are focusing on inlet and outlet flow distribution designs for HX plates. Our goal is to design an optimal ceramic plate heat exchanger for counterflow heat exchange, where there is a substantial difference between the volumetric flow rates of the two fluids. Applications can include liquid-to-gas heat exchangers and gas-to-gas heat exchangers where there exists a large difference in the volumetric flow rates. The design criteria are:
4.2.1 High Volumetric Flow (HVF) Fluid Maximize the HX frontal area, and minimize the flow area variation through the heat exchanger, to minimize pumping power. The heat exchanger is assumed to be immersed in environment containing the HVF fluid, so that the HVF fluid can be pumped through the HX in a manner similar to how air is pumped through a car radiator.
26
4.2.2 Low Volumetric Flow (LVF) Fluid • Because the LVF may be a liquid, and the HVF may flow horizontally through the
HX, LVF flow paths are horizontal, or slope upward, so that gas bubbles can be reliably purged and the liquid can be reliably drained.
• The distribution manifold must provide uniform mass flows to the finned region of the plate, to provide for high effectiveness. Fins are preferred due to their ability to enhance heat transfer, but the finned region of the plate may be subdivided into a number of parallel flow regions, to reduce cross-flow in the finned region. The distribution manifold must do this with a reasonable pressure drop, to avoid excessively high LVF fluid pressures and pumping power (although pumping power will likely be dominated by the LVF).
• Cross-flow reduces the effectiveness of the HX. Because regions with cross-flow operate with larger temperature differences than counterflow regions, they reduce the temperature difference available in the counterflow region. Thus it is important to minimize the fraction of the total plate area that operates with cross-flow, which means minimizing the area of the plate occupied by the distribution flow channels.
• The HX must be able to sustain transient thermal stresses that would occur if there is a sudden change in the inlet temperature of the LVF or HVF fluid. In general, this is best accomplished by avoiding thick plate regions, which means that the distribution flow channels should be separated by similar spacing as the widths of the fins. Special design attention must be paid to the manifold holes through the plates, where the plate material must be significantly thicker.
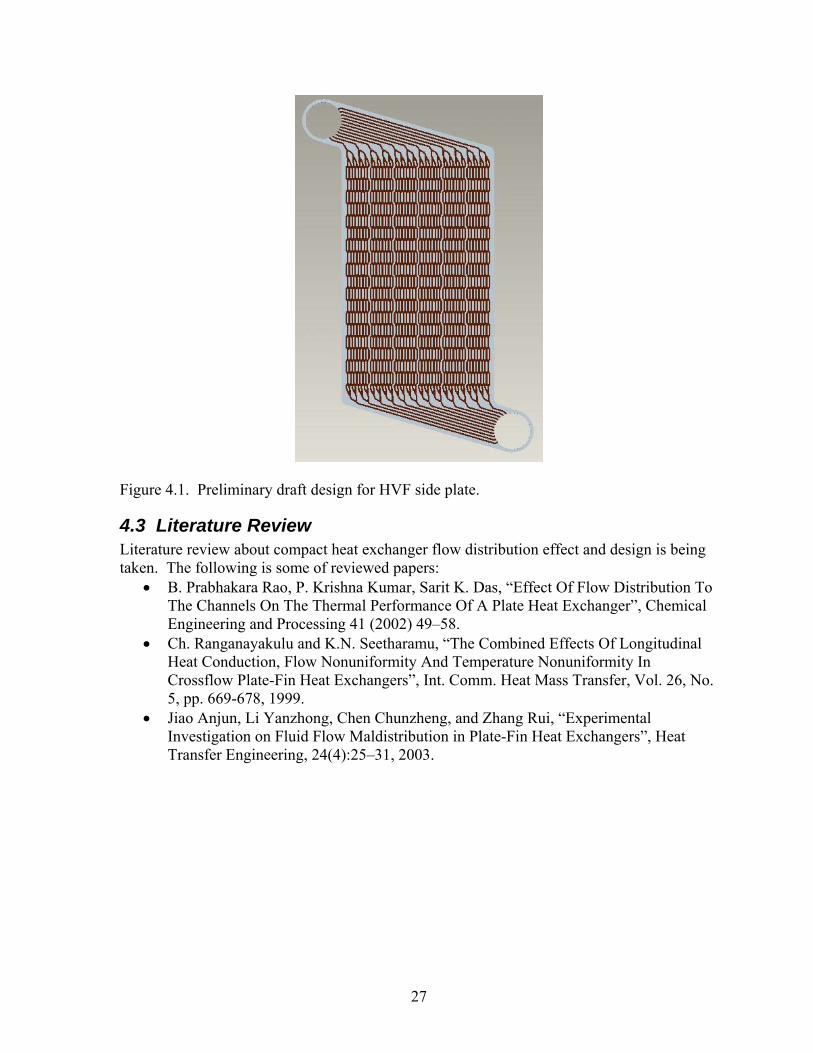
Figure 4.1 is a preliminary draft design for HVF side plate. We will further refine the design through pressure loss analysis and 3-D mechanical and thermal stress analysis. HX modules in this type of configuration can be arranged side by side to use available space to the maximum content while still can have uniform LVF distribution in HX modules.
27
Figure 4.1. Preliminary draft design for HVF side plate.
4.3 Literature Review Literature review about compact heat exchanger flow distribution effect and design is being taken. The following is some of reviewed papers:
• B. Prabhakara Rao, P. Krishna Kumar, Sarit K. Das, “Effect Of Flow Distribution To The Channels On The Thermal Performance Of A Plate Heat Exchanger”, Chemical Engineering and Processing 41 (2002) 49–58.
• Ch. Ranganayakulu and K.N. Seetharamu, “The Combined Effects Of Longitudinal Heat Conduction, Flow Nonuniformity And Temperature Nonuniformity In Crossflow Plate-Fin Heat Exchangers”, Int. Comm. Heat Mass Transfer, Vol. 26, No. 5, pp. 669-678, 1999.
• Jiao Anjun, Li Yanzhong, Chen Chunzheng, and Zhang Rui, “Experimental Investigation on Fluid Flow Maldistribution in Plate-Fin Heat Exchangers”, Heat Transfer Engineering, 24(4):25–31, 2003.

28
5.0 General Atomics Corrosion Testing - Materials for Hydrogen Iodide Decomposition 5.1 Executive Summary The temporary testing facility in Rm105, Bldg. 30 is in operation. A number of dry runs have been successfully completed and corrosion testing is underway beginning in early July. The testing is expected to be completed by late August. The waiting period required by the DEA to procure. The legal requirement to procure HI aqueous solution has led to a scheduling delay. In addition, lab set up and safety requirement modifications has pushed back the starting test date.
Introduction
HI decomposition by reactive distillation presents a clean and efficient means to obtain hydrogen. In this reaction, the HIx (HI + I2 + H2O) liquid mixture is heated to 310ºC to promote HI dissociation. The high temperature, high pressure and the chemicals involved in this reaction generate a remarkably corrosive surrounding. Hence, the materials used to construct components in this reaction cycle must be able to weather the environment in addition to having the suitable mechanical and thermal properties.
The goal of this project is to perform preliminary screening test to identify candidates for materials for construction for the HI decomposition Section. This is accomplished by conducting immersion corrosion test in which material coupons are submerged in HIx under the reactive distillation conditions. Their corrosion rate is monitored up to 100 hrs.
5.2 Facilities to Accommodate the Experimental Set Up
Renovation of a facility dedicated to Sulfur-Iodine (SI) cycle related experiment (including corrosion testing) is on going. Facility is expected to be ready by September 04 at which point, the temporary corrosion testing facility will be re-located.
Modification of the existing facility in room 105, GA Building 30 to fulfill the working and safety requirement has been completed. The effort include:
• installation of dry charcoal scrubber. • modification of the enclosure to accommodate the pressure manifold and piping set
up. • installation of interlocks for temperature, door and air flow. • installation of latches on the enclosure door to maintain the integrity of the enclosure. • modification of the ventilation system to increase air flow. • cleanup of fume hood for chemical storage and handling. • procurement and installation of emergency eyewash stations and spill kit. • locating waste disposals facilities inside the fume hood. • preparation of a location for He supply gas tank storage.
29
5.3 Design and Build of the Experimental Set up and Establish Working Procedures
The design and built of the high temperature, high pressure corrosion test system have been completed. Figure 5.1 shows the completed test set up including the furnace, vessel, temperature controller and fume hood. A schematic cross section of the test system is shown in Figure 5.2. Figure 5.3 shows the test coupon sits inside an empty and a filled glass capsule. The capsule is placed inside a closed ended mullite tube on top of a bed of activated charcoal. The mullite tube acts as spillage containment in the event the capsule breaks during experiment. The activated charcoal acts to absorb the HI and I2 if there is a spill. The top of the mullite tube is filled with charcoal and steel wool to absorb any test medium vapor that leaks outside the container the tapered joint. The specimen capsule-mullite tube combination sits on top of another bed of charcoal contained in stainless steel baskets inside the steel pressure vessel. A connection system with charcoal traps, blow disk, pressure relief vales and IN/OUT valves has been put together (Figure 5.4) and thoroughly tested. A detailed working procedure has been established(Appendix A). This procedure along with the test set up and safety pre-cautions were outlined in a Hazardous Work Authorization (HWA) and its subsequent amendment. This HWA has been approved by the safety community.
5.4 Procurement of Test Materials and Chemicals
The procurement of all test materials and coupons has been completed. The 57wt% HI aqueous solution, which was the final item, arrived on 6/22 due to a DEA waiting period requirement. The materials that are in house includes:
• pressure vessel capable rated at 4000 psi (276 bar) at 427ºC. • manifold related items • glass capsules for holding the HIx during the experiment. • chemicals: iodine and aqueous HI solution • materials coupons required for the experiment (Table 5.1) • lab safety related equipment (eyewash, spill kit) and tools • solvent and chemical waste disposals containers • system monitoring equipment e.g. interlocks and data acquisition equipment e.g.
micrometer, balance and camera.
5.5 Dry runs
A number of dry runs have been conducted to establish the equipment settings for the desired test conditions. This is because there is no direct measurement of the HIx temperature nor precise control of the chamber pressure during the experiment. The working pressure is expected to be between 1100–1200 psi, significantly higher that the expected equilibrium HIx vapor pressure of 750 psi. This ensures that the amount of HI and I2 vapor is minimized in order to maintain the integrity of the pressure vessel wall.
30
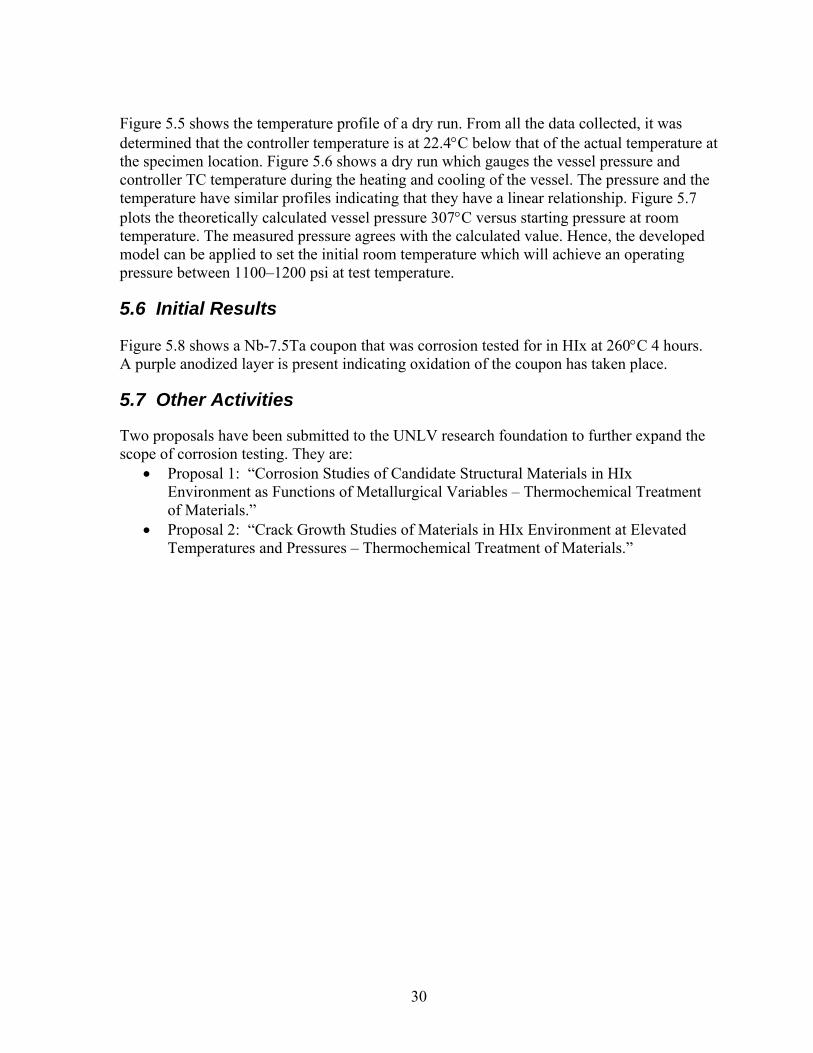
Figure 5.5 shows the temperature profile of a dry run. From all the data collected, it was determined that the controller temperature is at 22.4°C below that of the actual temperature at the specimen location. Figure 5.6 shows a dry run which gauges the vessel pressure and controller TC temperature during the heating and cooling of the vessel. The pressure and the temperature have similar profiles indicating that they have a linear relationship. Figure 5.7 plots the theoretically calculated vessel pressure 307°C versus starting pressure at room temperature. The measured pressure agrees with the calculated value. Hence, the developed model can be applied to set the initial room temperature which will achieve an operating pressure between 1100–1200 psi at test temperature.
5.6 Initial Results
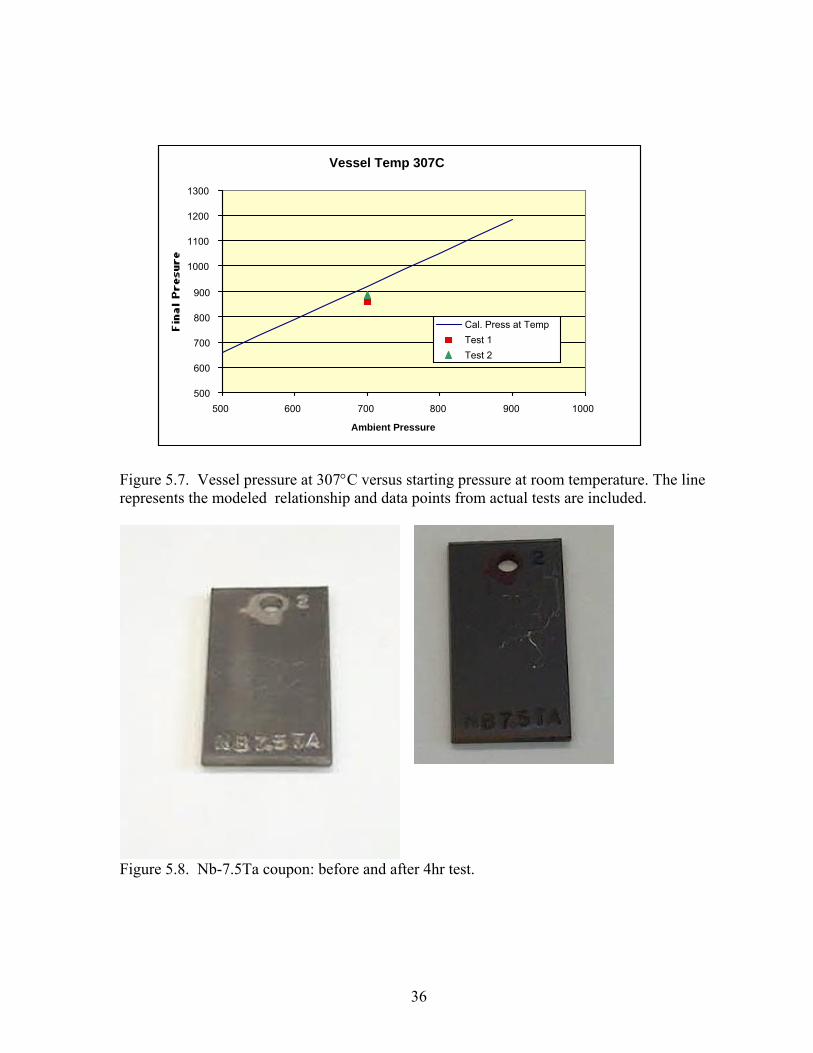
Figure 5.8 shows a Nb-7.5Ta coupon that was corrosion tested for in HIx at 260°C 4 hours. A purple anodized layer is present indicating oxidation of the coupon has taken place.
5.7 Other Activities
Two proposals have been submitted to the UNLV research foundation to further expand the scope of corrosion testing. They are:
• Proposal 1: “Corrosion Studies of Candidate Structural Materials in HIx Environment as Functions of Metallurgical Variables – Thermochemical Treatment of Materials.”
• Proposal 2: “Crack Growth Studies of Materials in HIx Environment at Elevated Temperatures and Pressures – Thermochemical Treatment of Materials.”

31
Table 5.1. Immersion corrosion test materials coupons
Materials In House Quantity
1 Ta √ 3
2 Ta-10%W √ 3
3 Ta-40%Nb √ 3
4 Nb √ 3
5 Nb-1%Zr √ 3
6 Nb-7.5%Ta √ 3
7 Nb-10%Hf √ 3
8 Zircalloy 702 √ 3
9 Zircalloy 705 √ 3
10 Mo-Re √ 3
11 graphite √ 3
12 SiC (sintered) √ 3 or more

32
Figure 5.1. (a) Furnace, pressure vessel and manifold set up (b) enclosure, temperature controller and charcoal filter (c) Fume hood next t the enclosure for mixing HIx.
Charcoal Filter Blow vent
a b
c
Temp. Controller

33
GlassCapsule
Taper Joint
GAS IN He
Mullite SpillageContainer 0.125Ó
Charcoal
Charcoal
GAS OUT
Specimen
HIx
Silica Capillary 5m
Glass Hook
304 Stainless Reactor
TUBE FURNACE
Figure 5.2. High temperature immersion corrosion test set up.

34
Figure 5.3. Corrosion coupon inside the glass capsule without HIx and with HIx. Figure 5.4. Piping schematic.
He IN
He OUT
Gauge
PressureReliefValve
Valve
Furnace/PressureVessel
Valve
PressureBlow Disk
Charcoal filter
Charcoal filter

35
Figure 5.5. Temperature readout from the thermal couples (TC) on the controller, external TC at the specimen location within the vessel and the interlock TC which is attached to the bottom of the vessel during the ramp up and soak cycle.
Figure 5.6. Thermal couple temperatures versus vessel pressure.
Controller vs. Thermocouple Readout (6/11)
0
50
100
150
200
250
300
0 100 200 300 400
time (min)
0
5
10
15
20
25
30
35
40
45
Cut
off T
C
456Vesselcutoff TC
reposition TC
Vessel Pressure vs. Temp 6_29
0
50
100
150
200
250
300
350
0 200 400 600 800 1000 1200
time (min)
600
650
700
750
800
850
900
950Ve
ssel
Pre
ssur
e
456TC CutoffVessel Pres
36
Figure 5.7. Vessel pressure at 307°C versus starting pressure at room temperature. The line represents the modeled relationship and data points from actual tests are included.
Figure 5.8. Nb-7.5Ta coupon: before and after 4hr test.
Vessel Temp 307C
500
600
700
800
900
1000
1100
1200
1300
500 600 700 800 900 1000
Ambient Pressure
Cal. Press at TempTest 1Test 2

37
5.8 Appendix A: Working Procedures
5.8.1 HIx Mixing and Corrosion Chamber Set Up Procedures I. Put on safety clothing including gloves, goggles and apron. II. Select the specimen for testing, put in on the glass hook and insert it into the glass
corrosion chamber. Place the glass chamber in a clean beaker. III. Determine the composition of the test medium and the volume/weight of individual
component: • HI(10at%), I (38at%) and H2O(52%) • HI(2at%), I (89at%) and H2O(9%)
IV. Determine the volume/weight of individual component:
I HI(10at%), I (38at%) and H2O (52%) Total Vol 180 120 100HI vol (cc) 70.7 47.2 39.3H2O vol (cc) 51.7 34.5 28.7I2 wt (g) 516.2 344.1 286.8
II HI(2at%), I (89at%) and H2O(9%) Total Vol (cc) 180 120 100HI vol (cc) 9.4 6.2 5.2H2O vol (cc) 6.8 4.6 3.8I2 wt (g) 800.3 533.5 444.6 V. Using a cylinder to measure the correct amount of H2O and pour it into another clean
glass beaker (e.q. 34.5 cc for Test medium 1 with 120 cc total volume). VI. Use a dry cylinder, funnel and pipette measure 47.2 cc of HI and add that to the
beaker. VII. With the balance and a disposable tray, weight 344.1 g of solid Iodine. VIII. Add the Iodine to the glass chamber. IX. Pour the HI and H2O into the chamber. X. Add the glass wool around the glass rod and the inside of the lid and seal the chamber
with the lid. Wrap some glass wool around the tube so that the seal is cover with it. XI. Refill the bottom of the mullite with about 2 in of charcoal and steel wool. XII. Using a hook through the fishing holes, lower the glass chamber into mullite holder
so that the chamber is sitting on the glass wool.
38
5.8.2 Test Set Up Procedures
• Set up the glass reaction chamber according to HIx Mixing and Corrosion Chamber Set Up Procedures
• Unscrew the top of the pressure vessel if not already opened. • Replace the wool on the bottom of the chamber if necessary (should be replace every
100 hrs). • Fill the three charcoal with new charcoals. • Lower the two larger baskets into the chamber on top of the steel wool as shown in
Figure 5.1. • Transfer the mullite tube from the hood to the enclosure. Hook the rod into the fishing
holes on the mullite tubes and lower the tube into the chamber so that it is sitting on the charcoal baskets.
• Insert the small charcoal into the mullite tube. • Fill the remaining space with steel wool. • Close the enclosure and torque to 35 ftlb.
5.8.3 Test Pressure System Set Up Procedures I. Move He cylinder into the room. II. Check to see if all components are secured and verify that the blower is working III. Hook up the Helium to the IN valve. IV. Open both IN and OUT valves and purge the setup with a small flow of Helium
(5 psig). V. Close the OUT/VENT valve and pressurize the system to 100 psig and close the inlet
valve. VI. Perform bubble test to see if there is any leak around the gasket joints. VII. If there is a leak, release the He using the vent valve. Un-mount the cover at the leak
joint, clean interface and re-seal. Repeat from step IV. VIII. If there is no leak, open the IN valve and continue to pressurize the system to
480 psig. IX. Close the inlet valve and remove the He connection. X. Wait 10 minutes to make sure pressure is stable and there is no leak. XI. Hand a warning sign showing that the experiment is on. XII. Turn on the temperature controller and set the temperature to 200°C on controller 4,
5, and 6. Wait 30 minutes and set the temperature to the correct test temperature i.e. 262°C for Condition/Medium I and 310 for Condition/Medium I.
XIII. Make sure pressure does not exceed 950 psig at temperature. In the event that the pressure is too high, cool set up back down to room temperature, reduce the pressure by 5 bar by using the outlet valve.
XIV. Monitor the thermal couple temperature on the controller to make sure the furnace is stable. In the event that there is a run away, cut off the power supply to the controller.

39
5.8.4 Cool Down and Specimen Retrieval Procedures 1. After the desired soaking time has passed, set the controller set point temperature to
200°C. After 30 minutes, turn off the power to the cable. The set up should take about 1.5 hours to cool down to room temperature. This can be gauge by the temperature on the external cutoff thermal couple. It should be at room temperature ~18–20°C.
2. After the setup has reached room temperature and open the outlet valve slowly to release the pressure of the content over 3 minutes.
3. Hook up the inlet with compressed air/He and flush the vessel for 30 seconds. 4. Loosen the bolts and unscrew the vessel cap. 5. Remove the remove all the steel wool. 6. Use the fishing tongs, remove the charcoal basket and the raise the mullite tube. 7. Transfer the mullite tube into the Fume hood. 8. With the tongs, retrieve the glass chamber. 9. If the test medium is a solid, use a heat gun and melts the solid so that the specimen can
be retrieved. Otherwise, open the lid and lift the glass rod and specimen out of the chamber (if the lid is stuck, use a heat gun to expand the glass container so that the lid can be pulled out).
10. If the medium has been used for more than 100 hours, discard it in the chemical waste disposal container.
11. Clean the specimen in alcohol/acetone following the Specimen Cleaning Procedures for Data Collection.
12. Weight the specimen and measure the thickness of the specimens and record them. 13. Return the specimen to the glass chamber for continuing testing or log the specimen in
for record. 5.8.5 Visual Inspection List At the end of each run, inspect the following:
• Crack in the glass capsule • Crack in the mullite • Condition of the vessel • Condition of the piping and valves
5.8.6 Specimen Cleaning Procedures for Data Collection (wrt ASTM G31) 1. Remove specimen from container with TFE coated tongs. 2. Rinse specimen with solvent. 3. Soak(30 seconds) and rinse the specimen in acetone. 4. Soak(30 seconds) and rinse the specimen in alcohol. 5. Dry in air. 6. Take Picture and collect weight. 7. Clean with alcohol Ultrasound bath for 3 minutes.

40
8. Rinse specimen in alcohol for 30 seconds. 9. Take Picture and collect weight. 10. Collect residue if any. 11. Return specimen to HIx test liquid.
41
6.0 General Atomics Task 1 High Temperature Heat Exchanger Project 6.1 Summary During the quarter ending June, 2004, General Atomics accomplished three primary work items on Task 1. These were: 1. Completion of the review to identify the range of High Temperature Heat Exchanger
(HTHX) applications required by the High Temperature Electrolysis (HTE) process for hydrogen production using nuclear energy.
2. The sizing requirements for the HTHXs required by the Sulfur-Iodine (S-I) process were revised and an alternative flow scheme was developed for the S-I process.
3. Initial sizing calculations and heat exchanger design layouts were prepared for three key HTHXs required by the candidate S-I and HTE hydrogen production processes.
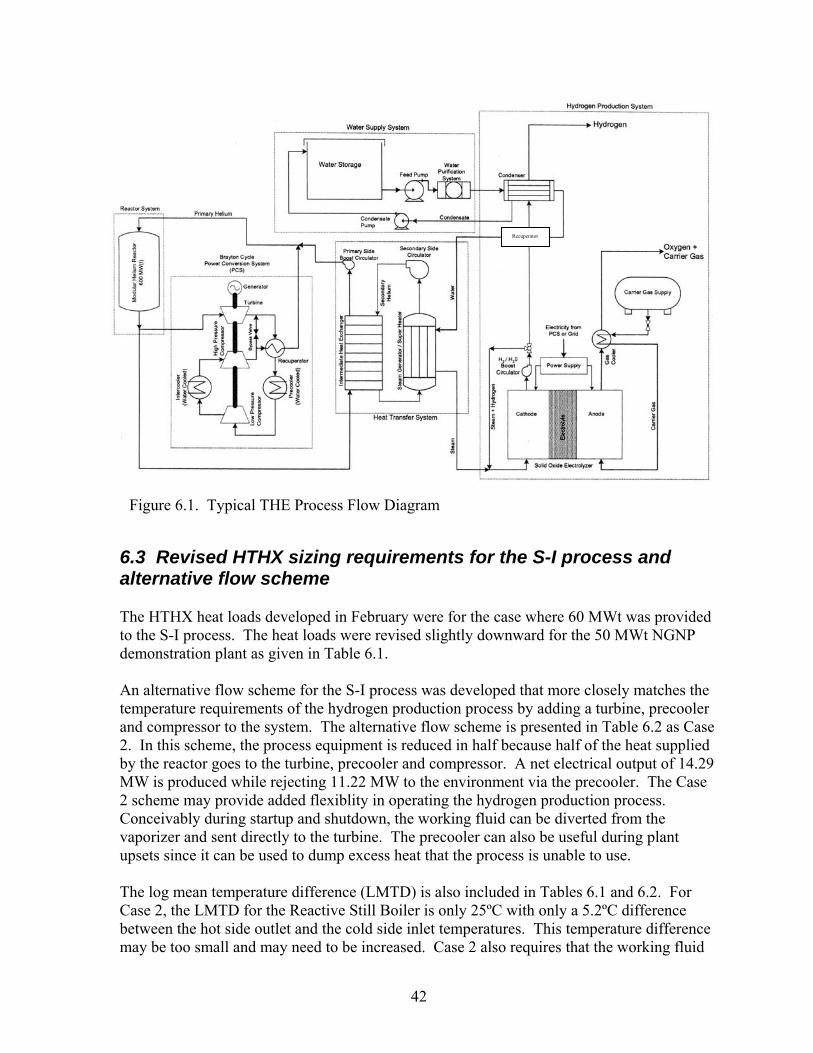
A summary of the work accomplished during the quarter on each of the above is provided in the following sections. 6.2 HTHX applications required by the HTE process The HTE hydrogen production process uses solid oxide fuel cells (SOFC) to split water into hydrogen and oxygen at high temperature. There are two high temperature heat exchangers within this process. The primary process heat exchanger receives heat from either an intermediary or tertiary fluid loop and transfers this heat to the working fluid of the HTE process. This heat exchanger receives its heat ultimately from the nuclear power plant through one or more intermediate heat exchangers. The other high temperature heat exchanger within this process is a recuperator that recovers some of the heat from the hydrogen-rich process stream leaving the SOFC. The HTE primary process heat exchanger is estimated to have a hot side fluid inlet temperature of ~900ºC and a hot side outlet temperature of ~320ºC. The cold side outlet temperature of the process heat exchanger will be ~850ºC. The process fluid will be composed of ~90% H2O and ~10% H2. The cold side inlet temperature will probably be ~264ºC. The hot side of the recuperator receives the process fluid from the SOFC rich in hydrogen. The inlet temperature to the hot side of the recuperator will be ~800ºC and composed of ~90% H2 and ~10% H2O. Likewise, the cold side fluid of the recuperator will be composed of 90% H2O and 10% H2. A process flow diagram for a typical HTE process is shown in Figure 6.1.
42
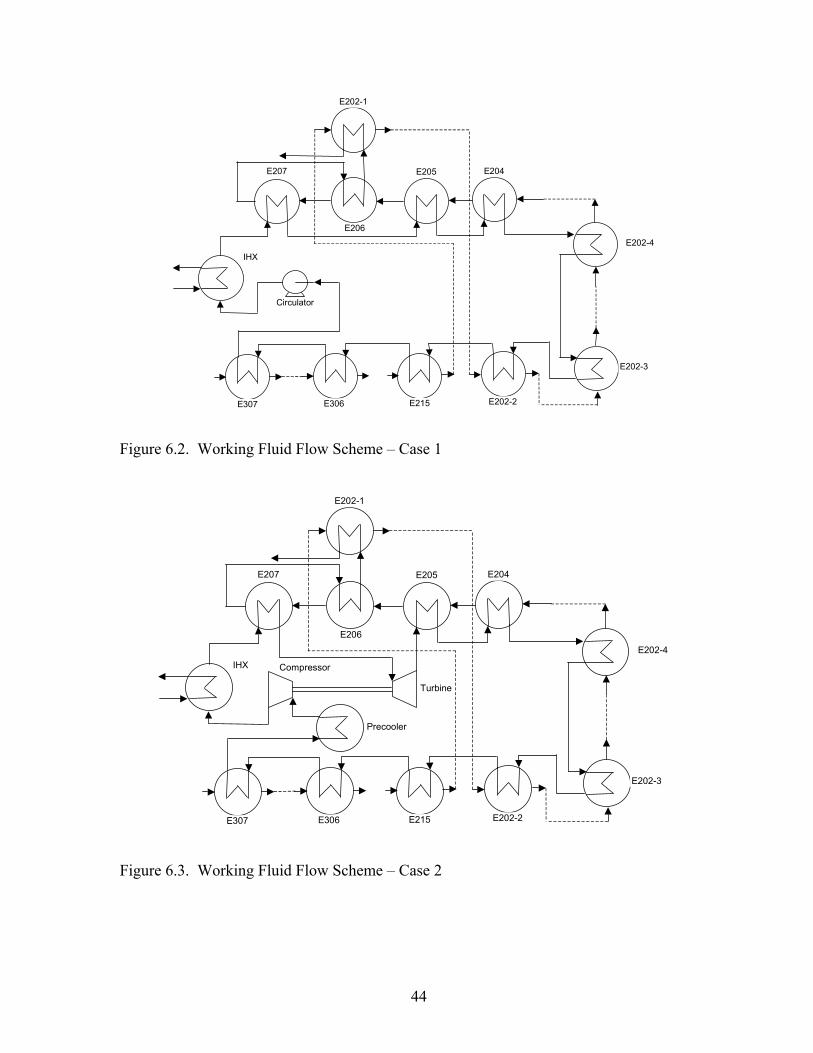
6.3 Revised HTHX sizing requirements for the S-I process and alternative flow scheme The HTHX heat loads developed in February were for the case where 60 MWt was provided to the S-I process. The heat loads were revised slightly downward for the 50 MWt NGNP demonstration plant as given in Table 6.1. An alternative flow scheme for the S-I process was developed that more closely matches the temperature requirements of the hydrogen production process by adding a turbine, precooler and compressor to the system. The alternative flow scheme is presented in Table 6.2 as Case 2. In this scheme, the process equipment is reduced in half because half of the heat supplied by the reactor goes to the turbine, precooler and compressor. A net electrical output of 14.29 MW is produced while rejecting 11.22 MW to the environment via the precooler. The Case 2 scheme may provide added flexiblity in operating the hydrogen production process. Conceivably during startup and shutdown, the working fluid can be diverted from the vaporizer and sent directly to the turbine. The precooler can also be useful during plant upsets since it can be used to dump excess heat that the process is unable to use. The log mean temperature difference (LMTD) is also included in Tables 6.1 and 6.2. For Case 2, the LMTD for the Reactive Still Boiler is only 25ºC with only a 5.2ºC difference between the hot side outlet and the cold side inlet temperatures. This temperature difference may be too small and may need to be increased. Case 2 also requires that the working fluid
Recuperator
Figure 6.1. Typical THE Process Flow Diagram

43
transferring heat to the hydrogen production process is a gas. The flow scheme does not account for pressure losses through the heat exchangers or any bypass losses in the turbine or compressor. Figures 6.2 and contain flow diagrams for the 2 cases.
Table 6.1. Working Fluid Flow Scheme – Case 1
Table 6.2. Working Fluid Flow Scheme – Case 2
original Q (MW)
revised Q (MW)
Cold Tin (C)
Cold Tout (C)
Hot Tin (C)
Hot Tout (C) LMTD (C)
E207 Decomposer 15.615 12.78 559.3 952 975 807.6 94.68E205 Vaporizer 11.809 9.67 411 411 807.6 680.9 329.18E204 Vaporizer Preheater 1.295 1.06 361 411 680.9 667.0 287.59E202-4 Stage 4 Flash Heater 2.431 1.99 358 371 667.0 641.0 289.44E202-3 Stage 3 Flash Heater 2.538 2.08 346 358 641.0 613.7 275.28E202-2 Stage 2 Flash Heater 4.059 3.32 330 346 613.7 570.2 253.73E215 Preheater 1.825 1.49 275.6 299 570.2 550.6 273.12E306 Reactive Still Reboiler 20.738 16.98 262 310 550.6 328.3 135.21E307 Condensate Reheater 0.77 0.63 25 221 328.3 320.0 185.56
Heat to Process 61.08 50.00
original Q (MW)
revised Q (MW)
Cold Tin (C)
Cold Tout (C)
Hot Tin (C)
Hot Tout (C)
LMTD (C)
E207 Decomposer 15.615 6.26 559.3 952 975 890.1 115.45TURBINE 28.02 890.1 510.2E205 Vaporizer 11.809 4.74 411 411 510.2 446.0 61.62E204 Vaporizer Preheater 1.295 0.52 361 411 446.0 439.0 53.64E202-4 Stage 4 Flash Heater 2.431 0.97 358 371 439.0 425.7 67.85E202-3 Stage 3 Flash Heater 2.538 1.02 346 358 425.7 411.9 66.84E202-2 Stage 2 Flash Heater 4.059 1.63 330 346 411.9 389.9 62.86E215 Preheater 1.825 0.73 275.6 299 389.9 380.0 97.46E306 Reactive Still Reboiler 20.738 8.32 262 310 380.0 267.2 24.92E307 Condensate Reheater 0.77 0.31 25 221 267.2 263.0 117.01PRECOOLER 11.22 263 110.9COMPRESSOR -13.73 110.9 297.1
Heat to Process 61.08 24.49Heat Rejected 11.22Net Work 14.29
Total 50.00
44
E202-4
E207
E206
E202-1
E205 E204
E202-3
E202-2E215E306E307
IHX
Circulator
Figure 6.2. Working Fluid Flow Scheme – Case 1
E202-4
E207
E206
E202-1
E205 E204
E202-3
E202-2E215E306E307
IHX Compressor
Precooler
Turbine
Figure 6.3. Working Fluid Flow Scheme – Case 2
45
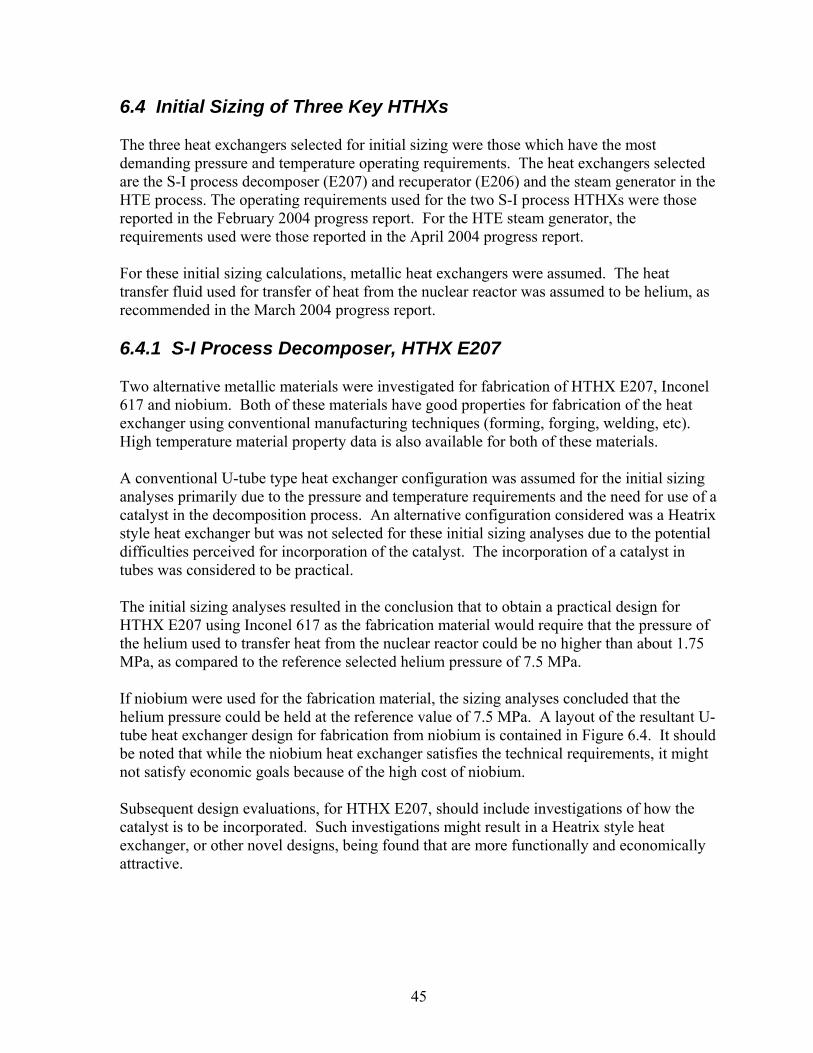
6.4 Initial Sizing of Three Key HTHXs The three heat exchangers selected for initial sizing were those which have the most demanding pressure and temperature operating requirements. The heat exchangers selected are the S-I process decomposer (E207) and recuperator (E206) and the steam generator in the HTE process. The operating requirements used for the two S-I process HTHXs were those reported in the February 2004 progress report. For the HTE steam generator, the requirements used were those reported in the April 2004 progress report. For these initial sizing calculations, metallic heat exchangers were assumed. The heat transfer fluid used for transfer of heat from the nuclear reactor was assumed to be helium, as recommended in the March 2004 progress report. 6.4.1 S-I Process Decomposer, HTHX E207 Two alternative metallic materials were investigated for fabrication of HTHX E207, Inconel 617 and niobium. Both of these materials have good properties for fabrication of the heat exchanger using conventional manufacturing techniques (forming, forging, welding, etc). High temperature material property data is also available for both of these materials. A conventional U-tube type heat exchanger configuration was assumed for the initial sizing analyses primarily due to the pressure and temperature requirements and the need for use of a catalyst in the decomposition process. An alternative configuration considered was a Heatrix style heat exchanger but was not selected for these initial sizing analyses due to the potential difficulties perceived for incorporation of the catalyst. The incorporation of a catalyst in tubes was considered to be practical. The initial sizing analyses resulted in the conclusion that to obtain a practical design for HTHX E207 using Inconel 617 as the fabrication material would require that the pressure of the helium used to transfer heat from the nuclear reactor could be no higher than about 1.75 MPa, as compared to the reference selected helium pressure of 7.5 MPa. If niobium were used for the fabrication material, the sizing analyses concluded that the helium pressure could be held at the reference value of 7.5 MPa. A layout of the resultant U-tube heat exchanger design for fabrication from niobium is contained in Figure 6.4. It should be noted that while the niobium heat exchanger satisfies the technical requirements, it might not satisfy economic goals because of the high cost of niobium. Subsequent design evaluations, for HTHX E207, should include investigations of how the catalyst is to be incorporated. Such investigations might result in a Heatrix style heat exchanger, or other novel designs, being found that are more functionally and economically attractive.

46
Figure 6.4. Initial design layout for decomposer HTHX E207 fabricated from niobium. 6.4.2 S-I Process Recuperator, HTHX E206 There is no need for incorporation of a catalyst in E206 and the pressure requirements for E206 are modest. As a result of these considerations, the initial sizing analyses were performed for a Heatrix style heat exchanger fabricated from Inconel 617. A reasonable heat exchanger design was concluded to be practical for these material and configuration design choices. An initial design layout for HTHX E206 is contained in Figure 6.5. 6.4.3 HTE Process Steam Generator For this HTHX, a helical coil heat exchanger configuration was chosen, similar to the designs of steam generators that have been previously developed for High Temperature Gas-cooled Reactor (HTGR) steam generators. The heat transfer fluids are basically the same (helium and water) but the HTE temperatures are higher. Because of the higher temperatures, Inconel 617 was been chosen for the helical coils. 2¼Cr-1Mo was chosen for the heat exchanger vessel, the same as the reference material for the Modular High Temperature Gas-cooled Reactor (MHTGR) because, by design, the vessel can be maintained at the helium outlet temperature. An initial layout of the HTE steam generator is contained in Figure 6.6.

47
Figure 6.5. Initial design layout for recuperator HTHX E206

48
Figure 6.6. Initial design layout for the HTE steam generator