march 1999 geo-heat center quarterly bulletin
TRANSCRIPT

8/8/2019 MARCH 1999 Geo-Heat Center Quarterly Bulletin
http://slidepdf.com/reader/full/march-1999-geo-heat-center-quarterly-bulletin 1/28
- Oregon and California -Direct-Use In Action
GEO-HEAT CENTER Quarterly Bulletin
Vol. 20, No. 1 MARCH 1999
ISSN 0276-
OREGON INSTITUTE OF TECHNOLOGY -KLAMATH FALLS, OREGON 97601-8801
PHONE NO. (541) 885-1750

8/8/2019 MARCH 1999 Geo-Heat Center Quarterly Bulletin
http://slidepdf.com/reader/full/march-1999-geo-heat-center-quarterly-bulletin 2/28
Vol. 20, No. 1 March 1999
GEO-HEAT CENTER QUARTERLY BULLETINISSN 0276-1084
A Quarterly Progress and Development Reporton the Direct Utilization of Geothermal Resources
CONTENTS
Aquaculture in the Imperial Valley –A Geothermal Success Story -
Kevin Rafferty
Klamath Falls Geothermal DistrictHeating Systems
Brian Brown
The Oregon Institute of TechnologyGeothermal Heating System – Thenand Now
Tonya L. Boyd
Reconstruction of a PavementGeothermal Deicing System
John W. Lund
Love Three Hot Springs out of theThousands – Hot Creek, Fields andAsh
Bill Kaysing
The Geo-Heat Center WebsiteTonya “Toni” Boyd
In Memory of Dr. Tibor Boldizar(1913-1998)
International Geothermal Days –Oregon 1999
Geothermal PipelineProgress and Development UpdateGeothermal Progress Monitor
Cover Photos (left to right, top tobottm): Tilapia being loaded froshipment at California Desert FishFarm, Imperial Valley, CA; NewKlamath County Government Centerbuilding with sidewalk snow meltingsystem; Oregon Institute of Technology stair snow melting system;and Klamath Falls highway snowmelting system installation (ODOT).
Page
1
5
10
14
18
20
22
23
24
PUBLISHED BY
GEO-HEAT CENTEROregon Institute of Technology
3201 Campus DriveKlamath Falls, OR 97601
Phone: 541-885-1750Email: [email protected]
All articles for the Bulletin are solicited. If youwish to contribute a paper, please contact theeditor at the above address.
EDITOR
John W. LundTypesetting/Layout – Donna GibsonGraphics – Tonya “Toni” Boyd
WEBSITE http://www.oit.edu/~geoheat
FUNDING
The Bulletin is provided compliments of the Geo-Heat Center. This material was prepared with the
support of the U.S. Department of Energy (DOEGrant No. DE-FG07-90ID13040). However, anyopinions, findings, conclusions, orrecommendations expressed herein are those of the authors(s) and do not necessarily reflect theview of USDOE.
SUBSCRIPTIONS
The Bulletin is mailed free of charge. Please sendyour name and address to the Geo-Heat Center foraddition to the mailing list.
If you wish to change your bulletin subscription,please complete the form below and return it tothe Center.
Name ___________________________________
Address _________________________________
___________________________ Zip __________
Country _________________________________

8/8/2019 MARCH 1999 Geo-Heat Center Quarterly Bulletin
http://slidepdf.com/reader/full/march-1999-geo-heat-center-quarterly-bulletin 3/28
GHC BULLETIN, MARCH 1999 1
Kevin RaffertyGeo-Heat Center
INTRODUCTION
The Salton Sea and Imperial Valley area of southernCalifornia has long been recognized as a hot spot of geo-thermal development. In the geothermal industry, this areahas for some time been synonymous with electric power gen-eration projects. Starting with the first plant in East Mesa in1979, geothermal power has increased over the years to thepresent 400+ MW of installed capacity in the three primaryareas of Salton Sea, Heber and East Mesa. Although most inthe industry are aware of the millions of kilowatt-hours annu-ally produced in this desert oasis of development, they re-main surprisingly uninformed about the Valley s other geo-thermal industry aquaculture.
At present, there are approximately 15 fish farming (or
aquaculture) operations clustered, for the most part, aroundthe Salton Sea. All of these farms use geothermal fluids tocontrol the temperature of the fish culture facilities so as toproduce larger fish in a shorter period of time and to permitwinter production which would otherwise not be possible. Inaggregate, these farms produce on the order of 10,000,000lbs of fish per year most of which is sold into the Californiamarket. Principle species are catfish, striped bass and tilapia.
For the past several years, tilapia has been the fastestgrowing part of the aquaculture industry. In 1996, the totalU.S. consumption of tilapia was 62,000,000 lbs. Of this, only16,000,000 lbs (26%) was domestically produced and the bal-ance imported. The primary market for the fish on the WestCoast is among the Asian-American populations in the majorcities. Fish are shipped and sold live at the retail level.
RESOURCESThe geothermal fluids used by the aquaculture opera-
tions are quite different from the those produced for electricpower production. Table 1 presents a summary of water chem-istry for typical Imperial Valley electric power and aquacul-ture wells.
Table 1. Typical Water Chemistry - Imperial ValleyWells 1 (Youngs, 1994)
Electric AquaculturePower Well Well
Depth (ft) 2260 246Temperature ( oF) 509 145
pH 6.1 7.8Na 47,300 980K 7,960 46Ca 23,600 132Mg 110 33SiO 2 435 65
1. All chemical species in ppm.
AQUACULTURE IN THE IMPERIAL VALLEY- A GEOTHERMAL SUCCESS STORY -
Temperatures of the wells used by the aquaculture op-
erations vary from site to site with the highest in the area tothe east of the Salton Sea. Pacific Aqua Farms and the Cali-fornia Desert Fish Farm, located on Hot Mineral Spring Rd(adjacent to the area s major hot spring resorts, see fig 2) atthe foot of the Chocolate Mountains have the warmest waterat approximately 165 oF. All of the wells in this area sustainsome artesian flow though often it is not sufficient to meet theneeds of the operators. In some cases, production is increasedusing air lifting. This method is not common in most conven-tional geothermal systems due to the corrosion resulting fromthe oxygen entrained in the water. In the aquaculture opera-tions, however, all of the piping is of non- metallic (mostlyPVC) construction so corrosion is not as great a consideration.Beyond this, since the fish are grown in the geothermal water,oxygen must be added later at the growout tanks.
On the west side of the Salton Sea, the wells typicallyproduce water between 90 and 120 oF depending upon depth.Shallow wells in the 200 ft range, produce water toward thelower end of these values and deeper wells of greater than600 ft produce water toward the higher end. All of the wellsin this area of the valley require pumps to produce the water.Most of the larger growers have 2 to 3 wells, with a few of thesmaller operations dependant upon a single well.
Due to the desert climate, high water temperatures are amajor concern for the growers in the warmer portion of theyear; particularly, those whose only water source is the geo-thermal fluid. Many use ponds to cool the water. A novelsolution to this problem is illustrated in Figure 1. PacificAqua Farms uses a cooling tower of their own design tocool the geothermal water in the summer. Reportedly, thesetowers are capable of reducing the 140 oF water to 90 oF underfavorable conditions. Their steel construction, however, issubject to high rates of corrosion and rebuilding is an ongoingtask.
Figure 1. Cooling tower at Pacific Aquafarms.

8/8/2019 MARCH 1999 Geo-Heat Center Quarterly Bulletin
http://slidepdf.com/reader/full/march-1999-geo-heat-center-quarterly-bulletin 4/28
2 GHC BULLETIN, MARCH 1999
LOCATIONSFigure 2 provides a map of the area indicating the loca-
tions of the individual operations. The largest concentrationof operations is in the southern Riverside County region onthe northwest fringe of the Salton Sea. The largest single fishfarm in the valley, Kent Seafarms with a production of ap-proximately 3,000,000 lbs per year, is located in this area.Kent grows primarily stripped bass and because these fish can-not be shipped live most of the production is shipped on ice.
Figure 2. Locations of aquaculture and geothermal powergeneration operations - Imperial Valley (num-bers are keyed toTable 2).
The largest single tilapia producer, Pacific Aqua Farms,as mentioned above, is located on the east side of the Sea.Pacific produces approximately 1,000,000 lbs per year andships most to the Los Angeles market.
Fish Producers the Valley s largest catfish facility andone of the oldest aquaculture operations having started busi-ness in the late-1960s. It is located just east of the town of Niland. Catfish is the primary product here and annual pro-duction is in the range of 1,300,000 lbs per year. Fish Produc-ers has used a conventional pond culture (Figure 3) approachin the past. Much of the water source for this portion of the
operation is irrigation canal water. A recently constructedraceway facility (Figure 4), along with two new geothermal
wells, will allow them to increase production by an additional300,000 lbs per year and also permit some development work with other species than catfish.
Figure 3. A small portion of the 70 acres of catfish pondsat Fish Producers.
Figure 4. Newly constructed raceway designed for aproduction of 300,000 lbs per year.
Table 2 provides additional information on some of thefish farms appearing in Figure 2.
Table 2. Species and Annual Production DataNo. Farm Name Species 1 Annual Prod. 2 Years
1 California Desert Fish Farm T 390,000 72 Pacific Aqua Farms T 1,000,000 12
3 Fish Producers C 1,300,000 304 Valley Fish Farm C 600,000 125 Kent Sea Farms HSB 3,000,000 126 Blue Aquarius C 125,000 107 Dashun Fisheries T 320,000 138 Coachella Valley Fish Farm C 450,000 unk 9 Arbia Farm ? in start up new
10 Unknown ? in start up new11 Oceanridge T 300,000 412 H&T T 150,000 513 Hsiang Niching C,T 200,000 214 S S Vong T 225,000 1515 Unknown C unknown unk
1. T = Tilapia, C = Catfish, HS = Hybrid Striped Bass2. Estimated production in lbs per year.
H @ 8 8 6
I D G 6 I 9
8 6 G D Q 6 U S D 6
7 S 6 X G @ `
X @ T U H P S G 6 I 9
D H Q @ S D 6 G
@ G Ã 8 @ I U S P
8 6 G @ Y D 8 P
C P G U W D G G @
T 6 G U P I Ã T @ 6
H Ã @ Ã Y Ã D Ã 8 Ã P Ã
S D W @ S T D 9 @ Ã 8 P V I U `
D H Q @ S D 6 G Ã 8 P V I U `
C @ 7 @ S
T 6 G U P I Ã T @ 6
B @ P U C @ S H 6 GQ P X @ S Ã Q G 6 I U T
C @ 7 @ S
B @ P U C @ S H 6 G
Q P X @ S Ã Q G 6 I U T
@ 6 T U Ã H @ T 6
B @ P U C @ S H 6 GQ P X @ S Ã Q G 6 I U T

8/8/2019 MARCH 1999 Geo-Heat Center Quarterly Bulletin
http://slidepdf.com/reader/full/march-1999-geo-heat-center-quarterly-bulletin 5/28
GHC BULLETIN, MARCH 1999 3
ANATOMY OF A TILAPIA FISH FARMThe following description is based on a tilapia farm pro-
ducing approximately 400,000 lbs of fish per year. It is im-portant to understand that all farms are a reflection of theirmanagement and as a result, two farms growing the same spe-cies with the same annual production can be quite different inconfiguration. The overall layout of the farm appears in Fig-ure 5. Figures 6 through 10 provide a close up of each majoraspect of the operation
X h r à T h t r
S r r v Ã Æ !
! ' Ã s
I r à r y y
C h p u r
r
s v t r y v t
h r h
A r r q à v y
Q r à u r
C y q v t
h x
B r u r h y à r y y
C r T u2
I
F
%%
B
qB
q
Figure 5. Typical fish farm layout for tilapia production.
Most fish farms operate their own hatchery to maintainproduct quality and assure an adequate supply of fingerlingsfor production. The hatchery typically includes tanks for broodstock, egg collection, fry and fingerling handling. Figure 6shows the hatchery/fingerling portion of the California DesertFish Farm facili ty. Brood fish are kept in the long rectangulartanks at the upper right, eggs and fry in the small buildingbeyond the brood tanks and various size fingerlings in the 20-and 30-ft diameter circular tanks in the foreground.
Figure 6. Hatchery area.
At a size of approximately 3 to 6 inches, the fingerlings,now referred to as juveniles, are moved to the larger tanks (Fig-ure 7) for growout. Due to the very high density of fish in thetanks, artificial aeration is necessary to maintain adequate lev-els of oxygen. Electric motor driven paddle wheel type de-vices are most common. Two paddle wheel aerators (approx 3to 7 hp each depending on pond size) are oriented on oppositesides of the pond and operated in reverse rotation relative to
each other. In addition to aeration, this also promotes a circu-lar flow in the tank. This flow helps to drive waste productstoward the center for collection. Feed for the fish is in pelletform and size varies according to the fish size. The feed isoften distributed to the pond surface using a trailer mountedhopper equipped with a blower. The circular growout tanksare of concrete and block construction.
Figure 7. 100- and 120-ft diameter growout tanks.
In a desert climate, many growers are constrained by theavailable supply of water. Raising fish at high density resultsin the need to remove waste products (solids, ammonia etc)from the recirculated water. With irrigation canal water gen-erally unavailable to most aquaculture operators, a variety of methods are used to stretch the geothermal water supply asfar as possible. Often this involves passing the water out of the fish tanks to several large earthen ponds arranged in such away as to cause the water to flow through them in series. Theseponds remove a portion of the impurities in the water allowingsome of the flow it to be recirculated.
At approximately nine months, the tilapia are largeenough for sale into the market place. Market size varies ac-cording to the needs of the particular retailer at which the fishwill be sold. Generally, fish in the 3/4-lb to1-lb range are con-sidered small and those larger than 1 1/4 lb large. Pricesare often better for the larger fish. At this point, the fish in thelarge circular tanks are gathered into one corner using a largesiene net. They are sorted as to size and placed in a transfernet equipped with a scale (Figure 8), for delivery to the ship-ment holding tank (Figure 9) and eventually to the transporttruck.
Figure 8. Sorting and moving fish from growout to trans-fer tank.

8/8/2019 MARCH 1999 Geo-Heat Center Quarterly Bulletin
http://slidepdf.com/reader/full/march-1999-geo-heat-center-quarterly-bulletin 6/28
4 GHC BULLETIN, MARCH 1999
Figure 9. Transferring fish to delivery truck.
The fish are shipped live to the retail level in a truck equipped with a series of tanks and a liquid oxygen distribu-tion system for aeration (Figure 10). A few of the largestoperations employ their own trucks and deliver directly to themarkets and restaurants. In most cases, however, the growersells to a middle man who owns and operates the truck andsells to the retail store or restaurant operator. Figure 11 shows
a view of the transport truck in San Francisco s Chinatown.
Figure 10. Live fish delivery truck--liquid oxygen storagetank at back.
Figure 11. Delivery truck in San Francisco s Chinatown.
CONCLUSIONAgricultural statistics, gathered for the Coachella Val-
ley for the year 1995, provide some interesting data. At thattime, there were 34 individual types of crops grown on landsirrigated by the Coachel la Canal. Of the approximately$432,500,000 in gross value for these crops, approximately3.1% was attributed to fish farm production. Interestingly, thegross revenue produced by the fish crops, per acre of land,ranks 4 th out of the 34 crops raised in the area. Only dates, bell
peppers and nursery crops produced higher gross earnings peracre of land.
The substantial growth in the number of operators andannual production for aquaculture in this region is impressive.Much of the growth has been in the production of tilapia. Thisreflects the national trend in the growth of aquaculture. Since1991 the national production of tilapia has approximately qua-drupled (Aquaculture, 1998). At some point, this level of growth will begin to approach equilibrium with the marketdemand in certain areas. In California, where 40% of the U.S.production is located, this may already be occurring. Priceshave dropped recently, from a high of $2.30 per pound in 1995to approximately $2.00 per pound currently. The price situa-tion was a commonly discussed topic at all of the farms visitedin the course of gathering information for this article.
Based on the limited shipping distance for live fish andthe finite size of the Asia-American market, it may be in thebest interests of the growers to explore the establishment of some new markets for the tilapia. Tilapia burgers maybe?
Finally, the estimate of the geothermal installed capac-ity and annual energy use for the 15 famrs is 85 MWt and 1.5trillion Btu/year, or about 500 Btu/yr/lb of fish.
ACKNOWLEDGEMENTSI would like to thank Maria L Schwander, owner and
Maria Soledad Sol Delgadillo, manager of the CaliforniaDesert Fish Farm for their generous hospitality, guidance, greatfood and patience in explaining aquaculture to an engineer. Iam also indebted to the owners of Pacific Aquafarms, FishProducers, Ocean Rich Fisheries Inc, H & T Aquatics Inc andAquafarming Tech, Inc for the time they took to show us theirfacilities.
REFERENCESAquaculture, 1998. 1997 Tilapia Situation & Outlook
Report, Vol. 24, No. 4, Asheville, NC, pp. 8-15.
Youngs, Leslie G., 1994. Database of Low-TemperatureGeothermal Springs and Wells in California,Division of Mines and Geology, Sacramento, CA.

8/8/2019 MARCH 1999 Geo-Heat Center Quarterly Bulletin
http://slidepdf.com/reader/full/march-1999-geo-heat-center-quarterly-bulletin 7/28
GHC BULLETIN, MARCH 1999 5
KLAMATH FALLS GEOTHERMALDISTRICT HEATING SYSTEMS
Brian Brown, P.E.Brian Brown Engineering
Ft. Klamath, OR
INTRODUCTIONThe city of Klamath Falls, Oregon, geothermal districtheating system was constructed in 1981 to initially serve 14government buildings with planned expansion to serve addi-tional buildings along the route. After a difficult start-up pe-riod, the system has provided reliable service since 1991. Formore information on the system development, see Lienau, etal., (1989 and 1991).
The district heating system was designed for a thermalcapacity of 20 million Btu/hr (5.9 MWt). At peak heating, theoriginal buildings on the system utilized only about 20 per-cent of the system thermal capacity, and revenue from heat-ing those buildings was inadequate to sustain system opera-
tion. This led the city to begin a marketing effort in 1992 toadd more customers to the system (Rafferty, 1993).
Since 1992, the customer base has increased substan-tially, with the district heating system serving several addi-tional buildings and extensive areas of sidewalk snowmelt.Figure 1 shows the service area of the district heating system.
In the winter of 1998 to 1999 the district heating systemserved the highest load ever, with peak loads estimated at 50to 60 percent of the original design capacity. The systemshowed some strain under the load, with operational difficul-ties related to capacity, controls, and equipment failures. Sys-tem upgrade and maintenance work is scheduled for the sum-mer of 1999 to improve system capacity, control, and reliabil-ity.
BUILDING HEATINGThe original and continuing primary purpose of the dis-trict heating system is to serve building space heating require-ments. The original buildings connected to the system in-cluded:
County MuseumFire StationPost officeCity HallCity Hall AnnexCounty LibraryCounty Courthouse
Old County JailVeteran s Memorial Building (County offices)County Annex
The courthouse, jail, and Veteran s buildings were allextensively damaged by an earthquake in 1993 (Lienau &Lund, 1993). The earthquake damage caused the loss of thatbuilding space for County government use, and the loss of the heating revenue for the district heating system. Thesebuildings were subsequently demolished and replaced.
The HVAC system controls in the County Library wereupgraded in 1996, resulting in a 50% reduction in the heatingcosts; from about $12,000 to $6,000 per year. That was goodfor the County, but reduced revenue for the district heatingsystem.
Figure 1. Map of Klamath Falls geothermal district heating system.
U h v v à G v r
T y Ã É Ã S r à G v r
Q q p v à X r y y
D w r p v à X r y y
C r h r q à 7 v y q v t Ã
C r h à @ p u h t r Ã É Ã Q v t à T h v
T à H r y à T r
9 i y r à Q v r à T r
T y S r às à A r u
C r h r q à X h r
Q v t à T h v Ã É Ã C r h
@ p u h t r à 7 v y q v t
8 Ã H r
D w r p v à X r y y
T v t y r à Q v r à T r Ã
B r u r h y à X h r
Q q p v à X r y y
8
8 u r
S Ã S h t y h q
U u r h r
H v p u v t h à 6 r
G
H h v à T
2 y q
à ) R
U WÃ S G
8 v à C h y y

8/8/2019 MARCH 1999 Geo-Heat Center Quarterly Bulletin
http://slidepdf.com/reader/full/march-1999-geo-heat-center-quarterly-bulletin 8/28
6 GHC BULLETIN, MARCH 1999
New facilities added to the district heating system in1993through 1997 included:
Christ Lutheran Church (served off the geothermalproduction main)Balsiger Building (replacing heating from a privategeothermal well)Eagles ClubGospel Mission
Ross Ragland TheaterFirst Presbyterian ChurchFirst Baptist ChurchSacred Heart Catholic Church (complex of 4buildings)South Valley State Bank US Bank Pacific Linen (commercial laundry)
New in 1998:Klamath County Government Center building. Thisbuilding is a renovation of the old County Annexbuilding with a significant new addition. The
construction included a complete new HVACsystem.
New and under construction for 1999:
Howard s Body ShopKlamath County Courthouse. This is a newreplacement for the earthquake damaged anddemolished original courthouse.Addition to the Ross Ragland Theater. Thisaddition will increase the heated floor space fromabout 12,000 ft 2 to about 22,000 ft 2 The totalheating load is expected to remain about the samedue to added insulation and improved heatingsystem controls in the original building.
As of the winter of 1998 - 1999, the estimated designpeak load for the buildings on the district heating system isabout 8 x10 6 Btu/hr (2.3 MWt).
DESIGN OF THE COUNTY GOVERMENT CENTERBUILDING HEATING SYSTEM
The new county buildings are the first on the geothermaldistrict heating system with efficient use of the system incor-porated in the original design. Important features of the heat-
ing system design include:
Heating coils are selected for low flow and high water-side temperature drop (delta-T).
Heating water control valves are mostly 2-wayvalves, resulting in a variable heating water flowand a high heating water system delta-T.Heating water pumps are controlled by adjustablefrequency drives, minimizing pumping energy useand accommodating the variable heating waterflow.
The building heating water supply temperature isaggressively reset to a lower temperature at higheroutside air temperatures and lighter building heatingdemand.Lower temperature loads, such as the sidewalk snowmelt system, are served from the heating waterreturn, increasing overall delta-T.The control valve on the district heating watersupply is closely controlled to meet building
heating loads while minimizing the flow andmaximizing the delta-T.
Figure 2. Klamath County Government Center Building.
The beneficial result of these design features is the main-tenance of high system delta-T, meeting the heating demand
with the minimum flow from the district heating system. Thehigh delta-T benefits the geothermal district heating system allthe way back to the production wells. Operation of the systemat high delta-T reduces pumping costs, improves performanceof heat exchangers, and increases the energy delivery capacityof the system.
Figure 3. Government Center district heating heat ex-changer.
The city does not guarantee uninterrupted service, as isthe case with other utilities, from the district heating system;consequently the county building heating system includes aback-up boiler. The controls in the County Government Cen-ter building monitor the status of the district heating systemand automatically operate the back-up boiler to supplement

8/8/2019 MARCH 1999 Geo-Heat Center Quarterly Bulletin
http://slidepdf.com/reader/full/march-1999-geo-heat-center-quarterly-bulletin 9/28
GHC BULLETIN, MARCH 1999 7
the heat available from the district heating system or to pro-vide complete back-up heating. The controls compare the sup-ply temperature available from the district heating system withthe set-point temperature for the building heating water sys-tem. If the district heating system is colder than the requiredbuilding heating water temperature, the district heating con-trol valve is closed to prevent heat loss from the building sys-tem. Once the district heating system is returned to service,the controls initiate an automatic warm-up sequence to purge
the cold water from the system piping. After the district heat-ing supply temperature returns to normal and is adequate tomeet the building heating demand, the boiler shuts off auto-matically.
Figure 4. Klamath County Government Center districtheating flow control valve. Good flow control
is vital for efficient operation.
Over the 1998 to 1999 heating season, the district heat-ing system experienced more than the ususal number of ser-vice interruptions from power outages, control problems, andproduction well problems. In all cases, the boiler controls pro-vided automatic, uninterrupted heat to the building, while mini-mizing boiler run time.
Figure 5. Government Center heating water, boiler, andsnowmelt controls.
The County Government Center building includes about37,000 ft 2 of conditioned floor space and about 10,000 ft 2 of heated sidewalks. The peak heating design load for the build-ing and sidewalks was estimated to be 2.4 x 10 6 Btu/hr (0.7
MWt), requiring a peak flow rate from the district heating sys-tem of 120 gpm at 40°F delta-T, based on a 180°F supply tem-perature from the district heating system and 140°F return tem-perature. The peak measured load in February, 1999 (afterinstallation and setup of the meter) was 1.3 x 10 6 Btu/hr (0.38MWt) with a peak flow of 50 gpm. Annual energy consump-tion is estimated to be about 1.8 x 10 9 Btu (520 MWht).
Figure 6. Government Center snowmelt heat exchanger.
Performance of the building heating system has beenexcellent, exceeding design expectations. Typical district heat-ing return water temperature is 110°F when the snowmelt sys-tem is operating in the IDLING mode; and 120°F when thesnowmelt system is off or operating in the higher temperatureMELT mode. This return temperature is well below the de-sign 140°F, and reflects the capability of the heating system tooperate in a higher than design delta-T. The performance of the system can be attributed to a combination of system de-sign, conservative heat exchanger sizing, and careful designand programming of the Alerton DDC control system.
trict heating system through a building heating system or di-rectly from the district heating mains. These installations in-clude the County Government Center building, the Basin Tran-sit bus transfer station, Sacred Heart Catholic Church, City Hall,City Hall Annex, South Valley Bank, and KOTI. The installedarea of these systems is about 19,000 ft 2. About 15,000 ft 2 of additional private snowmelt system area is anticipated for 1999.
SIDEWALK SNOWMELTGeothermally heated sidewalks and crosswalks have been
incorporated into a downtown redevelopment project alongMain Street, starting with the 800 block in 1995. (Brown,1995). That snowmelt system has been extended to covernine blocks of sidewalks and crosswalks, from 2 nd Street to11 th Street. The heated sidewalk and crosswalk area currentlyserved by the city snowmelt system is about 51,000 ft 2. An-ticipated additions to the city system in 1999 will bring thetotal area to about 60,000 ft 2.
Several snowmelt systems have also been installed sepa-rate from the main City snowmelt system, served from the dis-

8/8/2019 MARCH 1999 Geo-Heat Center Quarterly Bulletin
http://slidepdf.com/reader/full/march-1999-geo-heat-center-quarterly-bulletin 10/28
8 GHC BULLETIN, MARCH 1999
Figure 7. Klamath Falls snowmelt system control panelwith author Brian Brown, P.E., consultingengineer.
The sidewalks are heated by circulation of a heated anti-freeze solution through a network of polyethylene tubes im-bedded in the sidewalks or in a sand or slurry base under thesidewalks. The solution is heated through a heat exchangerfrom the building heating water system or the district heating
water. Where feasible, the heat is extracted from the return water side of the heating system to increase the overall districtheating system delta-T.
Figure 8. Snowmelt tubing in slurry backfill under side-walks.
Most of the snowmelt systems are designed for a heatoutput of 60 to 80 Btu/h·ft 2 of heated sidewalk. That designheat output is adequate for convenience snow melting undermost conditions in Klamath Falls. It will not keep the side-
walk above freezing in extremely cold conditions, or keep up with high snowfall rates. Figure 9 shows the slush accumula-tion after a heavy snowfall this past winter. Figures 10 and 11shows a section of sidewalk after the system had a chance tocatch up. The sidewalk beyond does not yet have the snow-melt system installed. The trees are protected with styrofoaminsulation to keep them from budding in the winter during sys-tem operation.
Figure 9. Slush accumulation after a heavy snowfall.
Figure 10. Clear sidewalk after snowfall. Tree well isprotected from heat by insulation. Sidewalk beyond is not heated.
Figure 11. Basin Transit transfer station snowmelt.
The snowmelt systems have become a significant por-tion of the total district heating system load, with an estimateddesign peak load of about 4 x10 6 Btu/hr (1.2 MWt).
SYSTEM GROWTH AND CAPACITYThe peak load under normal design winter conditions
for currently connected users is estimated to be about 60% of design system capacity, or 12 x10 6 Btu/h (3.5 MWt). The peak

8/8/2019 MARCH 1999 Geo-Heat Center Quarterly Bulletin
http://slidepdf.com/reader/full/march-1999-geo-heat-center-quarterly-bulletin 11/28
GHC BULLETIN, MARCH 1999 9
load is not precisely known, since the system has not had flowand energy monitoring. With improved controls and monitor-ing on-line for the 99- 00 heating season we will be betterable to track system operation and project system reserve ca-pacity.
Without system flow and energy instrumentation, evalu-ation of system load and reserve capacity has been based ongeneral observations of system performance. Operation in the
95- 96 heating season indicated pump flow capacity concerns
in the district heating closed loop, primarily due to poorly con-trolled flow at many of the users and the resulting low systemdelta-T. Improved flow control at three of the larger usersimproved that situation, and there were no capacity problemsin the 96- 97 and 97- 98 heating seasons.
In the 98- 99 heating season the circulation pump stillshowed adequate capacity, maintaining more than 15 psi pres-sure differential between the district heating supply and returnat the far end of the system. The system delta-T remainedlower than design, with a typical delta-T of about 13°F andmaximum delta-T of about 24°F; compared to the design delta-T of 40°F. This indicates that more work on flow control isnecessary.
The system was designed to operate both production wells at design capacity, but that has never been necessary.Typically the lower, cooler (206°F) well is operated in the mildseasons and the hotter (226°F) upper well is used in the colderpart of the winter. In December, 1998 the temperature droppedto -10°F, the coldest it has been for several years. Under thoseconditions, the upper well was unable to maintain the desireddistrict heating supply temperature of 180°F. That may bepartially due to fouling on the heat exchangers, but it also indi-cates a need to either increase the pumping capacity of theupper well, or begin operating both wells to meet the peak heating loads.
OPERATION AND IMPROVEMENTSThe district heating system has run close to nonstop since
1993, with short or partial shutdowns for system connectionsor maintenance. Extensive system maintenance is plannedduring a system shutdown in the summer of 1999. Planned
work includes:
Replacement of all critical isolation valves tofacilitate future maintenanceInstallation of a second large circulation pump onthe closed-loop system with an adjustable frequencyspeed control
Improved control of flow to connected buildingsRehabilitation of the upper geothermal well pumpsand replacement of the Nelson fluid drives with alarger motor and adjustable frequency speedcontrol. Pump capacity will be increased 60%,from 500 gpm to 800 gpm.Cleaning of the main heat exchangers and additionof about 50% more platesReplacement of the system controls with digitalprogrammable logic controller (PLC) based
controls, with radio telemetry between the heatexchanger building, the remote pump stations, andthe system manager s officeInstallation of new magnetic flow meters forgeothermal and closed loop flow and energymeasurementCleaning and painting exposed pipe and fittings intunnels and vaultsImproved ventilation of expansion joint vaults and
the production pipeline tunnel to reduce moistureaccumulation and corrosionMaintenance of the pipeline cathodic protectionsystems
The planned system maintenance and improvements willimprove the reliability and capacity of the district heating sys-tem to meet the existing and planned heating load. The im-proved flow control and adjustable speed pumping are alsoanticipated to reduce the electrical cost of operating the sys-tem by about 75 percent.
CONCLUSIONS
The city of Klamath Falls geothermal district heatingsystem has experienced considerable growth in the past fewyears. Additional expansion is scheduled for 1999, and thereis considerable additional interest in hooking onto the system.System maintenance and control system improvements sched-uled for 1999 will make the system more reliable and less ex-pensive to operate. This combination should help the districtheating system make the transition from a subsidized experi-ment in renewable energy to a fully self-sustaining utility.
REFERENCESBrown, B., 1995. Klamath Falls Downtown Redevelop-
ment Geothermal Sidewalk Snowmelt, Geo-HeatCenter Quarterly Bulletin, Vol. 16, No. 4., p. 23-26.
Lineau, P.; Culver, G. and J. Lund, 1989. Klamath FallsGeothermal Field, Oregon, Case History of Assess-ment, Development and Utilization. Presented atGeothermal Resources Council 1989 AnnualMeeting, Santa Rosa, CA.
Lineau, P. and K. Rafferty, 1991. Geothermal DistrictHeating System: City of Klamath Falls, Geo-HeatCenter Quarterly Bulletin, Vol. 13, No. 4., p. 8-20.
Lienau, P. and J. Lund, 1993. Groundwater AnomaliesAssociated with the Klamath Basin Earthquakes of September 20-24, 1993, Geo-Heat Center Quar-terly Bulletin, Vol. 15, No. 2, pp. 17-19.
Rafferty, K., 1993. Marketing the Klamath Falls Geother-mal District Heating System, Geo-Heat CenterQuarterly Bulletin, Vol. 15, No. 1., p. 4-6.

8/8/2019 MARCH 1999 Geo-Heat Center Quarterly Bulletin
http://slidepdf.com/reader/full/march-1999-geo-heat-center-quarterly-bulletin 12/28
10 GHC BULLETIN, MARCH 1999
THE OREGON INSTITUTE OF TECHNOLOGYGEOTHERMAL HEATING SYSTEM - THEN AND NOW
Tonya L. BoydGeo-Heat Center
INTRODUCTIONOregon Institute of Technology (OIT) is located on a
hill, which gently slopes from the east to the west, in the north-east part of Klamath Falls. The campus has been using geo-thermal water, for its heating and domestic hot water needs,since it was relocated to this location in 1964. It has been incontinuous operation for 35 years and now heats 11 buildings(~600,000 ft 2 / 55,700 m 2). It is the oldest of the modern geo-thermal district-heating systems, and due to the lack of expe-rience with the design of large systems in the early-1960s, ithas experienced some difficulties through the years. Thesedifficulties have been resolved and the experience has pro-vided a substantial body of information concerning the appli-
cability of various materials and designs for low-temperatureuse.The original system, which provided heating and do-
mestic hot water for the five original buildings, consisted of constant-speed, water-lubricated lineshaft pumps located in
well pits. The pumps were run manually according to thelevel in the storage tank. The distribution system consisted of direct-buried Schedule 40 carbon steel piping which was fieldinsulated with Foamglas type insulation and covered with a
mastic vapor barrier. The geothermal water was used di-
rectly in the buildings mechanical heating systems; then, theeffluent was disposed of to the surface through the storm drain-age system than eventually emptied into Upper Klamath Lake.Cooling for the campus was accomplished by an electric-pow-ered chiller.
Figure 1 shows a general layout of the OIT system as itis today. Geothermal water for the system is produced fromthree wells at a temperature of 192 oF (89 oC), which are lo-cated in the southeast corner of the campus. The wells arefrom 1300-1800 ft (400-550 m) in depth. The water is pumpedindividually from each well (total flow of all the wells is 980gpm/62 L/s). The water is then collected in a 4000-gal (15-m3) settling tank in the Heat Exchanger building before it isdelivered to each building via gravity through the distributionsystem according to demand on the system. The settling tank (Figure 2) provides the necessary head for the gravity flowsystem and allows the fines from pumping to settle out of the
water. The heat exchanger building also housed a fuel-oilboiler from the old campus as a backup; but due to lack of use, it was dismantled several years ago. The geothermal sys-tem saves approximately 11,000 bbl (1650 tonnes) of oil or$225,000 each year.
P D U !
P D U %
P D U $
P D U D I E
P D U D I E !
P S @ B P I Ã D I T U D U V U @
P A Ã U @ 8 C I P G P B `
Q u v p h y
Q y h
8 r à C h y y
Q v r
C h y y
T r
C h y y
T u
C h y y
P r Ã
C h y y
G v i h
8 y y r p v à U h x
h q à 7 r à Q
8 u v y y r
T r y y à C h y y
S r v q r p r Ã
à C h y y
8 y y r t r
V v
Q @
7 v y q v t
T h q v
C r h à @ p u h t r
7 v y q v t
T r y
T r
9 v r p à 7 v r q
U r y à T r
1
T r y
T r
Figure 1. General layout of the OIT geothermal system.

8/8/2019 MARCH 1999 Geo-Heat Center Quarterly Bulletin
http://slidepdf.com/reader/full/march-1999-geo-heat-center-quarterly-bulletin 13/28
GHC BULLETIN, MARCH 1999 11
Figure 2. The 4000-gal (15-m 3) settling tank located in theHeat Exchanger building.
THE PROBLEMS ENCOUNTEREDAND THE SOLUTIONSPumps
After approximately six years of operation, a major re-design of the pumping system was carried out. The originalconstant-speed, water-lubricated lineshaft pumps, were virtu-ally the same as cold-water irrigation pumps and were locatedin wellhead pits. Placing the pumps in the pits didn t allow forair circulation which lead to overheating and condensation prob-lems. The earlier pumps also didn t provide for the expansionof the piping in the well; therefore, the lineshaft had to be pre-heated to produce sufficient clearance before the pump wasstarted. This meant one pump had to be kept running all thetime. The pumps also experienced other failures. The originalbronze impellers were attached to the shaft with collets andthe failures occurred when the impellers detached from theshaft. The most serious problem was related to the failure of the shaft bearings. A number of bearing types were used, butnone proved to have acceptable lifetimes. It was reported thatthe bronze bearings burned up, and the rubber and teflonbearings swelled.
Figure 3. One of the pumps and variable-speed controllerswith the housing removed.
During the redesign of the pumps, extra lateral bowls were installed to eliminate the need for shaft preheating. Theimpellers were attached with both keys and collets. At thispoint, it was also decided to isolate the bearings from the geo-thermal water using an oil-lubricated enclosed lineshaft arrange-ment. To help with the overheating and condensation prob-lems, it was decided to raise the pumps to ground level andenclosed them in housing (Rafferty, 1989). Figure 3 showsone of the pumps with the housing removed.
Distribution SystemThe original distribution system consisted of direct-bur-
ied Schedule 40 carbon steel piping, field insulated withFoamglas insulation and covered with a mastic vapor bar-
rier. This piping system suffered internal and exterior corro-sion. The external corrosion was due to the expansion andmovement of piping which caused the mastic vapor barrier tobreak. This failure allowed groundwater and salt water fromdeicing to come in contact with the piping, resulting in theexternal corrosion. After 14 years of service, an examinationof the piping revealed an internal buildup of scale. The scaleconsisted of mainly silica and iron oxide with the iron oxidebeing closest to the pipe. In many places, the piping wall thick-ness was reduced to one-third of its original thickness. Thefact that the main settling tank was vented to the atmospherepermitted oxygen to enter the system, which promoted the in-ternal corrosion. The storm sewer system used for disposal of the effluent also encountered failures. This part of the systemconsisted of cast iron and carbon steel piping located in thebuildings, galvanized culverts from the buildings to the mainline, and concrete culverts in the main line. All of the failuresoccurred in sections with galvanized culverts. This could havebeen a result of dezincification (galvanized coating removed)and eventually corrosion of the unprotected steel surface(Rafferty, 1989).
In response to the piping failures, it was decided to con-struct a new distribution system and a dedicated collection sys-tem along with the construction of utility tunnels to connect allthe buildings. The design of the tunnel (6 ft x 6 ft / 2 m x 2 m)provides access for maintenance personnel and space for othercampus utilities. During construction the concrete was formedand poured in place to allow for forming around building foun-dations and utility pipes running at an angle to centerline (Fig-ure 4). The floor of the tunnel is 8 in. (20 cm) thick and thesides 6 in. (20 cm) thick. The pipes are held to the side withpipe clamps and Unistrut hangers. In some cases, the tunnelalso serves as a sidewalk; thus, snow-melting is enhanced due
to the heat loss through the system. The cost of constructingthe tunnel system (including excavation and backfill) was ex-tremely high at about $160/lf ($525/m), which didn t includethe cost of the piping. The cost of the piping varied from $15/ ft ($50/m) for 6-in. (15-cm) diameter to $22/ft ($72/m) for 8-in. (20-cm) diameter pipe. When new extensions to the tunnelsystem were added, a 6-ft (2-m) diameter corrugated galva-nized steel culvert was used instead of concrete. Its estimatedcost was only 25 percent of the cost for concrete tunnels (Lundand Lienau, 1980).

8/8/2019 MARCH 1999 Geo-Heat Center Quarterly Bulletin
http://slidepdf.com/reader/full/march-1999-geo-heat-center-quarterly-bulletin 14/28
12 GHC BULLETIN, MARCH 1999
Figure 4. View of the tunnel under construction.
Heat ExchangersIn the original design, the geothermal water was used
directly in each of the building mechanical systems. This oncethrough approach eliminated the need for circulation pumpsin the buildings. The direct use of the geothermal fluids causedproblems due to the corrosive nature of the water. The origi-nal chemical analysis of the water failed to consider the effectof H 2S (hydrogen sulfide) and NH 4 (ammonia) on the copperand copper alloys used in the mechanical system. There werea number of different types of failures identified that occurredas a result of using the water directly. The most importantones are listed below:
Failure of the 50/50 tin/lead solder connections,Rapid failure of 1% silver solder,
Wall thinning and perforation of copper tubing wasa common occurrence,Control valve failures where plug (brass) wascrimped to the stem (stainless steel). The threadedones experienced no problems, andControl valve problems associated with packingleakage.
thermal water at 100 gpm (6.3 L/s) and the building water at54 gpm (3.4 L/s). The building water is then circulated throughfinned-tube pipe heat convectors located along the outside wallsof the building. The second loop provides 30,000 Btu/hr (30MJ/hr) using geothermal water at 25 gpm (1.4 L/s) and build-ing water at 12 gpm (0.65 L/s). The building water is thencirculated through reheat coils, which provides heating througha forced-air system for the interior of the building (Lund andLienau, 1980).
Figure 5. The College Union heat exchanger.
Fluid DisposalDischarge to the surface was the original approach for
disposal of the geothermal effluent. Although surface dischargeis the simplest and least expensive option, there were severalpossible potential problems. The discharge temperature of the
waste effluent was still quite high (135 oF/57 oC-winter and170 oF/77 oC-summer) when it was delivered to the ditch. Thismethod presented a safety hazard. A local city ordinance waspassed which banned surface disposal and required all opera-tions in the city to establish an injection program by 1990.OIT now has two injection wells to compile with the ordinance.The first injection well was drilled using standard mud-rotarytechniques, and the second well used a combination of meth-ods with air drilling in the injection zone. During the initialpumping test of the first injection well, the maximum obtain-able pumping rate was only 200 gpm (12.6 L/s). It was be-lieved that a considerable amount of drilling mud had invadedfractures in the primary production zones. The well wasacidized (13% hydrochloric acid, 3% hydrofluoric acid) twice;this increased the capacity from 200 to 400 gpm (12.6 to 25.2L/s). Analysis of test data indicated that the aquifer was still
clogged with drilling mud at about 25 times the effective ra-dius of the well. The maximum injection rate was estimated tobe 600 gpm (37.8 L/s). The second injection well easily handles1,000 gpm (63 L/s) and could possibly accept as much as 2,500gpm (158 L/s) at 50 psi (3.4 bar) injection pressure is allowedat the wellhead. This well is being used as the primary injec-tion well. Experience with these injection well suggest that airdrilling can be quite beneficial in terms of subsequent wellperformance (Lienau, 1989).
To address these problems, it was decided to isolate thegeothermal water from the building heating systems using plateheat exchangers. Based on an analysis study, heat exchangers
with 316 stainless steel plates with Buna-N gaskets were se-lected. The stainless steel heat exchanger used to heat the cam-
pus swimming pool failed within the first three years of opera-tion. This failure occurred on the pool s water side of the heatexchanger, probably as a result of the high chorine content.The pool s heat exchanger was eventually replaced with tita-nium plates (Rafferty, 1989).
Some of the building systems utilize two loops throughthe heat exchanger. The College Union building plate heatexchanger, shown in Figure 5, utilizes two loops. The firstloop provides 1,350,000 Btu/hr (1,350 MJ/hr) using the geo-

8/8/2019 MARCH 1999 Geo-Heat Center Quarterly Bulletin
http://slidepdf.com/reader/full/march-1999-geo-heat-center-quarterly-bulletin 15/28
GHC BULLETIN, MARCH 1999 13
NEW ADDITIONS TO THE SYSTEMSnowmelt System
The newest additions to the OIT system are two sectionsof sidewalk snowmelting located by the Residence Hall. Thisbrings the total amount of sidewalk snowmelting to 2,300 ft 2
(214 m 3). The other sections include the wheelchair ramp infront of South Hall and a couple of stairwells (Figure 6) lead-ing to upper sections of the campus. All systems utilize 5/8-in.(1.6 cm) diameter cross-linked polyethylene tubing (PEX). The
wheelchair ramp has four loops with the tubing spaced 10 in.(25 cm) apart. The stairs has three loops with the tubing tied tothe existing stairs. Figure 7 shows the placement of tubing ona stairwell before the form work was added. The systems shouldbe able to maintain a slab surface temperature of 38 oF (3 oC) at-5 oF (-21 oC) air temperature and 10 mph (16 km/h) wind whenthe entering 50/50 propylene glycol/water temperature is144 oF(62 oC). Each stair section uses a brazed-plate heat exchangerto isolate the glycol-filled snowmelt loop. The new snowmeltsystems installed have slab temperature sensors which willactivate the system when the outside air is 30 oF (-1oC)(Geothermal Pipeline, 1994).
Figure 6. One of the stairwell leading to the CollegeUnion.
Figure 7. Placement of the snowmelt tubing before theformwork was added.
Purvine HallPurvine Hall utilizes the geothermal waste effluent from
the rest of the campus for its space heating and domestic hot water heating. The temperature of the effluent as it enters thebuilding is around 155 oF (68 oC) and leaves at a temperature of around 130 oF (54 oC). The main components of heating sys-tem include a 4,000-gal (15-m 3) storage tank, circulation pumpsand heat exchangers. On the building heating side, space heat-ing is accomplished by 54 variable air volume terminals
equipped with hot water coils (Fields, 1989).
Absorption ChillerA lithium-bromide absorption chiller was installed in
1980. It has a nominal 312 ton (1095 kW) capacity; but due tothe low temperature of the water entering the system (192 oF/ 89 oC), it only produces 150 tons (526 kW) of cooling. Thechiller requires 685 gpm (37.8 L/s) of geothermal fluid andonly takes a 20 oF (11 oC) delta T out of the water. Recordedinstallation cost for the chiller was $171,300. The geothermalchiller supplies a base cooling load to five campus buildingsor 277,300 ft 2 (25,800 m 2). The original electrical centrifugalchiller is now being used for peaking above the capacity of theabsorption chiller. Since the geothermal water is used directlyin the generator tubes of the absorption chiller there is a poten-tial for corrosion to occur. The generator tubes are constructedof 90-10 cupro-nickel; but, no failures have occurred in thepast 18 years (Lund and Lienau, 1980). Due to the low effi-ciency and high water usage, the absorption chiller will be re-placed this summer with a centrifugal water chiller.
REFERENCESFields, Paula G., 1989. Purvine Hall Geothermal Heating
System, Geo-Heat Center Quarterly Bulletin, Vol.11, No. 4, pp. 16-17.
Geothermal Pipeline, 1994. Geothermal Wheelchair RampInstalled at OIT, Geo-Heat Center QuarterlyBulletin, Vol. 16, No. 1, pp. 24-25.
Lienau, Paul, 1989. OIT Injection Well, Geo-Heat CenterQuarterly Bulletin, Vol. 11, No. 4, pp. 9-11.
Lund, John W. and Paul J. Lienau, 1980. New GeothermalConstruction on the OIT Campus, Geo-HeatCenter Quarterly Bulletin, Vol.5, No. 3, pp. 21-23.
Rafferty, K. 1989. A Materials and Equipment Review of Selected U.S. Geothermal District Heating Sys-tems. Geo-Heat Center, Klamath Falls, OR.USDOE Contract # DE-FG07-87-ID 12693.
Gibson, Raymond, 1999. Personal communication. OregonInstitute of Technology.
Masl, Bruce, 1999. Personal communication. OregonInstitute of Technology.
8/8/2019 MARCH 1999 Geo-Heat Center Quarterly Bulletin
http://slidepdf.com/reader/full/march-1999-geo-heat-center-quarterly-bulletin 16/28
14 GHC BULLETIN, MARCH 1999
RECONSTRUCTION OF A PAVEMENTGEOTHERMAL DEICING SYSTEM
John W. LundGeo-Heat Center
HISTORICAL BACKGROUND
In 1948, US 97 in Klamath Falls, Oregon was routedover Esplanade Street to Main Street and through the down-town area. In order to widen the bridge across the U.S. Bu-reau of Reclamation A Canal and to have the road crossunder the Southern Pacific Railroad main north-south line, anew bridge and roadway were constructed at the beginning of this urban route. Because the approach and stop where thisroadway intersected Alameda Ave (now Hwy 50 - EastsideBypass) caused problems with traffic getting traction in the
winter on an adverse 8% grade, a geothermal experiment inpavement de-icing was incorporated into the project.
A grid system within the pavement was connected to anearby geothermal well using a downhole heat exchanger(DHE). The 419-foot well provided heat to a 50-50 ethyleneglycol-water solution that ran through the grid system at about50 gpm. This energy could provide a relatively snow freepavement at an outside temperature of -10 oF and snowfall upto 3 inches per hour, at a heat requirement of 41 Btu/hr/ft 2.The grid was composed of 3/4-inch diameter iron pipes place3 inches below the surface on 18-inch centers. The pipes werefield wrapped in what appears to be an asphalt impregnatedmaterial to protect them from external corrosion.
The temperature drop in the grid was approximately 30to 35 oF with the supply temperature varying from 100 to 130 oFand the return temperature 70 to 10 oF. This was estimated tosupply a maximum of 3.5 x 10 5 Btu/hr to the grid at the origi-nal artesian flow of 20 gpm, and 9.0 x 10 5 Btu/hr at the pumpedrate of 50 gpm. ( Lund, 1976).
REHABILITATION OF THE ODOT WELLOver time, the well temperature drop from 143 to 98 oF
at the surface. In order to maintain the downhole heat ex-changer temperature, a pump was added to the well whichpumped and discharged approximately 10 gpm of geothermal
water into the storm system to increase the heat flow. How-ever, in 1985, the City of Klamath Falls adopted the Geother-mal Resource Act which required all sewer or surface dis-charge from geothermal wells be eliminated. Since discharge
from the well to the sewer was not longer permitted, the well was modified in 1992 by deepening it to about 1000 feet andcasing it to 900 feet. The greater depth increased the tem-perature of the entering water. In addition, the Schedule 40black iron pipe with malleable couplings was changed toSchedule 80 steel in the top leg of the DHE, the U-trap at thebottom constructed of Schedule 80, and the balance of theDHE fitted with Schedule 40 pipe. The DHE was extended to900 feet to provide additional energy and to be exposed tomore of the hotter water. Several section of Roscoe Mossstandard louvre-type screen was installed and a lower seal
added. The total cost of the modifications was about $115,000.
The net result was that the new well produced approximatelythe same temperature in the grid loop as the old well withthe pump discharging geothermal fluid to the sewer (Thurston,et al., 1995).
RECONSTRUCTION OF THE BRIDGE AND PAVE-MENT SURFACE
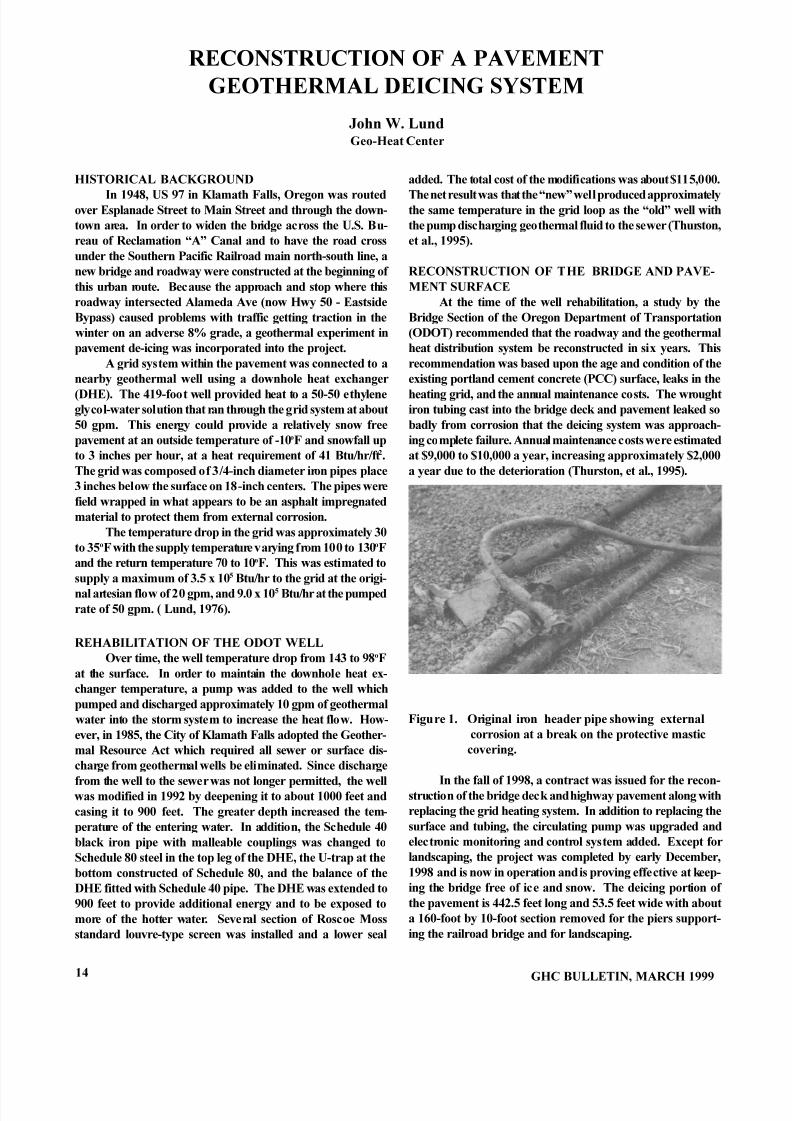
At the time of the well rehabilitation, a study by theBridge Section of the Oregon Department of Transportation(ODOT) recommended that the roadway and the geothermalheat distribution system be reconstructed in six years. Thisrecommendation was based upon the age and condition of theexisting portland cement concrete (PCC) surface, leaks in theheating grid, and the annual maintenance costs. The wroughtiron tubing cast into the bridge deck and pavement leaked sobadly from corrosion that the deicing system was approach-ing complete failure. Annual maintenance costs were estimatedat $9,000 to $10,000 a year, increasing approximately $2,000a year due to the deterioration (Thurston, et al., 1995).
Figure 1. Original iron header pipe showing externalcorrosion at a break on the protective mastic
covering.
In the fall of 1998, a contract was issued for the recon-struction of the bridge deck and highway pavement along withreplacing the grid heating system. In addition to replacing thesurface and tubing, the circulating pump was upgraded andelectronic monitoring and control system added. Except forlandscaping, the project was completed by early December,1998 and is now in operation and is proving effective at keep-ing the bridge free of ice and snow. The deicing portion of the pavement is 442.5 feet long and 53.5 feet wide with abouta 160-foot by 10-foot section removed for the piers support-ing the railroad bridge and for landscaping.

8/8/2019 MARCH 1999 Geo-Heat Center Quarterly Bulletin
http://slidepdf.com/reader/full/march-1999-geo-heat-center-quarterly-bulletin 17/28
GHC BULLETIN, MARCH 1999 15
Figure 2. Overall project design.
The top portion of the bridge deck was hydro-blasted toremove six to seven inches of the PCC pavement. Holes weredrilled through the deck to the header pipes hung underneath.Wirsbo 5/8-inch ID hePEX (a cross-linked polyethylene) tub-
ing was placed in a double overlap pattern at 14-inch on centerspacing across the deck on top of a mat of reinforcing steel.These tubes were then covered with a fresh layer of PCC. AnRTD temperature sensor was placed in the bridge deck and anambient sensor on an adjacent power pole.
The pavement section from the edge of the bridge deck,through the railroad underpass and to a point opposite the wellbuilding was completely removed. The subgrade was exca-vated to make room for about six inches of gravel base. Forms
were installed and a steel mesh placed on top of the compactedsubgrade within the forms. Geothermal black iron header pipes(supply and return) varying from 1.25 to 2.5 inches in diam-eter were placed outside the forms along the north side of the
roadway. These header pipe had a brass manifold placed atabout 40-foot intervals, to allow for four supply and returnPEX pipes to be attached. The 3/4-inch PEX grid system pipes
where then attached by wire to the reinforcing steel at 14-inchon center transverse to the roadway. Under the railroad under-pass, the tubing was placed longitudinally at about 16 incheson center, due to the narrowness of the pavement at this point.Concrete (PCC) was then placed which provided for a coverover the pipes of about 3 inches. The header pipes, were insu-lated with about one inch of Armstrong Armflex pipe insula-
tion and then covered with an aluminum foil vapor barrier.The manifolds were placed in concrete boxes for easy accessfor future maintenance. The header pipes, provided with twoexpansion loops and a concrete anchor, were covered with
earth and then had concrete slope paving placed on top forprotection.
Figure 3. A four-loop section ready for concrete place-ment.

8/8/2019 MARCH 1999 Geo-Heat Center Quarterly Bulletin
http://slidepdf.com/reader/full/march-1999-geo-heat-center-quarterly-bulletin 18/28
16 GHC BULLETIN, MARCH 1999
Figure 4. Attaching the loop pipes to the manifold.
Figure 5. Details of the manifold box.
Figure 6. Iron header pipe with insulation.
Each manifold had four supply and return pipes that madefour loops for a total length of about 430 feet each. Two loops
were staggered on top of each other to balance the temperatureloss in each loop - i.e. the hot end of one was placed adjacentto the cold end of the other, since there could be as much as
35 oF temperature drop in each loop. The PEX grid pipe isdesigned for 180 oF at 100 psi and 200 oF at 80 psi according toASTM specification F 876. The pipes are filled with an ethyl-ene glycol mixture through an air vent at the high point on thebridge deck.
Figure 7. Details of a four-loop section with manifold.

8/8/2019 MARCH 1999 Geo-Heat Center Quarterly Bulletin
http://slidepdf.com/reader/full/march-1999-geo-heat-center-quarterly-bulletin 19/28
GHC BULLETIN, MARCH 1999 17
Figure 8. Longitudinal loops under the railroad bridge.
The entire cost of the reconstruction project was approxi-mately $430,000 and the estimated annual maintenance cost
will be $500 and the operating cost (for the circulating pump)$3,000. The heated bridge deck covers 22,000 square feet andis designed for a heat output of 50 Btu/sq.ft/hr. This is suppose
to keep the deck clear during heavy snowfall down to -10 oF.During the first days of operation after a snowfall, the DHEsupply temperature was 100 oF and the return temperature 76 oFfor a delta-T of 24 oF. Once the ground and concrete tempera-tures reach equilibrium, it is expected that the supply and re-turn temperatures will increase by as much as 30 oF. The reno-vated deicing system appears to be operating effectively, basedon substantial snowfalls in January and February, 1999.
Figure 10. January snowfall looking east
Figure 11. January snowfall looking up the 8% grade tothe traffic signal and bridge deck.
ACKNOWLEDGEMENTSSpecial thanks to the Oregon Department of Transporta-
tion for providing plans and information, especially to Ms.Meredith E. Mercer, project designer; Jason Armstrong, theinspector; and to Powley Plumbing, Inc. of Klamath Falls, thegeothermal system installers, for answering many of author squestions.
REFERENCESLund, John W., 1976. Geothermal De-Icing of a Highway
Pavement. Geo-Heat Center Quarterly Bulletin,January, Vol. 1, No. 3, pp. 7-9.
Lund, John W., 1976. Geothermal De-Iceing of a Pave-ment - Part II. Geo-Heat Center QuarterlyBulletin, April, Vol. 1, No. 4, p. 7.
Thurston, Rachel, E.; Culver, Gene and John W. Lund, 1995.Pavement Snow Melting in Klamath Falls - Re-
habilitation of the ODOT Well. Geo-Heat CenterQuarterly Bulletin, February, Vol. 16, No. 2,pp. 23-28.
Figure 9. End of project and pump house in back-ground.
8/8/2019 MARCH 1999 Geo-Heat Center Quarterly Bulletin
http://slidepdf.com/reader/full/march-1999-geo-heat-center-quarterly-bulletin 20/28
18 GHC BULLETIN, MARCH 1999
LOVE THREE HOT SPRINGS OUT OF THE THOUSANDS- HOT CREEK, FIELDS AND ASH -
Bill KaysingKing City, CA
HOT CREEK
This has to be a divine design. An icy stream de-scending from the High Sierras meets a stream-bed steam ventonly a short distance from Highway US 395 above Bishop,California.
What this produces is a delightful and varied hot springsbath . You have your choice of toasting your toes by probingthe stones of the creek bottom or having the feeling of beingin an ice-cube-filled cocktail shaker. And you can enjoy ev-ery temperature in between! There s a thrill in knowing thatyou are cavorting in a crack in the cosmic egg, dancing in ageothermal miracle.
I should mention that I have not been there in years andthings could have changed; but, I hope not. This is one of ourGreat Spirit s finest aquatic playgrounds.
Hot Creek Springs
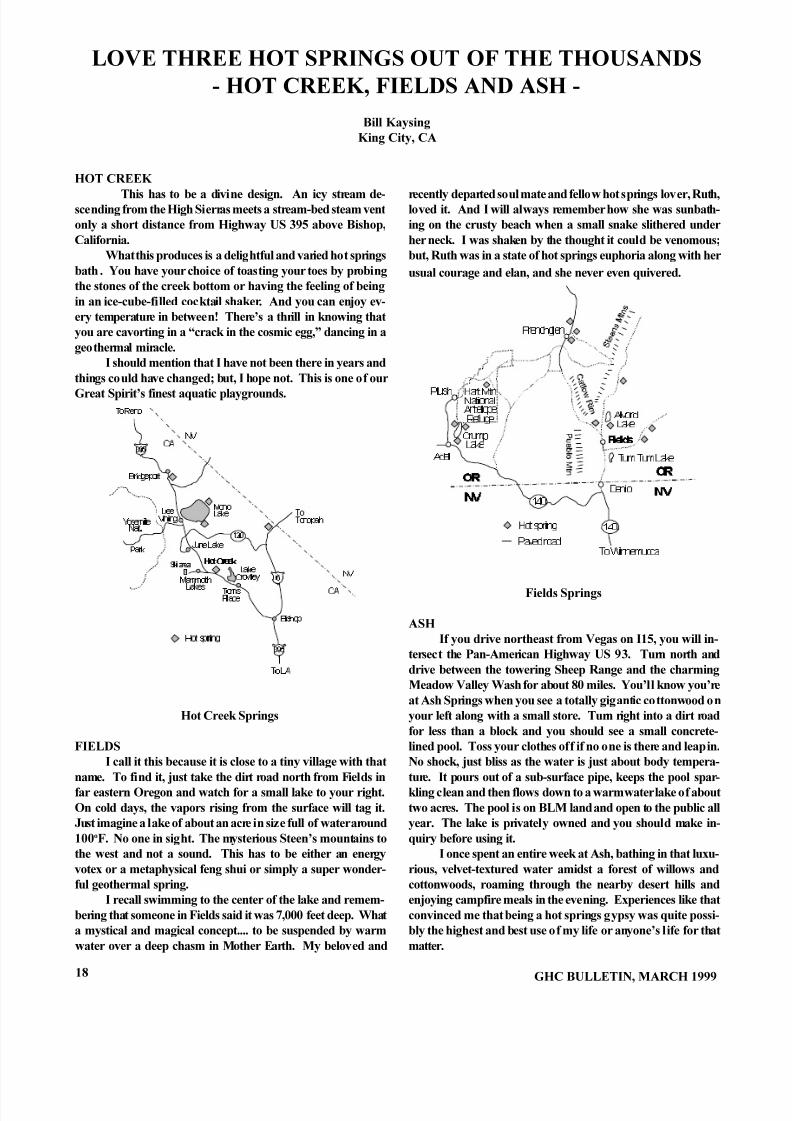
FIELDSI call it this because it is close to a tiny village with that
name. To find it, just take the dirt road north from Fields infar eastern Oregon and watch for a small lake to your right.On cold days, the vapors rising from the surface will tag it.Just imagine a lake of about an acre in size full of water around100 oF. No one in sight. The mysterious Steen s mountains tothe west and not a sound. This has to be either an energyvotex or a metaphysical feng shui or simply a super wonder-ful geothermal spring.
I recall swimming to the center of the lake and remem-bering that someone in Fields said it was 7,000 feet deep. Whata mystical and magical concept.... to be suspended by warm
water over a deep chasm in Mother Earth. My beloved and
recently departed soul mate and fellow hot springs lover, Ruth,loved it. And I will always remember how she was sunbath-ing on the crusty beach when a small snake slithered underher neck. I was shaken by the thought it could be venomous;but, Ruth was in a state of hot springs euphoria along with herusual courage and elan, and she never even quivered.
Fields Springs
ASHIf you drive northeast from Vegas on I15, you will in-
tersect the Pan-American Highway US 93. Turn north anddrive between the towering Sheep Range and the charmingMeadow Valley Wash for about 80 miles. You ll know you reat Ash Springs when you see a totally gigantic cottonwood onyour left along with a small store. Turn right into a dirt roadfor less than a block and you should see a small concrete-lined pool. Toss your clothes off if no one is there and leap in.No shock, just bliss as the water is just about body tempera-
ture. It pours out of a sub-surface pipe, keeps the pool spar-kling clean and then flows down to a warm water lake of abouttwo acres. The pool is on BLM land and open to the public allyear. The lake is privately owned and you should make in-quiry before using it.
I once spent an entire week at Ash, bathing in that luxu-rious, velvet-textured water amidst a forest of willows andcottonwoods, roaming through the nearby desert hills andenjoying campfire meals in the evening. Experiences like thatconvinced me that being a hot springs gypsy was quite possi-bly the highest and best use of my life or anyone s life for thatmatter.
#
#
1 9
2 5
1 9
2 5
6 q r y
8
G h x r
C h à H
I h v h y
6 r y r
S r s t r
Q y u
A r p u t y r
6 y q
G h x r
) L H O G V
U Ã U Ã G h x r
9 r v
C Ã v t
Q h r q à h q
U Ã X v r p p h
& $
1 9
& $
1 9
U
U h u
7 v q t r
G r r
W v v t
H h u
G h x r
E r à G h x r
U
Q y h p r
7 v u
G h x r
8 y r
C à 8 r r xT x v à h r h
` r v r
I h Ã
à Q h x
U Ã G 6
U Ã S r
" ( $
" ( $
%
!
H
G h x r
C Ã v t

8/8/2019 MARCH 1999 Geo-Heat Center Quarterly Bulletin
http://slidepdf.com/reader/full/march-1999-geo-heat-center-quarterly-bulletin 21/28
GHC BULLETIN, MARCH 1999 19
Ash Springs
EPILOGHot springs, how I love them and how fortunate to have
visited so many in the last four decades. If readers have ques-tions, I ll be happy to try to answer them. Bill Kaysing, PO1095, King City, CA 93930 [only 20 miles from Paraiso (Para-dise Hot Springs)].
Editor s Note: Bill Kaysing - author, inventor, sailor andvagabond - has written a classic book on Great Hot Springs
of the West covering 1,700 known hot springs that flow inthe 11 western states.We have since learned from the U.S. Fish and Wildlife
Service that there is a species of fish in Ash Springs (Crenicthysbaileyi baileyi), that is listed federally by the Endangered Spe-cies Act.
& $
1 9
$ =
1 9 8 7
,
$ V K
6 S U L Q J V
8 h y v r r
H h h
G h x r
H r h qG h
W r t h
U Ã G 6
U Ã S r
U Ã T h y
G h x r à 8 v
C Ã v t
,
8/8/2019 MARCH 1999 Geo-Heat Center Quarterly Bulletin
http://slidepdf.com/reader/full/march-1999-geo-heat-center-quarterly-bulletin 22/28
20 GHC BULLETIN, MARCH 1999
THE GEO-HEAT CENTER WEBSITETonya Toni Boyd
Geo-Heat Center
The Geo-Heat Center, located at the Oregon Institute of Technology campus, (under U.S. Department of Energy spon-sorship), has provided technical and information services togeothermal direct-use project developers since 1975. In keep-ing with the times, the Geo-Heat Center established a website(www.oit.edu/~geoheat or www.oit.edu/other/geoheat) on theInternet in early 1996.
The website has had numerous additions to its pagessince it was first established. It contains a wide variety of menus to select from depending on your surfing needs. Alisting of the menu includes:
What is Geothermal?Services OfferedPublications ListGeo-Heat Center Quarterly BulletinWhere are Geothermal Resources Being Used?Where are Geothermal Resources?Geothermal Heat Pump Owner Information Survival KitDirectory of Consultants and Equipment ManufacturersOther Places of Interest
The What is Geothermal? section includes a brief in-troduction to geothermal. The Services Offered section in-cludes information on what the Geo-Heat Center offers.
The Publications List section contains a listing of tech-nical papers, research reports, and past bulletin articles whichcan be requested (though not transmitted electronically) overthe Internet. Some new additions to this section includes apage where some publications can now be downloaded andthe Outside the Loop Newsletter (a newsletter for geothermalheat pump designers and engineers) webpage.
The Geo-Heat Center Quarterly Bulletin section fea-tures the Quarterly Bulletin articles since October 1995. Asof this writing, there are 13 issues on line with the latest issuebeing in a PDF (downloadable) format.
The Where are Geothermal Resources Being Used?section provides information on more than 440 individualgeothermal direct-use sites. It has an interactive U.S. map(Figure 1) showing the direct-use sites and resource areas.
There are several ways to use this map. You can click on anindividual state to reveal a full screen of that state or click onthe application icons located at the bottom of the map to get acomplete listing for that project type (e.g., all aquacultureprojects). The application icons include aquaculture, green-houses, industrial, space heating, district heating, resorts andspas, power plants, and national labs.
Figure 1. Interactive U.S. Geothermal Projects and Resource Areas map.
2 5
& $
1 0
2 .7 ;
0 1
, $
0 2
$ 5
/ $
: ,
, /, 1
7 1
0 6
0 ,
2 +
$ / * $ 6 &
1 &
9 $ : 9
0 '
' (
1 -
1 <9 7
1 +
0 $
& 7 5 ,
0 (
$ =
, '
: $
& 2
1 '
6 '
1 (
. 6
: <
T p r ) Ã @ T S D Ã ( ( $
3 $
1 9
0 7
8 7
T h p r à C r h v t
9 v v p à C r h v t
D q v h y S r à h q à T h
B r r u r
6 h p y r Q r à Q y h
Q r à Q y h à y h r q
/ % /
/ / 1 /
/ $ 1 /
6 1 /
, 1 ( /
1 5 ( /
2 5 1 /
% 1 /
I h v h y à G h i h U r r h r à h i r ÃR
8 Ã ! !R
A
U r r h r à i r y ÃR
8 Ã ! !R
A
6 r h à T v h i y r às à B r u r h y à C r h à Q à @
. <
+ ,
$ .
* + &
) /

8/8/2019 MARCH 1999 Geo-Heat Center Quarterly Bulletin
http://slidepdf.com/reader/full/march-1999-geo-heat-center-quarterly-bulletin 23/28
GHC BULLETIN, MARCH 1999 21
When you click on a state from the U.S. map, that statemap (Oregon in this example) will be displayed with the appli-cation icons and resource areas shown (Figure 2). If you areinterested in a particular direct-use site, click on the icon and asummary of what that icon represents will appear, or click any-
where else on the map to get a listing of the sites for that par-ticular state, by application (Figure 3).
Figure 2. Oregon map showing direct-use icons and geo-thermal resouce areas.
Figure 3. List that represents a district heating icon inOregon.
To get more information concerning a particular site,follow the link to the summary. This next page (Figure 4)features information concerning the location, application, tem-perature of the resource, flow, capacity, contact information,etc. This information will be improved with the addition of project summaries, photographs, and website links for moreinformation.
Figure 4. Summary of information for one of the direct-use sites.
Have you ever wondered if there are geothermal re-sources located close to your community? The Where are
Geothermal Resources? section identifies 271 collocated com-munities, within the 10 western states, that could potentiallyutilize geothermal energy for district heating and other direct-use applications. The main page for this section contains abrief description of what a collocated resource is and provideslinks to the 10 western states. Following the link to each state
will include a graphic of the state with the collocated locationsshown, a brief description of the state and a listing of the com-munities by county. Information such as location, well depth,resource temperature, flow, and TDS is included.
The Directory of Consultants and Equipment Manu-facturers section contains a listing of consultants and whatthey do. There is also a listing of equipment manufacturers forvarious types of geothermal equipment such as well pumps,heat exchangers, piping and heat pumps.
The Other Places to Visit section has several links toother websites including such sites as the Geothermal Tech-nologies - USDOE, the Geothermal Education Office, the Geo-thermal Resources Council, and American Tilapia Associa-tion to mention a few.
The Geo-Heat Center website has much to offer and isalways under continuous improvement. So come check us outat www.oit.edu/~geoheat or www.oit.edu/other/geoheat andfeel free to e-mail us with your suggestions, comments or ad-ditions.
2 5

8/8/2019 MARCH 1999 Geo-Heat Center Quarterly Bulletin
http://slidepdf.com/reader/full/march-1999-geo-heat-center-quarterly-bulletin 24/28
22 GHC BULLETIN, MARCH 1999
IN MEMORY OFDR. TIBOR BOLDIZSAR (1913 - 1998)
Tibor Boldizsar, the Father of direct-use geothermal develop-
ment in Hungary, died in Budapest on November 26, 1998, at the ageof 85. He was born in Budapest on June 9, 1913. In 1931, he matri-culated at the Hungarian Royal University of Mining and ForestryEngineer. He received his Ph.D. in 1952 and a Doctor of Science degreein 1956. From 1936 to 1944, he worked for the First Danube ShippingCompany as a mining captain and mining engineer near the city of Pecs.He was the chief mining engineer at the Hungarian Bauxite Co., Inc.,from 1945-46, and was then nominated to be the managing chief engineer of the Hungarian National Coal Mines Co., Inc., in Budapest.From 1949-50, he was head of the department at the Mining ResearchInstitute, and in 1952 became professor and head of the department atthe Polytechnical University of Heavy Industry. He was a professor atthe University of Miskolc from 1959-80, and retired in 1980.
During his retirement, he had advisory functions at the Hungarian National Committe of TechnicalDevelopment; Development Institute of the Mining Center; European Economic Committee of UNO(Geneva); the United Nations University, Tokyo; and the International School of Geothermics (IIRG), Pisa,Italy.
His main field of research and university teaching was on the organization and direction of mech-anization of mining processes. He wrote a book on Modern Mining Machinery, and edited four volumesof the Handbook of Mining, including chapters on ventilation and geothermal heat recovery of deepmining operations. He published about 200 studies and articles, nine books or portions of them, and about90 papers that were published in about 50 international periodicals. He also performed research and lecturedon geothermal energy and vulcanology in California, Oregon, Hawaii, New Zealand, the Canary Islands andseveral universities in Europe.
He received a number of Hungarian and international decorations and certificates of merit. In 1979,he became a member of the New York Academy of Sciences; an honorary member of the American Geo-physical Union in 1980; and a member of the American Institution of Mining, Metallurgical and Petrol-eum Engineers. In 1993, he was decorated with the Officer s Insignia of the Republic of Hungary.
He was invited to make a presentation at the first U.S. geothermal direct-use conference on theOregon Institute of Technology campus in October of 1974. At this conference, on the Multipurpose Use of Geothermal Energy; he presented a paper on Geothermal Energy Use in Hungary. He has also publishedpapers on heat flow in the Hungarian Basin (Nature, Journal of Geophysical Research, and Bulletin of Vol-canology) and on Geothermal Energy Production from Porous Sediments in Hungary in GeothermicsSpecial Issue, Part 1 (the UN Symposium on the Development and Utilization of Geothermal Resources,
Pisa in 1970). At that time, he was a member of the Geothermal Board in Budapest. His publications goback to at least 1968 in the geothermal field. The GHC Bulletin of October 1995 (Vol. 16, No. 4 - p. 1) hasa photo of the presenters at the 1974 OIT conference with Dr. Boldizsar seated in the front row.
His contributions to the geothermal community will be missed. Our condolences to his wife, Viola,and to his family.

8/8/2019 MARCH 1999 Geo-Heat Center Quarterly Bulletin
http://slidepdf.com/reader/full/march-1999-geo-heat-center-quarterly-bulletin 25/28
GHC BULLETIN, MARCH 1999 23
INTERNATIONAL GEOTHERMAL DAYSOREGON 1999
You are invited to attend the International GeothermalSummer School: International Geothermal Days - Oregon1999 at Oregon Institute of Technology in Klamath Falls,Oregon. This meeting, from October 10 through 16, will fea-ture of a series of workshops, courses and seminars; a con-
tinuation of earlier ones held in Europe since 1990. KlamathFalls is an ideal setting for colleagues from all over the worldto meet and discuss the development and utilization of geo-thermal energy. With over 500 geothermal wells in the areaand many types of geothermal utilization, the setting is anexcellent field laboratory to demonstrate the direct utilizationof this sustainable resource.
The program is organized by the International SummerSchool of Macedonia and the staff of the Geo-Heat Center,the latter which is famous for its international coopeation, tech-nical assistance, information dissemination, and Geo-HeatCenter Quarterly Bulletin. Presenters from the U.S. and Eu-rope will be supplemented by speakers from Latin American
and the Pacific Rim nations. The International Summer Schoolhas organized past meetings in the Azores, Turkey, Bulgaria,Slovenia, Romania and Macedonia. Dr. Kiril Popovski andDr. John Lund are the conference co-chairmen.
The conference will cover three main topic areas: (1)Small-Scale Power Projects, (2) Geothermal Heat Pumps, and(3) Direct Utilization of Geothermal Energy. These will be
supplemented with two evening workshops on computer ap-plications of (1) Software for Geothermal Heat Pumps, and(2) HEATMAP© Software (a district heating design program).The conference will also have three field trips (1) to MedicineLake (Glass Mountain) in northern California to view the sites
of the proposed Calpine Corp. and CalEnergy Co., Inc. 49.9MWe power plants, (2) direct-use sites in the Klamath Fallsarea, including the OIT heating system, the Klamath Falls Citydistrict heating/snow mel system, greenhouses and an aquac-ulture project, and (3) district heating, binary and hybrid powergeneration projects on the way to Reno. The last field trip
will occur on Saturday, October 16, after the conference and will end in Reno in time for the GRC Annual Meeting in Reno,NV. Participants can then take the Sunday field trip offeredby GRC of local power plants (field trip #2 - Steamboat andBrady s Hot Springs) and return in time for the Sunday eveningopening reception at the Reno Hilton Hotel. (The costs of theGRC events are not included in this conference.)
Additional information, the program and registrationforms can be obtained by contacting the Geo-Heat Center,Oregon Institute of Technology, Klamath Falls, OR 97601(phone: 541-885-1750, fax: 541-885-1754), or the entireprogram can be viewed on our website: www.oit.edu/other/ geoheat/iss/issindex.htm.

8/8/2019 MARCH 1999 Geo-Heat Center Quarterly Bulletin
http://slidepdf.com/reader/full/march-1999-geo-heat-center-quarterly-bulletin 26/28
24 GHC BULLETIN, MARCH 1999
GEOTHERMAL PIPELINEProgress and Development Update
Geothermal Progress Monitor
MEETINGSEuropean Geothermal Conference, Basel, Switzerland,September 20-30, 1999
Co-sponsored by the German and Swiss GeothermalAssociation, Geothermal Conference, Basel 99 will be heldat the Kongresszentrum Messe Basel. The purpose of the con-ference is to provide a forum for a European exchange of sci-entific, technological and economic information on geother-mal resources and their development and utilization. All as-pects of the state-of-the-art will be examined, as well as thenew market situations presented by electric restructuring andprivatization. Field trips are planned to Poland, Germany,Italy, France and within Switzerland. For more information,contact: OC Secretary EGC Basel 99, Bureau Inter-Prax,Dufourstrasse 87, CH-2502 BIEL/BIENNE. Phone/Fax: +44/ 32 341 45 65. E-mail: [email protected].
Geothermal Resources Council Annual Meeting - RenoHilton Hotel, Reno, NV, October 17-20, 1999
The meeting will feature a thematic opening session,special and technical session on a broad range of geothermalresource and development topics, workshops, field trips andthe Geothermal Energy Association Trade Show. Deadlinefor first draft of papers is May 3, 1999. Further informationcan be obtain from the Geothermal Resources Council, POBox 1350, Davis, CA 95617-1350, phone: 530-758-2360,email: [email protected].
World Geothermal Congress 2000, Kyushu - Tohoku,Japan, May 28 - June 10, 2000The World Geothermal Congress 2000 will be co-con-
vened in Japan by the International Geothermal Association(IGA) and the Japanese Organizing Committee for WGC2000(JOC). The main purpose of WGC2000 is to provide a forumfor exchange of scientific, technical and economic informa-tion on geothermal development. The Congress will offeropportunities to learn about recent scientific results and state-of-the-art technologies for geothermal energy developmentand for exchanges of information with worldwide experts inthe field. The IGA and JOC invite the participation of allpersons with an interest in geothermal resource development;
countries, organizations and enterprises of countries engagedin the research, development and use of geothermal energy;and the manufactures of geothermal-related equipment.
The technical sessions will be held in two separate loca-tions: Beppu City on Kyushu from May 31 to June 2 and inMorioka City, Tohoku on Honshu from June 5 to 7. Trans-portation will be provided between the two sites by JOC. Thecall for papers has been issued and the receipt of abstracts isby December 31, 1998. Draft papers will be received by July31, 1999 and receipt of the final papers is January 31, 2000.
The abstract form can be obtained from the WGC2000 offi-cial web site. For further information, contact the Secretariatof the WGC2000, % New Energy and Industrial Technology
Development Organization (NEDO), 3-1-1 Higashi-Ikebukuro, Toshima-ku, Tokyo 170-6028, Japan, phone: 81-3-3987-5793, fax: 81-3-3987-5796 and email:[email protected], or webpage: www.wgc.or.jp.
CALIFORNIACalEnergy to Break Ground for New Geothermal/ZincRecovery Facility
CalEnergy Company will break ground in early 1999on its new geothermal facility and zinc recovery plant nearthe Salton Sea in Imperial County, CA. The $285 million,49-megawatt geothermal facility and zinc recovery plant rep-resent the largest single renewable energy investment in theU.S. in nearly a decade. Approximately two-thirds of the elec-tricity generated by the plant will be sold into California semerging green electricity market, while the remaining one-third will be used onsite to provide power for the zinc recov-ery plant. The minerals recovery program will bring severalmajor benefits to California, more renewable energy at lowerprices, more jobs, environmentally benign mining, and en-hanced economic security, according to Jonathn Weisgall,VP of GEA. (Geothermal Energy News, GEA, Vol. 1, No. 7,Oct/Nov 98)
Stone and Webster of Boston have been authorized toproceed on two contracts with an estimated combined value
of $141 million for geothermal power projects owned by af-filiates of CalEnergy Co., in the Salton Sea geothermal areaof Imperial Valley. The contracts cover engineering, procure-ment and construction of the new 49-megawatt geothermalplant and additional facilities. The new power plant will belocated near CalEnergy s existing Salton Sea units 3 and 4. Itis being built to support a zinc-recovery facility scheduled forcompletion in June 2000. (CE - News, Oct. 1998)
Calpine Grows GreenerCalpine Corp s proposal to buy most of the Geysers,
announced on January 19, puts the San Jose company on track to become the state s largest producer of green electricity in
the new world of electricity deregulation. The purchase willadd about 800 MWe of green power to the company (a MWepowers about 1,000 households). Calpine currently owns in-terest in 4 of the 21 power plants there and 6,100 acres of thesteam fields that supply the power plants. If it successfullycompletes its proposed acquisitions, it will own 18 of the powerplants and 16,600 acres of the steam fields. The company has
just signed a contract to wholesale some of its Geysers energyto a retailer that is telling its customers the green power they regetting is from The Geysers the first time the Geysers en-

8/8/2019 MARCH 1999 Geo-Heat Center Quarterly Bulletin
http://slidepdf.com/reader/full/march-1999-geo-heat-center-quarterly-bulletin 27/28
GHC BULLETIN, MARCH 1999 25
ergy will be marketed directly to consumers for its environ-mental qualities. The retailer is the Commonwealth EnergyCorp. of Austin. (Mary Fricker, Santa Rosa Press Democrate,Jan. 1999)
NEBRASKACalEnergy Sells Unit Ownership to El Paso
Power company CalEnergy Co. Inc. on February 23 saidit agreed to sell 50 percent of its ownership in CE Generation
LLC, the holding company for 14 of its U.S. generating facili-ties, to an affiliate of El Paso Energy Corp. for about $259.6million. CalEnergy said it would retain the remaining 50 per-cent ownership interest in the facility. The sale is scheduled toclose on March 3, according to CalEnergy.
Last month, CalEnergy said it agreed to sell its minoritystake in the Coso geothermal power projects to Caithness En-ergy LLC for $277 million, including the assumption of $67million in debt. (NYSE:EPG - news, 23 Feb. 1999).
NEVADANevada s Mineral Production in 1997
Nevada s 1997 mineral production (including petroleumand geothermal energy) is estimated at $3.3 billion, a 4% de-crease from 1996. Gold production was the largest mineralsource, extracting 7.83 million troy ounces worth about $2.54billion. Silver production was 24.6 million troy ounces worth$114 million.
Nevada s geothermal electric power sales in 1997 were1,348,000 megawatt-hours worth $107 million, about the sameas in the four previous years. Total geothermal power gener-ating capacity of Nevada s 14 plants (on the sites) stands at237 megawatts, also about the same as during the past fouryears. No new plants have been installed in the past five years.(Nevada Geology, No. 34, Nov. 1998)
NEW MEXICOSandia Receives Patent
Sandia recently received a U.S. Patent for a well-pumpalignment system. The line-shaft pump alignment system isan acoustic device for measuring the axial alignment of thedrive shaft on downhole geothermal pumps. The present mea-surement method does not work when the shaft is turning re-quiring the pumps to run with more impeller clearance than
would otherwise be necessary and results in increased mainte-nance costs. Sandia and Johnson/Paco, a pump manufacturer,are planning a field test in a commercial production well in
1999 and if successful, Sandia and Johnston/Paco plan to ini-tiate patent licensing negotiations. This device will doublepump life from 18 to 36 months and save over $100,000 per
well. These pumps are used in the majority of geothermalpower plants built in the last decade. Overall this project willresult in a 50:50 cost share with industry. (Lew Pratsch, Nov.1998)
VIRGINIAGeothermal System to be Installed at Fort Eustis, VA
EVANTAGE, a division of Virginia Power, has starteda $2.2 million energy efficiency project at the 260,000-sq. ft.training facility at Ft. Eustis, VA. To heat and cool the build-ing, EVANTAGE will install a 240-ton geothermal heat pumpsystem with an earth-coupled, ground-loop heat exchanger. It
will also install energy-efficient lighting in offices and class-rooms and a direct digital control energy-management system
for all mechanical equipment.In the earth-coupled, ground-loop system, a series of
200 wells with underground pipes will use energy stored in theearth to cool and heat the buildings said Bob Andrus,EVANTAGE s staff engineer for the project. The annual en-ergy saving in the building is estimated at more than $150,000.Projected operating and management savings are $47,000 eachyears. EVANTAGE estimates the projected payback throughenergy savings is 7.4 years. The project is slated for comple-tion in March 1999. (Business Wire, Dec. 17, 1998)
GeoExchange Earns A Place in HistorySeveral of the buildings in the historic district of
Williamsburg, Virginia are using geothermal heat pumps forheating and cooling (GeoExchange). The largest system canbe found at the Shields Tavern, a reconstruction of a tavernoriginally built in the early 1700 s. The reason for selectinggeothermal heat pumps, is that they are hidden from sight,unlike traditional air conditioning units that hang from win-dows. In addition, is their virtual silence, geothermal heatpumps do no rely on noisy pumps and exhaust fans to heat andcool interior space.
It s an ideal technology for an historical district, whenyou can t afford to have any outdoor air source cooling equip-ment humming, said Clyde Kestner, director of engineering
for the Colonial Williamsburg Foundation. The overridingconcern is authenticity. You don t want to see these modernsystems, hear them, or even know that they are there. You just
want them to do their jobs quietly behind the scenes.Aesthetics aside, GeoExchange installations are also very
flexible, therefore they are generally the easiest systems to in-corporate into an historic building, explained Conn Abnee,executive director of the Geothermal Heat Pump Consortium.
One successful strategy is to use smaller heat pumps installedin closets, basements, and attics to provide space conditioningand ventilation with minimal ducting. (Geothermal Heat PumpConsortium - PRNewswire, Oct. 28, 1998)
WASHINGTON2 Companies Settle Mount St. Helens Claim
Nearly two decades after Mount St. Helens blew its top,two corporate landowners are getting $4.2 million for geother-mal development rights they never planned to exercise. Thesettlement with Weyerhaeuser Co. and Burlington ResourcesOil & Gas Co. that took effect in mid-December was designed
8/8/2019 MARCH 1999 Geo-Heat Center Quarterly Bulletin
http://slidepdf.com/reader/full/march-1999-geo-heat-center-quarterly-bulletin 28/28
to resolve a dispute stemming from creation of the Mount St.Helens National Volcanic Monument. Rather than cash, thegovernment is paying in credits the companies can either sellor apply toward acquisition of mineral, oil or geothermal rightson other federal lands.
Officials at both companies admit they had no plans totap the heat beneath the mountain before it erupted in May of 1980. In 1982, congress established the monument on 110,000acres, including 11,000 acres that Weyerhaeuser and Burlington
Resources agreed to exchange for timberland elsewhere inWashington state. The land deal did not include undergroundmineral and energy rights, but Paul Tittman, chief appraiserfor the U.S. Forest Service, said the agency was nonethelesssurprised when the two companies filed a claim in 1986 forcompensation of energy rights. The claim, based on calcula-tions that heat beneath the 8,355-foot mountain could be tappedfor a 55-megawatt electrical generating plant, was not sup-ported and contained questionable assumptions, Tittmansaid. A private appraisal done for the companies in 1991 setthe negotiating range at $5.6 to $6.9 million, Weyerhaeuserspokesman Fran Mendizabal said. (The Associated Press -Oregonian, Dec. 28, 1998)
INTERNATIONALChina s Geothermal Energy Resources to be Tapped
China will energetically tap geothermal energy resourcesin the southwest region and Tibet. In western Yunnan and
western Sichuan a number of medium-scale geothermal en-ergy plants will be established in the next two decades. China
will erect power plants with unit capacity of 3 to 5 kW in westYunnan and primarily Ruili. Geothermal energy resources inTengchong and western Sichuan will be tapped in 2000. Chinahas discovered over 3,000 geothermal springs, of which thereare over 2,200 with water temperature exceeding 250 degreeCelsius. (AsiaPort Daily News, Nov. 1998)
Oxbow, Marubeni, Costa Rica Celebrate Power ProjectGround Breaking
Oxbow Power Corporation announced that business andgovernment leaders from the U.S., Japan and Costa Rica, in-
cluding President Miguel Angel Rodriquez, met today to for-mally kick-off active construction of the Miravalles III Geo-thermal Power Project. The 27.5 MWe geothermal power plantis located in the Costa Rican province of Guanacaste, and willprovide clean, reliable and low-cost electricity to InstitutoCostarricense de Electricidad (ICE), the Costa Rican nationalutility. (Business Wire, Feb. 8, 1999)
World Renewable Energy Capacity and Production
A new Survey of Energy Resources 1998 was pub-lished in connection with the World energy Congress in Hous-ton, TX, in September 1998. The table below is complied fromthe survey. The installed capacities are at the end of 1996 andthe electricity generation is for the year 1996 for all the fourenergy sources:
Installed Capacity Production per YearMWe % GWh/yr %
Geothermal 7,049 52.0 42,053 79.6Wind 6,050 44.7 9,933 18.8Solar 175 1.3 229 0.4Tidal 264 2.0 602 1.2
TOTAL 3,538 52,817
The table demonstrates clearly one of the strong pointsof geothermal energy, i.e. that it is available day and nightthroughout the year and is not dependent on whether it is cloudyor whether the wind blows or not. It is often difficult to com-pare the advantages and disadvantages of different energy re-sources, as the data for these is often presented in variable forms.The good thing about the data presented in the WEC Survey of Energy Resources is that all the data is handled in the same
way and all the data originates from the national energy au-thorities of the countries of the world. (Ingvar Fridleifsson,International Geothermal Association letter to the Board of Directors, 28 Nov. 1998).