cta, mra, and cardiac imaging (hands on) - stanford...
TRANSCRIPT

CTA, MRA, and Cardiac Imaging (Hands On) R. L. Hallett, MD T. El‐Helw, MD J. Hellinger, MD S. Alexander, MD H. Wong, MD I. CTA/MRA TECHNICAL CONSIDERATIONS: Contrast Administration Considerations CTA: Successful CTA studies depend on the quality of contrast enhancement achieved. With today’s multidetector CT (MDCT) scanners, one must remember basic contrast medium (CM) administration principles in order to achieve the best results. 1. Arterial Enhancement is Proportional to the Flow (flux) of Iodine Molecules.
‐ Flow rate of 1.0 – 2.0 grams I‐/sec is the target range; this correlates to approximately 3.5 – 7 mL/sec CM injection rate
‐ To increase the arterial enhancement, one can: 1. Increase the iodine concentration (e.g. use “BrandX”‐370 instead of “BrandX” ‐300). 2. Increase the iodine flow rate (increase injection rate by 50% yield 50% greater enhancement)
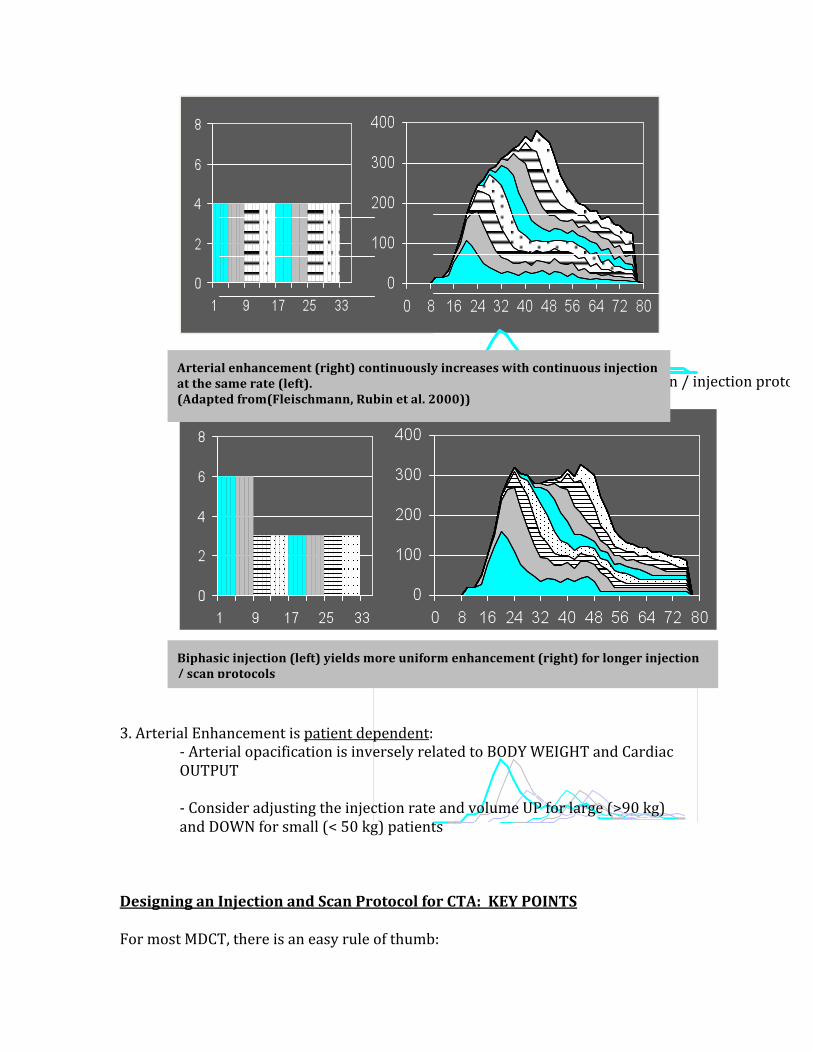
‐ Note: CM flow rates above 8mL/sec may NOT yield stronger enhancement 2. Arterial Enhancement Increases Over Time ‐ Longer injection at the same rate leads to higher enhancement ‐ In general, need at least 10 sec of injection (“injection duration”)
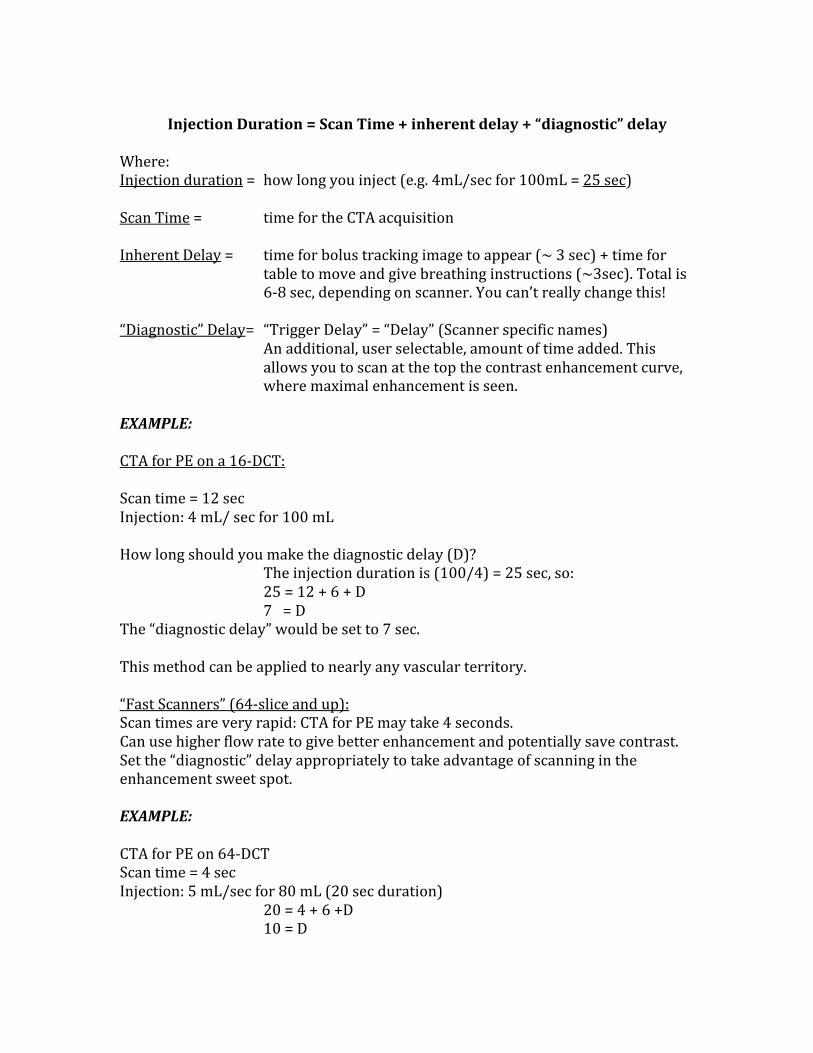
‐ Biphasic Injections result in more uniform enhancement for “long” scan / injection protocols (e.g. CTA runoff studies)
3. Arterial Enhancement is patient dependent:
‐ Arterial opacification is inversely related to BODY WEIGHT and Cardiac OUTPUT ‐ Consider adjusting the injection rate and volume UP for large (>90 kg) and DOWN for small (< 50 kg) patients
Designing an Injection and Scan Protocol for CTA: KEY POINTS For most MDCT, there is an easy rule of thumb:
Arterial enhancement (right) continuously increases with continuous injection at the same rate (left). (Adapted from(Fleischmann, Rubin et al. 2000))
Biphasic injection (left) yields more uniform enhancement (right) for longer injection / scan protocols
Injection Duration = Scan Time + inherent delay + “diagnostic” delay Where: Injection duration = how long you inject (e.g. 4mL/sec for 100mL = 25 sec) Scan Time = time for the CTA acquisition Inherent Delay = time for bolus tracking image to appear (~ 3 sec) + time for
table to move and give breathing instructions (~3sec). Total is 6‐8 sec, depending on scanner. You can’t really change this!
“Diagnostic” Delay= “Trigger Delay” = “Delay” (Scanner specific names)
An additional, user selectable, amount of time added. This allows you to scan at the top the contrast enhancement curve, where maximal enhancement is seen.
EXAMPLE: CTA for PE on a 16‐DCT: Scan time = 12 sec Injection: 4 mL/ sec for 100 mL How long should you make the diagnostic delay (D)? The injection duration is (100/4) = 25 sec, so: 25 = 12 + 6 + D 7 = D The “diagnostic delay” would be set to 7 sec. This method can be applied to nearly any vascular territory. “Fast Scanners” (64‐slice and up): Scan times are very rapid: CTA for PE may take 4 seconds. Can use higher flow rate to give better enhancement and potentially save contrast. Set the “diagnostic” delay appropriately to take advantage of scanning in the enhancement sweet spot. EXAMPLE: CTA for PE on 64‐DCT Scan time = 4 sec Injection: 5 mL/sec for 80 mL (20 sec duration) 20 = 4 + 6 +D 10 = D

In this example, we used less contrast dose, but at a higher rate. We waited to scan later. Enhancement will be higher, administered dose will be less. Another Fast Scanner Strategy: For some exams, there is no specific benefit to scanning at maximal speed. For example, mesenteric CTA, thoracic and abdominal aortic aneurysms, and peripheral runoff exams require sufficient time to allow adequate filling of the target vessels. In these situations, one can “slow down” these fast MDCT scanners by decreasing the pitch, gantry rotation time, and/or scan delay to optimize filling. Some vendor CT scanners allow the user to specify a scan time, and will then iteratively adapt the scan parameters. For example, one may specify a 40 second scan time for all peripheral CTA runoff exams, which when coupled to a 35 sec biphasic CM injection profile, yields excellent enhancement in essentially all cases. Automated tube‐current modulation should be applied to when available, to allow radiation dose savings while attaining uniform (and acceptable) noise across varying body parts and thicknesses. CTA Problem Solving: TIMING ISSUES: If your techs tell you they usually “cut off” contrast for CTA exams because the acquisition is finished, you have a problem!! They are not doing the patient a service – they are simply not imaging the majority of the intended (and presumably appropriate) contrast dose, limiting the enhancement and potential diagnostic yield. Remember the formula above! IV ISSUES: I hear all the time, “but, the patient only has a 20G in the hand”!! First, always get the largest bore IV available. For thoracic CTA studies, try to get the IV on the RIGHT. This decreases streak artifact across the aortic arch from left‐sided injection and contrast in the left innominate vein. Warming contrast and using a warmer sleeve on CM injectors will decrease CM viscosity and allow injection of higher flow rates. Now, if you can only use a small or far peripheral IV, consider the following: Inject SLOWER, but scan LATER!! Enhancement may not be exactly as good, but it will be close. EXAMPLES: CTA for PE: 16 DCT: Scan time = 12 sec

Injection: 100 mL at 3/ sec (= 33 sec) 33 = 12 + 6 + D 15 = D 64‐DCT: Scan Time = 4 sec Injection: 100 mL at 3 / sec (=33 sec) 33 = 4 + 6 + D 23 = D These protocols will result in strong (but not as strong as pulmonary) aortic enhancement as well. “LONG” Acquisitions (Runoffs, etc.) Biphasic Injections: For long scan times, overall contrast enhancement can be made more uniform by biphasic (or multiphasic) CM injection protocols. Fixed injection ratesin this situation yield relatively lower enhancement at the beginning of the acquisition, and much higher enhancement near the end of the acquisition, as these areas have “seen” contrast for a longer time (and thus have higher enhancements). We see this most often in CTA runoff studies, but also in single or dual‐ slice CTA, long coverage exams at 4‐ through 16‐ DCT, and 16‐ DCT ECG‐gated chest CTA. Biphasic injections start with a higher rate for 5 sec or so, followed by lower rates for the duration of the injection. Note that for runoff CTA, one can use an injection duration that is 5 sec less than the scan time, since the aorto‐popliteal transit time is > 5 sec in nearly all patients(Fleischmann, Koechl et al. 2003). Examples:

VALSALVA: This is probably the number 1 problem we see with PE CTA studies today. It is mostly (but not exclusively) a problem of 64‐ DCT and above. During CM injection, when the scan is triggered, may CTA studies are performed in INSPIRATION. Many PE study patients are nervous, sick, anxious, and want to help achieve an excellent exam. This leads to bearing down when given the breath‐hold instructions, possibly exacerbated by rapid or anxious language from the technologist (some scanners make the technologist give the breath‐hold instructions, instead a pre‐recorded voice). Valsalva increases intra‐thoracic and intra‐abdominal pressure and causes temporary interruption of venous return from the head and neck. There is also influx of (un‐opacified) blood from the IVC, which washes out the right heart and pulmonary arteries, and renders the exam non‐diagnostic. If you see dense contrast in the SVC, left heart, and aorta and none in the pulmonary arteries and right heart, it’s likely Valsalva effect:
To fix this, one can: 1. Coach the patient before‐hand NOT to bear down during the exam.
2. Acquire the data with by suspending respiration, not in full inspiration (“just stop breathing when told”). 3. Acquire the scan with the MOUTH OPEN, as this makes it more difficult to subconsciously Valsalva.
MRA: MRA, as a technique, has separate strengths and weaknesses relative to CTA. A major benefit in MRA is contrast enhancement. Intravenous gadolinium administration results in marked T1‐ shortening and yields higher contrast‐to‐noise ratio compared to CTA. So, “there is signal to burn” with MRA. This can be exploited by using less contrast volume, at slower injection rates. Also, the rate of

anaphylactoid reactions and serious adverse events with gadolinium compounds is significantly less than with iodinated CT agents. Relative weaknesses of MRA techniques primarily revolve around spatial resolution limitations. Although always improving, MRA acquisitions may have a voxel size that is a factor of 5‐10 time larger than CTA, primarily stemming from the Z‐axis (slice thickness) considerations and X‐Y matrix sizes of less than the 512x512 utilized in CTA. Additionally, in recent years the recognition of gadolinium chelates as a potential causative agent or exacerbating factor in nephrogenic systemic fibrosis (NSF), has resulted in stringent guidelines for use in renal failure patients. While initially disappointing, NSF has spurred tremendous advances in research of non‐contrast MRA techniques, and several robust techniques are now available which provide diagnostic MR angiographic acquisitions across most vascular domains. MRA Contrast Agents: Most MRA studies are performed with extracellular space gadolinium chelates, as an “off‐label” use of FDA‐approved agents. Typical doses range from 0.1 – 0.3 mmol/kg. Another agent, gadobenate (Multihance) has weak protein binding and affects the tumbling properties of serum proteins, yielding approximately double the T1 relaxivity at 1.5 T vs. other extracellular agents. This could allow use of less agent, better visualization of peripheral vessel branches, or both. Note that the T1 effect is field inversely proportional to field strength, and should be even more pronounced at low field. MRA Contrast Protocol Considerations: An important equation governing MRA contrast enhancement is: SI ≈ √(2/TR IR R1/CO)e‐T1/T2* Where: SI = signal intensity TR = repetition time IR = injection rate R1 = R1 time of the gadolinium agent CO = cardiac output An easy way to remember this is: SIGNAL increases with: 1. Faster injection rate 2. Worse cardiac output 3. better relaxivity (R1)
Injection rate: Given that signal only increases with the square root of the rate, and that R2 effects limit the maximum achievable SI, injection rate of 1.5 – 2.5 mL/sec are usually sufficient. Use of saline flush (“chaser”) is recommended, to improve bolus compactness and ensure that the entire administered dose is utilized for imaging. A suggestion is 20 mL volume at the same injection rate as the gadolinium. Especially important when imaging ipsilateral subclavian system (susceptibility artifact may otherwise lead to pseudostenosis) Contrast Timing: Timing Bolus:
1‐2 mL Gd, with 30 mL saline chaser. Determine time‐to‐peak enhancement. Leaves some Gd in kidneys, also some incrased background activity for MRA Fluoroscopic Triggering ( “Bolus Track”, “Care Bolus”, “Fluoro Trigger”, etc)
Rapid 2D GRE sequence in area of interest, MRA acquisition triggered by contrast arrival.
Quicker, no background activity issue Time Resolved Imaging: (TRICKS, TREAT, etc)
Oversamples central K‐space every few seconds Maintains reasonable spatial resolution and SNR, allows evaluation of flow dynamics Just inject and image
MRA CONTRAST INJECTION CHEAT SHEET: For “centric” k‐space acquisitions (e.g. “elliptic‐centric”) DELAY = tp + tR For LINEAR k‐space acquisitions: DELAY = tp – ts/2 + tinj/2
Where: Tp = test bolus time to peak TR = rise time (allow bolus to peak, usually 3‐5 sec) Ts = scan time Tinj = injection duration

PostProcessing Techniques, Limitations, and Quality Control It is important to understand the types of reconstructions available, along with strengths and limitations of each technique:
Display
Type Major Uses Advantages Disadvantages
MPR 2D Flow lumen, vessel wall analysis
•Best for stenosis, occlusions, calcifications, stents
•Limited spatial relationships •Limited display if curving vessel
MIP (also MINIP)
3D Angiographic overview, contextual with adjacent structures
•Depicts course of small and/or poorly enhancing vessels
•Vessel, bone, visceral overlap •Limited stent evaluation •Limited by calcium •No accurate measurements
CPR 2D Flow lumen, vessel wall analysis
•Best for stenosis, occlusions, calcifications, stents •Curved objects well seen
•Distortion of extra‐vascular structures •Dependent on accurate centerline
VR 3D Angiographic overview, contextual with adjacent structures
•Structural overview •Best for complex relationship
•Opacity transfer function dependent •No accurate measurements

display •WOW factor
Pointers: Make measurements on MPR images, NOT VR or thick‐slab MIP Evaluate your CTA/MRA data interactively in 3D Thin Client technology aids review and consultation from multiple locations. “ANGIO WINDOWS”: (e.g. 1200 / 200)
Wide window and level settings, these are crucial to evaluation of luminal disease and for measurements. Windows too narrow (e.g. aorta too “white”) will lead to overestimation of measurements since the grayscale values are truncated. Further, mural calcium or stents may not be depicted as separate and may be included in measurements. Proper windowing should allow calcium to be seen as not completely white, and may change case‐by‐case.
Think of 3D like Ultrasound – it is a combined job for MDs and techs:
MD: interactively review, interpret, save a few “screenshots” to send to docs and PACS
Tech: Perform protocol‐driven recons individualized per case Having dedicated 3D Lab or 3D techs improves uniformity of recons, also provides quality control
II. Current Applications of CTA / MRA in Interventional Radiology: Upper / Lower Extremity LOWER EXTREMITY: CTA/MRA have been shown to be cost‐effective relative to catheter angiography for pre‐therapeutic workup of patients with intermittent claudication (IC) and chronic limb threatening ischemia (CLI)(Visser, de Vries et al. 2003; Visser, Kock et al. 2003). Patients then can be stratified by TASC system. Pre‐therapeutic vessel diameters, stenosis / occlusion length, lesion morphology, runoff vessel status, and calcium volume can be delineated, which can guide selection of treatment (endovascular vs. surgical or medical management) as well as choice of specific balloons, access sites, and expected outcomes.

On the newer 64‐DCT systems and above, submillimeter collimation and thin (<1mm) reconstruction leads to improved visualization of small vessels in the calves and feet. Stepping table CE‐MRA, using spoiled gradient echo acquisition, gives excellent results in most patients. In diabetic patients with diffuse medial calcinosis, MRA may be a better choice for imaging, given the lack of visible calcium, which may limit CTA evaluation of small vessel stenosis. A problem for MRA in the extremities is venous contamination, often seen with diabetics and patients with cellulitis. This slab MIP review of the MRA data may help clarify findings. Also, MRA tends to overestimate stenoses, and in the abdomen respiratory motion artifact may limit visualization. Time of Flight (TOF) imaging may be utilized in patients with renal failure as a non‐contrast method to detect steno‐occlusive disease and “angiographically occult” vessels(Owen, Carpenter et al. 1992). Accuracy for CTA with newer, 16‐DCT and better is excellent, with sensitivity, specificity, and accuracy compared to DSA in the mid‐90% regions, if not higher. An even larger body of data is available for MRA, with overall similar results using stepping table, CE‐MRA technique. Both modalities have been shown to be cost‐effective compared to DSA, although with significantly less cost associated with CTA(Ouwendijk, de Vries et al. 2005). Protocol design (scan protocol, contrast medium administration) for lower extremity CTA is important and can maximize available diagnostic information. An important caveat to remember is that since the aorto‐popliteal transit time is > 5 sec in nearly all individuals, so one can set the scan time 5 sec more than the CM injection duration(Fleischmann, Koechl et al. 2003). Protocols for multiple different vendors and detector arrays are available(Fleischmann, Hallett et al. 2006; Hallett and Fleischmann 2006; Leiner T 2008). While not exhaustive, a list of protocols for each major vendor is as follows:(Hellinger JC 2006)
Acquisition
Number of Rows
Collimation Pitch
TI TS
Scan Time
4
4 x 2.5∆‡ ○ 4 x 2.0* 4 x 1.25∆ 4 x 1.0‡○ 4 x 1.0 *
1.5 1.375 1.5 1.5 1.375
15 11 7.5 6 5.5
30 22 15 12 11
27‐33 36‐45 53‐67 67‐83 73‐91

8∆
8 x 2.5 8 x 1.25
1.35 1.35
27 13.5
30 15
14‐18.5 30‐37
16
16 x 1.5○ 16 x 1.5‡ 16 x 1.25∆ 16 x 1.0* 16 x 0.75○ 16 x 0.75‡ 16 x 0.625∆ 16 x 0.5*
1.5 1.25 1.375 1.4375 1.5 1.25 1.375 1.4375
36 30 27.5 23 18 15 13.75 11.5
72 60 55 46 36 30 27.5 23
11‐14 13‐17 14.5‐18 17‐22 22‐28 27‐33 29‐36 35‐44
64
32 x 1.25∆ 24 x 1.2○ 64 x 625∆ 2 x 32 x 0.6○
0.9375 0.9 0.9375 0.9
37.5 26 37.5 34.6
75 52 75 69
11‐13 15‐19 11‐13 11.5‐14.5
NOTE: Parameters shown are for an 800‐1000mm acquisition with a 0.5sec gantry rotation. Collimation = No. channels x detector width (mm); TI=Table Increment / 360° gantry rotation; TS=Table Speed (mm/sec); Scan time in seconds; TH=slice thickness (mm). ∆GE, ‡
Phillips, ○Siemens, and *Toshiba scanners. UPPER EXTREMITY: Upper extremity (UE) CTA/MRA imaging is less well publicized but is very valuable for certain indications. The overall incidence of upper extremity ischemia is perhaps only 5% of all extremity ischemia patients. Upper extremity collateral networks can be robust, and the oxygen demands are less than the lower extremity. However, non‐invasive CTA and MRA can contribute useful information in this area. Technically, upper extremity CTA requires some modifications to the lower extremity CTA technique. First, depending on the clinical question, one can scan the arch and upper extremity, upper extremity alone, or perform CT venography (either direct or indirect). Choice of protocol is based on suspected diseases, as follows:
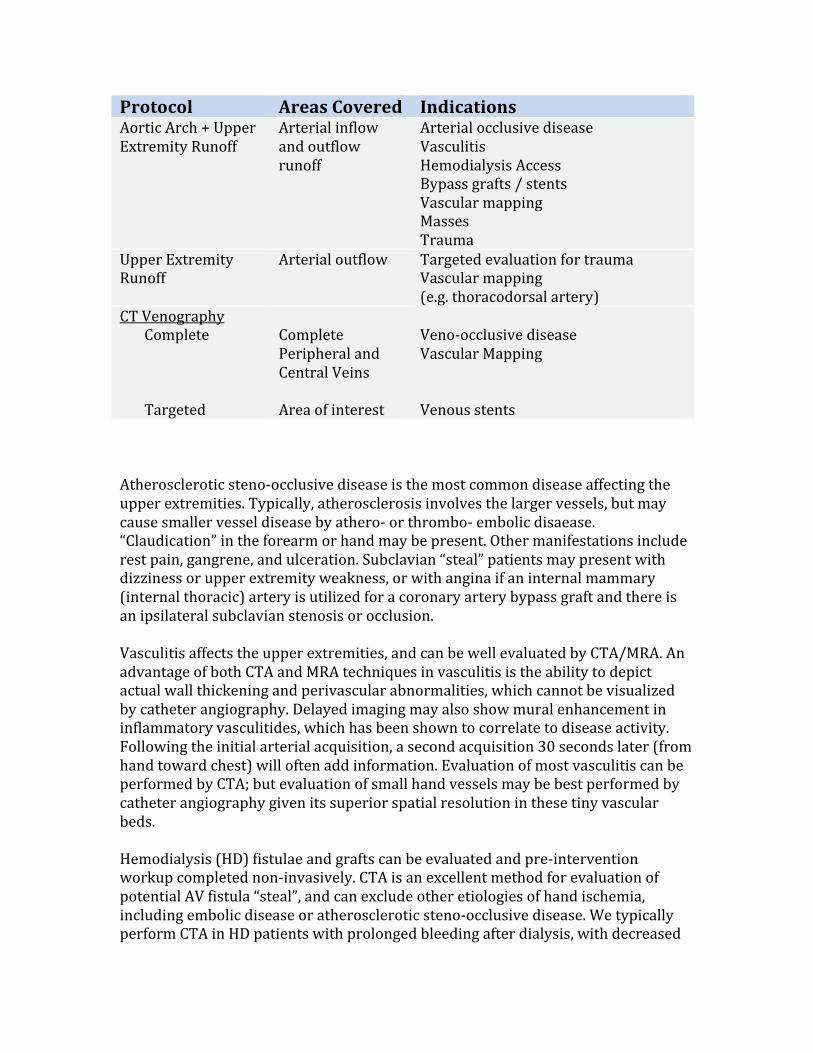
Protocol Areas Covered Indications Aortic Arch + Upper Extremity Runoff
Arterial inflow and outflow runoff
Arterial occlusive disease Vasculitis Hemodialysis Access Bypass grafts / stents Vascular mapping Masses Trauma
Upper Extremity Runoff
Arterial outflow Targeted evaluation for trauma Vascular mapping (e.g. thoracodorsal artery)
CT Venography Complete Targeted
Complete Peripheral and Central Veins Area of interest
Veno‐occlusive disease Vascular Mapping Venous stents
Atherosclerotic steno‐occlusive disease is the most common disease affecting the upper extremities. Typically, atherosclerosis involves the larger vessels, but may cause smaller vessel disease by athero‐ or thrombo‐ embolic disaease. “Claudication” in the forearm or hand may be present. Other manifestations include rest pain, gangrene, and ulceration. Subclavian “steal” patients may present with dizziness or upper extremity weakness, or with angina if an internal mammary (internal thoracic) artery is utilized for a coronary artery bypass graft and there is an ipsilateral subclavian stenosis or occlusion. Vasculitis affects the upper extremities, and can be well evaluated by CTA/MRA. An advantage of both CTA and MRA techniques in vasculitis is the ability to depict actual wall thickening and perivascular abnormalities, which cannot be visualized by catheter angiography. Delayed imaging may also show mural enhancement in inflammatory vasculitides, which has been shown to correlate to disease activity. Following the initial arterial acquisition, a second acquisition 30 seconds later (from hand toward chest) will often add information. Evaluation of most vasculitis can be performed by CTA; but evaluation of small hand vessels may be best performed by catheter angiography given its superior spatial resolution in these tiny vascular beds. Hemodialysis (HD) fistulae and grafts can be evaluated and pre‐intervention workup completed non‐invasively. CTA is an excellent method for evaluation of potential AV fistula “steal”, and can exclude other etiologies of hand ischemia, including embolic disease or atherosclerotic steno‐occlusive disease. We typically perform CTA in HD patients with prolonged bleeding after dialysis, with decreased
thrill or pulse, with poor HD flow rates, or with symptoms of graft steal. Precise luminal dimensions can be obtained and central veins can be well evaluated. Graft or fistula anastamoses can be measured precisely, and this information can direct anastamotic revision for steal patients. As with most CTA/MRA, interaction with the data in a 3D environment, with ability to save “screen shots”, facilitates greater understanding of the anatomy and pathology and will shorten intervention times. Upper extremity CTA allows several positioning options, which can be exploited depending on the clinical question. Routinely, we perform UE CTA with the patient supine with the affected arm abducted and extended over the head, with the fingers near the midline. Taping the fingers and hand in place helps, as do pillows and/or blankets under the arm, which improves tolerance and positions much of the UE in the same coronal plane. Inject from a CONTRALATERAL antecubital IV for arterial phase imaging; for venous imaging one can inject from the IPSILATERAL hand / forearm for direct or combination CTA/CTV, or via contralateral injection if indirect venography is to be acquired. The choice depends on the clinical question. An interesting alternative is the “combination” direct / indirect CTA/CTV study, performed from the ipsilateral extremity, with straight contrast, “chased” by dilute contrast (courtesy Scott Alexander, MD): •120 mL @ 5 mL/s followed by 100 mL 1:10 dilution at 2.5 mL/s via hand IV •Bolus track aortic arch •Caudocranial (fingers toward heart) acquisition Patients who cannot perform the above procedure can be evaluated with the affected arm at the side (and other arm over head to reduce noise), in the “modified swimmer’s” position, or prone with arms over the head and the face and neck supported in a donut cushion. In patients with suspected thoracic outlet / inlet disease, one may acquire data in both the “stress” (usually arm abducted, externally rotated +/‐ Wright or Adson’s position) and “neutral” position (arm at side) by changing arm positions after the initial arterial phase exam. In the neutral position, the arm of interest should be placed as near the isocenter of the gantry as possible. Remember that with the arms at the side, image noise may increase and automated tube exposure should be utilized. CTA protocols for each scenario above are available in the literature(Leiner T 2008). MRA evaluation adds the ability to better visualize muscle and ligamentous structures, and to quantitate flow by phase‐contrast techniques. As in the lower extremity, most MRA is performed by 3D‐CE‐MRA. Review of the MRA source data is mandatory, and creation of a subtracted dataset using a non‐contrast mask may improve lesion visualization and characterization.

A useful MRA interpretation tip: Reconstruct axial slices from the original coronal (upper extremity) or sagittal (chest) acquisition:
Typically, we reconstruct these as 3mm MPR (or MIP) at 2 mm interval. Review of these images is instantly familiar, allows confirmation that all target anatomy and collateral vessels of interest are included, and helps identify artifacts that may not be obvious on the source images.
Neck: Carotid CTA / MRA has supplanted most DSA as the next test after a positive or equivocal carotid Doppler US. Pre‐surgical / endovascular planning can be accomplished completely. There are many reports suggesting under‐or over‐estimation of stenosis with both MRA and CTA. While MRA results are more dependent on technique utilized, and reconstruction and viewing considerations, there is no systematic tendency to under‐ or over‐estimate stenosis by CTA(Hollingworth, Nathens et al. 2003). PQRI: Get your Money!! In 2007, Medicare introduced PQRI, which can allow practices additional reimbursement for all Medicare allowable studies (not just carotid and brain imaging) of up to 1.5%! To achieve this “bonus”, medical practices must report information on “appropriateness” over many different clinical and imaging parameters; in IR, the most common reportable factor is carotid imaging (PQRI Measurement 11). For now, PQRI is quite a carrot; in the future it may become a “stick”!! Note that for Medicare PQRI initiatives (“Measure 11”) one must measure and report the degree of stenosis for Doppler US, CTA, and MRA by appropriate criteria (typically NASCET), and note such in the report. Direct measurements are acceptable in CTA/MRA, and velocity measurements reported for Doppler US. Adding a transcription cue or voice transcription “template” of the report allows population of appropriate text to satisfy this requirement: “Note: this final report includes direct or indirect reference to measurements of distal internal carotid diameter as the denominator for stenosis measurement, by NASCET Criteria.” The specific PQRI code can then be added for ease of counting and reporting to Medicare: PQRI 3100 (I say “carotid code” into Powerscribe):
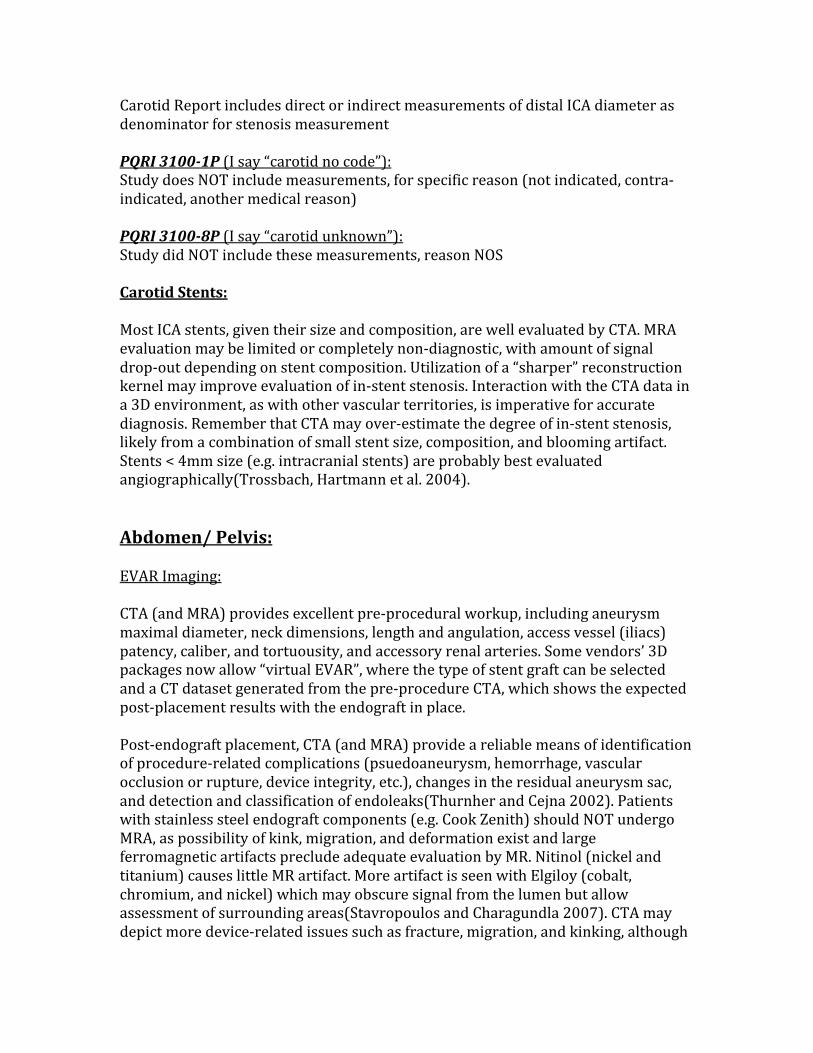
Carotid Report includes direct or indirect measurements of distal ICA diameter as denominator for stenosis measurement PQRI 31001P (I say “carotid no code”): Study does NOT include measurements, for specific reason (not indicated, contra‐indicated, another medical reason) PQRI 31008P (I say “carotid unknown”): Study did NOT include these measurements, reason NOS Carotid Stents: Most ICA stents, given their size and composition, are well evaluated by CTA. MRA evaluation may be limited or completely non‐diagnostic, with amount of signal drop‐out depending on stent composition. Utilization of a “sharper” reconstruction kernel may improve evaluation of in‐stent stenosis. Interaction with the CTA data in a 3D environment, as with other vascular territories, is imperative for accurate diagnosis. Remember that CTA may over‐estimate the degree of in‐stent stenosis, likely from a combination of small stent size, composition, and blooming artifact. Stents < 4mm size (e.g. intracranial stents) are probably best evaluated angiographically(Trossbach, Hartmann et al. 2004). Abdomen/ Pelvis: EVAR Imaging: CTA (and MRA) provides excellent pre‐procedural workup, including aneurysm maximal diameter, neck dimensions, length and angulation, access vessel (iliacs) patency, caliber, and tortuousity, and accessory renal arteries. Some vendors’ 3D packages now allow “virtual EVAR”, where the type of stent graft can be selected and a CT dataset generated from the pre‐procedure CTA, which shows the expected post‐placement results with the endograft in place. Post‐endograft placement, CTA (and MRA) provide a reliable means of identification of procedure‐related complications (psuedoaneurysm, hemorrhage, vascular occlusion or rupture, device integrity, etc.), changes in the residual aneurysm sac, and detection and classification of endoleaks(Thurnher and Cejna 2002). Patients with stainless steel endograft components (e.g. Cook Zenith) should NOT undergo MRA, as possibility of kink, migration, and deformation exist and large ferromagnetic artifacts preclude adequate evaluation by MR. Nitinol (nickel and titanium) causes little MR artifact. More artifact is seen with Elgiloy (cobalt, chromium, and nickel) which may obscure signal from the lumen but allow assessment of surrounding areas(Stavropoulos and Charagundla 2007). CTA may depict more device‐related issues such as fracture, migration, and kinking, although
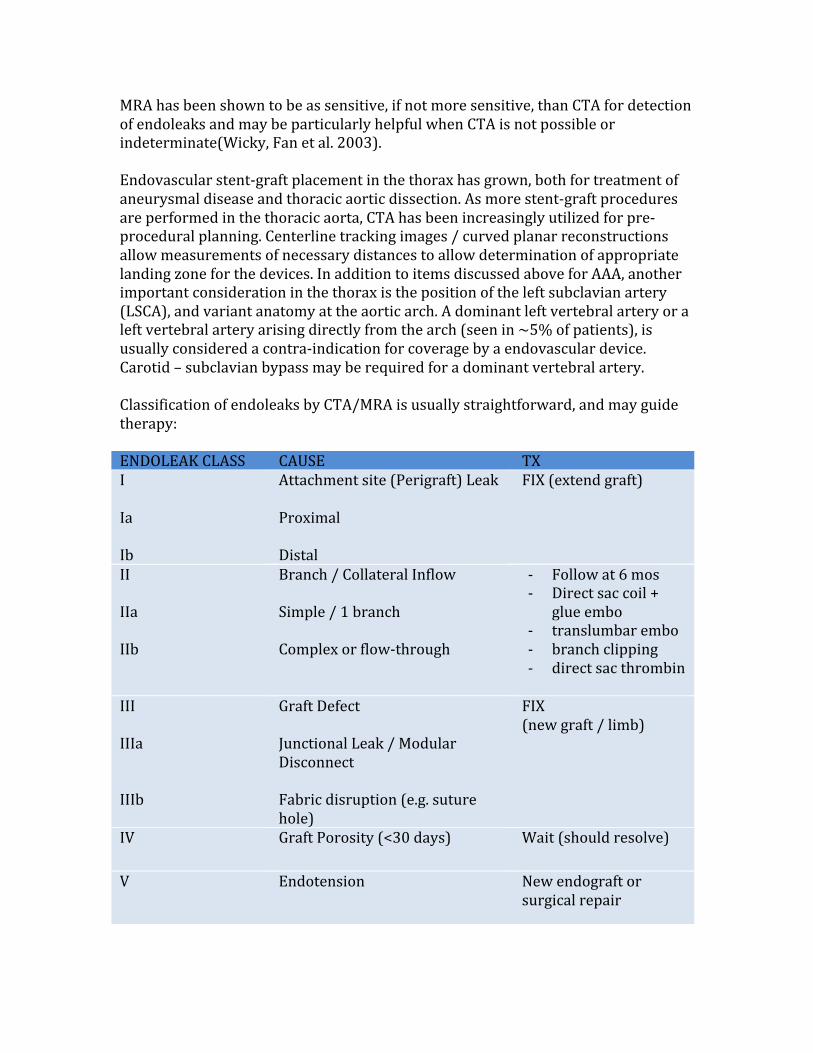
MRA has been shown to be as sensitive, if not more sensitive, than CTA for detection of endoleaks and may be particularly helpful when CTA is not possible or indeterminate(Wicky, Fan et al. 2003). Endovascular stent‐graft placement in the thorax has grown, both for treatment of aneurysmal disease and thoracic aortic dissection. As more stent‐graft procedures are performed in the thoracic aorta, CTA has been increasingly utilized for pre‐procedural planning. Centerline tracking images / curved planar reconstructions allow measurements of necessary distances to allow determination of appropriate landing zone for the devices. In addition to items discussed above for AAA, another important consideration in the thorax is the position of the left subclavian artery (LSCA), and variant anatomy at the aortic arch. A dominant left vertebral artery or a left vertebral artery arising directly from the arch (seen in ~5% of patients), is usually considered a contra‐indication for coverage by a endovascular device. Carotid – subclavian bypass may be required for a dominant vertebral artery. Classification of endoleaks by CTA/MRA is usually straightforward, and may guide therapy: ENDOLEAK CLASS CAUSE TX I Ia Ib
Attachment site (Perigraft) Leak Proximal Distal
FIX (extend graft)
II IIa IIb
Branch / Collateral Inflow Simple / 1 branch Complex or flow‐through
‐ Follow at 6 mos ‐ Direct sac coil +
glue embo ‐ translumbar embo ‐ branch clipping ‐ direct sac thrombin
III IIIa IIIb
Graft Defect Junctional Leak / Modular Disconnect Fabric disruption (e.g. suture hole)
FIX (new graft / limb)
IV Graft Porosity (<30 days) Wait (should resolve)
V Endotension New endograft or surgical repair

Currently, most centers follow endografts at 1‐, 6‐, and 12‐months, with yearly follow‐up exams thereafter if stable. After 1‐2 years, follow‐up can also be performed by Doppler US, although this is somewhat controversial. As part of the imaging follow‐up, residual aneurysm sac volume should be calculated – this provides a more reliable indication of lack of growth than a single maximal dimension from source CTA/MRA images.

Anatomic, Acquisition, and Interpretation Strategies for Coronary CTA (CCTA) CODING and BILLING: (!!!) New CPT Codes: effective 2010, replace previous Tcodes:
• Calcium Scoring--CT (75571): Heart without contrast material with quantitative evaluation of coronary calcium, replacing 0144T. Not separately reportable with 75572, 75572, 75574.
• Pulmonary Veins--CT (75572): Heart with contrast material, for evaluation of cardiac structure and morphology (including 3D image post-processing, assessment of cardiac function and evaluation of venous structures, if performed). Replaces 0145T.
• Congenital Heart Disease--CT (75573): Heart with contrast material, for evaluation of cardiac structure and morphology in the setting of congenital heart disease (including 3D image post-processing, assessment of cardiac LV function, RV structure and function and evaluation of venous structures, if performed). Replaces 0150T.
• CCTA--CT (75574): Heart, coronary arteries and bypass grafts (when present), with contrast material, including 3D image post-processing (including evaluation of cardiac structure and morphology, assessment of cardiac function and evaluation of venous structures, if performed). Replaces 0146T-0149T.
Indications for CCTA: (from(Hendel, Patel et al. 2006)) For Detection of CAD: 1. Acute Chest Pain in symptomatic patients
‐ Intermediate pre‐test probability of CAD ‐ No ECG changes and serial enzmes negative
2. Evaluation of chest pain syndrome in symptomatic subjects ‐ Intermediate Pr‐test probability of CAD ‐ ECG uninterpretable or unable to exercise
3. Evaluation of intra‐cardiac structures in symptomatic patients ‐ Suspected coronary anomalies Detection of CAD with prior test results: 1. Evaluation of chest pain syndrome
‐ Uninterpretable or equivocal stress test (nuclear, echo, treadmill) Structure and Function: 1. Morphology
‐ Assessment of complex congenital heart disease ‐ New onset heart failure to assess anomalies and etiology
2. Evaluation of intra‐ and extra‐ cardiac structures

‐ Non‐invasive coronary arterial mapping, including evaluation of internal mammary before repeat surgical revascularization
RECENT RESULTS DATA (from reference(Bastarrika, Lee et al. 2009)):

CORONARY ANATOMY:
17‐Segment AHA Model:
Courtesy of Frandics Chan, MD PhD

CCTA ACQUISITION: Pretest: NO caffeine, NTG Exclude or manage contraindications to b‐blockers, NTG History sheet Baseline Vitals PreMedicate (most scanners): Beta Blockers 50‐100 mg atenolol (Tenormin) p.o., can be taken night before or 50‐200 mg metoprolol (Lopressor) p.o. 60‐90 min before or 5‐20 mg metoprolol (Lopressor) IV, 5mg at a time, immediately before If contraindications to b‐blockers, may give: Calcium channel blockers (CCB) Diltiazem (Cardizem, regular release) 30 mg p.o. or Double oral dose for patients already on CCB Or Diltiazem (cardizem) 10 mg IV over 2 min, repeat q10 min up to 40 mg During test: If HR> 60‐65, give 5mg metoprolol IV (can repeat up to 15 mg) Do calcium score, give 0.4 mg NTG (SL or spray) May do timing bolus, or bolus triggering ALWAYS use saline chaser! (can use dilute 10‐30% contrast to see R heart) Posttest: We monitor outpatients for 30 min Instruct not to drive car / operate machinery for 3 hours

Example CCTA injection / scan protocol : (courtesy Justus Roos, MD)
Contraindications to Beta Blockers, CCBs, and NTG:

Types of Coronary CTA scans: Prospective ECG‐gating: aka “Step and Shoot”
‐ Usually lower radiation dose ‐ Fast (1 heart beat at 320‐DCT) ‐ Calcium scores are also done this way ‐ No functional data available
Retrospective ECG‐gating ‐ Tube on the entire scan ‐ Slow helical scan (pitch <1) ‐ Retrospectively, the scanner sorts out data and puts it into “bins” for each
portion of the R‐R wave ‐ Can reconstruct any combination; we use 0‐90% at 10% increments ‐ Functional data, valve motion, etc. available ‐ Relatively more radiation dose ‐ BUT:
o Use “ECG‐pulsing” (dials down dose during less important parts of R‐R) o Newer scanners have improved filters, etc.
NOTE: For bypass grafts, make sure to scan the entire chest! CCTA Image Reconstruction and Interpretation: Identify your particular 3D solution and spend the time to learn the “buttonology” Review the axial source images at 65‐75% R‐R interval Curved planar reconstruction (CPR) through each major coronary Generate cross sections through the CPRs
Aka “MPR the CPR”, “slice through display” Must interact with thin‐slice data in 3D “walk through” the data RTs can generate volumes, ejection fraction, etc. if retrospectively gated

References: Bastarrika, G., Y. S. Lee, et al. (2009). "CT of coronary artery disease." Radiology 253(2): 317‐338. Technical innovation is rapidly improving the clinical utility of cardiac
computed tomography (CT) and will increasingly address current technical limitations, especially the association of this test with relatively high levels of radiation. Guidelines for appropriate indications are in place and are evolving, with an increasing evidence base to ensure the appropriate use of this modality. New technologies and new applications, such as myocardial perfusion imaging and dual‐energy CT, are being explored and are widening the scope of coronary CT angiography from mere coronary artery assessment to the integrative analysis of cardiac morphology, function, perfusion, and viability. The scientific evaluation of coronary CT angiography has left the stage of feasibility testing and increasingly, evidence‐based data are accumulating on outcomes, prognosis, and cost‐effectiveness. In this review, these developments will be discussed in the context of current pivotal transitions in cardiovascular disease management and their potential influence on the current role and future fate of coronary CT angiography will be examined.
Fleischmann, D., R. L. Hallett, et al. (2006). "CT angiography of peripheral arterial disease." J Vasc Interv Radiol 17(1): 3‐26. Lower‐extremity computed tomographic (CT) angiography (ie, peripheral CT
angiography) is increasingly used to evaluate patients with peripheral arterial disease. It is therefore increasingly important for all vascular specialists to become familiar with the strengths and limitations of this new technique. The aims of this review are to explain the principles of scanning and injection technique for a wide range of CT scanners, to explain and illustrate the properties of current image postprocessing tools for effective visualization and treatment planning, and to provide an overview of current clinical applications of peripheral CT angiography.
Fleischmann, D., A. Koechl, et al. (2003). "Aorto‐popliteal bolus transit times in peripheral CTA: can fast acquisitions outrun the bolus." Eur Radiol 13S: 268. Fleischmann, D., G. D. Rubin, et al. (2000). "Improved uniformity of aortic enhancement with customized contrast medium injection protocols at CT angiography." Radiology 214(2): 363‐371. PURPOSE: To compare the uniformity of aortoiliac opacification obtained
from uniphasic contrast medium injections versus individualized biphasic injections at computed tomographic (CT) angiography. MATERIALS AND METHODS: Thirty‐two patients with an abdominal aortic aneurysm underwent CT angiography. In 16 patients (group 1), 120 mL of contrast material was administered at a flow rate of 4 mL/sec. In the other 16 patients (group 2), biphasic injection protocols were computed by using mathematic

deconvolution of each patient's time‐attenuation response to a standardized test injection. Attenuation uniformity was quantified as the "plateau deviation" of enhancement values, which were calculated as the SD of the time‐contiguous attenuation values observed during the 30‐ second scanning period. RESULTS: Group 2 patients received between 77 and 165 mL (mean, 115 mL) of contrast medium. Initial flow rates ranged from 4.1 to 10.0 mL/sec (mean, 6.8 mL/sec) for the first 4‐6 seconds; continuing flow rates ranged from 2.0 to 4.8 mL/sec (mean, 3.1 mL/sec) for the remaining 24‐26 seconds. The plateau deviation was significantly smaller in group 2 patients (19 HU) versus group 1 patients (38 HU, P .001). CONCLUSION: At CT angiography, tailored biphasic injections led to more uniform aortoiliac enhancement, compared with standard uniphasic injections of contrast medium.
Hallett, R. L. and D. Fleischmann (2006). "Tools of the trade for CTA: MDCT scanners and contrast medium injection protocols." Tech Vasc Interv Radiol 9(4): 134‐142. The introduction of multi‐detector row computed tomography (MDCT)
scanners in 1998 ushered in new advances in CT angiography (CTA). The subsequent expansion of MDCT scanner capabilities, coupled with advances in understanding of contrast medium (CM) dynamics, has further improved the clinical availability and consistency of CTA. We will review recent advances in CT scanner technology and discuss early CM dynamics. Specifically, we describe an approach tailored to the available scanner technology and to patient size aimed at providing consistently robust CTA studies across all vascular territories. A rational method to design combined CTA scan/injection protocols to facilitate this goal will be described. Our current experience with a simplified protocol for CTA with 64‐MDCT will also be explained.
Hellinger JC, a. R. G. (2006). Multidetector‐row computed tomographic angiography technique and clinical applications. Abrams' Angiography: Interventional Radiology. S. a. P. Baum, MJ. Philadelphia, Lippincott Williams and Wilkins. 3. Hendel, R. C., M. R. Patel, et al. (2006). "ACCF/ACR/SCCT/SCMR/ASNC/NASCI/SCAI/SIR 2006 appropriateness criteria for cardiac computed tomography and cardiac magnetic resonance imaging: a report of the American College of Cardiology Foundation Quality Strategic Directions Committee Appropriateness Criteria Working Group, American College of Radiology, Society of Cardiovascular Computed Tomography, Society for Cardiovascular Magnetic Resonance, American Society of Nuclear Cardiology, North American Society for Cardiac Imaging, Society for Cardiovascular Angiography and Interventions, and Society of Interventional Radiology." J Am Coll Cardiol 48(7): 1475‐1497.

Hollingworth, W., A. B. Nathens, et al. (2003). "The diagnostic accuracy of computed tomography angiography for traumatic or atherosclerotic lesions of the carotid and vertebral arteries: a systematic review." Eur J Radiol 48(1): 88‐102. INTRODUCTION: Helical computed tomography angiography (CTA) has
become an established technique for evaluating atherosclerosis of the cerebrovascular arteries. However, the role of CTA in penetrating and blunt trauma to the carotid and vertebral arteries is not well defined. We conducted a systematic literature review to determine the diagnostic accuracy of CTA for atherosclerotic, penetrating and blunt lesions in the carotid and vertebral arteries. METHODS: We searched MEDLINE and EMBASE databases to identify studies evaluating the diagnostic accuracy of CTA of the carotid and vertebral arteries published between January 1, 1992 and December 31, 2002. Two reviewers independently assessed abstracts and full text to determine study eligibility. Information on methodological quality, imaging technique and diagnostic accuracy was abstracted from all eligible studies by three independent reviewers. We pooled sensitivity and specificity data from diagnostic accuracy studies of high methodological quality. RESULTS: Forty‐three articles met the inclusion criteria and were included in the review. Thirty studies examined atherosclerotic disease, two blunt trauma, two penetrating trauma and nine examined patients with other pathology. Pooled data from 15 higher quality studies demonstrated that CTA had a sensitivity of 95% (91‐97% CI) for detecting severe (>70%) atherosclerotic stenosis of the carotid artery. The specificity of CTA for severe stenosis was also high 98% (96‐99% CI). CTA remained a sensitive technique (95%; 93‐97% CI) when the criterion for a positive result is relaxed to moderate or greater (>30%) stenosis. Two studies raised concerns about the use of CTA in the blunt trauma setting, suggesting that CTA may not be sensitive for detecting small intimal injuries, although both of these studies used older technologies for either obtaining or viewing images. Conversely, two penetrating trauma studies concluded that the sensitivity of CTA was high. CONCLUSIONS: Our findings demonstrate that CTA is both a sensitive and specific imaging technique for identifying severe atherosclerotic stenosis and occlusion of the carotid arteries. However, there is currently not enough high quality evidence to accurately estimate the sensitivity and specificity of CTA in the setting of blunt or penetrating trauma.
Leiner T, F. D., Rofsky NM (2008). Lower Extremities Vasculature. CT and MR Angiography: Comprehensive Vascular Assessment. G. D. a. R. Rubin, N.M. Philadelphia, Lippincott Williams and Wilkins: 991‐1007. Leiner T, H. J., Rofsky NM (2008). Upper Extremities Vasculature. CT and MR Angiography: Comprehensive Vascular Assessment. G. D. a. R. Rubin, N.M. Philadelphia, Lippincott Williams and Wilkins: 1118‐1187.

Ouwendijk, R., M. de Vries, et al. (2005). "Imaging peripheral arterial disease: a randomized controlled trial comparing contrast‐enhanced MR angiography and multi‐detector row CT angiography." Radiology 236(3): 1094‐1103. PURPOSE: To prospectively evaluate clinical utility, patient outcomes, and
costs of contrast material‐enhanced magnetic resonance (MR) angiography compared with multi‐detector row computed tomographic (CT) angiography for initial imaging in the diagnostic work‐up of patients with peripheral arterial disease. MATERIALS AND METHODS: Institutional review board approval and informed consent were obtained. Patients referred for diagnostic imaging work‐up to evaluate the feasibility of a revascularization procedure were randomly assigned to undergo either MR angiography or CT angiography. Clinical utility was assessed with therapeutic confidence (scale of 0‐10) at initial imaging and with the need for additional imaging. Patient outcomes included ankle‐brachial index, maximum walking distance, change in clinical status, and health‐related quality of life. Actual diagnostic and therapeutic costs were calculated from the hospital perspective. Differences between group means were calculated with unpaired t tests and 95% confidence intervals. RESULTS: A total of 157 consecutive patients with peripheral arterial disease were prospectively randomized to undergo MR angiography (51 men, 27 women; mean age, 63 years) or CT angiography (50 men, 29 women; mean age, 64 years). For one of the 78 patients in the MR group, no data were available. Mean confidence for MR angiography (7.7) was slightly lower than that for CT angiography (8.0, P = .8). During 6 months of follow‐up, 13 patients in the MR group compared with 10 patients in the CT group underwent additional vascular imaging (P = .5). Although not statistically significant, there was a consistent trend of less improvement in the MR group across all patient outcomes. The average cost for diagnostic imaging was 359 ($438) higher in the MR group than in the CT group (95% confidence interval: 209, 511 [$255, $623]; P < .001). Therapeutic costs were higher in the MR group, but the difference was not significant. CONCLUSION: The results suggest that CT angiography has some advantages over MR angiography in the initial evaluation of peripheral arterial disease.
Owen, R. S., J. P. Carpenter, et al. (1992). "Magnetic resonance imaging of angiographically occult runoff vessels in peripheral arterial occlusive disease." N Engl J Med 326(24): 1577‐1581. BACKGROUND. Bypass grafting to arteries of the lower leg has become
standard surgical management of advanced peripheral vascular disease. Its success depends on identifying suitable distal vessels. Preoperative preparation includes imaging of the arteries of the lower leg, usually by conventional contrast arteriography. An alternative procedure, magnetic resonance (MR) angiography, has been successfully employed in patients with various cardiovascular diseases, but its possible value in patients with peripheral vascular disease has received little attention. METHODS. We used both conventional and MR angiography in preoperative studies of the lower‐leg vessels of 23 patients (25 legs) with peripheral arteriosclerosis and

arterial insufficiency, and developed independent therapeutic plans based on the information provided by each technique. When the plans differed, the interventional procedure judged more likely to save the limb was performed. The findings of conventional and MR angiography were verified by intraoperative arteriography, postinterventional arteriography, or direct operative exploration. RESULTS. MR angiography detected all vessels identified by conventional angiography, whereas conventional arteriography failed to detect 22 percent of the runoff vessels identified by MR angiography. The detection by MR angiography of vessels not identified by conventional angiography altered the surgical management of the disorders of four patients (17 percent) and guided successful bypass procedures. CONCLUSIONS. MR angiography is a noninvasive technique with greater sensitivity than conventional contrast arteriography for detecting distal runoff vessels in patients with peripheral arterial occlusive disease.
Stavropoulos, S. W. and S. R. Charagundla (2007). "Imaging techniques for detection and management of endoleaks after endovascular aortic aneurysm repair." Radiology 243(3): 641‐655. Endovascular aortic aneurysm repair (EVAR) is evolving into a viable
alternative to open surgical repair for many patients with abdominal and thoracic aortic aneurysms. Endoleak development is a complication of EVAR and represents one of the limitations of this procedure. Endoleaks represent blood flow outside the stent‐graft lumen but within the aneurysm sac. Lifelong imaging surveillance of patients after EVAR is critical to detect endoleaks for the patient's benefit and to determine the long‐term performance of the stent‐graft. Although computed tomographic angiography is the most commonly used examination for imaging surveillance, magnetic resonance angiography, ultrasonography, and digital subtraction angiography all have a role in endoleak detection and management. This review will focus on imaging techniques used for endoleak detection and the role imaging surveillance plays in the overall care of the post‐EVAR patient.
Thurnher, S. and M. Cejna (2002). "Imaging of aortic stent‐grafts and endoleaks." Radiol Clin North Am 40(4): 799‐833. Although the technical success of stent‐graft implantation is established and
relatively safe, data on the long‐term safety and efficacy of endovascular repair are just emerging. Because several late complications of aortic stent‐graft placement have been observed, life‐long follow‐up remains essential. Imaging methods form an integral part of every stage of endovascular aortic aneurysm repair. The current imaging strategy should include initial plain films, CT angiography, and color‐coded Duplex sonography. Plain films are an excellent means to detect migration, angulation, kinking, and structural changes of the stent mesh, including material fatigue, at follow‐up. Helical CT angiography is considered a potentially revolutionary method for the noninvasive complete postprocedural assessment of aortic sten‐grafting.
Current data justify the use of biphasic C angiography as the postprocedural imaging technique of choice in most patients [118]. Ultrasound offers the advantages of low cost and lack of radiation exposure. High‐quality ultrasound reliably excludes endoleaks in patients after stent‐grafting of AAAs. There is a substantial variability, however, in measuring the diameter of aneurysm sacs; thus, confirmation using an alternative study is prudent in cases that demonstrate a significant change in size during follow‐up. MR angiography serves as an attractive alternative to CT angiography in patients with impaired renal function or known allergic reaction to iodinated contrast media. With current techniques, the visualization of aortic stent‐grafts (with the exception of stainless‐steel‐based devices) is sufficient with MR angiography. There is evidence that MR imaging is superior to CT angiography in detecting small type 2 endoleaks or for excluding retrograde perfusion in patients with suspected endotension. The role of diagnostic catheter angiography is limited to assessment of vascular pathways in equivocal cases or for suspected endotension. Currently, a consensus view about postprocedural management after aortic stent‐graft implantation is lacking. The authors propose performing a baseline CT angiography at discharge and a biphasic CT angiography and Duplex ultrasound scan at three months. In patients with no evidence of an endoleak, CT angiography, plain film and Duplex sonography (abdomen) should be repeated every year after endovascular repair. If an endoleak is present at follow‐up, immediate appropriate treatment should be initiated.
Trossbach, M., M. Hartmann, et al. (2004). "Small vessel stents for intracranial angioplasty: in vitro evaluation of in‐stent stenoses using CT angiography." Neuroradiology 46(6): 459‐463. Our aim was to determine whether CT angiography is suitable for the
evaluation of in‐stent restenoses in small vessel stents for intracranial angioplasty. Therefore, we simulated stenoses with degrees of 25, 50, 75 and 90% in a total of 12 stents with different designs (MEDTRONIC AVE; ABBOT BioDivYsio, GUIDANT Neurolink, TERUMO Tsunami, COOK V‐Flex Plus) and sizes (3.0 mm, 4.0 mm). For each stenosis, the apparent stenotic degree (ASD) was measured by CT angiography. Subjective (viewing at the CT images) and objective (acquisition of a density profile) evaluations were made after the stents were filled with a solution of 0.9% NaCl and with a diluted contrast medium. It was not possible to visualize the patent lumen in any of the stenotic stent segments by viewing at the CT images. After objective evaluation, the degree of the stenoses was generally overestimated. In the group with the 3.0‐mm stents, ASD ranged from 73.6 to 100% in 25% degree stenoses. With the exception of one stent, stenoses with a degree of more than 25% appeared as vessel obstruction (ASD = 100%) in the 3.0‐mm group. In the 4.0‐mm group, the mean ASD was 60% for 25% degree stenoses, 76% for 50% degree stenoses, 91% for 75% degree stenoses and 96% for 95% degree stenoses. The minimum diameter of stents for differentiation between in‐stent restenosis and vessel occlusion using CT

angiography is 4.0 mm. In CT angiography, the degrees of in‐stent stenoses are generally overestimated. The evaluation of in‐stent restenoses only seems to be possible when CT angiographic images before and after contrast application are evaluated objectively by density profiles.
Visser, K., S. O. de Vries, et al. (2003). "Cost‐effectiveness of diagnostic imaging work‐up and treatment for patients with intermittent claudication in The Netherlands." Eur J Vasc Endovasc Surg 25(3): 213‐223. OBJECTIVE: to determine the societal cost‐effectiveness of various
management strategies, including both the diagnostic imaging work‐up and treatment, for patients with intermittent claudication in The Netherlands. METHODS: a decision‐analytic model was used and included probability and quality of life data available from the literature. A cost‐analysis was performed in a university setting in The Netherlands. Imaging work‐up options included magnetic resonance angiography (MRA), color‐guided duplex ultrasound, or intraarterial digital subtraction angiography (DSA) and treatment options were percutaneous transluminal angioplasty with selective stent placement if feasible or bypass surgery. Management strategies were defined as combinations of imaging work‐up and treatment options. A conservative strategy with no imaging work‐up and walking exercises was considered as reference. Main outcome measures were quality‐adjusted life years (QALYs), lifetime costs (euro), and incremental cost‐effectiveness (CE) ratios. The base‐case analysis evaluated 60‐year‐old men with severe unilateral intermittent claudication of at least one year duration. RESULTS: the range in QALYs and costs across management strategies that considered angioplasty as only treatment option was small (maximum difference: 0.0033 QALYs and 451 euros). Similarly, the range was small across management strategies that considered angioplasty if feasible otherwise bypass surgery (maximum difference: 0.0033 QALYs and 280 euros). MRA in combination with angioplasty (6.1487 QALYs and 8556 euros) had a CE ratio of 20,000 euros/QALY relative to the conservative strategy. The most effective strategy was DSA in combination with angioplasty if feasible otherwise bypass surgery (6.2254 QALYs and 18,583 euros) which had a CE ratio of 131,000 euros/QALY relative to MRA in combination with angioplasty. CONCLUSION: the results suggest that the imaging work‐up with non‐invasive imaging modalities can replace DSA for the work‐up of patients with intermittent claudication without a substantial loss in effectiveness and a minimal cost‐reduction. Management strategies including angioplasty are cost‐effective in the Netherlands but although strategies including bypass surgery are more effective, their incremental costs are very high.
Visser, K., M. C. Kock, et al. (2003). "Cost‐effectiveness targets for multi‐detector row CT angiography in the work‐up of patients with intermittent claudication." Radiology 227(3): 647‐656.

PURPOSE: To determine the costs, sensitivity for detection of significant stenoses, and proportion of equivocal multi‐detector row computed tomographic (CT) angiography results in the work‐up of patients with intermittent claudication that would make this imaging examination cost‐effective compared with gadolinium‐enhanced magnetic resonance (MR) angiography. MATERIALS AND METHODS: A decision model was used to compare the societal cost‐effectiveness of a new imaging modality with that of gadolinium‐enhanced MR angiography. Main outcome measures were quality‐adjusted life years (QALYs) and lifetime costs. By using threshold analysis of a given willingness to pay per QALY, target values for costs, sensitivity for detection of significant stenoses, and proportion of cases requiring additional work‐up with intraarterial digital subtraction angiography owing to equivocal results of the new modality were determined. The base case evaluated was that of 60‐year‐old men with severe intermittent claudication and assumed an incremental cost‐effectiveness threshold of 100,000 US dollars per QALY. RESULTS: If treatment were limited to angioplasty, a new imaging modality would be cost‐effective if the costs were 300 US dollars and the sensitivity was 85%, even if up to 35% of patients needed additional work‐up. When both angioplasty and bypass surgery were considered as treatment options, a new imaging modality was cost‐effective if the costs were 300 US dollars, the sensitivity was higher than 94%, and 20% of patients required additional work‐up. CONCLUSION: Multi‐detector row CT angiography, as compared with currently used imaging modalities such as MR angiography, has the potential to be cost‐effective in the evaluation of patients with intermittent claudication.
Wicky, S., C. M. Fan, et al. (2003). "MR angiography of endoleak with inconclusive concomitant CT angiography." AJR Am J Roentgenol 181(3): 736‐738.