cryogenic carbon capture development · 2018-12-03 · background • ses developed the cryogenic...
TRANSCRIPT

Cryogenic Carbon Capture Development
2018 NETL CO2 Capture ConferenceAugust 13-17, 2018
Larry Baxter,1,2 Kyler Stitt,1 Chris Russell,2 and Daisy Harmon2
1Sustainable Energy Solutions2Brigham Young University

Outline• Project Background• Process, Energy, Economics Overview• Field Test Summary• Robust Unit Operations Review• Next Steps
2

Background• SES developed the Cryogenic Carbon Capture™ process under
separate funding to the stage of a 1 tonne/day skid-scale system that has been widely tested in house and in the field.
• DOE/NETL is funding the further development of unit operations in the existing skid to improve reliability and related issues that became apparent during the testing and updated TEA. (DE-FE0028697; $3.7M DOE/$4.7M total; 10/01/2016 – 03/31/2019)
• This presentation summarizes progress on the DOE-funded project.• The culmination of this project is a 6-month field test (3 months
under DOE funding) of the improved skid at a utility power plant, which starts 10/2018.
3

CCC is a Simple Process
4
The CCC process (1) cools a dirty exhaust gas stream to the point that the CO2 freezes using mostly heat recuperation, (2) separates solid CO2 as it freezes from the clean gas, (3) melts the CO2 through heat recuperation and pressurizes it to form a pure liquid, and
(4) warms up the clean, harmless gas releasing it to the atmosphere. See appendix slides for more detailed flow diagrams.

Cryogenic Carbon Capture (CCC) Cuts Costs in Half
5
-Numbers based on NETL 2013 net 550 MW super critical pulverized coal plant-Integration includes energy and cost savings from steam cycle improvements and offsetting cost and energy requirements for SOX, NOX, and
Mercury controls. -Additional value and revenues could be gained from CO2 sales and energy storage.
$35
$14
$69
14%
11%
28%
0%
5%
10%
15%
20%
25%
30%
$0
$10
$20
$30
$40
$50
$60
$70
$80
CCC Base Case CCC with Plant Integration Current Technology (Amine)
$/Tonne AvoidedEnergy Penalty (Parasitic Load)

0.6
0.8
1
1.2
1.4
1.6
$30
$40
$50
$60
$70
$80
$90
0% 5% 10% 15% 20% 25%
Ener
gy P
enal
ty (G
J/to
nne)
CAPE
X ($
/ton
ne/y
r)
Carbon Dioxide Concentration
CAPEX Energy Penalty
Cost and Energy with Composition
6
CAPEX numbers is the total equipment cost, not depreciated over any timeframe, and it does not includeoperating costs. These numbers assume large installations on the order of a power plant
NGCC Amine
Coal Amine

Cost and Energy with Plant Size
7
0.6
0.7
0.8
0.9
1
1.1
1.2
$0
$50
$100
$150
$200
$250
$300
0 500 1000 1500 2000 2500 3000 3500
Ener
gy P
enal
ty (G
J/to
nne)
CAPE
X ($
/ton
ne/y
r)
Carbon Dioxide (kT/yr)
CAPEX Energy Penalty
550 MWe Coal
CAPEX numbers is the total equipment cost, not depreciated over any timeframe, and it does not includeoperating costs. These numbers assume a CO2 composition of approximately 16% on a dry basis.
Pilot Plant
Industrial

Additional CCC Benefits• Bolt-on Retrofit• Grid-level Energy Storage• Multipollutant System• Low Water Demand• Highly Adaptable
8

9
Previous CCC Demonstrations• Fuels
– Coal– Natural gas– Biomass– Municipal Waste– Shredded Tires
• Field Tests– Power Utilities– Heat Plants– Cement Kilns– Pilot Combustion
Facilities
Thousands of cumulative hours of total testing.

Demonstration Pictures
10

CO2 used in concreteFebruary 6, 2018
CO2 captured from cementJanuary 22, 2018

12
Light Gas Path through System

13
Front End and Dryer- Commercially Available
Technologies, with promising Dryer Modifications

Water Vapor Pressure
14
1.E-111.E-101.E-091.E-081.E-071.E-061.E-051.E-041.E-031.E-02
-120 -100 -80 -60 -40 -20 0
Vapo
r Pre
ssur
e (b
ar)
Temperature (°C)
Process 1 Process 2 Ice
0
0.05
0.1
0.15
0.2
0 0.5 1
Pres
sure
(bar
)
Liq/Vap Mole Frac
Prediction Data

15
Multi-StreamHeat Exchanger
- Commercially AvailableIn Partnership with
Chart Industries

16
Direct Contact Desublimating
Heat Exchanger

17
Spray Tower Selected as Main HX• Easiest to scale• Most similar to commercial
processes• Lowest pressure drop• Most tested desublimating
heat exchanger
17

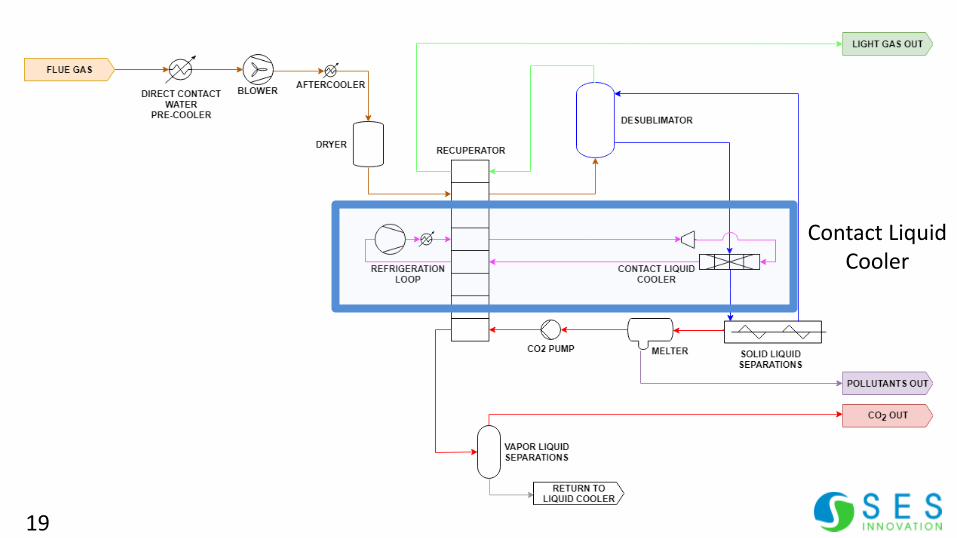
18
Desublimating Heat Exchangers• Spray tower has been
proven, including on-site with real flue gas sources
• CO2 capture above 90%, and can be increased up to 99% easily
• Average capture above 98% in tests at Alabama
19
Contact LiquidCooler

20
Contact Liquid Cooling Heat ExchangersUsed to cool the recirculating contact liquid without fouling
Self-cleaning Shell-and-tubeParticle Based Fluidized Bed
Custom Designed Brazed Plate HX with Patented Clearing Mechanisms
21
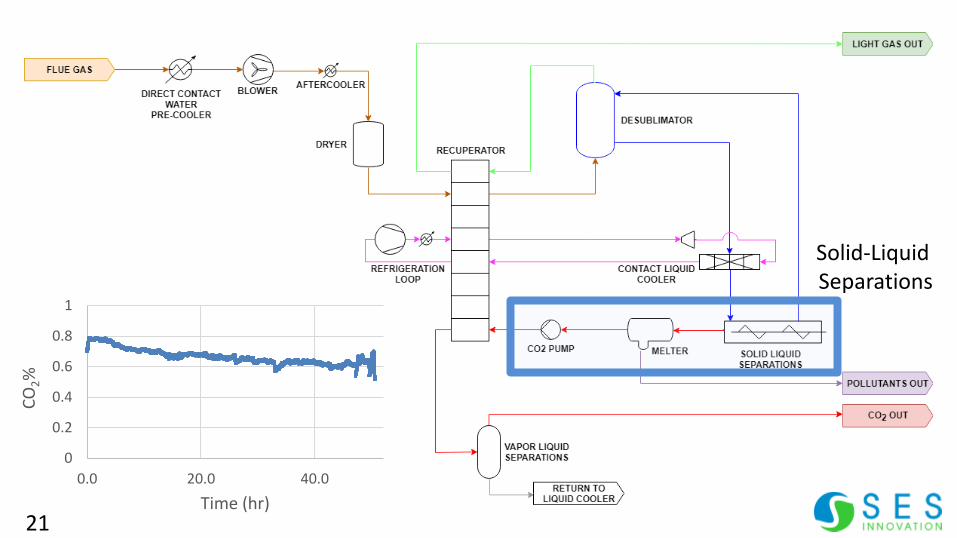
Solid-Liquid Separations
0
0.2
0.4
0.6
0.8
1
0.0 20.0 40.0
CO2%
Time (hr)

22
Solid-Liquid Separations• Increases the
concentration of solid CO2 before melting
• Current implementation is a screw press filtration system

Videos
Solid CO2 separation: https://youtu.be/9ZzIlBA3y9I
Solid CO2 melting: https://youtu.be/Qomy8H8cX00
23
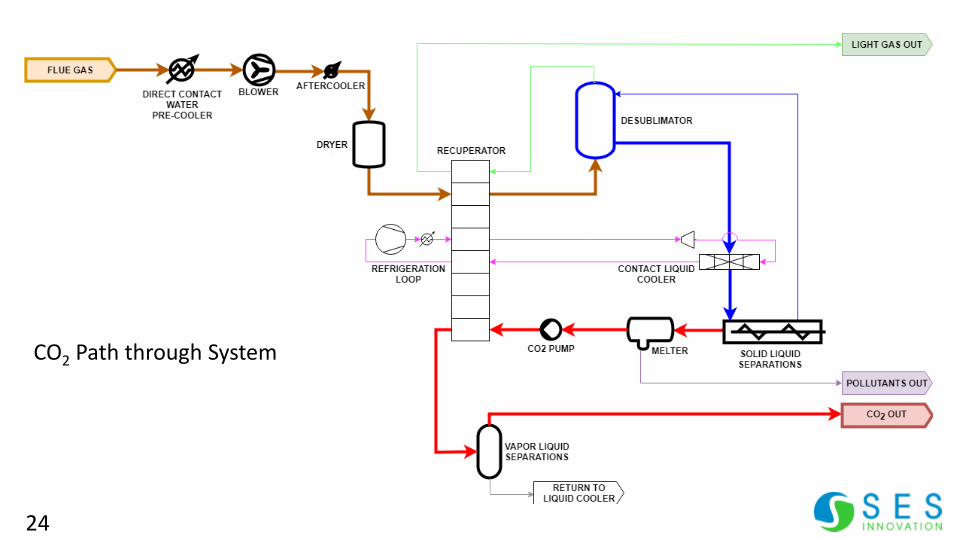
24
CO2 Path through System

25
Final CO2 Purification- Commercially Available- 99.99%+ CO2 purity and
high purity contact liquid
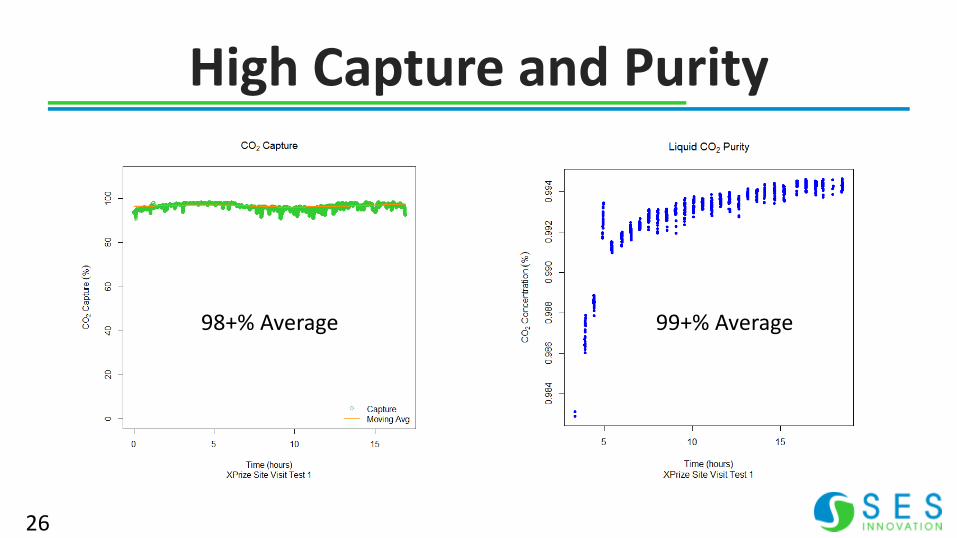
26
High Capture and Purity
98+% Average 99+% Average

Current Status• Thousands of cumulative hours for the system
and individual unit operations• Consistently demonstrated high rate of capture• Preliminary designs and quotes in place for larger
pilot scale system• Next step: six-month demonstration at Pacificorp
power plant
27

Next Step: $25M Pilot Project
28
Objective: Demonstrate industrial reliability and
validate commercial-scale economics
First commercial-scale (100 TPD CO2 liquid) demonstration
Design and engineering to begin first half of 2019

Acknowledgements• DOE/NETL Project No. DE-FE0028697
– $3.7M DOE/$4.7M total– 10/01/2016 – 03/31/2019
• Lynn Brickett and David Lang of DOE• SES Employees• Partners – Pacificorp, EPRI
29

30
This material is based upon work supported by the Department of Energy under AwardNumber DE-FE0028697.
This report was prepared as an account of work sponsored by an agency of the UnitedStates Government. Neither the United States Government nor any agency thereof, norany of their employees, makes any warranty, express or implied, or assumes any legalliability or responsibility for the accuracy, completeness, or usefulness of anyinformation, apparatus, product, or process disclosed, or represents that its use wouldnot infringe privately owned rights. Reference herein to any specific commercial product,process, or service by trade name, trademark, manufacturer, or otherwise does notnecessarily constitute or imply its endorsement, recommendation, or favoring by theUnited States Government or any agency thereof. The views and opinions of authorsexpressed herein do not necessarily state or reflect those of the United StatesGovernment or any agency thereof.