cryogenic carbon capture development library/research/coal/carbon capture... · cryogenic carbon...
TRANSCRIPT

Cryogenic Carbon CaptureDevelopment
DOE Award No. DE-FE0028697
Project Kick-Off MeetingNETL Pittsburgh
Larry Baxter, PIKyler Stitt, Project Manager
December 9, 2016

Presentation Outline• Introduction to SES• CCC technology background• Project objectives• Project team/project organization• Technical approach/project scope• Project schedule and associated milestones• Decision points and success criteria• Project budget• Project risks/risk management
2

3
Sustainable Energy Solutions
Founded in Early 2008
Support From
• Brigham Young University
• DONG Energy
• Clean Coal Task Force (Wyoming)
• ARPA-E
• CCEMC (Canada)
Headquarters in Orem, UT
4
The SES Team
Andrew Baxter, CEO/Cofounder
• Two successful startups
• Led company for past 7-years
• MBA, Rice University
Dr. Larry Baxter, Technical Director/Cofounder
• 30+ years in energy research
• Inventor on 7 CCS patents
Ten permanent engineers• 2 PhD, 4 Masters• BYU, Univ. of Utah, Stanford• Strong track record in innovation
Advisory Board• Carl Bauer- Past director NETL,
top 25 power industry• Vernon Rice- VP and GC DuPont• Bill Carlson- 35+ power projects

5
Lab Validation
2008
Bench Testing
2009-2012
Initial Skid Testing
2012-2016
CCC Development
2016-2019
Pilot2018-2020
Cryogenic Carbon Capture
Successfully tested two versions of process at “Skid-Scale” (~1 tonne/day CO2) on multiple sources
Working on long-term on-site testing during CCC-Dev project
Eleven patents filed (six issued) and many more in process
About $15 million in project funding to date

6
CCC TECHNOLOGY BACKGROUND
6

Carbon Capture Not Affordable Today
7
CCS [carbon capture and storage] is necessary for the achievement of EU’s targets for cutting greenhouse gases… The
main barrier…high initial cost.-WSJ/London School of Economics
“billions of tons of CO2 can be permanently sequestered…However, today’s capture technologies are not
cost-effective”
-US Department of Energy

Cryogenic Carbon Capture (CCC) Cuts Costs in Half
8
*energy and cost savings from integration with steam cycle and offsetting cost and energy requirements for SOX, NOX, and Mercury controls. Additional savings and revenues could be gained from CO2 sales and energy storage. Cost and energy numbers include compression. Amine numbers from NETL 2013
$69
$35
$14
28%
14%
11%
0%
5%
10%
15%
20%
25%
30%
$0
$10
$20
$30
$40
$50
$60
$70
$80
Current Technology (Amine) CCC Base Case CCC-Achievable with PlantIntegration
$/Tonne Avoided
Energy Penalty (Parasitic Load)50%+ savings over alternative

9
Further Cost and Energy Analysis
0%
5%
10%
15%
20%
25%
30%
$0
$10
$20
$30
$40
$50
$60
$70
$80
CCC-ECLBase Case
With SteamCycle
Integration
SOx CaptureOffset
NOx CaptureOffset
CummulativePotentialBenefit
NETL 2013Amine for
Comparison
$/Tonne Avoided Parasitic Load

CCC has Additional, Unique Advantages
Widely deployable (NGCC, cement, IGCC, refineries, etc.)
Easily retrofitted to existing plants
95%+ Capture
Option of grid-scale energy storage*
Multi-pollutant capture (SOX, NOX, Hg)
*see appendix slide for details

11
CCC Separates and Pressurizes CO2
CCC separates CO2 from plant exhaust and prepares it for storage or utilization
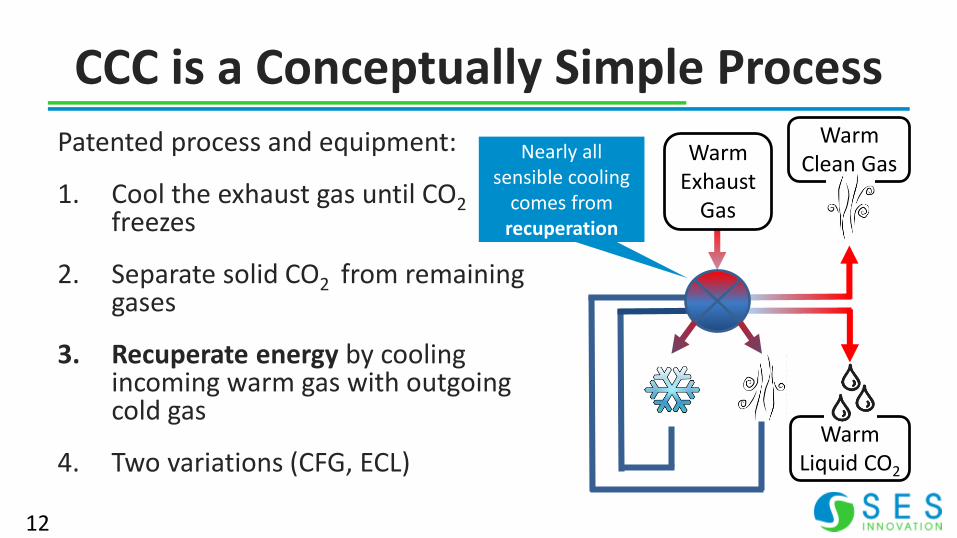
CCC is a Conceptually Simple Process
Patented process and equipment:
1. Cool the exhaust gas until CO2freezes
2. Separate solid CO2 from remaining gases
3. Recuperate energy by cooling incoming warm gas with outgoing cold gas
4. Two variations (CFG, ECL)
12
Warm Liquid CO2
WarmClean GasWarm
Exhaust Gas
Nearly all sensible cooling
comes from recuperation

13
Basic Principles
T
Distance or Q
ΔT1
ΔT2
ΔT1 suffices to drive a process that produces a product
near its initial temperature, far less cooling than a
traditional refrigeration cycle requires.
ΔT2 corresponds to traditional refrigeration
Condensing
Heat Exchanger
Compressor Expansion
Flue Gas
Dry Gas
Moisture
Solid CO2 Stream
SO2, NO2, Hg, HCl, etc.
Heat
Exchanger
Solid-gas
SeparatorSeparator
N2-rich Steam
Gaseous N2-rich Stream
Solids Compressor
Liquid Pump
Pressurized Liquid CO2 Stream
Solid CO2 Bypass
Small Ext.
Refrigeration Loop

Actual Gas Temperature Profiles
14
15
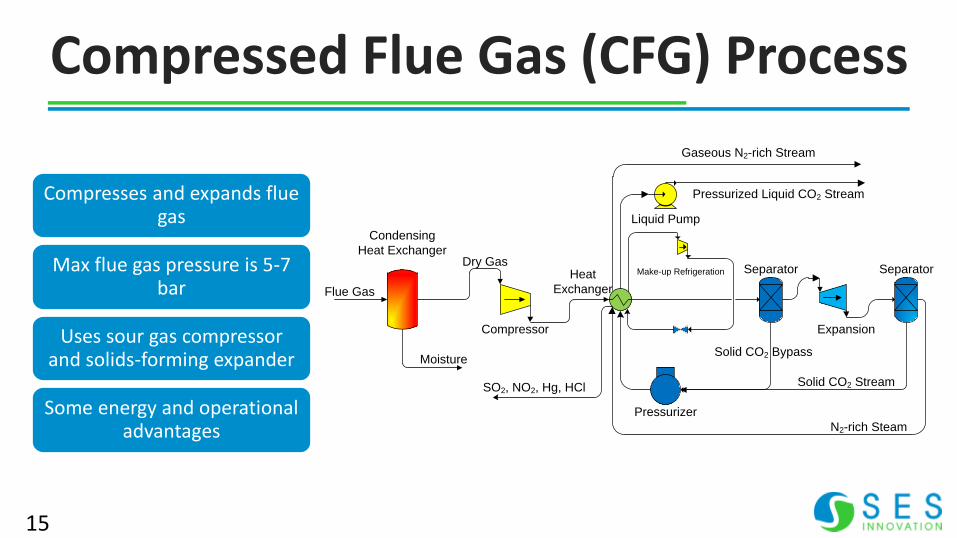
Compressed Flue Gas (CFG) Process
Condensing
Heat Exchanger
Compressor Expansion
Flue Gas
Dry Gas
Moisture
Solid CO2 Stream
Heat
Exchanger
Separator
N2-rich Steam
Gaseous N2-rich Stream
Pressurizer
Liquid Pump
Pressurized Liquid CO2 Stream
Separator
Solid CO2 Bypass
Make-up Refrigeration
SO2, NO2, Hg, HCl
Compresses and expands flue gas
Max flue gas pressure is 5-7 bar
Uses sour gas compressor and solids-forming expander
Some energy and operational advantages

16
External Cooling Loop (ECL) Process
Flue gas remains at atmospheric pressure
Lower capex than CFG: no sour-gas compressor or solids-
forming expander required
Capable of energy storage for load leveling and renewables
integration on the grid
Heat Exchanger
And Dryer
Flue Gas
Water
SO2, NO2, Hg, HCl
Heat
RecoverySolid
Separation
Solid
Compression
Pump
Pressurized, Liquid CO2
Heat
Recovery
ExpansionRefrigeration Loop
N2-rich Light Gas
Compression
Ambient Heat Exchange

Patented Heat Exchanger Captures Solid CO2
17

Videos
• Solids separation: https://youtu.be/9ZzIlBA3y9I
• Solids melting: https://youtu.be/MFX0jUjIPLw
18

Two-Minute Descriptive Video
19
https://www.youtube.com/watch?v=6kZ6EyI_iBc
Short video was produced by Brigham Young University where initial research was done on the process. Sustainable Energy Solutions currently owns all intellectual
property related to the CCC process.

Pictures of Skid-Scale Testing
20

Cement Plant
21

CO2 Field-Test data
22
0%
20%
40%
60%
80%
100%
CO
2 C
aptu
re %
24 Hours
Over 95% average capture at commercial coal plant
Noise due to instrumentation

Pollutant Removal

NOX Field Test Data
24
20%
30%
40%
50%
60%
70%
80%
90%
100%
NO
Cap
ture
24 Hours

SOX Capture Data
25
80%
85%
90%
95%
100%
105%
4-hours
% CO2 Removed% SO2 Removed
Over 99% average capture
SO2 noise due to instrumentation sensitivity at low levels

26
Mercury
Emissions from CCC are less than 1 PPT
This represents less mercury than was in the air when it entered the power plant

A Platform of CO2 Treating Technologies
27
Post-Combustion Carbon Capture
Liquefied NG Treating
NG Liquids Treating
NG Pipeline Treating
Cryogenic Carbon Capture (CCC), can remove CO2 from almost any stationary gas source.

Project Objectives• Increase the reliability, efficiency, and scalability of the Cryogenic Carbon
Capture™ (CCC) process and prepare it for a pilot demonstration. • Objective of Budget Period 1
– Improve key areas of the process through iterative design and experiment, culminating with a recommendation for improvements to be integrated in the large existing skid-scale system developed under non-federal funding called the CCC external cooling loop (CCC-ECL™) system.
• Objective of Budget Period 2 – Integrate the recommended improvements into the CCC-ECL™ system and
confirm their contributions through experimental process testing. Modeling and estimation improvements will improve the techno-economic analyses.
28

CCC Development Project Organizational Chart
29
Sustainable Energy SolutionsLarry Baxter
Principal Investigator
Kyler StittProject Manager
DOE-NETLDavid Lang
Project Manager
BYULarry Baxter
Professor
Christopher RussellGraduate Student
EPRIAbhoyjit Bhown
Technical Executive
Adam BergerR&D Analyst
Tri-StateShaun MannR&D Manager
Holly KrutkaSr R&D AnalystNicole Garcia
R&D Engineer
PacifiCorpIan Andrews
Director, Research Development
Glenn PinterichPlant Manager
Michael Burton
Engineer

Roles and Lead PersonnelOrganization Relationship Roles (Task #’s) Lead Personnel
Sustainable
Energy Solutions
Prime Recipient Manage and participate in all tasks.
Primary responsibility for project
management (1), unit ops evaluation
and selection (2, 3, 4, 5, 6, 7, 8),
techno-economic analysis (9, 13),
skid modifications and preparations
(10), and operation and testing (11),
and quantifying improvements in the
skid system (12)
Kyler Stitt - Project
Manager
Larry Baxter – PI
Electric Power
Research
Institute (EPRI)
Contractor Will be primarily responsible for
independent evaluation of the
technology, specifically process
modeling and techno-economic
analysis (9, 13)
Abhoyjit Bhown –
Technical Executive
Brigham Young
University
Contractor Support for techno-economic
analysis (9, 13), and
thermochemistry modeling and
testing for dissolved carbon dioxide
and multipollutant capture (3, 8)
Larry Baxter –
Professor
Tri-State Contractor Primarily responsible for the EH&S
Risk Assessment (14) and support for
the techno-economic analysis (9, 13)
Holly Krutka – Senior
Research and
Development Analyst
Pacificorp Host Site Primarily responsible for preparation
of the host site (10)
Ian Andrews – Dir.
Resource
Development
30

31
BUDGET PERIOD 1 APPROACH AND SCOPE
31

Task 2. Flue Gas Drying - Technical Approach
• Adsorption
• Phase Change Drying
• Alternative Techniques
32

Task 3. Dissolved Carbon Dioxide – Technical Approach
• Mitigate potential HX fouling– Pressure and temperature variation
• Alternative heat exchangers– Fluidized particle self-cleaning HX
– Shell-and-tube, also exploring cleaning technologies
– Fluidized Bed without contact liquid
– Modifications to existing heat exchangers
33

Task 4. Solid-Liquid Separations – Technical Approach
• Alternative solid-liquid separations units– Enhanced Screw Press
– Rotating cylinder compression
– Pre-filtering including hydrocyclones and vibration filters which increase overall efficiency
34

Task 5. Heat Exchanger Testing – Technical Approach
• Heat Exchanger Comparison– Bubbler – Existing HX in both single and multi-stage
forms– Spray Tower – Tested at smaller scale, we will be
doing a design overhaul and development of system that can work at any scale
– Fluid Bed
• Figures of Merit– Footprint– Pressure Drop– Complications to the balance of the process
35

Task 6. Instrumentation and Controls
• Improving on the following areas– Solids loading in the slurry– CO2 content in the melter– Pressure drop across the solids separator into the
melter.
• Figures of merit– Amount of operator attention/intervention required– Ability to follow flow transients and upsets
36

Task 7. Light Gas Dispersal – Technical Approach
• Theoretical and experimental work to determine safe methods for dispersal
• Modeling matching heat source streams
37

Task 8. Multi-Pollutant Capture – Technical Approach
• Improve predictive capability for SO2, NO, NO2, Mercury, PM10, and HCl
• Aspen and in-house models with validation using Cryogenic Unit Bench (CUB) and in-house analyzers
38

Task 9. Techno-Economic Analysis – Approach
• Will work closely with NETL and other project team members (EPRI, Tri-State, BYU)
• Based upon computer modeling following best practices, as implemented in the various NETL reports on carbon capture and as supplemented by utility and industrial experts experienced in such analyses
• Discussion of differences depending on the loan and ownership structure of the utility
• Energy penalties - calculated using in-house modeling software
• Cost analyses
– Include an analysis that uses NETL installation factors, costs of capital, fees, etc. for direct comparison to other published NETL results
– Some of our project team members use more specific and significantly different factors
– Effective cost of capital differ markedly among institutions and affect the projected economics
– Will include analyses pertinent to some of our project team members in this activity
39

40
BUDGET PERIOD 2 APPROACH AND SCOPE
40

Task 10. Skid Modification – Technical Approach
• Will incorporate the technologies selected in Budget Period 1 into the skid and shakedown the resulting systems in preparation for long-term, in-house and field testing
• Shakedown testing will include unit and full-skid testing of the modified CCC-ECL™ skid
• These tests will include a variety of inlet gas conditions to test the updated controls, valves, unit operations, and process monitoring devices
• Tests will last from a few minutes to over 10 hours to ensure that all modifications to the system are correct and robust.
41

Task 11. Skid Operation – Technical Approach
Subtask 11.1 Test PlanSubtask 11.2 Host Site Agreement
– coordinating with PacifiCorp or other host site
Subtask 11.3 Operation– Operating the improved CCC system for 500
continuous hours at 1 tonne/day conditions– In-house testing and field testing of the unit will occur,
with in-house using mixed N2/O2/CO2 gases
42

Task 12. Quantify System Figures of Merit
• BP1 develops individual unit ops figures of merit• This task quantifies improvement in system figures of merit• Provides summary information on these improvements• Will include projected improvements compared to realized
improvements in:– Efficiency– Robustness– Scalability
43

Task 13. TEA – Technical Approach
• Objective is to quantify theoretical improvements based on:
– Improvement to units ops in BP1
– Results of in-house and field testing in BP2
• Continuation of previous period, and will use similar analysis methods
44

Task 14. EH&S Risk Assessment – Technical Approach
• Work with Tri-State to develop formal safety assessment• Elements of EH&S Assessment
1) All potential ancillary or incidental air and water emissions, and solid wastes identified
2) Description of various toxicological effects of the substances in above
3) Properties related to volatility, flammability, explosivity, etc4) Compliance and regulatory implications5) Engineering analysis of potentially hazardous materials6) Precautions for safe handling and conditions for safe storage
45

CCC Dev Gantt ChartStart Date End Date Cost
Task 1. Project Management and Planning 10/1/2016 3/31/2019 $190,164.65
Subtask 1.1 Project management 10/1/2016 3/31/2019
Milestone 1.1 Submit management plan 10/31/2016 10/31/2016
Milestone 1.2 Complete project kick-off meeting 12/9/2016 12/9/2016
Subtask 1.2 Briefings and reports 10/1/2016 3/31/2019
Subtask 1.3 Host site coordination 10/1/2016 3/31/2019
Task 2. Drying 10/1/2016 9/30/2017 $35,929.59
Milestone 2.1 Select drying approach 3/31/2017 3/31/2017
Task 3. Dissolved Carbon Dioxide 10/1/2016 9/30/2017 $546,176.67
Milestone 3.1 Select solubility approach(es) 3/31/2017 3/31/2017
Milestone 3.2 Solubility Equipment Ordered and Received 6/30/2017 6/30/2017
Task 4. Solid Liquid Separations 10/1/2016 9/30/2017 $577,502.33
Milestone 4.1 Select solid–liquid separation approach(es) 12/31/2016 12/31/2016
Task 5. Heat Exchanger Testing 10/1/2016 9/30/2017 $456,530.78
Milestone 5.1 Select experimental heat exchanger approach(es) 3/31/2017 3/31/2017
Milestone 5.2 Receive experimental heat exchanger equipment 6/30/2017 6/30/2017
Task 6. Instrumentation and Controls 10/1/2016 9/30/2017 $596,206.44
Task 7. Light Gas Dispersal 4/1/2017 9/30/2017 $22,664.07
Milestone 7.1 Select light-gas dispersal approach 6/30/2017 6/30/2017
Task 8. Multipollutant Capture 10/1/2016 9/30/2017 $108,801.65
Milestone 8.1 Complete validation of simulator with
comprehensive pollutant description9/30/2017 9/30/2017
Task 9. Phase 1 Techno-Economic Analysis 10/1/2016 9/30/2017 $122,507.04
Milestone 9.1 Demonstrate simulator with new unit ops 3/31/2017 3/31/2017
Milestone 9.2 Complete techno-economic analysis including skid
simulation with new processes validated at UO level9/30/2017 9/30/2017
Task 10. Skid Modification and Shakedown 10/1/2017 9/30/2018 $1,158,993.10
Milestone 10.1 Finalize plans to modify skid 12/31/2017 12/31/2017
Milestone 10.2 Complete skid modifications 8/31/2018 8/31/2018
Milestone 10.3 Complete skid shakedown testing 9/30/2018 9/30/2018
Task 11. Skid Operation 4/1/2018 3/31/2019 $739,010.26
Subtask 11.1 Test Plan 4/1/2018 9/30/2018
Milestone 11.1 Finalize test plan 9/30/2018 9/30/2018
Subtask 11.2 Host site agreement 4/1/2018 9/30/2018
Milestone 11.2 Finalize host site agreement 9/30/2018 9/30/2018
Subtask 11.3 Operation 10/1/2018 3/31/2019
Milestone 11.3 Complete skid testing 3/31/2019 3/31/2019
Task 12. Quantify System Figures of Merit 10/1/2017 3/31/2019 $76,877.87
Milestone 11.1 Finalize figures of merit definition 12/31/2017 12/31/2017
Milestone 11.2 Demonstrate figures of merit 3/31/2019 3/31/2019
Task 13. Phase 2 Techno-Economic Analysis 10/1/2017 3/31/2019 $160,714.31
Milestone 13.1 Complete techno-economic analysis 3/31/2019 3/31/2019
Task 14. Environmental Health and Safety 12/31/2017 3/31/2019 $92,269.17
Milestone 14.1 Complete EH&S risk assessment 3/31/2019 3/31/2019
Q5 Q6 Q9 Q10Q2 Q7 Q8
10/1/2016-9/30/2017
Budget Period 1 Budget Period 2
10/1/2017-3/31/2019
Q1 Q3 Q4

BP1 MilestonesBudget
PeriodID
Task
NumberDescription
Planned
Completion DateVerification Method
1 1 Submit Project Management Plan 10/31/2016 Project Management Plan submitted to NETL/DOE
1 1 Complete project kick-off meeting 12/9/2016In person kick-off meeting for project; project kick-off meeting slides
submitted to NETL/DOE
1 2 Select drying approach 3/31/2017 First conceptual plan submitted in Quarterly Report to NETL/DOE
1 3 Select solubility approach(es) 3/31/2017 Finalized conceptual plan submitted in Quarterly Report to NETL/DOE
1 3 Solubility equipment ordered & received 6/30/2017Receipt of solubility equipment documented in Quarterly Report to
NETL/DOE
1 4 Select solid–liquid separation approach(es) 12/31/2016 Finalized conceptual plan submitted in Quarterly Report to NETL/DOE
1 5 Select heat exchanger approach(es) 3/31/2017 Finalized conceptual plan submitted in Quarterly Report to NETL/DOE
1 5 Receive experimental heat exchanger equipment 6/30/2017Receipt of heat exchanger equipment documented in Quarterly Report
to NETL/DOE
1 7 Select light-gas dispersal approach6/30/2017
Finalized conceptual plan submitted in Quarterly Report to NETL/DOE
1 8Complete validation of simulator with
comprehensive pollutant description9/30/2017 Simulation results submitted in Quarterly Report to NETL/DOE
1 9 Demonstrate simulator with new unit ops 3/31/2017 Simulation results submitted in Quarterly Report to NETL/DOE
1 9Complete techno-economic analysis including skid
simulation with new processes validated at UO level9/30/2017 Techno-Economic Analysis Report submitted to NETL/DOE
47

BP2 Milestones2 10 Finalize plans to modify skid 12/31/2017
Designs of new unit ops submitted in Quarterly
Report to NETL/DOE
2 10 Complete skid modifications 8/31/2018Details of skid modification submitted in Quarterly
Report to NETL/DOE
2 10 Complete skid shakedown 9/30/2018Test results and any resulting skid modifications
submitted in Quarterly Report to NETL/DOE
2 11 Finalize test plan 9/30/2018Details of test plan submitted in Quarterly Report
to NETL/DOE
2 11 Finalize host site agreement 9/30/2018Details of host site agreement submitted in
Quarterly Report to NETL/DOE
2 11 Complete skid testing 3/31/2019Field testing results submitted in Quarterly Report
to NETL/DOE
2 12 Figures of merit definition finalized 12/31/2017Definition of figures of merit submitted in
Quarterly Report to NETL/DOE
2 12 Demonstrate figures of merit 3/31/2019Figures of merit submitted in Quarterly Report to
NETL/DOE
2 13 Complete techno-economic analysis 3/31/2019Techno-Economic Analysis Report submitted to
NETL/DOE
2 14 Complete EH&S risk assessment 3/31/2019EH&S Risk Assessment Report submitted to
NETL/DOE
48

Budget Period 1 Success CriteriaDrying Verified solution which will reduce the dewpoint temperature of the flue
gas to a maximum of -70 C with a total parasitic load increase of less than .247 GJ/tonne CO2, while still maintaining over 90% CO2 capture
Dissolved CO2 Parasitic load from solution to dissolved CO2 less than .1 GJ/tonne CO2 captured
Solid-Liquid Separations
Demonstration of experimental solid-liquid separations system with the system achieving 70 wt% of solid CO2 in the effluent stream at ½ tonne/day CO2 captured for a minimum 50-hour test runSolution should not increase the overall parasitic load more than .1 GJ/tonne CO2
Heat Exchanger Final heat exchanger design that will be incorporated demonstrated at a minimum ½ tonne/day at above 90% CO2 capture for 50-hour test run
Light Gas Dispersal Dispersal technique that is approved by a certified Safety Engineer

Budget Period 2 Success CriteriaDemonstration Unit
Demonstration Unit - 500 Hour continuous run at 1 tonne/day CO2 flowrate at 90% CO2 capture
Techno-Economic Analysis
Finalized techno-economic analysis for full scale system that has been thoroughly reviewed by sub-contractors reflecting a parasitic load of less than 1.1 GJ/tonne CO2 captured

BP1 Success Criteria - Drying
• Verified solution which will reduce the dewpoint temperature of the flue gas to a maximum of -70 C with a total parasitic load increase of less than .247 GJ/tonne CO2, while still maintaining over 90% CO2 capture

BP1 Success Criteria – Dissolved CO2
• Experimentally demonstrate solution that reduces the parasitic load to less than .1 GJ/tonne CO2

BP1 Success Criteria – Solid-Liquid
• Demonstration of experimental solid-liquid separations system with the system achieving 70 wt% of solid CO2 in the effluent stream at ½ tonne/day CO2 captured for a minimum 50-hour test run
• Solution should not increase the overall parasitic load more than .1 GJ/tonne CO2

BP1 Success Criteria - HX
• Final heat exchanger design demonstrated at a minimum ½ tonne/day at above 90% CO2 capture for 50-hour test run
54
BP1 Success Criteria – Light Gas Dispersal
• Dispersal technique that is approved by a certified Safety Engineer
55

BP2 Success Criteria - Demonstration
• Demonstration Unit - 500 hour continuous run at 1 tonne/day CO2 flowrate
• Demonstration at over 90% capture
56

BP2 Success Criteria - TEA
• Finalized techno-economic analysis for full scale system that has been thoroughly reviewed by sub-contractors reflecting a parasitic load of less than 1.1 GJ/tonne CO2
captured at full scale and at 90% Capture
• Cost of less than $40/tonne CO2
57

58
BUDGET
58

Project Funding Profile
59
Government Cost Government Cost Government Cost
Share Share Share Share Share Share
SES $1,422,662 $996,100 $2,169,883 $0 $3,592,545 $996,100
BYU $15,000 $0 $25,000 $0 $40,000 $0
Tri-State Generation
and Transmission$0 $28,000 $0 $42,000 $0 $70,000
Electric Power
Research Institute
(EPRI)$50,919 $34,497 $59,785 $40,503 $110,704 $75,000
Total $1,488,581 $1,058,597 $2,254,668 $82,503 $3,743,249 $1,141,100
Cost Share 42% 4% 23%
10/1/2017-3/31/201910/1/2016-9/30/2017
Budget Period 1 Budget Period 2 Total Project
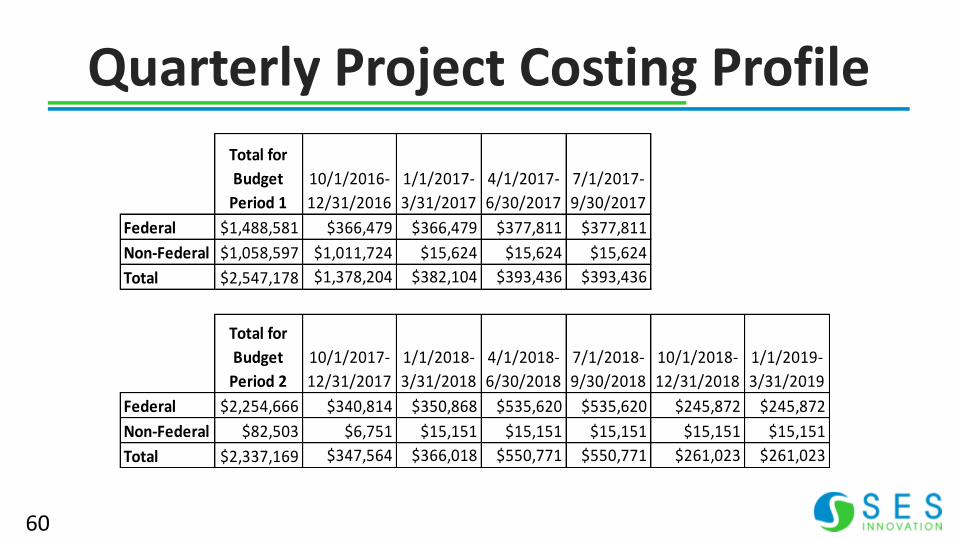
Quarterly Project Costing Profile
60
Total for
Budget
Period 1
10/1/2016-
12/31/2016
1/1/2017-
3/31/2017
4/1/2017-
6/30/2017
7/1/2017-
9/30/2017
Federal $1,488,581 $366,479 $366,479 $377,811 $377,811
Non-Federal $1,058,597 $1,011,724 $15,624 $15,624 $15,624
Total $2,547,178 $1,378,204 $382,104 $393,436 $393,436
Total for
Budget
Period 2
10/1/2017-
12/31/2017
1/1/2018-
3/31/2018
4/1/2018-
6/30/2018
7/1/2018-
9/30/2018
10/1/2018-
12/31/2018
1/1/2019-
3/31/2019
Federal $2,254,666 $340,814 $350,868 $535,620 $535,620 $245,872 $245,872
Non-Federal $82,503 $6,751 $15,151 $15,151 $15,151 $15,151 $15,151
Total $2,337,169 $347,564 $366,018 $550,771 $550,771 $261,023 $261,023

Budget Period/Fiscal Year Project Costing
61
Federal Share Non-Federal Share
1 FY2017 SES $1,422,662.00 $996,100.00
2 FY2018 SES $1,446,588.67 $0.00
2 FY2019 SES $723,294.33 $0.00
1 FY2017 BYU $15,000.00 $0.00
2 FY2018 BYU $16,666.67 $0.00
2 FY2019 BYU $8,333.33 $0.00
1 FY2017Tri-State Generation
and Transmission$0.00 $28,000.00
2 FY2018Tri-State Generation
and Transmission$0.00 $28,000.00
2 FY2019Tri-State Generation
and Transmission$0.00 $14,000.00
1 FY2017 EPRI $50,919.00 $34,497.00
2 FY2018 EPRI $39,856.67 $27,002.00
2 FY2019 EPRI $19,928.33 $13,501.00
Planned CostsPerforming
Organization
Fiscal Year (year in which
the cost will be incurred,
not appropriated)Budget Period

62
RISK ANALYSIS
62

Technical RisksRisk Description Probability
(Low,
Moderate,
High)
Impact (Low,
Moderate,
High)
Risk Management Mitigation and Response Strategies
Operating desublimating
HX: Fouling, plugging
Low High Camera inside HX to observe conditions, ability to vary inlet temperatures and
flowrates to flush solids buildup
Operating desublimating
HX: Liquid level upsets
Low Moderate Constant level monitoring with alarms, programmed controls to counteract upset,
liquid containment to stop overflow
Major equipment failure Low High Purchase high-quality equipment, follow maintenance schedules, regular review of
equipment performance
Sensing & control failures Moderate Moderate Redundant sensors when possible, built-in control warnings of problems
CO2 solubility solutions
difficult to implement at
this scale
Moderate Moderate Mitigation plans such as self-cleaning heat exchangers or a fluidized bed heat
exchanger which at this scale that may be less efficient than at larger (e.g., pilot- or full-
scale) scale, but will demonstrate the overall effect of the solubility solutions on system
Dryer: insufficient water
removal
Moderate High Designing a HX similar to the desublimating HX for water removal, increasing the inlet
gas pressure, adding an additional bank of mol-sieve dryers
Dryer: cost too high for
system implementation
Moderate High Implementing HX similar to desublimating HX for water removal
Dryer: footprint too large,
thus limiting field test sites
Low Moderate Negotiate for field test sites with ample ground for a larger-than-expected process
footprint
Dryer: pressure drop too
high
Low Moderate Over-sizing blower to ensure sufficient pressure
Solid–liquid separation
unreliable
Moderate Moderate Explore alternative separation system(s) that are not yet commercially mature under
these conditions

Additional RisksResource Risks
Reliance on 3rd-party
vendors, specifically the
difficulty of working with
vendors for first-of-its-
kind equipment
Moderate Moderate Get quotes from multiple vendors for equipment, allowing for fast
turnaround if a vendor can no longer provide the equipment, and have
back-ups for particularly sensitive pieces of equipment such as pumps in
case of failure
Coordination with solid–
liquid separations scaling
companies
Moderate Moderate Looking for additional partners, creating in-house capabilities
Management Risks
Loss of key personnel Low High SES works hard—and succeeds—at providing an attractive work
environment to help retain personnel. SES requires a thorough information
transfer from departing personnel to ensure our ability to continue work
on affected projects
IP risks Low Moderate Recently completed agreements with NewVistas Capital have substantially
addressed these issues and will allow for a broadening of the patent
portfolio

Appendix Slides
65
More than Carbon Capture
CCC provides for clean, affordable electricity from fossil fuels and can capture CO2, SOX, Mercury, and particulates in one process
CCC also allows for better use of renewables through grid-scale energy storage
In addition to CCC SES has other solutions under development.
• Cryogenic natural gas processing (gas sweetening, NGL, LNG)
• Dynamically responding heat exchangers
66

Energy Storing
67

Energy Storage Could Nearly pay For Carbon Capture
• An 800 MWe Coal plant with CCC stabilized +/-400 MWe supply swings from renewables
• 2.1-2.7 ¢/kWh in value compared with 2.5 ¢/kWh cost of CCC
• Using 12-months of real data from Southern California
68

Model Results• An 800 MWe power plant with CCC stabilized +/- 400 MWe grid
surges associated with periodic demand cycles and intermittent renewable availability with no need for spinning reserves or other supplementary power.
• Power demand cycles, wind availability, and general costs taken from actual grid data (southern California).
• 250 MWe surge in wind power that occurs in the evening, as power demand generally is in rapid decrease, was effectively absorbed by CCC and delivered the next day during peak power.
• Similar load following with coal being constant is possible, but requires larger storage tank and NG replacement rate.
69

Economic Bottom Line• Energy Storage Increases Net Revenue (Profit)
– 22-30% increase in profit with storage– Translates to an additional 2.1-2.7 ¢/kWh additional revenue
• CCC process costs comparable (2.3-3.1 ¢/kWh)• Additional benefits not included in these costs
– No need for backup power for wind and no price suppression from wind– Major equipment operates at essentially steady load, increasing useful lifetime and decreasing
unplanned shutdowns and scheduled and unscheduled maintenance.– Integrates diverse power sources effectively– Greatly increases the value of intermittent power sources– Enable permits– Decreases need for spinning reserve and peaking power (both very costly)
70