crack growth through the thickness of thin-sheet …
TRANSCRIPT

The Pennsylvania State University
The Graduate School
College of Earth and Mineral Sciences
CRACK GROWTH THROUGH THE THICKNESS
OF THIN-SHEET HYDRIDED ZIRCALOY-4
A Dissertation in
Materials Science and Engineering
by
Patrick A.C. Raynaud
2009 Patrick A.C. Raynaud
Submitted in Partial Fulfillment
of the Requirements
for the Degree of
Doctor of Philosophy
August 2009
The dissertation of Patrick A.C. Raynaud was reviewed and approved* by the following:
Arthur T. Motta
Professor of Nuclear Engineering and Materials Science and Engineering
Dissertation Co-Advisor
Co-Chair of Committee
Donald A. Koss
Professor Emeritus, Materials Science and Engineering
Dissertation Co-Advisor
Co-Chair of Committee
Christopher L. Muhlstein
Associate Professor of Materials Science and Engineering
Clifford J. Lissenden
Professor of Engineering Science and Mechanics
Kwai S. Chan
Institute Scientist, Southwest Research Institute
Gary L. Messing
Distinguished Professor of Ceramic Science and Engineering
Head of the Department of Materials Science and Engineering
*Signatures are on file in the Graduate School

ii
ABSTRACT
In recent years, the limits on fuel burnup have been increased to allow an increase
in the amount of energy produced by a nuclear fuel assembly thus reducing waste volume
and allowing greater capacity factors. As a result, it is paramount to ensure safety after
longer reactor exposure times in the case of design-basis accidents, such as reactivity-
initiated accidents (RIA). Previously proposed failure criteria do not directly address the
particular cladding failure mechanism during a RIA, in which crack initiation in brittle
outer-layers is immediately followed by crack growth through the thickness of the thin-
wall tubing. In such a case, the fracture toughness of hydrided thin-wall cladding
material must be known for the conditions of through-thickness crack growth in order to
predict the failure of high-burnup cladding.
The fracture toughness of hydrided Zircaloy-4 in the form of thin-sheet has been
examined for the condition of through-thickness crack growth as a function of hydride
content and distribution at 25°C, 300°C, and 375°C. To achieve this goal, an
experimental procedure was developed in which a linear hydride blister formed across the
width of a four-point bend specimen was used to inject a sharp crack that was
subsequently extended by fatigue pre-cracking. The electrical potential drop method was
used to monitor the crack length during fracture toughness testing, thus allowing for
correlation of the load-displacement record with the crack length. Elastic-plastic fracture
mechanics were used to interpret the experimental test results in terms of fracture
toughness, and J-R crack growth resistance curves were generated. Finite element
modeling was performed to adapt the classic theories of fracture mechanics applicable to
thick-plate specimens to the case of through-thickness crack growth in thin-sheet
materials, and to account for non-uniform crack fronts. Finally, the hydride
microstructure was characterized in the vicinity of the crack tip by means of digital image
processing, so as to understand the influence of the hydride microstructure on fracture
toughness, at the various test temperatures.
Crack growth occurred through a microstructure which varied within the
thickness of the thin-sheet Zircaloy-4 such that the hydrogen concentration and the radial

iii
hydride content decreased with increasing distance from the hydride blister. At 25°C, the
fracture toughness was sensitive to the changes in hydride microstructure, such that the
toughness KJi decreased from 39 MPa√m to 24 MPa√m with increasing hydrogen content
and increasing the fraction of radial hydrides. The hydride particles present in the
Zircaloy-4 substrate fractured ahead of the crack tip, and crack growth occurred by
linking the crack-tip with the next hydride-induced primary void ahead of it. Unstable
crack growth was observed at 25°C prior to any stable crack growth in the specimens
where the hydrogen content was the highest.
At 375°C as well as in most cases at 300°C, the hydride particles were resistant to
cracking and the resistance to crack-growth initiation was very high. As a result,, for this
bend test procedure, crack extension was solely due to crack-tip blunting instead of crack
growth in all tests at 375°C and in most cases at 300°C. The lower bound for fracture
toughness at these temperatures, the parameter KJPmax, had values of KJPmax~54MPa√m at
both 300°C and 375°C. For cases where stable crack growth occurred at 300°C, the
fracture toughness was KJi~58MPa√m and the tearing modulus was twice as high as that
at 25°C.
It is believed that the failure of hydrided Zircaloy-4 thin-wall cladding can be
predicted using fracture mechanics analyses when failure occurs by crack growth. This
failure mechanism was observed to occur in all cases at 25°C and in some cases at 300°C.
However, at more elevated temperatures, such as 375°C, failure will likely occur by a
mechanism other than crack growth, possibly by an imperfection-induced shear
instability.

iv
TABLE OF CONTENTS
LIST OF FIGURES ..................................................................................................... vi
LIST OF TABLES ....................................................................................................... xv
ACKNOWLEDGEMENTS ......................................................................................... xvi
Chapter 1 Introduction and Background ..................................................................... 1
1.1 Zirconium Nuclear Fuel Cladding .................................................................. 1 1.2 In-Service Microstructural Evolution ............................................................. 3 1.3 Reactivity Initiated Accidents (RIA) .............................................................. 7
1.4 Studies of Cladding Failure and Proposed Failure Criteria ............................ 9 1.4.1 Assessment of Cladding Failure Based on Strain Measurements ........ 12
1.4.1.1 Failure in the Absence of a Crack .............................................. 12 1.4.1.2 Failure Due to the Presence of a Crack ...................................... 16
1.4.2 Assessment of Cladding Failure Based on Strain-Energy-Density ...... 23
1.4.3 Assessment of Cladding Failure Based on Material Damage .............. 27 1.5 Fracture Toughness Studies on Cladding Materials ....................................... 34
1.6 Motivation for this Study ................................................................................ 56
Chapter 2 Materials and Experimental Procedures ..................................................... 59
2.1 Materials ......................................................................................................... 60 2.1.1 Microstructure and Texture .................................................................. 60
2.1.2 Flow Behavior ...................................................................................... 69 2.1.3 Hydrogen Charging .............................................................................. 74
2.2 Fracture Toughness Testing ............................................................................ 76
2.2.1 Test and Specimen Design ................................................................... 77 2.2.2 Pre-Cracking ......................................................................................... 79
2.2.3 Fracture Testing and Crack Length Monitoring ................................... 83 2.3 Hydride Microstructure Characterization ....................................................... 88
2.3.1 Metallography Procedures .................................................................... 88 2.3.2 Light Microscopy ................................................................................. 88
2.3.3 Hydrogen Content Measurement .......................................................... 92 2.3.4 Hydride Distribution Quantification ..................................................... 97
Chapter 3 Results and Discussion ............................................................................... 103
3.1 Fracture Mechanics Considerations ................................................................ 103 3.1.1 Elastic-Plastic Fracture Mechanics (EPFM) ........................................ 104
3.1.2 ASTM Standard Testing in Relation to this Study ............................... 109 3.2 Finite Element Modeling ................................................................................ 112
3.2.1 Validation of the Cast3M Code for Fracture Mechanics Modeling ..... 113

v
3.2.2 The η Parameter for Cracked Sheet ...................................................... 123 3.2.3 Modeling of Uneven Crack Fronts with the Franc3D Code ................. 132
3.3 Fracture Behavior ........................................................................................... 135 3.3.1 Crack Growth at 25°C .......................................................................... 136 3.3.2 Crack Extension at 300°C .................................................................... 148 3.3.3 Crack Extension at 375°C .................................................................... 157
3.4 Fracture Mechanics Interpretation of Test Results ......................................... 163
3.4.1 Fracture Toughness Behavior at 25°C .................................................. 164 3.4.2 Fracture Toughness Behavior at 300°C ................................................ 170 3.4.3 Fracture Toughness Behavior at 375°C ................................................ 173
3.4.4 The Influence of Hydrogen on Fracture Toughness ............................. 177 3.5 A Basis for a Criterion for RIA Cladding Failure .......................................... 191
Chapter 4 Conclusions and Recommendations for Future Work ............................... 195
4.1 Conclusions..................................................................................................... 195 4.2 Recommendations for Future Work ............................................................... 197
Bibliography ................................................................................................................ 200

vi
LIST OF FIGURES
Figure 1-1: Schematic orientation of hydrides in Zircaloy cladding [28] ................... 6
Figure 1-2: Hydride configurations in irradiated cladding: (a) hydride rim, (b)
hydride blister. Dark areas beneath blister and oxide are discrete sub-surface
hydride precipitates ............................................................................................... 7
Figure 1-3: Phenomena leading to cladding failure during a RIA [41] ...................... 9
Figure 1-4: (a) A fracture limit diagram for Zircaloy-2 sheet at four levels of
hydrogen. The major ε1 and minor ε2 principal strains in the plane of the
sheet at fracture are shown. (b) The equivalent strain to fracture εf for
Zircaloy-2 sheets containing either 150, 350, or 615 wt.ppm H as normalized
to (εf)21, at 21 wt.ppm H for the specified strain paths [42] ................................. 13
Figure 1-5: Macroscopic photographs of failures of (a) uniaxial tension ring
cladding specimen, where failure occurs across the width, and (b) plane-strain
tension cladding specimen, where failure occurs through the thickness [43]. ...... 14
Figure 1-6: (a) Comparison of calculated and measured hoop plastic strain to
failure, εθθf, for RX Zircaloy-2 and SRA Zircaloy-4 cladding. The thin dotted
lines are ±1ζ and ±2ζ uncertainty bands for the failure strain correlation. (b)
Best-estimate clad failure thresholds based on Jernkvist‟s model. The thin
light-gray lines are ±ζ uncertainty bands [50]. ..................................................... 16
Figure 1-7: Plane-strain fracture strain at room temperature and 300°C as a
function of hydride layer thickness [36] ............................................................... 17
Figure 1-8: The dependence of observed (Exp. Data) and predicted (lines)
fracture strains for CWSR Zircaloy-4 with 2mm or 3mm wide circular
hydride blisters at (a) 25°C and (b) 300°C [51]. ................................................... 18
Figure 1-9: Fracture profiles of (a) CWSR sheet with a 100 μm blister, (b) RX
with a 40 μm blister, (c) CWSR with a 35 μm blister, and (d) RX with an 80
μm blister. Test temperatures are indicated [51]. ................................................. 19
Figure 1-10: A comparison between the far-field failure strains in equal biaxial
tensile deformation (EBT) with those in plane-strain tensile deformation for
Zircaloy-4 sheet containing hydride blisters of different depths and tested at
(a) 25°C and (b) 300°C [54] ................................................................................. 20
Figure 1-11: EPFM simulations of hydride damage influence at 350°C [46]. ............ 22
Figure 1-12: (a) Modeling of cracked hydride particles; (b) strain concentration in
a ligament between two cracked hydrides; (c) tensile ductility predictions

vii
compared with experimental data; (d) fracture toughness predictions as a
function of cooling rate, as predicted by Chan‟s model to be applied to spent
fuel behavior [67, 68]. .......................................................................................... 28
Figure 1-13: (a) and (b): Prediction of crack opening displacement as a function
of mesh refinement and hydrogen content; (c) comparison of model behavior
with actual behavior using Grange et al.‟s modified GTN model: one should
note differences in boundary conditions. The images on the right-hand side
show experimental behavior. In load-displacement data, dots are
experimental data and line is the simulation result [70]. ...................................... 30
Figure 1-14: (a) and (b) Fan and Koss study: [42] void density as a function of
equivalent strain and failure loci as a function of hydrogen content and stress
state; (c) and (d) Grange et al. study: [70] void density as a function of
equivalent strain and failure loci as a function of hydrogen content and stress
state ....................................................................................................................... 31
Figure 1-15: Example of a broken assembly of 9 representative volume elements
(RVE), with the matrix in light gray and the hydrides in dark gray. One RVE
is highlighted [80]. ................................................................................................ 33
Figure 1-16: Crack plane identifications for (a) rectangular cross-sections and (b)
cylindrical and tubular cross-sections [81]. .......................................................... 35
Figure 1-17: Fracture toughness as a function of orientation and temperature for
Zircaloy-2. The correspondences of orientations with the ASTM standard go
as follows: RT=LS, WT=TS, WR=TL, RW=LT, TR=SL, TW=ST. The
fracture toughness values given in US units must be multiplied by ~1.1 to
obtain MPa√m (SI units) [85]. .............................................................................. 38
Figure 1-18: Fracture toughness as a function of radial hydride content as defined
by Honda for Zr-2.5Nb at room temperature [87]. ............................................... 40
Figure 1-19: Maximum load fracture toughness versus temperature for tube
containing radial hydrides. (a) Simpson and Chow: [H] = 90 wt.ppm for
unirradiated Zircaloy-2 and [H] = 200 wt.ppm for irradiated Zircaloy-2 [92]
(b) Davies et al.: HCC is the hydride continuity coefficient [93]. ........................ 42
Figure 1-20: Correlation of dJ/da with limiting plane-stress plastic zone size and
specimen dimensions [95] .................................................................................... 43
Figure 1-21: Fluence dependence of fracture toughness for Zircaloy-2 tube tested
at various temperatures [97] ................................................................................. 44
Figure 1-22: Change in fracture toughness with hydrogen content and
temperature, CL orientation, circumferential hydrides [99]. ................................ 46

viii
Figure 1-23: (a) PLT test specimen and (b) PLT test configuration [104] .................. 48
Figure 1-24: (a) Fracture toughness as a function of hydrogen content and
temperature,[107] (b) influence of hydride re-orientation on fracture
toughness at 20°C [109]. ...................................................................................... 50
Figure 1-25: (a) X-specimen geometry and (b) J-integral as a function of
temperature and hydrogen content [75]. ............................................................... 51
Figure 1-26: (a) Double-edge-notched tension specimen used by Bertsch; [111]
(b) Internal Conical Mandrel (ICM) technique used by Ste-Catherine et al.
[112]. ..................................................................................................................... 52
Figure 2-1: Polarized-light micrographs of CWSR Zircaloy-4 sheet in the three
orthogonal directions. The grain shape and size is schematically shown in the
top-left corner ....................................................................................................... 62
Figure 2-2: Pole figures measured for CWSR Zircaloy-4 thin-sheet for the {002}
and {100} planes, respectively top and bottom. The intensities have been
normalized by the average intensity. Note: the higher intensity of the basal
poles on the left-hand side corresponds well with the higher intensity of the
prism poles on the right-hand side. ....................................................................... 64
Figure 2-3: Stacked assembly of Zircaloy-4 sheet layers mounted with epoxy into
a steel frame. Such assemblies were used to obtain XRD data in the rolling
and transverse directions. ...................................................................................... 66
Figure 2-4: Texture coefficients as a function of the angle χ in the direction
normal to the sheet surface and for a cold-worked-stress-relieved (CWSR)
specimen ............................................................................................................... 67
Figure 2-5: True stress-strain curves for the CWSR Zircaloy-4 thin-sheet used in
this study, at 25°C, 300°C and 375°C, and compared with the behavior of
CWSR Zircaloy-4 thin-sheet used in previous studies [51], as well as CWSR
thin-wall Zircaloy-4 cladding tube [43]. ............................................................... 71
Figure 2-6: Schematic representation of the hydrogen charging procedure: (1)
natural oxide removal with acid, (2) gold sputter coating, (3) gold removal by
scribing, (4) nickel coating, (5) hydrogen charging, (6) final result. .................... 75
Figure 2-7: Micrograph of a specimen charged at 370°C (a) before annealing and
(b) after being annealed at 400°C for 10 minutes then furnace cooled. The
blister is under the scribe mark (V-shape groove), and sunburst hydrides are
visible under the blister. ........................................................................................ 76

ix
Figure 2-8: (a) Schematic drawing of the four-point bend specimen and fixture
(W: specimen thickness, B: specimen width); (b) Picture of the test fixture
with a specimen loaded (Note: the schematic representation and picture are
inverted). ............................................................................................................... 79
Figure 2-9: Acoustic emission events (blue dots) recorded during a bend test to
failure, superimposed with the corresponding load-time data. ............................. 81
Figure 2-10: SEM fractography taken from a specimen that was fatigue pre-
cracked prior to failure at room temperature (two magnifications shown) .......... 83
Figure 2-11: (a) Single edge crack geometry and electric potential wire placement
locations for EPD crack growth measurements using Johnson's formula
[122]; (b) Actual test specimen placed inside lead positioning device, with
zirconium wire leads ............................................................................................. 85
Figure 2-12: The normalized potential drop as a function of normalized crack
length for a notched specimen and a specimen containing a hydride blister, as
measured experimentally, and compared with that predicted using Johnson‟s
equation (Eq. 2.8). ................................................................................................ 86
Figure 2-13: Light micrographs of specimens with blister depths of (a) 86mm,
and (b) 209mm ...................................................................................................... 90
Figure 2-14: The dependence of the depths of either the sunburst hydrides or the
out-of-plane hydride zone on blister depth ........................................................... 91
Figure 2-15: An example of area fraction measurement for zirconium hydrides in
a Zircaloy-4 metal matrix using Image-J software. .............................................. 94
Figure 2-16: The linear relationship between the hydrogen content predicted by
area fraction measurements of SEM images and the actual measured
hydrogen content. ................................................................................................. 95
Figure 2-17: The linear relationship between the hydrogen content predicted by
area fraction measurements of light-micrographs and the hydrogen content
predicted by area fraction measurements of SEM images . .................................. 96
Figure 2-18: Examples of sectioning of a micrograph for input into Hydromorph,
with (a) the entire area under the hydride blister, (b) slices within an area
under the blister, and (c) the corresponding skeletized image with individual
hydrides numbered. ............................................................................................... 98
Figure 2-19: Schematic illustration of how a skeletized hydride was „sectioned‟ to
calculate its total length and orientation, using Eq. 2.14. ..................................... 99

x
Figure 2-20: Examples of Hydromorph plots of hydride orientation vs. hydride
length for (a) a specimen containing sunburst and mixed hydrides as well as
in-plane hydrides, and (b) mostly just in-plane hydrides. .................................... 100
Figure 2-21: Example of radial hydride content measurement through the
thickness of a sheet Zircaloy-4 specimen. ............................................................ 102
Figure 3-1: Schematic of a typical J-R curve [120]. Note: a schematic
representation of the blunting line offset δ is shown on a crack tip in the top
right. ...................................................................................................................... 108
Figure 3-2: (a) The cracked-plate ASTM geometry mesh created with Cast3M
(Loading pins are in red), and (b) mesh used by Kim [134]. Note: in these
cases, a/W=0.2 ...................................................................................................... 114
Figure 3-3: The predicted load-displacement curves for a cracked-plate ASTM
specimen made of Zircaloy-4 for increasing crack lengths in the range
a/W=0.1-0.7, by increments of 0.1. ...................................................................... 115
Figure 3-4: The normalized elastic stiffness as a function of normalized crack
length for a cracked-plate ASTM specimen with Zircaloy-4 properties and
loaded in a four-point bend configuration such that L/W=4, calculated using
Cast3M. ................................................................................................................. 116
Figure 3-5: Examples of circular and square paths used to calculate J-integral
using Cast3M. The radii are indicated by arrows. The largest possible
contour is also indicated, with the radius Rmax. .................................................... 117
Figure 3-6: The predicted J-integral as a function of contour radius for ASTM
thick-plate Zircaloy-4 specimens containing cracks with lengths ranging from
a/W = 0.1 to a/W = 0.7, as modeled in Cast3M. .................................................. 118
Figure 3-7: An example of linear curve fitting to determine η parameters. In this
case, a/W=0.5........................................................................................................ 119
Figure 3-8: The predicted elastic and plastic η functions for a thick plate ASTM
geometry made of zircaloy-4, compared with Y.J. Kim's published results
[134]. ..................................................................................................................... 120
Figure 3-9: (a)-(d) The equivalent plastic strain distributions at similar bending
increments for a/W = 0.1, 0.2, 0.4, and 0.6, respectively. The plastically
deformed areas are highlighted. ............................................................................ 121
Figure 3-10: Elastic error calculation. ......................................................................... 123

xi
Figure 3-11: (a) Mesh used to model the thin-sheet specimen geometry; (b) close
up for a/W = 0.2 .................................................................................................... 124
Figure 3-12: The predicted load-displacement curves for a thin sheet 4-point bend
specimens containing through-thickness cracks and made of Zircaloy-4, as a
function of increasing crack lengths in the range a/W=0.08-0.67 (i.e. a=50-
400m, with W=600m). ..................................................................................... 125
Figure 3-13: The normalized elastic stiffness as a function of normalized crack
length for a thin-sheet specimen made of Zircaloy-4 in a four-point bend
configuration such that L/W=40, compared with that predicted for a cracked-
plate ASTM specimen such that L/W=4. ............................................................. 126
Figure 3-14: The predicted J-integral as a function of contour radius for the thin-
sheet specimen geometry for a series of Zircaloy-4 specimens that are 600μm
thick and contain cracks with lengths ranging from a/W = 0.083 to a/W =
0.667, as modeled in Cast3M. .............................................................................. 127
Figure 3-15: The predicted η parameters, as a function of the normalized crack
length, for a thick-plate ASTM geometry and a thin-sheet PSU geometry.
The ηpl parameter predicted by Kim is also shown [134]. ................................... 129
Figure 3-16: (a)-(d) Equivalent plastic strain at similar bending increments for
a/W = 0.08, 0.25, 0.42, and 0.67, respectively. The plastically deformed
areas are highlighted. ............................................................................................ 131
Figure 3-17: Normalized stress-intensity factor along the crack profile for a tilted
crack, and profile of the corresponding crack. The test specimen, B63B, was
655μm thick. ......................................................................................................... 135
Figure 3-18: Typical load-displacement and crack-growth behavior at 25°C for (a)
a specimen displaying type I behavior (specimen B70A, KJc~39.5MPa√m),
and (b) a specimen displaying type III behavior (specimen B66A,
KJi~29.8MPa√m). Note: loads were normalized to represent a specimen
24mm wide by 0.6mm thick. ................................................................................ 137
Figure 3-19: Examples of type II load-displacement behavior at 25°C: unstable
crack growth following some plastic deformation (δpl~0.18mm) beyond
maximum load (specimen B65A, KJu~64.3MPa√m). Note: loads were
normalized to represent a specimen 24mm wide by 0.6mm thick. ...................... 138
Figure 3-20: Elastic energy stored in the specimen calculated at maximum load,
plotted as a function of initial normalized crack length, for 25°C tests.
Different types of load-crack growth behavior are highlighted. ........................... 139

xii
Figure 3-21: (a) Evolution of the crack profile with increased bending of the
specimen for a test at 25°C. The light-micrographs (b,c,d,e) show high
magnification images of the crack tip evolution (all images taken at same
magnification). After [114]. .................................................................................. 142
Figure 3-22: (a) A schematic representation of the method used to measure the
blunting-line offset δ. (b-e) Examples of blunting-line offset measurements
for specimens tested at 25°C and crack growth into in-plane hydrides. (b,c):
at the crack tip, respectively equal to 9μm, 7μm. (d,e): at the tip of the
fatigue pre-crack, respectively equal to 11μm and 10μm. The average
blunting-line offset was ~10μm. ........................................................................... 143
Figure 3-23: Typical crack front profiles observed in this study for 25°C tests.
The specimen number is in parentheses. The blue line represents the depth of
the hydride blister, the green line is the initial crack profile, and the red line is
the final crack profile. ........................................................................................... 145
Figure 3-24: (a) Typical SEM fractography for a specimen tested at 25°C. (b)
Close-up of the blister/fatigue pre-crack interface. (c) Close-up of the fatigue
pre-crack/fracture surface interface. (d) Hydride induced primary voids,
separated by ductile dimples. ................................................................................ 147
Figure 3-25: (a) Evidence of load-shedding during fatigue pre-cracking in the
form of a ridge. (b) Evidence of load-shedding during fatigue pre-cracking in
the form of hydride cracking in the first step of fatigue pre-cracking, and its
absence afterwards. ............................................................................................... 148
Figure 3-26: Typical load-displacement and crack-growth behavior at 300°C,
showing a plateau near maximum load, for (a) a specimen exhibiting stable
crack growth (B57D, KJPmax~71.4MPa√m), and (b) a specimen exhibiting
only crack-tip blunting (B70C, KJPmax~64.3MPa√m). Note: loads were
normalized to represent a 24mm wide by 0.6mm thick specimen. ...................... 150
Figure 3-27: (a) Evolution of the crack profile with increased bending of the
specimen for a test at 300°C (specimen B28). The SEM-micrographs (b,c,d)
show high magnification images of the crack tip evolution. Note: the small
black dots are a result of polishing, and do not correspond to voids in the
Zircaloy-4 matrix. ................................................................................................. 152
Figure 3-28: (a,b) Examples blunting-line offset „δ‟ measurements for specimens
tested at 300°C. The blunting-line offsets are respectively equal to 24μm and
28μm. .................................................................................................................... 153
Figure 3-29: Typical crack front profiles observed in this study for 300°C tests.
The specimen number is in parentheses. The blue line represents the depth of

xiii
the hydride blister, the green line is the initial crack profile, and the red line is
the final crack profile. ........................................................................................... 154
Figure 3-30: (a) Typical SEM fractography for a specimen tested at 300°C. (b)
Close-up of the fatigue pre-crack/fracture surface interface. (c) Close-up of
the fracture surface generated at 300°C. (d) Uncracked hydride particle
surrounded by ductile dimples. ............................................................................. 156
Figure 3-31: Typical load-crack-growth behavior at 375°C, showing a plateau
near maximum load (specimen B70D, KJPmax~57.1MPa√m). Note: the load
was normalized to represent a 24mm wide by 0.6mm thick specimen. ............... 158
Figure 3-32: (a) Evolution of the crack profile with increasing bending of the
specimen for a test performed at 375°C (from specimen B84). The SEM-
micrographs (b,c,d) show high magnification images of the crack tip
evolution. Note: the small black dots in (b) and (c) are a result of polishing,
and do not correspond to voids in the Zircaloy-4 matrix. ..................................... 160
Figure 3-33: (a,b) Examples of crack-tip radius measurements for specimens
tested at 375°C. The crack-tip radii are respectively equal to 16μm and
23μm. .................................................................................................................... 161
Figure 3-34: (a) Typical SEM fractography for a specimen tested at 375°C. (b)
Close-up of the fatigue pre-crack/fracture surface interface. (c) Close-up of
the fracture surface/remaining ligament interface. (d) Close-up of the
fracture surface generated at 375°C. ..................................................................... 163
Figure 3-35: J-R curves obtained at 25°C for specimens exhibiting Type I
behavior, where unstable crack growth occurred prior to stable crack growth
(see Table 3-1 for corresponding values of toughness parameters). The solid
black line is the construction line of slope equal to 2ζy, and the black dashed
line is the blunting line. The colored dashed lines represent the large
increment in crack length which occurs during the unstable crack growth
phase. .................................................................................................................... 165
Figure 3-36: J-R curves obtained at 25°C for specimens exhibiting Type II
behavior, where stable crack growth occurred prior to unstable crack growth
(see Table 3-1 for corresponding values of toughness parameters). The solid
black line is the construction line of slope equal to 2ζy, and the black dashed
line is the blunting line. The colored dashed lines represent the large
increment in crack length which occurs during the unstable crack growth
phase. .................................................................................................................... 166
Figure 3-37: J-R curves obtained at 25°C for specimens exhibiting Type III
behavior, where only stable crack growth occurred (see Table 3-1 for
corresponding values of toughness parameters). The solid black line is the

xiv
construction line of slope equal to 2ζy, and the black dashed line is the
blunting line. ......................................................................................................... 167
Figure 3-38: J-R curves obtained at 300°C, for specimens where stable crack
growth did not occur (see Table 3-2 for corresponding values of toughness
parameters). The solid line is the construction line of slope equal to 2ζy, and
the dashed line is the blunting line. ...................................................................... 171
Figure 3-39: J-R curves obtained at 300°C, for specimens where stable crack
growth occurred (see Table 3-2 for corresponding values of toughness
parameters). The solid line is the construction line of slope equal to 2ζy, and
the dashed line is the blunting line. ...................................................................... 172
Figure 3-40: J-R curves obtained at 375°C, for specimens where stable crack
growth did not occur (see Table 3-3 for corresponding values of toughness
parameters). The dashed line is the blunting line. ............................................... 175
Figure 3-41: The influence of (a) hydrogen content and (b) radial hydride content
on fracture toughness at the onset of crack growth (stable or unstable) at
25°C. ..................................................................................................................... 181
Figure 3-42: The influence of (a) hydrogen content and (b) radial hydride content
on the tearing modulus at 25°C. ........................................................................... 183
Figure 3-43: The influence of (a) hydrogen content and (b) radial hydride content
on fracture toughness at 300°C. Data points with a vertical arrow pointing
upwards (KJPmax) indicate lower bounds for toughness, and correspond to
specimens displaying only crack-tip blunting. ..................................................... 185
Figure 3-44: The influence of (a) hydrogen content and (b) radial hydride content
on the toughness at 375°C. ................................................................................... 187
Figure 3-45: The influence of temperature on the fracture toughness KJPmax, as a
function of (a) hydrogen content, and (b) radial hydride content. ........................ 189
Figure 3-46: A partial failure mechanism map for the failure of hydride thin-sheet
Zircaloy-4 under conditions of through-thickness crack growth. The darker
lines represent the transitions observed in this study, while the lighter lines
are potential trends. ............................................................................................... 192

xv
LIST OF TABLES
Table 1-1: Composition of alloying elements for common zirconium based
nuclear fuel cladding alloys (impurities not shown). Unit is [wt. %] unless
specified. ............................................................................................................... 2
Table 1-2: Summary of selected fracture toughness studies published for
Zirconium-base alloys for application in the nuclear industry. ............................ 55
Table 2-1: Calculated Kearns parameters for Zircaloy-4 sheet material used in
this study, compared with previous studies. ......................................................... 69
Table 2-2: Flow behavior of CWSR Zircaloy-4 in the transverse or hoop
direction ................................................................................................................ 72
Table 2-3: Flow behavior of CWSR Zircaloy-4 in the rolling direction .................... 73
Table 3-1: Summary of fracture toughness parameters obtained from testing at
25°C. Notes: Type I crack growth corresponds to unstable crack growth
prior to any stable crack growth, Type II corresponds to stable crack growth
followed by unstable crack growth, and type III corresponds to only stable
crack growth. Test B63B resulted in significantly lower KJu and T values,
likely because it had higher hydrogen content and radial hydride content than
the other specimens with type II behavior (see Section 3.3.1). ........................... 169
Table 3-2: Summary of fracture toughness parameters obtained from testing at
300°C. ................................................................................................................... 173
Table 3-3: Summary of toughness parameters obtained from testing at 375°C. ......... 176

xvi
ACKNOWLEDGEMENTS
First, I would like to thank my advisors Dr. Donald Koss and Dr. Arthur Motta for
their guidance, support, and patience during my six years of graduate studies at Penn
State. They gave me an invaluable opportunity to pursue my educational goals and grow
on both a professional and a personal level. I am also grateful for all the times we were
able to interact outside of the context of work and school: the dinners, the barbeques, the
soccer matches, the visits to France and the tour of the Amish country… Great times, of
which I hope there will be many more!
I would like to thank Dr. Kwai Chan of Southwest Research Institute, for his
precious help in analyzing the results of this study from a fracture mechanics standpoint,
as well as his experience and expertise during the numerous discussions we‟ve had
regarding this research. I would also like to thank Dr. Cliff Lissenden and Dr.
Christopher Muhlstein for their insights and their recommendations as members of my
dissertation committee.
I would also like to acknowledge the financial support and encouragement from
Ralph Meyer and Harold Scott of the U.S. Nuclear Regulatory Commission, in the
absence of which none of this work could have taken place.
Next, I would like to thank Christophe Poussard and Sebastien Carassou of the
CEA in Saclay, as well as Jean Desquines of the IRSN in Cadarache, for their supervision
during my internships, as well as their assistance with Cast3M and Hydromorph.
Special thanks to all of my fellow students with whom I have shared an office, a
lab, or an advisor. They made my daily life more enjoyable, provided support in the
more difficult moments, and many have become great friends.
Finally, I want to thank my parents Jean-Yves and Kelly, as well as my siblings
Magali and Kevin, for always believing in me, and for their constant support. Last but
not least, I want to thank Sandra, my soon-to-be wife, for her patience and her daily
encouragements, particularly during the writing of my dissertation, and for making my
life altogether more fulfilling.

Chapter 1
Introduction and Background
1.1 Zirconium Nuclear Fuel Cladding
A fuel assembly in a light-water nuclear reactor consists of a series of fuel rods
containing fissile material in the form of uranium dioxide (UO2) pellets. The UO2 pellets
are contained in cladding tubes made of a zirconium alloy which serves as a barrier
between the pellets and the coolant (water), thus helping avoid fission gas release.
Zirconium and its alloys have been selected for this application mainly because of their
very low neutron absorption cross-section, which optimizes the operating efficiency of
the reactor. In addition, these alloys possess good corrosion resistance, adequate
mechanical strength, and are relatively resistant to radiation damage [1].
During normal operation, the fuel cladding is subject to degradation resulting
from exposure to the extremely hostile reactor core environment. The inner wall of the
cladding is in contact with the UO2 pellet and a number of fission byproducts and
operates at temperatures close to 400°C. The outer surface of the cladding operates at
280°C to 350°C and is in contact with the coolant. As a result it undergoes oxidation and
consequent hydrogen pickup. Furthermore, neutron collisions cause each atom to be
displaced close to 35 times (35 dpa) during the life of the fuel rod, for a peak-rod fuel
burnup limit of 62GWd/t, (as defined in NUREG/CR 6703) [2]. Over the years, several
alloys have been developed for fuel cladding that are designed to operate in such an
environment; examples include the Zircaloys 2 and 4, and the more modern alloys
ZIRLO developed by Westinghouse Electric Company and M5 developed by AREVA-
NP. Zircaloy-4 has been the most widely used alloy for fuel cladding in pressurized
water reactors (PWR). The composition of Zircaloy-4 and other zirconium base alloys
used for cladding are given in Table 1-1.

2
Zircaloy-4 is based on pure zirconium, which has two allotropic phases: [6, 7]
α-zirconium, stable at room temperature and up to 863°C, with a hexagonal close-
packed (hcp) crystallographic structure of lattice parameters a=0.323nm and
c=0.515nm, such that c/a = 1.593
β-zirconium, stable between 863°C and the melting temperature Tm = 1855°C, with a
body-centered cubic (bcc) crystallographic structure of lattice parameter a = 0.361nm
In Zircaloy-4, the tin and oxygen additions aim at improving the mechanical
behavior of the alloy by raising its tensile strength; however the tin addition is to the
detriment of corrosion behavior. Tin also improves creep behavior and limits the ingress
of nitrogen [8]. The iron and chromium additions result in a fine dispersion of
intermetallic Zr(Cr,Fe)2 Laves phase precipitates with an average size of 200nm (strongly
dependent on heat treatment) and an hcp (C14) crystal structure, which increase the
resistance to corrosion [9, 10].
Table 1-1: Composition of alloying elements for common zirconium based nuclear fuel
cladding alloys (impurities not shown). Unit is [wt. %] unless specified.
ASTM Ref. R 60802 R 60804 R 60901 N/A N/A N/A
Common
Name
Zircaloy-2
[3]
Zircaloy-4
[3]
Zr-2.5%Nb
[4]
ZIRLO
[5]
M5
[5]
E110
[5]
Sn 1.20-1.70 1.20-1.70 - 0.90-1.20
Fe 0.07-0.2 0.18-0.24 - 0.10 0.015-0.060 0.006-0.012
Cr 0.05-0.15 0.07-0.13 -
Ni 0.03-0.08 - -
Nb - - 2.4-2.8 0.90-1.30 0.80-1.20 0.95-1.05
O 0.09-0.16 0.09-0.16 0.09-0.15
Fe + Cr + Ni 0.18-0.38
Fe + Cr 0.28-0.37

3
The thin-walled Zircaloy tubes (0.6-0.7 mm thick and 9.5-10.0 mm diameter) are
produced by a combination of hot extrusion followed by cold pilgering, the latter of
which is performed in such a way that the ratio of wall thickness reduction to tube
diameter reduction is high [11]. The cladding tubes are then annealed for a few hours at
temperatures in the vicinity of 500°C to partially relieve residual stresses generated by
the cold-pilgering. In the cold-worked-stress-relieved (CWSR) condition, the texture is
such that most of the grains have their c-axes tilted 20-40° away from the normal to the
sheet or tube surface in the circumferential direction [12]. The strong texture of the tubes
results in significant mechanical anisotropy, such that through-thickness deformation is
very difficult compared to circumferential and axial deformation (typical strength ratios
in tension are close to 2:1) and slightly higher yield strength but lower strain hardening in
the circumferential direction when compared to the axial direction [13].
1.2 In-Service Microstructural Evolution
During the time spent inside the nuclear reactor core, the Zircaloy cladding
experiences a number of changes in its microstructure caused by irradiation, oxidation
and hydrogen pickup. Radiation damage is due to collisions between fast neutrons
(>1MeV) and the atoms in the alloy, creating point-defects and defect clusters [1]. The
accumulation of these defects results in the formation of dislocation loops consisting
mostly of a -type 1/3 0211 loops, and for high fluences above 3x1025
n.cm-2
some
c -type 1/6 3220 loops have also been observed in annealed Zircaloy-2, as described
in detail by Griffiths [14]. The direct consequence of this increase in defect
concentration is radiation hardening, increasing the yield strength and decreasing the
work-hardening coefficient as well as the overall ductility of the cladding [6, 15]. The
amount of radiation damage (as measured by the concentration of defect clusters or by
the variation on yield strength saturates after about one month in the reactor. Another
important consequence of neutron irradiation is the amorphization and dissolution of the
4
second phase precipitates, with the amorphization beginning at the precipitate boundaries,
and moving toward the center of the precipitates [16-18].
In addition to radiation damage, the outer surface of the cladding undergoes
corrosion by water according to Eq. 1.1. As a result, an adherent protective oxide layer is
formed, which slows further corrosion. During this process, there is some induces
hydrogen ingress into the metal. Corrosion has been shown to accelerate at high burnup
for reasons not yet fully understood. It has been postulated that this may be due in part to
the dissolution of the Zr(Fe,Cr)2 precipitates, but also because of the formation of a
hydride rim at the oxide/metal interface [19].
As mentioned above, despite the presence of a protective oxide layer, about 15%
of the hydrogen produced in this reaction is absorbed into the cladding. It has been shown
that hydrogen will diffuse under the influence of stress and temperature gradients [20].
The terminal solid solubility (TSS) for hydrogen in Zircaloy-4 is approximately 0.05
wt.ppm at 25°C and 100 wt.ppm at 300°C, as given by Eq. 1.2 and Eq. 1.3 [21].
Once hydrogen ingress into the cladding exceeds the solid solubility, precipitation
of zirconium hydrides occurs. Two predominant phases exist for zirconium hydrides:
[20, 22, 23]
The δ-hydride phase (ZrH1.53 to ZrH1.66) is the most commonly observed for hydrogen
concentrations under 1250 wt.ppm. It has a face centered cubic structure with a ~
0.477 nm. It should be noted here that a metastable γ-hydride phase has been
observed in small quantities when precipitation is a result of rapid cooling at low
hydrogen concentrations [24], or for very high overall hydrogen contents (> 1200
wt.ppm) [23].
222 HZrOOHZr (1.1)
TSS Dissolution = 106446.7 exp [-4328.67/T] (1.2)
TSS Precipitation = 138746.0 exp [-4145.72/T] (1.3)

5
For very high hydride concentrations, the -hydride phase (ZrH1.66 to ZrH2) is
observed. It has a face centered tetragonal structure with a = 0.498 nm and c =
0.4445 nm.
Unlike radiation damage, which appears to saturate rather early in reactor
exposure (~months), hydrogen pickup continues as long as corrosion is taking place [25,
26]. Thus the nature and distribution of hydrides in the cladding matrix is a key element
in determining the survivability of the cladding during a reactivity-initiated accident. The
distribution of the hydrides varies in a complex manner with the cladding texture, stress
state and temperature [27].
In Zircaloy-4, the predominant δ-hydride precipitates as platelets. The habit plane
for δ-hydrides is the 7110 plane, oriented at 14.7° from the basal plane [28]. As a
result, because of the cladding‟s preferred crystallographic orientation (with basal poles
oriented at ~30° from the normal to the cladding surface), most of the hydride platelets
are oriented with their poles along the radial direction, so that the platelets align in the
circumferential direction of the tube, parallel to the tube wall surface, as shown
schematically in Figure 1-1 [28]. It should be noted that upon cooling, hydrides tend to
re-orient themselves normal to the maximum principal stress, hence when cooling from
temperatures at which the hydrogen is mostly in solution, radial precipitation of hydrides
has been observed within cladding tubes under tensile loading along the hoop direction
[28-33]. During in-service loading, the circumferential orientation of the hydrides can be
tolerated to a greater extent than the radial orientation because circumferential hydrides
are less penalizing for the ductility of the cladding [25].

6
The thermal gradient that is present in the cladding due to the outward heat flow
from the fuel into the coolant causes the hydrides solid solubility limit to be exceeded
first in the coolest regions of the cladding, near the outer surface. Consequently, a dense
region of hydrides called a “hydride rim” often forms near the outer surface of the
cladding, as shown in Figure 1-2(a). Oxide layers up to 100m thick have been observed
in high burnup cladding (with corresponding hydrogen contents of 200-800 wt.ppm for a
burnup around 60GWd/t, depending on the cladding alloy) [34, 35]. The oxide layer on
the outer diameter of the cladding represents a barrier to heat exchange between the
cladding and the coolant, resulting in a temperature increase in the cladding of about
0.3°C/m of oxide [19]. For thick oxide layers (≥80m), the volume and thermal
mismatch stresses are such that the probability for oxide spallation is increased. When
the insulating oxide layer is spalled off, a “cold spot” (~25-30°C difference) can be
created near the cladding surface because the subjacent material is more efficiently
cooled. This phenomenon can result in the formation of a lens-shaped solid hydride
“blister”, as shown in Figure 1-2(b).
Figure 1-1: Schematic orientation of hydrides in Zircaloy cladding [28]
7
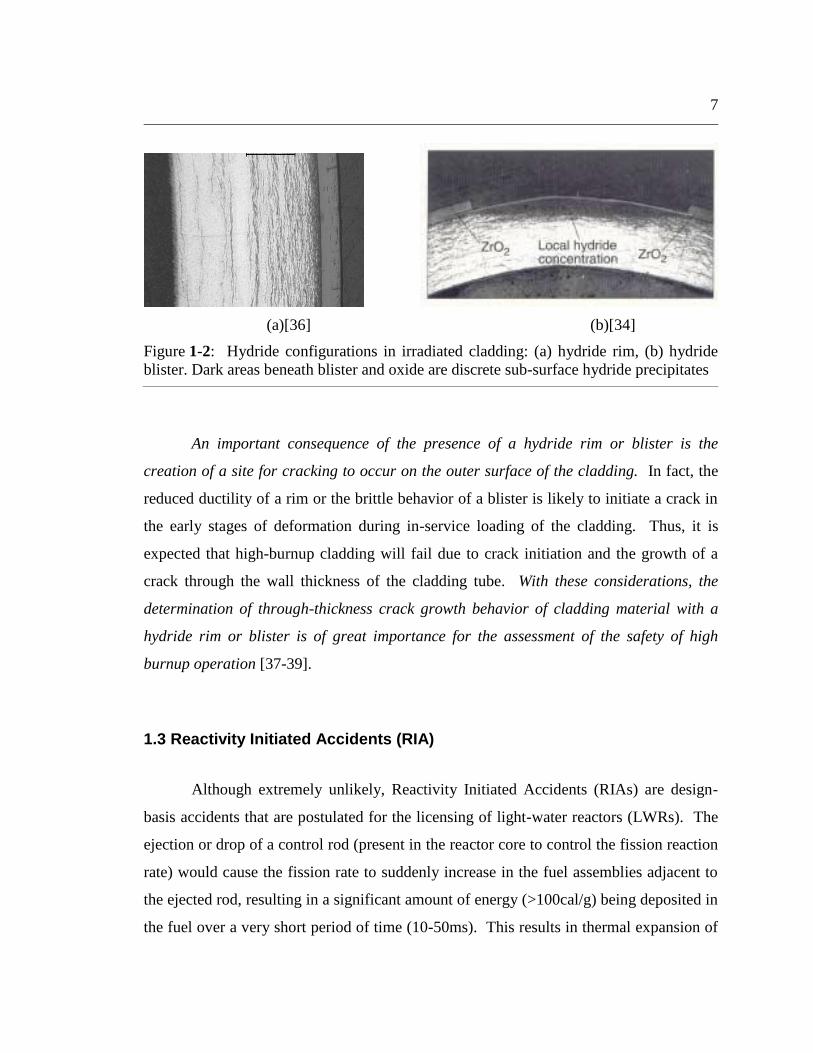
An important consequence of the presence of a hydride rim or blister is the
creation of a site for cracking to occur on the outer surface of the cladding. In fact, the
reduced ductility of a rim or the brittle behavior of a blister is likely to initiate a crack in
the early stages of deformation during in-service loading of the cladding. Thus, it is
expected that high-burnup cladding will fail due to crack initiation and the growth of a
crack through the wall thickness of the cladding tube. With these considerations, the
determination of through-thickness crack growth behavior of cladding material with a
hydride rim or blister is of great importance for the assessment of the safety of high
burnup operation [37-39].
1.3 Reactivity Initiated Accidents (RIA)
Although extremely unlikely, Reactivity Initiated Accidents (RIAs) are design-
basis accidents that are postulated for the licensing of light-water reactors (LWRs). The
ejection or drop of a control rod (present in the reactor core to control the fission reaction
rate) would cause the fission rate to suddenly increase in the fuel assemblies adjacent to
the ejected rod, resulting in a significant amount of energy (>100cal/g) being deposited in
the fuel over a very short period of time (10-50ms). This results in thermal expansion of
(a)[36] (b)[34]
Figure 1-2: Hydride configurations in irradiated cladding: (a) hydride rim, (b) hydride
blister. Dark areas beneath blister and oxide are discrete sub-surface hydride precipitates

8
the fuel, which then comes in contact with the cladding. This pellet-cladding mechanical
interaction caused by thermally induced expansion, coupled with the sudden release of
fission gases, mechanically loads the cladding and may lead to cladding failure, [34, 40].
If this failure occurred with fuel dispersal, fuel channels may be blocked, resulting in a
loss of coolable geometry, fuel damage, or even a partial meltdown.
Non-irradiated Zircaloy-4 has sufficient ductility to withstand the above type of
accidental transient if energy deposition is maintained below 180cal/g, and great care is
taken to ensure that the effects of irradiation do not severely decrease the mechanical
properties of the material [34]. However, these limits have been determined using only
cladding with burnup levels up to ~30GWd/t. Recent studies indicate that at higher
exposures, the material may not be ductile enough to withstand a RIA. As a result, there
has been an assessment of the existing database of the mechanical properties of the
material at higher levels of hydriding and radiation damage [34].
Failure of the cladding occurs by through-thickness crack growth. Unfortunately,
none of these studies have examined the failure of Zircaloy-4 cladding tube under
through-thickness crack growth. Thus a critical step in assessing the rod ejection
accident risk is cladding failure under conditions where crack initiation and through-
thickness crack occur, as shown on Figure 1-3. The most likely scenario is the formation
of a crack within a highly hydrided spot such as a hydride rim or hydride blister, and
subsequent crack growth through the thin-wall substrate material. The ductility of the
cladding is then limited by both crack initiation in the rim/blister in the early stages of the
transient and subsequent crack propagation through the underlying matrix. The critical
aspect of the failure is that the maximum loading of the cladding occurs while the
cladding is still cold, and therefore more brittle.

9
1.4 Studies of Cladding Failure and Proposed Failure Criteria
In this section, selected studies on cladding failure and of proposed criteria
developed over the years and used to describe cladding failure during RIA transients are
briefly reviewed. These studies are classified in three categories that overlap in some
cases: strain-based studies, energy-based studies, or damage-based studies. Importantly,
it should be noted that cladding failure has also been investigated on the basis of fracture
Figure 1-3: Phenomena leading to cladding failure during a RIA [41]

10
mechanics by performing fracture toughness studies on cladding materials, which is the
focus of section 1.5.
In order to avoid catastrophic failures during design-basis accidents such as a
RIA, it is of great importance to understand and to be able to predict cladding failure
during such an event. Cladding failure may be assessed on the basis (a) that the cladding
does not form a crack-like defect during failure or (b) that crack initiation and crack
growth control failure. In the former case, strain-based failure criteria seem most
appropriate while in the latter case, failure would be dictated by a combination of a crack
initiation criterion and a crack growth criterion.
To predict failure under both failure conditions, it is also critical to recognize the
influence of temperature, since rapid heating occurs during the RIA. In addition, the
initial flaw condition, fracture toughness of the substrate, hydrogen content and
distribution, oxide thickness, as well as the strain path (whether force loading or
displacement loading is observed) can lead to different types of failure and different types
of failure mechanisms.
In order to predict failure on the basis of these criteria, several approaches have
been proposed, as follows:
For strain-based criteria, cladding deformation (i.e. strain) is calculated in a code
for a set of fixed accidental conditions (temperature, hydride distribution and
content, burnup, etc…) and compared to a critical value corresponding to the
failure strain in the exact same conditions. Two distinct cases exist for strain-
based failure criteria: (a) failure in the absence of a crack, for which the inherent
assumption is that cracks do not control the value of the strain to failure, and (b)
failure in the presence of a crack, for which crack initiation and crack growth
control the value of the failure strain. A significant difficulty for the application
of both these criteria is the experimental measurement of failure strain under
realistic conditions, particularly for cases of non-uniform deformation under
multi-axial strain paths or extensive necking prior to failure (as is often observed
in cladding failures).

11
For strain-energy-density-based criteria, a simulation code is used to calculate
strain-energy-density (SED) under accidental conditions and compared to a
critical value of SED (the CSED) corresponding to failure and measured
experimentally in the same conditions as modeled. The assumption for this type
of approach is that the CSED is an invariant material property independent of the
presence of cracks. However it has been argued that this is not the case, as the
role of cracks in the failure of high-burnup cladding is not taken into account
when using SED criteria. This implies that SED-based criteria might be valid if
uniform deformation followed by plastic instability led to failure, but not in the
case of failure due to crack growth due to a surface flaw which is typically
observed in cladding failures during a RIA.
For damage-based criteria, a parameter representative of microscopic damage
within the material (for example void density or strain to rupture a ligament
between two voids) is calculated for the case of accidental conditions and then
compared to a critical value of the parameter associated with cladding failure.
The difficulty here lies in defining and calculating the damage parameter, as well
as measuring it experimentally. This is also in part due to the difficulty to
characterize the microstructure well enough to apply such criteria. In addition, a
major deficiency similar to that described for SED-based criteria is that the actual
mechanism of cladding failure during a RIA (i.e. crack growth originating from a
brittle or near-brittle surface layer) is not taken into account in these models.
Instead, uniform deformation is usually assumed and the local damage parameter
is evaluated to determine the onset of failure.
In using the first type of criterion above (a strain-based criterion in presence of a
crack), a fracture-mechanics procedure can be used based on the value of a fracture
toughness parameter (typically the stress intensity factor K or the J-integral), a given
crack length, under the RIA-type loading conditions. In such an analysis, the assumed
value of toughness is critical, as it is likely to depend on hydride microstructure and
temperature. Depending on these conditions, this procedure will predict failure on the
basis of a critical strain (or critical stress, in near-brittle conditions). Predicting failure by

12
crack initiation and growth, as observed in the case of high-burnup RIA failures, has been
the aim of many fracture toughness studies which have led to fracture-mechanics based
failure criteria for cladding. Special attention is given to these studies in section 1.5.
Despite the large number of fracture toughness studies, none have investigated through-
thickness crack growth conditions in thin-walled materials. This constitutes a key
deficiency, since cladding failure during accidental transients such as RIAs occurs as a
result of crack initiation in a brittle or near-brittle outer layer, followed by through-
thickness crack growth. In an attempt to remedy this deficiency, the aim of the present
study is to determine the fracture toughness of hydrided thin-wall Zircaloy-4 for
conditions of through-thickness crack growth and at temperatures ranging up to 375°C,
under RIA-type behavior.
1.4.1 Assessment of Cladding Failure Based on Strain Measurements
For simple specimen geometries in the absence of pre-existing flaw, failure strain
can be measured experimentally without great difficulty. As a result, it seems natural to
define a critical strain value and use it as a failure criterion. There are many studies that
have used strain measurements as a means to quantify hydrogen embrittlement in
cladding materials, as a function of a variety of parameters, including temperature,
hydride microstructure, and strain path. Two different approaches are presented here: (a)
failure by mechanisms other than crack growth, and (b) presence of a crack.
1.4.1.1 Failure in the Absence of a Crack
The failure strains in hydrided cladding materials were measured in uncracked
material as a function of parameters such as hydrogen content, strain path, surface flaw
depth (in the form of grooves), temperature and fluence. As a result, failure occurred due
to void nucleation and growth or necking instability, instead of crack growth.

13
In an early study, Yunchang and Koss [42] investigated the influence of stress
biaxiality and hydrogen content of the fracture of Zircaloy-2 sheets by the means of local
fracture strain measurements based on grids printed on uniaxial and biaxial punch-stretch
specimens. Hydrogen embrittlement was found to be the direct consequence strain-
induced hydride fracture resulting in void nucleation, growth and link-up. Figure 1-4
[42] clearly shows that increasing hydrogen content and stress biaxiality significantly
reduce the fracture strain in hydrided cladding, especially when both effects are
combined. The authors found that the decrease in the critical void density leading to
failure with increasing stress biaxiality was the leading cause of hydrogen embrittlement
in this case.
Figure 1-4: (a) A fracture limit diagram for Zircaloy-2 sheet at four levels of hydrogen.
The major ε1 and minor ε2 principal strains in the plane of the sheet at fracture are shown.
(b) The equivalent strain to fracture εf for Zircaloy-2 sheets containing either 150, 350, or
615 wt.ppm H as normalized to (εf)21, at 21 wt.ppm H for the specified strain paths [42]

14
In order to study failure due to hoop expansion in a RIA type accident, Link et al.
developed a wide notched ring tension test to achieve plane-strain in a region of the
gauge section when deforming the ring specimen in the hoop/circumferential direction
[43, 44]. The specimen geometry developed in this study has since been called the PSU
plane-strain ring specimen and has been used extensively by others [36, 45-47]. In this
study, strains were measured using a grid of micro-hardness indents, which allowed for
the measurement of both the limit strain and the local fracture strain associated with
necking instability. With this specimen geometry, Link et al. achieved a through-
thickness failure mode similar to that observed during the Pellet-Cladding-Mechanical-
Interaction (PCMI) which occurs during a RIA, as seen in Figure 1-5(b) and to be
contrasted with Figure 1-5(a) which shows uniaxial through-width failure. Based on
uncracked hydrided specimens, this study found that cladding failure occurred as a result
of localized necking at both 25°C and 300°C. Link et al. also performed a series of tests
on specimens with surface flaws simulated by grooves on the ring surface in the gauge
section. In doing so, they showed that a rapid decrease in failure strain is associated with
increasing flaw depth, as predicted by the „M-K‟ strain localization model applied to their
case [44].
Figure 1-5: Macroscopic photographs of failures of (a) uniaxial tension ring cladding
specimen, where failure occurs across the width, and (b) plane-strain tension cladding
specimen, where failure occurs through the thickness [43].

15
In addition to reproducing Link et al.‟s results for failure threshold strains as a
function of uniform hoop strain and groove depth, Jernkvist [48] extended the same
plastic strain localization and necking failure model to analyze the effects of local surface
defects on clad ductility and survivability under RIA as a function of stress biaxiality
ratio, fast neutron fluence and temperature. In comparing the results from this necking
failure model with another strain energy density (SED) criterion proposed by Rashid et
al. [49] (see section 1.4.2), Jernkvist clearly shows the importance of surface defects and
stress biaxiality ratios in predicting cladding failure, although these are typically not
taken into account in SED based criteria. In a separate study, Jernkvist used data from
over 200 out-of-pile mechanical properties tests to define a strain-based failure criterion
which was then used to calculate burnup-dependent threshold enthalpies for clad tube
failure and incipient fuel melting [50]. This criterion was dependent on temperature,
strain rate, hydrogen content and fluence, but despite the large amount of data used to
generate the criterion, the author acknowledges that the uncertainties in this model are
rather large, as seen in Figure 1-6.
In summary, these studies of cladding failure strain in the absence of a crack are
in agreement as to the detrimental effect of increased stress biaxiality ratios and surface
flaws in the form of grooves or notches. Although these studies provide important
insight on the deleterious effects of strain path, hydrogen and surface defects on cladding
failure, the difference in failure mechanism between investigations of cladding failure in
the absence of cracks and high-burnup cladding failures due to crack growth limits their
usefulness in terms of predicting RIA behavior. As a consequence of this, more recent
studies have considered the effect of cracks on failure strains, as described in the next
section.

16
1.4.1.2 Failure Due to the Presence of a Crack
In order to better represent RIA cladding failure and develop more accurate
criteria than those described in the previous section, more recent studies have focused on
the measurement of failure strains in the case where failure occurs in the presence of a
crack in brittle or near-brittle outer layers of the cladding.
Daum et al. [36, 45] used the PSU plane-strain ring specimens to study the
influence of brittle hydride rims on the failure of hydrided cladding as a means to
simulate high-burnup cladding. Strain measurements at room temperature and 300°C
have shown that hydride rim thicknesses of less than 90μm result in ductile behavior of
the cladding, while hydride rim thicknesses larger than 140μm result in a large loss of
ductility of the cladding, as shown in Figure 1-7 . These studies also showed that the loss
(a) (b)
Figure 1-6: (a) Comparison of calculated and measured hoop plastic strain to failure, εθθf,
for RX Zircaloy-2 and SRA Zircaloy-4 cladding. The thin dotted lines are ±1ζ and ±2ζ
uncertainty bands for the failure strain correlation. (b) Best-estimate clad failure
thresholds based on Jernkvist‟s model. The thin light-gray lines are ±ζ uncertainty bands
[50].

17
of ductility was very sensitive to the thickness of the rim, but less sensitive to the hydride
concentration for concentrations up to 700 wt.ppm observed in the study. Despite similar
failure strains, the failure mechanism observed at room temperature was very different
from the failure mechanism observed at 300°C. In both cases failure occurred by
microcrack initiation with incipient crack length equal to hydride rim thickness, followed
by growth and linkage of the microcracks into a large surface crack and through-
thickness crack growth. However, room temperature failure was controlled by crack
growth due to damage accumulation in the remaining ligament, while the 300°C failure
was due to the formation of a shear-instability beneath a blunted crack.
In their study of the influence of brittle layers on the fracture of hydrided
Zircaloy-4, Pierron et al. [51] focused on the influence of hydride blisters in addition to
hydride rims. The specimens were made of recrystallized (RX) and cold-worked-stress-
relieved (CWSR) sheet Zircaloy-4, and double edge-notched tensile specimens were used
to generate a plane-strain condition analog to that observed in the PSU ring specimens.
Pierron found that the fracture strain decreased rapidly for hydride blisters up to 100μm
Figure 1-7: Plane-strain fracture strain at room temperature and 300°C as a function of
hydride layer thickness [36]
Loss of Ductility

18
in depth, and then remained relatively constant, see Figure 1-8 . It was also observed
that, at equal thickness, solid hydride rims (akin to a hydride blister spanning the entire
specimen) appeared to be more detrimental to ductility than hydride blisters (localized in
the center of the gauge section). In addition, the fracture strain was found to increase
significantly with temperature (which was expected but not clearly observed in Daum et
al.‟s study [36, 45]). Also, similar to what Daum et al. had observed, the fracture
mechanism shifted from a mode I crack growth mode, in which the hydrides play a
significant role at room temperature, to a shear instability failure (or mixed mode I/II
crack growth) at 300°C and 400°C, as shown in Figure 1-9.
Pierron et al. [51] used elastic-plastic fracture-mechanics (EPFM) analyses to fit
the failure strain data collected in their study. This was done in an attempt to utilize
fracture mechanics to predict the plastic strain to failure at the onset of through-thickness
crack growth due to the presence of a crack of depth equal to the depth of a hydride
blister or rim. In doing so, the authors showed that good agreement with experimental
data could be obtained at 25°C by assuming a through-thickness fracture toughness value
Figure 1-8: The dependence of observed (Exp. Data) and predicted (lines) fracture strains
for CWSR Zircaloy-4 with 2mm or 3mm wide circular hydride blisters at (a) 25°C and
(b) 300°C [51].

19
of KC~70MPa√m. However at 300°C the model over-predicted the fracture strain. Thus
a fracture-mechanics procedure could not be used to accurately predict failure strains at
300°C, which is believed to be the lower end of the temperature range believed to be
relevant to RIA failures. It should be noted here that although a through-thickness
fracture toughness value was assumed to model failure strains at 25°C, Pierron‟s study
was not, strictly speaking, an investigation of fracture toughness, but rather of failure
strains. Consequently, the authors proved that a strain-based assessment of cladding
failure due to through-thickness crack growth can in some conditions predict failure using
fracture mechanics, just as long as a single fracture toughness value can be assumed to
accurately predict failure strains in a given set of conditions. For the experiments ran by
Pierron et al. [51] failure almost always occurred near the ultimate tensile strength (at
both 25°C and 300°C), but the fracture strain was very sensitive to blister depth, thus a
stress-based criterion [52, 53] was inadequate.
Figure 1-9: Fracture profiles of (a) CWSR sheet with a 100 μm blister, (b) RX with a 40
μm blister, (c) CWSR with a 35 μm blister, and (d) RX with an 80 μm blister. Test
temperatures are indicated [51].

20
Glendening et al. [54] extended Pierron‟s study to equal-biaxial strain paths using
a punch-stretch test to fracture specimens with similar hydride blisters as in [45].
Glendening‟s observations for equal-biaxial tension were in agreement with Pierron et
al.‟s for plane-strain concerning the failure mechanisms at 25 and 300°C, and testing at
375°C revealed that shear instability was also the mode of failure at that temperature,
similar to what was observed at 300°C. Also similar to Pierron‟s study was the
observation that the fracture strain decreased sharply with increasing blister depth, which
increased the depth of the initial crack. As expected, testing at 375°C resulted in slightly
higher fracture strains than those observed at 300°C, which in turn were larger than those
measured at 25°C. One of the more important observations made by Glendening et al.
was that the failure process for the hydrogen contents studied appeared to be driven by
the maximum principal strain, such that the failure strains for equal-biaxial tension were
similar to those for plane-strain deformation, as shown in Figure 1-10.
Figure 1-10: A comparison between the far-field failure strains in equal biaxial tensile
deformation (EBT) with those in plane-strain tensile deformation for Zircaloy-4 sheet
containing hydride blisters of different depths and tested at (a) 25°C and (b) 300°C [54]

21
In another study, Desquines et al. [46] describe a series of tests performed as part
of the PROMETRA program on CEA Saclay hoop tensile specimens with the aim of
defining a strain-based failure criterion to be applied in the CABRI REP-Na integral RIA
tests. Several tests were performed on irradiated cladding containing hydride rims and
hydride blisters and the failure strains were measured as a function of hydride rim or
blister depth. In many cases where a surface flaw was present in the form of a hydride
blister, failure occurred by what appeared to be through-thickness crack growth, hence it
is likely that the through-thickness fracture toughness of the cladding controlled failure in
these cases. Consequently, an elastic-plastic fracture-mechanics (EPFM) approach based
on simulations by the French Institute for Radiation-protection and Nuclear Safety
(IRSN) was used to fit the data obtained, as shown in Figure 1-11. The EPFM analysis
was based on finite element fracture-mechanics calculations such that the basic concept
(crack growth induced failure) was similar to that developed by Pierron et al.; the
prediction trends are in agreement between the two studies. In an effort to further
develop this criterion, the CEA has tested PSU plane-strain rings in the non-irradiated
condition (analog to those performed by Link et al. and Daum et al. described earlier [36,
43]), and plans are under way to begin testing irradiated PSU rings in the new hot cells in
Saclay, France.

22
In summary, to address cladding failure during a RIA, a number of investigations
of failure strain have been published in the past decade for failure in the presence of a
crack, a couple of which have attempted to model failure strains with fracture mechanics.
Most studies are in agreement that the hydrides are detrimental to cladding ductility,
particularly when they are in the form of brittle (or near-brittle) surface layers that act to
initiate cracks. The studies are also in agreement that at higher testing temperatures, the
effect of hydrogen diminishes and the overall ductility increases, associated with a
change in failure mechanism.
Generally speaking, despite their apparent simplicity, strain-based criteria are
seldom applied directly, as many parameters can influence the critical strain
measurements. For instance, whether strain is measured locally or globally, the direction
in which the strain is measured, the effects of post-failure cladding deformation, and most
importantly the actual failure mechanisms (e.g. necking instability versus crack growth)
can provide significantly different measurements of strain for one given failure event.
Recently, several studies have attempted to model failure strains with the help of fracture
Figure 1-11: EPFM simulations of hydride damage influence at 350°C [46].

23
mechanics. This emerging procedure appears to be promising for use when failure due to
crack growth occurs, and should be incorporated into simulation codes such as
SCANAIR, FRAPTRAN or FALCON, which are being used to model transient behavior
for nuclear safety applications [55-58].
1.4.2 Assessment of Cladding Failure Based on Strain-Energy-Density
Strain energy density (SED)-based criteria rely on the determination of a critical
strain energy density (CSED) at failure, corresponding to the energy absorbed by the
material at a given deformation, under certain loading conditions, and for a given
material state. This critical energy is calculated by measuring the area under stress strain
curves obtained from experimental data in experiments taken to failure. A general
expression to describe a SED type criterion is given in Eq. 1.4. The calculated SED
corresponds to the area under the stress-strain curve obtained from a finite element
simulation, under a given set of conditions. The SED thus calculated is compared with
the critical SED measured experimentally under the same conditions.
Rashid et al. and Montgomery et al. have developed a model using the above
approach to describe cladding failure, which has been incorporated in the FALCON code
developed by the Electric Power Research Institute (EPRI) [49, 58-61]. The database for
this criterion consists of a series of stress-strain curves obtained using mechanical
properties tests performed as a function of fast fluence, temperature, hydrogen
concentration and material type. The criterion is then applied by introducing correction
factors to account for the differences between the out-of-pile (i.e. outside of a nuclear
reactor) test conditions and the actual RIA conditions, in particular to take into account
the multi-axial stress states that are not present in out-of-pile testing. The assumption
behind this type of criterion is that the CSED is an invariant property of the material
related to its ability to absorb energy before failure. However, the SED measured based
on stress-strain records and used to generate the CSED values accounts for the
,...,,)( HTCSEDSED calc (1.4)

24
macroscopic behavior of the entire specimen used to generate the data, which in turn will
be strongly influenced by the failure mode. In particular, the absence of a crack will lead
to much higher SED values than in the case where cladding failure is dictated by crack
initiation and growth, as observed for high-burnup cladding during a RIA. With this in
mind, it seems unlikely that a criterion based on SED would be suitable for the prediction
of high-burnup cladding during a RIA.
As part of Rashid and Montgomery‟s studies, an analysis was developed to
convert CSED values into critical J-integral values so as to link the SED criterion with
fracture mechanics, but without actually taking into account essential assumptions of
fracture mechanics such as the presence of a crack. This approach was argued to be
incorrect by Monerie [62] mainly because the assumption made by Rashid et al. [49] that
"failure of a cladding with a flaw or a defect can be predicted by calculating the strain
energy density in the material without performing fracture analysis" was not justified.
However, by using different assumptions which implicitly introduce a critical crack
length that can be correlated to the oxide layer thickness, Monerie showed that it is
possible to define an equivalence between the CSED and fracture mechanics [62].
Despite Monerie‟s derivation to establish a link between CSED and fracture mechanics,
the fact that CSED values are often obtained from test specimens without cracks raises
concerns about the applicability of the criterion to predict failure driven by crack
initiation and crack growth.
In a different review of the same work by Rashid and Montgomery, Motta [63]
has criticized several aspects of the CSED approach to model cladding failure during a
transient accident, beginning with the fact that an elastic-plastic fracture-mechanics
approach on an uncracked body is not adapted. Among the many concerns raised in this
review of the criterion, two important ones are that (a) CSED does not explicitly consider
existing or potential flaws in its formulation (for instance, the cracked blister or rim
hydrides are not taken into account in the SED calculations, but the CSED is deducted
from tests on flawed samples); and (b) CSED does not consider the failure mechanism (it
treats brittle failure, mode I failure, shear instability, and mixed mode I and II failure, all
in the same way).

25
Despite these concerns, CSED criteria are still used by EPRI in the FALCON
code, as well as by the French EDF in the SCANAIR code. In fact, in an attempt to
justify the use of this criterion, Leclercq et al. [64] have recently derived a number of
biaxiality and strain rate correction factors to be applied to the results of experimental
tests performed as part of the PROMETRA program, in such a way that the SED
calculations performed as part of the program [65] could be representative of RIA
biaxiality conditions, and RIA strain rate conditions. The authors acknowledge the
difficulties inherent to this type of approach, as the results are dependent on the material
properties used, which are not well known during the transient phase of RIAs, and thus
have adopted very conservative correction factors. They also recognize the potential for
improvement related to the fact that SED criteria do not take into account the specific
mechanisms of failure observed from experiments. In particular, as stated previously, the
absence of a growing crack in the SED model is a key deficiency for predicting high-
burnup cladding failure. Also, although SED criteria are currently used in codes, the
validity of the assumptions inherent to these models has yet to be verified, in particular
the assumption that the CSED is an invariant material property. In a further attempt to
remedy this deficiency, Leclercq et al. have developed a mechanical test that could be
implemented to obtain RIA-like loading path and strain rate, based on electromagnetic
forming. This test might provide CSED values that could be used to predict cladding
failure in the absence of cracks, or might even reduce the uncertainty related to transient
mechanical properties, thus potentially modifying the correction factors developed.
However, it seems unlikely that the issues related to the absence of a crack in the SED
model will be resolved, making it difficult to develop a sound basis for the prediction of
high-burnup cladding failure.
Dufourneaud et al. [66] have also implemented the use of finite elements to model
an expansion due to compression (EDC) test in an effort to develop a CSED criterion for
cladding failure due to PCMI. The mechanical test relies on the compression of a Teflon
pellet inside a cladding tube specimen, with the Teflon pellet eventually deforming the
cladding from the inside. By using appropriate normalization techniques, the authors
were able to generate load-independent CSED values to be used in a failure criterion for

26
cladding that does not fail due to crack growth, which is likely not applicable to high
burnup cladding during a RIA. Once again, although the test configuration is likely to
provide a loading configuration very close to that observed during PCMI, the inability of
the SED to properly take into account the presence of cracks in high-burnup cladding
renders this approach invalid when trying to predict high-burnup cladding failure during a
RIA.
In summary, the common basis of the criteria presented here is the SED, which is
compared to a CSED value to determine the failure point of the cladding. Because CSED
criteria are relatively easy to implement in failure assessment codes, they are still widely
used to predict PCMI during RIAs: the FALCON code used by EPRI and SCANAIR
code used by EDF, IRSN and CEA both use CSED type criteria, and other entities such
as Studsvik Nuclear have studied these types of criteria. However, many concerns have
been expressed about the validity and accuracy of CSED criteria, largely because this
type of approach does not reflect actual failure mechanisms observed in in-pile and out-
of-pile tests. In particular, CSED does not take into account the presence of a crack, so it
seems unlikely that high-burnup cladding failure, which is a result of crack initiation in
brittle or near-brittle outer layers followed by first through-thickness and then axial
crack growth, could be accurately predicted by such a criterion. In an attempt to remedy
this, new types of mechanical tests are being developed to validate calculated CSED
values. Although these tests might provide some insight for cladding failures in the
absence of cracks, as well as help to generate correction factors for uncracked cladding
being deformed and fractured under various reactor conditions that are difficult to obtain
in a laboratory, they are unlikely to provide a sound basis for the prediction of high-
burnup cladding failure during a RIA. Finally, several attempts to link CSED with
fracture mechanics have been made, but the lack of a crack in the SED model
assumptions have made it difficult to validate such an approach.

27
1.4.3 Assessment of Cladding Failure Based on Material Damage
Compared to other approaches such as fracture mechanics, material damage
criteria are attractive in the sense that they allow for modeling of the failure behavior of
the cladding without knowing exactly what the macroscopic fracture mechanism is. In
fact, these criteria often focus on the micromechanical behavior of the material and are
based on microscopic local failure criteria (such as for example critical void density, local
stress concentration, local cohesive forces, or local strains) in the vicinity of failure
initiation sites, such as hydride particles in Zircaloy claddings. If the micromechanical
model is a good representation of cladding failure at a local microscopic scale, it should
theoretically predict the correct macroscopic failure mechanism. Evidently, the initial
geometry of the modeled cladding, in particular the absence or presence of a crack,
should strongly influence the macroscopic failure mechanism predicted by a damage-
based model.
In order to model hydride embrittlement for applications in predicting nuclear fuel
cladding material behavior, Chan [67, 68] developed a micromechanical model based on
elastic-plastic fracture mechanics (EPFM) to calculate tensile ductility and fracture
toughness as a function of hydride morphology, volume fraction and distribution. In this
study, Chan modeled hydrides as an array of cracks of different sizes and with different
spacing in the directions parallel and normal to the principal tensile stress axis. When the
local strain in the uncracked ligaments reached the failure strain of the ductile matrix, the
ligaments were assumed to fail, as illustrated in Figure 1-12. Chan found good
agreement between his model and room temperature experimental data (Figure 1-12),
which showed that normalized ductility was reduced with increasing hydride size,
decreased spacing between hydrides, and increased radial hydride content. In addition to
his micromechanical model, Chan developed a model to predict hydride morphology and
distribution under various cooling conditions, [68] which coupled with the
micromechanical model for failure, was used predict hydride embrittlement due to
delayed hydride cracking (DHC) (Figure 1-12). Although this approach was not
designed to model high-burnup cladding failure during a RIA, Chan‟s assumption that

28
hydride particles fracture early in the deformation process and result in an array of voids
or microcracks has been used by others in their attempts to describe cladding failure in
terms of damage and derive failure criteria, as described below. Finally, it should be
noted that Chan‟s approach does not address failure in the case of a pre-existing
macroscopic crack in the material.
(a) (b)
(c) (d)
Figure 1-12: (a) Modeling of cracked hydride particles; (b) strain concentration in a
ligament between two cracked hydrides; (c) tensile ductility predictions compared with
experimental data; (d) fracture toughness predictions as a function of cooling rate, as
predicted by Chan‟s model to be applied to spent fuel behavior [67, 68].

29
To describe the ductile fracture of hydrided Zircaloy-4 at room temperature for
hydrogen contents up to 1200 wt.ppm, Prat et al. [69] and Grange et al. [70] used a
modified Gurson-Tvergaard-Needleman (GTN) model [71, 72] which took into account
anisotropy and plasticity. In a way similar to what was done by Chan, the damage inside
the hydrided material was attributed to the fracture of hydrides resulting in voids within
the Zircaloy-4 matrix. This model is a coupled model, implying that the calculated yield
stress for the material being deformed takes into account the damage caused during
yielding. The parameters of the model were determined experimentally by the authors.
These include the Hill anisotropy parameters, the plastic and visco-plastic material
parameters for undamaged material and the kinetics of damage, meaning void nucleation,
growth and coalescence [13]. The final failure criterion consisted of a critical void
density which varied with hydrogen content, following an empirical law according to
which the critical void fraction diminished with increasing hydrogen content. Grange
showed that with sufficient mesh refinement, crack opening displacement and crack
growth could accurately be predicted, as shown in Figure 1-13(a)-(b). However, it is
unclear whether the model was successful in predicting the plastic and failure behavior of
hydrided Zircaloy-4 sheets containing through-thickness holes and deformed at room
temperature because the boundary conditions applied in the model do not match those
obtained experimentally, as shown in Figure 1-13(c). In addition, Grange‟s model is
unlikely to be applicable at high temperatures above 300°C at which cladding failure
during a RIA is believed to occur, mainly because the model relies on the fracture of
hydrides embedded in the metal matrix to generate damage in the form of voids, which
accumulate until the critical void density is reached and failure occurs. Indeed, it has
been shown by others [73-75] that hydrides tend to behave in a more ductile fashion
above 300°C, which means that hydride cracking is inhibited and Grange‟s model could
not be applied to predict high-burnup cladding failure during a RIA.

30
On a side note, it should be mentioned here that Fan and Koss [42] also measured
void density as a function of the Hill equivalent strain in the absence of a crack, and that
the behavior they had observed was at least qualitatively similar to that observed more
recently by Grange et al., thus explaining the similarities also obtained between Grange‟s
calculation of failure loci as a function of hydrogen and stress state and that measured
(a) (b)
(c)
Figure 1-13: (a) and (b): Prediction of crack opening displacement as a function of mesh
refinement and hydrogen content; (c) comparison of model behavior with actual behavior
using Grange et al.‟s modified GTN model: one should note differences in boundary
conditions. The images on the right-hand side show experimental behavior. In load-
displacement data, dots are experimental data and line is the simulation result [70].

31
experimentally by Fan and Koss, as shown in Figure 1-14. These failure loci have been
the basis for a large number of studies on the influence of hydrogen on the ductile failure
of Zircaloys.
Racine et al. [76, 77] also studied the influence of hydride orientation and
concentration on the deformation modes, damage and failure of hydrided Zircaly-4 at
room temperature. In this study, an anisotropic void nucleation model was developed
(a) (b)
(c) (d)
Figure 1-14: (a) and (b) Fan and Koss study: [42] void density as a function of equivalent
strain and failure loci as a function of hydrogen content and stress state; (c) and (d)
Grange et al. study: [70] void density as a function of equivalent strain and failure loci as
a function of hydrogen content and stress state

32
without taking into account the influence of damage on deformation behavior. The
model was adapted from one developed by Lemaitre et al. [78] to describe the influence
of micro-cracks and voids on failure. According to Racine et al., the advantage of their
method is its ability to be expressed with tensors which can take into account the
morphology and orientation of the fractured particles. In particular, the use of damage
mechanics as described by Racine can take into account radial hydride content. To assess
failure, an internal variable representative of damage is calculated and the failure
criterion is that this variable reaches a critical value equal to 1. Qualitatively, the model
was in agreement with experimental observations of the influence of radial hydrides on
deformation and failure at room temperature in the absence of an initial macroscopic
crack. Unfortunately, similar to Grange‟s model, Racine et al.‟s model is unlikely to be
able to predict cladding failure during an RIA due to the absence of hydride cracking at
temperatures above 300°C.
Perales et al. [79, 80] have proposed a micromechanical approach to model
hydride embrittlement and hydride induced fracture based on a frictional cohesive zone
model (FCZM) and on a multi-body method in the context of non-smooth contact
dynamics (NSCD). The proposed model can be used to study the propagation of a crack
in a two phase medium exhibiting a gradient of mechanical properties such as the
hydrided, anisotropic Zircaloy-4 matrix. With the use of periodic numerical
homogenization, the authors can then extract effective properties related to fracture
mechanics. This very complex mathematical approach provides good qualitative results,
and the results from the modeling reveal damage due to hydrides embedded in a Zircaloy-
4 matrix. An example of such simulations in the absence of an initial macroscopic crack
is shown in Figure 1-15. This figure shows that when hydrided cladding is deformed, the
model predicts the initiation and growth of cracks in the hydrided metal matrix. In
comparison with the previously described damage models, Perales‟ model appears more
promising for the prediction of high-burnup cladding failure during a RIA, because
theoretically the material parameter inputs could be changed to reflect high temperature
and high burnup conditions. However, the experimental challenges associated with
determining the necessary material parameters (cohesive forces between the Zircaloy

33
matrix and the hydrides, for example) cannot be neglected. In addition, the
computational resources and computation times necessary to implement this type of
model are currently quite prohibitive.
In summary, several damage models have been implemented to model the failure
of hydrided cladding at room temperature in the absence of a macroscopic crack. The
models usually postulate void initiation due to hydride fracture, which in turn has been
verified experimentally in a number of studies. In some cases, the failure criterion is
related to the conditions leading to ductile failure of an uncracked ligament between
voids, in other cases the failure criterion is in the form of a critical void density.
However, the general consensus is that hydride fracture is not a root cause for the failure
of hydrided Zircaloy-4 cladding at temperatures around 300°C. These models thus
appear to be inadequate for the modeling of high-burnup cladding failure during a RIA,
for two reasons: (a) the absence of a macroscopic crack in the proposed models and (b)
the absence of hydride cracking (hence absence of hydride induced voids) at temperatures
above 300°C. One recent study by Perales et al. stands out as a new way of looking at
damage within a hydrided Zircaloy-4 volume, using advanced micromechanical modeling
to simulate crack initiation and growth with a frictional cohesive zone model. However
this approach is still under development and more research is required before
implementation in RIA failure prediction codes.
Figure 1-15: Example of a broken assembly of 9 representative volume elements (RVE),
with the matrix in light gray and the hydrides in dark gray. One RVE is highlighted [80].

34
1.5 Fracture Toughness Studies on Cladding Materials
As described in section 1.3, during reactivity initiated accidents (RIA) high-
burnup cladding failure is likely to occur due to crack initiation in brittle layers of the
outer diameter of the cladding, followed by radial crack growth through the thickness
of the cladding, followed by axial crack propagation. Considering this, it seems natural
to generate fracture-mechanics based criteria to describe cladding failure during RIAs,
since these take into account the presence of cracks which are inherent to the fracture
process for high-burnup cladding during a RIA. The key parameter used to describe
failure in terms of fracture mechanics is either the fracture toughness (usually labeled KQ
and assuming near-linear elastic crack growth behavior) or the critical value of the J-
integral (or JQ, in the case of elastic-plastic fracture mechanics). It should be noted here
that although the J-integral represents a more general approach that takes into account
plasticity, due to their relative ease of use, fracture toughness values are often given
instead of J-integral values. To convert one into the other, the relationship given by
Eq. 1.5 is used, where E‟ is the effective modulus: E‟=E for plane-stress and E‟=E/(1-ν2)
for plane-strain, where ν is Poisson‟s ratio.
For both the KQ-value and the JQ-value, a critical value can be determined for the
onset of failure, representing critical conditions near the crack tip which result in crack
growth. This represents a fundamental difference with other types of criteria describe
previously, as those do not generally take into account crack growth. The fracture
toughness values reported in some studies that are not based on fracture mechanics are
usually obtained by fitting various experimental data sets (failure strains or failure
energies, for example) with fracture-mechanics analyses rather than by direct
measurement in a fracture toughness test. Thus this approach is inherently preferable.
This section consists of a review of fracture-mechanics studies performed on a
variety of zirconium base alloys used in the nuclear industry. Although the present study
pertains to Zircaloy-4 thin sheet, it is believed that any studies on the fracture toughness
'JEK (1.5)

35
of Zircaloy-2, Zircaloy-4 or other nuclear grade zirconium alloys in the form of sheet,
plate, thin-wall tubing, as well as thick-wall pressure tubing are of relevance for
comparison purposes. In addition, as described in the present review of the literature,
many qualitative trends observed within these materials are alloy and geometry
independent. The nomenclature for crack plane orientation and the direction of crack
growth has been normalized in standard ASTM E399 [81], and is shown in Figure 1-16.
This nomenclature system will be used throughout this literature review. Two directions
of particular interest are the axial crack growth in tube, equivalent to TL or CL, and radial
(through-thickness) crack growth in tube, equivalent to TS or CR.
Another important issue is the influence of specimen thickness on fracture
toughness values. Indeed, several studies described in this section have shown that the
degree of plastic constraint at the crack tip is influenced by specimen design, and that
specimen thickness has a significant influence of fracture toughness. This raises the issue
whether tests performed using thick specimen designs can produce accurate fracture
toughness values for application in thin-wall cladding.
(a) (b)
Figure 1-16: Crack plane identifications for (a) rectangular cross-sections and (b)
cylindrical and tubular cross-sections [81].

36
One of the earliest studies based on fracture toughness testing of Zircaloy to
investigate the effects of BWR and PWR conditions on fracture behavior was published
in 1969 by Hoagland and Rowe [82]. In this study, the influence of cold work, hydrogen
and neutron fluence on the fracture toughness of Zircaloy-2 are described. Double
cantilever beam (DCB) specimens were machined from Zircaloy-2 plate (6.5mm thick)
with various thermomechanical treatments (annealed and cold worked up to 40%) to
investigate two crack growth orientations, corresponding to the TL and LT orientations,
which are analogous to axial and circumferential crack growth in a tube, respectively. It
should be noted that circumferential crack growth is irrelevant for prediction of high-
burnup RIA failures, as this direction of crack growth has not been observed in that case.
The authors found that fracture toughness increased with temperature between -160°C
and 100°C, decreased with increasing cold-work, decreased with increasing neutron
fluence until saturation around 3x10²⁰
n.cm-2
, and decreased with increasing hydrogen
content. The toughness values reported for 20-40% cold worked material tested in the
TL orientation (axial crack growth) around 20°C were ~55-65 MPa√m for virgin
material, and dropped to ~45 MPa√m for saturation neutron fluence and ~30-35 MPa√m
for a hydrogen content equal to 400 wt.ppm. Unfortunately, Hoagland and Rowe‟s study
did not provide any data for through-thickness crack growth, used thick specimens, and
investigated a range of temperatures that is not relevant for RIA failure predictions or
normal light-water reactor operating temperatures.
Within the same time frame, Aitchison [83] and Watkins et al. [84] performed
separate studies investigating the room temperature fracture toughness of both Zircaloy-2
and Zr-2.5N, and just Zircaloy-2, respectively. Both studies performed fracture
toughness tests with single-edge-notch tensile specimens to investigate the influence of
hydrogen concentration and hydride orientation on toughness. Aitchison machined 5mm
thick specimens from a hydrided plate containing hydride platelets oriented parallel to the
plane of the plate (akin to circumferential hydrides). Different specimen orientations
(TL, SL and LS) were used to investigate the effect of hydride orientation with respect to
the crack. It was found that fracture toughness decreased with hydrogen content
independently of orientation, especially for the first 100 wt.pm. Also, crack growth was

37
easier in the SL orientation when hydrides were co-planar with the crack (with toughness
around ~10-40 MPa√m), but more difficult in the LS orientation when the hydrides were
perpendicular to the crack plane and crack growth direction (with toughness around ~60-
80 MPa√m) due to hydride cracking and delamination at the crack tip resulting in
blunting. It should be noted that unfortunately, none of the orientations studied
correspond to through-thickness crack growth under hoop deformation, as is the case in
thin-wall cladding tubes during a RIA. In the study by Watkins et al. on 5mm thick
specimens cut from tube, it is unclear what crack orientation was studied; however it
appears to correspond to the CL (or axial propagation under hoop deformation) crack
growth orientation. In their study, hydride reorientation under stress was performed and
linear-elastic fracture mechanics were employed to obtain fracture toughness values
(which is likely to be invalid due to the amount of plasticity in Zircaloy-2 at room
temperature, especially for low hydrogen contents). The room temperature toughness for
the case of circumferential hydrides was found to decrease with hydrogen content from
~65 MPa√m for unhydrided material to ~25 MPa√m for a hydrogen content of 800
wt.ppm. In the case of radial hydrides, the toughness was found to be on the order of 10
MPa√m and linear-elastic fracture mechanics were appropriate in that case.
In 1972, Walker published what appears to be the first fracture toughness study
performed on Zircaloy-4 [85]. In this study performed on unhydrided and unirradiated
Zircaloy-4 in the hot rolled annealed condition, the author focused on the effects of crack
orientation in relation to the ingot‟s extrusion direction. Both the wedge opening loading
(WOL) specimens with a thickness of 25mm and compact tension (CT) specimens with a
thickness of 10mm were used, and all six specimen orientations described in Figure 1-16
were tested at temperatures between -110°C and 135°C. Unfortunately, no testing was
performed at 300°C and above. The author found that fracture toughness was highly
dependent on specimen orientation, and increased with increasing temperature, as shown
in Figure 1-17. For the two orientations of most relevance with respect to the present
study, TL and TS (or WR and WT using the author‟s designations), toughness was
reported to be ~65 MPa√m and ~35-40 MPa√m, respectively. He also found that at all
temperatures tested the fracture surfaces showed signs of ductile failure with the presence

38
of ductile dimples. In a later study in 1974, Walker and Kass extended this investigation
to include the effects of hydrogen and irradiation [86]. It is unclear whether hydriding
took place during irradiation, but this does not appear to be the case. The authors found
that 250 wt.ppm of hydrogen in the Zircaloy-4 specimens reduced the fracture toughness
by a factor of 2 over the range of temperatures studied, and that for unhydrided
specimens the fracture toughness increased with fluence. This behavior is somewhat
contradictory with a number of later studies, but could be due to the use of linear elastic
fracture mechanics (LEFM) to measure fracture toughness. In fact, irradiation has been
shown to harden Zircaloy-4, thus increasing the failure load and the elastic fracture
toughness (which only depends on failure load and crack length), but the actual elastic-
plastic fracture toughness of the material decreases due to a decrease in ductility with
fluence.
Figure 1-17: Fracture toughness as a function of orientation and temperature for Zircaloy-
2. The correspondences of orientations with the ASTM standard go as follows: RT=LS,
WT=TS, WR=TL, RW=LT, TR=SL, TW=ST. The fracture toughness values given in
US units must be multiplied by ~1.1 to obtain MPa√m (SI units) [85].
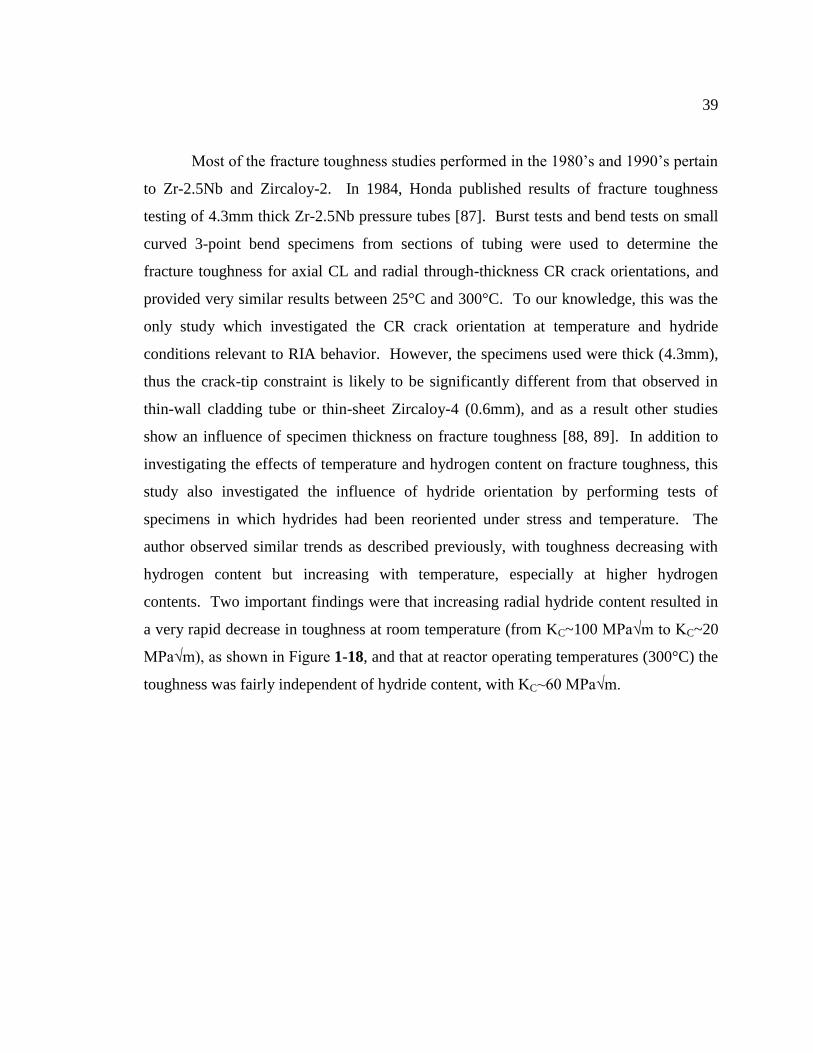
39
Most of the fracture toughness studies performed in the 1980‟s and 1990‟s pertain
to Zr-2.5Nb and Zircaloy-2. In 1984, Honda published results of fracture toughness
testing of 4.3mm thick Zr-2.5Nb pressure tubes [87]. Burst tests and bend tests on small
curved 3-point bend specimens from sections of tubing were used to determine the
fracture toughness for axial CL and radial through-thickness CR crack orientations, and
provided very similar results between 25°C and 300°C. To our knowledge, this was the
only study which investigated the CR crack orientation at temperature and hydride
conditions relevant to RIA behavior. However, the specimens used were thick (4.3mm),
thus the crack-tip constraint is likely to be significantly different from that observed in
thin-wall cladding tube or thin-sheet Zircaloy-4 (0.6mm), and as a result other studies
show an influence of specimen thickness on fracture toughness [88, 89]. In addition to
investigating the effects of temperature and hydrogen content on fracture toughness, this
study also investigated the influence of hydride orientation by performing tests of
specimens in which hydrides had been reoriented under stress and temperature. The
author observed similar trends as described previously, with toughness decreasing with
hydrogen content but increasing with temperature, especially at higher hydrogen
contents. Two important findings were that increasing radial hydride content resulted in
a very rapid decrease in toughness at room temperature (from KC~100 MPa√m to KC~20
MPa√m), as shown in Figure 1-18, and that at reactor operating temperatures (300°C) the
toughness was fairly independent of hydride content, with KC~60 MPa√m.

40
Between 1986 and 1988, Chow and Simpson published three studies investigating
the fracture toughness of Zr-2.5Nb and Zircaloy-2 pressure tubes for axial (CL) crack
growth. The first study [90] investigated the failure of a 5mm thick Zircaloy-2 pressure
tube from the Pickering-2 power plant using curved compact tension specimens (initially
described by Wallace in 1985 [91]) which were cut from the tube by spark machining,
and tested using electrical potential drop to monitor crack length. Fracture toughness was
determined as a function of temperature, hydride concentration and the hydride
orientation, and reported values for both ductile (J-integral) and brittle (K fracture
toughness) behavior ranged between 40 MPa√m at 230°C and 70 MPa√m at 280°C.
Importantly, it was found that a brittle to ductile transition occurred for test temperatures
Figure 1-18: Fracture toughness as a function of radial hydride content as defined by
Honda for Zr-2.5Nb at room temperature [87].

41
above 260°C in the presence of radial hydrides, suggesting that at these temperatures,
hydrides are either mostly dissolved or somewhat ductile and that their morphology no
longer influences the fracture toughness.
The second Chow and Simpson study, published in 1987, [92] is based on over
300 tests performed on Zr-2.5Nb (4.2mm thick) and Zircaloy-2 (5mm thick) using either
flattened CT specimens from tubing or curved CT specimens for tests of irradiated tubes
extracted from a reactor. Once again, axial crack growth was investigated as a function
of test temperature (25-300°C) hydrogen concentration ([H] = 40-750 wt.ppm),
irradiation, and hydride orientation. Typical fracture toughness values varied between 25
MPa√m at 25°C and 150 MPa√m at 300°C, function of hydrogen content and hydride
orientation (Figure 1-19(a)). Depending on specimen behavior, either linear-elastic
fracture mechanics (LEFM) or elastic-plastic fracture mechanics (EPFM) were used to
analyze raw data, and EPFM data was converted to K fracture toughness for practical
comparison reasons. The brittle to ductile transition reported previously for material
containing radial hydrides was confirmed, as seen in Figure 1-19(a). It was also found
that fracture toughness was controlled primarily by strength and hydride morphology, and
that temperature and irradiation influenced toughness primarily because of their effect on
strength. In parallel with Simpson and Chow, Davies et al. also performed a detailed
study on the influence of temperature on axial fracture toughness for Zircaloy-2
containing radial hydrides using flattened CT specimens 5mm in thickness [93]. Their
observations were almost identical to Simpson and Chow‟s, as shown in Figure 1-19(b).
The third study by Chow and Simpson, published in 1988, [94] was aimed at
justifying the use of curved CT specimens by comparing results from tests performed on
flattened and curved CT specimens from the same materials (Zircaloy-2 and Zr-2.5Nb
with a variety of heat treatments and hydriding to obtain a wide range of toughness
values). The authors concluded that the use of curved CT specimens gave identical
results, and that fracture-mechanics relationships valid for flat CT specimens could be
used for curved CT specimens without correction. Despite providing a large amount of
information on fracture toughness and analyzing the influences of a wide range of
parameters on fracture toughness, the studies described here did not investigate through-

42
thickness crack growth. In addition, the use of thick specimen geometries to obtain data
is unfortunately unlikely to be applicable for the case of thin-wall cladding used in light
water reactors due largely to differences in crack-tip constraint.
In addition to investigating the effects of temperature and hydrogen on the
fracture toughness of Zircaloy-2 and Zr-2.5Nb, Davies et al. also investigated the
influence of specimen design and flattening techniques on axial fracture toughness in Zr-
2.5Nb for CL axial crack orientations [88, 89]. These studies showed that the degree of
constraint of the crack tip as influenced by specimen design and thickness has a
significant influence of fracture toughness, hence the critical importance of specimen
thickness in determining fracture toughness values for application in thin-wall
(a) (b)
Figure 1-19: Maximum load fracture toughness versus temperature for tube containing
radial hydrides. (a) Simpson and Chow: [H] = 90 wt.ppm for unirradiated Zircaloy-2 and
[H] = 200 wt.ppm for irradiated Zircaloy-2 [92] (b) Davies et al.: HCC is the hydride
continuity coefficient [93].

43
cladding. In a later study focused on J-controlled crack growth, Davies and Smeltzer
also showed that plastic work dissipation (slope of the J-R curve) is governed by the
plane-stress plastic zone size in relation to the size of the remaining ligament and the
thickness of the specimens, see Figure 1-20 [95].
Finally Chow and Nho performed a study on the influence of specimen thickness
on axial (CL orientation) fracture toughness values obtained for the same material but for
different tube wall thicknesses [96]. An important finding was that fracture toughness
decreased with increasing wall thickness up to 3mm, and that the tearing modulus
(indicated by the slope of a J-R resistance curve) continued to decrease for thicknesses of
at least 4.2mm. Again, based on these observations, it is not possible to directly measure
the fracture toughness of thin-wall components using massive thick specimens.
In 1993, Huang published two studies on the influence of fast neutron fluence and
temperature (32°C-260°C) on the fracture toughness of Zircaloy-2 pressure tubes [97,
98]. Small CT specimens were extracted from pressure tubes and submitted to fracture
Figure 1-20: Correlation of dJ/da with limiting plane-stress plastic zone size and
specimen dimensions [95]

44
toughness tests in the CL orientation (axial crack growth) while monitoring crack length
using potential drop. As shown in Figure 1-21, the author found that fracture toughness
decreased somewhat linearly with fluence, and observed saturation of this effect above
fluences of 5·1025
n/m2 at 260°C. The toughness values measured for unirradiated
material were ~55-100 MPa√m (depending on temperature and amount of cold-work in
the tube used to obtain test specimens) and ~30 MPa√m for high fluences up to 6·1025
n/m2. The general conclusion was that brittle fracture potential increases with decreasing
temperature and increasing fluence. Similarly to the studies described above, Huang used
thick specimens (~5mm), which cannot directly be used to predict thin-wall cladding
behavior due to large differences in the degree of constraint. Also, Huang‟s study does
not include testing at 300°C and above, so the fracture toughness data reported cannot be
used to predict light water reactor cladding failure in the case of a RIA.
Another study performed on curved CT specimens from Zircaloy-2 pressure tubes
4mm thick and investigating fracture toughness in the CL orientation was performed by
Figure 1-21: Fluence dependence of fracture toughness for Zircaloy-2 tube tested at
various temperatures [97]

45
Dubey et al. in India [99]. The specimen geometry was identical to that used in some
studies by Chow, Simpson and Davies (described previously), and effects of temperature
and hydrogen content were investigated. Figure 1-22 shows fracture toughness values
determined in terms of J-integral and reported as toughness dJ/da and KJC. The authors
reported increasing toughness with increasing temperature except for very low hydrogen
contents, suggesting that the degradation of toughness at low temperature is due
principally to the presence of hydrides, and that the influence of hydrides essentially
disappears at high temperatures. The detrimental effects of increasing hydrogen content
(even at quite low hydrogen contents) were also observed, especially at lower
temperatures. In this study, the value of KJC at 373 K was about 78 MPa√m for
circumferential hydrides. This is to be compared with the studies of Davies et al. and
Chow and Simpson (Figure 1-19) on material containing radial hydrides, which showed a
fracture toughness calculated at the point of maximum load of about 25-35 MPa√m,
implying the more deleterious effect of radial hydrides in comparison to circumferential
hydrides.

46
With the exception of Walker‟s in 1974, all the studies presented up to this point
were performed on either Zircaloy-2 or Zr-2.5Nb. In addition, all of these studies
(including Walker‟s) have been performed with specimens obtained from pressure tubes,
thick plates or ingots with thicknesses ranging from 4mm to 25mm. Although these
investigations of fracture toughness describe many common trends which are to be
expected in Zircaloy-4 as well as Zircaloy-2 and Zr-2.5Nb, the differences in materials
and in specimen thickness prevent direct use of the published fracture toughness values
for applications in RIA failure prediction codes without further verification of their
applicability to thin-wall Zircaloy-4 cladding material. The remainder of this section
focuses on more recent investigations of fracture toughness in either thin-wall materials
or Zircaloy-4, or a combination of both.
One should note that most of the fracture toughness data provided in more recent
studies is given in terms of J-integral (in kN/m). The J-integral concept is a
generalization of fracture mechanics to include the effects of plasticity on crack growth
Figure 1-22: Change in fracture toughness with hydrogen content and temperature, CL
orientation, circumferential hydrides [99].

47
behavior. A common way to report J-integral data is to provide a J-R crack growth
resistance curve, which consists of reporting J-integral versus crack extension. From
these resistance curves, a variety of J-integral parameters may be defined, corresponding
for example to the onset of stable tearing (J0.2), the onset of unstable crack growth (Jc or
Ju), or even the value of J-integral at the maximum load during a test (JPmax). Different
authors have used different J-integral parameters to quantify material toughness. For
comparison purposes, these values of J-integral have been converted to K fracture
toughness values in MPa√m based on Eq. 1.5 with E=99.3GPa and ν= 0.37 at 25°C and
E=82.5GPa and ν= 0.41 at 300°C [100]. Such conversions are common in the literature,
and the resulting fracture toughness parameters are often noted „KJx‟, where x may take
different values depending on J-integral parameter used. More details on elastic fracture
mechanics are given in section 3.1.
Between 1996 and 2005, Grigoriev et al. published several studies based on a pin-
loading tension (PLT) test they developed in 1995 [101] to test notched rings made of
thin-wall Zircaloy-2 cladding tube material, shown in Figure 1-23(a)-(b). Their method
allowed them to generate elastic-plastic fracture toughness values for axial (CL) crack
growth in the form of J-R curves, by using the potential drop method to monitor crack
lengths. Specimen thicknesses were on the order of 0.80-0.82mm, a wall thickness
approaching that of Zircaloy-4 cladding tubes (typically 0.50-0.60mm). The authors used
the PLT configuration to test cold-worked, hydrided and irradiated cladding, and showed
that the trends observed in thick-specimen material were still present in thin-wall tubing
[102]. Fracture toughness decreased with increasing hydrogen content, increasing radial
hydride content, and increasing hydride continuity (the degree to which hydride particles
are linked to each other) at room temperature, but this fracture toughness decrease was
not observed at 300°C for hydrogen concentrations up to 900 wt.ppm. In addition, at
300°C and for hydrogen contents around 100-200 wt.ppm, the fracture toughness of
irradiated cladding was similar to that of cold-worked material. The J-integral at
maximum load was reported to be about 100kN/m (KQ~91 MPa√m) for both unhydrided
cold-worked cladding at room temperature and hydrided cladding at 300°C (for all
hydrogen contents up to 900 wt.ppm).

48
In a later study Girgoriev et al. [103] investigated the effects of texture on fracture
toughness of Zircaloy-2 cladding tubes using the PLT test. They tested material in which
basal poles were oriented 30° from normal along the radial-circumferential plane and 38°
along the same plane. They found that fracture toughness varied from ~140kN/m
(KQ~118 MPa√m) for an angle α=30° to ~80kN/m (KQ~89 MPa√m) for α=38°. These
results underline the importance of texture in determining ease of through-thickness
deformation and its contribution to fracture toughness in thin-wall cladding. Finally, in a
study published in 2005, [104] Grigoriev and Jakobsson performed J-R testing with the
PLT configuration on thin-wall Zircaloy-4 and measured J-integral values for axial crack
growth of 86kN/m (KQ~92 MPa√m) and 96kN/m (KQ~89 MPa√m) at 25°C and 300°C,
respectively. Unfortunately no through-thickness crack growth can be obtained with the
PLT test.
In more recent years, Bertolino et al. have published extensive data on fracture
toughness of Zircaloy-4; however, the vast majority of their work has employed thick
plate specimens and investigated crack orientations that are not directly applicable to RIA
type cladding failures. Using 6mm thick compact-tension (CT) specimens machined
from cold worked Zircaloy-4 plate in the LT direction (corresponding to circumferential
crack growth in cladding tube), the authors investigated the influence of hydrogen
content (from 10 wt.ppm to 2000 wt.ppm) and temperature (20°C-260°C) on the J-R
Figure 1-23: (a) PLT test specimen and (b) PLT test configuration [104]
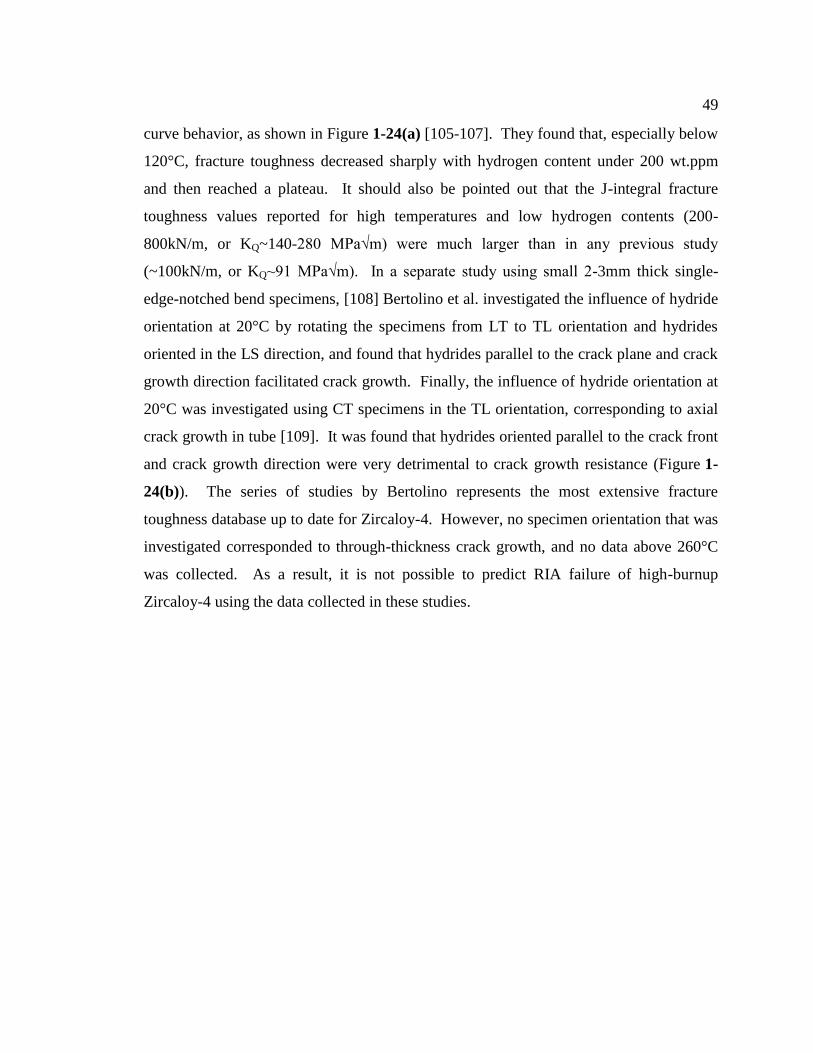
49
curve behavior, as shown in Figure 1-24(a) [105-107]. They found that, especially below
120°C, fracture toughness decreased sharply with hydrogen content under 200 wt.ppm
and then reached a plateau. It should also be pointed out that the J-integral fracture
toughness values reported for high temperatures and low hydrogen contents (200-
800kN/m, or KQ~140-280 MPa√m) were much larger than in any previous study
(~100kN/m, or KQ~91 MPa√m). In a separate study using small 2-3mm thick single-
edge-notched bend specimens, [108] Bertolino et al. investigated the influence of hydride
orientation at 20°C by rotating the specimens from LT to TL orientation and hydrides
oriented in the LS direction, and found that hydrides parallel to the crack plane and crack
growth direction facilitated crack growth. Finally, the influence of hydride orientation at
20°C was investigated using CT specimens in the TL orientation, corresponding to axial
crack growth in tube [109]. It was found that hydrides oriented parallel to the crack front
and crack growth direction were very detrimental to crack growth resistance (Figure 1-
24(b)). The series of studies by Bertolino represents the most extensive fracture
toughness database up to date for Zircaloy-4. However, no specimen orientation that was
investigated corresponded to through-thickness crack growth, and no data above 260°C
was collected. As a result, it is not possible to predict RIA failure of high-burnup
Zircaloy-4 using the data collected in these studies.

50
The latest studies on the fracture toughness of Zircaloy-4 have focused on
developing new geometries to allow for testing of thin-wall tubing for the case of axial
crack propagation (CL crack orientation). As part of these studies, Hsu et al. developed
the so called „X-specimen‟ test (Figure 1-25(a)), [110] which Hsu used in 2006 to
generate J-integral fracture toughness data for thin-wall (0.57mm) Zircaloy-4 cladding
tube in the cold-worked-stress-relieved condition, as a function of hydrogen content (150-
1200 wt.ppm) and temperature up to 300°C [75]. The study showed that fracture
toughness decreased with hydrogen content, especially at 25°C. Fracture toughness also
increased with temperature, especially at higher hydrogen contents. The toughness
values reported were very similar to those reported for Zircaloy-2 by Grigoriev, with
Jmax~115kN/m (KJmax~107 MPa√m) at 25°C and Jmax~97kN/m (KJmax~89 MPa√m) at
300°C (Jmax being the J-integral at the point of maximum load). This study shows
promise in predicting axial crack growth which occurs following through-thickness crack
growth in high-burnup thin-wall cladding during a RIA; however the issue of through-
thickness crack growth remains unresolved.
(a) (b)
Figure 1-24: (a) Fracture toughness as a function of hydrogen content and
temperature,[107] (b) influence of hydride re-orientation on fracture toughness at 20°C
[109].

51
Other testing geometries for thin-wall Zircaloy-4 cladding in conditions of axial
crack growth were developed by Bertsch and Hoffelner [111] and Ste-Catherine et al.
[112]. Using the double-edge-notched specimen shown in Figure 1-26(a), Bertsch
reported fracture toughness values of Jmax~94kN/m (KJmax~97 MPa√m) at 25°C for
hydrogen contents in the range 30-120 wt.ppm. Ste-Catherine et al. developed the
internal conical mandrel technique illustrated in Figure 1-26(b) to measure fracture
toughness and obtained KJ0.2~76 MPa√m at 25°C. At higher temperatures (300°C), large
scale plasticity only allowed to determine a lower bound (155 MPa√m) for the fracture
toughness. Similar to the comments made concerning Hsu‟s study, the studies by Bertsch
and Ste-Catherine may be useful to predict axial crack growth, but do not provide insight
into through-thickness crack growth behavior.
(a) (b)
Figure 1-25: (a) X-specimen geometry and (b) J-integral as a function of temperature and
hydrogen content [75].

52
Finally, in our previous studies at Penn State University [113, 114], a four-point
bend test was developed in an attempt to determine fracture toughness for through-
thickness crack growth. In that study, testing was performed at 25°C and 300°C using
hydrided Zircaloy-4 thin-sheet. The creation of a linear hydride blister across the width
of the specimen surface was used to generate a surface crack which was then propagated
through the thickness of the sheet. Despite providing a good basis for future work, the
outcome of that study in terms of fracture toughness values was limited. In fact, the lack
of real-time crack length monitoring prevented J-R resistance curve type data from being
generated. In addition, ASTM recommended fatigue pre-cracking was not used, and no
testing was performed above 300°C.
In summary, a large number of studies on the fracture toughness of zirconium
based alloys for applications in the nuclear industry have been performed, as summarized
in Table 1-2. The vast majority of earlier studies have focused on Zircaloy-2 and Zr-
(a) (b)
Figure 1-26: (a) Double-edge-notched tension specimen used by Bertsch; [111] (b)
Internal Conical Mandrel (ICM) technique used by Ste-Catherine et al. [112].
53
2.5Nb, while the later studies have focused on Zircaloy-4. Hydrogen was generally
present in the test specimens (with a few exceptions), and the effects of hydrogen content,
hydride orientation, or sometimes a combination of both have been studied in some detail
for a range of hydride microstructures relevant to the nuclear industry. Many crack
orientations have been studied, but most investigations have focused on TL or CL crack
orientations corresponding to axial crack growth in cladding tube, instead of focusing on
through-thickness crack growth configurations, such as TS and CR specimen
orientations. In fact, only two studies have investigated crack growth in a TS or CR
orientation akin to through-thickness crack growth in thin-wall cladding tubes, but
unfortunately both used thick specimens and only one reported testing at a relevant
temperature (300°C) for RIA behavior. This brings up the fact that only a few recent
studies have been performed on thin-wall cladding specimens instead of thick specimens
obtained from plate or pressure tubing. Unfortunately, it has been shown that specimen
thickness can significantly influence fracture toughness values [88, 89, 95]. Thus to
predict the failure of high-burnup thin-wall cladding tube under RIA loading conditions,
it is imperative to perform testing on thin-wall specimen geometries. In addition, a large
number of fracture toughness studies have not been performed in the temperature range
relevant to RIA behavior, that is 300°C and above. In conclusion, fracture mechanics are
likely to provide better criteria for RIA failures than are currently available, but large
deficiencies exist in the current literature for appropriate fracture toughness values. In
fact, there are currently no published studies which have investigated through-thickness
T-S or C-R crack orientations in thin-wall cladding-type materials containing hydrogen
and in the temperature range 300°C-375°C, believed to be relevant for RIA behavior. It
is the aim of the present study to provide such data.
Note: in Table 1-2, B (mm) is the specimen thickness; [H] is the hydrogen
content; T is the test temperature; H// and H∟ represent hydrides parallel to the crack
plane and normal to the crack plane (respectively); H orientation means hydride
orientation. The desired data corresponds to the combination of the following
requirements (as highlighted in the table). It should be noted that there is not one single
case for which all the requirements are simultaneously met.

54
Material: Zircaloy-4
Specimen thickness: B~0.6mm
Crack orientation: TS or CR
Test temperature: T≥300°C
Hydride content and microstructure

55
Table 1-2: Summary of selected fracture toughness studies published for Zirconium-base
alloys for application in the nuclear industry.

56
Notations:
DCB: Double Cantilever Beam
DENT/SENT/SENB: Double/Single-Edge Notch Tension/Bending
WOL: Wedge Opening Loading
CT: Compact Tension
PLT: Pin-Loaded Tension
ICM: Internal Conical Mandrel
[H]: hydrogen content in wt.ppm
H orientation: hydride orientation
T: temperature
Crack orientations are given in Figure 1-16.
1.6 Motivation for this Study
As described above, during a RIA, in-service cladding failure is likely to result
from crack initiation and growth. Cracks initiate in the less ductile areas of the surface of
the cladding (hydride rims or blisters), either at the onset of yielding in the case of
blisters and brittle rims, or after some finite strain if the rim is ductile. The cracks
present in the outer diameter of the cladding propagate first through the thickness of
the thin-wall cladding tube, and then, only after having breached the cladding wall,
propagate along the axis of the cladding tube. Many different approaches have been
implemented to define a failure criterion for high-burnup thin-wall cladding under such
RIA conditions, as described in more detail in sections 1.4 and 1.5 and recalled briefly
here.
Strain-based criteria based on ductility behavior are relatively simple; however
they are seldom applied directly, as many parameters can influence the critical strain
measurements, notably cracks. In addition, strain localization (which is often observed in
RIA cladding failures) is difficult to measure experimentally, and the direction in which
the strain is measured as well as the effects of post-failure cladding deformation, can
provide significantly different measurements of strain for a given failure event. As a

57
result, strain-based criteria are unlikely to provide reliable predictions, unless coupled
with fracture mechanics to account for crack growth leading to failure.
Strain-energy-density criteria are relatively easy to implement in failure
assessment codes, and they are still widely used to predict PCMI during RIAs. However,
many concerns have been expressed about the validity and accuracy of CSED criteria,
largely because this type of approach does not reflect actual failure mechanisms observed
in in-pile and out-of-pile tests. In particular, CSED does not take into account the
presence of a crack. Hence it seems unlikely that high-burnup cladding failure, which is
a result of crack initiation in brittle or near-brittle outer layers followed by first through-
thickness and then axial crack growth, could be accurately predicted by such a criterion.
Damage-based criteria often postulate void initiation due to hydride fracture to
model the failure of hydrided cladding at room temperature. However, these models
appear to be inadequate for the modeling of high-burnup cladding failure during a RIA,
primarily because of the absence of a macroscopic crack in the proposed models and the
absence of hydride cracking (hence absence of hydride induced voids) at temperatures
above 300°C.
In part because of obvious deficiencies in other types of approaches, but primarily
because of the fact that high-burnup cladding failure during a RIA involves the presence
of a crack, it seems fracture-mechanics based criteria are the most promising to
accurately predict failure in these cases. It should be recognized that the fracture
toughness may be sufficiently high so as to cause crack-tip blunting, especially at
temperatures well above 300°C. In this case an alternate failure mechanism (still
sensitive to blunted crack/notch depth) may intervene prior to crack growth.
Imperfection-induced shear instability is one possibility. A large number of studies on
this topic have been performed, however there are key deficiencies. Indeed, there are
only a few studies on thin-wall Zircaloy-4, and only our previous Penn State study was
performed in the condition of through-thickness crack growth which is initially the
critical step in cladding failure. In addition, little data is available at 300°C and above,
the temperature range relevant to RIA failures.

58
Consequently, the present study is an investigation of the fracture toughness of
hydrided Zircaloy-4 in conditions of through-thickness crack growth for temperatures up
to 375°C. To achieve this, a unique test method was developed in order to obtain the
fracture toughness of thin (~0.675 mm) unirradiated Zircaloy-4 sheet metal in which a
surface crack is propagated through the sheet thickness as a result of deformation in the
transverse direction, corresponding to hoop deformation in cladding tube (T-S or C-R
crack orientation). When compared to the previous Penn State study on through-
thickness crack growth, the present study is an improvement on many levels. Indeed, the
ASTM-recommended fatigue pre-cracking procedure was used, real-time crack length
monitoring was introduced to allowing for full J-R curves to be generated, new
quantitative methods to characterize the hydride microstructures were developed, and
testing was performed up to 375°C. New experimental procedures allowed for the
investigation of fracture toughness as a function of hydride concentration and orientation,
as well as temperature. It is the first time such data has been generated between 25°C and
375°C, making this study very relevant as a part of the current effort to assess high-
burnup cladding failure in the event of a RIA. It is hoped that the work done as part of
this thesis will be of use for the development of new RIA failure criteria incorporating
fracture mechanics as a way to accurately predict cladding behavior.

Chapter 2
Materials and Experimental Procedures
The main purpose of the present study is to determine the fracture toughness of
hydrided Zircaloy-4 under conditions of through-thickness crack growth at temperatures
ranging from room temperature to 375°C. In order to achieve this goal, the following
experimental tasks must be accomplished:
Characterization of the Zircaloy-4 sheet metal used in this study in the cold-
worked-stress-relieved (CWSR) condition. First, microstructural observations
of the grain structure of the sheet metal were performed. Then the texture of the
material was measured by the means of pole figures and calculating the Kearns
factors [27]. Finally, the flow behavior of the sheet metal was characterized at
25°C, 300°C and 375°C in the rolling and transverse directions.
Development of a procedure in which a “starter” crack of known depth is
injected into the sheet specimen across its width. This condition was achieved
by hydriding a Zircaloy-4 specimen to obtain a linear blister of controlled depth
extending across the specimen width. The procedure relies on the fact that
hydride blisters crack at roughly the yield strain of the matrix at room
temperature, thus creating a pre-crack [51]. The added benefit of this procedure is
the introduction of hydrogen into the Zircaloy-4 substrate underneath the blister in
the form of zirconium hydride particles. These hydride particles are discrete and
elongated, and are usually oriented parallel to the plane of the sheet similar to the
circumferential hydrides in cladding tube material. It should be noted that
hydrides orientated normal to the plane of the sheet were observed occasionally
near large hydride blisters.
Design of a test procedure in which the crack growth resistance through the
thickness of hydrided Zircaloy-4 sheet specimens may be determined using
load-displacement behavior of the bend specimens. In order to do so, the crack

60
length must be known during testing so as to be correlated with the load-
displacement response. Using electrical potential drop (EPD) to monitor crack
growth during fracture toughness tests, the crack growth resistance behavior was
determined at 25°C, 300°C and 375°C.
Characterization of the hydride microstructure in terms of hydrogen content
and hydride distribution. In order to interpret fracture toughness behavior as a
function of not only temperature but also hydride microstructure, the hydrogen
content and hydride distribution were characterized in the vicinity of the crack tip
using image analysis techniques.
2.1 Materials
In this study, Zircaloy-4 sheet metal with a thickness of 675μm was provided by
Teledyne Wah-Chang in the cold-worked material state. Prior to testing of the material,
stress relieving was performed for two hours at 520°C under vacuum at ~1.5x10⁻⁴
Pa,
resulting in a cold-worked-stress-relieved (CWSR) material state. The CWSR Zircaloy-4
sheet was characterized in terms of its microstructure, texture, and flow behavior at 25°C,
300°C and 375°C. The procedures employed to perform these characterization tasks and
the results obtained are presented in this section.
2.1.1 Microstructure and Texture
The general microstructure of the CWSR Zircaloy-4 sheet was characterized in
the three orthogonal directions of the sheet using polarized-light microscopy. The
specimens were ground using silicon carbide paper down to a 1200 grit finish and
chemically etched by swabbing for ~ 5 seconds using a solution of 45% water, 45% nitric
acid and 10% hydrofluoric acid, as recommended in the ASM handbooks [115]. The
resulting micrographs are shown in Figure 2-1. The grains in the CWSR Zircaloy-4 sheet

61
appear to be pancake shaped, oriented parallel to the plane of the sheet, and elongated in
the rolling direction. Line intercept counts gave an average grain size of roughly 6μm x
4.5μm x 3μm, with an error of ±1μm. The observed microstructure is that expected from
the cold rolling operation used to fabricate the Zircaloy-4 sheet. Since the stress-relief
heat treatment does not cause recrystallization to occur, this microstructure is also typical
of cold-worked-stress-relieved sheet Zircaloy-4.
Because thin-sheet and tube products made of CWSR Zircaloy-4 tend to have a
very strong texture which can influence deformation mechanisms and thus mechanical
behavior [12], texture measurements were performed on the CWSR Zircaloy-4 sheet used
in this study to confirm that it is similar to CWSR Zircaloy-4 sheet and to CWSR
Zircaloy-4 cladding tube used in previous studies. Pole figures were generated for the
{002}, {100}, {110}, {101} and {103} planes using a four-circle goniometer, and the
Kearns texture parameters [27] were computed using two different methods in all three
orthogonal directions (sheet/tube): normal/radial, transverse/circumferential, and
rolling/axial.

62
The normalized pole figures measured up to χ=85° for the {002} and {100}
planes are shown in Figure 2-2. It can be deduced from these pole figures that the basal
poles are tilted about 30° away from the normal direction in the transverse direction, and
that one of the prism pole directions is aligned with the rolling direction, as described by
Tenckhoff for sheet metal with an hcp crystal structure for which the lattice parameters
Figure 2-1: Polarized-light micrographs of CWSR Zircaloy-4 sheet in the three
orthogonal directions. The grain shape and size is schematically shown in the top-left
corner

63
are such that c/a<1.633 [12]. In addition, the splitting of the basal pole maxima confirms
that the material was not recrystallized during stress relieving (as is also obvious in the
light micrographs shown in Figure 2-1). Recrystallization would have caused the basal
pole figure to exhibit a single maximum normal to the sheet. The pole figures shown in
Figure 2-2 are those expected for CWSR Zircaloy-4 sheet, and are very similar to those
observed in other studies on CWSR sheet Zircaloy-4 and on CWSR cladding tube [43,
54]. One difference however is the asymmetry observed in the basal pole maxima, with
the left pole maximum being about 54% larger than the right pole maximum. In fact, the
peak intensities were 7.9 times random and 5.1 times random for the left and right {002}
pole maxima, respectively. It is unclear why this asymmetry was observed in the CWSR
sheet Zircaloy-4. Such a texture could potentially be observed in the early stages of
cross-rolling of the sheet. However, according to the manufacturer‟s records, no cross-
rolling took place in manufacturing the present sample.

64
Figure 2-2: Pole figures measured for CWSR Zircaloy-4 thin-sheet for the {002} and
{100} planes, respectively top and bottom. The intensities have been normalized by the
average intensity. Note: the higher intensity of the basal poles on the left-hand side
corresponds well with the higher intensity of the prism poles on the right-hand side.
Rolling Direction
Transverse
Direction
Rolling Direction
Transverse
Direction

65
Two methods exist to measure the Kearns texture parameter: (a) the direct
measurement of pole figures on a single specimen, and (b) inverse pole figure
measurements from three specimens of the same material oriented in the three orthogonal
directions [116]. Both methods were used to calculate the Kearns parameters for the
CWSR Zircaloy-4 thin sheet used in this study, and they are described below. The
Kearns texture parameter is defined as the resolved fraction of basal planes {002} along a
reference direction „i‟.
The first procedure consists of measuring the pole figures for five families of
planes ({002}, {100}, {110}, {101} and {103}) in order to generate orientation
distribution functions (ODFs), which allow for calculation of any complete pole figure
for the material being analyzed. Using the ODFs, the full {002} pole figure was
calculated for all three reference directions (normal, rolling and transverse). The average
pole intensity I as a function of the angle χ from the reference direction was then obtained
and integrated using Eq. 2.1 to obtain the Kearns texture coefficient for the corresponding
reference direction „i‟.
The second procedure was introduced by Kearns [27] and is more efficient than
the former in terms of data collection times; however it requires more extensive sample
preparation. It is based on the measurement of the intensity of 18 poles to construct an
inverse pole figure of the basal plane in all three orthogonal directions: normal, rolling
and transverse, thus allowing for the calculation of the Kearns texture parameter in these
three directions. In order to measure the Kearns texture parameters in the rolling and
transverse directions, several layers of sheet metal (0.6 mm thick) must be stacked as
shown in Figure 2-3 to obtain a sufficiently large sample to perform X-ray diffraction and
2
0
2
0
2
sin
sincos
dI
dI
f i (2.1)

66
obtain the intensity of the 18 poles necessary to generate an inverse pole figure in each
orthogonal direction [27, 116].
The θ-θ scans were performed on three specimens corresponding to the three
orthogonal directions of the Zircaloy-4 sheet, for a 2θ range from 30° to 140° in order to
obtain the intensity of enough poles to generate an inverse pole figure in each of these
orthogonal directions. The measured integrated intensities were then normalized to those
from a random sample (obtained from the Powder Diffraction File (PDF) # 00-005-0665
for zirconium[117]), thus providing an approximate value of the texture coefficient TC(χ)
corresponding to the intensity of the (002) plane at an angle χ to the surface. This
method, devised by Kearns [27], determines the density of the (002) poles at an angle χ to
the surface from that of (hkl) poles at an angle χ from (002). For example, (102) is
oriented 42.5° from (002) thus one estimates I(42.5°) from the normalized integrated
intensity of (102).
For each orientation (normal, rolling and transverse), the texture coefficients for
the (10*), (11*) and (21*) families of poles were then plotted as a function of χ and the
average texture coefficient of the (002) plane was computed from these texture
Figure 2-3: Stacked assembly of Zircaloy-4 sheet layers mounted with epoxy into a steel
frame. Such assemblies were used to obtain XRD data in the rolling and transverse
directions.

67
coefficients as follows using Eq. 2.2, 2.3 and 2.4. An example of this procedure is shown
in Figure 2-4 for the normal direction specimen.
Region 1:
Region 2:
Region 3:
Figure 2-4: Texture coefficients as a function of the angle χ in the direction normal to the
sheet surface and for a cold-worked-stress-relieved (CWSR) specimen
1TCTCI (2.2)
2
21 TCTCTCI
(2.3)
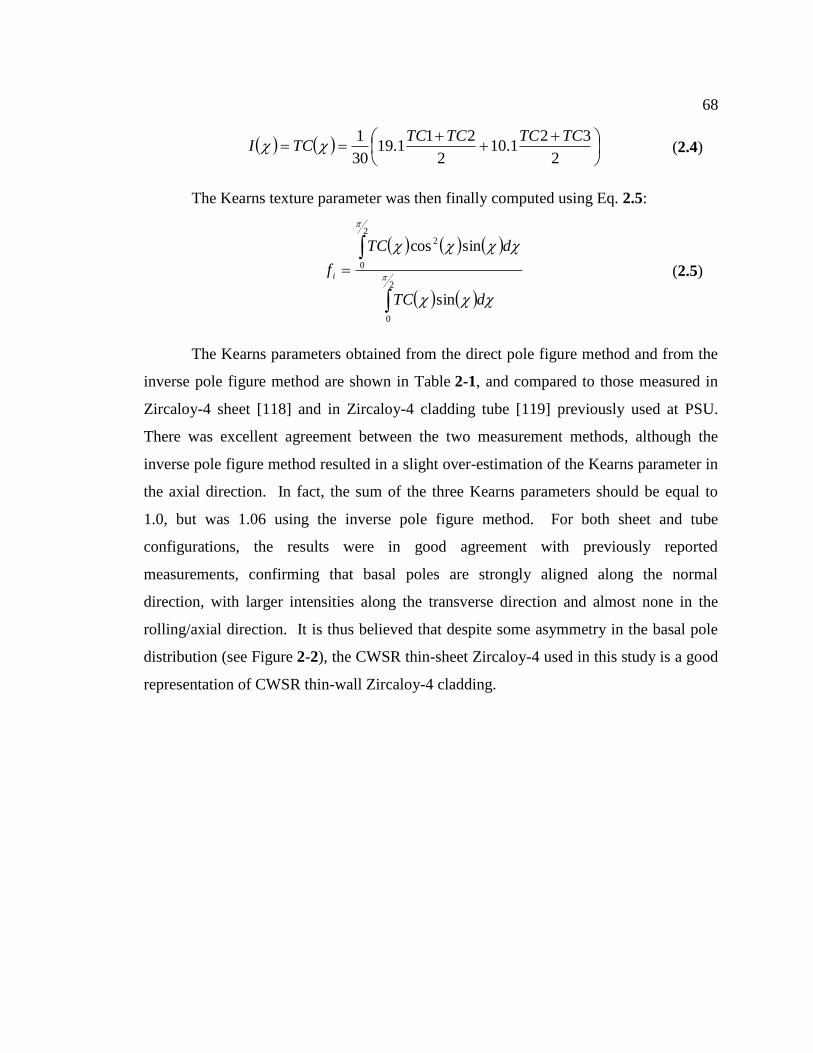
68
The Kearns texture parameter was then finally computed using Eq. 2.5:
The Kearns parameters obtained from the direct pole figure method and from the
inverse pole figure method are shown in Table 2-1, and compared to those measured in
Zircaloy-4 sheet [118] and in Zircaloy-4 cladding tube [119] previously used at PSU.
There was excellent agreement between the two measurement methods, although the
inverse pole figure method resulted in a slight over-estimation of the Kearns parameter in
the axial direction. In fact, the sum of the three Kearns parameters should be equal to
1.0, but was 1.06 using the inverse pole figure method. For both sheet and tube
configurations, the results were in good agreement with previously reported
measurements, confirming that basal poles are strongly aligned along the normal
direction, with larger intensities along the transverse direction and almost none in the
rolling/axial direction. It is thus believed that despite some asymmetry in the basal pole
distribution (see Figure 2-2), the CWSR thin-sheet Zircaloy-4 used in this study is a good
representation of CWSR thin-wall Zircaloy-4 cladding.
2
321.10
2
211.19
30
1 TCTCTCTCTCI (2.4)
2
0
2
0
2
sin
sincos
dTC
dTC
f i (2.5)

69
2.1.2 Flow Behavior
As previously mentioned, the material used in this study is Zircaloy-4 sheet,
675μm thick, obtained from Teledyne Wah-Chang initially in the cold-worked (CW)
state. All specimens used in this study were annealed in a vacuum furnace at 1.5x10⁻⁴
Pa
and 520°C for two hours in order to obtain a cold-worked-stress-relieved (CWSR)
material state. Tensile tests were performed at 25°C, 300°C, and 375oC in order to obtain
material flow parameters at these temperatures in both rolling and transverse directions.
Tensile specimens were machined from the Zircaloy-4 sheet metal with tensile axes in
the rolling and transverse directions. The gauge dimensions were 40mm long by 10mm
wide, such that the ratio of gauge length to width was 4:1. Extended grip sections were
used for high temperature testing so as to avoid heating the grips.
Three specimens were tested at each temperature. The first specimen was tested
to failure so as to determine the yield strength for 0.2% plastic deformation, the ultimate
tensile strength, and the elongation to failure. The other two specimens were tested to
Table 2-1: Calculated Kearns parameters for Zircaloy-4 sheet material used in this study,
compared with previous studies.
Direction Normal/Radial Transverse/Circumferential Rolling/Axial
Pre
sen
t st
ud
y
CW
SR
sh
eet
Direct pole figure
method 0.59 0.29 0.12
Inverse pole figure
method 0.59 0.31 0.16
Pre
vio
us
stu
die
s
CWSR sheet[118] 0.59 0.31 0.05
CWSR tube[119] 0.58 0.32 0.10

70
maximum load, corresponding to the maximum strain for which uniform elongation is
obtained, so as to measure the plastic anisotropy ratios R and P, respectively. As given
by Eq. 2.6, the ratios R and P correspond to the ratio of the width strain to the thickness
strain when the principal tensile axis is parallel to the rolling or transverse direction.
In addition, the portions of the true stress-true strain curves between either 1% or 2%
plastic strain (depending on which provided the best fit) and the plastic strain at
maximum stress were fitted using a power law relationship in order to obtain the strength
coefficient k and the strain-hardening exponent n at all three test temperatures. That
relationship is given by Eq. 2.7, where ζ is the true stress and εp is the true plastic strain.
The CWSR Zircaloy-4 sheet‟s flow behavior in the transverse direction is shown
in Figure 2-5 and summarized in Table 2-2, in comparison with that of CWSR Zircaloy-4
sheet [51] and of CWSR Zircaloy-4 cladding tube [43] previously used at Penn State. In
addition, although of lesser interest for this particular study, the material flow behavior in
the rolling direction is summarized in Table 2-3.
transversethickness
width
rollingthickness
width PR
(2.6)
n
pk (2.7)

71
Figure 2-5: True stress-strain curves for the CWSR Zircaloy-4 thin-sheet used in this
study, at 25°C, 300°C and 375°C, and compared with the behavior of CWSR Zircaloy-4
thin-sheet used in previous studies [51], as well as CWSR thin-wall Zircaloy-4 cladding
tube [43].

72
Table 2-2: Flow behavior of CWSR Zircaloy-4 in the transverse or hoop direction
σ0.2% (MPa) σu (MPa) k (MPa) n ef (%) P
25
°C
Previous studies at PSU with CWSR sheet [51]
573 NA 610 0.01 19 2.2
CWSR Sheet (this study) 575 595 647 0.018 17 2.6
Unirradiated CWSR Cladding [43]
590 NA 914 0.068 NA 1.3
30
0°C
Previous studies at PSU with CWSR sheet [51]
318 NA 372 0.03 16 1.6
CWSR Sheet (this study) 315 340 394 0.032 20 1.9
Unirradiated CWSR Cladding [43]
350 NA 585 0.059 NA 1.5
37
5°C
CWSR Sheet (this study) 290 330 375 0.027 22 1.6
In this table, ζ0.2% is the yield stress at 0.2% plastic deformation, ζu the ultimate tensile
stress, K the strength coefficient, n the strain-hardening exponent, ef(%) the elongation to
failure, and P the plastic anisotropy factor. Results obtained in this study are in bold.

73
When compared with unirradiated Zircaloy-4 cladding tube in the transverse
direction, the CWSR sheet material used in this study is slightly softer and has a much
smaller strain-hardening exponent, thus making it more similar to irradiated cladding.
When compared to sheet Zircaloy-4 used in previous studies at PSU at 25°C and 300°C
[43, 51], the sheet material used in this study displays very similar strength and strain-
hardening behavior, but its elongation to failure at 25°C is 2-4% lower in both test
orientations and 4% higher at 300°C, when tested in the transverse direction. The
material used in this study has a higher plastic anisotropy ratio P when compared to both
the sheet Zircaloy-4 previously used at PSU and cladding tube, but this difference is
reduced at 300°C. At 25°C, the plastic anisotropy ratio R is smaller for the material used
in the present study when compared to sheet Zircaloy-4 previously studied at PSU.
From the above we can conclude that overall, despite some differences, the thin-
sheet Zircaloy-4 used in the present study is very similar to the sheet materials used in
previous studies at PSU, and is a good representation of thin-wall Zircaloy-4 cladding
tube, particularly around 300°C, where differences in anisotropy are reduced. The
Table 2-3: Flow behavior of CWSR Zircaloy-4 in the rolling direction
σ0.2% (MPa) σu (MPa) k (MPa) n ef (%) R
25
°C
Previous studies at PSU with CWSR sheet [51]
489 NA NA 0.1 24 3.0
CWSR Sheet (this study) 485 606 829 0.09 20 1.9
30
0°C
CWSR Sheet (this study) 273 360 478 0.077 22 1.6
37
5°C
CWSR Sheet (this study) 250 328 405 0.053 21 1.5
In this table, ζ0.2% is the yield stress at 0.2% plastic deformation, ζu the ultimate tensile
stress, K the strength coefficient, n the strain-hardening exponent, ef(%) the elongation to
failure, and R the plastic anisotropy factor. Results obtained in this study are in bold.

74
relatively large differences in strain-hardening behavior between the thin-sheet Zircaloy-
4 used in this study and unirradiated cladding tube makes the former more similar to
irradiated cladding, thus providing a good representation of in-service behavior. Finally,
it is believed that the similarities observed between the thin-sheet Zircaloy-4 used here
and the actual cladding tube at 25°C and 300°C are very likely an indication of similar
behavior at 375°C.
2.1.3 Hydrogen Charging
To conduct the tests to measure fracture toughness, a crack must be created that
will propagate into a representative hydride microstructure. In order to generate a surface
crack extending across the width of thin-sheet 4-point bend specimens, a brittle hydride
blister in the form of a thin (~ 200μm - 700μm wide) strip extending across the width of a
bend specimen (~25 mm wide) was created in all test specimens. Upon loading, the
brittle blister cracked, thus resulting in the creation of a sharp crack on the Zircaloy-4
sheet specimen surface. Another important benefit of this procedure was the production
of a hydride microstructure within the Zircaloy-4 substrate that was similar to that
observed in high-burnup cladding. The following gaseous hydrogen charging procedure
was used to form a “linear” hydride blister of controlled depth with discrete hydride
precipitate particles in the substrate beneath the blister, as illustrated in Figure 2-6.
For the hydrogen to be absorbed by the Zircaloy-4, the surface must be free of the
native oxide which acts as a barrier for hydrogen diffusion into the Zircaloy-4 substrate.
To remove this natural oxide, the Zircaloy-4 specimens were immersed for 45-60 seconds
in a solution of water (10 parts), nitric acid (10 parts) and hydrofluoric acid (1 part) to
remove the natural oxide layer (1). A 5 nm thick gold layer was then sputter-deposited
on both surfaces of the sheet-Zircaloy-4 specimens in order to prevent further oxidation
and act as a barrier for hydrogen diffusion into the substrate (2). A diamond scribe was
subsequently used to remove the gold barrier from a thin line (~ 100μm wide) across the
specimen (3). Immediately after removal of the thin gold strip, the specimens were
coated with nickel (99.995% pure) using a Semicore® evaporator (4). The nickel film

75
(about 20 nm thick) was deposited by electron-gun evaporation under a vacuum of about
10-6
Torr, at a deposition rate of about 0.2 nm/s. The permeability of nickel to hydrogen
gas results in a “window” for hydrogen pickup (5), thus allowing the absorption of the
hydrogen gas into the substrate only along the thin strip where the gold was removed (6).
Gaseous hydrogen charging was performed in a quartz tube vacuum furnace at
temperatures varying between 370°C and 400°C. The Zircaloy-4 specimen was
introduced into the cool section of the vacuum chamber which was subsequently
evacuated to a base pressure of ~ 1.5x10⁻⁴
Pa, at which point the specimen was moved to
the hot portion of the tube and a finite volume of mixture of argon and hydrogen gas
(12.5% H2, balance Ar) was introduced until the total measured gas pressure in the
furnace tube equaled ~ 62 kPa. Charging times ranged from 20 minutes to 120 minutes,
after which the hydrogen and argon gas mixture was pumped out, and the specimen
moved to the cool section of the tube, where it cooled relatively rapidly at a rate of
~150°C/min.
During the cooling following hydrogen charging, the hydrogen in solution in the
Zircaloy-4 substrate at the elevated charging temperature precipitated in the form of small
hydrides dispersed in the matrix. As a result, annealing was necessary to obtain a coarser
Figure 2-6: Schematic representation of the hydrogen charging procedure: (1) natural
oxide removal with acid, (2) gold sputter coating, (3) gold removal by scribing, (4) nickel
coating, (5) hydrogen charging, (6) final result.

76
hydride microstructure, similar to that observed in service within Zircaloy cladding tubes.
Thus, all specimens were annealed for up to 30 minutes at 400°C and then furnace-cooled
at an initial cooling rate of ~100°C/hr. As will be discussed later, the resulting
microstructure consisted of hydride blisters with depths ranging from ~50 microns to
~320 microns. Elongated zirconium hydrides were also present throughout the substrate
beneath the blister, mostly oriented in the plane of the sheet metal. Out-of-plane hydrides
also formed under large blisters, thus forming a “sunburst” branching from the blister (as
indicated by an arrow in Figure 2-7b) and a field of out-of-plane hydrides mixed with in-
plane hydrides underneath it. An example of one such hydride microstructure is shown
in Figure 2-7 before and after annealing; the hydride microstructures obtained are
discussed in more detail in Section 2.3.
2.2 Fracture Toughness Testing
In order to measure the fracture toughness of CWSR hydrided Zircaloy-4 thin-
sheet under conditions of through-thickness crack growth, a four-point bend test
configuration was used, similar to that used in a previous study [114]. Pre-cracking was
Figure 2-7: Micrograph of a specimen charged at 370°C (a) before annealing and (b)
after being annealed at 400°C for 10 minutes then furnace cooled. The blister is under the
scribe mark (V-shape groove), and sunburst hydrides are visible under the blister.

77
thus a two-step process wherein the brittle zirconium hydride blister was first cracked to
produce a surface crack which was then grown to a desired length by fatigue cycling the
specimen. Fracture toughness testing was then performed while monitoring the load and
crack-growth behavior in order to obtain J-integral type data. In comparison with our
previous study on through-thickness crack growth, fatigue pre-cracking was introduced,
allowing for a more precise knowledge of the crack depth and crack front profile, and for
the determination of fracture toughness as a function of hydride microstructure.
Furthermore, the addition of real-time crack length monitoring allowed for full J-R
curves to be generated, instead of single-point fracture toughness values. This section
describes these procedures in more detail.
2.2.1 Test and Specimen Design
Failure of hydrided Zircaloy cladding tubes under simulated RIA accidents [34]
usually occurs after finite plastic strains accumulate after cracks form within the heavily
hydrided surface layer. Predicting such a ductile crack growth process implies the use of
elastic-plastic fracture mechanics, in which the crack grows by increments in a stable
manner through the thickness of the specimen. To simulate such through-thickness crack
growth behavior, fracture toughness testing was performed using a four-point bend
configuration which could allow for stable crack growth to occur in a through-thickness
orientation. Figure 2-8 shows the specimen and test fixture designs used.
The present design used conventional four-point bend geometry with the distance
between the inner pins (7.7 mm) roughly equal to one third of the outer pin spacing
(23.85 mm). This specimen configuration allowed for uniform bending between the
center loading pins, which were sufficiently far apart that the stress fields resulting from
the contact of the pins with the bend specimen did not affect crack growth under the
hydride blister. The top of the bend fixture had a V-shaped groove normal to the axial
direction of the loading pins, and a 2 mm diameter pin was placed in this groove to
suppress any bending moment transfer to the crack induced by the contact between the
upper ram and the top of the fixture. This procedure also improved alignment of the

78
fixture with the load axis. All bend testing was performed under displacement control
conditions in a screw-driven Instron® model 5866 machine using a 1 kN load cell with a
crosshead speed of 0.5 mm/minute. Displacement control during testing allowed for
stable crack growth (or crack growth arrest in some cases where unstable crack growth
was observed) due to the loss of load associated with crack growth, which in turn caused
a loss of driving force for crack growth. Given the small thickness of the sheet Zircaloy-
4 used in this study (~0.6 mm), and the range of specimen widths tested (≤ 24 mm), the
measured loads never exceeded 600N.
The initial dimensions of the hydrided specimens were approximately 32 mm in
width, 38 mm in length, and 0.6 mm in thickness. Following blister pre-cracking
(described in Section 2.2.2), the two edges of the specimens were cut with a diamond
blade in order to reduce specimen width to less than 24 mm so that they could fit into the
bend fixture with guide rails. The two strips of material that were cut off the hydrided
specimen were subsequently used to determine the hydride configuration and blister
depth of the test specimen as described in Section 2.3.1.
In many cases the 24 mm wide pre-cracked specimen were sectioned into several
specimens of reduced width prior to testing. As will be described later, this procedure
was subsequently adapted in order to ensure testing of specimens with more uniform
crack fronts (i.e. of nearly constant crack length) across the (reduced) specimen width.
This procedure also allowed different sections of the same specimen to be tested at
different temperatures to study the effect of temperature on fracture toughness for
specimens containing approximately the same crack length and hydride microstructure.
Another benefit of this procedure was an enhanced sensitivity of the electrical potential
drop method to changes in crack length, as described in Section 2.2.3.

79
2.2.2 Pre-Cracking
In order to properly conduct a fracture toughness test, it is necessary to inject a
sharp crack of known length into the test specimen. In this study, pre-cracking was done
in two steps. First, the crack was created into the specimen surface as a result of the
cracking of the linear hydride blister extending across the specimen width. Second, the
resulting surface crack was grown into the specimen thickness by cyclic fatigue loading.
In contrast with a previous study that relied only on hydride blister cracking [114], this
two-step procedure provides several advantages. First, the characteristic appearance of
the fatigue pre-crack on the fracture surface allowed for very precise knowledge of the
crack depth and profile. Second, because the hydride microstructure varied through the
thickness of the test specimens (as will be described later), fatigue pre-cracking allowed
for control over the type of hydride microstructure at the crack tip. Importantly, this
(a) (b)
Figure 2-8: (a) Schematic drawing of the four-point bend specimen and fixture (W:
specimen thickness, B: specimen width); (b) Picture of the test fixture with a specimen
loaded (Note: the schematic representation and picture are inverted).
W
B

80
procedure enabled a measurement of the fracture toughness as a function of hydride
microstructure. Third, fatigue pre-cracking ensured that the crack tip had moved beyond
the small region beneath the hydride blister which might have been plastically deformed
during the hydride blister pre-cracking phase. Last, fatigue pre-cracking is the standard
procedure for fracture toughness testing as described in ASTM standard E 1820 [120] for
fracture toughness testing.
For the first step, the goal was to stop loading the specimen as soon as the blister
was completely cracked, but before subsequent bending caused the crack to extend
beyond the blister depth. To achieve this goal, acoustic emission signals emitted from the
specimen during bending were monitored in order to detect blister cracking and used to
assess when to stop specimen deformation during this initial pre-cracking phase.
Acoustic emission data was measured during several pre-cracking test sequences
using an acoustic emission amplifier coupled with the Mistras® software. An acoustic
emission transducer was attached to the top of the four-point bend fixture in between the
center loading pins to record the data. Preliminary testing indicated that a threshold of
55dB could be used to eliminate most extraneous noise. Figure 2-9 shows the acoustic
emission events above the threshold during testing of a Zircaloy-4 sample containing a
~200m blister, which formed a crack within the blister and across the ~24mm wide
specimen. Typical energies for hits associated with blister cracking ranged from 5000 to
15000 energy counts and could easily be distinguished from hits associated with noise
from the load frame and fixture, which had much lower energies, and were proportional
to the load (points below the dashed line in Figure 2-9). Thus the points inside the box
on Figure 2-9 are associated with blister cracking. It is believed that the multiple hits
shown inside the box correspond to both (a) the blister cracking by increments (either
along the blister‟s length or through its depth) rather than all at once, or (b) the creation
of more than one crack in some instances. It should be noted that when more than one
crack was present, only the deepest crack advanced during fatigue pre-cracking. When
present, the other shorter cracks were confined to the hydride blister and did not open up
during subsequent fracture toughness testing, thus having a negligible influence on the
test results. In fact, the fatigue pre-crack length was generally at least two times larger

81
than the blister depth, which resulted in a stress intensity factor at least 50% larger at the
tip of the fatigue pre-crack than at the tip of a secondary crack contained within the
blister.
Crack-initiation testing with acoustic emission monitoring showed that, at room
temperature, blister cracking occurred between 50% and 110% of the yield load. As a
result, subsequent test specimens were loaded to the onset of yielding at room
temperature to create the desired crack. In addition, an examination of the specimen
surface along the entire width of the blister under a light microscope was used to confirm
the presence of a single crack in the hydride blister. It should be noted here that in later
testing, hydride blister crack-initiation was often performed under 3-point bending in
order initiate the crack at lower loads.
Figure 2-9: Acoustic emission events (blue dots) recorded during a bend test to failure,
superimposed with the corresponding load-time data.
Acoustic signals
scaling with the
load

82
Once a crack was initiated within the hydride blister, fatigue pre-cracking was
used to grow the crack into the substrate so as to obtain a single sharp crack which could
easily be distinguished on the eventual fracture surface, as shown in Figure 2-10. Thus,
the fatigue pre-crack provided precise and accurate indication of the initial crack length
during a fracture toughness test. Fatigue pre-cracking was performed in a screw driven
Instron 5866 load frame, using displacement control, with at least two steps of load
shedding. The load ratio, R, (R=Pmin/Pmax, where Pmin and Pmax are the minimum and
maximum load during one cycle, respectively) was always between 0.1 and 0.2, and the
fatigue cycling frequency was 2Hz. The applied stress intensity K was below the limit
recommended by ASTM E 1820, with mMPaK f
ysT
ys
f
ys
063.0max during the first
step, and FT
ys
f
ysKK
6.0max during the last step, where ys
f and ys
T are the material
yield stresses at the fatigue pre-crack and test temperatures respectively, and KF=KQ. The
most limiting case corresponded to room temperature testing and crack growth into
sunburst hydrides, for which Kmax=38MPa√m for the first step, and Kmax=9MPa√m for
the last step. In all cases presented in this study, during fatigue pre-cracking, the
maximum stress intensity applied was always below 15 MPa√m during the first step, and
below 9MPa√m for the subsequent step(s). All fatigue pre-cracking was done at room
temperature, regardless of the testing temperature. Crack growth was detected by
monitoring the decrease in peak load at each cycle during fatigue pre-cracking, and the
crack length was approximated by observation of the specimen edges and top surface
under a light microscope between cyclic loading steps. Fatigue pre-cracking was
typically stopped when the pre-crack reached a depth between 30% and 60% of the
specimen thickness. Due to the difficulties in precisely monitoring crack length, the
ASTM recommended initial crack length of 50% of the specimen thickness was obtained
only in some cases, but fracture toughness testing was still possible under those
conditions.

83
2.2.3 Fracture Testing and Crack Length Monitoring
Fracture toughness testing was performed in the same Instron® 5866 test frame
used to pre-crack the specimens. The test specimens were deformed at a constant
crosshead speed of 0.25 mm/s in a four-point bend configuration, as described
previously. Testing took place at 25°C, 300°C and 375°C. A clam-shell furnace
surrounding the test fixture and compression rams was used to achieve the high
temperatures.
Since elastic-plastic fracture toughness testing requires monitoring the length of a
pre-existing crack as a function of load during the test, the electrical potential drop
method was used to determine crack advance through the thickness of the thin-sheet
Zircaloy-4 bend specimens. The electric potential drop technique (EPD) is one of the
most accurate and efficient methods for monitoring crack length [121]. It relies on the
fact that the electrical potential field is disturbed by any discontinuity in a current
carrying body. For fracture toughness applications, a current passes through the length of
Figure 2-10: SEM fractography taken from a specimen that was fatigue pre-cracked prior
to failure at room temperature (two magnifications shown)
50m
Fatigue pre-crack
Blister

84
the conductive test specimen that contains a crack (the conducting Zircaloy-4 four-point
bend specimen in this case), and the difference in potential drop is then monitored across
the crack as the crack propagates, see Figure 2-11. An increase in crack length reduces
the specimen cross-section, resulting in an increase in electrical resistance, and thus the
potential difference between two points spanning the crack rises. By monitoring the
potential drop across the crack, the normalized crack length a/W (where a is the crack
length and W the specimen thickness) can be determined using Eq. 2.8 developed by
Johnson [122], where: a is the crack length, a0 is the initial crack length, V is the
measured potential, V0 is the initial potential at the crack length a0, y is the half of the
potential probe gage length, and W is the specimen width. The parameter y was adjusted
for each test so that Eq. 2.8 would accurately predict the initial and final crack lengths.
Typical values of y ranged between 0.5 and 1.5 mm, which was in agreement with
physical measurements of the potential probe gage length.
Eq. 2.8 is valid for all values of a/W and can be used to solve for the crack length
directly, thus we obtain Eq. 2.9:
In order to run a current through the Zircaloy-4 specimens and measure the EPD,
Zirconium 702 wires were spot welded to the specimen surface in precise locations. A
fixture was designed and fabricated in order to allow for reproducible wire positioning
and welding onto the specimen surface, as shown in Figure 2-11. An HP E3612A dc
power supply was used to produce a 500mA current passing through the four point bend
specimen, and the potential leads were connected to an amplifier with x100 gain.
Typically, the amplified voltages were in the 5mV to 30mV range. In order to record the
EPD data in real time and synchronize it with the load-displacement data obtained during
WaWy
WaWy
V
V
2cos2cosh
cosh
2cos2cosh
cosh
0
1
1
0
(2.8)
WaWy
VV
WyWa
2cos2cosh
coshcosh
2coshcos
2
0
1
0
1
(2.9)

85
a four-point bend fracture toughness test, the amplified output potentials were fed into a
strain channel on the test frame. Alumina pins were used to electrically isolate the test
specimen and leads from the load frame, and the zirconium wire leads were inserted into
fiberglass sleeving capable of withstanding temperatures up to 480°C, thus easily
allowing for testing up to 400°C.
The validity of Johnson‟s equation for the test specimen geometry used in this
study was verified for both notched specimens and specimens containing hydride blisters,
as shown in Figure 2-12. For notched specimens, a square bottom notch was machined in
a test specimen with a diamond cutting wheel, and the corresponding potential drop was
measured. The notch was then made deeper, and the resulting potential drop was
measured. Using this procedure, good agreement was obtained between Johnson‟s
equation and the measured notch depth, as represented in blue in Figure 2-12. In
addition, to evaluate the influence of plastic strain in the measured potential drop, the
(a) (b)
Figure 2-11: (a) Single edge crack geometry and electric potential wire placement
locations for EPD crack growth measurements using Johnson's formula [122]; (b) Actual
test specimen placed inside lead positioning device, with zirconium wire leads

86
notched specimen was subsequently bent manually so as to induce a large amount of
plastic strain, similar to what an actual test specimen would experience. The variation in
potential drop associated with plastic deformation was found to be negligible. For the
case of specimens containing hydride blisters (resulting in a sharp crack instead of a
square-bottom notch), specimen „B29‟ was tested in bending, and the crack length was
monitored by optical measurements from the specimen edges. As shown by the red data
points and the red dashed line in Figure 2-12, there was also very good agreement
between the measured crack length and that predicted using Johnson‟s equation, hence
validating Johnson‟s equation for the specimen geometry tested in this study.
Figure 2-12: The normalized potential drop as a function of normalized crack length for a
notched specimen and a specimen containing a hydride blister, as measured
experimentally, and compared with that predicted using Johnson‟s equation (Eq. 2.8).

87
In order to use the EPD procedure, Eq. 2.8 and Eq. 2.9 rely on establishing the
initial crack length a0 that corresponds to an initial potential drop V0 as well as a final
crack length af and its potential drop Vf. The value of a0 can be readily determined by
fractography after specimen fracture. Specimens tested at room temperature and 300°C
were heat tinted in air at 300°C for one hour in order to mark the position of the final
crack front on the fracture surface, and thus obtain af. This procedure was unnecessary
for 375°C tests because sufficient oxidation of the fracture surface occurred during
testing.
After testing, the remaining ligament of the fracture toughness specimens was
broken so as to expose the fracture surfaces for observation. Fractography in a
stereoscope and a measuring microscope then allowed for measurements of the initial and
the final crack lengths. These were then used to precisely calibrate the potential drop so
that crack growth behavior could be determined during the test before fracture. In
addition, the profile of the initial and final crack fronts was obtained. The crack profiles
were later used to assess for crack uniformity and, in the case of uneven cracks, were
input into the FRANC3D software to calculate stress intensity factors along the crack
front, as described in Section 3.2.3. SEM fractography was also performed on a number
of specimens using a scanning electron microscope (SEM) in the secondary electron (SE)
mode, so as to gather information on the crack growth process as a function of
temperature and hydride microstructure based on the fracture surface features.
A few specimens were subjected to interrupted-testing with the goal of assessing
crack-front profiles and crack-tip blunting at different levels of crack extension. To
achieve this, the specimens were sequentially tested at incremental degrees of crack
extension and a thin-strip section was removed along their length after each increment of
crack growth and load-displacement. This procedure permitted observations of the crack
tip profile at different conditions of crack extension and crack growth behavior. The
strips removed at various amounts of bending were mounted for metallography following
the procedure described in Section 2.3.1. Pre-cracking was not performed on these
specimens.

88
2.3 Hydride Microstructure Characterization
In order to perform a study of through-thickness crack growth behavior in thin
sheet Zircaloy-4 as a function of hydride distribution and temperature, it is essential to be
able to accurately characterize the hydride microstructure through which crack growth
occurs. This section describes the metallography procedures used to reveal hydride
microstructures in the CWSR Zircaloy-4 sheet used in this study. The general hydride
microstructure observed by light microscopy is described, and image analysis methods to
characterize the hydrogen content and hydride distribution are presented.
2.3.1 Metallography Procedures
In order to reveal their hydride microstructure, strips of hydrided specimens were
cold-mounted in a transparent Epoxy resin. The mounts were mechanically grinded with
silicon carbide paper ranging from 180 to 1200 grit and etched for observation in an
optical microscope. The etching solution consisted of 10 parts distilled water (H2O), 10
parts nitric acid (HNO3, 70% concentration), and 1 part hydrofluoric acid (HF, 48-52%
concentration). Test specimen strips that had not been deformed during testing were
swab-etched for ~5 seconds, and then immersed in the solution for ~10 seconds in order
to reveal the hydrides. In the case of deformed test specimen strips, the etching solution
was less effective at revealing the hydrides so the swab time was increased to ~10
seconds, and the immersion time increased to ~15 seconds. A typical hydride
microstructure obtained using this procedure is shown in Figure 2-13.
2.3.2 Light Microscopy
As will be discussed in Sections 3.3 and 3.4, the hydride microstructure in the
substrate underneath the blister has a significant impact on the failure process; hence to
analyze the crack growth results, accurate characterization of the hydride microstructure

89
was necessary. As typically observed for hydride blisters whose depths exceed about 70
m, Figure 2-13 shows four distinct forms of hydrides. In addition to the solid hydride
blister whose depth was roughly one-half of its width, the microstructures beneath
blisters consisted of the following:
1. Sunburst hydrides: Emanating radially from the hydride blister were sunburst
hydrides. Above a threshold blister depth of ~70 m, the sunburst hydride depth
(δsunburst) increased with increasing blister depth (δblister) in a manner expressed
approximately by (dδsunburst/d δblister) 0.4 δblister (see Figure 2-14). The tensile
strain imposed on the substrate by the presence of the hydride blister likely
accounts for the orientation of the hydride platelets as they form under load [27].
2. Mixed hydride zone: Adjacent to the sunburst hydrides, there was a transition
zone within which discrete hydride particles were present that exhibited different
orientations. A significant fraction ( 1/3) of the hydride platelets had their
normal oriented parallel to the sample surface, so that the platelet surfaces were
nearly parallel to the crack plane and crack growth direction (i.e. akin to radial
hydrides within a cladding tube). These out-of-plane hydrides mixed with in-
plane hydrides and a few hydrides that were oriented at about 45° to both the in-
plane and out-of-plane hydrides. For large blisters (≥70 m, the depth of the
mixed hydride zone (δmixed) also increased with increasing blister depth (δblister) in
a manner expressed approximately by (d δmixed /d δblister) 0.5 δblister (as seen in
Figure 2-14).
3. In-Plane Hydride Zone: The remainder of the Zircaloy sheet contained discrete
hydride platelets that were parallel to the sample surface and thus perpendicular to
the crack growth direction and the crack plane (in-plane hydrides). These
hydrides are akin to the “circumferential hydrides”, typically observed in Zircaloy
cladding tubes.

90
(a)
(b)
Figure 2-13: Light micrographs of specimens with blister depths of (a) 86mm, and (b)
209mm
Sunburst hydrides
Mixed hydrides
In-plane hydrides
Sunburst hydrides
Mixed hydrides
In-plane hydrides
Hydride Blister
Hydride Blister

91
Within the in-plane hydride region in the substrate, two distinct particle size
groups were apparent. There were many small hydride particles with lengths in the 20-
50μm range (as measured on the specimen surface); these particles dominated the inter-
particle spacing of 20 µm described above. A second size group consisted of a small
population of much larger hydride particles with (surface) lengths in the 100-200μm
range. These larger hydride particles, which resulted from the annealing at 400°C
followed by a furnace cool, had inter-particle spacings of about ~60-80m.
Sunburst/Out-of-plane Hydride Depth vs. Blister Depth
y = 0.4157x - 14.338
R2 = 0.7333
y = 0.4879x - 11.403
R2 = 0.7447
0
20
40
60
80
100
120
140
0 50 100 150 200 250 300 350
Blister Depth (micron)
Su
nb
urs
t/O
ut-
of-
pla
ne
Hy
dri
de
De
pth
(m
icro
n)
Sunburst Hydride Depth Out-of-plane hydride Depth
Linear (Sunburst Hydride Depth) Linear (Out-of-plane hydride Depth)
Figure 2-14: The dependence of the depths of either the sunburst hydrides or the out-of-
plane hydride zone on blister depth

92
2.3.3 Hydrogen Content Measurement
In addition to the characterization of the hydride microstructure, it is important to
quantify the hydrogen content of the substrate into which through-thickness crack growth
occurs. To achieve this, an image analysis procedure which relies on the measurement of
hydride area fraction was calibrated with chemical analyses of hydrogen contents for the
materials and etching procedures used in this study.
It should be noted here that a determination of the hydride area-fraction was made
using two different procedures. The first procedure is the metallography procedure
described in Section 2.3.1. This method is relatively easy and fast in terms of specimen
preparation, and provides very good phase contrast for image analysis. However due to
the small variability in etching from specimen to specimen, significant scatter was
observed in the measured hydride area fractions. In fact, slight variations in etch-solution
temperature (less than 5°C), etching times (within 1-2 seconds), and concentration of the
solution (within 1%) may cause measurable differences in the apparent area fraction of
hydrides. The second procedure relies on the Z-contrast (the contrast produced by
differences in the atomic number Z) obtained in the backscattered electron (BSE) mode
of a scanning electron microscope (SEM). It involves polishing mounted specimens to a
1μm finish using a diamond suspension, followed by direct observation in a SEM. Due
to the absence of etching, and thus less variability in the procedure, the SEM imaging
method should provide a more accurate estimation of hydrogen content. However, due
the onerous specimen preparation associated with SEM imaging and the resulting low
phase contrast, conventional metallography was generally preferred. SEM imaging was
used only in an attempt to obtain a more precise calibration between area fraction and
measured hydrogen content using chemical analyses.
The calibration of the image analysis procedure was performed in two steps. The
first step relied on developing a correlation between the calculated hydrogen content from
SEM imaging and the actual hydrogen content measurements from chemical analyses
(both hot vacuum extraction and inert gas fusion, as performed by Luvak Inc.). For the
reasons described above, a second correlation factor was then developed to relate the

93
hydrogen contents calculated using SEM imaging and using conventional metallography
in a light microscope after etching. These two correlation ratios were then multiplied to
obtain the conversion ratio between a calculated hydrogen content based on conventional
metallography and the actual hydrogen content in the specimens.
To determine the first correlation factor, hydrided specimens of CWSR Zircaloy-4
with a range of hydrogen contents and uniform hydride distributions were mounted and
polished to a 1μm finish using a diamond suspension. SEM images were taken at ~500X
and ~1500X in the backscattered electron (BSE) mode so as to image individual hydrides
(typically ~2-5μm thick) by relying on Z-contrast between the zirconium metal phase and
the zirconium hydride phase. The area fraction of hydride particles was computed using
the Image-J freeware. The images were first enhanced for contrast between metal and
hydrides, and then turned into binary images which were filtered to obtain an accurate
area fraction measurement. The magnification of the images had no influence on the
measured hydride content. Figure 2-15 illustrates this process.
Based on the quantitative image analysis of the area fraction of hydride particles
as obtained from SEM images, the hydrogen content was calculated from the area
fraction using Eq. 2.10 [123].
where [H]total is the total hydrogen content (wt.ppm); [H]δ-ZrHx is the hydrogen content of
the δ-phase of ZrHx (1.5 < x < 1.7), equal to ~ 17570 wt.ppm; ρδ-ZrHx is the density of the
δ-phase of ZrHx (1.5 < x < 1.7), equal to ~5.65 g/cm3 at room temperature; ρα-Zr is the
density of the α-phase of Zircaloy-4, equal to ~ 6.54 g/cm3 at room temperature; and Fδ-
ZrHx is the hydride area fraction [23, 29]. It should be noted that the amount of hydrogen
on solution in the metal at room temperature is negligible (less than 5wt.ppm) [21].
xxx
x
xx
ZrHZrHZrHZr
ZrH
ZrHZrHtotalFF
FHH
1 (2.10)

94
Following SEM observations and the associated hydrogen contents based on the
hydride area-fraction determinations, the same specimens were sent to Luvak Inc. for
hydrogen content analysis. Both vacuum hot extraction and inert gas fusion were used to
measure actual hydrogen contents in the specimens. Figure 2-16 shows the linear
relationship between predicted and measured hydrogen contents, based on SEM imaging
and vacuum hot extraction, respectively. It was found that the predicted hydrogen
content using image analysis overestimated the actual hydrogen content by about three
times. The correlation factor ω1 is given by Eq. 2.11.
Figure 2-15: An example of area fraction measurement for zirconium hydrides in a
Zircaloy-4 metal matrix using Image-J software.
307.01
SEM
measured
H
H (2.11)

95
To determine the second correlation factor between SEM images and calculated
hydrogen content based conventional light micrographs, the following procedure was
adopted. Six specimens with seemingly different hydrogen contents were chosen and
polished to a 1μm finish for SEM backscatter electron mode observations. The resulting
images were analyzed as described above to obtain area fraction measurements, and the
corresponding hydrogen contents were calculated using Eq. 2.10. Metallography was
then performed on the same specimens, as described in Sections 2.3.1 and 2.3.2. The
images thus obtained by light microscopy were once again analyzed so as to obtain
hydride area fractions and the corresponding hydrogen contents.
Figure 2-16: The linear relationship between the hydrogen content predicted by area
fraction measurements of SEM images and the actual measured hydrogen content.

96
Figure 2-17 shows the relationship between the calculated hydrogen contents
obtained from the two imaging techniques. It was found that the calculated hydrogen
content using light microscopy was about five times larger than that calculated from
SEM-BSE images. The correlation factor ω2 is given by Eq. 2.12.
The two correlation factors were multiplied so as to obtain the correlation factor
between calculated hydrogen content using light microscopy and the actual hydrogen
216.02
graphymetallo
SEM
H
H (2.12)
Figure 2-17: The linear relationship between the hydrogen content predicted by area
fraction measurements of light-micrographs and the hydrogen content predicted by area
fraction measurements of SEM images .

97
content in the specimen in the area of interest. This total correlation factor ωT (ωT=0.066)
is given by Eq. 2.13. The value of ωT found in this study is identical to that found by
Daum (ωT=0.067) [23].
2.3.4 Hydride Distribution Quantification
Because hydride orientation can have a large impact on crack growth and fracture
toughness, particularly at room temperature [108, 109], the hydride distribution was
studied in addition to the hydrogen content. In particular, the hydride orientation, length,
and hydride spacing were quantified using the software Hydromorph developed by the
CEA (Atomic Energy Commission) and IRSN (Institute for Radiological Protection and
Nuclear Safety) in France.
The images input into Hydromorph consisted of both (a) the entire area under a
hydride blister, where through-thickness crack growth would occur, and (b) slices within
that same area in order to observe any microstructure variations across the thickness of
the test specimens. Examples of such images are shown in Figure 2-18(a)-(b). These
images were then skeletized by the software and all the hydrides indexed individually, as
shown in Figure 2-18(c). For each indexed hydride, its length and orientation were
calculated. The length L of a given hydride was equal to the distance between the two
points of the hydride that were furthest apart. The orientation θ of a given hydride in
degrees was equal to the weighted sum of the angle θi that each „section‟ of the hydride
made with the horizontal direction, as given by Eq. 2.14. Figure 2-19 illustrates these
definitions.
066.0log
21
raphymetal
SEM
SEM
measuredT
H
H
H
H (2.13)
i
i
i
ii
L
L
(2.14)

98
(a)
(b) (c)
Figure 2-18: Examples of sectioning of a micrograph for input into Hydromorph, with
(a) the entire area under the hydride blister, (b) slices within an area under the blister, and
(c) the corresponding skeletized image with individual hydrides numbered.

99
Plots of hydride orientation versus hydride length could then be visualized, with
each individual point corresponding to one hydride. Examples of these plots are shown
in Figure 2-20. The graphical representations were quite different depending on the
presence or absence of out-of-plane hydrides, thus confirming that Hydromorph was
adapted to distinguish between different hydride microstructures observed in this study.
Figure 2-19: Schematic illustration of how a skeletized hydride was „sectioned‟ to
calculate its total length and orientation, using Eq. 2.14.
L

100
In addition to the graphical report produced by Hydromorph, an Excel sheet
containing all the calculated parameters for each hydride was produced by the software,
which allowed for radial, mixed or in-plane hydride content calculations. Because of the
method employed by Hydromorph to calculate the orientation of hydride particles,
microstructures which were comprised of only in-plane hydrides (such as shown in
Figure 2-20(b)) resulted in hydride orientations up to 40°. Consequently, „in-plane
hydrides‟ were defined as hydride particles whose orientation was comprised between 0°
(a)
(b)
Figure 2-20: Examples of Hydromorph plots of hydride orientation vs. hydride length for
(a) a specimen containing sunburst and mixed hydrides as well as in-plane hydrides, and
(b) mostly just in-plane hydrides.
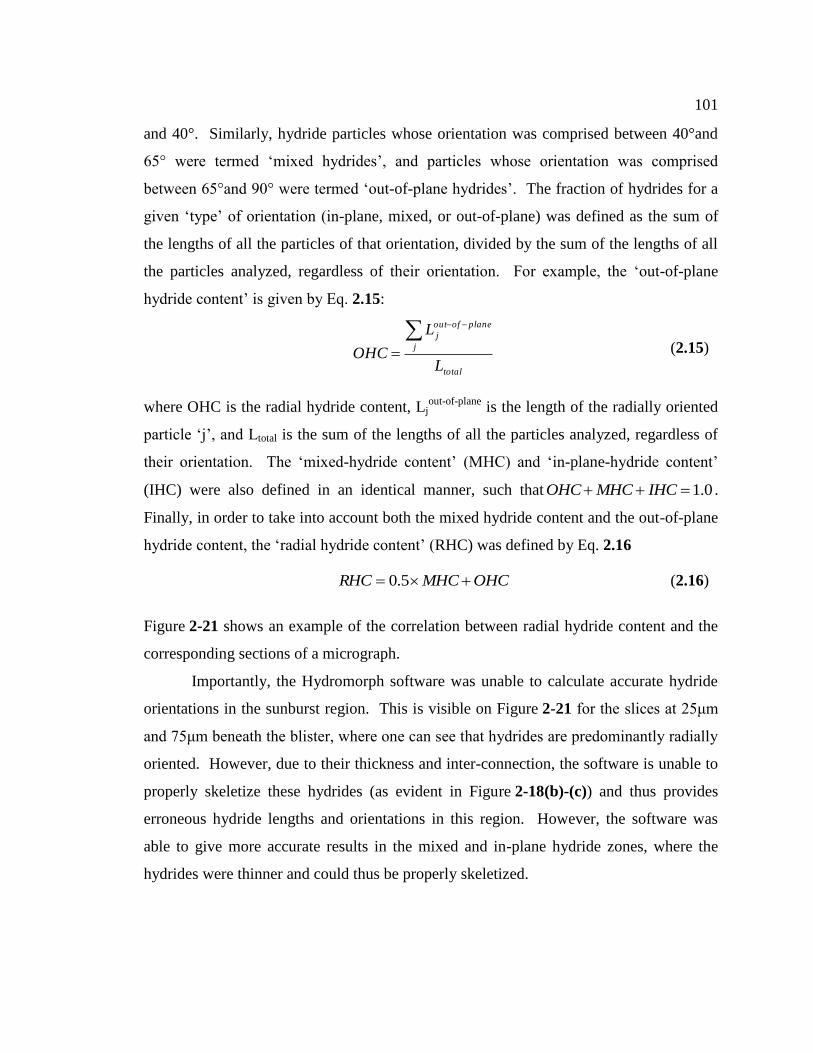
101
and 40°. Similarly, hydride particles whose orientation was comprised between 40°and
65° were termed „mixed hydrides‟, and particles whose orientation was comprised
between 65°and 90° were termed „out-of-plane hydrides‟. The fraction of hydrides for a
given „type‟ of orientation (in-plane, mixed, or out-of-plane) was defined as the sum of
the lengths of all the particles of that orientation, divided by the sum of the lengths of all
the particles analyzed, regardless of their orientation. For example, the „out-of-plane
hydride content‟ is given by Eq. 2.15:
where OHC is the radial hydride content, Ljout-of-plane
is the length of the radially oriented
particle „j‟, and Ltotal is the sum of the lengths of all the particles analyzed, regardless of
their orientation. The „mixed-hydride content‟ (MHC) and „in-plane-hydride content‟
(IHC) were also defined in an identical manner, such that 0.1 IHCMHCOHC .
Finally, in order to take into account both the mixed hydride content and the out-of-plane
hydride content, the „radial hydride content‟ (RHC) was defined by Eq. 2.16
Figure 2-21 shows an example of the correlation between radial hydride content and the
corresponding sections of a micrograph.
Importantly, the Hydromorph software was unable to calculate accurate hydride
orientations in the sunburst region. This is visible on Figure 2-21 for the slices at 25μm
and 75μm beneath the blister, where one can see that hydrides are predominantly radially
oriented. However, due to their thickness and inter-connection, the software is unable to
properly skeletize these hydrides (as evident in Figure 2-18(b)-(c)) and thus provides
erroneous hydride lengths and orientations in this region. However, the software was
able to give more accurate results in the mixed and in-plane hydride zones, where the
hydrides were thinner and could thus be properly skeletized.
total
j
planeofout
j
L
L
OHC
(2.15)
OHCMHCRHC 5.0 (2.16)

102
Figure 2-21: Example of radial hydride content measurement through the thickness of a
sheet Zircaloy-4 specimen.

Chapter 3
Results and Discussion
3.1 Fracture Mechanics Considerations
In order to achieve the goals of this study, four-point bend fracture toughness tests
were performed on as-received and hydrided Zircaloy-4 sheet specimens in the fatigue
pre-cracked condition and at temperatures ranging from 25°C to 375°C. In general, the
amount of plastic deformation displayed by a given specimen during crack growth guides
the choice between linear-elastic fracture mechanics (LEFM) and elastic-plastic fracture
mechanics (EPFM) as a means of interpreting the results. Three main conditions must be
satisfied for the use of linear-elastic fracture mechanics (LEFM), as specified in ASTM
standard E399 [81]. First, the specimen dimensions must be such that Eq. 3.1 is satisfied:
with W the specimen thickness, a the crack length, KIc the fracture toughness, and ζYS the
yield stress for 0.2% offset. Second, the specimen proportions must be those specified in
the standard (the initial crack length must be half way through the specimen, and the
thickness-to-width ratio must be between 1 and 4). Finally, the ratio of the maximum
load to the load PQ defined in the standard corresponding to the onset of crack growth
must be such that Pmax/PQ<1.10. If all of these conditions are met, then linear-elastic
fracture mechanics (LEFM) may be applied, otherwise, elastic-plastic fracture mechanics
(EPFM) should be used.
For all four-point bend fracture toughness tests performed in this study, the level
of plasticity associated with crack growth dictated the use of elastic-plastic fracture
mechanics (EPFM) to predict crack growth behavior. In fact, even in the case resulting
in the smallest plastic-zone size (room temperature testing and crack growth into sunburst
hydrides, for which the fracture toughness KQ was previously determined to be around 15
25.2 YSIcKaW (3.1)

104
MPa√m [113, 114] and the yield stress is equal to 575MPa), Eq. 3.1 gives the condition
mmaW 7.1 . The criterion given by Eq. 3.1 thus cannot be satisfied given that the
thickness W of the test specimens used in this study is less than 0.675mm. Consequently,
this section describes the EPFM analyses employed to analyze test data. In addition, the
ASTM guidelines and criteria for a standard fracture toughness test are described and
compared with the conditions obtained in this study.
3.1.1 Elastic-Plastic Fracture Mechanics (EPFM)
Elastic-plastic fracture mechanics (EPFM) originated in the late 1960s, when
Hutchinson, Rice and Rosengren developed the contour integral named the J-integral
[124-126], and given by Eq. 3.2:
where γ is any path surrounding the crack tip , U is the strain energy density , t̄x is the
traction vector along the x -axis (t̄x=ζxn̄x+ζxyn̄y), t̄y is the traction vector along the y -axis
(t̄y=ζyn̄y+ζxyn̄x), ζ(x,y,xy) are components of the stress tensor, n̄ is the unit outer normal
vector to path γ, u is the displacement vector, s is the distance along the path γ. It has
been shown that for a linear or non-linear elastic material under quasi-static conditions
the J-integral is equal to the energy release rate [127], which is a measure of the energy
available for an increment in crack length. Hence one can interpret the J-integral as the
amount of energy required to grow a given crack by a known increment. Importantly, it
can be shown that the J-integral is path-independent [127], thus meaning that any closed
contour around the crack tip will yield the same value of J-integral. Thus, the J-integral
is an invariant parameter characterizing a given crack under a known set of conditions,
and the J-integral at the onset of crack growth can be considered a material property.
The J-integral concept was developed as a means to describe the non-linear load-
displacement behavior observed in materials displaying a large amount of plasticity
during crack growth. Thanks to its successful applications in the nuclear industry in the
dsy
ut
x
utUdyJ
y
yx
x (3.2)

105
United States (as well as the U.S. Navy) [128], the J-integral concept was widespread,
and a standard procedure for J-testing was developed in the early 1980s [129]. The other
major concept of EPFM, the crack tip opening displacement (CTOD) was mainly
developed in the U.K. [130] during the same period, and Shih in 1981 demonstrated the
relationship between the two concepts, which are now often applied in parallel [131].
In this study, the main objective is to determine the fracture toughness at the onset
of through-thickness crack growth in thin-sheet Zircaloy-4. To achieve this goal, it is
critical to be able to measure the J-integral at each instant during a fracture toughness
test, and correlate this measurement with the crack extension. The resistance curve test
method described in standard procedure ASTM E1820 [120] provides the necessary
guidelines and the EPFM data analysis procedures to obtain „J-R curves‟. The „J-R
curves‟ correspond to plots of the J-integral as a function of the crack growth increment
Δa, from which several key values of the J-integral with physical significance may be
defined, including the J-value at the onset of stable or unstable crack growth.
In order to generate a J-R curve, the crack length and the load-displacement
response of the pre-cracked specimen must be known at each instant during a test. In this
study, the electrical potential drop (EPD) technique (see Section 2.2.3) provided
continuous measurement of the crack length. To calculate J-integral for the “resistance
curve test method”, standard procedure ASTM E1820 [120] provides the following
Eq. 3.3 to determine the J-integral value at any given point „i‟ of the load-displacement
response:
where Ki is the elastic stress intensity factor for this configuration and ν and E are
Poisson‟s ratio and Young‟s modulus, respectively. The Ki value is expressed as a
function of a/W by Eq. 3.12:
i
plii
pl
i
el
i
tot JE
KJJJ
22 1 (3.3)
106
The F(a/W) factor used to calculate Ki is given by Tada [132] for single-edge bend
specimens submitted to a constant moment, which corresponds to the four-point bend
case. The moment M is equal to half the applied load P multiplied by the moment arm
(i.e. the span S between the loading pins) and a, W and B are the specimen crack length,
thickness and width, respectively.
The plastic portion of J-integral, Jpli is given by Eq. 3.5:
where bi=W-ai, is the length of the remaining ligament; Apli is the amount of plastic
energy spent by the applied load up to crack increment „i‟ (the plastic energy under the
load-displacement curve). The terms ηpl and are geometric factors directly related to
each other by Eq. 3.6 given by Anderson [133], and which depend on crack length as
follows:
As can be seen from Eq. 3.5 and Eq. 3.6, the J-integral increment is directly
proportional to the value of the ηpl (and ), hence the value of ηpl is critical in determining
accurate J-integral toughness values, particularly for small cracks such that a/W<0.3. For
a/W>0.3, it has been shown that ηpl is constant and equal to 2 [134, 135]. However for
a/W<0.3, the value of ηpl is quite sensitive to a/W and has been shown to vary with
specimen dimensions [136]. Thus, for short cracks, small changes in crack length can
result in significant changes, and possibly errors, in J-values.
aBW
PS
W
a
W
a
W
a
a
WK
M
WaF
i
2
4
6
2
2cos
2sin1199.0923.0
2tan
2
(3.4)
1
1
1
1
1 1i
ii
i
i
pl
i
pl
i
i
pli
pl
i
plb
aa
B
AA
bJJ
(3.5)
3.0
3.0
1
11
W
afor
W
afor
Wbd
d
W
b pl
pl
pl
(3.6)

107
Finally, the fracture toughness KJ derived from the J-integral for plane strain is
then given by Eq. 3.7:
A typical J-R curve is shown schematically in Figure 3-1, where the J-integral is
plotted as a function of the crack extension. J-R curves may be used as a means of
obtaining the fracture toughness at the onset of crack growth. In many cases, crack
growth is preceded by crack-tip blunting, resulting in a finite amount of crack extension
which does not correspond to crack growth. Consequently, it is important to know the
amount of crack extension associated with crack-tip blunting to determine the fracture
toughness at the onset of crack growth. To predict the amount of crack extension due to
blunting (preceding crack growth), ASTM standard E1820 gives Eq. 3.8 to define the
construction line, with m=2 and ζy is the yield stress:
The blunting line is parallel to the construction line, with a crack extension offset δ equal
to the amount of crack extension which can be attributed to blunting (see Figure 3-1).
The blunting line is critical for the definition of stable crack growth, as points on the J-R
curve prior to the intersection with the blunting line correspond to blunting, instead of
crack growth. In the ASTM standard, this offset is equal to 0.2mm [120]. However, due
to the small size of the specimens in this study, the blunting offset was redefined by
metallographic observations at each test temperature so as to maintain the physical
significance of the blunting line (i.e. a crack increment threshold beyond which crack
growth occurs instead of blunting), as described in more detail in Section 3.3.2 about
fracture behavior.
In Figure 3-1, the terms Jlimit and Δalimit respectively correspond to the maximum
standard J-integral capacity and crack extension capacity for a given specimen, and are
given by Eq. 3.9 and Eq. 3.10, where b0 is the length of the remaining ligament at the
beginning of the test:
21
i
toti
J
JK (3.7)
amJ y (3.8)

108
Based on the above notations for the J-R resistance curve, several values of J-
integral with physical significance can be defined for this particular study:
The intersection of the J-R curve and the blunting line defines Ji, which can be
converted to KJi. This parameter is analog to KJ0.2mm in ASTM standard
terminology, and corresponds to the initiation of stable crack growth.
In some tests at 25°C, unstable crack growth resulting in large crack extension
occurs before the intersection of the J-R curve and the blunting line. In this case,
100 y
mitli
bJ
(3.9)
025.0 ba mitli (3.10)
Figure 3-1: Schematic of a typical J-R curve [120]. Note: a schematic representation of
the blunting line offset δ is shown on a crack tip in the top right.
m ζy
Ji
δ
109
the J-integral value at the onset of unstable crack growth is termed Jc. This can be
converted to a fracture toughness value termed KJc corresponding to the onset of
unstable crack growth before any stable crack growth occurred in the specimen.
In other tests at 25°C, unstable crack growth resulting in a large crack extension
occurs after the intersection of the J-R curve and the blunting line. In this case,
the J-integral value at the onset of unstable crack growth is termed Ju. This can
be converted to a fracture toughness value termed KJu corresponding to the onset
of unstable crack growth after some stable crack growth occurred in the specimen.
Finally, independent of test temperature, the J-integral value corresponding to the
point of maximum load during a given test defines JPmax, which, if crack growth
occurs, can be converted to a fracture toughness value termed KJPmax. It should
be noted that large scatter in the values of JPmax may occur in tests at 300°C and
above. This is due to the extensive plastic deformation which sometimes occurs
at maximum load, thus creating a „plateau‟ in the load-displacement data.
In addition to the fracture toughness values described above, the tearing modulus
T is an indication of the resistance to stable crack growth [127]:
where E is Young‟s modulus, ζy the yield stress, and ∂J/∂a the slope of the J-R curve.
3.1.2 ASTM Standard Testing in Relation to this Study
As described briefly above, ASTM standard E 1820 [120] defines several
conditions which must be satisfied to perform a „standard‟ test. These conditions are
described in the following paragraphs. The degree to which each standard requirement
was met is evaluated for the present study of through-thickness crack growth in sheet
specimens.
a
JET
y
2 (3.11)

110
Concerning single-edge notch bend specimen geometry, the standard requires that
the ratio of specimen thickness W by specimen width B, be such that 1≤W/B≤4. The
sheet material used in this study was ~600-675μm thick; hence specimen width should
have ranged between ~0.6mm and ~2.7mm to fall under standard specifications. Instead,
specimen width ranged from ~5mm to ~24mm. These dimensions were chosen mainly
for experimental reasons related to the creation of a linear hydride blister on the specimen
surface, and so as to ensure a large region of plane-strain deformation in the center
portion of the sheet specimens.
With regard to fatigue pre-cracking, the standard procedure requires the presence
of a sharp V-notch from which a fatigue pre-crack should emanate. Instead the brittle
character of the linear hydride blister was relied upon as a substitute to the V-notch to
initiate a fatigue crack in the test specimens, as described in Section 2.2.2. Despite the
difference in means to generate a crack, the growth of the initial crack by fatigue was
performed along the standard guidelines concerning maximum load and load shedding, as
described in Section 2.2.2. After fatigue pre-cracking, the conditions at the crack tip
were believed to be consistent with those obtained from standard pre-cracking
procedures.
Concerning crack length and crack geometry, the standard requires an initial
normalized crack length such that 0.45≤a0/W≤0.7 for J-integral testing, and this condition
was met in the majority of test specimens. In addition, it is required that none of the
measurements of initial and final crack size differ from the average crack length by more
than 5% of the width of the specimen, B. This implies that even for the smallest
specimens tested in this study, for which B~5mm, a crack length variation of ~0.25mm is
allowed by the standard. Although this requirement was fulfilled in the vast majority of
cases, an allowed crack length variation equal to ~0.25mm (~40 % or more of the
thickness of the sheet specimens) was considered unreasonable for the purpose of this
study. As a result, uneven cracks in which the crack length varied by more than 10% of
the specimen thickness were analyzed in more detail using the software Franc3D [137],as
described in Section 3.2.3.

111
Regarding crack extension, the standard requires that there be no point in the
specimen where the measured crack extension is less than 50% of the average crack
extension. This standard implies relatively uniform crack extension across the width of
the test specimens. Due to variations in crack length and thus hydride microstructure
across the specimen width in some tests, this standard requirement was not always met.
This situation was particularly true for 25°C tests, where crack growth variations could
be significant along the crack front due to differences of crack length and hydride
microstructure. Despite not always fulfilling standard requirements, the crack extensions
measured provided useful insight into the crack-growth behavior in relation to the
hydride microstructure at the different test temperatures.
As mentioned above, the blunting line is defined as the crack extension offset in
the J-R curve beyond which stable crack growth occurs, instead of crack-tip blunting. In
the standard, this offset is equal to 0.2mm, meaning that the first 0.2 millimeters of crack
extension are not considered to be crack growth, but rather crack-tip blunting. The
0.2mm offset value was determined for large test specimens where the maximum crack
extension is on the order of Δa~1.5-2.0mm and the specimen thickness larger than
W~25mm. In such a case, 0.2mm represents only a fraction of the total crack extension
observed during a test. However, such a large offset is unfit for the present study (in
which the specimen thickness is only W~0.6mm), since the total crack extension is often
smaller than Δa=0.2mm. As a result, a different (much smaller) value for the blunting
line offset was determined by measuring the degree of crack-tip blunting prior to crack
growth for each test temperature, as described in Section 3..
Finally, concerning the elastic-plastic fracture mechanics interpretation of the
tests, the standard defines a maximum standard J-integral capacity and crack extension
capacity for a given specimen (Eq. 3.9 and Eq. 3.10). Assuming the initial crack length is
about half the thickness of the specimen, the value of JPmax varies between
Jlimit~17.25kJ/m2 at 25°C and Jlimit~8.7kJ/m
2 at 375°C for the present study. These values
were rapidly exceeded in all test specimens prior to the onset of crack growth (that is,
prior to the intersection between the J-R curve and the blunting line), although crack
growth was nonetheless observed to occur at higher values of J-integral. Exceeding the

112
Jlimit requirement implies that all the tests performed in this study provided specimen-size
dependent results. In particular, the small thickness of the sheet specimens (W~0.6mm)
is believed to have an influence on the measured fracture toughness. Thus, the fracture
toughness values measured in this study are suited applicable to Zircaloy-4 sheet and
Zircaloy-4 cladding with a similar wall thickness.
In summary, in order to determine the resistance to through-thickness crack
growth in thin-wall Zircaloy-4, the testing performed in this study does not fulfill several
ASTM standard requirements, largely due to the small thickness of the test specimens. In
order to be able to use the results, various adjustments to the standards were used as
described above. As a result, the fracture toughness data generated in this study is
believed to be relevant for the prediction of crack growth behavior in thin-wall Zircaloy-4
cladding tube, and in thin-sheet Zircaloy-4. Moreover, crack geometries of ex-service
cladding tubes reported in the literature generally have complex shapes and complex
hydride microstructures [90], similar to those observed here. Thus the data generated in
this study for uneven crack fronts and varying hydride microstructures are believed to be
relevant for the analysis of real cases of complex crack geometries which may be found
in actual nuclear fuel cladding.
3.2 Finite Element Modeling
In the previous section, Eq. 3.5 and Eq. 3.6 identified the sensitivity of the value
of the Jpl component of the J-integral to the values of ηpl and therefore . Previous studies
[134, 135, 138] have examined ηpl values as a function of a/W for the case of thick plates
containing a crack. In this study, finite element modeling (FEM) was used to examine ηpl
and for the thin-sheet single-edge four-point bend geometry used in this study. This
analysis required the computation of J-integral values using the path-independent
integral, and thus required the use of finite element modeling, which was performed
using the code Cast3M. Also, classic fracture mechanics as defined by the standards
[120] do not take into account the variations of crack length across the width of a given

113
specimen. Thus, the Franc3D software was used to understand the influence of uneven
crack fronts on fracture toughness calculations. This section begins with the validation of
the software Cast3M for fracture mechanics calculations, then explains how ηpl and
were generated using Cast3M, and finally provides a description of how Franc3D was
used to interpret fracture toughness data for the case of uneven crack fronts.
3.2.1 Validation of the Cast3M Code for Fracture Mechanics Modeling
The Cast3M finite element code was developed by the French CEA. It was used
to calculate the ηpl parameter, which is directly related to the value of the J-integral value
determined experimentally using Eq. 3.5. In fact, for a given crack length, the ηpl
parameter is given by Eq. 3.12:
where Jpl is the plastic component of J-integral, Apl is the plastic energy spent by the
applied load, b is the remaining ligament length, and B is the width of the specimen.
From this equation, it can be seen that it is necessary to calculate J-integral directly in
order to be able to determine the ηpl parameter.
In order to validate the use of the finite element code Cast3M to perform fracture
mechanics calculations in this study, an attempt was made to reproduce results published
by Y.J. Kim [134] for the case of cracked plate. In his study, Kim presented a review of
previous attempts to generate the ηpl parameter for four-point bend geometries. He then
used finite element modeling to calculate the ηpl function for the case of a four-point bend
configuration of a thick plate with an ASTM geometry where L/W=4, with L=40mm is
the distance between outer loading pins and W=10mm is the specimen thickness. His
results were in good agreement with previously published work for a wide range of crack
lengths.
Bb
A
J
pl
pl
pl (3.12)

114
To reproduce Kim‟s results, a finite element geometry similar to Kim‟s was
created, as shown in Figure 3-2. Plane-strain 2D modeling (such that there were no
strains out of the plane of the model) with full use of symmetry was performed, using
quadratic meshing elements (8 node quadrangles and 6 node triangles). The material
properties of the pins were set equal to those of hardened steel, and the pins were
assumed to be perfectly elastic and with a frictionless contact with the specimen. The
pre-cracked test specimen was modeled using Zircaloy-4 material properties in the
transverse direction, which were determined as part of this study and were given in
Section 2.1.2.
Figure 3-3 shows the calculated load-displacement curves obtained for increasing
normalized crack lengths in the range a/W=0.1-0.7. It should be noted that in all cases,
calculations were continued at displacements well into the plastic deformation region, so
that the calculation of ηpl functions was valid. As expected, the maximum load decreased
with increasing crack length. Yielding occurred quite gradually for short cracks.
However, for long cracks, yielding occurred more abruptly, resulting in a quasi-bilinear
load-displacement behavior. In real cases, crack growth and the associated loss of load
would occur, resulting in a maximum-load point; this behavior did not occur in the finite
element model calculation, as the crack length was fixed.
(a) (b)
Figure 3-2: (a) The cracked-plate ASTM geometry mesh created with Cast3M (Loading
pins are in red), and (b) mesh used by Kim [134]. Note: in these cases, a/W=0.2

115
As is evident in Figure 3-4, the specimen stiffness decreases with increasing crack
length, and it is quite sensitive to normalized crack length over the entire range a/W=0.1-
0.7. It should be noted that the large changes in compliance with crack length for an
ASTM type geometry make it easy to accurately determine the crack length using
compliance measurements, thus justifying the use of compliance crack length
measurements in thick-plate specimens, as prescribed by standard ASTM E1820 [120].
Figure 3-3: The predicted load-displacement curves for a cracked-plate ASTM specimen
made of Zircaloy-4 for increasing crack lengths in the range a/W=0.1-0.7, by increments
of 0.1.

116
The J-integral defined by Rice was shown to be path-independent [124], meaning
that integration along any closed contour around the crack tip would yield the same J-
integral value. As such, the J-integral is an invariant parameter characterizing a given
crack under a known set of conditions, and it can thus be considered a material property.
The path-independence of the J-integral calculation in this work was tested by choosing
increasingly large contours centered on the crack tip, and calculating J-integral at the last
step of the calculation for each normalized crack length ranging from a/W=0.1 to
a/W=0.7. The contours chosen were either circular or square shaped, depending on
whether the contour was contained in the „spider-web‟ portion of the mesh, as shown in
Figure 2-13.
Figure 3-4: The normalized elastic stiffness as a function of normalized crack length for a
cracked-plate ASTM specimen with Zircaloy-4 properties and loaded in a four-point bend
configuration such that L/W=4, calculated using Cast3M.

117
Figure 2-14 shows that the current FEM predicts a path dependence of J-integral
as a function of the average radius of the chosen contour. In this figure, the J/Jmax ratio is
defined as the ratio of the J-integral „J‟ for the contour of radius „R‟ to the J-integral
„Jmax‟ for the largest possible contour comprised strictly within the specimen boundaries
(of radius „Rmax‟), taken at the last step of the FEM calculation. Despite the fact that the
J-integral increased with increasing contour radius, it was possible to ensure minimal
path-dependence of the J-integral by choosing the appropriate contour around the crack
tip. Indeed, as long as the chosen contour was large enough (typically for R/Rmax > 0.7)
the calculated J-integral showed very little path dependence, such that it did not vary by
more than 5%, independently of the path chosen. Thus, the J-integral was deemed
sufficiently path-independent (within 5%) for the purposes of code validation and η
calculations, provided that the chosen contour was such that R/Rmax > 0.7.
Figure 3-5: Examples of circular and square paths used to calculate J-integral using
Cast3M. The radii are indicated by arrows. The largest possible contour is also
indicated, with the radius Rmax.
Rmax
R

118
In addition, to obtain the best possible accuracy and to be sure to encompass the
entire area of plastically deformed elements, the Cast3M manual recommends the choice
of the largest possible contour comprised strictly within the boundaries of the meshed
geometry [139]. With these considerations, the path chosen to calculate the ηpl (and ηel)
functions was the largest possible path strictly comprised within the specimen mesh (i.e.
that does not contain any boundary elements), thus corresponding to R/Rmax=1.
For the case of a thick plate with a crack under plane-strain conditions, the J-
integral was calculated in Cast3M and the elastic and plastic portions of J-integral, Jel and
Jpl, were extracted and plotted as a function of the ratios BbAel
and BbApl
,
Figure 3-6: The predicted J-integral as a function of contour radius for ASTM thick-plate
Zircaloy-4 specimens containing cracks with lengths ranging from a/W = 0.1 to a/W = 0.7,
as modeled in Cast3M.

119
respectively (where b and B are the length of the remaining ligament and the width of the
specimen, respectively). An example of this procedure is shown in Figure 3-7. The
slopes of the curves, equal to the η parameter, were calculated by performing a linear fit
according to:
The predicted ηpl parameter was compared to the results obtained by Y.J. Kim
[134] using FEM for cracked plates with ASTM E1820 4-point bend geometries where
L/W=4, and the results are shown in Figure 3-8. Compared to Kim‟s results, the ηpl
Bb
A
J
elpl
elpl
elpl
,
,
, (3.13)
Figure 3-7: An example of linear curve fitting to determine η parameters. In this case,
a/W=0.5.

120
function generated with Cast3M was ~15% smaller for a/W<0.4, but about 5% larger for
a/W>0.4, as shown in Figure 3-10(a). As such, these differences are considerably less
that the 35% variations observed by others [136]. Thus, there was fairly good
agreement between Kim‟s published results and the finite element calculations performed
with Cast3M. The differences observed could be due to differences in the numerical
code, mesh design, boundary conditions, numerical scheme utilized to computed the J-
integral, and precise method used to calculate η, as mentioned by Davies et al. in their
review of η calculation studies [136].
As shown in Figure 3-8, the ηpl parameter deviates from a constant value of 2 at
low a/W values. Davies et al. have suggested that this phenomenon is due to the
Figure 3-8: The predicted elastic and plastic η functions for a thick plate ASTM geometry
made of zircaloy-4, compared with Y.J. Kim's published results [134].

121
occurrence of more plastic deformation in the bulk away from the crack tip [136]. This
hypothesis was examined by plotting the equivalent plastic strain on the deformed finite
element mesh, as shown in Figure 3-9 for increasing crack depths. Plastic deformation
was distributed more in the bulk of the specimen for short cracks, while it concentrated
near the crack tip at larger a/W ratios, hence corroborating Davies et al.‟s hypothesis.
(a) (b)
(c) (d)
Figure 3-9: (a)-(d) The equivalent plastic strain distributions at similar bending
increments for a/W = 0.1, 0.2, 0.4, and 0.6, respectively. The plastically deformed areas
are highlighted.

122
Figure 3-8 also shows the ηel parameter calculated by Cast3M compared with the
theoretical value of ηel given by Eq. 3.14, which is valid in the linear region of the load-
displacement response (Figure 3-3):
where b is the remaining ligament, C is the elastic compliance, and a is the crack length.
There was good overall agreement between the calculated values and the theoretical
values.
To further validate the Cast3M code in the elastic regime, an elastic error
calculation was performed for the thick-plate ASTM geometry modeled in this study.
The error calculation was based on the crack geometry correction factor [α(a/W)] for
stress intensity calculations in the elastic regime, as given by Eq. 3.15 and Eq. 3.16:
where Kel is the elastic stress intensity factor, α(a/W) is the geometry correction factor, ζ
is the maximum tensile stress at the surface of the bend specimen, a is the crack length,
W is the specimen thickness, J is the J-integral, E is Young‟s modulus, and ν is Poisson‟s
ratio. The value of α was calculated at the first step of the calculation in the elastic
regime, when J=Jel, and then compared to the expression given for α by Tada et al. [132].
As shown in Figure 3-10, the differences between the values predicted by Cast3M and
those given by Tada‟s expression were small (less than 4% over the entire range of crack
lengths modeled).
11
11
11
2
ii
ii
ii
i
ii
ii
elaa
CC
CC
b
da
dC
C
b
(3.14)
aW
aKel
(3.15)
a
EJ
Wa
21
(3.16)

123
In summary, the Cast3M finite element code was validated for fracture mechanics
calculations by reproducing published work by Y.J. Kim [134]. The agreement between
Cast3M calculations and published results was within 3% for elastic calculations, and
within 15% for elastic-plastic calculations, which was deemed satisfying. In conclusion,
the Cast3M code was well suited to perform the finite element fracture mechanics
calculations required for the present study.
3.2.2 The η Parameter for Cracked Sheet
As seen in Eq. 3.5, the magnitude of Jpl (and hence J-integral as a whole) is
directly dependent on the magnitude of the ηpl parameter. Consequently, an accurate
value of the ηpl parameter must be known in order to determine the J-integral (and
therefore the fracture toughness) from load-displacement data obtained from the testing
of Zircaloy-4 sheet metal. In a recent study by Kim [134], finite element modeling was
Figure 3-10: Elastic error calculation.

124
used to calculate ηpl for cracked plates with conventional four-point bend geometries
satisfying the requirements of ASTM E1820 [120]. However, the sheet metal specimen
geometry used in this study did not fall under the ASTM geometric requirements for
fracture toughness testing. It was thus necessary to re-calculate ηpl for the present
cracked thin-sheet geometry.
Once the Cast3M code was validated by reproducing Y.J. Kim‟s published results
[134], the finite element software was used to create a model of the thin sheet specimen
containing a through-thickness crack used in this study, for which L/W=40. The
corresponding mesh is shown in Figure 3-11. The type of element used to create the
mesh was a combination of second-order 8-node quadrangles and 6-node triangles. All
modeling was performed using the material properties of Cold-Worked Stress Relieved
(CWSR) Zircaloy-4 as determined by tensile tests in this study with values given in
Section 2.1.2. The pins shown in Figure 3-11 were modeled as hardened steel and were
considered perfectly elastic. Frictionless contacts were assumed between the specimen
and the loading pins. As in Section 3.2.1, only half of a specimen was modeled in 2D
with a plane-strain condition such that the strains were confined to the plane of the mesh,
and the appropriate boundary conditions were applied to simulate four-point bending.
The range of crack lengths modeled varied between a/W=0.08 and a/W=0.67.
(a)
(b)
Figure 3-11: (a) Mesh used to model the thin-sheet specimen geometry; (b) close up for
a/W = 0.2
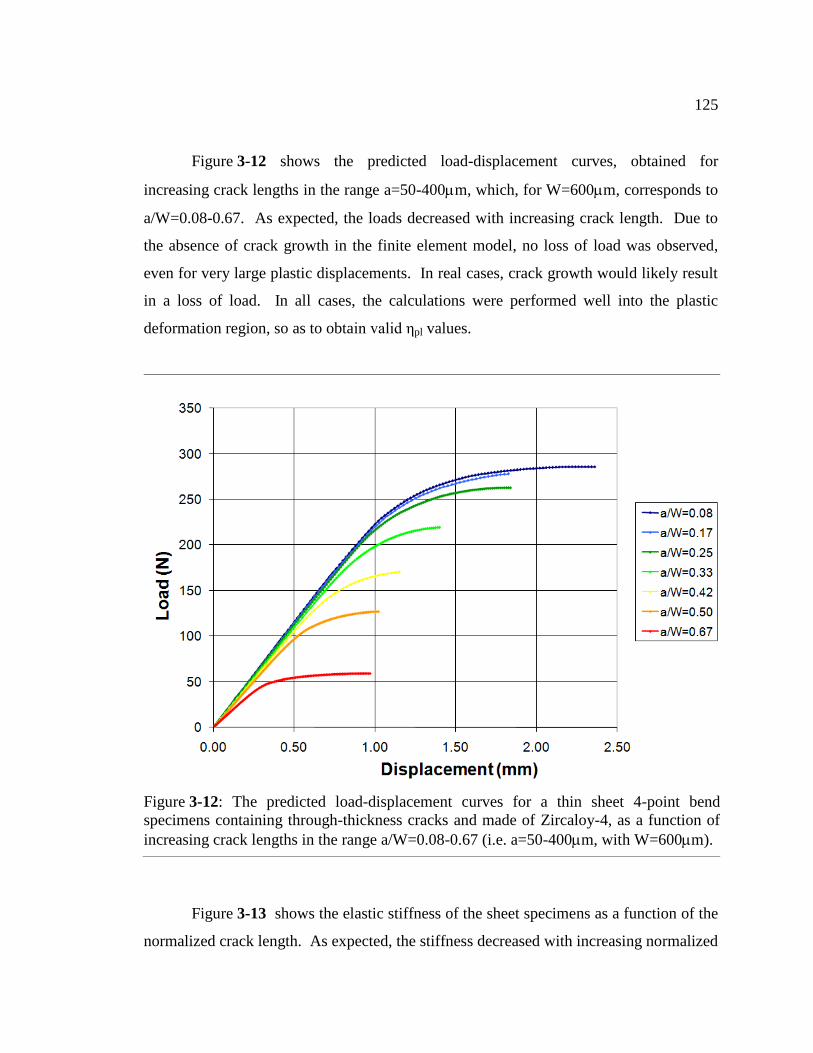
125
Figure 3-12 shows the predicted load-displacement curves, obtained for
increasing crack lengths in the range a=50-400m, which, for W=600m, corresponds to
a/W=0.08-0.67. As expected, the loads decreased with increasing crack length. Due to
the absence of crack growth in the finite element model, no loss of load was observed,
even for very large plastic displacements. In real cases, crack growth would likely result
in a loss of load. In all cases, the calculations were performed well into the plastic
deformation region, so as to obtain valid ηpl values.
Figure 3-13 shows the elastic stiffness of the sheet specimens as a function of the
normalized crack length. As expected, the stiffness decreased with increasing normalized
Figure 3-12: The predicted load-displacement curves for a thin sheet 4-point bend
specimens containing through-thickness cracks and made of Zircaloy-4, as a function of
increasing crack lengths in the range a/W=0.08-0.67 (i.e. a=50-400m, with W=600m).

126
through-thickness crack length. However the behavior was quite different from the
ASTM geometry modeled previously. In fact for thin-sheet specimens where L/W=40,
the stiffness was much less sensitive to normalized crack length for a/W<0.5, and more
sensitive for a/W>0.5. This behavior explains why experimental compliance
measurements could not successfully be used to determine crack length in this study. As
a result, the electrical potential drop was used as a means to measure crack length, instead
of compliance measurements.
Figure 3-14 shows the variation of the J-integral as a function of the average
radius of the chosen contour. In this figure, as in Figure 2-14, the J/Jmax ratio is
Figure 3-13: The normalized elastic stiffness as a function of normalized crack length for
a thin-sheet specimen made of Zircaloy-4 in a four-point bend configuration such that
L/W=40, compared with that predicted for a cracked-plate ASTM specimen such that
L/W=4.

127
dependent on the J-integral „J‟ at the last step of the calculation for a given contour and
the J-integral „Jmax‟ at the last step of the calculation for the largest possible contour
comprised strictly within the mesh boundaries (analog to that shown in Figure 2-13). The
R/Rmax ratio is dependent on the average radius „R‟ of the given contour and the average
radius „Rmax‟ of the largest possible contour comprised strictly within the mesh
boundaries.
As observed for the cracked-plate ASTM geometry modeled previously, the J-
integral increased with increasing contour radius. However, as long as the chosen
contour was large enough, typically for R/Rmax > 0.75, the calculated J-integral showed
very little path dependence, such that it did not vary by more than 5%, independently of
Figure 3-14: The predicted J-integral as a function of contour radius for the thin-sheet
specimen geometry for a series of Zircaloy-4 specimens that are 600μm thick and contain
cracks with lengths ranging from a/W = 0.083 to a/W = 0.667, as modeled in Cast3M.

128
the path chosen, as for the ASTM geometry. Hence as long as R/Rmax > 0.75, the J-
integral was deemed sufficiently path-independent (within 5%) for the purpose of η
calculations.
As was done for thick-plate geometries, the J-integral was calculated for the
largest possible contour that was strictly within the specimen‟s mesh boundaries, and the
elastic and plastic portions of J-integral, Jel and Jpl, were extracted and plotted as a
function of the ratios BbAel and BbApl , respectively (where b and B are the
length of the remaining ligament and the width of the specimen, respectively). The slope
of the curves, equal to the ηel and ηpl parameters, were calculated by performing linear
fits in the same way as for the cracked-plate ASTM geometry modeled, using Eq. 3.13.
An example of this procedure was shown in Figure 3-7.
Figure 3-15 shows a comparison between the η values found using Cast3M for the
L/W=4 thick-plate ASTM geometry and the L/W=40 PSU thin-sheet geometry, and
Kim‟s published results (see Section 3.2.1). The ηel function obtained for the L/W=40
thin-sheet geometry was significantly different from that obtained for the l/W=4 thick-
plate ASTM geometry, over the entire a/W range. This confirms that the two geometries
have different elastic behaviors, which is consistent with the different stiffnesses
calculated (Figure 3-13). In contrast, in the a/W region from 0.3 to 0.8, the ηpl values for
thin-sheet and thick-plate were similar. The ηpl functions were markedly different in the
range a/W≤0.3. In this region, the thin-sheet ηpl value was significantly lower than that
for the thick-plate geometry. The smaller ηpl value for short cracks in the thin-sheet
geometry is consistent with the predictions made by Davies et al. [136] concerning the
influence of the L/W ratio on ηpl for various tensile specimen geometries. That study
predicted that ηpl decreases significantly with increasing L/W in the case of short cracks.

129
As noted previously, at low a/W values the deviation of the ηpl parameter from a
constant value of 2 is much larger for a thin-sheet specimen than for a thick-plate
specimen. Davies et al. have suggested that the deviation from a constant value of 2 is
due to the occurrence of more plastic deformation in the bulk material away from the
crack tip [136] in the case of thin-sheet specimens. As a result, the large ηpl differences
between thin-sheet and thick-plate may be due to more plastic deformation in the bulk of
a thin-sheet specimen than in that of a thick cracked-plate specimen. This prediction was
supported by comparing the equivalent plastic strain distribution near the crack tip within
the thin-sheet specimen, shown in Figure 3-16, with that for the cracked-plate geometry,
shown in Figure 3-9. For short cracks (Figure 3-9(a) and Figure 3-16(a)), there was a
significant accumulation of plastic deformation near the specimen top surface, where
Figure 3-15: The predicted η parameters, as a function of the normalized crack length, for
a thick-plate ASTM geometry and a thin-sheet PSU geometry. The ηpl parameter
predicted by Kim is also shown [134].

130
plastic strain levels were 2-3% in both the thin-sheet and thick-plate cases. In addition,
for short cracks, the calculated equivalent plastic deformation was uniformly distributed
in the bulk of the specimen between the crack and the inner loading pins; only the area
near the neutral axis of the specimen was not deformed plastically. However, in the case
of the thick plate, the specimen volume comprised between the center loading pins is
equal to 2BW2 (with B the width of the specimen and W the thickness). In contrast, for
the thin-sheet specimen, the corresponding volume was equal to ~13BW2, since the
distance between the inner loading pins was ~13W instead of 2W in the case of the thick-
plate geometry. This large difference in the volume of material experiencing plastic
deformation for small a/W values is likely the cause for the larger deviation from the
constant value of 2 for thin-sheet specimens. As is the case for thick plates, for longer
cracks the plastic deformation concentrates near the crack tip; see Figure 3-16(c-d).

131
Concerning the ηel function, the values predicted with Cast3M for the cracked
thin-sheet specimens were compared with the theoretical values given by Eq. 3.14.
Figure 3-15 shows good agreement between the predicted FEM values and the theoretical
values, hence validating the elastic portion of the calculation. To further validate the
Cast3M calculation in the elastic regime, an elastic error calculation was performed for
the thin-sheet geometry, based on the geometry correction factor for stress intensity
calculations in the elastic regime, as given by Eq. 3.15 and Eq. 3.16. As was done for
(a) (b)
(c) (d)
Figure 3-16: (a)-(d) Equivalent plastic strain at similar bending increments for a/W =
0.08, 0.25, 0.42, and 0.67, respectively. The plastically deformed areas are highlighted.

132
cracked-plate geometries in Section 3.2.1, α was taken at the first step of the calculation,
in the elastic regime, when J=Jel, and then compared to the expression given for α by
Tada et al. [132]. The elastic error was smaller than 3% for the entire range of crack
lengths modeled.
In summary, the Cast3M finite element code was used to simulate the elastic-
plastic behavior of a thin-sheet Zircaloy-4 specimen with a through-thickness crack and
submitted to four-point bending. From the model, J-integral calculations were performed
for a wide range of crack lengths and the important ηpl parameter was derived for the test
configuration used in this study. (Note: It should be recalled that the ηpl parameter is an
essential parameter for experimental determinations of the plastic component of J-
integral. Also, the γ factor used to take into account previous crack growth while
generating J-R resistance curves is directly derived from ηpl using Eq. 3.6.) Large
differences were observed between the ηpl parameter calculated for thin-sheet geometries
and those calculated for cracked thick-plate ASTM geometries for the a/W≤0.3 regime.
In this case, ηpl for thin-sheet specimens is much smaller than for thick-plate specimens.
These observation were consistent with work published by Davies et al. indicating a
dependence of ηpl on the L/W ratio [136], such that for small crack lengths, ηpl decreased
with increasing L/W ratios, which corresponds to the case of cracked thin-sheet
geometries.
3.2.3 Modeling of Uneven Crack Fronts with the Franc3D Code
As mentioned briefly in Section 3.1.2, a number of the fracture toughness
specimens tested in this study showed somewhat irregular crack fronts, meaning the
crack length varied across the width of the specimen. Consequently, the stress intensity
factor varied with location along the crack front along the specimen width. The electrical
potential drop (EPD) method used to monitor crack length is insensitive to the variations
of crack length along the crack front and only provides an average crack length. The
average crack length obtained from the EPD was used to calculate the J-integral, as
described in Section 3.1.1. As a result, the J-integral fracture toughness values generated

133
from the EPD record did not reflect the local stress intensity factor variations along the
crack front. If the crack length varies significantly over the crack front, this could cause
discrepancies in the fracture toughness calculations. As a result, in cases where the crack
length along its front deviated from the average crack length by more than 10% of the
specimen thickness W, the software Franc3D (FRacture ANalysis Code 3D) [137] was
used to model the effects of a locally varying crack length on the local stress intensity
factor. In particular, the software was used to compare the local stress-intensity factor
along the uneven crack front to that of a straight crack of average length.
Franc3D is a hybrid software which combines 3D-solid modeling, mesh
generation and fracture mechanics for nucleating and propagating cracks in a given
geometry. In this particular case, it was used in conjunction with the boundary element
modeling (BEM) code OSM (Object Solid Modeler) [137] to apply boundary conditions
on the surfaces of the generated model. The models created were 3D representations of
the thin-sheet Zircaloy-4 specimens, to which the appropriate boundary conditions were
applied to simulate four-point bending. Any shape of crack front may be injected into the
model for fracture mechanics analyses, to determine the local variations of the stress
intensity factor. Importantly, due to difficulties running calculations involving plasticity,
all the modeling was performed assuming elastic behavior. As a result, the displacements
applied as boundary conditions corresponded to the onset of yielding for the test
specimens considered.
Figure 3-17 presents a crack profile corresponding to a tilted crack, which is
presented as an example. The average crack length was calculated by integrating the
crack length along the crack front, and two separate models of the same cracked thin-
sheet specimen were created under Franc3D. The first model contained a uniform
straight crack of depth equal to the average crack length, while the second model was
generated using the actual crack profile. The same boundary conditions were applied to
both models. Franc3D allows for the computation of the stress intensity factors KI, KII
and KIII along the crack front. In most cases modeled, including this one, the value of KI
was more than a hundred times larger than the values of KII and KIII, so only KI was
retained for further analyses. The KI values obtained from the first model (containing the

134
uniform crack front) were compared to those obtained from the second model (containing
the actual tilted crack front) and by calculating the ratio KI(actual crack)/KI(straight crack).
Figure 3-17 shows the result of a Franc3D calculation in which a tilted crack was
modeled for the cracked thin-sheet specimen subject to uniform bending. In this case, the
crack length varied by ~30% of the specimen thickness, gradually increasing in length
across the specimen width. The lowest value of the calculated stress intensity factor
occurred where the crack was the shallowest and increased gradually to where the crack
was the deepest. The local stress intensity factor thus varied between 85% and 120% of
the average stress intensity factor, as determined using the average crack length provided
by the electrical potential drop measurement.
As observed in the example presented here as well as in other analyses of
irregular crack fronts, the stress intensity factor calculated with Franc3D generally
increased with increasing crack depth despite the bending mode of loading. Thus, the
lowest calculated stress intensity factors occurred at the shallowest section of the crack
front. As in other cases of specimens with variations of crack length along the crack
front, crack growth occurred first where the crack depth was the smallest at 25°C
(described in Section 3.3.1) and therefore at a location where the local KI value was
lowest. As will be discussed later, this surprising effect caused the crack front to become
more uniform as it propagated. As a result, the fracture toughness of hydrided Zircaloy-4
sheet for through-thickness crack growth was equal to ~85-90% of the toughness
calculated using the average crack length provided by EPD measurement.

135
3.3 Fracture Behavior
In this section, the fracture behavior of the thin sheet Zircaloy-4 specimens is
presented for the case of through-thickness crack growth. For each test temperature
(25°C, 300°C, and 375°C), the following are presented in order to better understand the
toughness behavior: (a) typical load-displacement records; (b) cracked-specimen cross-
sections, obtained from interrupted testing and metallography, which indicate crack
growth behavior and which are correlated to the load-displacement behavior; (c) crack
front profiles measured across the specimen width, as obtained using a light-microscope
Figure 3-17: Normalized stress-intensity factor along the crack profile for a tilted crack,
and profile of the corresponding crack. The test specimen, B63B, was 655μm thick.

136
equipped with a measuring stage; and (d) SEM fractography images, which provide
insight into the micro-mechanisms of crack growth.
In order to properly describe the fracture behavior, it is first necessary to define
„stable‟ and „unstable‟ crack growth. According to standard ASTM E1820 [120], stable
crack growth is defined as a displacement-controlled crack extension beyond the stretch-
zone width (the length of crack extension that occurs during crack-tip blunting), such that
crack extension stops when the applied displacement is kept constant. In contrast,
unstable crack growth corresponds to an abrupt crack extension that occurs with or
without prior stable crack growth in a test specimen under constant crosshead
displacement. Thus, unstable crack growth will be accompanied by a rapid load-loss,
while stable crack growth often occurs under a rising load, but may also occur under
slowly declining load conditions.
3.3.1 Crack Growth at 25°C
(a) Load-Displacement Behavior
At 25°C, three main types of load-displacement behavior were observed (termed
type I, II, and III), as depicted in Figure 3-18 and Figure 3-19. Type I behavior
corresponds to unstable crack growth occurring prior to any stable crack growth. For
type I behavior (Figure 3-18(a)), a large and abrupt loss of load occurred shortly after
maximum load was reached after yielding. This load-drop was associated with a large
increment in crack length corresponding to rapid unstable crack growth occurring prior to
any stable crack growth. Type III behavior corresponds to only stable crack growth (i.e.
no unstable crack growth). For type III behavior (Figure 3-18(b)) a gradual loss of load
occurred after maximum load was reached, but no abrupt load-drop was observed, and
only stable crack growth occurred.

137
In addition to type I and type III behaviors, some intermediate cases were
observed. In type II behavior, a finite amount of stable crack growth occurred prior to
unstable crack growth. Figure 3-19 shows an example of type II behavior, in which a
(a)
(b)
Figure 3-18: Typical load-displacement and crack-growth behavior at 25°C for (a) a
specimen displaying type I behavior (specimen B70A, KJc~39.5MPa√m), and (b) a
specimen displaying type III behavior (specimen B66A, KJi~29.8MPa√m). Note: loads
were normalized to represent a specimen 24mm wide by 0.6mm thick.

138
certain amount of plasticity associated with stable crack growth occurred after maximum
load, followed by an abrupt load-drop corresponding to unstable crack growth.
In order to try and understand the different types of behavior illustrated in
Figure 3-18 (unstable crack growth prior to any stable crack growth, and only stable
crack growth) and Figure 3-19 (stable crack growth followed by unstable crack growth),
the stored elastic energy per unit of cross-section area Emaxel was calculated for each
specimen:
where Pmax is the maximum load, S is the elastic stiffness of the specimen, b=W-a is the
length of the remaining ligament (where a is the crack length), and W the specimen
thickness.
Figure 3-19: Examples of type II load-displacement behavior at 25°C: unstable crack
growth following some plastic deformation (δpl~0.18mm) beyond maximum load
(specimen B65A, KJu~64.3MPa√m). Note: loads were normalized to represent a
specimen 24mm wide by 0.6mm thick.
bBS
PE el 1
2
12
maxmax (3.17)
Stable crack-growth
Unstable crack-growth
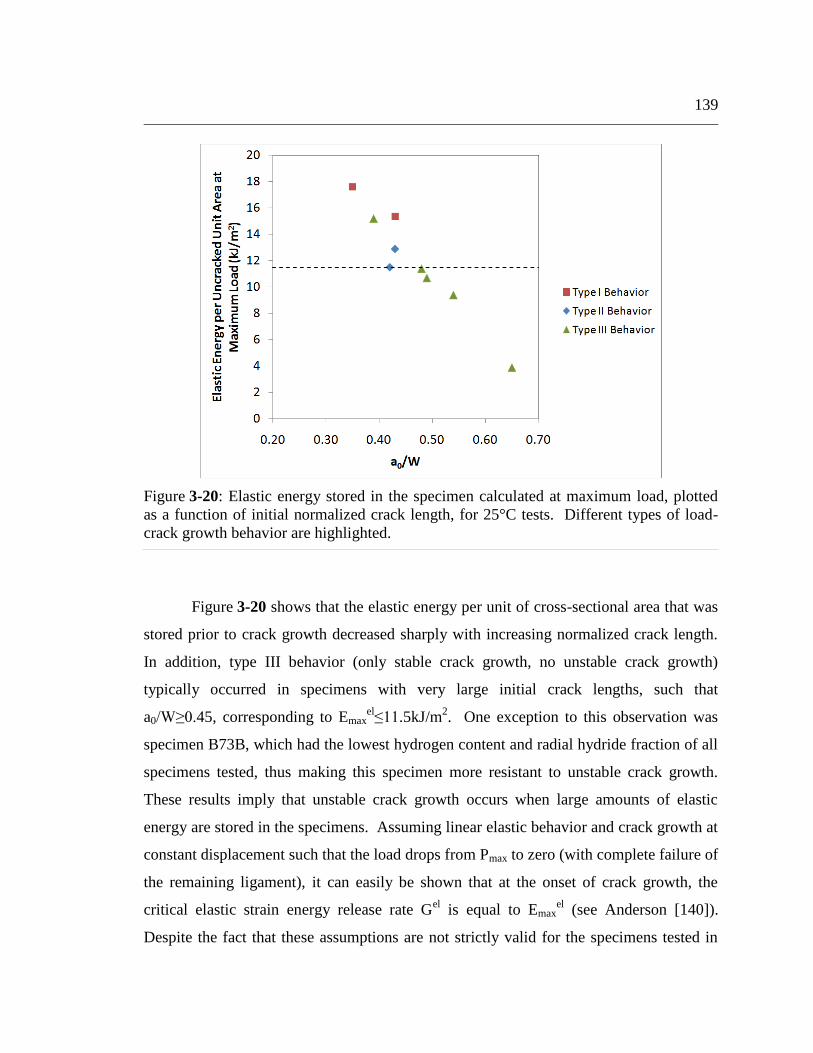
139
Figure 3-20 shows that the elastic energy per unit of cross-sectional area that was
stored prior to crack growth decreased sharply with increasing normalized crack length.
In addition, type III behavior (only stable crack growth, no unstable crack growth)
typically occurred in specimens with very large initial crack lengths, such that
a0/W≥0.45, corresponding to Emaxel≤11.5kJ/m
2. One exception to this observation was
specimen B73B, which had the lowest hydrogen content and radial hydride fraction of all
specimens tested, thus making this specimen more resistant to unstable crack growth.
These results imply that unstable crack growth occurs when large amounts of elastic
energy are stored in the specimens. Assuming linear elastic behavior and crack growth at
constant displacement such that the load drops from Pmax to zero (with complete failure of
the remaining ligament), it can easily be shown that at the onset of crack growth, the
critical elastic strain energy release rate Gel is equal to Emax
el (see Anderson [140]).
Despite the fact that these assumptions are not strictly valid for the specimens tested in
Figure 3-20: Elastic energy stored in the specimen calculated at maximum load, plotted
as a function of initial normalized crack length, for 25°C tests. Different types of load-
crack growth behavior are highlighted.

140
this study, it is believed that for larger values of Emaxel, a larger amount of elastic strain
energy will be released for a given crack extension, resulting in a larger driving force for
crack growth, leading to a more rapid (i.e. unstable) crack growth process. As the
amount of stored elastic energy decreased, stable crack growth was increasingly favored
over unstable crack growth. The transition from type III (only stable crack growth) to
type I and II (some unstable crack growth) behaviors occurred when the elastic energy
stored in the specimen exceeded ~11.5kJ/m2. Specimen B73B, which had a very low
hydrogen content and radial hydride fraction, constitutes an exception to this rule.
(b) Interrupted Testing
To better understand the crack growth process in relation to the load-displacement
behavior, interrupted tests were carried out using the procedure described in Section
2.2.3. While the specimens tested in this manner were not fatigue pre-cracked prior to
fracture testing (a sharp crack was initiated in this case when the brittle hydride blister
cracked), the crack-tip fracture process should be the same as that of a fatigue-induced
crack studied here.
Figure 3-21 shows the evolution of the resulting crack profile at different points
on the load-displacement curve for a test performed at 25°C [113, 114]. It was observed
that a sharp crack was observed in the specimen prior to yielding (Figure 3-21(b)), as
would be expected to happen for fatigue pre-cracked specimens. No further crack growth
was observed prior to maximum load, at which point a significant mode I crack opening
displacement was evident, as shown in Figure 3-21(c). Beyond the maximum load, crack
growth occurred, and crack tip blunting was observed as the crack entered the zone of
“in-plane hydrides” (Figure 3-21(d)). Crack growth within the in-plane hydride zone
occurred as a result of cracking of large hydride particles ahead of the crack tip, which
formed large, elongated primary voids (Figure 3-21(e)). Smaller secondary voids then
formed between the crack tip and the large primary void ahead of it (Figure 3-21(d)).
Finally, crack advance resulted from the rupture of the Zircaloy-4 ligament in between
the crack tip and the next large hydride-induced primary void ahead of it, as is evident on
Figure 3-21(e).

141
Importantly, micrographs obtained from interrupted testing were used to measure
the crack tip radius at the onset of crack growth into in-plane hydrides, from which the
blunting-line offset δ (defined in Section 3.1.1) was determined. As shown
schematically in Figure 3-22(a), the crack-tip opening displacements were determined by
measuring the radius of the crack tip, and in the cases where the crack grew
incrementally, subtracting the crack opening displacement associated with subsequent
crack growth. Thus, the crack-tip opening displacements (2δ) of a blunted crack were
determined (Figures 3-22(b) and 3-22(c)), as were the opening displacements of cracks
that had grown incrementally (Figures 3-22(d) and 3-22(e)). At 25°C, the average
blunting-line offset δ was thus found to be ~10μm for through-thickness crack growth
into a field of in-plane hydrides. These data imply a crack extension of ~10μm occurred
by crack-tip blunting prior to crack growth.

142
(a)
(b) (c)
(d) (e)
Figure 3-21: (a) Evolution of the crack profile with increased bending of the specimen for
a test at 25°C. The light-micrographs (b,c,d,e) show high magnification images of the
crack tip evolution (all images taken at same magnification). After [114].

143
(a)
(b) (c)
(d) (e)
Figure 3-22: (a) A schematic representation of the method used to measure the blunting-
line offset δ. (b-e) Examples of blunting-line offset measurements for specimens tested
at 25°C and crack growth into in-plane hydrides. (b,c): at the crack tip, respectively equal
to 9μm, 7μm. (d,e): at the tip of the fatigue pre-crack, respectively equal to 11μm and
10μm. The average blunting-line offset was ~10μm.
Δ=23μm
Δ=17μm
2δ=14μm
2δ=18μm
2δ+Δ=45μm
2δ+Δ=37μm

144
(c) Crack Front Profiles
In addition to the load-displacement behavior and the observations made from
interrupted testing, the shape of the crack front across the width of each test specimen
was obtained from observations of the fracture surface after testing. There was a well
defined and readily observable transition from a fracture surface formed by fatigue crack
growth and one formed by fast fracture. Figure 3-23 displays typical crack fronts
obtained in this study for tests performed at 25°C. A number of different crack
geometries were obtained: tilted cracks, where the fatigue pre-crack extends the entire
width of the specimen, and the crack depth is larger on one side of the specimen than the
other; bridged cracks, where the crack depth is reduced locally due to the presence of a
crack bridge; and comparatively straight cracks of different depths in different specimens.
As mentioned above, the final crack front after tensile crack growth was always
relatively straight, independent of the initial fatigue pre-crack profile across the specimen
width. This behavior indicates that at 25°C, through-thickness crack growth during
fracture toughness testing occurred in a manner that resulted in uniform crack lengths
(i.e. where the crack depth is roughly constant across the specimen width). Such a final
crack profile implies that crack growth occurred first where the cracks were most
shallow. As was described in Section 2.3, due to the relative proximity of the crack tip to
the hydride blister, the shallow regions of a crack generally also correspond to the regions
within the thickness of a given specimen where the hydride particles are most susceptible
to being oriented out-of-plane. Importantly, previous research has shown that the
presence of out-of-plane hydrides reduces fracture toughness [113, 141]. Thus the
occurrence of crack growth in the regions where the crack is shallower is consistent with
the lower fracture toughness values associated with the presence of out-of-plane hydrides.

145
(d) SEM Fractography
As a final means to characterize the crack growth process, SEM fractography was
performed on a number of specimens tested at 25°C. Figure 3-24 shows three main
regions of the fracture surface that were clearly distinguishable:
The hydride blister, shown in Figure 3-24(b), characterized by a smooth and flat
fracture surface, and associated with a very low energy fracture. This confirms
the hydride blisters were brittle and failed by cleavage during the initial stage of
pre-cracking.
(a) Tilted crack (b) Bridged crack
(B63B, KJPmax~29.3MPa√m) (B64A, KJPmax~28.1MPa√m)
(c) Straight shallow crack (d) Straight deep crack
(B70A, KJPmax~32.8MPa√m) (B66A, KJPmax~24.1MPa√m)
Figure 3-23: Typical crack front profiles observed in this study for 25°C tests. The
specimen number is in parentheses. The blue line represents the depth of the hydride
blister, the green line is the initial crack profile, and the red line is the final crack profile.

146
The fatigue pre-crack, shown in Figure 3-24(b,c), also characterized by a
relatively smooth and flat fracture surface. The fatigue pre-crack surface was
rougher than the cleavage fracture surface associate with the hydride blister, but
much smoother than the tensile crack growth surface from fracture toughness
testing.
The surface created during fracture toughness testing exhibited several
important features characteristic of the fracture process, shown in Figure 3-24(d).
The cracking of large elongated hydride precipitates (Figure 3-21) in the Zircaloy-
4 matrix formed large primary voids in the plane of the sheet specimen, with
lengths that varied between ~20m and 200-300m. In addition, small secondary
equiaxed micro-voids were present on the fracture surfaces in the form of
“dimples” (about ~5m in diameter). These resulted from void nucleation ahead
of the crack tip during the crack growth process that links the crack tip with the
next primary void ahead of it, as shown in Figure 3-21. Because of the formation
of a number of very large hydride-initiated primary voids and because the crack
propagated by linking these large voids, the fracture surface appeared rough and
irregular.

147
The last step of the fatigue pre-cracking procedure was performed at a lower
maximum stress-intensity factor. This transition to a lower stress intensity factor (load
shedding) is shown in the SEM fractograph in Figure 3-25(a). The ridge seen on the
fracture surface indicates a change in the maximum stress intensity factor driving the
crack during fatigue cycling. Figure 3-25(b) shows that some hydride particles crack
during the first step(s) of fatigue pre-cracking, but not during the last step (after load-
Figure 3-24: (a) Typical SEM fractography for a specimen tested at 25°C. (b) Close-up
of the blister/fatigue pre-crack interface. (c) Close-up of the fatigue pre-crack/fracture
surface interface. (d) Hydride induced primary voids, separated by ductile dimples.
(d)
(a)
(c)
(b)
Blister
Fatigue pre-crack
Fatigue pre-crack
Tensile fracture
Hydride-induced
primary voids

148
shedding). The transition in the fracture surfaces within the fatigue pre-crack region is
consistent with the reduction in stress intensity factor, such that no large scale damage
(such as hydride cracking) occurred near the crack tip. The lack of observable damage on
the fatigue pre-crack surface implies that the maximum stress intensity factor
recommended by ASTM E1820 [120] for the last step of fatigue pre-cracking was well
adapted for the case of through-thickness crack growth in Zircaloy-4 at 25°C.
3.3.2 Crack Extension at 300°C
(a) Load-Displacement Behavior
In contrast with testing at 25°C, only one type of load-displacement behavior was
observed at 300°C, as shown in Figure 3-26. The most important characteristic of the
load-displacement response at 300°C was the presence of a plateau that occurred near
(a) (b)
Figure 3-25: (a) Evidence of load-shedding during fatigue pre-cracking in the form of a
ridge. (b) Evidence of load-shedding during fatigue pre-cracking in the form of hydride
cracking in the first step of fatigue pre-cracking, and its absence afterwards.
Fatigue pre-crack
Blister
Tensile fracture
Tensile fracture
Fatigue pre-crack
2nd
step 2nd
step
1st step
1st step
Ridge Hydride cracking

149
maximum load, accompanied by an extended range of plastic displacement. Thus a large
amount of plastic deformation occurred during crack extension at or near maximum load.
(Note: the term „crack extension‟ does not necessarily mean crack growth, as crack
extension may also occur by crack-tip blunting, as depicted in Figure 3-22(a)) After the
plateau, crack extension caused a loss of load, at a rate that depended on the rate of crack
extension, as shown in Figure 3-26. Importantly, unstable crack growth was not observed
at 300°C, even in cases where the rate of load-loss was comparatively high. In fact, no
rapid increase in crack length accompanied by an abrupt load-drop (such as observed at
25°C) was recorded in tests performed at 300°C.

150
(b) Interrupted Testing
To better understand the crack extension process of thin-sheet Zircaloy-4
specimens under conditions of through-thickness crack growth, interrupted tests were
performed at 300°C in the same way they were previously performed at 25°C [113, 114],
using the procedure described in Section 2.2.3. Although the specimens tested in this
(a)
(b)
Figure 3-26: Typical load-displacement and crack-growth behavior at 300°C, showing a
plateau near maximum load, for (a) a specimen exhibiting stable crack growth (B57D,
KJPmax~71.4MPa√m), and (b) a specimen exhibiting only crack-tip blunting (B70C,
KJPmax~64.3MPa√m). Note: loads were normalized to represent a 24mm wide by 0.6mm
thick specimen.
Plateau at max. load
Plateau at max. load

151
manner were not fatigue pre-cracked prior to fracture testing, a sharp crack was present in
the test specimens, since the hydride blister cracked prior to yielding; hence the results
are relevant to the present study. Figure 3-27(a) shows the evolution of the crack profile
at different points on the load-displacement curve for a test performed at 300°C [114].
As in the case of 25°C testing, it was observed that the blister had already cracked prior
to yielding. Subsequent plastic deformation of the specimen near maximum load resulted
in crack extension due to blunting, rather than to clearly defined crack growth, as is
evident in Figure 3-27(b-c). After the plateau observed at maximum load, the gradual
loss of load observed was associated with the onset of stable tearing (in the form of a
gradual extension of a blunted crack in a mixed-mode I+II manner), which initiated at the
bottom of the blunted crack tip, as visible in Figure 3-27(d). This type of behavior (crack
extension due to extensive blunting followed by stable tearing) was also observed by
others under similar through-thickness crack growth conditions at 300°C [51, 54].

152
Importantly, the micrographs obtained from interrupted testing permitted
measurements of the crack tip radius using the software Image-J, as shown in Figure 3-
28. The measured radii provided estimates of the crack extension associated with crack-
tip blunting prior to crack growth, and were thus used to determine the blunting line
(a) (c)
(b) (d)
Figure 3-27: (a) Evolution of the crack profile with increased bending of the specimen for
a test at 300°C (specimen B28). The SEM-micrographs (b,c,d) show high magnification
images of the crack tip evolution. Note: the small black dots are a result of polishing, and
do not correspond to voids in the Zircaloy-4 matrix.

153
defined in Section 3.1.1. The average crack extension associated with blunting at 300°C
was found to be δ~25μm for through-thickness crack growth into a field of mixed or in-
plane hydrides. In the case of fatigue pre-cracked specimens, the initial crack length
placed the crack tip within the field of mixed or in-plane hydrides, thus a δ=25μm
blunting-line offset was used at 300°C.
(c) Crack Front Profiles
In addition to the load-displacement behavior and the previous observations made
from interrupted testing, the shape of the crack front across the width of each test
specimen was used to analyze the crack growth behavior. Figure 3-29 displays typical
crack front profiles present initially after fatigue pre-cracking (a0) and after tensile crack
growth (af) for tests at 300°C. A number of different crack geometries were obtained,
some of which were similar to those observed at 25°C and described in Section 3.3.1:
tilted cracks, and straight cracks, of different depths in different specimens. Inverse-
thumbnail cracks, (in which the crack is deeper near the edges of the specimen), were
also observed prior to toughness testing.
(a) (b)
Figure 3-28: (a,b) Examples blunting-line offset „δ‟ measurements for specimens tested at
300°C. The blunting-line offsets are respectively equal to 24μm and 28μm.
Δ=56μm
2δ+Δ=104μm
2δ =56μm

154
It is interesting to note that unlike crack growth at 25°C, the final crack front (af)
had the same overall shape as the initial crack front (a0). This behavior indicates that at
300°C, through-thickness crack growth occurred roughly at the same rate all along the
crack front. Since the hydride microstructure generally varied within the thickness of the
test specimens (see Figure 2-13), this implies that the hydride microstructure likely had
little influence on the crack growth process at 300°C.
(a) Inverse-thumbnail crack (b) Tilted crack
(B70C, KJPmax~64.3MPa√m) (B71B, KJPmax~55.5MPa√m)
(c) Straight crack (B74B, KJPmax~55.2MPa√m)
Figure 3-29: Typical crack front profiles observed in this study for 300°C tests. The
specimen number is in parentheses. The blue line represents the depth of the hydride
blister, the green line is the initial crack profile, and the red line is the final crack profile.

155
(d) SEM Fractography
As a final means to characterize the crack growth process, SEM fractography was
performed on a number of specimens tested at 300°C so as to characterize the crack-
growth mechanisms. Figure 3-30(a) shows a characteristic fracture surface obtained
from testing at 300°C. The three main regions of the fracture surface were clearly
distinguishable. From top to bottom, these are:
The hydride blister, shown in the top of Figure 3-30(a), was similar to that
described in Section 3.3.1.
The fatigue pre-crack, shown in the top of Figure 3-30(b) was similar to that
described in Section 3.3.1.
Note: the similarities between the hydride blister and the fatigue pre-crack in tests
performed at 300°C and tests performed at 25°C is to be expected, since pre-cracking was
performed at 25°C in all cases.
The tensile surface created during fracture toughness testing at 300°C was
significantly different from that observed at 25°C, as shown in Figure 3-30(c,d).
At 300°C, despite much larger plastic strains than at room temperature, large,
elongated primary voids were not present in the fracture surface. Therefore, there
was no evidence of the hydrides initiating the failure process at this temperature.
The fracture surfaces were characterized by equiaxed ductile “dimples” which
resulted from the formation of voids during the ductile fracture of the substrate
under the blister. The diameter of the ductile dimples was in the ~10-15m range,
compared to ~5m at room temperature. The larger diameter of the dimples at
300°C was a consequence of the material being more ductile than at room
temperature. Very similar observations were made by Glendening et al. [119] as
well as Bertolino et al. [107, 109] for high temperature testing.
Note that in Figure 3-30(a) the remaining ligament corresponds to the uncracked portion
of the specimen at the end of a fracture toughness test, and was subsequently broken at
room temperature.

156
At 300°C, the solid solubility of hydrogen is around 100wt.ppm, which was lower
than the hydrogen content found in most specimens tested at this temperature. As a
result, most of the hydride particles were still present in the hydrided Zircaloy-4 at
300°C. Interestingly, the elongated “ridges” visible in the plane of the sheet in Figure 3-
30(d) are reminiscent of large hydrides. These hydride particles did not crack to form
large primary voids, as was observed at 25°C. Instead, they appear to have failed with a
Figure 3-30: (a) Typical SEM fractography for a specimen tested at 300°C. (b) Close-up
of the fatigue pre-crack/fracture surface interface. (c) Close-up of the fracture surface
generated at 300°C. (d) Uncracked hydride particle surrounded by ductile dimples.
(d)
(a)
(c)
(b)
Fatigue pre-crack
Fatigue pre-crack
Blister
Tensile fracture Tensile fracture
“Ductile” hydride
Remaining ligament

157
certain amount of ductility, and can be seen in Figure 3-30(d) embedded in the Zircaloy-4
substrate which formed ductile “dimples”. Thus, although hydrides fail, they do not form
large primary voids at 300°C, as was the case at 25°C. The absence of large hydride-
induced primary voids and the presence of ductile elongated ridge features, suggesting
ductile behavior of the hydrides, has also been observed by Glendening and Bertolino
[107, 109, 119] during their studies of the fracture of hydrided Zircaloy-4 at 300°C.
3.3.3 Crack Extension at 375°C
The overall fracture behavior at 375°C was very similar to that observed at
300°C; see Section 3.3.2. As a consequence, fewer details are given here.
(a) Load-Displacement Behavior
The load-displacement behavior at 375°C was basically identical to that observed
at 300°C, with the presence of a plateau which occurred around maximum load,
accompanied by slow crack growth, as shown in Figure 3-31. After the plateau observed
near maximum load, loss of load occurred gradually at a relatively low rate in all cases.
Importantly, unstable crack growth was not observed at 375°C, as was the case at 300°C.

158
(b) Interrupted Testing
Interrupted tests were performed at 375°C in a manner similar to those performed
at 25°C and 300°C to discern crack growth mechanisms [113, 114]. At 375°C, extensive
crack-tip blunting was associated with the plateau near maximum load, as shown in
Figure 3-32(c,d). Importantly, the small amount of crack extension observed occurred
solely as a result of this extensive crack-tip blunting. In contrast to the behavior at
300°C, the onset of stable tearing (in the form of a gradual extension of a blunted crack in
a mixed-mode I+II manner) was not reached at 375°C. This is different from the crack
growth behavior observed by Glendening et al. at 375°C under conditions of through-
thickness crack growth, where short mixed-mode cracks initiated at the bottom of blunted
cracks along a plane inclined at ~45° from the specimen plane [54]. However, it should
be noted that in Glendening‟s study, performed under equal-biaxial tension, the
specimens failed as a result of shear instability. In this case, the bending geometry
Figure 3-31: Typical load-crack-growth behavior at 375°C, showing a plateau near
maximum load (specimen B70D, KJPmax~57.1MPa√m). Note: the load was normalized to
represent a 24mm wide by 0.6mm thick specimen.
Plateau at max. load

159
creates a neutral axis ahead of the crack tip which impedes the development of a shear
instability. Thus, it is logical that crack extension due to crack-tip blunting and ductile
tearing would occur in bending geometry instead of a shear instability.
Note: in the case of shear instability, the entire remaining ligament would fail at once by
void nucleation, growth and coalescence, due to the accumulation of plastic strain in a
shear band oriented at ~45° from the specimen plane [142]. This requires for there to be
tensile stresses through the whole specimen thickness.

160
As was done for the other test temperatures, the crack tip radius was measured
using the software Image-J, as shown in Figure 3-33. The measured radii provided
estimates of the crack extension associated with crack-tip blunting prior to the onset of
(a) (b)
(c) (d)
Figure 3-32: (a) Evolution of the crack profile with increasing bending of the specimen
for a test performed at 375°C (from specimen B84). The SEM-micrographs (b,c,d) show
high magnification images of the crack tip evolution. Note: the small black dots in (b) and
(c) are a result of polishing, and do not correspond to voids in the Zircaloy-4 matrix.
Scratches from polishing
Crack tip

161
crack growth initiation, and were thus used to define the blunting line defined in Section
3.1.1. The average crack extension associated with blunting at 375°C was found to be
~20μm. In the case of fatigue pre-cracked specimens, the initial crack length placed the
crack tip within the field of mixed or in-plane hydrides, thus a 20μm blunt line offset was
used at 375°C.
(c) Crack Front Profiles
The crack-front profiles obtained from testing at 375°C were very similar to those
obtained for tests at 300°C. Most importantly, at 375°C like at 300°C, the final crack
front had the same overall shape as the initial crack front. This indicates that at 375°C,
through-thickness crack growth occurred uniformly all along the crack front.
(d) SEM Fractography
As was done at 25°C and 300°C, SEM fractography was performed on a number
of specimens tested at 375°C so as to characterize the crack-growth mechanisms.
Figure 3-34(a) shows a characteristic fracture surface obtained from a specimen tested at
(a) (b)
Figure 3-33: (a,b) Examples of crack-tip radius measurements for specimens tested at
375°C. The crack-tip radii are respectively equal to 16μm and 23μm.
50μm 50μm

162
375°C. The main regions of the fracture surface are clearly distinguishable. From top to
bottom, these are:
The hydride blister, shown in the top of Figure 3-34(a), is similar to that
described in Section 3.3.1.
The fatigue pre-crack, shown in the top of Figure 3-34(b) is similar to that
described in Section 3.3.1.
The surface created during fracture toughness testing, which is very similar to
that observed at 300°C (Figure 3-30), is shown in the lower half of Figure 3-34(c)
and in Figure 3-34(d). In contrast to the observations of crack growth at room
temperature, primary voids were not present in the 375°C fracture surface despite
much larger plastic strains. Therefore, there was no evidence of the hydrides
initiating the failure process at 375°C. The fracture surfaces were characterized
by equiaxed ductile “dimples” which resulted from the formation of voids during
the ductile fracture of the substrate under the blister. The diameter of the ductile
dimples was about ~15-20m, compared to ~10-15m at 300°C and ~5m at
25°C. The larger diameter of the dimples at 375°C suggests that the material is
more ductile than at lower temperatures. As opposed to 300°C, no hydride
induced ridges were observed at 375°C, likely because a larger proportion of the
hydride particles were dissolved into the matrix at 375°C than at 300°C.

163
3.4 Fracture Mechanics Interpretation of Test Results
The main goal of the present study was to determine the fracture toughness of
thin-sheet Zircaloy-4 under conditions of through-thickness crack growth at 25°C, 300°C,
Figure 3-34: (a) Typical SEM fractography for a specimen tested at 375°C. (b) Close-up
of the fatigue pre-crack/fracture surface interface. (c) Close-up of the fracture
surface/remaining ligament interface. (d) Close-up of the fracture surface generated at
375°C.
(d)
(a)
(c)
(b)
Fatigue pre-crack
Fatigue pre-crack
Blister
Tensile fracture
Tensile fracture
Remaining ligament
Tensile fracture
Remaining ligament
164
and 375°C. The load-displacement and crack-growth data obtained using the electrical
potential drop method described in Section 2.2.3 were analyzed using the fracture
mechanics analyses presented in Section 3.1.1. For each specimen tested, a J-R
resistance curve was obtained and subsequently analyzed to determine several toughness
parameters of interest (see Section 3.1.1). In the cases where the crack length was not
uniform across the specimen width, the software Franc3D was used to determine the
correction factors to be applied to obtain the more accurate fracture toughness values, as
described in Section 3.2.3. In this section, the J-R curve behavior is described, and
fracture toughness parameters are identified for each test temperature.
3.4.1 Fracture Toughness Behavior at 25°C
At 25°C, three different J-R responses were obtained, corresponding to the three
types of load-displacement behavior described in Section 3.3.1. Type I behavior, for
which the J-R behavior is shown in Figure 3-35, corresponds to the case where unstable
crack growth occurred prior to the onset of stable crack growth (i.e. prior to the
intersection of the J-R curve with the blunting line); see also Figure 3-18(a). In this case,
it was possible to determine two characteristic values of the J-integral: the J-integral
corresponding to the point of maximum load, termed JPmax, and the J-integral at the onset
of unstable crack growth (i.e. rapid crack growth at constant crosshead displacement)
prior to any stable crack growth, termed Jc.

165
Type II behavior corresponds to the case where an increment of stable crack
growth occurred first, which was then followed by unstable crack growth; for example,
see the load-displacement responses in Figure 3-19. The J-R response for several
specimens exhibiting type II behavior is shown in Figure 3-36. For this type of behavior,
it was possible to determine three characteristic values of the J-integral: the J-integral
corresponding to the point of maximum load (JPmax), the J-integral at the onset of stable
crack growth (Ji), defined by the intersection between the J-R curve and the blunting line,
Figure 3-35: J-R curves obtained at 25°C for specimens exhibiting Type I behavior, where
unstable crack growth occurred prior to stable crack growth (see Table 3-1 for
corresponding values of toughness parameters). The solid black line is the construction
line of slope equal to 2ζy, and the black dashed line is the blunting line. The colored
dashed lines represent the large increment in crack length which occurs during the
unstable crack growth phase.
Jc

166
and the J-integral at the onset of unstable crack growth after some stable crack growth
had occurred (Ju).
For specimens showing type III behavior, only stable crack growth was observed.
The J-R response associated with type III behavior is shown in Figure 3-37. When only
stable crack growth occurred, two J-integral parameters were determined: the J-integral
corresponding to the point of maximum load (JPmax), and the J-integral at the onset of
Figure 3-36: J-R curves obtained at 25°C for specimens exhibiting Type II behavior,
where stable crack growth occurred prior to unstable crack growth (see Table 3-1 for
corresponding values of toughness parameters). The solid black line is the construction
line of slope equal to 2ζy, and the black dashed line is the blunting line. The colored
dashed lines represent the large increment in crack length which occurs during the
unstable crack growth phase.
Ju

167
stable crack growth (Ji), defined by the intersection between the J-R curve and the
blunting line.
In addition to the fracture toughness parameters derived from the different types
of J-R responses described above, the tearing modulus, which depends on the slope of the
J-R curve (and is given by Eq. 3.11), was also calculated for the cases where stable crack
growth occurred (type II and III behaviors). For type II behavior, an average value of the
tearing modulus was calculated between the onset of stable crack growth (Ji) and the
onset of unstable crack growth (Ju). For type III behavior, where no unstable crack
Figure 3-37: J-R curves obtained at 25°C for specimens exhibiting Type III behavior,
where only stable crack growth occurred (see Table 3-1 for corresponding values of
toughness parameters). The solid black line is the construction line of slope equal to 2ζy,
and the black dashed line is the blunting line.
Ji

168
growth was observed, the tearing modulus was calculated between the onset of stable
crack growth (Ji) and the end of the test.
Table 3-1 summarizes the fracture toughness parameters obtained from tests at
25°C (the error is ±5%). The fracture toughness at the onset of crack growth corresponds
to the parameter KJi in the cases where stable crack growth occurred (Type II and type III
behaviors), and to KJc in the cases where unstable crack growth occurred (Type I
behavior). Both KJi and KJc showed a decreasing trend with increasing hydrogen content
and increasing fraction of radial hydrides near the crack tip (see Section 3.4.1 for more
details), thus implying that the crack-growth behavior of the material at 25°C is
dependent on the hydride microstructure near the crack tip. Over the range of hydride
microstructures studied, the fracture toughness KJi at the onset of stable crack growth (for
type II and type III behavior) decreased from 40 to 24 MPa√m, while the fracture
toughness KJc at the onset of unstable crack growth (for type I behavior), decreased from
48 to 34 MPa√m. Type I unstable crack growth behavior occurred at higher hydrogen
contents and higher radial hydride contents (RHC) when compared to type II and type III
stable crack growth behavior, but resulted in higher values of the fracture toughness at
the onset of crack growth (KJc > KJi). The relationship between the measured fracture
toughness at the onset of stable and unstable crack growth is unexpected, since higher
hydrogen contents and higher RHC are typically associated with lower fracture toughness
at 25°C [93, 108, 141]. It should be noted, however, that type I behavior also
corresponded to shorter initial crack lengths, which resulted in higher loads and more
elastic energy being stored in the specimen prior to the onset of crack growth (see
Figure 3-20), when compared to specimens exhibiting type II and III behavior. The
higher loads and higher stored elastic energy measured for type I behavior could
contribute to artificially inflating the KJc fracture toughness values.
In test specimens exhibiting type II behavior, the fracture toughness KJi at the
onset of stable crack growth was smaller than the fracture toughness KJu at the onset of
unstable crack growth following a finite amount of stable crack growth (KJi<KJu),
indicating a rising R-curve behavior prior to unstable crack growth. In addition, for the
onset of unstable crack growth, the values of KJu were slightly lower than the values of

169
KJc despite being measured at lower hydrogen contents and lower RHC. This
relationship between KJu and KJc is somewhat unexpected, and could be a testing artifact,
as mentioned above. However, it is also possible that damage (in the form of hydride
induced voids) occurred ahead of the crack tip during stable crack growth, thus
weakening the material ahead of the crack tip. As a result, less energy would be
necessary to fracture the material during unstable crack growth following stable crack
growth, when compared to the type I case of unstable crack growth prior to any stable
crack growth.
Table 3-1: Summary of fracture toughness parameters obtained from testing at 25°C.
Notes: Type I crack growth corresponds to unstable crack growth prior to any stable crack
growth, Type II corresponds to stable crack growth followed by unstable crack growth, and
type III corresponds to only stable crack growth. Test B63B resulted in significantly lower
KJu and T values, likely because it had higher hydrogen content and radial hydride content
than the other specimens with type II behavior (see Section 3.4.1).
Specimen Behavior [H]
(wt.ppm) RHC (%)
Jc (kJ/m
2)
Ji (kJ/m
2)
Ju (kJ/m
2)
JPmax (kJ/m
2)
T KJc
(MPa√m) KJi
(MPa√m) KJu
(MPa√m) KJPmax
(MPa√m)
B62B Type I 228 24 19.9 - - 15.0
- 47.9 - - 41.5
B70A Type I 281 43 12.8 - - 9.3
- 34.5 - - 29.5
B63B Type II 221 31 - 8.6 10.6 7.5
12.5 - 25.4 28.3 23.7
B65A Type II 141 11 - 8.0 25.9 11.6
87.3 - 24.3 43.7 29.3
B64A Type III 192 22 - 7.0 - 6.9
66.4 - 25.9 - 25.6
B66A Type III 157 14 - 7.7 - 5.1
70.4 - 26.8 - 21.7
B71A Type III 148 12 - 12.6 - 9.8
101.5 - 38.1 - 33.6
B73B Type III 63 0 - 9.9 - 11.6
69.0 - 33.8 - 36.6
B74A Type III 71 16 - 16.6 - 9.3
64.0 - 39.3 - 29.5

170
3.4.2 Fracture Toughness Behavior at 300°C
As described in Section 3.3.2, and in contrast with 25°C, unstable crack growth
never occurred during testing at 300°C. As a result, only two types of J-R curve behavior
were observed. The first type of behavior, shown in Figure 3-38 (see also Figure 3-
26(a)), corresponds to the cases where the J-R curve never intersected the blunting line,
defined at an offset of δ=25μm (see Section 3.3.2). In fact, for these tests, the J-R curves
were essentially parallel to the construction line corresponding to crack-tip blunting (see
Section 3.1.1), meaning that even if δ~0μm there would be no intersection between the J-
R curves and the blunting line. Thus stable crack growth never occurred in these
specimens. Instead, the relatively large amounts of crack extension occurred solely due
to extensive crack blunting. This behavior is an indication of inherent limitations of the
specimen test conditions or that through-thickness cladding failure at 300°C may not
occur as a result of crack growth. It may, in some cases, occur as a result of an alternate
failure mechanism (still sensitive to blunted crack/notch depth), possibly imperfection-
induced shear instability (which as mentioned above cannot be observed for our specimen
geometry).
When this type of J-R behavior was observed, it was impossible to define J-
integral at the onset of stable crack growth, hence only the J-integral at maximum load
(JPmax) was calculated, as summarized in Table 3-2. The resulting values of KJPmax were
comprised between 43 MPa√m and 57 MPa√m. In addition, since stable crack growth
did not occur in specimens exhibiting this type of behavior, it was not possible to
compute the tearing modulus for stable crack growth.

171
The second type of J-R behavior corresponds to cases where the J-R curve
eventually crossed the blunting line, thus indicating stable crack growth, as shown in
Figure 3-39. In this case, the J-integral at the onset of stable crack growth (Ji) was
defined by the intersection of the J-R curve and the blunting line. The J-integral at
maximum load (JPmax) was also computed for these cases, and the tearing modulus for
stable crack growth was calculated based on the average slope of the J-R curve between
the onset of stable crack growth and the end of the test (as summarized in Table 3-2).
The fracture toughness at the onset of crack growth (KJi~55-61 MPa√m) was larger than
the fracture toughness at maximum load (KJPmax~44-45 MPa√m), thus indicating that
maximum load was reached prior to the onset of stable crack growth. The average value
Figure 3-38: J-R curves obtained at 300°C, for specimens where stable crack growth did
not occur (see Table 3-2 for corresponding values of toughness parameters). The solid
line is the construction line of slope equal to 2ζy, and the dashed line is the blunting line.

172
of the tearing modulus was T~210, which is about 2-3 times higher than at 25°C,
indicating much higher resistance to crack growth.
Figure 3-39: J-R curves obtained at 300°C, for specimens where stable crack growth
occurred (see Table 3-2 for corresponding values of toughness parameters). The solid line
is the construction line of slope equal to 2ζy, and the dashed line is the blunting line.

173
3.4.3 Fracture Toughness Behavior at 375°C
The J-R curves obtained from testing at 375°C all showed the same type of
behavior, in which the J-R curve never intersected the blunting line, as shown in
Figure 3-40. Thus, crack extension was limited to crack-tip blunting. As a result, only
the J-integral at maximum load (JPmax) was obtained from these tests. The values of JPmax
(and the resulting KJPmax) obtained from testing at 375°C are summarized in Table 3-3. It
is important to note that the values of JPmax (and KJPmax) do not correspond to the fracture
toughness at the onset of crack growth (stable or unstable). If crack growth were to occur
at 375°C, the fracture toughness at the onset of crack growth would exceed KJPmax, hence
the value of KJPmax may be used as a lower bound for fracture toughness at the onset of
crack growth.
Table 3-2: Summary of fracture toughness parameters obtained from testing at 300°C.
Specimen [H]
(wt.ppm) RHC (%)
Ji (kJ/m
2)
JPmax (kJ/m
2)
T KJi
(MPa√m) KJPmax
(MPa√m)
B57D 346 30 - 51.6
- - 57.1
B70B 207 24 - 18.7
- - 43.0
B70C 242 36 - 41.9
- - 57.9
B71B 155 12 - 31.1
- - 55.5
B74B 125 11 - 30.8
- - 55.2
B65B 169 12 42.2 27.4
271.1 55.6 44.8
B72B 241 24 37.8 19.8
154.2 61.2 44.3

174
The J-R curve behavior observed for all tests at 375°C indicates a very high
resistance to stable crack growth through the thickness of the specimen. As a result,
crack extension occurred by extensive crack-tip blunting. It is possible that the lack of
crack growth at 375°C is inherent in the bend test procedure of these thin-sheet
specimens. Indeed, the presence of a neutral axis ahead of the crack in bending geometry
results in a decreasing tensile stress field ahead of the crack, which could inhibit crack
growth. In fact, under conditions of equal-biaxial tension, for which the tensile stress
ahead of the crack remains positive, Glendening et al. [54] have observed the formation
of cracks at the bottom of blunted crack-tips at 375°C. However, the lack of crack
growth at 375°C under a bending configuration, which was also observed in some cases
at 300°C, may be an indication that through-thickness cladding failure at 375°C would
not result from crack growth, but from an alternate failure mechanism, such as
imperfection-induced shear instability as mentioned above.

175
Figure 3-40: J-R curves obtained at 375°C, for specimens where stable crack growth did
not occur (see Table 3-3 for corresponding values of toughness parameters). The dashed
line is the blunting line.

176
In summary, at 25°C, the average fracture toughness was KJc~41MPa√m for
specimens in which unstable crack growth occurred prior to any stable crack growth
(type I). A slightly lower value, KJu~38MPa√m, was obtained at lower hydrogen
contents and lower RHC when unstable crack growth followed some stable crack growth
(type II). This lower value of KJu could possibly be due to damage occurring ahead of the
crack tip during the stable crack growth phase preceding unstable crack growth, thus
weakening the material. The tests in which only stable crack growth occurred resulted in
a fracture toughness KJi~34MPa√m, which is surprisingly lower than the value of KJc
obtained at the onset of unstable crack growth at higher hydrogen contents and RHC. At
300°C, stable crack growth was observed in two tests. For these cases the calculated
KJi~58MPa√m was much larger than that observed at 25°C. The higher value of KJi at
300°C when compared to 25°C is to be expected, since crack extension at 300°C is
associated with a much larger amount of plastic deformation, which results in extensive
crack tip blunting prior to the onset of stable crack growth. For all the other tests at
300°C, as well as all tests performed at 375°C, crack extension was solely due to crack-
tip blunting, such that crack growth did not occur. As a consequence, the parameter
KJPmax may be considered as a lower bound for the fracture toughness in these cases, so
Table 3-3: Summary of toughness parameters obtained from testing at 375°C.
Specimen [H]
(wt.ppm) RHC (%)
JPmax (kJ/m
2)
KJPmax (MPa√m)
B58B 244 6 34.01
56.7
B70D 212 34 34.60
57.1
B71C 148 9 19.97
48.2
B73C 63 0 28.52
51.9
B74C 173 11 25.82
49.4

177
that KJcrack
growth
>KJPmax~54 MPa√m at 300°C and at 375°C. Overall, the material was
more resistant to crack growth with increasing temperature, and the fracture toughness
for the onset of stable crack growth increased by almost a factor of two between 25°C
and 300°C. The increase in toughness with increasing temperature appears to be a result
of the increased ability of the hydrides to deform plastically and resist cracking at 300°C
and above, thus preventing damage from occurring ahead of the crack tip and increasing
the resistance to crack-growth initiation.
3.4.4 The Influence of Hydrogen on Fracture Toughness
The ingress of hydrogen into Zircaloy-4 has a significant influence on the fracture
process and the resulting fracture toughness (see Chapter 1 and Section 3.). As a result,
an important aspect of this study was the investigation of the effects of hydrogen on the
fracture toughness of thin-sheet Zircaloy-4 under conditions of through-thickness crack
growth, and the corresponding fracture process. In this section, for each test temperature,
the toughness parameters described above are correlated with the characteristics of the
hydride microstructure (hydrogen content [H] in wt.ppm and radial hydride content RHC
in %) in the vicinity of the crack tip. The hydride microstructure characterization was
performed using the image analysis techniques described in Section 2.3. The trends
found by correlating the fracture toughness to the hydride microstructure are also
discussed in view of the fracture processes described in Section 3..
(a) The Influence of Hydrogen at 25°C
At 25°C, the influence of hydrogen on fracture toughness was analyzed by
studying the variations of the fracture toughness parameters described in Section 3.4.1 as
a function of the hydrogen content and the radial hydride content, as defined in Section
2.3. Figure 3-41(a) shows the influence of the hydrogen content [H] on the fracture
toughness at the onset of crack growth KJi (when stable crack growth occurred) and KJc
(when unstable crack growth occurred prior to any stable crack growth). The influence

178
of the hydrogen content on fracture toughness at the onset of crack growth at 25°C was
such that:
Overall, for a given parameter, the fracture toughness of the Zircaloy-4 thin-sheet
for through-thickness crack growth decreased with hydrogen content.
Type I crack-growth behavior (unstable crack growth prior to any stable crack
growth, as described in Section 3.3.1), leading to the values of KJc, occurred at
the highest hydrogen contents tested in this study. Surprisingly, despite being
associated with a more abrupt type of fracture behavior, KJc was also roughly 10-
15 MPa√m larger than the fracture toughness parameters obtained from tests
displaying stable crack growth at similar hydrogen contents. For type I crack
growth, KJc decreased from ~48 MPa√m for [H]~230wt.ppm to ~35 MPa√m for
[H]~300wt.ppm. The corresponding values of KJPmax were typically ~5 MPa√m
lower than the values of KJc but followed the same trend.
For hydrogen contents under ~230wt.ppm, stable crack growth occurred (type II
and type III crack growth behavior, as described in Section 3.3.1). For type II
and type III behavior, the fracture toughness KJi at the onset of stable crack
growth decreased from ~40 MPa√m for [H] ~50 wt.ppm to ~25 MPa√m for [H]
~200 wt.ppm. Similarly, KJPmax decreased from ~35-40 MPa√m to ~20-25
MPa√m over the same range of hydrogen contents.
The observed decrease of fracture toughness with increasing hydrogen content is
in good agreement with a large number of previously published studies, performed on
Zircaloy-2 [82-84, 99], Zr-2.5Nb [83], or Zircaloy-4 [105, 107, 109]. In addition, the
fracture toughness values found here for low hydrogen contents (~35-40 MPa√m for
[H]~50 wt.ppm) are in good agreement with those found by Walker and Kass for
through-thickness crack growth in thick Zircaloy-4 plate [85], but are lower than those
found Grigoriev [104] and Bertsch [111] for axial crack growth in thin-wall Zircaloy-4
cladding (~90-100 MPa√m). This factor of ~2-3 between the fracture toughness for axial
and through-thickness crack growth could be explained by the difference in crack-tip
constraint between the mode I+III crack growth observed in axial crack growth, and the

179
mode I or mixed mode I+II crack growth observed in through-thickness crack growth.
Indeed, axial crack growth occurs under conditions of plane-stress along the crack front,
such that the material is allowed to contract in the two directions normal to the direction
of principal strain. In contrast, through-thickness crack growth occurs under conditions
of plane-strain along the crack tip, such that contraction in the axial/rolling direction is
impossible, thus resulting in a higher degree of constraint at the crack-tip and lower
fracture toughness.
The influence of the radial hydride content (RHC) on the fracture toughness
parameters obtained from 25°C testing (shown in Figure 3-41(b)) was as follows:
As for the case of hydrogen content, the fracture toughness decreased with
increasing RHC.
Type I crack growth (corresponding to the absence of stable crack growth) was
observed for larger radial hydride contents, with KJc decreasing from ~48 MPa√m
for RHC~25% to ~35 MPa√m for RHC~45%.
Type II and III crack growth (stable crack growth followed by unstable crack
growth in some cases) occurred at lower radial hydride contents, with KJi
decreasing from ~35 MPa√m for RHC~0% to ~25 MPa√m for RHC~30%.
The trends observed for the influence of RHC on fracture toughness at room
temperature are similar to those reported for axial crack growth by Honda for Zr-2.5Nb
(Kc from 40 to 20 MPa√m for RHC from 10 to 20%, Figure 1-18) [87], and by Chow
[92] and Davies [93] for Zircaloy-2 (KPmax from 40 to 25 for increasing hydride
continuity coefficient, Figure 1-19). Bertolino also observed a decrease in toughness in
Zircaloy-4 thick-plate if the hydride particles were parallel to the crack plane (radial
orientation) as opposed to perpendicular to the crack plane (circumferential orientation),
but found overall higher fracture toughness values, with KJc decreasing from 85 MPa√m
for [H]=200wt.ppm to 50 MPa√m for [H]=400wt.ppm at 20°C.
In terms of the fracture process, the decrease in toughness with increasing radial
hydride content is in agreement with the observations made in our previous study of
fracture toughness in thin-sheet Zircaloy-4 for through-thickness crack growth [143]. In

180
that study, we found that the fracture surface associated with crack growth into a field of
mixed hydrides (corresponding to higher radial hydride contents) was characterized by
shallow dimples and tear ridges, and that the significant density of out-of-plane hydrides
created cleavage or void facets coplanar with the growing crack. These observations are
consistent with lower fracture toughness values when the RHC is higher. In contrast,
when the crack propagates into the region of in-plane hydrides (with low values of RHC),
large primary voids elongated in an orientation normal to the crack plane and growth
direction are readily evident on the fracture surface formed at room temperature (see
Figure 3-24). These large voids result from the cracking of large in-plane hydride
particles, and cause crack deflection and crack-tip blunting to occur, thus increasing the
crack growth resistance relative to that observed for microstructures with a higher RHC.

181
The influences of hydrogen content and radial hydride content on the tearing
modulus were also investigated, as shown in Figure 3-42. The tearing modulus decreased
with increasing hydrogen content and RHC, but not in a linear fashion. In fact, for
(a)
(b)
Figure 3-41: The influence of (a) hydrogen content and (b) radial hydride content on
fracture toughness at the onset of crack growth (stable or unstable) at 25°C.
Unstable crack growth
Stable crack growth
Unstable crack growth
Stable crack growth

182
[H]≤200wt.ppm and for RHC≤25%, all of the tearing modulus data were in the range
~60-100. The value of the tearing modulus rapidly dropped below 20 for a single test of
a specimen with a high hydrogen content as well as a high fraction of radial hydrides (this
specimen also had a low fracture toughness KJi~25 MPa√m). The value of T found for
low hydrogen contents is in agreement with that found by Dubey [99] for [H]~10wt.ppm
(T~60), and by Bertolino [107] for un-hydrided material (T~90). Both of those studies
also found a sharp decrease of the tearing modulus (resulting in T~10) at hydrogen
contents above 200wt.ppm, as in the single test here.

183
(b) The Influence of Hydrogen at 300°C
As for 25°C fracture toughness results, the 300°C fracture toughness parameters
described in Section 3.4.2 were analyzed as a function of hydrogen content and radial
hydride content (RHC), as shown in Figure 3-43. At 300°C, the fracture toughness
parameter KJPmax was found to be independent on hydrogen content and on radial hydride
(a)
(b)
Figure 3-42: The influence of (a) hydrogen content and (b) radial hydride content on the
tearing modulus at 25°C.

184
content over the entire range of hydride microstructures tested, such that KJPmax ~40-60
MPa√m. For the two tests where stable crack growth occurred, the fracture toughness at
the onset of stable crack growth was such that KJi~55-61 MPa√m and was larger than
KJPmax. In cases where stable crack growth initiation was not observed, the value of
KJPmax can be considered a lower bound for the fracture toughness at the onset of crack
growth, such that in the event of crack growth, KJc or KJi would be larger than KJPmax.
The values of KJi found in the present study for through-thickness crack growth in
thin-sheet are surprisingly in good agreement with those found by Honda for through-
thickness crack growth in Zr-2.5Nb thick-tube specimens (Kc~60 MPa√m at 300°C) [87],
but are lower than those found by Davies et al. for axial crack growth in Zircaloy-2 thick-
tube (KPmax~ 150 MPa√m at 300°C). For axial crack growth in Zircaloy-4 thin-wall
cladding tube at 300°C, Grigoriev [104] and Hsu [75] found that KJPmax~89 MPa√m,
while Ste-Catherine found that the toughness exceeded 150 MPa√m [112]. These
fracture toughness values reported at 300°C for axial crack growth are all significantly
higher than those found in this study (as well as Honda‟s) for through-thickness crack
growth. These large differences could be due to mode I+III axial crack growth occurring
under conditions of plane-stress along the crack front, while mode I or mixed mode I+II
through-thickness crack growth occurs under conditions of plane-strain along the crack
front, thus resulting in a higher degree of constraint at the crack-tip and lower fracture
toughness.
Importantly, much like in this study, all of the aforementioned studies found that
hydrogen content and radial hydride content had little or no influence on fracture
toughness at 300°C, even for hydrogen contents as high as 900wt.ppm. The fracture
surfaces observed by SEM on specimens tested at 300°C, described in detail in Section
3.3.2, showed no evidence of the hydride particles participating in the fracture process.
Thus, it is not expected that the fracture toughness of the material at this temperature
would be dependent on the hydride microstructure. This statement is in agreement with
studies by Simpson [92] and by Davies [93], which showed that even in the presence of
radial hydrides, the influence of hydrogen on fracture toughness essentially disappeared
above 300°C.

185
The other fracture toughness parameter that was determined for tests where stable
crack growth initiation occurred at 300°C is the tearing modulus. Based on two tests
(a)
(b)
Figure 3-43: The influence of (a) hydrogen content and (b) radial hydride content on
fracture toughness at 300°C. Data points with a vertical arrow pointing upwards (KJPmax)
indicate lower bounds for toughness, and correspond to specimens displaying only crack-
tip blunting.
Stable crack growth
Stable crack growth

186
displaying some stable crack growth, and with similar microstructures, the average value
of the tearing modulus was T~210 at 300°C. In comparison, for axial crack growth at
300°C, Dubey found that T~240 for unhydrided Zircaloy-2 thick pressure tube [99],
which is in good agreement with our findings. For axial crack growth in unhydrided
Zircaloy-4 thin-wall cladding tube, Grigoriev found that T~70, which is much lower than
that found in this study for through-thickness crack growth. For tests that did not display
stable crack growth behavior, the slope of the J-R curves was essentially equal to the
slope of the construction line ydadJ 2 defined in Section 3.1.1, thus indicating
that crack extension occurred solely as a result of crack-tip blunting.
(c) The Influence of Hydrogen at 375°C
At 375°C, the onset of stable crack growth was never observed, and crack
extension occurred due to extensive crack-tip blunting, hence the parameter KJPmax
(derived from J-integral at the point of maximum load) indicates a lower bound to the
true fracture toughness value for crack growth. The influence of hydrogen content and
radial hydride content on KJPmax is shown in Figure 3-44. The KJPmax value at 375°C
appeared to be independent from the hydrogen content and the radial hydride content,
much like at 300°C, such that KJPmax~48-57 MPa√m over the range of hydride
microstructures studied.
Although there is no published data for testing at 375°C for comparison, it seems
reasonable to believe that if the hydride microstructure does not influence the fracture
toughness at 300°C; the same should be true at 375°C. Indeed, SEM observations of the
fracture surfaces obtained from 375°C test specimens (described in Section 3.3.3) were
in agreement with this hypothesis, as they showed no signs of the hydride particles
participating in the fracture process. Also, more hydrogen will have dissolved into the
matrix at higher temperatures, thus resulting in fewer and smaller hydrides, and a smaller
chance of the hydrides participating in the fracture process. In fact, only large equiaxed
dimples, characteristic of a ductile fracture process, were observed on the tensile fracture
surfaces.

187
(d) Summary
As shown on the basis of KJPmax in Figure 3-45, the most important effect
observed as a result of testing at 300°C and 375°C in comparison with testing at 25°C
was that the crack extension behavior became essentially independent of the hydride
microstructure, over the entire range of microstructures studied. Others have observed
(a)
(b)
Figure 3-44: The influence of (a) hydrogen content and (b) radial hydride content on the
toughness at 375°C.

188
similar effects for axial crack growth in thick Zircaloy-2 and Zr-2.5Nb pressure-tube
specimens that were hydrided at levels up to 300wt.ppm and contained in-plane as well
as out-of-plane (radial) hydrides [87, 92, 93]. The same result has been observed for
axial crack growth in thin-wall Zircaloy-2 cladding with hydrogen contents up to
900wt.ppm [101], as well for axial crack growth in thin-wall Zircaloy-4 cladding with
hydrogen contents up to 700wt.ppm [75]. Our previous studies of fracture toughness for
through-thickness crack growth in thin-sheet Zircaloy-4 have led to similar observations
[141, 143].
The independence of crack extension behavior on the hydride microstructure at
300°C and 375°C is related to the differences in the crack extension process observed at
these temperatures (see Sections 3.3.2 and 3.3.3) relative to that observed at 25°C
(Section 3.3.1). At 25°C, crack growth occurred due to fracture at or near the crack tip,
and the hydride particles played a dominant role in the fracture process. Indeed, the
hydrides fractured ahead of the crack tip to form large primary voids, and crack growth
then occurred by linking these hydride-induced primary voids. In contrast, at 300°C and
375°C, the SEM observation of the fracture surfaces resulting from crack extension
during testing showed no evidence of the hydrides participating in the crack extension
process. Instead, the tensile fracture surfaces formed during testing were characterized
by equiaxed dimples which increased in diameter with temperature (thus indicating a
much more ductile fracture process than that observed at 25°C), as well as by the absence
of hydride-induced primary voids. Similar observations were made on the fracture
surfaces in our previous study of through-thickness crack growth for temperatures up to
300°C [113].

189
Another effect of increasing the test temperature was the general increase in
resistance to crack growth and crack growth initiation (when crack growth did not occur).
An important consequence of this overall increase in resistance to crack growth was the
complete absence of unstable crack growth at 300°C and 375°C. Similar observations of
higher fracture toughness at higher test temperatures were made in our previous study on
(a)
(b)
Figure 3-45: The influence of temperature on the fracture toughness KJPmax, as a function
of (a) hydrogen content, and (b) radial hydride content.

190
fracture toughness for through-thickness crack growth in thin-sheet Zircaloy-4 [114]. At
25°C, stable crack growth occurred in specimens with hydrogen contents below
250wt.ppm, such that the fracture toughness at the onset of stable crack growth KJi
decreased from 39 to 24 MPa√m with increasing [H] and RHC. Unstable crack growth
occurred for [H]>250wt.ppm, such that KJc decreased from 47 to 34 MPa√m with
increasing [H] and RHC. In contrast, in more than half of the tests performed at 300°C,
the material was very resistant to the initiation of crack growth, such that it never
occurred. In the cases where crack growth did not occur, the fracture toughness at the
onset of stable crack growth must exceed the KJPmax value of 57 MPa√m. In fact, stable
crack growth did occur in some specimens tested at 300°C, at KJi values of 55-61
MPa√m, suggesting a transition from crack-tip blunting to crack growth at KJi > 58
MPa√m. At 375°C, a high resistance to the initiation of stable crack growth exists such
that in the event of crack growth, KJb or KJc would be higher than the KJPmax values
determined at maximum load. As a result, crack growth did not occur at 375°C in this
study; instead, crack extension was due solely to blunting. It is a possibility that at
375°C, failure would not occur due to crack growth, but rather as a result of a different
failure mechanism such as imperfection-induced plastic instability.
The resistance to crack growth as measured by the tearing modulus was also
influenced by the test temperature. At 25°C, the tearing modulus for stable crack growth
decreased with increasing hydrogen content and radial hydride content, and had a
maximum value of T~90. At 300°C, two tests resulted in stable crack growth, leading to
an average value of the tearing modulus of T~210, which was roughly two times larger
than the largest values obtained at 25°C. This value of the tearing modulus is in good
agreement with observations made by Dubey, who found that at 275°C, T was equal to
225 for axial crack growth in thick Zircaloy-2 pressure tube, independently of hydrogen
content [99]. In most cases at 300°C, as well as all cases at 375°C, stable crack growth
never occurred, indicating a much higher resistance to the initiation of crack growth than
at 25°C. In these cases, the resulting J-R curves were essentially parallel to the blunting
line (with a slope equal to two times the yield strength), and never intersected the
blunting line, indicating that crack extension was solely due to crack-tip blunting.

191
3.5 A Basis for a Criterion for RIA Cladding Failure
In this section, an approach for the development of a strain criterion to predict
thin-wall cladding failure by through-thickness crack growth under RIA-type loading
conditions is described. The proposed method is based on the results of this study with
regards to fracture behavior and fracture toughness behavior. The basic assumption for
the development of this strain criterion is that the strain to failure under conditions of
through-thickness crack growth during a RIA is given by:
where ε(crack-initiation) is the strain necessary to initiate a crack in a brittle or near-brittle
surface layer (such as a hydride blister or hydride rim), and ε(crack-propagation) is the strain
necessary to propagate this crack through the thickness of the cladding. The strain to
initiate a crack in the outer diameter of the cladding is not the object of the present study.
However, it is believed that the strain necessary to propagate a given crack through the
thickness of the cladding, thus resulting in cladding failure, may in some cases be
predicted using the fracture toughness values obtained in this study. For safety analyses
it is possible to imagine that a crack of a certain size is assumed to exist, and in that case,
this study gives an idea of conditions for its propagation
In order to know which type of analysis must be used to predict failure strains, it
is important to know by which mechanisms the material will fail. That is, if the fracture
process involves crack growth, the failure strain can be predicted using the fracture
toughness of the material. However, if another fracture process leads to failure at strains
less than those necessary for crack growth, a different type of approach must be used to
determine the failure strain. As a result, the fracture toughness parameters obtained in
this study can be used to predict cladding failure only in cases where crack growth is the
controlling fracture process.
ε(failure) = ε(crack-initiation) + ε(crack-propagation) (3.18)

192
Based on the observations made in this study, Figure 3-46 shows a schematic
failure map as a function of hydrogen content and temperature. It should be noted that
the radial hydride content could be added as a third axis to generate 3D failure maps, but
this was not attempted here, as more data would be required to define the transitions
between the different failure modes. The transition between stable and unstable crack
growth at 25°C was found to occur for a hydrogen content around 250wt.ppm (see
Figure 3-41). At 300°C, in cases where crack growth occurred, it always did do in a
stable manner, even for hydrogen contents as high as 350wt.ppm (see Figure 3-43). The
transition from stable crack growth to another type of failure mechanism which did not
involve crack growth but was characterized by a large amount of ductility occurred
around 300°C. A possibility for this alternative failure mechanism is imperfection-
induced shear instability, as observed by Glendening [54] and Pierron [51].
Figure 3-46: A partial failure mechanism map for the failure of hydride thin-sheet
Zircaloy-4 under conditions of through-thickness crack growth. The darker lines
represent the transitions observed in this study, while the lighter lines are potential trends.

193
To predict failure strains for cases of through-thickness crack growth in thin-sheet
and thin-wall cladding Zircaloy-4, Pierron et al. proposed a theoretical approach based on
an assumed value of fracture toughness [51]. It is believed that Pierron‟s fracture
mechanics analysis can be used to predict failure strains in the „stable crack growth‟ and
„unstable crack growth‟ regions of the above failure map, so long as the appropriate
fracture toughness parameters are used. It should be noted here that in addition to the
temperature and hydrogen content, the radial hydride content (RHC) should also be used
as an input to determine the fracture toughness, especially at room temperature, where the
influence of RHC is significant. For the case of stable crack growth, a lower bound of
the failure strain may be calculated using the value of fracture toughness corresponding
to the onset of stable crack growth: KJi, and an upper bound may be obtained for the same
conditions using the value of fracture toughness corresponding to the onset of unstable
crack growth following stable crack growth: KJu. In the case of unstable crack growth,
the fracture parameter KJc, corresponding to the onset of unstable crack growth prior to
any stable crack growth, may be used to predict the through-thickness failure strain.
In this study, in many cases of the Zircaloy-4 sheet failure at 300°C, and in all
cases of failure at 375°C, crack growth did not constitute the failure mechanism. Instead,
a very high resistance to crack growth initiation caused the crack tip to experience a large
amount of blunting, resulting in the equivalent of a blunted imperfection (or notch) in the
surface of the thin-wall cladding material. Others have observed that in this type of
configuration, shear instability will eventually develop, leading to through-thickness
cladding failure by imperfection-induced shear instability [51, 54]. Although this failure
mechanism was not observed in this study due to the bending mode of loading, it is
believed that, given sufficient deformation, shear instability would eventually lead to
through-thickness failure of thin-wall cladding material above 300°C. In such a case, it is
not possible to predict the failure strain using fracture mechanics. Instead, another type
of analysis, such as the M-K model employed by Link [44], can be used to predict the
failure strain as a result of strain localization due to a groove or imperfection on the
surface of the material. It should be noted that Link‟s proposed failure model requires
precise knowledge of the strain-hardening exponent, as well as the strain-rate hardening

194
exponent, for the cladding material being studied. The strain-rate hardening exponent
was not determined as a part of the present study; more work would be required to obtain
this parameter.

Chapter 4
Conclusions and Recommendations for Future Work
4.1 Conclusions
The fracture toughness of unirradiated thin-sheet cold-worked-stress-relieved
(CWSR) Zircaloy-4 was investigated for conditions of through-thickness crack growth,
as a function of the hydride microstructure and at temperature of 25°C, 300°C and 375°C.
The main results of this experimental study are as follows.
1. A new experimental procedure was developed to perform fracture toughness tests
under conditions of through-thickness crack growth in a thin-sheet (0.65mm
thick) of CWSR Zircaloy-4. In this procedure, gaseous hydrogen charging was
initially used to create a linear hydride blister extending across the width of a test
specimen. The brittle character of the hydride blister was relied upon to inject a
sharp crack on the test specimen surface. Cyclic loading was then used to grow a
fatigue pre-crack for fracture toughness testing. Finally, four-point bend fracture
toughness testing at 25°C, 300°C, and 375°C was performed, employing the
electrical potential drop method to monitor the crack length in real-time.
2. New image analysis techniques were used to characterize the hydride
microstructure and to estimate the hydrogen content locally near the crack tips.
The fraction of hydrides that were oriented radially („radial hydride content‟
RHC) was calculated with the software package Hydromorph and the local
hydrogen contents were predicted based on local area fraction measurements from
the software Image-J. Both the hydride microstructure and hydrogen content
showed variations within the thickness of the thin-sheet specimens, such that the
196
hydrogen concentration and the radial hydride content increased near the hydride
blister.
3. Elastic-plastic fracture mechanics were used to analyze load-displacement and
crack-growth data so as to obtain J-R curves. Finite element modeling with
Cast3M was used to determine the ηpl parameter in the J-integral calculations for
the four-point bend thin-sheet through-thickness crack configuration tested in our
study. The software package Franc3D was used to model non-uniform crack
fronts and to predict the variation in fracture toughness along irregular crack
fronts.
4. At 25°C, the fracture toughness was influenced by the hydride microstructure
such that toughness decreased with increasing hydrogen content ([H]) and radial
hydride content (RHC). Stable crack growth occurred in specimens with
hydrogen contents below 250wt.ppm, such that the fracture toughness at the onset
of stable crack growth KJi decreased from 39 to 24 MPa√m with increasing [H]
and RHC. Unstable crack growth occurred for [H]>250wt.ppm, such that KJc
decreased from 47 to 34 MPa√m with increasing [H] and RHC. The tearing
modulus at 25°C was equal to T~80, and decreased sharply to T~10-15 for
[H]≥200wt.ppm and RHC≥25%. The crack growth process was controlled by the
formation of hydride-induced primary voids, and crack growth occurred by
linking the crack tip with the next hydride-induced void ahead of it.
5. At 300°C, stable crack growth initiation was difficult, such that it occurred in only
less than half of the specimens tested. For the cases where stable crack growth
occurred, the fracture toughness appeared independent from the hydrogen content
and the radial hydride content, such that KJi ~ 58MPa√m, and the tearing modulus
was T~210. For most of the tests which did not show stable crack growth
behavior, crack extension occurred due to extensive crack-tip blunting.

197
6. At 375°C, the material was very resistant to the initiation of stable crack growth,
such that crack extension occurred solely due to large amounts of crack-tip
blunting instead of crack growth. The parameter KJPmax indicated a toughness in
excess of 53±5 MPa√m, independent of the hydride microstructure.
7. Overall, the hydride microstructure strongly influenced the fracture process and
the resulting fracture toughness only at 25°C. In contrast, at 300°C and 375°C,
the limited instances of crack growth as well as an absence of any fractographic
evidence of hydride particles initiating damage indicate that hydride
microstructure did not affect the fracture process or the crack extension process.
It is believed that a different failure mechanism takes place at these high
temperatures (not observable under the bending test conditions), perhaps
imperfection-induced shear instability.
4.2 Recommendations for Future Work
In view of the results obtained over the course of this study, the following
paragraphs constitute a set of recommendations which could provide a better
understanding of some phenomena observed when studying the influence of hydrogen
and temperature of the through-thickness fracture toughness of hydrided Zircaloy-4 thin-
wall cladding materials.
One of the biggest experimental difficulties encountered over the course of this
study was associated with monitoring the crack length along its entire front. First, for
reasons that are unclear, the electrical potential drop (EPD) method could not be used
successfully to monitor the crack length during fatigue pre-cracking. As a result, the
precise initial crack length and the crack front profile were unknown prior to post-test
observations, and the crack length was not always uniform across the specimen width.
Second, during a fracture toughness test, the EPD method only provided an average crack
length. Thus, in the cases where the crack length was not perfectly uniform across the

198
specimen width, it was impossible to know precisely by how much the crack advanced in
different sections of the crack front. It would be useful to develop an experimental
method that could provide a measurement of the crack length along its entire front, and
which could be used not only during specimen pre-cracking, but also during the actual
fracture toughness testing phase. If such information were available during the fatigue
pre-cracking phase, the position of the loading pins could be adjusted so as to induce
crack growth in specific regions along the crack front, with aims to produce a uniform
initial crack length. Additionally, if the hydride microstructure varies along the crack
front, the precise knowledge of when different sections of the crack advance during a
fracture toughness test would provide greater insight into the relationship between
hydride microstructure, the crack growth process, and the fracture toughness. It is
believed that using an array of potential leads instead of only measuring the EPD between
two points of the specimen could potentially provide some insight into the variations in
crack length along its front. Another possibility, which would be easier to implement,
would be to obtain the crack front profile at regular intervals during fatigue pre-cracking,
using a scanning-acoustic microscope.
In order to obtain a more complete picture of the influence of the hydride
microstructure on fracture toughness, additional testing between 25°C and 375°C is
required. In particular, it would be useful to test specimens with higher hydrogen
contents, ranging between 400 and 1000 wt.ppm, as well as to adapt existing hydride re-
orientation procedures to test microstructures with higher radial hydride contents,
between 40% and 100%. It is believed that a relatively small number of tests with
carefully chosen hydride microstructures and at the appropriate test temperatures would
be sufficient to complete the failure map presented in Section 3.. In particular, there is a
large effect of the temperature between 25°C and 300°C, so this range of temperatures
should be investigated to determine when transitions in behavior occur. Another benefit
of such work would be the confirmation of the results obtained in this study, as well as
the extension of the fracture toughness database which we have begun to generate.
In terms of the hydride microstructure characterization, the current procedures
typically rely on the analysis of images obtained from one or two sections of a given

199
specimen. With a few exceptions, the analyses obtained from different locations of a
given specimen provided very similar results. However, in order to verify the uniformity
of the hydride microstructure across the entire width of fracture toughness test specimens,
a non-destructive imaging technique, possibly scanning-acoustic microscopy, could be
implemented. The information which could potentially be gathered using such a
procedure would theoretically allow for a 3D mapping of all the hydride particles in a
given specimen, thus providing extremely accurate microstructural information that could
be related to the fracture process and fracture toughness.
Finally, in order to obtain more accurate data for application in the case of high-
burnup cladding, it would be useful to adapt the experimental techniques developed in
this study for testing of irradiated materials in hot-cell environments. It is not expected
that the complex surface preparation required for hydrogen charging could be reproduced
on irradiated material, but that would not be necessary, since high-burnup cladding
typically already contains hydrogen, and in some cases, hydride blisters. However, it is
believed that fatigue pre-cracking, as well as on-line crack length monitoring (likely via
EPD) could be adapted for hot cell testing environments. Extensive work would also be
required to develop a test procedure for cladding tube, as opposed to thin-sheet. It is
expected that finite element modeling with the use of fracture mechanics would be
necessary to obtain through-thickness crack growth fracture toughness data, analog to
that obtained in the present study.
It is believed that these recommendations for future work would contribute to
confirming the results of this study, and extend the present work to provide data which
could more readily be used by regulators to define a failure criterion for high-burnup
cladding during a RIA.
Bibliography
[1] C. Lemaignan and A. T. Motta, "Zirconium Alloys in Nuclear Applications," in
Nuclear Materials. Materials Science and Technology, A Comprehensive
Treatment vol. 10 B, B. R. T. Frost, Ed., New York, VCH, 1994, pp. 1-51.
[2] J. V. Ramsdell Jr., C. E. Beyer, D. D. Lanning, U. P. Jenquin, R. A. Schwarz, D.
L. Strenge, P. M. Daling, R. T. Dahowski, and T. J. Kenyon, "Environmental
Effects of Extending Fuel Burnup Above 60 Gwd/MTU," U.S. N.R.C., Rockville,
MD, NUREG/CR 6703, 2001.
[3] ASTM, "Standard Specification for Wrought Zirconium Alloy Seamless Tubes
for Nuclear Reactor Fuel Cladding," ASTM, West Conshohocken, PA, Standard
Specification B811-02, 2002.
[4] ASTM, "Standard Specification for Hot-Rolled and Cold-Finished Zirconium and
Zirconium Alloy Bars, Rod, and Wire for Nuclear Application," ASTM, West
Conshohocken, PA, Standard Specification B351/B351M-08, 2008.
[5] R. O. Meyer, "NRC Activities Related to High Burnup New Cladding Types, and
Mixed-Oxide Fuel," in proceedings of International Topical Meeting on Light-
Water-Reactor-Fuel-Performance, Park City, UT, April 10-13, 2000.
[6] D. L. Douglass, The Metallurgy of Zirconium. Vienna: International Atomic
Energy Agency Supplement, 1971.
[7] P. Partridge, "The crystallography and deformation modes of hexagonal close–
packed metals," Metallurgical Reviews, vol. 12, no. 118, pp. 169-194, 1967
[8] H.-S. Hong, S.-J. Kim, and K.-S. Lee, "Effects of alloying elements on the tensile
properties and oxidation behavior of modified Zircaloy-4 in 360 deg C water,"
Journal of Nuclear Materials, vol. 238, no. 2-3, pp. 211-217, 1996
[9] D. Charquet, R. Hahn, E. Ortlieb, J.-P. Gros, and J.-F. Wadier, "Solubility Limits
and Formation of Intermetallic Precilitates in ZrSnFeCr Alloys," in Zirconium in
the Nuclear Industry: 8th International Symposium. ASTM STP vol. 1023, L. F.
P. VanSwam and C. M. Eucken, Eds., Philadelphia, ASTM, 1989, pp. 405-422.
[10] K. T. Erwin, O. Delaire, A. T. Motta, R. C. Birtcher, Y. Chu, and D. Mancini,
"Observation of second-phase particles in bulk zirconium alloys using
synchrotron radiation," Journal of Nuclear Materials, vol. 294, no. 3, pp. 299-
304, 2001
201
[11] R. T. Webster, "Zirconium and Hafnium," in Properties and Selection:
Nonferrous Alloys and Special-Purpose Materials. ASM Handbooks vol. 2, ASM
International, 1990.
[12] E. Tenckhoff, "Review of Deformation Mechanisms, Texture, and Mechanical
Anisotropy in Zirconium and Zirconium Base Alloys," Journal of ASTM
International, vol. 2, no. 4, pp. 25-50, April 2005, 2005
[13] M. Grange, J. Besson, and E. Andrieu, "Anisotropic behavior and rupture of
hydrided Zircaloy-4 sheets," Metallurgical and Materials Transactions A:
Physical Metallurgy and Materials Science, vol. 31A, no. 3, pp. 679-690A, 2000
[14] M. Griffiths, "A review of microstructural evolution in zirconium alloys during
irradiation," Journal of Nuclear Materials, vol. 159, pp. 190-218, 1988
[15] F. Onimus, J. Bechade, C. Prioul, P. Pilvin, I. Monnet, S. Doriot, B. Verhaeghe,
D. Gilbon, L. Robert, L. Legras, and J. P. Mardon, "Plastic Deformation of
Irradiated Zirconium Alloys: TEM Investigations and Micro-Mechanical
Modeling," Journal of ASTM International, vol. 2, no. 8, p. 24, September, 2005
[16] A. T. Motta, F. Lefebvre, and C. Lemaignan, "Amorphization of Precipitates in
Zircaloy under Neutron, Ion and Electron Irradiation," in Zirconium in the
Nuclear Industry: 9th International Symposium. ASTM STP vol. 1132, C. M.
Euken and A. M. Garde, Eds., Philadelphia, ASTM, 1991, pp. 718-739.
[17] A. T. Motta and C. Lemaignan, "Mechanisms of Radiation-Induced
Amorphization," in proceedings of Ordering and Disordering in Alloys,
Grenoble, France, 10-12 July 1991, pp. 255-276, 1992.
[18] P. Vizcaino, A. D. Banchik, and J. P. Abriata, "Synchrotron X-ray diffraction
evidences of the amorphization/dissolution of the second phase particles (SPPs) in
neutron irradiated Zircaloy-4," Materials Letters, vol. 62, no. 3, pp. 491-493, 15
Feb., 2008
[19] P. Bossis, D. Pecheur, K. Hanifi, J. Thomazet, and M. Blat, "Comparison of the
High Burn-Up Corrosion on M5 and Low Tin Zircaloy-4," Journal of ASTM
International, vol. 3, no. 1, p. 32, 2006
[20] D. O. Northwood and U. Kosasih, "Hydrides and Delayed Hydrogen Cracking in
Zirconium and Its Alloys," International metals reviews, vol. 28, no. 2, pp. 92-
121, 1983
[21] A. McMinn, E. C. Darby, and J. S. Schofield, "The terminal solid solubility of
hydrogen in zirconium alloys," in Zirconium in the Nuclear Industry: 12th
International Symposium. ASTM STP vol. 1354, G. P. Sabol and J. Moan, Eds.,
Philadelphia, ASTM, 2000, pp. 173-195.

202
[22] V. Perovic, G. C. Weatherly, and C. J. Simpson, "Hydride Precipitation in
Alpha/Beta Zirconium Alloys," Acta metallurgica, vol. 31, no. 9, pp. 1381-1391,
1983
[23] R. S. Daum, "Hydride-Induced Embrittlement of Zircaloy-4 Cladding under Plane
Strain Tension," Ph.D. thesis in Materials Science and Engineering, Pennsylvania
State University, 2007.
[24] B. Nash, G. Lorimer, and N. Ridley, "The relationship between gamma and delta
hydrides in zirconium-hydrogen alloys of low hydrogen concentration," Journal
of Nuclear Materials, vol. 49, no. 3, pp. 262-280, 1974
[25] F. H. Huang, Fracture Properties of Irradiated Alloys. Richland, WA: Avante
Publishing, 1995.
[26] T. S. Byun and K. Farrell, "Irradiation hardening behavior of polycrystalline
metals after low temperature irradiation," Journal of Nuclear Materials, vol. 326,
no. 2-3, pp. 86–96, 2004
[27] J. J. Kearns and C. R. Woods, "Effect of texture, grain size, and cold work on the
precipitation of oriented hydrides in Zircaloy tubing and plate," Journal of
Nuclear Materials, vol. 20, no. 3, pp. 241-261, 1966
[28] H. M. Chung, R. S. Daum, J. M. Miller, and M. C. Billone, "Characteristics of
hydride precipitation and reorientation in spent-fuel cladding," in Zirconium in the
Nuclear Industry: 13th International Symposium. ASTM STP vol. 1423, G. D.
Moan and P. Rudling, Eds., West Conshohocken, PA, ASTM, 2002, pp. 561-582.
[29] J. J. Kearns, "Terminal solubility and partitioning of hydrogen in the alpha phase
of zirconium, Zircaloy-2 and Zircaloy-4," Journal of Nuclear Materials, vol. 22,
no. 3, pp. 292-303, 1967
[30] C. E. Ells, "Hydride Precipitates in Zirconium Alloys," Journal of Nuclear
Materials, vol. 28, no. 2, pp. 129-151, 1968
[31] S. I. Hong, K. W. Lee, and K. T. Kim, "Effect of the circumferential hydrides on
the deformation and fracture of Zircaloy cladding tubes," Journal of Nuclear
Materials, vol. 303, no. 2-3, pp. 169-176, 2002
[32] R. N. Singh, R. Kishore, S. S. Singh, T. K. Sinha, and B. P. Kashyap, "Stress-
reorientation of hydrides and hydride embrittlement of Zr-2.5 wt% Nb pressure
tube alloy," Journal of Nuclear Materials, vol. 325, no. 1, pp. 26-33, 2004
[33] H. C. Chu, S. K. Wu, and R. C. Kuo, "Hydride reorientation in Zircaloy-4
cladding," Journal of Nuclear Materials, vol. 373, no. 1-3, pp. 319-327, 2008

203
[34] R. O. Meyer, R. K. McCardell, H. M. Chung, D. J. Diamond, and H. H. Scott, "A
Regulatory Assessment of Test data for Reactivity Initiated Accidents," Nuclear
Safety, vol. 37, no. 4, pp. 872-387, 1996
[35] R. O. Meyer, "An Assessment of Fuel Damage in Postulated Reactivity-Initiated
Accidents," U.S. Nuclear Regulatory Commission, Washington, D.C., Report,
ML 0521704030, 2005.
[36] R. S. Daum, S. Majumdar, D. W. Bates, A. T. Motta, D. A. Koss, and M. C.
Billone, "On the embrittlement of Zircaloy-4 under RIA-relevant conditions," in
Zirconium in the Nuclear Industry: 13th International Symposium. ASTM STP
vol. 1423, G. D. Moan and P. Rudling, Eds., West Conshohocken, PA, ASTM,
2002, pp. 702-719.
[37] D. W. Bates, "Influence of Stress State and Hydrogen on Deformation and Failure
of Zircaloy-4," M.Sc. Thesis in Nuclear Engineering, The Pennsylvania State
University, 1998.
[38] T. Fuketa, F. Nagase, K. Ishijima, and T. Fujishiro, "NSSR/RIA Experiments with
High Burnup Fuels," Nuclear Safety, vol. 37, no. 4, pp. 328-342, 1996
[39] A. M. Garde, G. P. Smith, and R. C. Pirek, "Effects of Hydride Precipitate
Localization and Neutron Fluence on the Ductility of Irradiated Zircaloy-4," in
Zirconium in the Nuclear Industry: 11th International Symposium. ASTM STP
vol. 1295, E. R. Bradley and G. P. Sabol, Eds., West Conshohocken, PA, ASTM,
1996, pp. 407-430.
[40] P. E. MacDonald, S. L. Seiffert, Z. R. Martinson, R. K. McCardell, D. E. Owen,
and S. K. Fukuda, "Assessment of Light-Water-Reactor Fuel Damage During a
Reactivity-Initiated Accident," Nuclear Safety, vol. 21, no. 5, p. 582, 1980
[41] B. E. Boyack, A. T. Motta, K. L. Peddicord, C. A. Alexander, R. C. Deveney, B.
M. Dunn, T. Fuketa, K. E. Higar, L. E. Hochreiter, S. E. Jensen, F. J. .Moody, M.
E. Nissley, J. Papin, G. Potts, D. W. Pruitt, J. Rashid, D. H. Risher, R. J. Rohrer,
J. S. Tulenko, K. Valtonen, and W. Wiesenack, "Phenomena Identification and
Ranking Tables (PIRTs) for Reactivity Initiated Accidents in Pressurized Water
Reactors Containing High Burnup Fuel," Los Alamos National Laboratory, LA-
UR-99-6810, 2001.
[42] Y. Fan and D. A. Koss, "The Influence of Multiaxial States of Stress on the
Hydrogen Embrittlement of Zirconium Alloy Sheet," Metallurgical transactions.
A, Physical Metallurgy and Materials Science, vol. 16A, no. 4, pp. 675-681, 1985
[43] T. M. Link, D. A. Koss, and A. T. Motta, "Failure of Zircaloy Cladding under
transverse plane-strain deformation," Nuclear Engineering and Design, vol. 186,
no. 3, pp. 379-394, 1998

204
[44] T. M. Link, D. A. Koss, and A. T. Motta, "Strain-localization in sheet metal
containing a geometric defect," Metallurgical and Materials Transactions; A;
Physical Metallurgy and Materials Science, vol. 31A, no. 7, pp. 1883-1886A,
2000
[45] R. S. Daum, D. W. Bates, D. A. Koss, and A. T. Motta, "The influence of a
hydrided layer on the fracture of Zircaloy-4 cladding tubes," in proceedings of
International Conference on Hydrogen Effects on Materials Behavior and
Corrosion Deformation Interactions, Moran, WY, 22-26 Sept. 2002, pp. 249-258,
2003.
[46] J. Desquines, B. Cazalis, C. Bernaudat, C. Poussard, X. Averty, and P. Yvon,
"Mechanical Properties of Zircaloy-4 PWR Fuel Cladding with Burnup 54-64
MWd/kgU and Implications for RIA Behavior," Journal of ASTM International,
vol. 2, no. 6, 2005
[47] B. Cazalis, J. Desquines, C. Poussard, M. Petit, Y. Monerie, C. Bernaudat, P.
Yvon, and X. Averty, "The Prometra Program: Fuel Cladding Mechanical
Behavior Under High Strain Rate," Nuclear Technology, vol. 157, no. 3, pp. 215-
229, 2007
[48] L. O. Jernkvist, "Prediction of Failure of Highly Irradiated Zircaloy Clad Tubes
under Reactivity Initiated Accidents," in proceedings of SMIRT-17: 17th
International Conference on Structural Mechanics in Reactor Technology,
Prague, Czech Republic, pp. C03-4 (C037), 2003.
[49] Y. R. Rashid, R. Montgomery, W. Lyon, and R. Yang, "A cladding failure model
for fuel rods subjected to operational and accident transients," in proceedings of
Nuclear Fuel Behavior Modeling at High Burnup and its Experimental Support,
Windermere, UK, June 18-23, pp. 187-199, 2000.
[50] L. O. Jernkvist, "Computational Assessment of Burnup-Dependent Fuel Failure
Thresholds for Reactivity Initiated Accidents," Journal of Nuclear Science and
Technology, vol. 43, no. 5, pp. 546-561, 2006
[51] O. N. Pierron, D. A. Koss, A. T. Motta, and K. S. Chan, "The influence of hydride
blisters on the fracture of Zircaloy-4," Journal of Nuclear Materials, vol. 322, no.
1, pp. 21-35, 2003
[52] S. Yamanaka, M. Kuroda, D. Setoyama , M. Uno, K. Takeda, F. Nagase, and H.
Uetsuka, "Analysis of the fracture behavior of a hydrided cladding tube at
elevated temperatures by fracture mechanics," Journal of Alloys and Compounds,
vol. 330-332, pp. 400-403, 2002

205
[53] M. Kuroda, S. Yamanaka, F. Nagase, and H. Uetsuka, "Analysis of the fracture
behavior of hydrided fuel cladding by fracture mechanics," Nuclear Engineering
and Design, vol. 203, no. 2-3, pp. 185-194, 2001
[54] A. Glendening, D. A. Koss, O. N. Pierron, A. T. Motta, and R. S. Daum, "Failure
of Hydrided Zircaloy-4 Under Equal-Biaxial and Plane-Strain Tensile
Deformation," Journal of ASTM International, vol. 2, no. 6, 2005
[55] E. Federici, F. Lamare, V. Bessiron, and J. Papin, "Status of Development of the
SCANAIR Code for the Description of Fuel Behavior Under Reactivity Initiated
Accidents," in proceedings of International Topical Meeting on Light Water
Reactor Fuel Performance, Park City, UT, 10-13 April, 2000.
[56] E. Federici, F. Lamare, V. Bessiron, and J. Papin, "The SCANAIR Code Version
3.2: Main Features and Status of Qualifications," in proceedings of IAEA
Technical Committee on Fuel Behavior under Transient LOCA Conditions,
Halden, Norway, 10-14 September, 2001.
[57] C. Beyer, M. Cunningham, and D. Lanning, "Development and verification of
NRC's single rod fuel performance codes FRAPCON-3 and FRAPTRAN," in
proceedings of 25th Water Reactor Safety Information Meeting, Bethesda, MD,
October 20-22, 1997, pp. 167-178, 1998.
[58] EPRI, "Fuel Analysis and Licensing Code: FALCON MOD01," EPRI, Palo Alto,
CA, Technical Report 1011308, 2004.
[59] Y. R. Rashid, "Application of Critical Strain Energy Density to Predicting High-
Burnup Fuel Rod Failure," EPRI, Palo Alto, CA, Technical Report, 1011816,
2005.
[60] R. O. Montgomery, N. Waeckel, and R. Yang, "Topical Report on Reactivity
Initiated Accident: Bases for RIA Fuel and Core Coolability Criteria," EPRI, Palo
Alto, CA, Technical Report, 1002865, 2002.
[61] R. O. Montgomery and D. Sunderland, "Analysis of Reactivity Initiated Accident-
Simulation Tests Conducted at theCABRI and NSRR Facilities in France and
Japan," EPRI, Palo Alto, CA, Technical Report, 1002863, 2003.
[62] Y. Monerie, "Cladding Integrity Criteria: revisiting CSED based models," IRSN,
SEMAR Technical Report, March, 2003.
[63] A. T. Motta, "A review of the critical strain energy density (CSED) model to
analyzing reactivity initiated accidents (RIA) in high burnup fuel," EPRI proposal
review submitted to NRC, 2004.

206
[64] S. Leclercq, A. Parrot, and M. Leroy, "Failure characteristics of cladding tubes
under RIA conditions," Nuclear Engineering and Design, vol. 238, no. 9, pp.
2206-2218, 2008
[65] P. Yvon, C. Ste.-Catherine, C. Duguay, S. Carassou, H. N, B. Cazalis, and C.
Bernaudat, "Development of New Techniques to Assess the Mechanical Behavior
of Zircaloy-4 During an RIA," in proceedings of AIEA Technical Committee
Meeting on "Fuel Behavior under transient and LOCA conditions", Halden,
Norway, 10-14 September, 2001.
[66] O. Dufourneaud, A. G. Varias, V. Grigoriev, R. Jakobsson, and D. Schrire,
"Elastic–plastic deformation of a nuclear fuel cladding specimen under the
internal pressure of a polymer pellet," in proceedings of 5th World Congress on
Computational Mechanics, Vienna, Austria, 7-12 July, 2002.
[67] K. S. Chan, "A fracture model for hydride-induced embrittlement," Acta
Metallurgia et Materialia, vol. 43, no. 12, pp. 4325-4335, 1995
[68] K. S. Chan, "A micromechanical model for predicting hydride embrittlement in
nuclear fuel cladding material," Journal of Nuclear Materials, vol. 227, no. 3, pp.
220-236, 1996
[69] F. Prat, J. Besson, M. Grange, and E. Andrieu, "Behavior and rupture of hydrided
Zircaloy-4 tubes and sheets," Metallurgical and Materials Transactions A:
Physical Metallurgy and Materials Science, vol. 29A, no. 6, pp. 1643-1651A,
1998
[70] M. Grange, J. Besson, and E. Andrieu, "Anisotropic Gurson type model to
represent the ductile rupture of hydrided Zircaloy-4 sheets," International Journal
of Fracture, vol. 105, no. 3, p. 273, 2000
[71] A. L. Gurson, "Continuum Theory of Ductile Rupture by Void Nucleation and
Growth: Part 1 - Yield Criteria and Flow Rules for Porous Ductile Media,"
Journal of Engineering Materials and Technology, vol. 99, no. 1, pp. 2-15, 1977
[72] V. Tvergaard and A. Needleman, "Analysis of the Cup-Cone Fracture in a Round
Tensile Bar," Acta Metallurgica, vol. 32, no. 1, pp. 157-169, 1984
[73] J.-H. Huang and J.-P. Huang, "Effect of Hydrogen Contents on the Mechanical
Properties of Zircaloy-4," Journal of Nuclear Materials, vol. 208, no. 1-2, pp.
166-179, 1994
[74] J. B. Bai, C. Prioul, and D. Francois, "Hydride Embrittlement in Zircaloy-4 Plate.
II. Interaction Between the Tensile Stress and the Hydride Morphology,"
Metallurgical transactions. A, Physical Metallurgy and Materials Science, vol.
25A, no. 6, pp. 1199-1208, 1994

207
[75] H. H. Hsu, "An evaluation of hydrided Zircaloy-4 cladding fracture behavior by
X-specimen test.," Journal of Alloys and Compounds, vol. 426, no. 1-2, pp. 256-
262, 2006
[76] A. Racine, M. Bornert, C. Sainte Catherine, C. Cappelaere, and D. Caldemaison,
"Experimental Investigation of Strain, Damage and Failure of Hydrided
Zirconium Alloys with Various Hydride Orientations," in proceedings of SMiRT-
18: 18th International Conference on Structural Mechanics in Reactor
Technology, Beijing, China, August 7-12, 2005.
[77] A. Racine, "Influence of hydride orientation on deformation modes, damage and
failure of hydrided zircaloy-4," PhD thesis in Mechanics and Materials, Ecole
Polytechnique, 2005.
[78] J. Lemaitre and J. L. Caboche, Mecanique des Materiaux Solides. Paris, France:
Dunod, 1988.
[79] F. Perales, "Fissuration des materiaux a gradient de proprietes application au
zircaloy hydrure," PhD thesis in Mechanical and Civil Engineering, University of
Montpellier II, France, 2005.
[80] F. Perales, S. Bourgeois, A. Chrysochoos, and Y. Monerie, "Two field multibody
method for periodic homogenization in fracture mechanics of nonlinear
heterogeneous materials," Engineering Fracture Mechanics, vol. 75, no. 11, pp.
3378-3398, 2008
[81] ASTM, "Standard Test Method for Plane-Strain Fracture Toughness of Metallic
Materials," ASTM, West Conshohocken, PA, Standard Practice E399-90, 2005.
[82] R. G. Hoagland and R. G. Rowe, "Fracture of irradiated zircaloy-2," Journal of
Nuclear Materials, vol. 30, no. 1-2, pp. 179-195, 1969
[83] I. Aitchison, "The Effect of Orientation of Hydride Precipitates on the Fracture
Toughness of Cold-Rolled Zircaloy-2 and 2.5Nb Zirconium," in Applications-
Related Phenomena for Zirconium and its Alloys. ASTM STP vol. 458,
Philadelphia, ASTM, 1969, pp. 160-178.
[84] B. Watkins, A. Cowan, G. W. Parry, and B. W. Pickles, "Embrittlement of
Zircaloy-2 Pressure Tubes," in Applications-Related Phenomena for Zirconium
and its Alloys. ASTM STP vol. 458, Philadelphia, ASTM, 1969, pp. 141-159.
[85] T. J. Walker, "Characterization of the Fracture Toughness of Zircaloy," Nuclear
Technology, vol. 16, no. 3, pp. 509-520, 1972

208
[86] T. J. Walker and J. N. Kass, "Variation of Zircaloy Fracture Toughness in
Irradiation," in Zirconium in Nuclear Applications. ASTM STP vol. 551,
Philadelphia, ASTM, 1974, pp. 328-354.
[87] S.-I. Honda, "Fracture Toughness of Zr--2.5 Wt.% Nb Pressure Tubes," Nuclear
Engineering and Design, vol. 81, no. 2, pp. 159-167, 1984
[88] P. H. Davies, R. S. W. Shewfelt, and A. K. Jarvine, "Constraint effects in testing
different curved geometries of Zr-2.5Nb pressure tube material," in Constraint
Effects in Fracture: Theory and Applications, Vol. II. ASTM STP vol. 1244, M.
Kirk and A. Bakker, Eds., Philadelphia, ASTM, 1995, pp. 392-424.
[89] P. H. Davies and C. P. Stearns, "Axial Fracture Toughness Testing of Zr--2.5Nb
Pressure Tube Material," in Fracture Mechanics: 16th Symposium. ASTM STP
vol. 868, M. F. Kanninen and A. T. Hopper, Eds., Philadelphia, ASTM, 1985, pp.
308-327.
[90] C. K. Chow and L. A. Simpson, "Analysis of the Unstable Fracture of a Reactor
Pressure Tube Using Fracture Toughness Mapping," in Case Histories Involving
Fatigue and Fracture Mechanics. ASTM STP vol. 918, C. M. Hudson and T. P.
Rich, Eds., Philadelphia, ASTM, 1986, pp. 78-101.
[91] A. C. Wallace, "The Development of Curved Fracture Toughness Specimens for
Predicting Crack Growth in Candu Reactor Pressure Tubes," in proceedings of
11th Canadian Fracture Conference: Time Dependent Fracture, Ottawa, June
1984, pp. 281-291, 1985.
[92] L. A. Simpson and C. K. Chow, "Effect of Metallurgical Variables and
Temperature on the Fracture Toughness of Zirconium Alloy Pressure Tubes," in
Zirconium in the Nuclear Industry: 7th International Symposium. ASTM STP vol.
939, R. B. Adamson and L. F. P. VanSwam, Eds., Philadelphia, ASTM, 1987, pp.
579-596.
[93] P. H. Davies and C. P. Stearns, "Fracture Toughness Testing of Zircaloy-2
Pressure Tube Material With Radial Hydrides Using Direct-Current Potential
Drop," in Fracture Mechanics: 17th Volume. ASTM STP vol. 905, J. H.
Underwood and R. Chait, Eds., Philadelphia, ASTM, 1986, pp. 379-400.
[94] C. K. Chow and L. A. Simpson, "Determination of the Fracture Toughness of
Irradiated Reactor Pressure Tubes Using Curved Compact Specimens," in
Fracture Mechanics: 18th Symposium. ASTM STP vol. 945, D. T. Read and R. P.
Reed, Eds., Philadelphia, ASTM, 1988, pp. 419-439.
[95] P. H. Davies and J. M. Smeltzer, "J-Controlled Crack Growth (Size Effects) in
Fracture Toughness Testing of Zr--2.5Nb Pressure Tube Material," in Fracture

209
Mechanics: 22nd Symposium. Vol. 1. ASTM STP vol. 1131, H. A. Ernst, A.
Saxena, and D. L. McDowell, Eds., Philadelphia, ASTM, 1992, pp. 93-104.
[96] C. K. Chow and K. H. Nho, "Effect of thickness on the fracture toughness of
irradiated Zr-2.5Nb pressure tubes," Journal of Nuclear Materials, vol. 246, no. 1,
pp. 84-87, 1997
[97] F. H. Huang, "Brittle-fracture potential of irradiated Zircaloy-2 pressure tubes,"
Journal of Nuclear Materials, vol. 207, pp. 103-115., 1993
[98] F. H. Huang, "Fracture Toughness Evaluation for Zircaloy-2 Pressure Tubes with
the Electric-Potential Method," in Small Specimen Techniques Applied to Nuclear
Reactr Vessel Thermal Annealing and Plant Life Extension. ASTM STP vol.
1204, W. R. Corwin, F. M. Haggag, and W. L. Server, Eds., Philadelphia, ASTM,
1993, pp. 182-198.
[99] J. S. Dubey, S. L. Wadekar, R. N. Singh, T. K. Sinha, and J. K. Chakravartty,
"Assessment of hydrogen embrittlement of Zircaloy-2 pressure tubes using
unloading compliance and load normalization techniques for determining J-R
curves," Journal of Nuclear Materials, vol. 264, no. 1-2, pp. 20-28, 1998
[100] E. B. Schwenk, K. R. Wheeler, G. D. Shearer, and R. T. Webster, "Poisson's ratio
in zircaloy-4 between 24° and 316°C," Journal of Nuclear Materials, vol. 73, no.
1, pp. 129-131, 1978
[101] V. Grigoriev, B. Josefsson, A. Lind, and B. Rosborg, "A pin-loading tension test
for evaluation of thin-walled tubular materials," Scripta metallurgica et
materialia, vol. 33, no. 1, pp. 109-114, 1995
[102] V. Grigoriev, B. Josefsson, and B. Rosborg, "Fracture Toughness of Zircaloy
Cladding Tubes," in Zirconium in the Nuclear Industry: 11th International
Symposium. ASTM STP vol. 1295, G. P. Sabol and E. R. Bradley, Eds., West
Conshohocken, PA, ASTM, 1996, pp. 431-447.
[103] V. Grigoriev, K. Pettersson, and S. Andersson, "Influence of Texture on the
Fracture Toughness of Unirradiated Zircaloy Cladding," in Zirconium in the
Nuclear Industry: 12th International Symposium. ASTM STP vol. 1354, G. P.
Sabol and G. D. Moan, Eds., West Conshohocken, PA, ASTM, 2000, pp. 303-
315.
[104] V. Grigoriev and R. Jakobsson, "Delayed Hydrogen Cracking Velocity and J-
Integral Measurements on Irradiated BWR Cladding," Journal of ASTM
International, vol. 2, no. 8, pp. 16-31, 2005

210
[105] G. Bertolino, G. Meyer, and J. Perez-Ipina, "Degradation of the mechanical
properties of Zircaloy-4 due to hydrogen embrittlement," Journal of Alloys and
Compounds, vol. Vol. 330-332, pp. 408-413, 2002
[106] G. Bertolino, G. Meyer, and J. Perez-Ipina, "Mechanical Properties Degradation
at Room Temperature in ZRY-4 by Hydrogen Brittleness," Materials Research,
vol. 5, no. 2, pp. 125-129, 2002
[107] G. Bertolino, G. Meyer, and J. Perez-Ipina, "Effects of hydrogen content and
temperature on fracture toughness of Zircaloy-4," Journal of Nuclear Materials,
vol. 320, pp. 272-279, 2003
[108] G. Bertolino, J. Perez-Ipina, and G. Meyer, "In situ crack growth observation and
fracture toughness measurement of hydrogen charged Zircaloy-4," Journal of
Nuclear Materials, vol. 322, pp. 57-65, 2003
[109] G. Bertolino, J. Perez-Ipina, and G. Meyer, "Influence of the crack-tip hydride
concentration on the fracture toughness of Zircaloy-4," Journal of Nuclear
Materials, vol. 348, no. 1-2, pp. 205-212, 2006
[110] H. H. Hsu, K. F. Chien, H. C. Chu, R. C. Kuo, and P. K. Liaw, "An X-specimen
Test for Determination of Thin-walled Tube Fracture Toughness," in Fatigue and
Fracture Mechanics: 32nd Volume. ASTM STP vol. 1402, R. Chona, Ed., West
Conshohocken, PA, ASTM, 2001, pp. 214-226.
[111] J. Bertsch and W. Hoffelner, "Crack resistance curves determination of tube
cladding material.," Journal of Nuclear Materials, vol. 352, no. 1-3, pp. 116-125,
2006
[112] C. Ste.-Catherine, D. Le Boulch, S. Carassou, N. Ramasubramanian, and C.
Lemaignan, "An Internal Conical Mandrel Technique for Fracture Toughness
Measurements on Nuclear Fuel Cladding," Journal of Testing and Evaluation,
vol. 34, no. 5, 2006. D.O.I. 10.1520/JTE14081
[113] P. A. Raynaud, D. A. Koss, A. T. Motta, and K. S. Chan, "Fracture Toughness of
Hydrided Zircaloy-4 Sheet Under Through-Thickness Crack Growth Conditions,"
Journal of ASTM International, vol. 5, no. 1, 2007
[114] P. A. Raynaud, "Fracture Toughness of Hydrided Zircaloy-4 Sheet," M.Sc. Thesis
in Materials Science and Engineering, Penn State University, 2005.
[115] P. E. Danielson and R. C. Sutherlin, "Metallography and Microstructures of
Zirconium, Hafnium, and Their Alloys," in Metallography and Microstructures.
ASM Handbook vol. 9, ASM Handbook, ASM International, 2004, pp. 942-958.

211
[116] J. E. Lewis, G. Schoenberger, and R. B. Adamson, "Texture Measurement
Techniques for Zircaloy Cladding: a Round-Robin Study," in Zirconium in the
Nuclear Industry:Fifth Conference vol. ASTM STP 754, D. G. Franklin, Ed.,
American Society for Testing and Materials, 1982, pp. 39-62.
[117] "Reference Card # 00-005-0665," Newton, PA: International Center for
Diffraction Data, 2001.
[118] O. N. Pierron, "Influence of Hydride Blisters on Failure of Zircaloy-4 Sheet,"
M.Sc. Thesis in Materials, Penn State University, 2002.
[119] A. Glendening, "Influence of Hydride Blisters on the Failure of Zircaloy-4 under
Equal Biaxial tension," M.Sc. Thesis in Materials Science and Engineering, The
Pennsylvania State University, 2004.
[120] ASTM, "Standard Test Method for Measurement of Fracture Toughness," ASTM,
West Conshochocken, PA, Standard Practice E1820-08, 2008.
[121] A. Saxena and C. L. Muhlstein, "Crack Length Measurement," in Mechanical
Testing and Evaluation. ASM Handbooks vol. 8, ASM International, 2000, pp.
174-178.
[122] H. H. Johnson, "Calibrating the Electric Potential Method for Studying Slow
Crack Growth," Materials Research and Standards, vol. 5, no. 9, pp. 442-445,
Sept. 1965, 1965
[123] F. Nagase and H. Uetsuka, "Hydride Morphology and Hydrogen Embrittlement of
Zircaloy fuel Cladding used in NSRR/HBO Experiment," in proceedings of
Proceedings of the ANS International Topical Meeting on Light Water Reactor
Performance, Portland, OR, p. 677, 1997.
[124] J. R. Rice, "A Path Independent Integral and the Approximate Analysis of Strain
Concentration by Notches and Cracks," Journal of Applied Mechanics, vol. 35,
pp. 379-386, 1968
[125] J. R. Rice and G. F. Rosengren, "Plane Strain Deformation near a Crack Tip in a
Power-Law Hardening Material," Journal of the Mechanics and Physics of Solids,
vol. 16, pp. 1-12, 1968
[126] J. W. Hutchinson, "Singular Behavior at the End of a Tensile Crack Tip in a
Hardening Material," Journal of the Mechanics and Physics of Solids, vol. 16, pp.
13-31, 1968
[127] T. L. Anderson, "Mathematical Foundations of EPFM," in Fracture Mechanics :
Fundamentals and Applications, 3rd ed, Taylor & Francis/CRC Press, 2005.

212
[128] J. A. Begley and J. D. Landes, "The J-integral as a Fracture Criterion." ASTM
STP vol. 514, Philadelphia, 1972, pp. 1-20.
[129] ASTM, "Standard Test Method for JIC, a Measure of Fracture Toughness,"
ASTM, Philadelphia, PA, Standard Practice E813-81, 1981.
[130] T. L. Anderson, "History and Overview," in Fracture Mechanics : Fundamentals
and Applications, 3rd ed, Taylor & Francis/CRC Press, 2005.
[131] C. F. Shih, "Relationship between the J-Integral and the Crack Opening
Displacement for Stationary and Extending Cracks," Journal of the Mechanics
and Physics of Solids, vol. 29, pp. 305-326, 1981
[132] H. Tada, P. Paris, and G. Irwin, The Stress Analysis of Cracks Handbook, 3rd ed.
ed. New York: ASME Press, 2000.
[133] T. L. Anderson, "Fracture Toughness Testing of Metals," in Fracture Mechanics :
Fundamentals and Applications, 3rd ed, Taylor & Francis/CRC Press, 2005.
[134] Y. J. Kim, "Experimental J estimation equations for single-edge-cracked bars in
four-point bend: homogeneous and bi-material specimens," Engineering Fracture
Mechanics, vol. 69, no. 7, p. 793, 2002
[135] J. Sumpter, "Jc Determination for Shallow Notch Welded Bend Specimens,"
Fatigue of engineering materials and structures, vol. 10, no. 6, pp. 479-493, 1987
[136] C. M. Davies, M. Kourmpetis, N. P. O'Dowl, and K. M. Nikbin, "Experimental
Evaluation of the J or C* Parameter for a Range of Cracked Geometries," in
Fatigue and Fracture Mechanics, 35th Volume. ASTM STP vol. 1480, R. E. Link
and K. M. Nikbin, Eds., West Conshohocken, PA, ASTM, 2005, pp. 312-340.
[137] "http://www.cfg.cornell.edu/index.htm," Cornell Fracture Group, 2008.
[138] S. X. Wu, Y. W. Mai, and B. Cotterell, "Plastic factor (p) of fracture
specimens with deep and shallow cracks," International Journal of Fracture, vol.
45, pp. 1-18, 1990
[139] http://www-cast3m.cea.fr/cast3m/printnotice.do?name=G_THETA, "Cast3M
Manual Pages on the G-Theta Function," 2003.
[140] T. L. Anderson, "Linear Elastic Fracture Mechanics," in Fracture Mechanics :
Fundamentals and Applications, 3rd ed, Taylor & Francis/CRC Press, 2005.
[141] P. A. Raynaud, M. J. Meholic, D. A. Koss, A. T. Motta, and K. S. Chan,
"Influence of Hydride Microstructure on Through-Thickness Crack Growth in
Zircaloy-4 Sheet," in proceedings of 13th
International Conference on

213
Environmental Degradation of Materials in Nuclear Power Systems, Whistler,
B.C., August 19 - 23, 2007.
[142] T. M. Link, D. A. Koss, and A. T. Motta, "On the Influence of an Embrittled Rim
on the Ductility of Zircaloy Cladding," in proceedings of ANS International
Topical Meeting on Light Water Reactor Fuel Performance, Portland, OR, pp.
634-642, 1997.
[143] P. A. Raynaud, D. A. Koss, A. T. Motta, and K. S. Chan, "Fracture of Hydrided
Zircaloy-4 Sheet under Through-Thickness Crack Growth Conditions," in
proceedings of International LWR Fuel Performance Meeting, San Francisco,
CA, September 30th
- October 3rd
, 2007.

VITA
Patrick A.C. Raynaud
Patrick A.C. Raynaud was born on November 9th
1981 in Aix-en-Provence,
France, as the first child of Jean-Yves and Kelly Raynaud. He has one younger sister,
Magali, and one younger brother, Kevin. He graduated from „La Nativité‟ high school in
1999, when he obtained his French High School Baccalaureate degree.
Patrick then moved to Versailles, France, in order to attend „Classes
Préparatoires‟, where he studied mathematics and physics. In 2001, he took the
competitive entrance exams to the French engineering schools and was admitted to the
„Ecole Centrale de Lyon‟, one of the top-ten engineering schools in France. In the fall of
2003, he joined the department of Materials Science and Engineering at Penn State
University for a double-degree program. His first year at Penn State also counted as his
third and last year of engineering school in France, and he obtained his Master‟s of
Engineering from the „Ecole Centrale de Lyon‟ in the fall of 2004. During his
undergraduate studies, he performed internships with Pechiney-Altec, as well as
Eurocopter, where he worked in the materials division.
Over the entire course of his graduate studies at Penn State, Patrick performed
research in the field of nuclear materials, and specialized in the mechanical behavior and
fracture properties of zirconium alloys used as nuclear fuel cladding. In 2004 and 2005,
he spent his summers at the CEA Saclay and at IRSN Cadarache to collaborate with
French scientists. He obtained his Master‟s of Science in Materials Science and
Engineering in 2005, and then continued his studies at Penn State. During his time as a
PhD student, Patrick published several papers about his research, obtained the
Kennametal Fellowship for academic excellence by a graduate student, and held several
officer positions in the Penn State chapter of ASM International. After obtaining his PhD
in Materials Science and Engineering from Penn State in August 2009, Patrick will be
working for the U.S. Nuclear Regulatory Commission in Rockville, MD.