measuring the thickness of thin metal films - idaho · measuring the thickness of thin metal films...
TRANSCRIPT

Measuring the Thickness of Thin Metal Films
by
R. Phillip Scott
A senior thesis submitted to the faculty of
Brigham Young University – Idaho
in partial fulfillment of the requirements for the degree of
Bachelor of Science
Department of Physics and Astronomy
Brigham Young University – Idaho
July 2012


Copyright © 2012 Randy Phillip Scott
All Rights Reserved


Brigham Young University – Idaho
Department Approval
of a senior thesis submitted by
R. Phillip Scott
This thesis has been reviewed by the research advisor, research coordinator, and
department chair and has been found to be satisfactory.
________________ __________________________________________ Date R. Todd Lines, Research Advisor
________________ __________________________________________ Date David Oliphant, Thesis Coordinator
________________ __________________________________________ Date Stephen Turcotte, Department Chair


ABSTRACT
Measuring the Thickness of Thin Metal Films
Phil Scott
Department of Physics
Bachelor of Science
An exploration of thin metallic film deposition and measuring techniques as well
as an attempt at experimental verification. In an effort to further thin film
development at BYU—Idaho, I have used an alumina coated tungsten basket to
evaporate aluminum onto 1” diameter mineral glass substrates. I then
investigated film measurement techniques in an effort to understand how we
might best proceed with measuring the thickness of developed films. Jaasiel
Rodriguez developed an experimental setup which enabled experimental
measurements of reflectance and transmittance of our films. Due to thin film
properties which differ from bulk material properties, we were unable to
calculate the thickness of our films, but we were able to produce a method of
comparing the thickness of different films with each other.


Acknowledgements
I would like to acknowledge the help of several individuals who have assisted me
in various aspects of this thesis and the work relating to it. First and foremost I
would like to thank Br. Todd R. Lines for supervising the research which has
precluded this work and for the countless candies which were provided through
regular visits to his office. I would also like to thank Br. David Oliphant for the
time, supervision, and direction he has given to the research behind this thesis as
well as the thesis itself. Br. Evan Hansen thanks for guiding me in many of the
improvements that have been made to this document. Of course I would like to
thank my mother for birthing me, without which none of this would have been
possible. A special thanks to fellow students Jaasiel Rodriguez, Bryce Murray,
and Stefan Lofgran without whom nothing practical would have gotten done.


Contents
1 Introduction 1 1.1 Uses of Thin Films in Physics 1 1.2 History of Thin Films at BYU—Idaho 2 1.3 The Measurement Problem 3
2 Thin Film Measurement Techniques 4 2.1 X-Ray Diffraction 4 2.2 Spectrometric Technique 5 2.3 Geometry and Beer’s Law 6 2.4 Ellipsometry/Reflectometry 9 2.5 Fresnel Equations 10 2.6 Mass Approximations 11 2.6.1 Mass Evaporated 11 2.6.2 Mass Added to the Slide 12
3 Research Procedures 14 3.1 My Development of Our Thin Film Program 15 3.1.1 Tungsten Filament 15 3.1.2 Tungsten Basket 16 3.1.3 Alumina Coated Basket 18 3.2 Optical Theory for Thin Film Measurement 19 3.3 Experimental Setup 21
4 Experimental Results 24 4.1 Data Analysis 24 4.2 Sources of Error 27 4.3 Possible Discrepancies 28
5 Conclusion 31 5.1 Outcome of Research 31 5.2 Suggested Improvements 33 5.3 Future Research 34
Bibliography 35 Appendix: Programming Code 37


1
Chapter 1
Introduction to Thin Films
1.1 Uses of Thin Films in Physics
Thin films have become increasingly important in physics and engineering due to
their uses in semiconductors, mirrors, lens coatings, and many other
applications. In industry, there are applications in areas including optical
electronics, communications, a variety of coatings, energy generation, and
energy conservation1. Thin Films are also heavily used in microelectronics and
semiconductor devices. The thin film industry is growing as quickly as scientist
and engineers can find applications for them. This field will become even more
vibrant as we try to make appliances and systems smaller and thinner.
One of the beauties of thin film physics is that it is a very multidisciplinary
subject. Through thin films we can explore areas in solid state physics, surface

2
science, chemistry, vacuum science, crystal growth, and still more2. The reason
for this is that we are dealing with layers from millimeters of material to
nanometers and beyond. With such small amounts of material, the structure and
material properties become very important. Questions arise about discrepancies
between effects in the thin films and effects in bulk properties of the same
material. By investigating these abnormalities, we are forced to branch out into
several areas in science in order to find answers and explanations.
1.2 History of Thin Films at BYU – Idaho
The work of developing a thin film program at Brigham Young University—Idaho
began in 2007 by Steven Turner. He has recorded the techniques he attempted
for deposition in his senior thesis3. The thin film program began by looking at a
few different designs which included using a crucible to contain the evaporant,
using molybdenum/tungsten boats, and using a tungsten filament to evaporate
metals.
When I began investigating thin film deposition methods, the university was
evaporating metals by flashing a wire filament. This gave very inhomogeneous
films and the results were in no way reproducible since it was impossible to tell
at which point the wire would finally melt and evaporate. While this technique is
not listed in Turner’s thesis, it was later developed and used as the best option at
the time. Because this method is not ideal for producing films, my research
began by identifying ways to improve the film generation at BYU – Idaho and the

3
methods and means used to improve the thin film quality are listed in section
3.1.
1.3 The Measurement Problem
After thin films were produced, it became apparent that BYU—Idaho lacks the
equipment to determine the thickness of the produced films. The method of X-
ray diffraction was attempted, but the detector currently used lacks the
precision to determine anything about our films. Since thickness is an important
quality of thin films, it became necessary to find a way to measure the thickness
of the films so that BYU—Idaho can begin developing thin films with specific
applications in mind. Measuring the thickness will also be important to ensure
that the deposition method which is used can produce films with consistent
properties and quality. It is therefore my goal to find reasonable methods of
measuring the thickness of thin metallic films which can be used at BYU—Idaho.
My research focuses on using one of these techniques in an effort to measure
the thickness of the films we can produce at this university as well as improving
the deposition methods currently in use.

4
Chapter 2
Thin Film Measurement Techniques
There is by no means a single way to measure the thickness of a given thin film.
Having a film I would like to list a few of the possible techniques that seem likely
to get results with the equipment at this university or with equipment that we
may be able to procure in the near future. This list is not comprehensive and
different methods have different strengths and weaknesses. The techniques I
have looked into include the following.
2.1 X-Ray Diffraction
Professor David Oliphant has attempted to use x-ray diffraction techniques to
measure the thickness of BYU – Idaho’s films. Unfortunately the detector
currently used here is insufficient to find the thickness of these films. I have not
spent time further investigating this possibility. If we are able to get a new x-ray
detector, this method would warrant looking into more deeply as a potential
way of measuring film properties such as thickness.

5
2.2 Spectrometric Technique
This technique relies on a paper in the American Journal of Physics titled “A
simple transmission-based approach for determining the thickness of
transparent films” by Kailash C. Jena and Dennis K. Hore5. In this paper the
authors outline how a spectrometer can be used to generate transmission
spectra of the film. These can then be used not only to find it’s thickness, but
also its index of refraction using numerical curve fitting techniques with Fresnel’s
equations. It would also give us the refractive index of the substrate which the
film is on. I believe that this approach could be modified to be used with metallic
films as well as dielectrics. For this, one would have to fit not only for the real
component of the refractive index, but also for the complex part.
A large advantage to this approach is that it is relatively simple and
straightforward. The experiment is done using normal incidence with white light.
The transmission spectra can be fit using the Fresnel equations which are quite
simplified at normal incidence.
The main problem that I had with this approach was equipment based. We
are currently only in possession of the USB650 Red Tide Spectrometer from
Ocean Optics. I tried collecting data from this machine by attempting
measurement with a fiber optic cable and attempting it without. One problem is
that the spectrometer is very angularly dependent. This means that if everything

6
isn’t lined up just right, the data may not be accurate or collected well enough to
trust. Small deviations in angles produce large deviations in intensities. This
means that any bump or change ruins any further testing and data collection.
This combined with getting inconsistent measurements with the device led
me to decide against using this technique. I still think it would be a valid way to
get the indices of refraction as well as the thickness of the film if we are able to
get better and more stable equipment.
2.3 Geometry and Beer’s Law
This technique relies heavily on Beer’s Law for metals. In its basic form it is
(1)
taken from Eugene Hecht’s “Optics”6. Here the absorption coefficient for the
metal is and is the distance the light travels in the metal. and are the
transmitted and incident intensities as shown in Figure 1. This approach assumes
that is the amount of light entering the metal,
so anything reflected needs to be taken care of
first. This is easily done with Equation (1) changing
to
(2)
or equally
(3)
Ir Io
It
Figure 1: Simplified diagram of the incident, reflected and transmitted rays

7
The reason we can do this so simply is that we are assuming that the
substrate (currently soda lime glass) has no absorption. This means that all the
light is either reflected by the system, transmitted through the system, or
absorbed by the film. One drawback is that this does not account for multiple
reflections within the film. This would lead to more absorption taking place and
subsequently the equation would produce a larger value for the thickness of the
film than really is there. If we limit our focus to thick films, then any light
reaching the back of the metal will be low in intensity and the reflection from the
film substrate interface will become small enough that the resulting absorption
can be considered negligible.
This procedure has the benefit of needing only three detectors. We can
measure the initial, reflected and transmitted intensities and thus solve for
thickness. Furthermore we can use the optical properties of the metal with this
equation if we note that
(4)
where refers to the complex component of the index of refraction of the film
( ̃ ).
Another note is that when we are entering the metal at an angle, the light is
traveling through at a distance larger than the thickness of the film. We can
relate the distance traveled ( ) to the thickness with the cosine trig function
leading to
(5)

8
Here is the angle the light enters the metal and is related to the incidence
angle via snell’s law
(6)
If we remember that
√ (7)
we get the equation relating the distance traveled in the film to the thickness
and the angel of incidence
√
√ (8)
Substituting all this back into Equation (2) gives us
(
)
√
(9)
and solving for the thickness we get
√
(10)
If we use a laser (single wavelength) and a metal with well known optical
constants ( ) we can measure the Intensities at a given angle and find the
thickness based on the above equation.
As stated previously, one thing to be aware of when using this technique is
that there may well be several bounces inside the metal, leading to more light
being absorbed than would be absorbed in a single pass. This would invalidate
the assumptions made in the derivation above and lead to inaccurate
thicknesses. In spite of this, this technique should work just fine for thick films.

9
Relatively little light will get transmitted from the metal and therefore little will
bounce off the back of the substrate and re-enter the metal. As for multiple
reflections in the metal, for thick films the intensity would die shortly after
reflection from the back of the metal.
2.4 Ellipsometry/ Reflectometry
Ellipsometry is a technique that can be used to determine various properties of a
thin film. This technique can be used either to determine the thickness or indices
of refraction. This involves looking at the polarization of light that is incident on
and reflected by a film. The basic theory behind this is that while in the film, the
light’s polarization undergoes a shift that is dependent on the thickness of the
metal. By seeing how much the polarization has shifted in the metal and
knowing the metal’s indices of refraction, we can determine the thickness of the
film. Likewise, by knowing the thickness of the film, we can determine the
indices of refraction, both real and complex.
This seems to be a viable technique for measuring the thickness of films, and
would be worth taking time to experiment with, but I will be focusing my
attention on other methods. To the interested reader, Doctor Evan Hansen has
some literature that might help one get started in understanding the design and
theory of ellipsometric experiments.

10
Another resource for studying ellipsometry is the book “Handbook of Optical
Constants of Solids” edited by Edward Palik7. This book has a large section on
both ellipsometric methods as well as reflectometry. While this reference
focuses mainly on finding the indices of refraction, if these optical constants are
known, one should be able to rearrange the equations to solve for the thickness
of the films.
2.5 Fresnel Equations
Aside from using the Fresnel equations in the spectrometer approach of
normally incident white light, there is another method which uses the Fresnel
equations. Instead of curve fitting with the Fresnel equations as a function of
wavelength, we can fit the transmittance and reflectance with them with respect
to the angle of incidence. An experiment can be designed to measure the
incident, reflected, and transmitted intensities of light of a particular
wavelength. These intensities can then be used to find experimental values for
the reflectance and transmittance of the film-slide system which can then be
curve fit to find the film thickness. For more detail on the equations to use in
curve fitting, see section 3.2.

11
2.6 Mass Approximations
If deposition occurs with a known metal composition, and the mass of the metal
applied is measurable, an approximation on the thickness of the produced film
can be made. I would like to propose two methods for doing this. The first is
dependent on measuring how much mass is evaporated form the source. The
second method involves measuring the mass increase of the slide after
deposition.
2.6.1 Mass Evaporated
If we assume that the mass evaporated proceeds from the source spherically, we
can approximate the thickness as
(11)
The thickness is , is the mass evaporated (mass difference in the pellet), is
the density of the metal, and is the height of the slide from the basket10. The
mass evaporated can easily be measured by simply weighing the crucible and the
metal to be evaporated before and after deposition. The difference in these
masses is what was evaporated out of the crucible. This formula assumes that
the evaporation radiates out spherically. This will not hold true with the alumina
coated basket or other such pieces of equipment. The equation could easily be

12
changed to account for this by accounting for the maximum angle from the
vertical ( ) that the vapor leaves the basket
(12)
One shortcoming of this technique is that the angle at which vapor leaves the
source is dependent on the amount of metal used for evaporation. As the basket
is filled, the angle will increase and while evaporation continues, the angle
decreases. There may be a way to link the angle of deposition to the volume of
metal being evaporated, but this would require experimentation to find the
relationship and would be strongly dependent on the setup and geometry of the
source. Because of this we will end the derivation with Equation (12) and leave
further derivation to the reader should this technique be of further interest.
2.6.2 Mass Added to the Slide
One should be able to weigh the slide before the film is applied and weigh the
slide afterwards and figure out approximately how thick the film is by way of the
formula
(13)
This gives the thickness with respect to the mass , density , and area of
the slide’s filmed surface . The problem that I’ve run into with this is that the
slide has come out of the chamber weighing less than when it went in. I believe
this is because of the way the slide is inserted as well as outgassing effects.

13
While investigating the method, there was a tight space holding the slide in place
and it was difficult to get the slide into the holder. This lead to the glass being
chipped as the slide was inserted into the chamber. This has since been
remedied with further improvements to our deposition setup, but is something
to keep in mind as this method of approximating film thickness is used.
Outgassing effects are currently being investigated by fellow student Stefan
Lofgran.

14
Chapter 3
Research Procedures
One of the large problems that we’ve had to solve in our experiments is having
an unknown index of refraction for our film. Since we were using an unknown
mixture of Ni and Ag, we don’t know exactly how light is interacting with the
film. One way of overcoming this was to make metal films of a solitary metal
(such as Al) whose optic properties are well known. We have since done this and
have a few films of various metal types. At Brigham Young University —Idaho we
haven’t had a thin films research program until very recently. We now have the
equipment to deposit thin metal films on glass substrates via thermal
evaporation. To make these films, a vacuum chamber is used with a rotary vane
roughing pump as well as an oil diffusion pump to reach high vacuum.

15
3.1 The Development of Our Thin Film Program
Steven Turner began developing thin films at Brigham Young University—Idaho
and has recorded the techniques he attempted in his senior thesis3. The thin film
program began by looking at a few different designs which included using a
crucible to contain the evaporant, using molybdenum/tungsten boats, and using
a tungsten filament to evaporate metals.
When I began investigating thin film deposition methods, the university was
evaporating metals by flashing a wire filament. This gave very inhomogeneous
films and the results were in no way reproducible since it was impossible to tell
where the wire would finally melt and evaporate at. While this technique is not
listed in Turner’s thesis, it was later developed and used as the best option at the
time. Because this method is not ideal for producing films, my research began by
identifying ways to improve the film generation at BYU – Idaho.
3.1.1 Tungsten Filament
The first attempted improvement consisted of us wrapping tungsten wire around
the electrical inputs and then wrapping the filament with the nickel/silver wire.
The idea behind this is that since tungsten has a much higher melting point than
either nickel or silver, heating the tungsten should be able to evaporate some if
not all of the wire wrapped around the filament.

16
When this technique was attempted, a 200 A, 5V power supply was used.
This is the same power supply which has been used to flash the Ni and Ag wire.
Unfortunately, this provided too much current even for the tungsten, and it
broke before the wire wrapped around it had a chance to melt. What we ended
up with was a slide coated with a dark tungsten film.
3.1.2 Tungsten Basket
The next step towards better film making was to use a tungsten basket. We also
decided to switch from using the wire with this to using aluminum pellets which
we cut into small chunks to insert into the basket. The reason for this is that we
can easily find the optical properties of aluminum, whereas before we were
dealing with a combination of metals which could have several effects on the
films the least of which would be an unknown refractive index. We would also
have to worry about a crystalline structure forming, a potentially
inhomogeneous film, and potentially a multilayered film since silver melts at a
lot lower temperature than nickel.
Since we’ve seen that the power source we have used up to this point has
the capability to easily melt tungsten wire in a vacuum, we looked for a different
power supply. We decided that most of the power supplies we have won’t be
able to heat the tungsten to any significant temperature, so we decided to use a

17
variac. This takes the electricity from a wall socket and lets us only feed a certain
percent of the voltage through. We put a multimeter in the circuit so we could
track how much current is going through our system for repeatability and
analysis. We started with 5 A and left it there till the tungsten became orange
hot. The current continually lowers since the resistivity changes with
temperature and this is a sign that the tungsten is heating up. We left it at 5.5 A
so that the tungsten was wet and to cleanse out any oxides. We then went up to
8 A for a brief time to get things hotter. We went to 9 A to try and flash the
aluminum and lowered the current back down to 0. There wasn’t much if any of
a film deposited on the slide.
Our next attempt we followed a similar procedure, but we left the current
running at 9 A longer to see if anything happened. We went to 10 A once we had
let it sit with nothing interesting happening. At 10 A the Al looked to be
somewhat melted, so we continued to increase the amperage to 11 A. Here the
aluminum completely melted. The resistance lowered drastically as the tungsten
was wet with aluminum. The current was then raised to 13 A to try to evaporate
the Al and the fuse in the multimeter blew at 13.5 A. When we took the basket
out of the chamber the Al had been completely melted and was now a solid
chunk in the bottom of the basket. There still wasn’t much if any evaporant. The
tungsten was fine and we were at about 6 V. I believe that if we could find a 20 A
power supply it might do the trick. As a note, while handling the basket, the
tungsten broke near the bottom of the basket.

18
After this I used another basket and tried the experiment again. This time
however, I didn’t hook a multimeter into the circuit so that a fuse blowing
wouldn’t stop the progress. As I went back to around 6 V, the tungsten basket
broke. The slide was coated in a nice layer of tungsten, but I can’t be sure any of
the metal evaporated in the basket. Both baskets have aluminum deposits in
them and both have had an end broken off rendering them unusable. I believe
that the problem with this technique is that once the tungsten is wet, electricity
no longer travels through it, but it short cuts it by traveling through the liquid
aluminum.
3.1.4 Alumina Coated Basket
To solve the problem of wetting the Tungsten, I found alumina coated tungsten
baskets online through a Midwest Tungsten Service. This will allow the tungsten
to keep the current through it while still melting and evaporating the metal.
Because the tungsten is no longer in direct contact with the aluminum, we don’t
have to worry about wetting our filament. The specifications given imply that to
get the alumina basket to a temperature of 1475 ᵒC one should use 5.7 V and 11
A4.
The alumina coated basket has worked wonderfully. We have been able to
achieve more consistent results with better quality films. The films appear much

19
more homogenous even through simple inspection than those previously
produced. With this basket and a little practice, we should be able to make
consistent films in vacuum by blocking the evaporant with the swiveling arm in
the chamber. By letting the basket get to temperature and timing how long the
slide is left open to the evaporant, we should get thin films of consistent
thicknesses.
3.2 Optical Theory for Thin Film Measurement
In order to measure the thin films which have been produced, we have decided
to use an optical technique similar to the one introduced in section 2.5. The
theory is described in general in chapter 4 of the book “Physics of Light and
Optics”9 but I will briefly describe the relevant equations here as well. To fully
describe the system, I believe it would be best to describe the film-slide system
as a multilayer film since the reflections off the back of the slide can’t be
separated from the reflections off the metal. This light interferes with other
reflections inside the slide and the film. For our experiment, we will be using a
simplified equation which also describes the system well by assuming the glass is
infinitely thick. Figure 2 shows that making this simplification is justified and
reflects the result of treating the slide film system as a single film with infinitely
thick glass instead of as a multilayered film. The equation for a multilayered film
works well until trying to describe films thinner than approximately 3*10-8 m.

20
The well-defined line in Figure 2 is the simplified function, while the “fuzzy” line
is the result of the equation produced in describing our system as a multilayered
film. For more information on the multilayered film equations see “Physics of
Light and Optics”9. It is worth noting that both methods reproduce results
predicted in Born and Wolf’s “Principles of Optics”8. In the simplified system, the
reflectance and transmittance can be written as
( ) ( ) and
( ) ( )
(14)
respectively. Here and represent the total reflection and transmission
coefficients for p-polarized light from a double film interface. The p-polarization
Figure 2: The predicted reflectance and transmittance of a thin aluminum film. This shows the validity of the simplification used

21
state was chosen based on experimental considerations. This should work
similarly with the s-polarized state. The coefficients in Equation (14) are
(15)
and
(16)
In Equations (15) and (16), the ‘s and the ’s represent the Fresnel reflection
and transmission coefficients across the boundary described by the superscript.
For example, is the Fresnel transmission coefficient for p-polarized light
from the film to glass interface. The other variables, and , represent the
wavenumber and film thickness respectively. With these equations, we should
be able to calculate a film thickness from both the reflectance and transmittance
of our thin films. It is also important to know that since we are using absorptive
material for our film, the index of refraction of the film is complex.
3.3 Experimental Setup
To test the theory in section 3.2, an experiment was devised. For this, an optics
table was used with a red laser which was polarized so that the electric field was
parallel to the plane of incidence. A diagram of the setup is given in Figure 3. This

22
setup enabled us to measure the initial, reflected, and transmitted intensities of
light from the laser. This is turn allowed us to get data related to the reflectance
and transmittance of our film and slide for a range of angles. By placing the slide
on a rotating mount, we could rotate it and the reflected beam so as to have all
detectors normal to the beam at all times.
One major difficulty faced was ensuring that all our optics were normal to
the laser. For the alignment techniques we used to do this, see the senior thesis
of Jaasiel Rodriguez from BYU—Idaho11. A neutral density filter was used to
ensure that we were well below the saturation point for all our detectors. The
beam splitter we used allowed us to compare the intensity of the beam before it
interacted with our system with the intensity of any rays measured after the
interaction, thereby ensuring that all the information we gathered was gathered
Figure 3: Diagram of the experiment performed to measure film thicknesses

23
at the same time so that we weren’t forced to assume anything about the
stability of the laser.

24
Chapter 4
Experimental Results
Born and Wolf8 claim that “At optical wavelengths absorption of metals is so
large that the thickness at which there is appreciable transmission is well below
a quarter wavelength” (pg. 632). This implies that the thickness we should be
getting from our metallic thin films is on the order of 10-7 – 10-9 m. We can use
this range to check the validity of thicknesses we measure.
4.1 Data Analysis
The data was collected using LabView and analyzed primarily using MatLab and
Maple. To ensure that we knew how the diodes were responding, we let the
laser settle over time while measuring the intensity of the initial beam with
respect to the reflected and transmitted rays. This was then fit with a line to
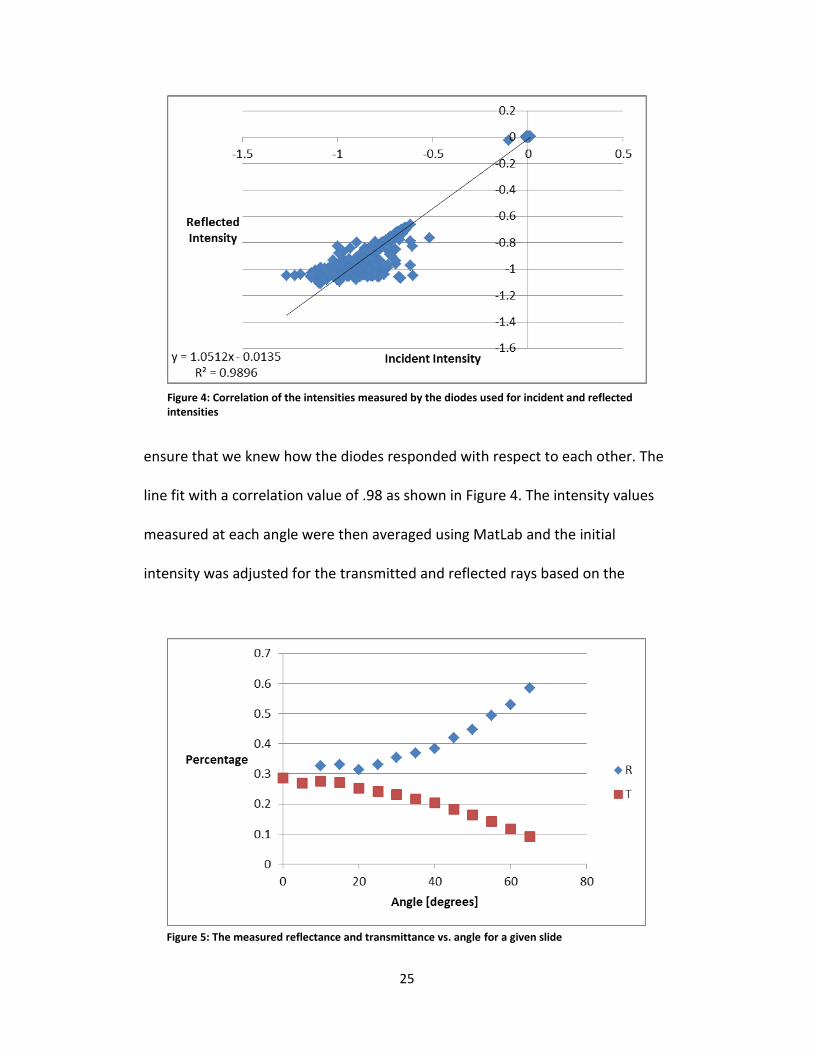
25
Figure 5: The measured reflectance and transmittance vs. angle for a given slide
ensure that we knew how the diodes responded with respect to each other. The
line fit with a correlation value of .98 as shown in Figure 4. The intensity values
measured at each angle were then averaged using MatLab and the initial
intensity was adjusted for the transmitted and reflected rays based on the
Figure 4: Correlation of the intensities measured by the diodes used for incident and reflected intensities

26
response function found in Figure 4. I then calculated the reflectance and
transmittance of the film and created a plot of R and T vs. angle for a given film
as shown in Figure 5.
Once experimental values were found, the data was compared to the
theoretical curves generated from the equations in section 3.2. The theoretical
curves for reflectance and transmittance are shown in Figure 6. As can be seen
by comparison of Figures 5 and 6, the data does not fit the general shape of the
curves as we would expect. Possible reasons for this discrepancy are given in
section 4.3, but suffice it to say that our theory does not fit our data. An area of
Figure 6: Curves generated by the theory given in section 3.2. This figure shows the theoretical reflectance and transmittance of our slide and film system.

27
future research could include looking at the s-polarized measurements and
comparing with the same theory to see if the same discrepancy occurs.
4.2 Sources of Error
When dealing with optics there are three major sources of error. Alignment,
alignment, and alignment. A major analysis of the alignment of our optics system
is given in the senior thesis of Jaasiel Rodriguez11, but a brief discussion will be
given here. To ensure that all of our optics were aligned, the reflections from all
diodes and the film were reflected in such a way that all reflected rays reentered
the laser from which they originated. This ensures that the laser beam is normal
to all surfaces. As far as angular uncertainty goes, we were able to rotate our
slide to within a .3 degree uncertainty. All other sources of angular uncertainty
were kept well below this.
Error would also result from the oxidation of the aluminum deposited on the
slide. The thin layer of Al2O3 would not absorb light in the visible spectrum, but it
could affect reflectance and transmittance. The oxide would also develop
between grain boundaries adding another complicated element to performing a
full analysis of our film.
There is an uncertainty with regards to the polarization of the beam. The
analysis being performed assumes that the laser is polarized completely in the p
state, but in reality the polarization is likely a combination of the p and s

28
polarization states. This would affect the analysis because the two polarizations
behave differently with reflectance and transmittance. I believe that assume full
p polarization is justified since there is likely a negligibly small s component to
the polarization.
4.3 Possible Discrepancies
As is clearly visible in Figures 5 and 6, the predicted reflectance curve does not
match the shape of the data we retrieved. This means that we will not be able to
fit the data using the theory as outlined in section 3.2. There could be several
reasons why we did not get the curve that we expected form our experimental
data.
The factor I believe to be creating the discrepancy between theory and
experiment is that when dealing with very thin films, bulk material properties
may no longer apply. One assumption that was made with regards to many of
the theories which I have outlined is that the optical constants of aluminum are
known and apply to the film we have developed. Changing the optical constants
of the material would indeed change the shape of the predicted R and T curves
from what they are in Figure 6. I tried doing a three parameter fit of the data in
order to search for the best fit with variable optical constants, but this
unfortunately did not yield any results. If a method can be devised to determine

29
the optical properties of the film in question, or if the film were made thick
enough, this experiment may still yield accurate results.
Other possibilities for the discrepancy between theory and experiment could
include an oxide layer developing on the film, crystalline structure developing in
the film, or grain boundaries playing a significant role. While I did not have time
to delve into these topics in depth, it could be that any or all of these are
affecting the behavior of our thin films. An oxide layer does develop, but we
have not looked into including that into our film analysis. Theoretically we could
treat it as another layer using a multilayer film equation to describe our
experiment and solve for the thickness of both the aluminum and its oxide layer,
but we did not have time to further investigate this possibility.
Another possible explanation would be that surface effects may become
non-negligible when dealing with thin films. As the film gets thinner, a larger
percentage of the total film is considered the film boundary. In bulk materials
these boundaries are small compared to the overall size of the material, but
when dealing with a thin film it is possible that your film consist of little more
than two boundary layers of the material. Our expectation is that our film is on
the order of tens to hundreds of atoms thick. This means that there are very few
atoms total, so if the boundary layer is only 10 atoms thick, this still becomes a
significant portion of the film. Light may be interacting differently in these

30
boundary regions than we would expect and this could be causing the
discrepancy we are seeing.

31
Chapter 5
Conclusion
5.1 Outcome of Research
Because of the discrepancies we found between the theory and the data we
collected we were not able to calculate the thickness of our thin metal films.
While this method did not give us the solution we desired, using the methods
outlined in this text we were able to differentiate between films of different
thicknesses. Figure 7a shows the reflectance and transmittance of a thin film,
while Figure 7b shows the reflectance and transmittance of a thicker film. While
these films are easy to differentiate by simple inspection, one should be able to
do a similar analysis for two films which appear to be similar in thickness in order
to determine which is thicker. One implication of this is that if one is able to
determine the thcickness of a given film, other films can be compared to the
known one in order to approximate their thicknesses or set upper or lower

32
Figure 7a: The reflectance and transmittance of a relatively thin film. Note the high transmittance at near normal incidence.
bounds on the thickness of the film in question. So while we were unsuccessful
in determining a method usable at BYU—Idaho to measure the thickness of thin
metal films, we were able to find a way to differentiate between films of
different thicknesses.
My goal was not only to measure the thickness of a metallic film, but also to
Figure 7b: The reflectance and transmittance of a relatively thick film. Because the reflectance is greater even at small angles, it is easy to determine that this film is relatively thick

33
improve the film development process and the experimental optics at this
university. With respect to these last two goals, I feel that I have succeeded in
my research. Our optics table now has the necessary equipment to proceed with
research in multiple areas of optics and we have students interested in
continuing this line of research. Likewise the thin film program is continuing to
improve and become more advanced through the interest of other students.
5.2 Suggested Improvements
One improvement that could be made would be to modify the theory to account
for the oxide layer which will have developed on any film we will analyze.
Further improvements to this experiment would also include finding a way to
measure the refractive index of thin metal films. With these improvements it
may be possible to replicate my work with a more promising result. Another
improvement could include using s polarized light. This would eliminate the dip
in reflection and possibly be less affected by small changes in the refractive
index. Improvements can likely be made to the experimental setup, but for this I
will again refer the reader to the thesis of Jaasiel Rodriguez11 which discusses
such things much more thoroughly than I have here.

34
5.4 Future Research
The research which I have performed can help future students in multiple areas
of future research. First, students interested in optics and thin film applications
can attempt to use the spectrometric technique outlined in section 2.2 by
building their own spectrometer using the universities equipment. I believe that
with the purchase of a few more pieces of equipment, our optics table and
equipment would be sufficient to design and build a visible light spectrometer.
This could be an area of research in and of itself with thin film applications being
applied to the spectrometer after it has been developed.
Another area of research would be to further investigate X-ray diffraction.
This may require a better detector than we currently have in our department,
but it might be possible to find ways to use the one we currently have to
perform further research. It might also be possible for students to find ways to
improve the setup of the apparatus.
With the equipment that we have purchased for the university, students will
be able to investigate numerous areas of research in optics. Experiments can be
performed investigating interference, diffraction, or a plethora of other optical
principles. This allows future students to investigate many areas of optical
physics experimentally and gives them freedom to choose which area they are
most interested in.

Bibliography
[1] M. Ohring, The Materials Science of Thin Films¸ 2nd ed. (Academic Press, 2001).
[2] P. Barna, “History of thin films: growth techniques characterization,”
http://crysta.physik.hu-berlin.de/as2005/pdf/as2005_talk_15_Barna.pdf (2005).
[3] S. Turner, B.S. Thesis, “Thin film deposition: principles, design, and production,”
Brigham Young University—Idaho, 2007.
[4] Midwest Tungsten Service, Alumina Coated Crucibles and Evaporation Filaments,
http://www.tungsten.com/crucible.html
[5] D. Hore and K. Jena, “A simple transmission-based approach for determining the
thickness of transparent films,” American Journal of Physics 79, 256-260 (2011).
[6] E. Hecht, Optics, 4th ed. (Addison Wesley, 2002).
[7] E. Palik, Handbook of Optical Constants of Solids, 2nd ed. (Knovel, 1998).
http://www.knovel.com/web/portal/basic_search/display?_EXT_KNOVEL_DISPL
AY_bookid=1669
[8] M. Born and E. Wolfe, Principles of Optics: electromagnetic theory of
propogation, interference and diffraction of light, 7th ed. (Cambridge
University Press, 1997) pp. 735-759.
[9] J. Peatross and M. Ware, Physics of Light and Optics (2011).
[10] L. Fuller, “Physical vapor deposition – evaporation and sputtering,”
http://people.rit.edu/lffeee/PVD_Recipes.pdf (2011).

[11] J. Rodriguez, B.S. Thesis,”Semiconductor detector and optical system alignment for
optical thin-film thicknesses using a modified reflectometry method,” Brigham
Young University—Idaho, 2012.

Appendix: Programming Code
1. This selection of MatLabcode was used to average the intensities we
measured for each given angle. It also calculates the uncertainties in those
measurements
function [] = IntensityAveragingUncertainties() % Created by: Phil Scott 6/22/11 % This function takes in a matrix from excel and averages the
2nd-nth % columns for a given value in the specified column. Increments
need not be % consistent. DOES NOT SORT THE MATRIX!
% User specified values filename1 = input('\nWhat is the name of the file to read in?
(example: Book1.csv)\n','s'); filename2 = input('What is the name of the file to write to?
(example: Book2.csv)\n','s');
%This is the option to have a different column than the first as
a reference %column %column = input('Which column will be used as a reference for
averaging?\n');
column = 1;
% Read file into a matrix A = xlsread(filename1);
% Get dimensions [m,n] = size(A);
% Walk through all the columns including the specified one and
average each % for a given value in the user selected column for p = 1:n
value = A(1,column); q = 1; j = 0; sum = 0; sqsum = 0;
% Average rows for each given value in the first column

for i = 1 : m
% sum up values so long as the value in the chosen column
remains % the same. Once it changes, move to the next value and
do again. if A(i,column) == value sum = sum + A(i,p); j = j + 1; else Avg(q,2*p-1) = sum/j; sum = A(i,p); value = A(i,column); q = q + 1; j = 1; end
end
% Last value doesn't go into else statement so it gets put in
the % matrix here Avg(q,2*p-1) = sum/j;
value = A(1,column); q = 1; j = -1; %standard deviation uses N-1, so j starts at -1
for i = 1 : m % sum up values so long as the value in the chosen column
remains % the same. Once it changes, move to the next value and
do again. if A(i,column) == value sqsum = sqsum + (A(i,p) - Avg(q,2*p-1))^2; j = j + 1; else Avg(q,2*p) = sqrt(sqsum/(j*(j+1))); value = A(i,column); q = q + 1; sqsum = (A(i,p)-Avg(q,2*p-1))^2; j = 0; end
end
% Last angle doesn't go into else statement so it gets put in
the % matrix here Avg(q,2*p) = sqrt(sqsum/(j*(j+1))); end
dlmwrite(filename2,Avg);

fprintf('\nI hope this has been a quick and enjoyable experience.
Thank you and have a nice day!\n\n') end
2. The following are the LabView programs we used to collect all of our data.
The first is the program used in the experiment itself. This allowed us to
collect the initial, reflected and transmitted intensities of our laser-slide
experiment.
The second program was used to measure the intensities with the purpose of
comparing the different intensities to each other. This is the program we
used in comparing the response of the different photodiodes.