fatigue crack growth characteristics of thin sheet
TRANSCRIPT

March 2001
NASA/TM-2001-210830
Fatigue Crack Growth Characteristics ofThin Sheet Titanium Alloy Ti 6-2-2-2-2
Stephen W. Smith and Robert S. PiascikLangley Research Center, Hampton, Virginia

The NASA STI Program Office ... in Profile
Since its founding, NASA has been dedicatedto the advancement of aeronautics and spacescience. The NASA Scientific and TechnicalInformation (STI) Program Office plays a keypart in helping NASA maintain this importantrole.
The NASA STI Program Office is operated byLangley Research Center, the lead center forNASAÕs scientific and technical information.The NASA STI Program Office providesaccess to the NASA STI Database, the largestcollection of aeronautical and space scienceSTI in the world. The Program Office is alsoNASAÕs institutional mechanism fordisseminating the results of its research anddevelopment activities. These results arepublished by NASA in the NASA STI ReportSeries, which includes the following reporttypes: · TECHNICAL PUBLICATION. Reports of
completed research or a major significantphase of research that present the resultsof NASA programs and include extensivedata or theoretical analysis. Includescompilations of significant scientific andtechnical data and information deemed tobe of continuing reference value. NASAcounterpart of peer-reviewed formalprofessional papers, but having lessstringent limitations on manuscript lengthand extent of graphic presentations.
· TECHNICAL MEMORANDUM. Scientific
and technical findings that arepreliminary or of specialized interest, e.g.,quick release reports, working papers,and bibliographies that contain minimalannotation. Does not contain extensiveanalysis.
· CONTRACTOR REPORT. Scientific andtechnical findings by NASA-sponsoredcontractors and grantees.
· CONFERENCE PUBLICATION. Collectedpapers from scientific and technicalconferences, symposia, seminars, or othermeetings sponsored or co-sponsored byNASA.
· SPECIAL PUBLICATION. Scientific,
technical, or historical information fromNASA programs, projects, and missions,often concerned with subjects havingsubstantial public interest.
· TECHNICAL TRANSLATION. English-
language translations of foreign scientificand technical material pertinent toNASAÕs mission.
Specialized services that complement theSTI Program OfficeÕs diverse offeringsinclude creating custom thesauri, buildingcustomized databases, organizing andpublishing research results ... evenproviding videos.
For more information about the NASA STIProgram Office, see the following:
· Access the NASA STI Program HomePage at http://www.sti.nasa.gov
· E-mail your question via the Internet to
[email protected] · Fax your question to the NASA STI
Help Desk at (301) 621-0134 · Phone the NASA STI Help Desk at
(301) 621-0390 · Write to:
NASA STI Help Desk NASA Center for AeroSpace Information 7121 Standard Drive Hanover, MD 21076-1320

National Aeronautics andSpace Administration
Langley Research CenterHampton, Virginia 23681-2199
March 2001
NASA/TM-2001-210830
Fatigue Crack Growth Characteristics ofThin Sheet Titanium Alloy Ti 6-2-2-2-2
Stephen W. Smith and Robert S. PiascikLangley Research Center, Hampton, Virginia

Available from:
NASA Center for AeroSpace Information (CASI) National Technical Information Service (NTIS)7121 Standard Drive 5285 Port Royal RoadHanover, MD 21076-1320 Springfield, VA 22161-2171(301) 621-0390 (703) 605-6000

1
Abstract
Fatigue crack growth rates of Ti 6-2-2-2-2 as a function of stress ratio, temperature (24 or 177 °C), tensile orientation and environment (laboratory air or ultrahigh vacuum) are presented. Fatigue crack growth rates of Ti 6-2-2-2-2 are also compared with two more widely used titanium alloys (Timetal 21S and Ti 6Al-4V). The fatigue crack growth rate (da/dN) of Ti 6-2-2-2-2 in laboratory air is dependent upon stress ratio (R), particularly in the near-threshold and lower-Paris regimes. For low R (less than approximately 0.5), da/dN is influenced by crack closure behavior. At higher R (> 0.5), a maximum stress-intensity factor (K
max) dependence is observed. Fatigue crack growth behavior is
affected by test temperature between 24 and 177 °C. For moderate to high applied cyclic-stress-intensity factors (∆K), the slope of the log da/dN versus log ∆K curve is lower in 177 °C laboratory air than 24 °C laboratory air. The difference in slope results in lower values of da/dN for exposure to 177 °C laboratory air compared to room temperature laboratory air. The onset of this temperature effect is dependent upon the applied R. This temperature effect has not been observed in ultrahigh vacuum. Specimen orientation has been shown to affect the slope of the log da/dN versus log ∆K curve in the Paris regime. The damaging effect of laboratory air is more pronounced for specimens with the applied load oriented 45° to the longitudinal and long transverse directions compared to fatigue crack growth in the T-L or L-T orientations.
Introduction
Titanium alloy systems are being considered for advanced supersonic aircraft
components, because they have a higher specific strength and improved thermal stability
compared to conventional aluminum alloys. Some components on supersonic airframes, for
example skin on leading edges, may operate at temperatures greater than 130 °C for tens-of-
thousands of hours; which precludes the use of conventional aluminum alloys. The objective of
this work is to characterize the fatigue crack growth behavior of one such advanced titanium
alloy sheet, Ti - 6 Al - 2 Zr - 2 Cr - 2 Sn - 2 Mo (Ti 6-2-2-2-2) and to compare this behavior with
two more widely studied sheet materials, a β titanium alloy (Timetal 21S) and another α+β alloy
(Ti 6Al-4V). Characterization of the fatigue crack growth behavior in an active environment
(air) compared to an inert environment (ultrahigh vacuum) will be used to develop an
understanding of the environmental interactions which influence long term durability [1-4].

2
Materials Processing and Characterization
The Ti 6-2-2-2-2 alloy product studied was a 1.65 mm (0.065 inch) thick cross rolled
sheet. The sheet was hot rolled at 927 °C (1700 °F) and solution annealed at 899 °C (1650 °F)
for 30 minutes, followed by an aging treatment at 510 °C (950 °F) for 10 hours (in all cases the
sheet material was processed in packs of several sheets which were air cooled following all heat
treatments). The chemical composition and β transus are shown in Table I. The as-received
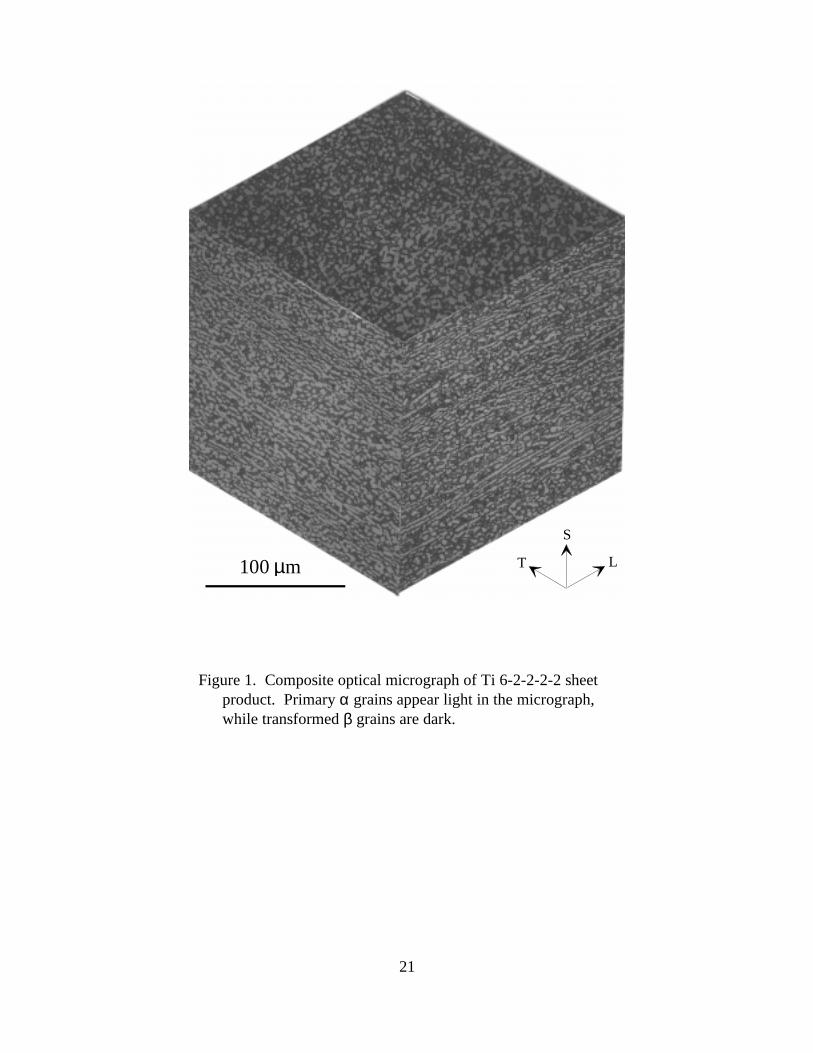
sheet contained primary α grains of less than 10 µm, with transformed β colonies, as shown in
Figure 1 (the primary α grains appear lighter than the transformed colonies). Grains were
pancake shaped, elongated in the longitudinal (L) and long transverse (T) directions. While this
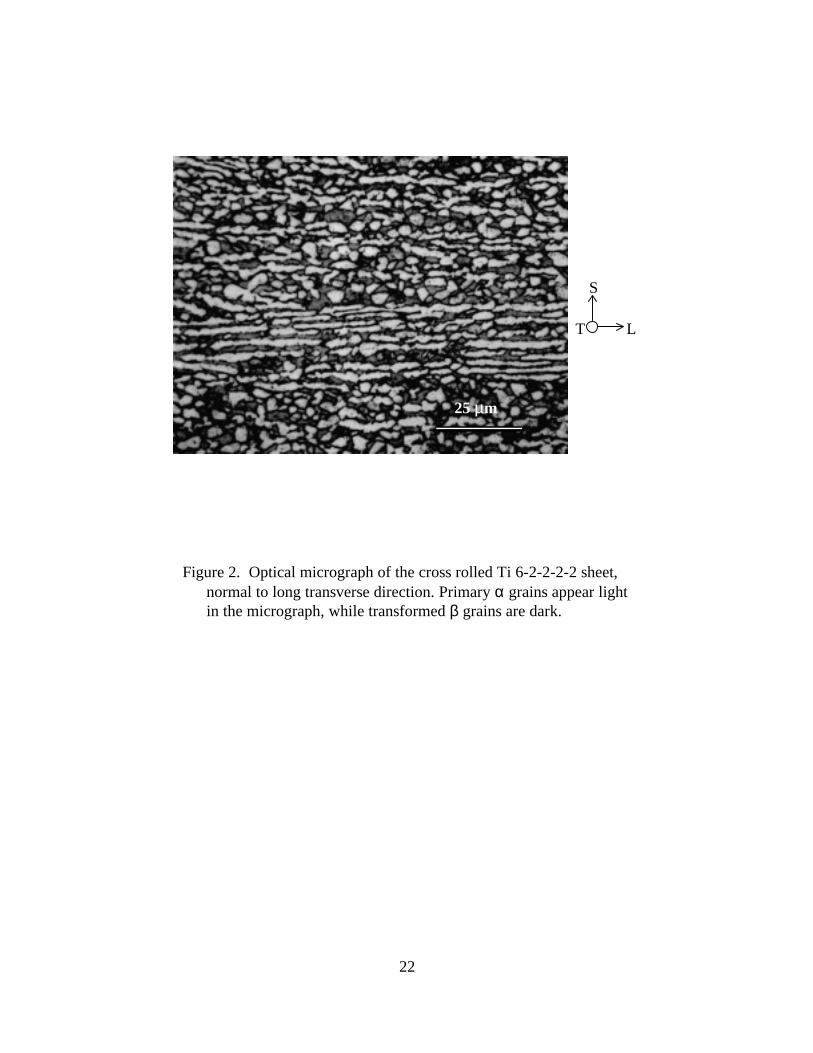
microstructure was fairly uniform, there was evidence of some highly elongated primary α
grains, Figure 2. The Ti 6-2-2-2-2 alloy contains a higher fraction of β phase than does the near
α (lean in retained β) Ti 6Al-4V alloy, which has a small amount of acicular α and some
intergranular β. Chemical compositions of these alloys are given in Table I. Grain sizes, phase
composition, and morphology of the three alloys are listed in Table II.
Table III summarizes room temperature L and T mechanical properties for Ti 6-2-2-2-2,
Timetal 21S, and Ti 6Al-4V. The Timetal 21S, β-Ti alloy, exhibits the greatest ultimate (σUTS)
and yield (σys) strengths followed by the α+β alloy, Ti 6-2-2-2-2, and the near α Ti 6Al-4V
alloy. The additional β present in the Ti 6-2-2-2-2, results in a significant increase in strength,
compared to the near α alloy Ti 6Al-4V. The elastic modulus (E) for the three sheet products
does not follow the same trend, as does the strength in the longitudinal and transverse axes. Ti 6-
2-2-2-2 was found to have the highest modulus followed by the Ti 6Al-4V and the Timetal 21S
sheets.
Rolled α+β alloys develop a textured microstructure with preferential alignment of the
basal planes (0002) in the hexagonal α phase [5, 6]. A texture analysis was performed on the Ti
6-2-2-2-2 sheet and is presented in Figure 3. The maximum intensities for the (0002) normal
were found to be rotated approximately 35° from the short transverse (S) direction towards the T
and approximately 30° from the S to the L direction. The texture was examined at the middle of
the sheet thickness (t/2) as well as the t/4 plane, with both locations exhibiting a similar texture.
It is common for the (0002) poles of rolled alloys containing a hexagonal phase to be
concentrated 30 to 40° from the sheet normal in the T direction [6]. This preferential alignment

3
of (0002) has been attributed to the competition between {0002} >< 0211 slip, rotating the
basal poles toward the sheet normal and }2211{ twinning, rotating the basal poles towards the
transverse direction [6]. Since the Ti 6-2-2-2-2 sheet was cross rolled, the basal planes were
rotated 30° to 40° towards both the L and T axes from the S axis. The observed texture produced
basal planes of the α phase oriented nearly equally with respect to the L and T directions.
Consequently, a crack growing normal to the tensile axis in a T-L oriented (T tensile axis with
the crack growing in the L direction) fatigue crack growth specimen would encounter roughly
the same microstructure as a crack growing normal to the tensile axis in a L-T oriented (L tensile
axis with the crack growing in the T direction) specimen. Therefore, comparison of the fatigue
crack growth behavior for only T-L and L-T oriented mechanical test specimens is not adequate
to evaluate the effect of texture on the fatigue crack growth behavior for the cross rolled Ti 6-2-
2-2-2 sheet product. Accordingly, fatigue crack growth rate tests for specimens with the applied
load oriented 45° to the longitudinal and long transverse directions will also be presented.
Experimental
All fatigue crack growth testing was performed using computer-controlled, closed-loop,
servo-hydraulic machines, operating under load control, and using a sinusoidal waveform.
Laboratory air and ultrahigh vacuum testing was conducted at room (24 °C) and elevated
temperature (177 °C). Inert environment testing was conducted in an ultrahigh vacuum, metal-
to-metal sealed, stainless steel chamber with a baseline pressure less then 7 x 10⁻⁷ Pa (< 5 x 10⁻⁹
Torr). A platinum electrode furnace contained in the vacuum chamber was used for elevated
temperature testing for the inert environment.
Fatigue crack growth tests were conducted using eccentrically-loaded single edge notch
tensile (ESE(T)) specimens (formally known as extended compact tension, EC(T)), shown in
Figure 4. The final thickness (B) of the specimens tested in this study was 1.52 mm. Crack-tip
stress-intensity factor (K) controlled testing was performed by continuously determining crack
length (a) using a compliance based measurement technique. Displacement measurements were
made using either a clip gage placed across the crack mouth using integrally machined knife
edges, shown in detail A of Figure 4, or a strain gage bonded to the back-face surface of the
specimen, shown in Figure 4. All near-threshold tests were conducted with a strain gage bonded

4
to the back-face surface of the specimen to eliminate anomalous crack-tip loading which can be
introduced when using a clip gage. Automated crack length determinations make it possible to
vary the amplitude of a sinusoidal load spectra in order to obtain the desired cyclic-stress-
intensity factor (∆K) during fatigue testing. Compliance and stress-intensity factor solutions for
the ESE(T) specimen are presented in Appendix A.
To verify automated compliance based crack length determinations, visual surface crack
length measurements were performed periodically during the tests using a 20X telescope
mounted on a traveling stage with a resolution of ± 25 µm (± 0.001 inch) for tests conducted in
lab air, and using a long focal length microscope (≈ 400X) for tests conducted in the vacuum
chamber. Following each test, the visual crack length measurements and a final fracture surface
crack length measurement were used to make small (typically 0.5 % error) corrections to the
compliance based crack length determinations by linear interpolation.
Fatigue crack growth rate data was generated by performing both K-increasing and K-
decreasing tests at a constant stress ratio (R), in accordance with ASTM standard E 647 [7]. K-
decreasing tests were conducted to the fatigue crack growth threshold (defined as a fatigue crack
growth rate, da/dN, approximately 10-10 m/cycle) at a normalized K-gradient (C) of -0.079 mm-1
(-2 in-1). All K-increasing tests were conducted at a C of 0.16 mm-1 (4 in-1). Two K-increasing
tests were performed in laboratory air to insure reproducibility. Additionally, a portion of the
data generated during the K-decreasing test was duplicated during a K-increasing test to insure
reproducibility for these two test profiles. The test parameters (i.e., frequency and C) were
consistent from specimen to specimen in order to quantify the effect of material chemistry, stress
ratio, temperature, specimen orientation and test environment on fatigue crack growth rate.
Decreasing-∆K tests were also performed using a constant-Kmax (increasing-R) method
[8, 9]. These increasing-R tests result in high R (typically R > 0.9) as threshold is approached.
During constant-Kmax testing, the minimum applied stress-intensity factor (Kmin) increases with
decreasing ∆K, making it possible to maintain a Kmin which is greater than the crack-opening
stress-intensity factor (Kop), resulting in closure-free near-threshold fatigue crack growth rates [8,
9].
To make direct comparisons of fatigue crack growth rates for specimens tested under
various conditions (stress ratio, temperature, orientation and environment), the extrinsic effect of
crack closure has to be considered. Closure is produced by the premature contact of fatigue-

5
crack surfaces, resulting in an effective ∆K (∆Keff = Kmax - Kop) that is less than the applied ∆K
[10]. Load-displacement data from either the back-face or front-face displacement gage was
analyzed using the offset technique described in ASTM standard E 647 [7] to determine opening
loads. To insure the accuracy of the automated opening load determinations, additional load-
displacement data were acquired and an opening load was determined using Elber’s reduced-
displacement technique [11]. An opening load determined using the reduced-displacement
technique was compared to five opening load predictions determined by the automated system
for five selected offset percentages (1, 2, 4, 8, and 16%) at the same applied ∆K value. The
offset percentage, which resulted in the best correlation of Kop with the reduced-displacement
result, was used to calculate the appropriate ∆Keff.
Results and Discussion
To develop a comprehensive understanding of the fatigue crack growth characteristics for
a thin sheet Ti 6-2-2-2-2 alloy, several factors that can affect fatigue crack growth rate have been
examined. In addition, the fatigue crack growth behavior of Ti 6-2-2-2-2 at room temperature
has been compared to two more commonly used titanium alloys. The results are detailed in five
sections below; 1) Comparison of Room Temperature da/dN, 2) Effect of Stress Ratio, 3) Effect
of Temperature, 4) Effect of Crack Path Orientation, and 5) Effect of Environment. A sixth
section, which includes fractography, has been supplied to aid in identifying the causal effects
for the test conditions examined.
Comparison of Room Temperature da/dN
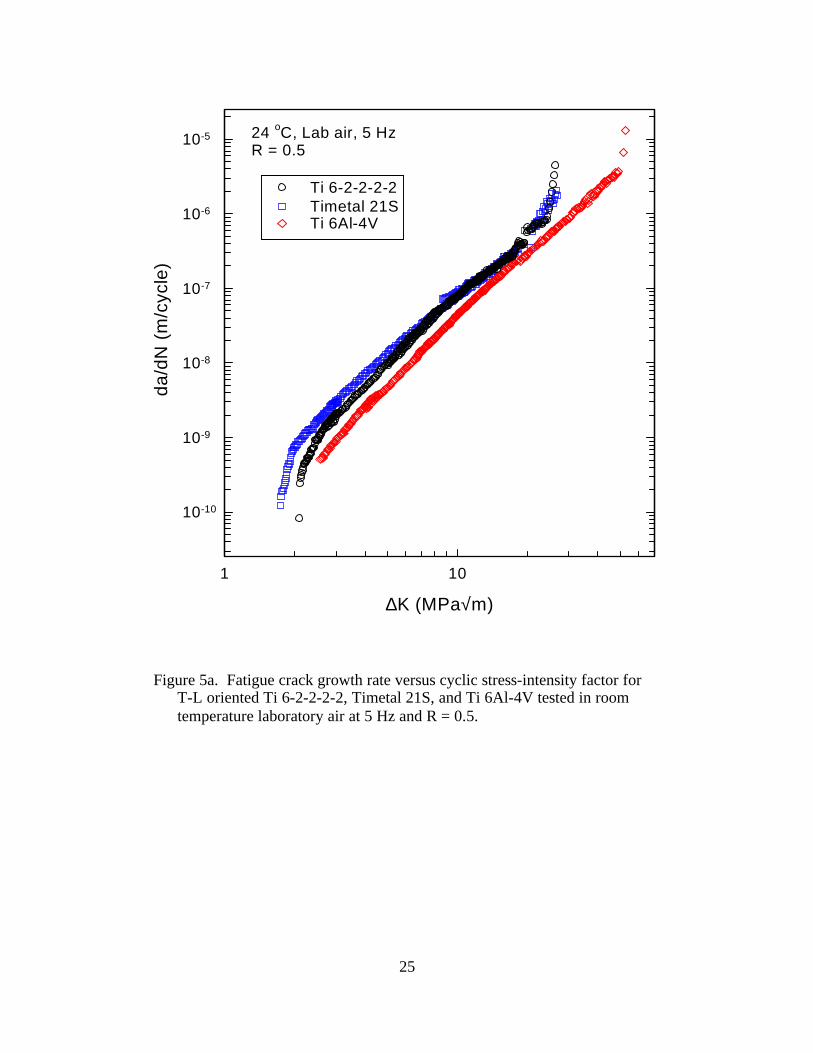
Figure 5a shows results for T-L oriented Ti 6-2-2-2-2, Timetal 21S, and Ti 6Al-4V
fatigue crack growth rate tests conducted in room temperature laboratory air at a frequency of 5
Hz and R = 0.5. No detectable crack closure was observed, using compliance methods, for all
three materials during R = 0.5 tests. Therefore, the differences in fatigue crack growth
characteristics observed in Figure 5a are believed to be a result of intrinsic properties and not
extrinsic crack wake effects (closure). For ∆K less than approximately 4 or 5 MPa√m, the
intrinsic fatigue crack growth rate of Ti 6-2-2-2-2 was lower than Timetal 21S. For ∆K > 4 or 5
MPa√m, the fatigue crack growth characteristics of Ti 6-2-2-2-2 and Timetal 21S were nearly

6
identical. Both higher strength alloys (Ti 6-2-2-2-2 and Timetal 21S) exhibited increased fatigue
crack growth rates compared to Ti 6Al-4V. In the region of rapid crack growth rates (∆K > 20
MPa√m), the alloys having lower fracture toughness (Ti 6-2-2-2-2 and Timetal 21S) compared to
Ti 6Al-4V exhibited accelerated intrinsic da/dN.
The fatigue crack growth behavior of Ti 6Al-4V and Timetal 21S determined in this
study are compared with results from the literature in Figures 5b and 5c, respectively. Figure 5b
is a plot comparing room temperature laboratory air fatigue crack growth rate data for the present
1.52 mm thick Ti 6Al-4V sheet with 9.65 mm thick Ti 6Al-4V plate at R = 0.5 [12]. For ∆K <
13 MPa√m, similar fatigue crack growth characteristics are observed for Ti 6Al-4V sheet and
plate. For ∆K > 13 MPa√m, the fatigue crack growth rate for the sheet product is lower than the
fatigue crack growth rate for the plate material. These results are consistent with previously
reported observations [13]. Figure 5c shows fatigue crack growth characteristics for Timetal 21S
for ∆K > 7 MPa√m in room temperature laboratory air. Here, da/dN data at f = 5 Hz are in
excellent agreement with data from the literature at f = 30 Hz [14]. Results shown in Figure 5c
reveal no effect of loading frequency (5 and 30 Hz) for ∆K > 7 MPa√m.
Effect of Stress Ratio
Figure 6 shows room temperature laboratory air fatigue crack growth rate data for Ti 6-2-
2-2-2 ranging from 10-11 to 10-5 m/cycle for tests conducted at R = 0.1 (circle symbols) and R =
0.5 (square symbols). Also plotted in Figure 6 are the R = 0.1 data corrected for crack closure
(diamond symbols). The data represented by each symbol in Figure 6 are results for three tests.
A downward arrow is used to indicate the start of a K-decreasing test for each stress ratio and
upward arrows are used to indicate the start of two K-increasing tests for each stress ratio.
Fourteen load-displacement measurements, noted as 1 through 14 in Figure 6, were acquired
during the R = 0.1 tests. For each load-displacement measurement, an opening load was
determined using Elber’s reduced-displacement method [11]. Some representative load versus
strain deviation curves are supplied in Appendix B. Figures B1 and B2 are two reduced-strain
curves generated for the R = 0.1 tests labeled in Figure 6. Opening loads determined from the
reduced-displacement method are compared with opening load values for five different offset
levels [7] calculated by the computer-controlled testing system. The opening loads determined

7
from the fourteen load-displacement measurements at R = 0.1 compared most favorably with the
opening load determinations at an offset of 1 %. Therefore, the closure corrected R = 0.1 (∆Keff)
results shown in Figure 6 were calculated using the opening loads at a 1 % offset. The offset and
reduced-displacement techniques were also used to determine opening loads for the R = 0.5
fatigue crack growth tests. Acquisition of ten load-displacement measurements are noted as A
through J in Figure 6. No evidence of crack closure was observed during fatigue crack growth
testing at R = 0.5, as revealed by the vertical load versus strain deviation plot shown in Figure
B3. The excellent correlation between the constant R = 0.5 test data and the ∆Keff (R = 0.1)
based determinations, shown in Figure 6, and the fact that no crack closure was detected during
constant R = 0.5 tests suggests that the constant R = 0.5 data represents the closure-free
(intrinsic) fatigue crack growth characteristics of Ti 6-2-2-2-2 in room temperature laboratory
air. However, it will be shown later, that the compliance techniques have not accounted for all of
the closure present for these tests.
The fatigue crack growth characteristics of T-L oriented Ti 6-2-2-2-2 for the lower-Paris
to threshold regime (∆K ≤ 10 MPa√m) are shown in Figure 7 for a wide range of stress ratios.
Decreasing-∆K tests were conducted at constant Kmax, R ranging from approximately 0.15 to
0.95, as well as constant stress ratios, R = 0.1 and 0.5. Three data points on the constant-Kmax
curves in Figure 7 for ∆K between 5.5 and 9.5 MPa√m have been encircled. At these three data
points, additional data with similar stress ratios are present for constant-R tests. Here, excellent
agreement in da/dN is observed for the different test methods. For example, similar fatigue
crack growth rates are observed for the constant-Kmax (11 MPa√m) testing at R = 0.5 and 0.15
compared to fatigue crack growth rates obtained for constant-R testing at R = 0.5 and 0.1,
respectively. At very low values of ∆K, the three constant-Kmax tests shown in Figure 7 produce
accelerated da/dN compared to the two constant-R tests. A line of constant da/dN at 1 x 10⁻¹⁰
m/cycle has been indicated on Figure 7. According to ASTM E 647 [7] this fatigue crack growth
rate can be used to estimate fatigue crack growth threshold (∆Kth). The three values of ∆K
identified along the x-axis in Figure 7 represent the intercepts of the fatigue crack growth test
results (Kmax= 16.5 MPa√m, R = 0.5, and R = 0.1) with da/dN = 1 x 10⁻¹⁰ m/cycle. Estimated
intercepts of the five curves shown in Figure 7 as well as for constant-Kmax tests of 3.85 and 6.6
MPa√m with 1 x 10⁻¹⁰ m/cycle are presented as ∆Kth in Table IV. This data indicates a

8
decreasing ∆Kth with increasing Kmax. As shown in Figure 6, the difference in ∆Kth for R = 0.1
and 0.5 appears to be a result of crack closure. However, the further decrease in ∆Kth observed
for the three closure-free Kmax tests presented in Figure 7 are consistent with recent research [15,
16] indicating an effect of applied Kmax and not consistent with the view of a single intrinsic
fatigue crack growth rate curve [10].
One potential effect that could influence the results of the constant-Kmax tests presented in
Figure 7 is an apparent decrease in toughness with crack length. To examine this effect in Ti 6-
2-2-2-2, several specimens were fatigue cracked to different lengths and then pulled to failure at
a constant crosshead rate. Results of apparent fracture toughness (Kc) versus a/W are presented
for four T-L oriented Ti 6-2-2-2-2 specimens in Figure 8. Here an obvious trend of decreasing
stress-intensity factor at failure is observed with increasing crack length. To minimize any
potential effect of this observation, the fatigue results presented within this paper are only shown
for values of a/W less than 0.75 and the applied Kmax was always less than half the apparent
fracture toughness. Additionally, the results for constant-Kmax tests presented in Figure 7 and for
subsequent results were acquired using multiple specimens, and the trend observed (decreasing
∆Kth with increasing Kmax) could not be related to the crack length or apparent fracture toughness
for each test.
Values of ∆Kth plotted against applied Kmax in Figure 9 (represented as circle symbols)
reveal two distinct regions [17, 18]. For low values of Kmax (< 4.6 MPa√m), a relatively large
increase in ∆Kth is observed with decreasing Kmax (dashed linear regression line). For values of
Kmax greater than approximately 4.6 MPa√m, a more subtle yet distinct decrease in ∆Kth is
observed for increasing Kmax (dotted linear regression line). Here, the large increase in ∆Kth with
decreasing Kmax (for Kmax < 4.6 MPa√m) is dominated by crack closure, while the subtle
decrease in ∆Kth (Kmax > 4.6 MPa√m) is a true Kmax effect [17, 18]. The results shown in Figure
9 suggest that closure was present at threshold for R = 0.5 (∆K = 2.09 MPa√m, Kmax = 4.18
MPa√m), even though no closure was measured using the far-field displacement techniques
described above. This discrepancy is believed to be due to a lack of crack-tip displacement
measurement resolution using far-field displacement gages such as a back-faced strain gage or
front-face clip gage. By extending the regression line for the Kmax-affected region to values of

9
Kmax < 4.6 MPa√m, closure-free values of ∆Kth (∆Kth, eff) can be predicted (represented as
triangle symbols in Figure 9).
Curves of ∆K versus Kmax were generated for a total of twenty values of da/dN from 1 x
10-10 to 1 x 10⁻⁷ m/cycle for Ti 6-2-2-2-2. Figure 10 contains data for four of these values of
da/dN. At each value of da/dN data are fit using two linear regression lines. At low values of
Kmax, a relatively large increase in ∆K is observed with decreasing Kmax (dashed linear regression
lines). For larger values of Kmax, a distinct change in slope is observed (dotted linear regression
lines). To delineate between the two regions of crack growth, solid line segments are drawn
connecting the intercepts between the closure-dominated (Region A, dashed lines) and closure-
free (Region B, dotted lines) data. Plots of ∆K versus Kmax can thus be used as an empirical
method to determine whether fatigue crack growth rate data are influenced by crack closure
without relying on displacement measurements from a far-field displacement gage.
Figure 11 is a plot of da/dN versus ∆K for tests at three different conditions (constant
Kmax = 22 MPa√m, R = 0.1, and R = 0.5). Also shown are two ∆Keff curves for the two constant-
R tests that were generated using Kop determined by the empirical threshold method described
above for each of the twenty values of da/dN selected. These curves are considered as a
boundary for closure affected data. All of the data points to the right of the two closure-free
curves are affected by closure and the data to the left of the curves are not affected by closure.
Values of da/dN, applied ∆K and closure-free ∆K for da/dN less than 1 x 10⁻⁷ m/cycle for R =
0.5 and 0.1 are presented in Appendices C and D, respectively. It should be noted that the
empirical threshold method results are contrary to standard ASTM crack closure determinations
shown above. Figure 11 shows that near-threshold (∆K < 3.5 MPa√m) fatigue crack growth
rates at R = 0.5 are influenced by crack closure.
Effect of Temperature
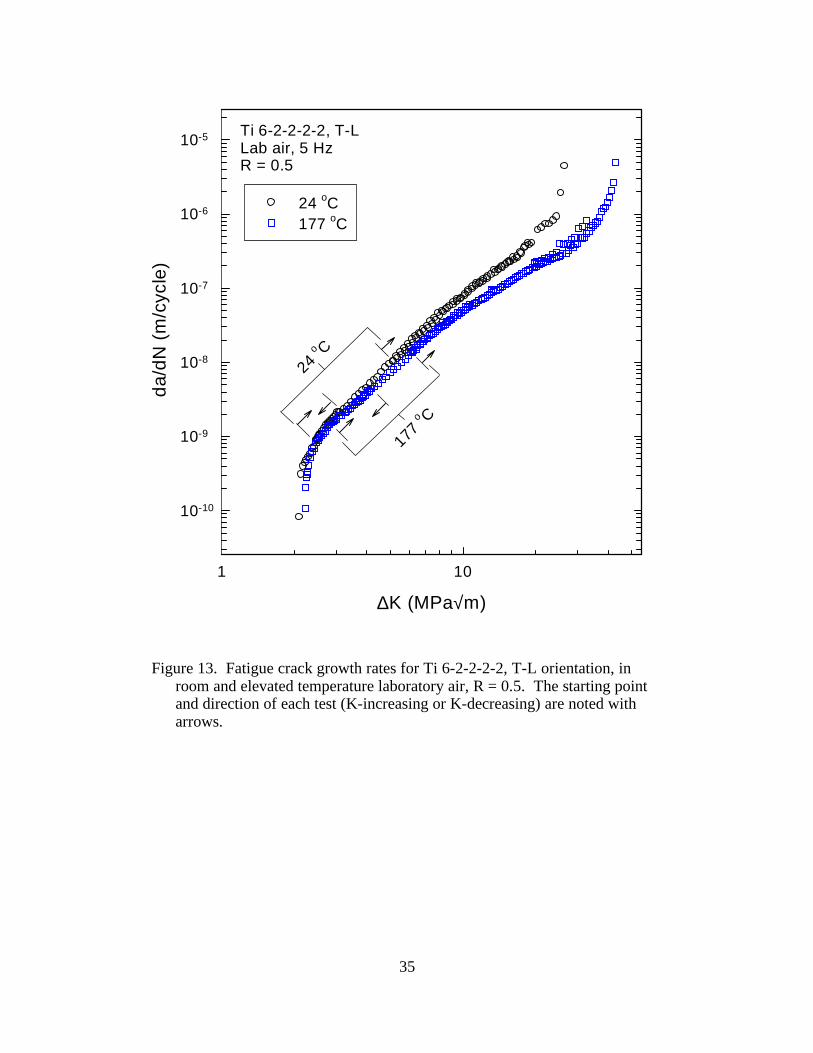
Figures 12 and 13 compare room temperature (24 °C) and elevated temperature (177 °C)
fatigue crack growth rate data at R = 0.1 and R = 0.5, respectively. For R = 0.1 (Fig. 12), the
fatigue crack growth rates at 24 °C and 177 °C are similar for ∆K < 25 MPa√m. For ∆K > 25
MPa√m, room temperature fatigue crack growth rates are accelerated compared to that observed
at 177 °C. The R = 0.5 fatigue crack growth rate characteristics shown in Figure 13 reveals

10
room temperature da/dN is accelerated compared to crack growth at 177 °C for ∆K > 7 MPa√m.
A comparison of the results shown in Figures 12 and 13 suggests a stronger influence of
temperature on fatigue crack growth rates at R = 0.5. Over the entire range of ∆K examined, no
closure was observed for testing at R = 0.5 using far-field compliance based closure techniques;
however, closure was measured for R = 0.1. To further evaluate the fatigue crack growth
behavior in the lower-Paris to threshold regime at 177 °C, several constant-Kmax decreasing-∆K
tests were performed (Fig. 14). Threshold ∆K values at 177 °C for each test are shown in Table
V. The 24 °C and 177 °C threshold data plotted as ∆Kth versus Kmax in Figure 15, exhibit similar
trends for the closure-dominated (dashed linear regression lines) and closure-free (dotted linear
regression lines) regions. Figure 16 is a plot of ∆K versus Kmax data at a fatigue crack growth
rate of 1 x 10⁻⁸ m/cycle. Temperature (24 to 177 °C) is shown to have little influence on the
closure-dominated (dashed linear regression lines) region. However, for the closure-free data
(dotted linear regression lines), a temperature dependence is indicated as a difference in slope for
the data at the two temperatures examined. Applied Kmax has less of an influence on fatigue
crack growth behavior at 177 °C than at room temperature (Fig. 16). As was done at room
temperature, plots of ∆K versus Kmax were produced at twenty values of da/dN between 1 x 10⁻¹⁰
and 1 x 10⁻⁷ m/cycle. From these plots closure-free fatigue crack growth rate data for R = 0.1
and 0.5 were generated. Values of da/dN, applied ∆K and closure-free ∆K for da/dN less than 1
x 10-7 m/cycle for R = 0.5 and 0.1 tests at 177 °C are supplied in Appendices E and F,
respectively.
Figures 12 and 13 indicate an increase in temperature from 24°C to 177°C can result in a
decrease in da/dN for Ti 6-2-2-2-2 in laboratory air. While increasing temperature has been
shown to produce an increase in da/dN for several materials [19, 20], previous studies of α+β
titanium alloys have also observed a decrease in da/dN with increasing temperature for certain
conditions [21, 22]. Decreasing da/dN with increasing temperature has only been observed over
a selected temperature range (approximately 0 to 150°C)[21]. Several reasons for this effect
have been proposed [21, 22]; however, there has been no definitive evidence to support any one
theory. This will be discussed in further detail in a later section (Effect of Environment).

11
Effect of Crack Path Orientation
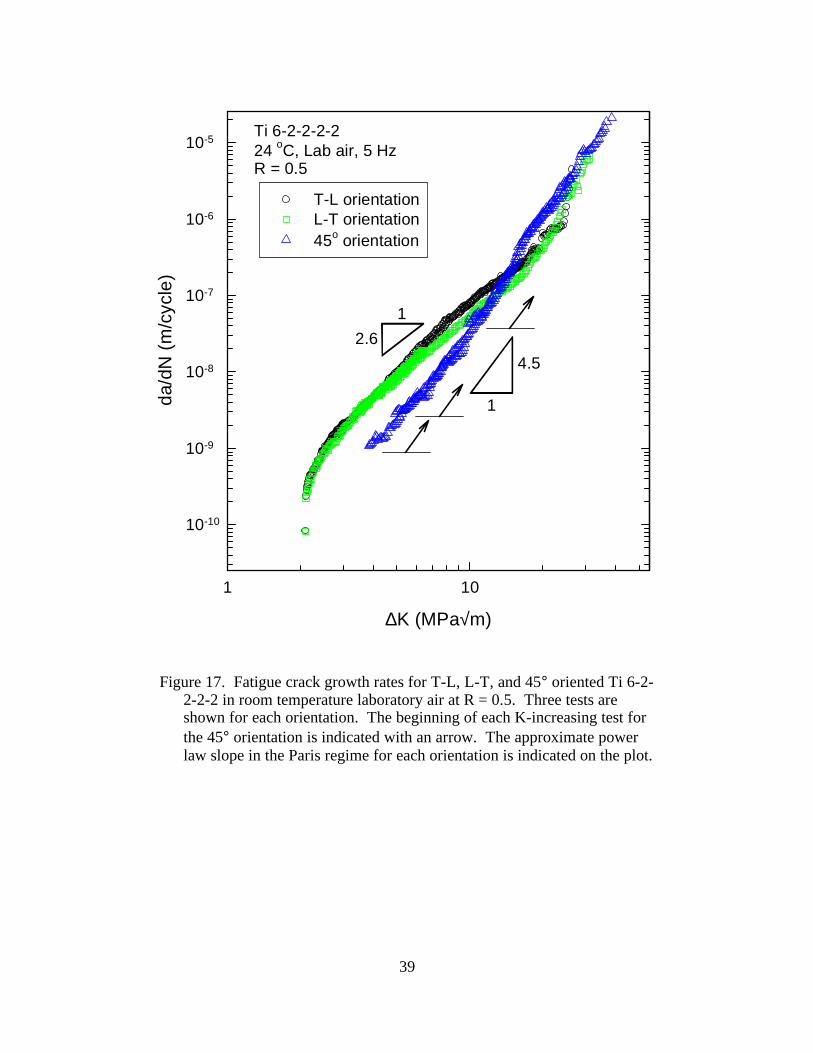
Fatigue crack growth rates of T-L, L-T and 45° oriented Ti 6-2-2-2-2 specimens at room
temperature and T-L and 45° oriented Ti 6-2-2-2-2 specimens at 177 °C are shown in Figures 17
and 18, respectively. At 24 °C, T-L and L-T orientations exhibit similar fatigue crack growth
rate characteristics except at moderate values of ∆K (between 7.7 and 16.5 MPa√m) where the
T-L orientation was found to have a slightly higher (approximately 1.5 times greater) da/dN
compared to the L-T orientation. The fatigue crack growth behavior observed for the 45°
orientation is different than the behavior for either the T-L or L-T orientations (Fig. 17). The
T-L and L-T Paris regime fatigue crack growth curves are approximately described by a ∆K2.6
power law while the 45° orientation is characterized by a single ∆K4.5 power law. The fatigue
crack growth characteristics at elevated temperature (Fig. 18) are described by a ∆K2.2 power law
for the T-L orientation and a ∆K3.5 power law for the 45° orientation.
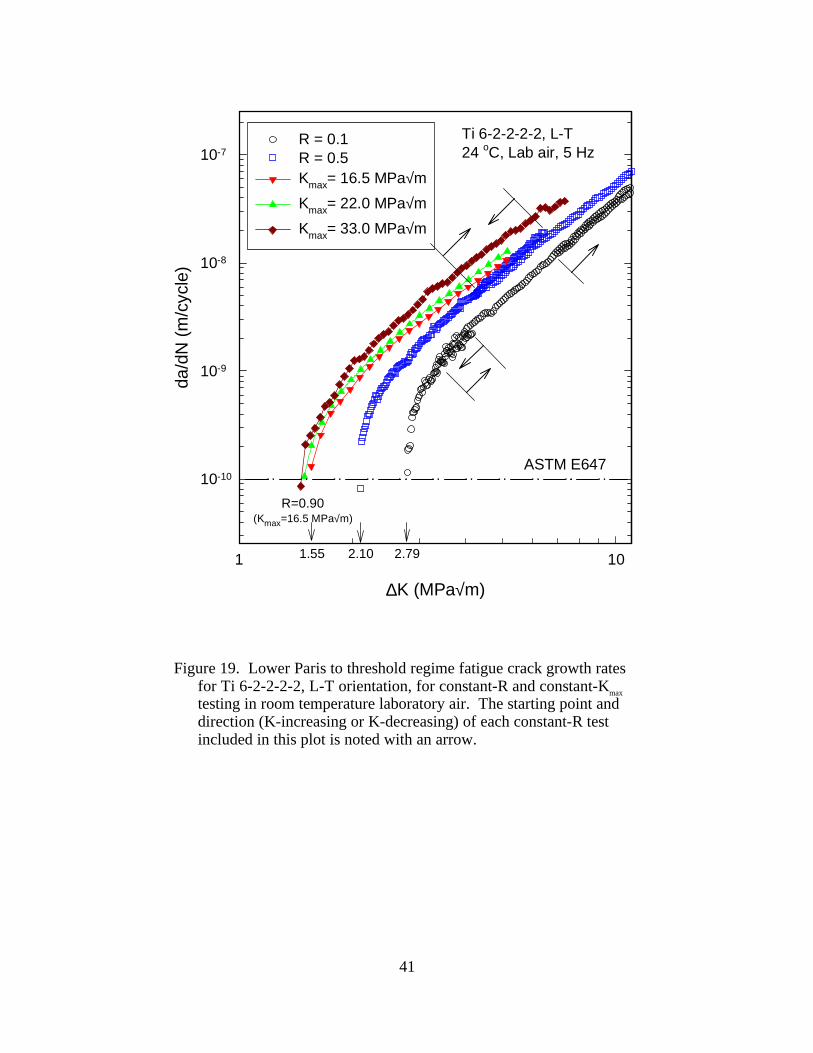
Figure 19 is a plot of lower-Paris to threshold regime da/dN versus ∆K data for L-T
oriented specimens. As was observed for the T-L orientation, ∆Kth is shown to decrease with
increasing Kmax. Table VI lists values of ∆Kth for each of the tests represented in Figure 19. The
∆Kth values are approximated using the ASTM guideline of 1 x 10⁻¹⁰ m/cycle [7]. Figure 20 is a
plot of ∆Kth versus Kmax for the L-T data listed in Table VI and T-L data listed in Table IV.
Similar trends are observed for the two orientations, indicating nearly identical behavior for both
the closure-dominated (dashed linear regression lines) and closure-free (dotted linear regression
lines) regions. These observations have been made for values of da/dN up to 7 x 10⁻⁹ m/cycle.
The similarity between the T-L and L-T oriented specimens can be attributed to the cross-rolling
procedure used to fabricate the Ti 6-2-2-2-2 sheet. The basal planes in the α phase are
preferentially rotated 30 to 40° towards both the longitudinal and long transverse axes from the
short transverse axis (Fig. 3). Consequently, fatigue cracks growing in T-L and L-T specimens
will intersect nearly identical crystallographic morphologies resulting in similar fatigue crack
growth behavior.
The difference in the ∆K power law for 45° oriented specimens compared to either T-L
or L-T oriented specimens (Figs. 17 and 18) is similar to results previously presented for highly
textured Ti 6Al-4V [23, 24]. In this previous study, the fatigue crack growth behavior of
specimens machined from a rolled bar product with six different orientations were examined. A

12
∆K2.5 power law approximated the Paris regime fatigue crack growth data for three of the
orientations, while a ∆K(3.1 to 4.1) power law characterized the other three orientations. The lower
exponent was observed when the α grains were oriented such that the maximum applied shear
stress was very close to the primary slip plane in the slip direction [23, 24]. However, when the
crystallographic slip systems were not aligned with the crack tip shear stresses, a larger exponent
for the power law was obtained [23, 24].
Effect of Environment
Figure 21 compares room and elevated temperature fatigue crack growth characteristics
of Ti 6-2-2-2-2 in laboratory air and ultrahigh vacuum (< 7 x 10⁻⁷ Pa) for R = 0.5. Fatigue crack
growth rates in laboratory air are three to five times greater at room temperature and two to four
times greater at 177 °C compared to ultrahigh vacuum for 5 MPa√m < ∆K < 17 MPa√m.
Environmental effects are minimized at rapid crack growth rates (∆K > 17 MPa√m); where room
temperature and elevated temperature da/dN in laboratory air converge with their respective
vacuum fatigue crack growth rates. For 7 MPa√m < ∆K < 17 MPa√m, a temperature effect is
observed in laboratory air while there is little difference in fatigue crack growth rate data
obtained at 24 and 177 °C in ultrahigh vacuum. This suggests that the temperature effect
observed in laboratory air, for ∆K < 17 MPa√m, is related to the environmentally assisted
processes developed in laboratory air. However, the temperature effect for ∆K > 17 MPa√m is a
result of an apparent increase in toughness as temperature is increased [13].
As stated earlier, a similar temperature effect, i.e. decreasing da/dN with increasing
temperature, has been observed for α+β titanium alloys in this temperature range [21, 22].
While several potential causes were discussed, these papers proposed that stress induced hydride
formation along α / β interfaces within the cyclic plastic zone is the most likely cause. It has
been argued in these references that as temperature is increased above room temperature to
approximately 150°C, the solubility of hydrogen within the titanium matrix will be increased
sufficiently to reduce the potential for hydride formation. This argument can be used to help
support the existence of a temperature effect in laboratory air while having no temperature effect
in ultrahigh vacuum. However, if this mechanism were operative, one would expect to see
evidence of intergranular fatigue fracture in laboratory air at room temperature and a more

13
ductile appearance at 177°C. Fractography presented in the section entitled Fractographic
Observations does not support this argument.
Fatigue surfaces were produced in a high purity water vapor environment of 67 Pa at 24
and 177°C. The fatigue surfaces were then studied using X-ray Photoelectron Spectroscopy
(XPS). Figures 22a and b shows the O1s photoelectron spectra (represented by open circles) for
the surfaces produced at 24 and 177°C, respectively. Each O1s spectra was curve fit using
constituent gaussian peaks (dashed lines) and the sum of the constituent peaks are also presented
(solid lines). At 24°C (Fig. 22a) and 177°C (Fig. 22b), three constituent peaks are identified.
The centers for each of the three constituent peaks are in good agreement with published binding
energies for oxygen in adsorbed water (533.5 eV), an hydroxide (532.0 eV) and an oxide (530.5
eV) (identified with dotted lines) [25, 26]. The height of the constituent peaks identified as
binding energies of oxygen in water and an hydroxide are found to have nearly the same ratio to
one another at 24 and 177°C. However, the relative height of the peak associated with the
oxygen binding energy in an oxide is greater at 177°C than at room temperature. This indicates
that an hydroxide film dominates the surface when exposed to a water vapor environment at
24°C, while an oxide can readily form at 177°C. Therefore, it would appear that the temperature
effect observed for fatigue crack growth rate in laboratory air is a direct result of the surface film
formed at the growing fatigue crack. It is unclear if the different surface films directly affect the
mechanical behavior of the crack tip or the increased oxide formed on the crack surfaces limit
the amount of hydrogen absorbed in the cyclic plastic zone.
Figure 23 compares the fatigue crack growth characteristics of 45° oriented specimens in
laboratory air and ultrahigh vacuum at room temperature. The ultrahigh vacuum data in Figure
23 represents two fatigue crack growth rate tests. During the K-increasing test the fatigue crack
propagated at an angle of approximately 15° to the loading axis normal. To determine the
reproducibility of the test, a K-decreasing (C = -0.079 mm-1) test was conducted on the same
specimen. The propagating fatigue crack remained within 8° of the loading axis normal for the
K-decreasing test. While a small difference in fatigue crack growth rates is shown for 7 MPa√m
< ∆K < 10 MPa√m (Fig. 23), the general fatigue crack growth behavior for the two tests are very
consistent. A comparison of the vacuum and laboratory air fatigue crack growth characteristics
shows minimal environmental effect for ∆K > 10 MPa√m. However, for ∆K < 10 MPa√m, a

14
strong environmental effect is observed. For ∆K = 7 MPa√m, the fatigue crack growth rate for
the 45° orientation is accelerated by a factor of twenty in air compared to vacuum. A similar
comparison for the T-L orientation at 24 °C (Fig. 21), reveals an increase by a factor of three in
air rates compared to vacuum (da/dN at ∆K = 7 MPa√m).
Fractographic Observations
Fatigue crack surfaces were examined using a scanning electron microscope (SEM).
Figures 24a and b are micrographs showing fatigue crack surfaces produced in laboratory air for
∆K = 19.8 MPa√m, R = 0.5 and 5 Hz at room and elevated temperature, respectively. Fatigue
surfaces produced at room temperature (Fig. 24a) exhibit a ductile appearance. At 177 °C (Fig.
24b), much of the fatigue surface was similar to that produced at room temperature. However,
there were also smooth regions (marked with arrows on Figure 24b) running parallel to the crack
growth direction. These smooth transgranular facets are present between the t/4 and 3t/4 planes
through the specimen thickness. These flat regions are most prevalent in the regions where
groups of elongated α grains were observed (Fig. 2). Differences in the fatigue surfaces are
more apparent when viewed at higher magnification (Figs. 25a and b). Here, ductile tearing
features are clearly present at room temperature (Fig. 25a), with mating features present on the
conjugate surface. Examination of the transgranular facets at elevated temperature reveals the
presence of parallel slip traces oriented approximately 30° from the crack growth direction (Fig.
25b). These observations for the smooth regions are consistent with quasi-cleavage of the
elongated primary α [27]. Due to the highly textured nature of this material and the grouping of
elongated primary α grains, these smooth regions can consist of cleavage facets for several
grains.
Fatigue surfaces produced in ultrahigh vacuum were also examined to distinguish the
effects of temperature and environment. Figures 26a and b are micrographs for specimens tested
in ultrahigh vacuum at R = 0.5 and 5 Hz at room and elevated temperature, respectively. Each of
the micrographs were taken in a region where ∆K was approximately 16.8 MPa√m. Fatigue
surfaces produced at room temperature (Fig. 26a) were ductile in appearance, with ductile
features appearing similar to the fatigue surface produced at room temperature in laboratory air
(Fig. 24a). At 177 °C (Fig. 26b), small-elongated features were observed. However, these

15
features were not as large or abundant as those produced at 177 °C in laboratory air (Fig. 24b).
Examination of these surfaces at higher magnification reveals a uniform and ductile surface is
produced at room temperature and at 177°C in ultrahigh vacuum. These surfaces are comparable
to those produced in laboratory air at 24°C (Fig. 25a).
The fatigue surfaces produced at 24 °C and 177 °C in ultrahigh vacuum at 16.8 MPa√m
(Fig. 26) are very similar in appearance to one another; while those produced in laboratory air at
24 °C and 177 °C for ∆K = 19.8 MPa√m (Figs. 24 and 25) reveal distinct differences. These
observations compare favorably with the fatigue crack growth rate data presented in Figure 21.
In the inert environment, fatigue crack growth rates at 24 °C and 177 °C are roughly the same for
applied ∆K values up to approximately 17 MPa√m at R = 0.5. However, in laboratory air,
fatigue crack growth rates at 177 °C become increasingly lower with increasing ∆K compared to
fatigue crack growth rates at 24 °C for all applied ∆K greater than 7 MPa√m at R = 0.5.
Therefore, morphology of the fatigue surfaces helps to support the observations previously stated
for Figure 21. Namely, temperature between 24 °C and 177 °C has very little affect on the
intrinsic fatigue crack growth behavior of Ti 6-2-2-2-2 for ∆K < 19.8 MPa√m at R = 0.5.
However, in laboratory air, fatigue crack growth rates decrease with increasing temperature in
the Kmax- affected region.
Summary
1. For ∆K greater than 4.4 MPa√m, Ti 6-2-2-2-2 has a comparable fatigue crack growth rate
to Timetal 21S sheet. Ti 6Al-4V sheet has a lower fatigue crack growth rate than either Ti 6-2-2-
2-2 or Timetal 21S in room temperature laboratory air. In the near-threshold regime (∆K less
than 5 MPa√m) the fatigue crack growth rate was found to decrease with an increasing fraction
of α phase (i.e. da/dNTimetal 21S > da/dNTi 6-2-2-2-2 > da/dNTi 6Al-4V).
2. Fatigue crack growth rate data for several values of R or Kmax plotted as ∆K versus Kmax,
can be used to identify closure affected and closure-free fatigue crack growth rate data for Ti 6-
2-2-2-2.
3. A stress ratio effect has been observed for Ti 6-2-2-2-2 for all loading conditions. While
this effect is smaller for closure-free data than for closure-dominated data, a non-zero slope is

16
observed for all data presented as ∆K versus Kmax for a selected da/dN. The empirical technique
described in this paper makes it possible to delineate closure-free and closure-dominated Kmax
effects. This delineation is not possible using the ASTM suggested crack closure measurement
technique.
4. For ∆K greater than 7 MPa√m (R = 0.5), the fatigue crack growth rate for Ti 6-2-2-2-2 in
177 °C laboratory air is less than room temperature laboratory air. An apparent increase in
toughness with temperature is observed for ∆K > 17 MPa√m (R = 0.5) in ultrahigh vacuum.
However, a temperature dependence is not observed for ∆K < 17 MPa√m. Therefore, the
temperature dependence observed in laboratory air is a result of environmental interactions
during fatigue cycling.
5. The fatigue crack growth characteristics of cross-rolled Ti 6-2-2-2-2 sheet are dependent
upon specimen orientation. While the fatigue crack growth behavior of T-L and L-T oriented
specimens are very similar, the fatigue behavior of 45° oriented specimens are very different. In
the Paris regime, the slope of the log da/dN versus log ∆K curve is much higher for the 45°
orientation (approximated by a ∆K4.5 power law) than for the T-L and L-T orientations
(approximated by a ∆K2.6 power law). Although the 45° orientation results in a lower fatigue
crack growth rate for ∆K < 13 MPa√m than is observed for the T-L and L-T orientations, a
greater environmental degradation is also observed.
References
1.Dawson, D. B.; and Pelloux, R.M.: Corrosion Fatigue Crack Growth of Titanium Alloys in Aqueous Environments. Metallurgical Transactions A, vol. 5, 1974, pp. 723-731.
2.Bomberger, H.B.; Meyn, D.A.; and Fraker, A.C.: Environmental Effects on Titanium and Its Alloys. Titanium: Science and Technology V, Volume 4, G. Lütjering, U. Zwicker and W. Bunk eds., Deutsche Gesellschaft für Metallkunde E.V. Oberursel, 1985, pp. 2435-2454.
3.Sugano, M.; Kanno, S.; and Satake, T.: Fatigue Behavior of Titanium in Vacuum. Acta Metallurgica, vol. 37, no. 7, 1989, pp. 1811-1820.
4.Wei, R.P.; and Ritter, D.L.: The Influence of Temperature on Fatigue Crack Growth in a Mill Annealed Ti-6Al-4V Alloy. Journal of Materials, vol. 7, no. 2, 1972, pp. 240-250.
5.Peters, M.; Gysler, A.; and Lütjering, G.: Influence of Texture on Fatigue Properties of Ti-6Al-4V. Metallurgical Transactions A, vol. 15A, 1984, pp. 1597-1605.

17
6.Collings, E.W.: The Physical Metallurgy of Titanium Alloys. American Society for Metals, 1984, pp. 170-180.
7.ASTM: Standard Test Method for Measurement of Fatigue Crack Growth Rates, E 647-99. Annual Book of ASTM Standards, Vol. 03.01, 2000, pp. 591-630.
8.Herman, W.A.; Hertzberg, R.W.; and Jaccard, R.: A Simplified Laboratory Approach for the Prediction of Short Crack Behavior in Engineering Structures. Fatigue and Fracture of Engineering Materials and Structures, vol. 11, no. 4, 1988, pp. 303-320.
9.Hertzberg, R.; et al.: Simulation of Short Crack and Other Low Closure Loading Conditions Utilizing Constant Kmax ∆K-Decreasing Fatigue Crack Growth Procedures. Small-Crack Test Methods, ASTM STP 1149, J.M. Larsen, and J.E. Allison, eds., American Society for Testing and Materials, 1992, pp. 197-220.
10. Elber, W.: The Significance of Fatigue Crack Closure. Damage Tolerance in Aircraft Structures, ASTM STP 486, ASTM, 1971, pp. 230-242.
11. Elber, W.: Crack-Closure and Crack Growth Measurements in Surface-Flawed Titanium Alloy Ti-6Al-4V. NASA TN D-8010, Sep. 1975.
12. Forman, R.G.: NASAFLAGRO 2.0.
13. Broek, D.: Elementary Engineering Fracture Mechanics, 4th ed., Martinum Nijhoff, 1986, pp. 208-217, 266-272, 321-323.
14. Fanning, J.C.: Timetal®21S Property Data. Beta Titanium Alloys in the 1990’s, D. Eylon, R.R. Boyer, and D.A. Koss eds., TMS, 1993, pp. 397-410.
15.Newman, J.A.; Riddell, W.T.; and Piascik, R.S.: Effects of Kmax on Fatigue Crack Growth Threshold in Aluminum Alloys. Fatigue Crack Growth Thresholds, Endurance Limits, and Design, ASTM STP 1372, J.C. Newman, Jr. and R.S. Piascik, eds., American Society for Testing and Materials, 1999, pp. 63-77.
16. Riddell, W.T.; and Piascik, R.S.: Stress Ratio Effects on Crack Opening Loads and Crack Growth Rates in Aluminum Alloy 2024, NASA/TM-1998-206929, NASA Langley Research Center, 1998.
17. Döker, H.; and Bachmann, V.: Determination of Crack Opening Load by Use of Threshold Behavior. Mechanics of Fatigue Crack Closure, ASTM STP 982, J.C. Newman, Jr. and W. Elber, eds., American Society for Testing and Materials, 1988, pp. 247-259.
18. Smith, S.W.; and Piascik, R.S.: An Indirect Technique for Determining Closure-Free Fatigue Crack Growth Behavior. Fatigue Crack Growth Thresholds, Endurance Limits, and Design, ASTM STP 1372, J.C. Newman, Jr. and R.S. Piascik, eds., American Society for Testing and Materials, 1999, pp. 109-122.
19. Wei, R.P.: Fatigue-Crack Propagation in a High-Strength Aluminum Alloy. International Journal of Fracture Mechanics, vol. 4, no. 2 , 1968, pp. 159-168.
20. Wei, R.P.: Some Aspects of Environment-Enhanced Fatigue-Crack Growth. Engineering Fracture Mechanics, vol. 1, 1970, pp. 633-651.
21. Pao, P.S.; and Wei, R.P.: Hydrogen-Enhanced Fatigue Crack Growth in Ti-6Al-2Sn-4Zr-2Mo-0.1Si. Titanium: Science and Technology V, Volume 4. G. Lütjering, U. Zwicker and W. Bunk eds., Deutsche Gesellschaft für Metallkunde E.V. Oberursel, 1985, pp. 2503-2510.
22. Evans, W.J.; and Gostelow, C.R.: The Effect of Hold Time on the Fatigue Properties of a β-Processed Titanium Alloy. Metallurgical Transactions A, vol. 10A, 1979, pp. 1837-1846.
23. Bowen, A.W.: Fatigue Crack Growth in Strongly Textured Ti-6Al-4V. Texture and the Properties of Materials. G.J. Davies et al. eds., The Metals Society, 1976, pp. 218-223.
24. Bowen, A.W.: The Influence of Crystallographic Orientation on the Fracture Toughness of Strongly Textured Ti-6Al-4V. Acta Metallurgica, vol. 26, 1978, pp. 1423-1433.
25. Fuggle, J.C.; Watson, L.M.; Fabian, D.J.; and Affrossman, S.: X-Ray Photoelectron Studies of the Reaction of Clean Metals (Mg, Al, Cr, Mn) with Oxygen and Water Vapor. Surface Science, vol. 49, 1975, pp. 61-76.

18
26. Padalia, B.D.; Gimzewski, J.K.; Affrossman, S.; Lang, W.C.; Watson, L.M.; and Fabian, D.J.: The Reactions of Oxygen and Water with the Rare-Earth Metals Terbium to Lutetium Studied by X-Ray Photoelectron Spectroscopy. Surface Science, vol. 61, 1976, pp. 468-482.
27. Gregory, J.K.: Fatigue Crack Propagation in Titanium Alloys. Handbook of Fatigue Crack Propagation in Metallic Structures, A. Carpinteri ed., Elsevier Science, 1994, pp. 281-322.
28. Piascik, R.S.; and Newman, J.C., Jr.: An Extended Compact Tension Specimen for Fatigue Crack Growth and Fracture Testing. International Journal of Fracture, vol. 76, 1995, pp. R43-R48.

19
Table I. Material Chemistry, wt. %.
Alloy Al Zr Cr Sn Mo Nb V Fe Si O
Ti 6-2-2-2-2 # 5.60 1.81 1.79 1.88 1.96 --- --- 0.03 0.23 0.103
Timetal 21S 3.00 --- --- --- 14.95 2.62 --- 0.34 0.195 0.145
Ti 6Al-4V * 6.3 --- --- --- --- --- 4.0 0.15 --- 0.16
# - Beta Transus: 960 ± 6°C (1760 ± 10°F) * - Nominal Composition
Table II. Microstructure of Three Ti Sheet Products.
Alloy Grain size Volume fraction β Morphology
Ti 6-2-2-2-2 < 10 µm 35 - 45 % Primary α and transformed β colonies
Timetal 21S 25 - 50 µm 70 - 80 % Grain boundary α and platelet α in retained β
Ti 6Al-4V < 15 µm 10 - 20 % α matrix with grain boundary β
Table III. Mechanical Properties.
Alloy
Tensile axis
σUTS (MPa)
σys (MPa) (0.2% offset)
E (GPa)
Ti 6-2-2-2-2 L 1161.1 1121.8 116.5 T 1145.2 1110.7 121.9
Timetal 21S L 1299.7 1196.2 --- T 1320.3 1241.1 104.1
Ti 6Al-4V L 986.6 901.1 113.1 T ---- ---- 109.6
20
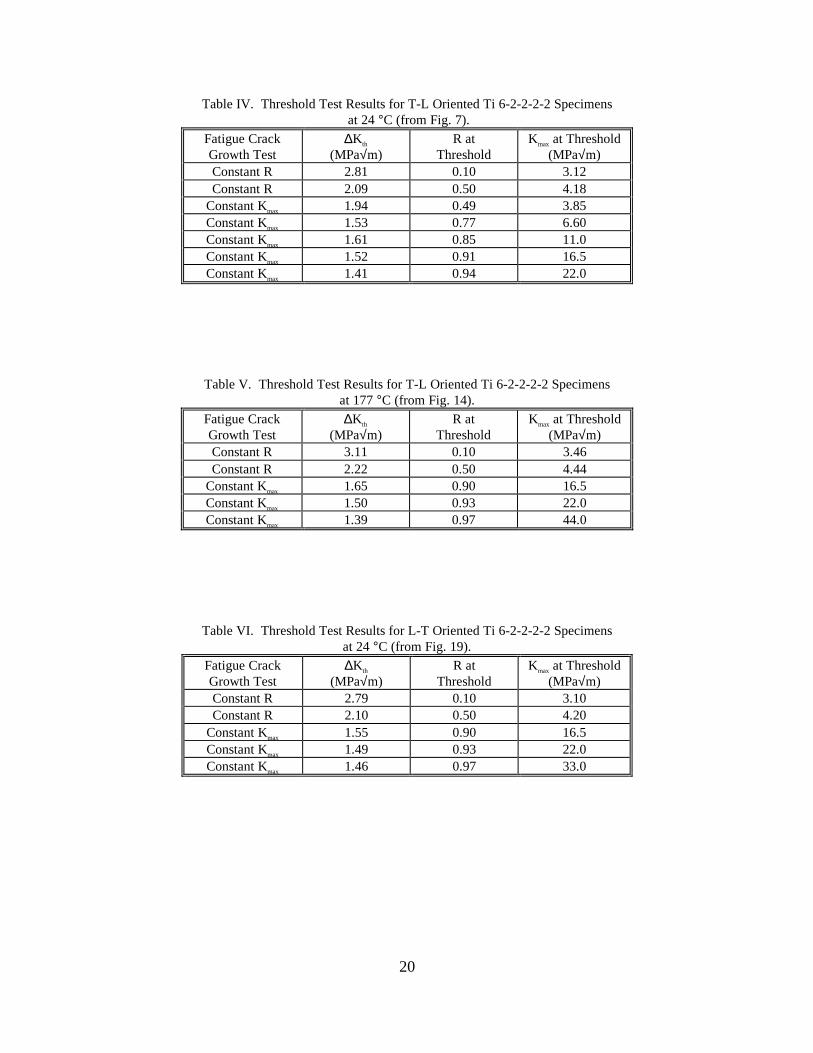
Table IV. Threshold Test Results for T-L Oriented Ti 6-2-2-2-2 Specimens at 24 °C (from Fig. 7).
Fatigue Crack Growth Test
∆Kth (MPa√m)
R at Threshold
Kmax at Threshold (MPa√m)
Constant R 2.81 0.10 3.12 Constant R 2.09 0.50 4.18
Constant Kmax 1.94 0.49 3.85 Constant Kmax 1.53 0.77 6.60 Constant Kmax 1.61 0.85 11.0 Constant Kmax 1.52 0.91 16.5 Constant Kmax 1.41 0.94 22.0
Table V. Threshold Test Results for T-L Oriented Ti 6-2-2-2-2 Specimens at 177 °C (from Fig. 14).
Fatigue Crack Growth Test
∆Kth (MPa√m)
R at Threshold
Kmax at Threshold (MPa√m)
Constant R 3.11 0.10 3.46 Constant R 2.22 0.50 4.44
Constant Kmax 1.65 0.90 16.5 Constant Kmax 1.50 0.93 22.0 Constant Kmax 1.39 0.97 44.0
Table VI. Threshold Test Results for L-T Oriented Ti 6-2-2-2-2 Specimens at 24 °C (from Fig. 19).
Fatigue Crack Growth Test
∆Kth (MPa√m)
R at Threshold
Kmax at Threshold (MPa√m)
Constant R 2.79 0.10 3.10 Constant R 2.10 0.50 4.20
Constant Kmax 1.55 0.90 16.5 Constant Kmax 1.49 0.93 22.0 Constant Kmax 1.46 0.97 33.0
21
100 µ m L T
S
Figure 1. Composite optical micrograph of Ti 6-2-2-2-2 sheet product. Primary α grains appear light in the micrograph, while transformed β grains are dark.
22
S
LT
25 µm
Figure 2. Optical micrograph of the cross rolled Ti 6-2-2-2-2 sheet, normal to long transverse direction. Primary α grains appear light in the micrograph, while transformed β grains are dark.

23
19.72
10.0
4.0
2.0
4.0
10.0
14.9517.68
10.0
4.0
2.0
0.5
Rolling Direction
LongTransverse
Figure 3. Basal plane (0002) pole figure for Ti 6-2-2-2-2 sheet, examined at the t/4 plane. Included in the lower left quadrant is a stereographic projection drawn with 10° intervals.

24
Detail A
0.79 mm
30o
4.70 mm
5.08 mm
57.1 mm
71.1 mm
30.7 mm
38.4 mm
see Detail A
7.62 mm DIA(2 places)
(W)(d)
(B)
142.2 mm Location of back-facestrain gage
integrally machined knifeedges for clip gage
a
7.7 mm
Figure 4. Specimen design for eccentrically loaded single edge notch tensile (ESE(T)) specimen.
25
∆K (MPa√m)
1 10
da
/dN
(m
/cyc
le)
10-10
10-9
10-8
10-7
10-6
10-5 24 oC, Lab air, 5 HzR = 0.5
Timetal 21STi 6Al-4V
Ti 6-2-2-2-2
Figure 5a. Fatigue crack growth rate versus cyclic stress-intensity factor for T-L oriented Ti 6-2-2-2-2, Timetal 21S, and Ti 6Al-4V tested in room temperature laboratory air at 5 Hz and R = 0.5.

26
Ti 6Al-4V, T-L24 oC, Lab AirR = 0.5
∆K (MPa√m)
1 10
da/d
N (
m/c
ycle
)
10-10
10-9
10-8
10-7
10-6
10-5
9.65 mm thick, 1 Hz [12]1.52 mm thick, 5 Hz
Figure 5b. Fatigue crack growth rate versus cyclic stress-intensity factor for T-L oriented Ti 6Al-4V tested in room temperature laboratory air at R = 0.5.

27
∆K (MPa√m)
1 10
da/d
N (
m/c
ycle
)
10-10
10-9
10-8
10-7
10-6
10-5
5 Hz30 Hz [14]
Timetal 21S24 oC, Lab AirR = 0.1
Figure 5c. Fatigue crack growth rate versus cyclic stress-intensity factor for Timetal 21S tested in room temperature laboratory air at R = 0.1.

28
∆K (MPa√m)
1 10
da/
dN
(m
/cyc
le)
10-10
10-9
10-8
10-7
10-6
10-5
R = 0.1R = 0.5R = 0.1 (∆Keff 1% offset)
Ti 6-2-2-2-2, T-L24 oC, Lab air, 5 Hz
1413
11
A
B
DC
J
E-GH,I
12
3
12
109
876
54
Figure 6. Fatigue crack growth rates for Ti 6-2-2-2-2, T-L orientation, in room temperature laboratory air at 5 Hz. Numbers and letters indicate load-displacements measurements to determine opening loads. Three test were performed at each R and the starting point and direction of tests (K-increasing or K-decreasing) are noted with arrows.

29
∆K (MPa√m)
1 10
da/d
N (
m/c
ycle
)
10-10
10-9
10-8
10-7
R = 0.1R = 0.5Kmax= 11.0 MPa√m
Kmax= 16.5 MPa√m
Kmax= 22.0 MPa√m
1.53 2.09
Ti 6-2-2-2-2, T-L24 oC, Lab air, 5 Hz
R = 0.5(Kmax= 16.5 MPa√m)
R = 0.5(Kmax= 11 MPa√m)
R = 0.91(Kmax= 16.5 MPa√m)
2.81
R = 0.15(Kmax= 11 MPa√m)
∆Keff (1% offset)R = 0.1
ASTM E 647
Figure 7. Lower Paris to threshold regime fatigue crack growth rates for Ti 6-2-2-2-2, T-L orientation, for constant-R and constant-Kmax testing in room temperature laboratory air. Noted in the figure are regions of correlation (similar R) between the different types of tests.

30
a/W
0.0 0.2 0.4 0.6 0.8 1.0
Kc
(MP
a√m
)
0
20
40
60
80
100
Ti 6-2-2-2-2, T-L24oC, Lab Air
Figure 8. Apparent fracture toughness (Kc) versus a/W for Ti 6-2-2-2-2, T-L orientation, in room temperature laboratory air.

31
Kmax (MPa√m)
0 5 10 15 20 25
∆ Kth (
MP
a√m
)
1
2
3
4
Ti 6-2-2-2-2, T-L24 oC Lab air, 5 Hz
da/dN = 1 x 10⁻¹⁰ m/cycle
closure dominated
Kmax affected
constant Rconstant Kmax
∆Kth ∆Kth,effR = 0.1
R = 0.5
Figure 9. ∆Kth versus Kmax data at 1 x 10⁻¹⁰ m/cycle for Ti 6-2-2-2-2, T-L orientation, in room temperature laboratory air. Two distinct regions, a closure-dominated region (dashed line) and a Kmax-affected region (dotted line) are identified.

32
Kmax (MPa √m)
0 5 10 15 20 25
∆ K (
MP
a √ m
)
1
2
3
4
5Ti 6-2-2-2-2 T-L24 oC, Lab Air, 5 Hz
closure free
3 x 10⁻¹⁰ m/cycle5 x 10-10 m/cycle1 x 10-9 m/cycle3 x 10-9 m/cycle
constantKmax
constantR
(A)
(B)
Figure 10. ∆K versus Kmax data for Ti 6-2-2-2-2, T-L orientation, in room temperature laboratory air at four fatigue crack growth rates. Two distinct regions, a closure-dominated region (A, dashed lines) and a Kmax-affected region (B, dotted lines) are identified.

33
∆K (MPa√m)
1 10
da/d
N (m
/cyc
le)
10-10
10-9
10-8
10-7
R = 0.1R = 0.5Kmax= 22.0 MPa√m
R = 0.1 (∆Keff)
R = 0.5 (∆Keff)
Ti 6-2-2-2-2, T-L24 oC, Lab air, 5 Hz
ASTM E 647
Figure 11. Lower Paris to threshold regime fatigue crack growth rate data for Ti 6-2-2-2-2, T-L orientation, in room temperature laboratory air. ∆Keff curves for R = 0.1 and 0.5 are determined using the ∆K versus Kmax data.

34
∆K (MPa√m)
1 10
da/
dN (
m/c
ycle
)
10-10
10-9
10-8
10-7
10-6
10-5
24 oC177 oC
Ti 6-2-2-2-2, T-LLab air, 5 HzR = 0.1
24 o C
177 o C
Figure 12. Fatigue crack growth rates for Ti 6-2-2-2-2, T-L orientation, in room and elevated temperature laboratory air, R = 0.1. The starting point and direction of each test (K-increasing or K-decreasing) are noted with arrows.
35
∆K (MPa√m)
1 10
da/
dN
(m
/cyc
le)
10-10
10-9
10-8
10-7
10-6
10-5
24 oC177 oC
Ti 6-2-2-2-2, T-LLab air, 5 HzR = 0.5
24 o C
177 o C
Figure 13. Fatigue crack growth rates for Ti 6-2-2-2-2, T-L orientation, in room and elevated temperature laboratory air, R = 0.5. The starting point and direction of each test (K-increasing or K-decreasing) are noted with arrows.

36
∆K (MPa√m)
1 10
da
/dN
(m
/cyc
le)
10-10
10-9
10-8
10-7
R = 0.1R = 0.5Kmax= 16.5 MPa√m
Kmax= 22.0 MPa√m
Kmax= 44.0 MPa√m
Ti 6-2-2-2-2, T-L177 oC, Lab air, 5 Hz
3.112.221.65
R = 0.90(Kmax=16.5 MPa√m)
R = 0.5(Kmax= 16.5 MPa√m)
R = 0.5(Kmax= 22 MPa√m)
ASTM E647
Figure 14. Lower Paris to threshold regime fatigue crack growth rates for Ti 6-2-2-2-2, T-L orientation, constant-R and constant-Kmax testing in elevated temperature laboratory air. Regions of similar R for the two different test types are noted.

37
Kmax (MPa√m)
0 10 20 30 40 50
∆ Kth (
MP
a√m
)
1
2
3
4
Ti 6-2-2-2-2, T-LLab air, 5 Hz
da/dN = 1 x 10⁻¹⁰ m/cycle
closure dominated
Kmax affected
constant Rconstant Kmax
24 oC 177 oC
Figure 15. ∆Kth versus Kmax for Ti 6-2-2-2-2 at da/dN = 1 x 10⁻¹⁰ m/cycle, T-L orientation, for constant-R and constant-Kmax testing in room and elevated temperature laboratory air. The data shows two distinct regions, a closure-dominated region (dashed lines) and a Kmax-affected region (dotted lines).

38
Kmax (MPa√m)
0 10 20 30 40 50
∆ K (
MP
a√m
)
4
5
6
7
8
Ti 6-2-2-2-2, T-LLab air, 5 Hz
da/dN = 1 x 10⁻⁸ m/cycle
closure dominated
Kmax affected
constant Rconstant Kmax
24 oC 177 oC
Figure 16. ∆K versus Kmax for Ti 6-2-2-2-2 at da/dN=1 x 10-8 m/cycle, T-L orientation, for constant-R and constant-Kmax testing in room and elevated temperature laboratory air. The data shows two distinct regions, a closure-dominated region (dashed lines) and a Kmax-affected region (dotted lines).
39
∆K (MPa√m)
1 10
da/d
N (
m/c
ycle
)
10-10
10-9
10-8
10-7
10-6
10-5
T-L orientationL-T orientation45o orientation
Ti 6-2-2-2-224 oC, Lab air, 5 HzR = 0.5
4.5
2.6
1
1
Figure 17. Fatigue crack growth rates for T-L, L-T, and 45° oriented Ti 6-2-2-2-2 in room temperature laboratory air at R = 0.5. Three tests are shown for each orientation. The beginning of each K-increasing test for the 45° orientation is indicated with an arrow. The approximate power law slope in the Paris regime for each orientation is indicated on the plot.

40
∆K (MPa√m)
1 10
da/
dN
(m
/cyc
le)
10-10
10-9
10-8
10-7
10-6
10-5
T-L orientation45o orientation
Ti 6-2-2-2-2177 oC, Lab air, 5 HzR = 0.5
3.5
2.2
1
1
Figure 18. Fatigue crack growth rates for T-L and 45° oriented Ti 6-2-2-2-2 in 177 °C laboratory air at R = 0.5. The approximate power law slope in the Paris regime for each orientation is indicated on the plot.
41
∆K (MPa√m)
1 10
da/d
N (
m/c
ycle
)
10-10
10-9
10-8
10-7R = 0.1R = 0.5Kmax= 16.5 MPa√m
Kmax= 22.0 MPa√m
Kmax= 33.0 MPa√m
1.55
Ti 6-2-2-2-2, L-T24 oC, Lab air, 5 Hz
R=0.90(Kmax=16.5 MPa√m)
2.10 2.79
ASTM E647
Figure 19. Lower Paris to threshold regime fatigue crack growth rates for Ti 6-2-2-2-2, L-T orientation, for constant-R and constant-Kmax
testing in room temperature laboratory air. The starting point and direction (K-increasing or K-decreasing) of each constant-R test included in this plot is noted with an arrow.

42
Kmax (MPa√m)
0 5 10 15 20 25 30 35
∆ Kth (
MP
a√m
)
1
2
3
4
Ti 6-2-2-2-224 oC Lab air, 5 Hz
da/dN = 1 x 10⁻¹⁰ m/cycle
closure dominated
Kmax affected
constant Rconstant Kmax
T-L L-T
Figure 20. ∆Kth versus Kmax for Ti 6-2-2-2-2 at da/dN = 1 x 10⁻¹⁰ m/cycle, T-Land L-T orientations, for constant-R and constant-Kmax testing in room temperature laboratory air. The data shows two distinct regions, a closure-dominated region (dashed lines) and a Kmax-affected region (dotted lines).

43
∆K (MPa√m)
1 10
da/d
N (
m/c
ycle
)
10-10
10-9
10-8
10-7
10-6
10-5
24 oC Lab Air177 oC Lab Air24 oC UHV (≈9 x 10⁻⁸ Pa)177 oC UHV (≈3 x 10⁻⁷ Pa)
Ti 6-2-2-2-2, T-LR = 0.5, 5 Hz
Figure 21. Fatigue crack growth rates for T-L oriented Ti 6-2-2-2-2 tested in laboratory air and ultrahigh vacuum at 24°C and 177°C for R = 0.5.

44
Binding Energy (eV)
528530532534536
Co
un
ts p
er
Se
con
d
0
5000
10000
15000
20000
25000O1s (oxide)~ 530.5 eV
O1s (hydroxide)~ 532.0 eV
O1s (water)~ 533.5 eV
O1s spectra67 Pa H2O
exposure 24 oC
a) room temperature
Binding Energy (eV)
528530532534536
Co
un
ts p
er
Se
con
d
0
500
1000
1500
2000
2500O1s (oxide)~ 530.5 eV
O1s (hydroxide)~ 532.0 eV
O1s (water)~ 533.5 eV
O1s spectra67 Pa H2O
exposure 177 oC
b) 177 °C
Figure 22. XPS spectra from Ti 6-2-2-2-2 fatigue surfaces produced during exposure to 67 Pa water vapor at a) 24°C and b) 177 °C. Constituent peaks are shown as dashed lines and the binding energy of O1s photoelectrons for three compounds are identified by dotted lines.

45
∆K (MPa√m)
1 10
da/d
N (
m/c
ycle
)
10-10
10-9
10-8
10-7
10-6
10-5
Lab AirUHV (≈ 1 x 10⁻⁷ Pa)
Ti 6-2-2-2-2, 45oorientationR = 0.5, 5 Hz, 24 oC
Figure 23. Fatigue crack growth rates for 45° oriented Ti 6-2-2-2-2 tested in room temperature laboratory air and ultrahigh vacuum at R = 0.5.

46
LT
S
Crack GrowthDirection
100 µm
a) room temperature
100 µm
b) 177 °C
Figure 24. SEM micrographs of fatigue surface of Ti 6-2-2-2-2, T-L orientation, ∆K = 19.8 MPa√m, R = 0.5 tested at a) 24 °C and b) 177 °C in laboratory air.

47
LT
S
Crack GrowthDirection
20 µm
a) room temperature
20 µm
b) 177 °C
Figure 25. SEM micrographs of fatigue surface of Ti 6-2-2-2-2, T-L orientation, ∆K = 19.8 MPa√m, R = 0.5 tested at a) 24 °C and b) 177 °C in laboratory air.

48
LT
S
Crack GrowthDirection
100 µm
a) room temperature
100 µm
b) 177 °C
Figure 26. SEM micrographs of fatigue surface of Ti 6-2-2-2-2, T-L orientation, ∆K = 16.8 MPa√m, R = 0.5 tested at a) 24 °C and b) 177 °C in ultrahigh vacuum.

49
Appendix A – Crack length and stress-intensity factor determinations for the ESE(T) specimen.
A compliance expression to determine crack length (a) for displacements measured along
the front-face of an ESE(T) specimen has been derived [28].
( ) ( ) ( ) ( ) ( )a
WC C U C U C U C U C U= + + + + +0 1 2
23
34
45
5 (A-1)
Where UE B P
=+
1
1ν /, W is the specimen width (Fig. 4), B is the specimen thickness (Fig.
4), P is the applied load, ν is the displacement, and E is the elastic modulus. The coefficients for
each term have been solved as C0 = 1.00132, C1 = -3.58451, C2 = 6.59954, C3 = -19.22577, C4 =
41.54678, C5 = -31.75871.
A compliance solution for strain measurements along the back-face of an ESE(T)
specimen has also been derived [28].
( ) ( ) ( ) ( )a
WN N A N A N A N A= + + + +0 1 2
23
34
4log log log log (A-2)
Where: ( )A P BWE= ε / , and ε is the measured strain. The coefficients for each term have been
solved as N0 = 0.09889, N1 = 0.41967, N2 = 0.06751, N3 = -0.07018, N4 = 0.01082.
The crack-tip stress-intensity factor expression for the ESE(T) specimens is [28]:
KP
B We cF=
(A-3)
where:
( )
( )ecF
d
W
G=+
− −
2
1 13 21 2
β
β //
(A-4)
G = 1.15 + 0.94 - 2.48 + 2.95 - 1.24 4β β β β2 3 (A-5)
( )( )β =
−−
a d
W d (A-6)
and d is the distance between the specimen edge and load line (Fig. 4).

50
Appendix B - Closure measurements using the compliance techniques.
Load versus strain data was acquired during fatigue testing. The collection of this data
during fatigue testing of T-L oriented Ti 6-2-2-2-2 in room temperature laboratory air is
identified in Figure 6. From the load versus strain data, strain deviation is calculated as the
difference between the measured strains and a least-squares fit through the unloading curve near
the maximum load. Load is then normalized by the maximum applied load and plotted against
the reduced strain. This technique results in an increased resolution for graphical determination
of the crack-opening load. Examples of reduced strain plots are shown in Figures A1, A2, and
A3. An opening load is determined on the reduced strain plot when the tangent to the loading
curve becomes vertical [11]. The opening load determined from the reduced strain technique is
then compared to the opening load values calculated for five selected offset values [7], to
determine the appropriate offset level to use for the calculation of ∆Kop.
Strain Deviation (µStrain)
-7 -6 -5 -4 -3 -2 -1 0 1
P/P
ma
x
0.0
0.2
0.4
0.6
0.8
1.0
1 % offset (0.328)2 % offset (0.308)4 % offset (0.275)
8 % offset (0.246)
16 % offset (0.208)
Ti 6-2-2-2-2, T-L24 oC, Lab AirR = 0.1, ∆K = 2.97 MPa√mPop/Pmax = 0.325, ∆Keff = 2.45 MPa√m
Load-strain measurement #1(Figure 6)
results fromoffset technique
(Pop/Pmax)loading
unloading
Figure B1. Load versus strain deviation for T-L oriented Ti 6-2-2-2-2 to determine crack opening load. Opening loads determined for 5 different offset values are also shown.

51
Strain Deviation (µStrain)
-10 -8 -6 -4 -2 0 2 4 6
P/P
ma
x
0.0
0.2
0.4
0.6
0.8
1.0
1 to 16 % offset (0.175)
Ti 6-2-2--22, T-L24 oC, Lab AirR = 0.1, ∆K = 17.90 MPa√mPop/Pmax = 0.217, ∆Keff = 15.57 MPa√m
Load-strain measurement #13(Figure 6)
loading
unloading
results fromoffset technique
(Pop/Pmax)
Figure B2. Load versus strain deviation for T-L oriented Ti 6-2-2-2-2 to determine crack-opening load. Opening loads determined for 5 different offset values are also shown.
Strain Deviation (µStrain)
-10 -8 -6 -4 -2 0 2 4 6
P/P
max
0.4
0.5
0.6
0.7
0.8
0.9
1.0
1.1Ti 6-2-2-2-2 T-L24 oC, Lab airR = 0.5, ∆K = 2.09 MPa√m loading
unloading
Load-strain measurement A(Figure 6)
Figure B3. Load versus strain deviation for T-L oriented Ti 6-2-2-2-2 at ∆K = 2.09 MPa√m, R = 0.5 and 5 Hz in room temperature laboratory air. The entire loading portion of the curve is vertical, indicating no crack closure.
52
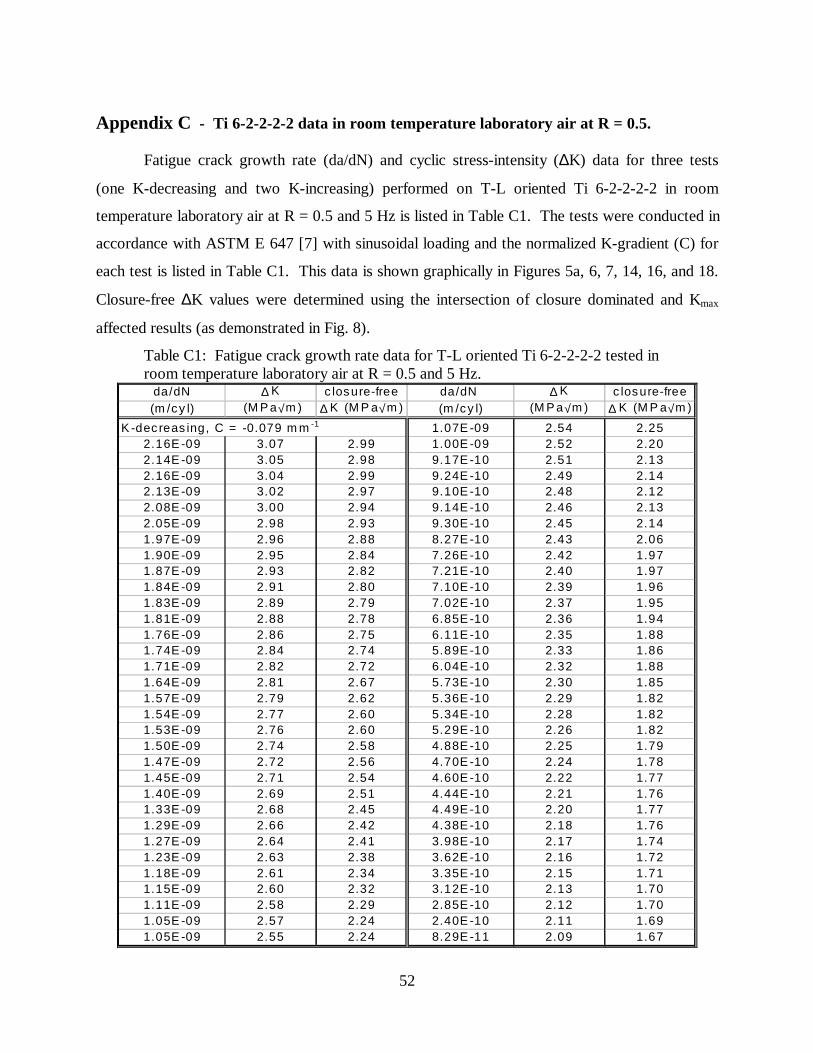
Appendix C - Ti 6-2-2-2-2 data in room temperature laboratory air at R = 0.5.
Fatigue crack growth rate (da/dN) and cyclic stress-intensity (∆K) data for three tests
(one K-decreasing and two K-increasing) performed on T-L oriented Ti 6-2-2-2-2 in room
temperature laboratory air at R = 0.5 and 5 Hz is listed in Table C1. The tests were conducted in
accordance with ASTM E 647 [7] with sinusoidal loading and the normalized K-gradient (C) for
each test is listed in Table C1. This data is shown graphically in Figures 5a, 6, 7, 14, 16, and 18.
Closure-free ∆K values were determined using the intersection of closure dominated and Kmax
affected results (as demonstrated in Fig. 8).
Table C1: Fatigue crack growth rate data for T-L oriented Ti 6-2-2-2-2 tested in room temperature laboratory air at R = 0.5 and 5 Hz.
da/dN ∆ K c losure-free da/dN ∆ K c losure-free(m /cy l) (M P a√m ) ∆ K (M P a√m ) (m /cy l) (M P a√m ) ∆ K (M P a√m )
K -dec reas ing, C = -0.079 m m -1 1.07E -09 2.54 2.252.16E -09 3.07 2.99 1.00E -09 2.52 2.202.14E -09 3.05 2.98 9.17E -10 2.51 2.132.16E -09 3.04 2.99 9.24E -10 2.49 2.142.13E -09 3.02 2.97 9.10E -10 2.48 2.122.08E -09 3.00 2.94 9.14E -10 2.46 2.132.05E -09 2.98 2.93 9.30E -10 2.45 2.141.97E -09 2.96 2.88 8.27E -10 2.43 2.061.90E -09 2.95 2.84 7.26E -10 2.42 1.971.87E -09 2.93 2.82 7.21E -10 2.40 1.971.84E -09 2.91 2.80 7.10E -10 2.39 1.961.83E -09 2.89 2.79 7.02E -10 2.37 1.951.81E -09 2.88 2.78 6.85E -10 2.36 1.941.76E -09 2.86 2.75 6.11E -10 2.35 1.881.74E -09 2.84 2.74 5.89E -10 2.33 1.861.71E -09 2.82 2.72 6.04E -10 2.32 1.881.64E -09 2.81 2.67 5.73E -10 2.30 1.851.57E -09 2.79 2.62 5.36E -10 2.29 1.821.54E -09 2.77 2.60 5.34E -10 2.28 1.821.53E -09 2.76 2.60 5.29E -10 2.26 1.821.50E -09 2.74 2.58 4.88E -10 2.25 1.791.47E -09 2.72 2.56 4.70E -10 2.24 1.781.45E -09 2.71 2.54 4.60E -10 2.22 1.771.40E -09 2.69 2.51 4.44E -10 2.21 1.761.33E -09 2.68 2.45 4.49E -10 2.20 1.771.29E -09 2.66 2.42 4.38E -10 2.18 1.761.27E -09 2.64 2.41 3.98E -10 2.17 1.741.23E -09 2.63 2.38 3.62E -10 2.16 1.721.18E -09 2.61 2.34 3.35E -10 2.15 1.711.15E -09 2.60 2.32 3.12E -10 2.13 1.701.11E -09 2.58 2.29 2.85E -10 2.12 1.701.05E -09 2.57 2.24 2.40E -10 2.11 1.691.05E -09 2.55 2.24 8.29E -11 2.09 1.67

53
Table C1. Continued
da/dN ∆K closure-free da/dN ∆K closure-free(m/cyl) (MPa√m) ∆K (MPa√m) (m/cyl) (MPa√m) ∆K (MPa√m)
K-increasing, C=0.16 mm-1 6.98E-09 4.541.39E-09 2.77 2.50 7.53E-09 4.591.42E-09 2.80 2.52 8.09E-09 4.651.46E-09 2.84 2.54 8.24E-09 4.701.55E-09 2.87 2.61 8.54E-09 4.761.61E-09 2.91 2.65 8.95E-09 4.821.61E-09 2.94 2.65 9.22E-09 4.881.73E-09 2.98 2.73 9.59E-09 4.931.94E-09 3.01 2.86 9.97E-09 5.002.05E-09 3.05 2.92 1.02E-08 5.062.11E-09 3.09 2.96 1.05E-08 5.122.15E-09 3.12 2.98 1.10E-08 5.182.27E-09 3.16 3.04 1.17E-08 5.242.37E-09 3.20 3.10 1.21E-08 5.302.39E-09 3.24 3.11 1.23E-08 5.372.43E-09 3.28 3.12 1.29E-08 5.432.55E-09 3.32 3.18 1.39E-08 5.502.73E-09 3.36 3.27 1.45E-08 5.572.83E-09 3.40 3.32 1.50E-08 5.632.91E-09 3.44 3.35 1.57E-08 5.703.06E-09 3.48 3.42 1.64E-08 5.773.24E-09 3.52 3.49 1.71E-08 5.843.37E-09 3.56 3.55 1.80E-08 5.913.50E-09 3.61 3.60 1.87E-08 5.983.69E-09 3.65 1.95E-08 6.063.76E-09 3.70 2.07E-08 6.133.83E-09 3.74 2.17E-08 6.214.01E-09 3.79 2.23E-08 6.284.19E-09 3.83 2.27E-08 6.364.26E-09 3.88 2.34E-08 6.434.34E-09 3.93 2.41E-08 6.514.50E-09 3.97 2.52E-08 6.594.74E-09 4.02 2.60E-08 6.674.96E-09 4.07 2.68E-08 6.755.19E-09 4.12 2.80E-08 6.835.39E-09 4.17 2.88E-08 6.915.56E-09 4.22 2.99E-08 7.005.73E-09 4.27 3.13E-08 7.095.98E-09 4.32 3.26E-08 7.176.15E-09 4.37 3.46E-08 7.266.28E-09 4.43 3.62E-08 7.356.62E-09 4.48 3.67E-08 7.44

54
Table C1. Continued
da/dN ∆K da/dN ∆K da/dN ∆K (m/cyl) (MPa√m) (m/cyl) (MPa√m) (m/cyl) (MPa√m)
K-inc., C=0.16 mm-1 (cont.) 1.41E-07 12.33 K-inc., C=0.16 mm-1
3.78E-08 7.52 1.45E-07 12.48 9.29E-09 5.043.98E-08 7.62 1.45E-07 12.63 9.76E-09 5.104.21E-08 7.71 1.47E-07 12.78 1.03E-08 5.164.46E-08 7.80 1.51E-07 12.94 1.08E-08 5.234.72E-08 7.90 1.53E-07 13.10 1.12E-08 5.294.81E-08 7.99 1.57E-07 13.26 1.14E-08 5.364.81E-08 8.09 1.62E-07 13.41 1.17E-08 5.424.99E-08 8.19 1.64E-07 13.58 1.27E-08 5.575.20E-08 8.28 1.67E-07 13.74 1.28E-08 5.625.30E-08 8.38 1.74E-07 13.91 1.35E-08 5.695.28E-08 8.48 1.81E-07 14.08 1.43E-08 5.765.31E-08 8.59 1.85E-07 14.26 1.51E-08 5.835.61E-08 8.69 1.88E-07 14.43 1.57E-08 5.915.81E-08 8.80 1.93E-07 14.60 1.61E-08 5.975.88E-08 8.91 1.80E-07 14.77 1.67E-08 6.056.18E-08 9.02 2.06E-07 15.15 1.73E-08 6.126.54E-08 9.12 2.23E-07 15.25 1.81E-08 6.196.81E-08 9.24 2.34E-07 15.57 1.89E-08 6.277.03E-08 9.34 2.27E-07 15.63 2.00E-08 6.357.24E-08 9.46 2.27E-07 15.74 2.12E-08 6.427.40E-08 9.57 2.33E-07 15.89 2.18E-08 6.507.46E-08 9.69 2.36E-07 16.08 2.27E-08 6.587.52E-08 9.81 2.41E-07 16.28 2.37E-08 6.667.81E-08 9.93 2.48E-07 16.47 2.43E-08 6.738.21E-08 10.05 2.56E-07 16.67 2.52E-08 6.828.48E-08 10.17 2.60E-07 16.87 2.63E-08 6.908.71E-08 10.29 2.63E-07 17.08 2.73E-08 6.999.06E-08 10.42 2.76E-07 17.28 2.69E-08 7.079.48E-08 10.55 2.98E-07 17.49 2.93E-08 7.219.76E-08 10.67 3.21E-07 17.70 3.07E-08 7.281.01E-07 10.80 3.50E-07 17.92 3.18E-08 7.371.06E-07 10.93 3.69E-07 18.13 3.29E-08 7.461.10E-07 11.06 3.82E-07 18.37 3.41E-08 7.551.13E-07 11.20 3.87E-07 18.58 3.56E-08 7.651.16E-07 11.33 3.90E-07 18.81 3.70E-08 7.731.17E-07 11.47 3.82E-07 19.04 3.83E-08 7.821.18E-07 11.61 4.08E-07 19.32 4.05E-08 7.921.22E-07 11.75 4.25E-08 8.021.26E-07 11.90 4.44E-08 8.121.29E-07 12.04 4.64E-08 8.221.34E-07 12.19 4.85E-08 8.32

55
Table C1. Continued
da/dN ∆K da/dN ∆K da/dN ∆K (m/cyl) (MPa√m) (m/cyl) (MPa√m) (m/cyl) (MPa√m)
K-inc., C=0.16 mm-1 (cont.) 2.00E-07 14.62 9.28E-07 24.445.03E-08 8.42 2.05E-07 14.80 1.18E-06 24.775.20E-08 8.51 2.10E-07 14.98 1.44E-06 25.035.39E-08 8.61 2.16E-07 15.16 1.96E-06 25.415.72E-08 8.99 2.22E-07 15.35 2.47E-06 25.655.95E-08 9.10 2.29E-07 15.52 3.30E-06 26.036.25E-08 9.21 2.36E-07 15.71 4.47E-06 26.356.53E-08 9.32 2.46E-07 15.916.72E-08 9.43 2.61E-07 16.096.88E-08 9.55 2.72E-07 16.297.06E-08 9.66 2.71E-07 16.497.18E-08 9.77 2.70E-07 16.697.32E-08 9.89 2.77E-07 16.897.64E-08 10.01 2.89E-07 17.097.93E-08 10.13 3.05E-07 17.298.26E-08 10.26 3.21E-07 17.508.62E-08 10.38 3.29E-07 17.718.88E-08 10.51 3.49E-07 17.939.25E-08 10.64 3.99E-07 18.159.54E-08 10.76 4.27E-07 18.379.87E-08 10.89 4.11E-07 18.591.02E-07 11.02 3.88E-07 18.811.05E-07 11.15 3.92E-07 19.051.10E-07 11.30 4.14E-07 19.261.12E-07 11.43 5.59E-07 19.801.13E-07 11.56 6.63E-07 19.951.17E-07 11.70 6.01E-07 20.171.21E-07 11.85 6.20E-07 20.421.22E-07 11.99 6.20E-07 20.661.24E-07 12.13 6.23E-07 20.911.29E-07 12.28 6.62E-07 21.161.32E-07 12.42 7.19E-07 21.421.35E-07 12.57 7.53E-07 21.681.39E-07 12.73 7.40E-07 21.931.44E-07 12.88 7.28E-07 22.211.78E-07 13.43 7.55E-07 22.471.71E-07 13.60 7.42E-07 22.751.73E-07 13.76 7.24E-07 23.021.76E-07 13.93 7.73E-07 23.301.80E-07 14.10 8.15E-07 23.611.87E-07 14.27 8.05E-07 23.861.95E-07 14.44 8.29E-07 24.19

56
Appendix D - Ti 6-2-2-2-2 data in room temperature laboratory air at R = 0.1.
Fatigue crack growth rate (da/dN), cyclic stress-intensity (∆K) and effective cyclic stress-
intensity (∆Keff) data for two tests (one K-decreasing and one K-increasing) performed on T-L
oriented Ti 6-2-2-2-2 in room temperature laboratory air at R = 0.1 and 5 Hz is listed in Table
D1. The tests were conducted in accordance with ASTM E 647 [7] with sinusoidal loading and
the normalized K-gradient (C) for each test is listed in Table D1. This data is shown graphically
in Figures 6, 7, and 13. Closure-free ∆K values, determined using the intersection of closure
dominated and Kmax affected results (as demonstrated in Fig. 8), for da/dN less than 1 x 10⁻⁷
m/cycle are also presented.
Table D1: Fatigue crack growth rate data for T-L oriented Ti 6-2-2-2-2 tested in room temperature laboratory air at R = 0.1 and 5 Hz.
da/dN ∆K closure-free da/dN ∆K closure-free(m/cyl) (MPa√m) ∆K (MPa√m) (m/cyl) (MPa√m) ∆K (MPa√m)
K-decreasing, C = -0.079 mm-1 1.22E-09 3.59 2.393.02E-09 4.34 3.47 1.18E-09 3.56 2.362.80E-09 4.30 3.37 1.17E-09 3.54 2.352.77E-09 4.28 3.35 1.11E-09 3.52 2.302.83E-09 4.25 3.39 1.10E-09 3.50 2.302.78E-09 4.23 3.36 1.07E-09 3.48 2.272.60E-09 4.20 3.27 1.04E-09 3.46 2.252.56E-09 4.18 3.25 1.04E-09 3.44 2.252.53E-09 4.15 3.23 9.72E-10 3.42 2.192.53E-09 4.12 3.24 9.12E-10 3.39 2.142.49E-09 4.10 3.21 8.96E-10 3.37 2.132.30E-09 4.08 3.11 8.63E-10 3.35 2.102.25E-09 4.05 3.08 8.17E-10 3.33 2.062.10E-09 4.03 2.99 7.84E-10 3.31 2.032.01E-09 4.00 2.94 7.59E-10 3.29 2.012.14E-09 3.98 3.02 7.04E-10 3.27 1.972.12E-09 3.95 3.01 6.99E-10 3.25 1.962.10E-09 3.93 3.00 7.00E-10 3.23 1.962.03E-09 3.91 2.95 6.61E-10 3.21 1.931.92E-09 3.88 2.88 6.32E-10 3.20 1.911.83E-09 3.86 2.83 6.15E-10 3.18 1.891.71E-09 3.83 2.75 6.04E-10 3.16 1.891.64E-09 3.81 2.70 5.53E-10 3.14 1.851.59E-09 3.79 2.66 5.20E-10 3.12 1.821.53E-09 3.77 2.62 5.04E-10 3.10 1.811.50E-09 3.74 2.60 4.61E-10 3.08 1.781.50E-09 3.72 2.60 4.51E-10 3.06 1.781.48E-09 3.70 2.59 4.42E-10 3.04 1.771.49E-09 3.67 2.59 3.94E-10 3.03 1.751.44E-09 3.65 2.56 3.32E-10 3.01 1.721.34E-09 3.63 2.48 2.95E-10 2.99 1.711.29E-09 3.61 2.45 2.72E-10 2.97 1.711.29E-09 3.61 2.45 3.43E-11 2.95 1.69

57
Table D1. Continued
da/dN ∆K closure-free da/dN ∆K closure-free(m/cyl) (MPa√m) ∆K (MPa√m) (m/cyl) (MPa√m) ∆K (MPa√m)
K-increasing, C=0.16 mm-1 1.07E-08 6.54 5.362.17E-09 4.00 3.04 1.16E-08 6.61 5.502.14E-09 4.04 3.02 1.21E-08 6.70 5.572.21E-09 4.09 3.06 1.20E-08 6.77 5.552.33E-09 4.14 3.12 1.26E-08 6.86 5.632.49E-09 4.19 3.21 1.38E-08 6.94 5.792.52E-09 4.24 3.23 1.34E-08 7.02 5.732.52E-09 4.29 3.22 1.41E-08 7.11 5.822.61E-09 4.34 3.27 1.49E-08 7.20 5.922.71E-09 4.40 3.32 1.52E-08 7.28 5.952.90E-09 4.45 3.41 1.63E-08 7.37 6.083.08E-09 4.51 3.50 1.71E-08 7.46 6.173.17E-09 4.56 3.53 1.73E-08 7.55 6.183.25E-09 4.62 3.57 1.89E-08 7.64 6.363.27E-09 4.67 3.57 2.00E-08 7.73 6.473.41E-09 4.73 3.63 2.06E-08 7.83 6.533.64E-09 4.78 3.73 2.21E-08 7.92 6.673.77E-09 4.84 3.78 2.18E-08 8.01 6.643.85E-09 4.90 3.80 2.27E-08 8.11 6.723.99E-09 4.96 3.85 2.45E-08 8.21 6.894.16E-09 5.02 3.91 2.62E-08 8.31 7.044.34E-09 5.08 3.98 2.61E-08 8.41 7.024.49E-09 5.14 4.02 2.72E-08 8.52 7.114.71E-09 5.21 4.09 2.98E-08 8.61 7.335.02E-09 5.27 4.19 2.98E-08 8.72 7.325.27E-09 5.33 4.26 3.08E-08 8.82 7.405.54E-09 5.40 4.34 3.30E-08 8.93 7.585.65E-09 5.46 4.37 3.42E-08 9.04 7.665.67E-09 5.52 4.37 3.50E-08 9.15 7.726.03E-09 5.59 4.46 3.84E-08 9.26 7.986.44E-09 5.66 4.56 4.03E-08 9.37 8.116.44E-09 5.73 4.56 3.89E-08 9.48 8.006.64E-09 5.80 4.60 4.12E-08 9.60 8.166.88E-09 5.87 4.66 4.27E-08 9.71 8.267.46E-09 5.94 4.79 4.44E-08 9.82 8.387.74E-09 6.00 4.84 4.83E-08 9.94 8.647.91E-09 6.08 4.87 5.02E-08 10.06 8.768.48E-09 6.15 4.99 5.37E-08 10.18 8.998.96E-09 6.23 5.07 5.63E-08 10.31 9.159.51E-09 6.31 5.17 5.74E-08 10.44 9.219.94E-09 6.38 5.24 5.71E-08 10.56 9.181.01E-08 6.46 5.26 5.89E-08 10.70 9.28

58
Table D1. Continued
da/dN ∆K closure-free da/dN ∆K closure-free(m/cyl) (MPa√m) ∆K (MPa√m) (m/cyl) (MPa√m) ∆K (MPa√m)
K-increasing, C=0.16 mm-1 (cont.) 2.04E-07 17.696.02E-08 10.82 9.36 2.15E-07 17.896.10E-08 10.95 9.40 2.16E-07 18.116.42E-08 11.08 9.59 2.17E-07 18.336.57E-08 11.21 9.67 2.18E-07 18.556.78E-08 11.35 9.78 2.39E-07 18.797.09E-08 11.49 9.95 2.50E-07 19.007.27E-08 11.63 10.05 2.34E-07 19.247.70E-08 11.77 10.28 2.35E-07 19.468.11E-08 11.91 10.50 2.49E-07 19.708.25E-08 12.05 10.57 2.51E-07 19.938.71E-08 12.20 10.80 2.65E-07 20.188.95E-08 12.34 10.92 2.62E-07 20.429.51E-08 12.49 11.19 2.57E-07 20.699.44E-08 12.64 11.15 2.79E-07 20.919.82E-08 12.80 11.32 2.84E-07 21.191.05E-07 12.95 2.93E-07 21.431.03E-07 13.11 2.86E-07 21.681.02E-07 13.26 3.00E-07 21.971.04E-07 13.42 3.09E-07 22.201.13E-07 13.59 3.07E-07 22.491.13E-07 13.75 3.33E-07 22.761.14E-07 13.92 3.38E-07 23.021.26E-07 14.08 3.41E-07 23.321.32E-07 14.26 3.43E-07 23.581.34E-07 14.43 3.64E-07 23.881.38E-07 14.60 3.79E-07 24.151.42E-07 14.78 3.78E-07 24.451.47E-07 14.96 4.00E-07 24.731.54E-07 15.15 4.07E-07 25.041.56E-07 15.33 4.08E-07 25.331.59E-07 15.51 4.28E-07 25.681.65E-07 15.69 4.49E-07 25.931.71E-07 15.88 5.57E-07 26.331.80E-07 16.07 5.56E-07 26.571.77E-07 16.27 5.03E-07 26.941.74E-07 16.46 5.07E-07 27.231.84E-07 16.66 5.07E-07 27.591.91E-07 16.86 5.09E-07 27.881.96E-07 17.08 5.27E-07 28.242.01E-07 17.28 6.05E-07 28.571.97E-07 17.49 6.30E-07 28.90

59
Table D1. Continued
da/dN ∆K closure-free da/dN ∆K closure-free(m/cyl) (MPa√m) ∆K (MPa√m) (m/cyl) (MPa√m) ∆K (MPa√m)
K-increasing, C=0.16 mm-1 (cont.) 2.04E-06 35.896.49E-07 29.25 2.25E-06 36.317.16E-07 29.60 2.60E-06 36.767.51E-07 29.97 2.74E-06 37.188.02E-07 30.35 2.98E-06 37.698.78E-07 30.73 3.12E-06 38.109.49E-07 31.12 2.95E-06 38.599.29E-07 31.45 3.26E-06 39.119.50E-07 31.85 3.36E-06 39.521.00E-06 32.20 3.44E-06 40.081.09E-06 32.63 4.09E-06 40.511.24E-06 33.00 4.60E-06 40.991.37E-06 33.43 5.09E-06 41.471.41E-06 33.79 5.31E-06 41.971.52E-06 34.22 5.45E-06 42.481.64E-06 34.60 6.20E-06 43.001.71E-06 35.05 7.41E-06 43.581.89E-06 35.46 7.72E-06 44.04

60
Appendix E - Ti 6-2-2-2-2 data in 177°C laboratory air at R = 0.5.
Fatigue crack growth rate (da/dN) and cyclic stress-intensity (∆K) data for three tests
(one K-decreasing and two K-increasing) performed on T-L oriented Ti 6-2-2-2-2 in 177 °C
laboratory air at R = 0.5 and 5 Hz is listed in Table E1. The tests were conducted in accordance
with ASTM E 647 [7] with sinusoidal loading and the normalized K-gradient (C) for each test is
listed in Table E1. This data is shown graphically in Figures 10, 11 and 14. Closure-free ∆K
values, determined using the intersection of closure dominated and Kmax affected results (as
demonstrated in Fig. 8), are also presented.
Table E1: Fatigue crack growth rate data for T-L oriented Ti 6-2-2-2-2 tested in 177 °C laboratory air at R = 0.5 and 5 Hz.
da/dN ∆K closure-free da/dN ∆K closure-free(m/cyl) (MPa√m) ∆K (MPa√m) (m/cyl) (MPa√m) ∆K (MPa√m)
K-decreasing, C = -0.079 mm-1 2.58E-09 3.48 3.274.81E-09 4.22 4.16 2.53E-09 3.46 3.244.61E-09 4.19 4.09 2.47E-09 3.44 3.214.52E-09 4.17 4.06 2.40E-09 3.42 3.184.36E-09 4.14 4.01 2.35E-09 3.40 3.154.18E-09 4.12 3.94 2.33E-09 3.38 3.144.05E-09 4.09 3.89 2.32E-09 3.36 3.134.00E-09 4.07 3.88 2.28E-09 3.34 3.113.95E-09 4.05 3.86 2.24E-09 3.32 3.093.93E-09 4.02 3.85 2.20E-09 3.30 3.073.92E-09 4.00 3.85 2.16E-09 3.28 3.053.80E-09 3.97 3.80 2.16E-09 3.26 3.053.60E-09 3.95 3.72 2.12E-09 3.24 3.033.53E-09 3.93 3.69 2.08E-09 3.22 3.003.51E-09 3.90 3.68 2.09E-09 3.20 3.013.45E-09 3.88 3.66 2.09E-09 3.18 3.013.42E-09 3.86 3.65 2.05E-09 3.16 2.993.34E-09 3.83 3.61 1.99E-09 3.14 2.953.30E-09 3.81 3.60 1.93E-09 3.13 2.923.28E-09 3.79 3.59 1.90E-09 3.11 2.903.21E-09 3.76 3.56 1.92E-09 3.09 2.913.10E-09 3.74 3.51 1.91E-09 3.07 2.913.04E-09 3.72 3.48 1.84E-09 3.05 2.863.05E-09 3.70 3.49 1.72E-09 3.01 2.792.98E-09 3.67 3.46 1.72E-09 2.99 2.792.88E-09 3.65 3.41 1.70E-09 2.98 2.782.92E-09 3.63 3.43 1.68E-09 2.96 2.772.88E-09 3.61 3.41 1.66E-09 2.94 2.752.77E-09 3.59 3.36 1.62E-09 2.92 2.732.71E-09 3.57 3.33 1.60E-09 2.90 2.722.70E-09 3.54 3.33 1.58E-09 2.89 2.702.67E-09 3.52 3.31 1.53E-09 2.87 2.672.61E-09 3.50 3.28 1.54E-09 2.85 2.68

61
Table E1. Continued
da/dN ∆K closure-free da/dN ∆K closure-free(m/cyl) (MPa√m) ∆K (MPa√m) (m/cyl) (MPa√m) ∆K (MPa√m)
K-decreasing, C=-0.079 mm-1 (cont.) 1.06E-10 2.22 1.951.55E-09 2.84 2.681.50E-09 2.82 2.65
1.45E-09 2.80 2.62 K-increasing, C = 0.16 mm-1
1.43E-09 2.78 2.60 3.29E-09 3.72 3.601.42E-09 2.77 2.60 3.38E-09 3.77 3.631.38E-09 2.75 2.57 3.56E-09 3.82 3.711.32E-09 2.74 2.53 3.66E-09 3.87 3.751.28E-09 2.72 2.50 3.76E-09 3.91 3.791.24E-09 2.70 2.48 3.92E-09 3.96 3.851.16E-09 2.69 2.42 4.11E-09 4.01 3.921.12E-09 2.67 2.39 4.29E-09 4.06 3.981.11E-09 2.65 2.38 4.36E-09 4.11 4.011.10E-09 2.64 2.38 4.46E-09 4.16 4.041.10E-09 2.62 2.38 4.57E-09 4.21 4.081.07E-09 2.61 2.36 4.62E-09 4.26 4.091.01E-09 2.59 2.31 4.77E-09 4.31 4.149.62E-10 2.58 2.28 5.02E-09 4.36 4.229.51E-10 2.56 2.27 5.16E-09 4.42 4.279.72E-10 2.55 2.29 5.17E-09 4.47 4.279.64E-10 2.53 2.28 5.39E-09 4.52 4.339.10E-10 2.52 2.24 5.70E-09 4.58 4.438.77E-10 2.50 2.22 5.88E-09 4.63 4.488.67E-10 2.49 2.21 5.96E-09 4.69 4.508.53E-10 2.47 2.20 6.07E-09 4.75 4.538.15E-10 2.46 2.18 6.35E-09 4.80 4.607.66E-10 2.44 2.14 6.72E-09 4.86 4.707.34E-10 2.43 2.12 7.07E-09 4.92 4.796.94E-10 2.41 2.10 7.26E-09 4.98 4.836.59E-10 2.40 2.07 7.45E-09 5.04 4.886.52E-10 2.38 2.07 7.77E-09 5.10 4.956.32E-10 2.37 2.06 8.07E-09 5.16 5.025.99E-10 2.35 2.04 8.36E-09 5.23 5.085.57E-10 2.34 2.01 8.55E-09 5.29 5.125.12E-10 2.33 1.99 8.80E-09 5.35 5.174.71E-10 2.31 1.97 9.32E-09 5.42 5.284.48E-10 2.30 1.96 9.65E-09 5.48 5.344.10E-10 2.29 1.95 1.00E-08 5.55 5.413.27E-10 2.27 1.94 1.05E-08 5.62 5.503.06E-10 2.26 1.94 1.07E-08 5.69 5.542.83E-10 2.24 1.94 1.11E-08 5.76 5.612.05E-10 2.23 1.96 1.14E-08 5.82 5.66

62
Table E1. Continued
da/dN ∆K closure-free da/dN ∆K closure-free(m/cyl) (MPa√m) ∆K (MPa√m) (m/cyl) (MPa√m) ∆K (MPa√m)
K-increasing, C=0.16 mm-1 (cont.) 4.82E-08 9.651.19E-08 5.89 5.75 4.94E-08 9.771.25E-08 5.96 5.85 5.10E-08 9.881.28E-08 6.04 5.90 5.24E-08 10.001.32E-08 6.11 5.96 5.39E-08 10.121.37E-08 6.18 6.04 5.58E-08 10.241.40E-08 6.26 6.08 5.83E-08 10.371.44E-08 6.33 6.14 5.97E-08 10.501.51E-08 6.41 6.03E-08 10.621.59E-08 6.49 6.13E-08 10.751.67E-08 6.57 9.50E-08 13.141.75E-08 6.65 9.65E-08 13.141.82E-08 6.73 9.63E-08 13.141.87E-08 6.81 9.67E-08 13.141.92E-08 6.89 9.81E-08 13.142.00E-08 6.97 9.71E-08 13.142.07E-08 7.06 9.58E-08 13.142.12E-08 7.14 2.16E-07 19.722.22E-08 7.23 2.15E-07 19.722.33E-08 7.32 2.14E-07 19.722.42E-08 7.41 2.19E-07 19.722.51E-08 7.50 2.24E-07 19.722.59E-08 7.59 2.23E-07 19.722.64E-08 7.68 2.23E-07 20.062.75E-08 7.77 2.25E-07 20.322.89E-08 7.86 2.31E-07 20.563.01E-08 7.96 2.36E-07 20.823.16E-08 8.06 2.39E-07 21.073.28E-08 8.15 2.43E-07 21.333.42E-08 8.25 2.47E-07 21.583.47E-08 8.35 2.51E-07 21.843.50E-08 8.45 2.57E-07 22.103.57E-08 8.56 2.58E-07 22.363.68E-08 8.66 2.63E-07 22.633.75E-08 8.76 2.67E-07 22.913.86E-08 8.87 2.76E-07 23.204.03E-08 8.98 2.82E-07 23.474.15E-08 9.08 2.84E-07 23.764.29E-08 9.19 2.85E-07 24.044.39E-08 9.30 3.02E-07 24.344.48E-08 9.42 3.27E-07 24.634.66E-08 9.53 3.53E-07 24.94

63
Table E1. Continued
da/dN ∆K da/dN ∆K da/dN ∆K (m/cyl) (MPa√m) (m/cyl) (MPa√m) (m/cyl) (MPa√m)
K-inc., C=0.16 mm-1 (cont.) 1.81E-08 6.66 3.64E-08 8.813.98E-07 25.24 1.85E-08 6.70 3.67E-08 8.874.10E-07 25.53 1.88E-08 6.76 3.72E-08 8.923.96E-07 25.84 1.90E-08 6.81 3.80E-08 8.983.89E-07 26.15 1.95E-08 6.85 3.88E-08 9.043.84E-07 26.46 1.99E-08 6.90 3.95E-08 9.103.90E-07 26.80 2.04E-08 6.94 4.04E-08 9.154.05E-07 27.13 2.07E-08 6.99 4.12E-08 9.214.17E-07 27.46 2.06E-08 7.03 4.19E-08 9.274.31E-07 27.79 2.12E-08 7.10 4.26E-08 9.334.52E-07 28.11 2.18E-08 7.15 4.28E-08 9.394.77E-07 28.46 2.23E-08 7.22 4.25E-08 9.454.83E-07 28.80 2.28E-08 7.26 4.28E-08 9.514.80E-07 29.15 2.33E-08 7.31 4.39E-08 9.575.21E-07 29.49 2.35E-08 7.36 4.48E-08 9.646.06E-07 29.84 2.39E-08 7.41 4.55E-08 9.706.48E-07 30.21 2.43E-08 7.45 4.64E-08 9.766.25E-07 30.58 2.43E-08 7.50 4.71E-08 9.826.25E-07 30.98 2.48E-08 7.55 4.77E-08 9.886.74E-07 31.36 2.57E-08 7.60 4.83E-08 9.957.29E-07 31.75 2.59E-08 7.65 4.94E-08 10.017.74E-07 32.13 2.61E-08 7.70 5.07E-08 10.088.30E-07 32.50 2.66E-08 7.75 5.14E-08 10.149.27E-07 32.87 2.69E-08 7.80 5.16E-08 10.21
2.74E-08 7.85 5.22E-08 10.272.82E-08 7.90 5.30E-08 10.34
K-inc., C = 0.16 mm-1 2.86E-08 7.95 5.37E-08 10.401.34E-08 5.96 2.93E-08 8.00 5.46E-08 10.471.37E-08 6.00 2.97E-08 8.05 5.50E-08 10.541.38E-08 6.06 2.98E-08 8.10 5.53E-08 10.611.39E-08 6.10 3.03E-08 8.16 5.64E-08 10.671.42E-08 6.14 3.09E-08 8.21 5.70E-08 10.741.44E-08 6.18 3.12E-08 8.26 5.84E-08 10.841.47E-08 6.22 3.16E-08 8.32 5.95E-08 10.911.52E-08 6.28 3.21E-08 8.37 6.11E-08 11.021.55E-08 6.32 3.23E-08 8.42 6.14E-08 11.091.59E-08 6.38 3.28E-08 8.48 6.18E-08 11.161.62E-08 6.42 3.34E-08 8.53 6.33E-08 11.231.65E-08 6.46 3.39E-08 8.59 6.39E-08 11.311.69E-08 6.51 3.44E-08 8.64 6.42E-08 11.381.72E-08 6.55 3.54E-08 8.70 6.62E-08 11.451.75E-08 6.59 3.60E-08 8.75 6.75E-08 11.52

64
Table E1. Continued
da/dN ∆K da/dN ∆K da/dN ∆K (m/cyl) (MPa√m) (m/cyl) (MPa√m) (m/cyl) (MPa√m)
K-inc., C=0.16 mm-1(cont.) 1.22E-07 15.46 2.05E-07 20.546.80E-08 11.60 1.24E-07 15.56 2.08E-07 20.676.97E-08 11.71 1.24E-07 15.66 2.12E-07 20.877.04E-08 11.78 1.26E-07 15.76 2.14E-07 21.017.11E-08 11.90 1.27E-07 15.86 2.17E-07 21.147.24E-08 11.98 1.30E-07 15.96 2.21E-07 21.287.31E-08 12.05 1.30E-07 16.06 2.23E-07 21.417.32E-08 12.13 1.32E-07 16.16 2.22E-07 21.557.37E-08 12.21 1.35E-07 16.27 2.21E-07 21.697.45E-08 12.28 1.36E-07 16.37 2.24E-07 21.837.57E-08 12.36 1.40E-07 16.48 2.28E-07 21.977.68E-08 12.44 1.42E-07 16.58 2.29E-07 22.117.84E-08 12.52 1.44E-07 16.69 2.29E-07 22.257.97E-08 12.60 1.45E-07 16.80 2.30E-07 22.498.01E-08 12.68 1.48E-07 16.91 2.34E-07 22.688.10E-08 12.80 1.50E-07 17.01 2.41E-07 22.938.21E-08 12.89 1.50E-07 17.12 2.45E-07 23.128.42E-08 13.01 1.51E-07 17.23 2.47E-07 23.278.54E-08 13.09 1.54E-07 17.34 2.48E-07 23.428.63E-08 13.18 1.57E-07 17.45 2.51E-07 23.578.68E-08 13.26 1.57E-07 17.57 2.54E-07 23.728.83E-08 13.35 1.56E-07 17.68 2.55E-07 23.879.03E-08 13.43 1.60E-07 17.85 2.60E-07 24.029.12E-08 13.52 1.62E-07 17.96 2.62E-07 24.189.22E-08 13.60 1.65E-07 18.14 2.61E-07 24.339.38E-08 13.69 1.70E-07 18.25 2.63E-07 24.499.51E-08 13.78 1.72E-07 18.37 2.64E-07 24.659.58E-08 13.87 1.73E-07 18.49 2.70E-07 24.809.68E-08 14.00 1.75E-07 18.61 2.70E-07 24.979.83E-08 14.09 1.76E-07 18.73 2.68E-07 25.131.01E-07 14.23 1.77E-07 18.85 2.69E-07 25.291.02E-07 14.32 1.79E-07 18.97 2.76E-07 25.461.04E-07 14.41 1.81E-07 19.09 2.83E-07 25.611.05E-07 14.50 1.86E-07 19.27 2.90E-07 25.781.07E-07 14.59 1.89E-07 19.39 2.96E-07 25.941.08E-07 14.69 1.88E-07 19.58 2.70E-07 26.581.10E-07 14.78 1.91E-07 19.71 2.77E-07 26.701.12E-07 14.92 1.92E-07 19.82 2.95E-07 26.961.12E-07 15.02 1.93E-07 19.96 3.01E-07 27.131.14E-07 15.16 1.95E-07 20.08 3.08E-07 27.311.18E-07 15.26 1.97E-07 20.22 3.20E-07 27.481.20E-07 15.36 2.00E-07 20.35 3.25E-07 27.65

65
Table E1. Continued
da/dN ∆K da/dN ∆K da/dN ∆K (m/cyl) (MPa√m) (m/cyl) (MPa√m) (m/cyl) (MPa√m)
K-inc., C=0.16 mm-1(cont.) 5.54E-07 32.59 1.16E-06 37.853.29E-07 27.83 5.79E-07 32.89 1.19E-06 38.103.76E-07 28.02 5.75E-07 33.11 1.20E-06 38.333.77E-07 28.19 5.91E-07 33.32 1.20E-06 38.593.37E-07 28.38 6.35E-07 33.53 1.20E-06 38.823.49E-07 28.55 6.59E-07 33.76 1.25E-06 39.083.57E-07 28.73 6.54E-07 33.96 1.31E-06 39.333.67E-07 28.92 6.54E-07 34.18 1.36E-06 39.573.86E-07 29.19 6.58E-07 34.39 1.43E-06 39.833.86E-07 29.38 7.07E-07 34.61 1.43E-06 40.093.88E-07 29.66 7.36E-07 34.83 1.49E-06 40.323.98E-07 29.86 7.35E-07 35.06 1.67E-06 40.613.87E-07 30.04 7.59E-07 35.29 1.72E-06 40.844.55E-07 30.49 7.65E-07 35.53 1.82E-06 41.124.76E-07 30.67 7.70E-07 35.74 2.09E-06 41.394.84E-07 30.86 7.87E-07 36.10 2.39E-06 41.654.72E-07 31.06 8.10E-07 36.30 2.65E-06 41.924.75E-07 31.26 8.76E-07 36.65 2.70E-06 42.154.69E-07 31.45 9.00E-07 36.88 3.34E-06 42.474.66E-07 31.66 9.29E-07 37.13 4.12E-06 42.694.90E-07 31.86 9.90E-07 37.36 4.96E-06 43.025.21E-07 32.07 1.08E-06 37.61 5.46E-06 43.285.38E-07 32.37

66
Appendix F - Ti 6-2-2-2-2 data in 177°C laboratory air at R = 0.1.
Fatigue crack growth rate (da/dN), cyclic stress-intensity (∆K) and effective cyclic stress-
intensity (∆Keff) data for two tests (one K-decreasing and one K-increasing) performed on T-L
oriented Ti 6-2-2-2-2 in 177 °C laboratory air at R = 0.1 and 5 Hz is listed in Table F1. The tests
were conducted in accordance with ASTM E 647 [7] with sinusoidal loading and the normalized
K-gradient (C) for each test is listed in Table F1. This data is shown graphically in Figures 10,
11 and 13. Closure-free ∆K values, determined using the intersection of closure dominated and
Kmax affected results (as demonstrated in Fig. 8), for da/dN less than 1 x 10⁻⁷ m/cycle are also
presented.
Table F1: Fatigue crack growth rate data for T-L oriented Ti 6-2-2-2-2 tested in 177 °C laboratory air at R = 0.1 and 5 Hz.
da/dN ∆K closure-free da/dN ∆K closure-free(m/cyl) (MPa√m) ∆ K (MPa√m) (m/cyl) (MPa√m) ∆K (MPa√m)
K-decreasing, C = -0.079 mm-1 1.26E-09 3.60 2.502.24E-09 4.36 3.11 1.27E-09 3.57 2.512.25E-09 4.34 3.12 1.27E-09 3.55 2.512.20E-09 4.31 3.09 1.24E-09 3.53 2.492.22E-09 4.28 3.10 1.17E-09 3.51 2.442.23E-09 4.25 3.11 1.10E-09 3.49 2.392.19E-09 4.23 3.09 1.07E-09 3.47 2.372.10E-09 4.20 3.03 1.04E-09 3.45 2.351.92E-09 4.18 2.93 9.35E-10 3.43 2.271.84E-09 4.15 2.88 1.00E-09 3.40 2.321.87E-09 4.13 2.90 1.04E-09 3.39 2.352.05E-09 4.10 3.01 9.35E-10 3.36 2.272.25E-09 4.08 3.12 9.06E-10 3.35 2.252.20E-09 4.05 3.09 8.46E-10 3.33 2.212.02E-09 4.03 2.99 8.10E-10 3.31 2.191.97E-09 4.00 2.96 7.57E-10 3.29 2.151.91E-09 3.98 2.92 7.43E-10 3.27 2.141.79E-09 3.96 2.85 7.12E-10 3.25 2.121.78E-09 3.93 2.85 6.27E-10 3.23 2.071.75E-09 3.91 2.83 5.88E-10 3.21 2.041.70E-09 3.89 2.80 5.81E-10 3.19 2.041.65E-09 3.86 2.76 4.93E-10 3.17 1.991.66E-09 3.84 2.77 3.90E-10 3.15 1.961.66E-09 3.82 2.77 3.19E-10 3.13 1.951.62E-09 3.79 2.74 8.38E-11 3.11 1.931.61E-09 3.77 2.741.56E-09 3.75 2.711.49E-09 3.73 2.66 K-increasing, C=0.16 mm-1
1.43E-09 3.71 2.62 1.55E-09 3.55 2.701.38E-09 3.68 2.59 1.56E-09 3.61 2.711.35E-09 3.66 2.56 1.60E-09 3.65 2.731.31E-09 3.64 2.54 1.66E-09 3.69 2.771.25E-09 3.62 2.50 1.72E-09 3.74 2.81
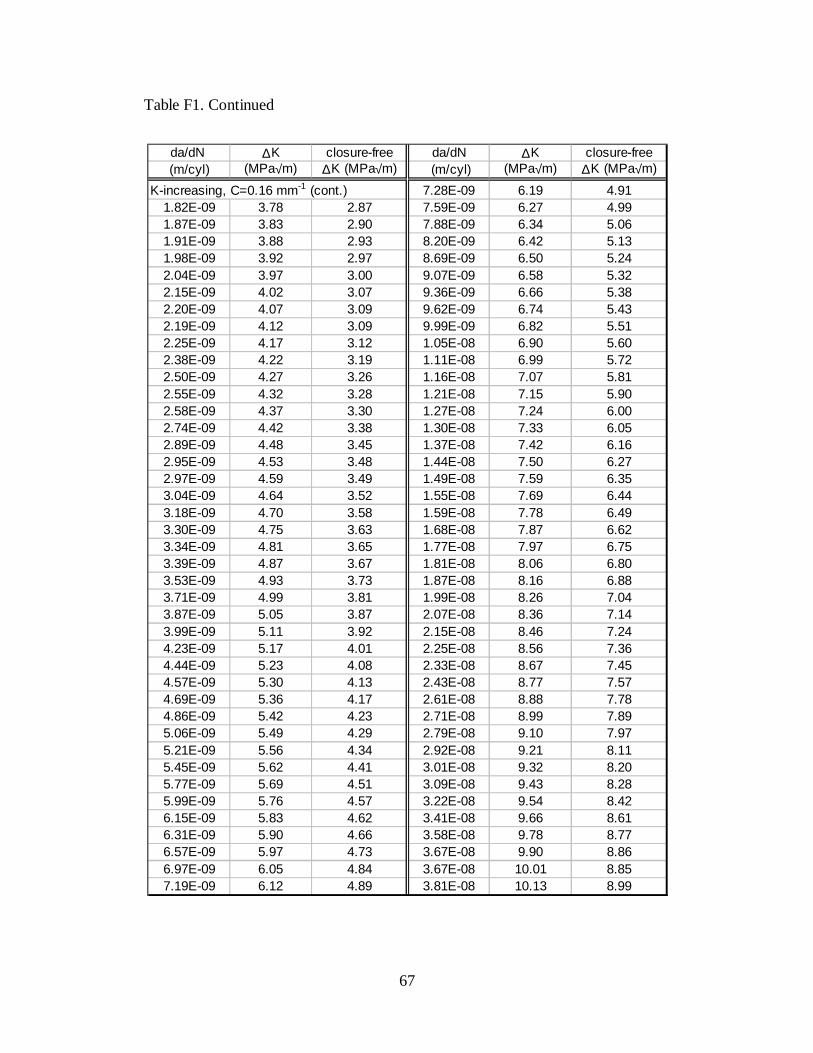
67
Table F1. Continued
da/dN ∆K closure-free da/dN ∆K closure-free(m/cyl) (MPa√m) ∆K (MPa√m) (m/cyl) (MPa√m) ∆K (MPa√m)
K-increasing, C=0.16 mm-1 (cont.) 7.28E-09 6.19 4.911.82E-09 3.78 2.87 7.59E-09 6.27 4.991.87E-09 3.83 2.90 7.88E-09 6.34 5.061.91E-09 3.88 2.93 8.20E-09 6.42 5.131.98E-09 3.92 2.97 8.69E-09 6.50 5.242.04E-09 3.97 3.00 9.07E-09 6.58 5.322.15E-09 4.02 3.07 9.36E-09 6.66 5.382.20E-09 4.07 3.09 9.62E-09 6.74 5.432.19E-09 4.12 3.09 9.99E-09 6.82 5.512.25E-09 4.17 3.12 1.05E-08 6.90 5.602.38E-09 4.22 3.19 1.11E-08 6.99 5.722.50E-09 4.27 3.26 1.16E-08 7.07 5.812.55E-09 4.32 3.28 1.21E-08 7.15 5.902.58E-09 4.37 3.30 1.27E-08 7.24 6.002.74E-09 4.42 3.38 1.30E-08 7.33 6.052.89E-09 4.48 3.45 1.37E-08 7.42 6.162.95E-09 4.53 3.48 1.44E-08 7.50 6.272.97E-09 4.59 3.49 1.49E-08 7.59 6.353.04E-09 4.64 3.52 1.55E-08 7.69 6.443.18E-09 4.70 3.58 1.59E-08 7.78 6.493.30E-09 4.75 3.63 1.68E-08 7.87 6.623.34E-09 4.81 3.65 1.77E-08 7.97 6.753.39E-09 4.87 3.67 1.81E-08 8.06 6.803.53E-09 4.93 3.73 1.87E-08 8.16 6.883.71E-09 4.99 3.81 1.99E-08 8.26 7.043.87E-09 5.05 3.87 2.07E-08 8.36 7.143.99E-09 5.11 3.92 2.15E-08 8.46 7.244.23E-09 5.17 4.01 2.25E-08 8.56 7.364.44E-09 5.23 4.08 2.33E-08 8.67 7.454.57E-09 5.30 4.13 2.43E-08 8.77 7.574.69E-09 5.36 4.17 2.61E-08 8.88 7.784.86E-09 5.42 4.23 2.71E-08 8.99 7.895.06E-09 5.49 4.29 2.79E-08 9.10 7.975.21E-09 5.56 4.34 2.92E-08 9.21 8.115.45E-09 5.62 4.41 3.01E-08 9.32 8.205.77E-09 5.69 4.51 3.09E-08 9.43 8.285.99E-09 5.76 4.57 3.22E-08 9.54 8.426.15E-09 5.83 4.62 3.41E-08 9.66 8.616.31E-09 5.90 4.66 3.58E-08 9.78 8.776.57E-09 5.97 4.73 3.67E-08 9.90 8.866.97E-09 6.05 4.84 3.67E-08 10.01 8.857.19E-09 6.12 4.89 3.81E-08 10.13 8.99
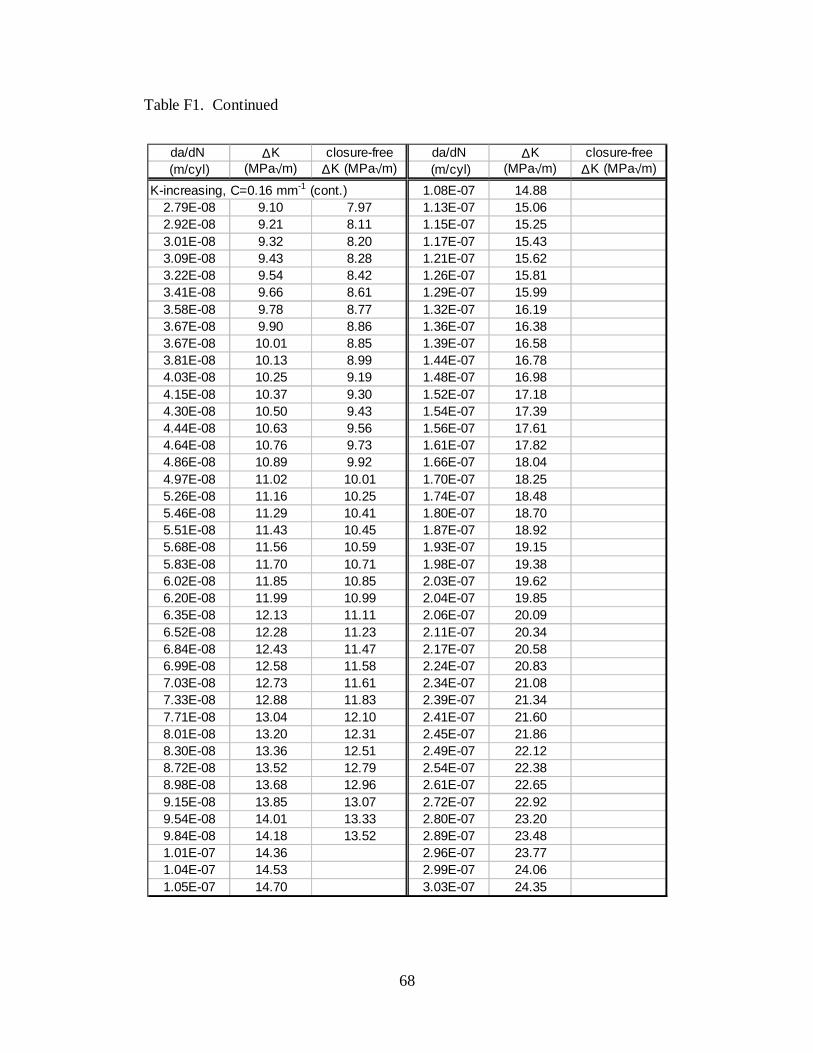
68
Table F1. Continued
da/dN ∆K closure-free da/dN ∆K closure-free(m/cyl) (MPa√m) ∆K (MPa√m) (m/cyl) (MPa√m) ∆K (MPa√m)
K-increasing, C=0.16 mm-1 (cont.) 1.08E-07 14.882.79E-08 9.10 7.97 1.13E-07 15.062.92E-08 9.21 8.11 1.15E-07 15.253.01E-08 9.32 8.20 1.17E-07 15.433.09E-08 9.43 8.28 1.21E-07 15.623.22E-08 9.54 8.42 1.26E-07 15.813.41E-08 9.66 8.61 1.29E-07 15.993.58E-08 9.78 8.77 1.32E-07 16.193.67E-08 9.90 8.86 1.36E-07 16.383.67E-08 10.01 8.85 1.39E-07 16.583.81E-08 10.13 8.99 1.44E-07 16.784.03E-08 10.25 9.19 1.48E-07 16.984.15E-08 10.37 9.30 1.52E-07 17.184.30E-08 10.50 9.43 1.54E-07 17.394.44E-08 10.63 9.56 1.56E-07 17.614.64E-08 10.76 9.73 1.61E-07 17.824.86E-08 10.89 9.92 1.66E-07 18.044.97E-08 11.02 10.01 1.70E-07 18.255.26E-08 11.16 10.25 1.74E-07 18.485.46E-08 11.29 10.41 1.80E-07 18.705.51E-08 11.43 10.45 1.87E-07 18.925.68E-08 11.56 10.59 1.93E-07 19.155.83E-08 11.70 10.71 1.98E-07 19.386.02E-08 11.85 10.85 2.03E-07 19.626.20E-08 11.99 10.99 2.04E-07 19.856.35E-08 12.13 11.11 2.06E-07 20.096.52E-08 12.28 11.23 2.11E-07 20.346.84E-08 12.43 11.47 2.17E-07 20.586.99E-08 12.58 11.58 2.24E-07 20.837.03E-08 12.73 11.61 2.34E-07 21.087.33E-08 12.88 11.83 2.39E-07 21.347.71E-08 13.04 12.10 2.41E-07 21.608.01E-08 13.20 12.31 2.45E-07 21.868.30E-08 13.36 12.51 2.49E-07 22.128.72E-08 13.52 12.79 2.54E-07 22.388.98E-08 13.68 12.96 2.61E-07 22.659.15E-08 13.85 13.07 2.72E-07 22.929.54E-08 14.01 13.33 2.80E-07 23.209.84E-08 14.18 13.52 2.89E-07 23.481.01E-07 14.36 2.96E-07 23.771.04E-07 14.53 2.99E-07 24.061.05E-07 14.70 3.03E-07 24.35

69
Table F1. Continued
da/dN ∆K da/dN ∆K da/dN ∆K (m/cyl) (MPa√m) (m/cyl) (MPa√m) (m/cyl) (MPa√m)
K-inc., C=0.16 mm-1 (cont.) 5.45E-07 35.83 1.88E-06 51.423.11E-07 24.64 5.53E-07 36.28 1.98E-06 52.033.18E-07 24.93 5.74E-07 36.71 2.20E-06 52.653.18E-07 25.24 5.91E-07 37.16 2.35E-06 53.283.21E-07 25.55 5.85E-07 37.61 2.44E-06 53.933.26E-07 25.86 5.94E-07 38.07 2.46E-06 54.533.35E-07 26.17 6.20E-07 38.53 2.65E-06 55.223.37E-07 26.48 6.52E-07 39.00 3.02E-06 55.873.38E-07 26.79 6.87E-07 39.46 3.15E-06 56.553.51E-07 27.12 6.86E-07 39.94 3.35E-06 57.273.64E-07 27.45 6.86E-07 40.42 3.80E-06 57.943.70E-07 27.79 7.15E-07 40.91 4.39E-06 58.653.77E-07 28.13 7.40E-07 41.40 4.68E-06 59.373.86E-07 28.48 7.84E-07 41.91 4.99E-06 60.123.92E-07 28.82 8.53E-07 42.41 5.08E-06 60.813.94E-07 29.16 9.32E-07 42.94 5.41E-06 61.593.98E-07 29.52 9.61E-07 43.45 7.04E-06 62.334.05E-07 29.87 9.58E-07 43.98 8.41E-06 63.164.08E-07 30.23 1.01E-06 44.51 8.57E-06 63.924.07E-07 30.59 1.02E-06 45.03 8.49E-06 64.774.09E-07 30.97 1.04E-06 45.58 9.34E-06 65.474.22E-07 31.33 1.13E-06 46.12 1.21E-05 66.284.38E-07 31.72 1.23E-06 46.68 1.36E-05 67.134.36E-07 32.09 1.28E-06 47.24 1.30E-05 67.994.46E-07 32.94 1.32E-06 47.81 1.64E-05 68.964.52E-07 33.34 1.42E-06 48.39 2.18E-05 69.794.50E-07 33.75 1.51E-06 48.96 2.81E-05 70.864.69E-07 34.17 1.59E-06 49.57 2.79E-05 71.604.90E-07 34.57 1.69E-06 50.18 3.78E-05 73.035.05E-07 35.00 1.81E-06 50.79 3.30E-05 73.785.33E-07 35.41
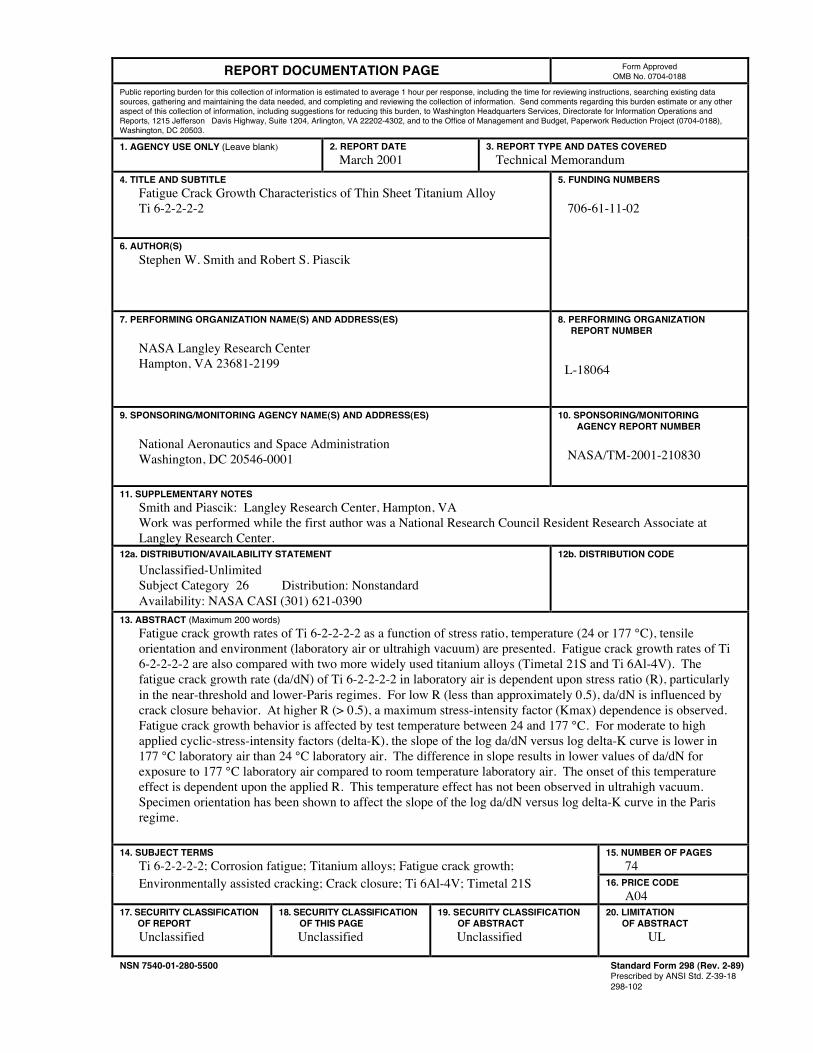
REPORT DOCUMENTATION PAGE Form ApprovedOMB No. 0704-0188
Public reporting burden for this collection of information is estimated to average 1 hour per response, including the time for reviewing instructions, searching existing datasources, gathering and maintaining the data needed, and completing and reviewing the collection of information. Send comments regarding this burden estimate or any otheraspect of this collection of information, including suggestions for reducing this burden, to Washington Headquarters Services, Directorate for Information Operations andReports, 1215 Jefferson Davis Highway, Suite 1204, Arlington, VA 22202-4302, and to the Office of Management and Budget, Paperwork Reduction Project (0704-0188),Washington, DC 20503.
1. AGENCY USE ONLY (Leave blank) 2. REPORT DATEMarch 2001
3. REPORT TYPE AND DATES COVEREDTechnical Memorandum
4. TITLE AND SUBTITLEFatigue Crack Growth Characteristics of Thin Sheet Titanium AlloyTi 6-2-2-2-2
5. FUNDING NUMBERS
706-61-11-02
6. AUTHOR(S)Stephen W. Smith and Robert S. Piascik
7. PERFORMING ORGANIZATION NAME(S) AND ADDRESS(ES)
NASA Langley Research CenterHampton, VA 23681-2199
8. PERFORMING ORGANIZATIONREPORT NUMBER
L-18064
9. SPONSORING/MONITORING AGENCY NAME(S) AND ADDRESS(ES)
National Aeronautics and Space AdministrationWashington, DC 20546-0001
10. SPONSORING/MONITORINGAGENCY REPORT NUMBER
NASA/TM-2001-210830
11. SUPPLEMENTARY NOTESSmith and Piascik: Langley Research Center, Hampton, VAWork was performed while the first author was a National Research Council Resident Research Associate atLangley Research Center.
12a. DISTRIBUTION/AVAILABILITY STATEMENTUnclassified-UnlimitedSubject Category 26 Distribution: NonstandardAvailability: NASA CASI (301) 621-0390
12b. DISTRIBUTION CODE
13. ABSTRACT (Maximum 200 words)Fatigue crack growth rates of Ti 6-2-2-2-2 as a function of stress ratio, temperature (24 or 177 ¡C), tensileorientation and environment (laboratory air or ultrahigh vacuum) are presented. Fatigue crack growth rates of Ti6-2-2-2-2 are also compared with two more widely used titanium alloys (Timetal 21S and Ti 6Al-4V). Thefatigue crack growth rate (da/dN) of Ti 6-2-2-2-2 in laboratory air is dependent upon stress ratio (R), particularlyin the near-threshold and lower-Paris regimes. For low R (less than approximately 0.5), da/dN is influenced bycrack closure behavior. At higher R (> 0.5), a maximum stress-intensity factor (Kmax) dependence is observed.Fatigue crack growth behavior is affected by test temperature between 24 and 177 ¡C. For moderate to highapplied cyclic-stress-intensity factors (delta-K), the slope of the log da/dN versus log delta-K curve is lower in177 ¡C laboratory air than 24 ¡C laboratory air. The difference in slope results in lower values of da/dN forexposure to 177 ¡C laboratory air compared to room temperature laboratory air. The onset of this temperatureeffect is dependent upon the applied R. This temperature effect has not been observed in ultrahigh vacuum.Specimen orientation has been shown to affect the slope of the log da/dN versus log delta-K curve in the Parisregime.
14. SUBJECT TERMSTi 6-2-2-2-2; Corrosion fatigue; Titanium alloys; Fatigue crack growth;
15. NUMBER OF PAGES74
Environmentally assisted cracking; Crack closure; Ti 6Al-4V; Timetal 21S 16. PRICE CODEA04
17. SEC U RITY CL ASSIF IC AT ION O F REPO R TUnclassified
18. SEC U RITY CL ASSIF IC AT ION O F TH IS PA GEUnclassified
19. SECURITY CLASSIFICATION OF ABSTRACTUnclassified
20. LIMITATION OF ABSTRACT UL
NSN 7540-01-280-5500 Standard Form 298 (Rev. 2-89)Prescribed by ANSI Std. Z-39-18298-102