cost optimization of earthwork equipment fleet by productivity analysis … · cost optimization of...
TRANSCRIPT

International Journal of Science and Research (IJSR) ISSN (Online): 2319-7064
Index Copernicus Value (2013): 6.14 | Impact Factor (2015): 6.391
Volume 5 Issue 5, May 2016
www.ijsr.net Licensed Under Creative Commons Attribution CC BY
Cost Optimization of Earthwork Equipment Fleet by
Productivity Analysis - Case Study of NH 50 Phase IV
Bhagyesh J. Chaudhari1, Prof. S. C. Tandale
2, Prof. S. S. Deshmukh
3
1PG Scholar, Trinity Academy Of Engineering and Management Research Center, Pune Maharashtra, India
2Assistant. Professor, Trinity Academy Of Engineering and Management Research Center, Pune Maharashtra, India 3Associate Professor, Trinity Academy Of Engineering and Management Research Center, Pune Maharashtra, India
Abstract: Construction sector particularly infrastructure projects like roads and dams etc. employees various type of construction
equipment in large numbers. In India Excavators, dumpers, dozers, Motor graders, soil compactors etc are most commonly used earth
work equipments on road project. These equipments work in synchronization with each other. Construction equipment are the major
resource in infrastructure projects. Construction equipments occupy major portion of project finance. But improper utilization of such
resource leads to loss of productivity, ultimately affecting profit. This paper tries to shows how productivity and profit optimization of
these equipments can be achieved. To perform these optimization production capacity and cost of equipments, idle period is taken into
consideration. To validate the results, case study of NH50 is taken and it is found that there is increase in profit.
Keywords: Fleet, Construction equipments, production potential, idle period, cost optimization
1. Introduction
In most of the public works operations equipment is
largest support function. The volume of work now a days
are getting increases. The projects are getting very big.
Moreover large and highly competitive markets for
infrastructure projects especially BOT type of contract,
enforces the contractors to complete the project as early as
possible to start regaining the investments. To fulfill the
completion date of such mega projects contractors are
involving various types of construction equipments in
large numbers. These equipments comes under various
sizes and from number of different manufacturers. There
are various types of equipment are being used on sites to
day like excavating equipments like excavator, loading
equipments like front loaders, hauling equipments like
dumpers, spreading equipments like dozers, leveling
equipments like motor graders, compacting equipments
like soil compactors, lifting equipments like cranes etc.
These equipments work in support to each other to
complete the works. This group of equipment together is
known as fleet. A large group of equipments working
together engaged in the same activity, under the same
administration, performing their individual operations to
complete that particular activity is called as a construction
equipment fleet.
1.1 Equipment Fleet
A fleet can be homogenous fleet of similar equipments or
heterogeneous fleets of group of different equipments
when these equipments work together it develop a
complex situation as number of variables increases. This
complexity give raise the use of EMS.
1.2 Equipment management system (EMS)
EMS solves the following problems accompanied with
fleets of various equipments.
1.2.1 Equipment selection and optimization
Equipment selection means which type of equipment to be
assigned for this particular type of work. As we discussed
there are large variety of equipment are available to do
project, it is very important to choose proper equipment
which will be feasible financially and functionally.
Equipment optimization means assigning optimum number
of equipment so as to reduce the idle period of this
equipment.
1.2.2 Productivity analysis and monitoring
This is another important element regarding the production
calculation of the equipments. It do the study of cycle
times, loading capacity, performances of loading.
Basically this component works to find out and optimize
the production potential of equipments.
This EMS make easy to monitor the production potential
in real time using latest data communication technologies.
1.2.3. Position and material monitoring
When these equipment work they work simultaneously.
This develops congestion on hauling route. Also it
equipment are not positioned where they should be then it
hamper the activity. This component helps to monitor of
these equipments so as to reduce congestion on hauling
roads at loading sites.
But this is not limited up to position monitoring only. This
also helps to monitor which type of material and in which
quantity the equipment is shifting. This is very important
from safety point of view of both equipments and
operators. This also analyzes performance of the overall
fleet which gives managers exact idea about the
productivity of the fleet.
Paper ID: NOV163975 2266

International Journal of Science and Research (IJSR) ISSN (Online): 2319-7064
Index Copernicus Value (2013): 6.14 | Impact Factor (2015): 6.391
Volume 5 Issue 5, May 2016
www.ijsr.net Licensed Under Creative Commons Attribution CC BY
1.3 Research motivation
The construction industry has undergone automation and
still is. Contractors are employing more and more
equipments to get job done. And they are being successful.
Top managements are trying to provide best working
environment to its working executives. But equipments are
still used and managed on the basis of the experience.
These methods are resulting in production losses, delays
which ultimately lead to loss in profit of company.
1.4 Aim of paper
This paper aims towards optimizing the cost of fleet at site
using productivity analysis.
2. Methodology
3. Case Study
For this paper case study of national highway 50 Sinnar to
nashik road from chainage 177/00 to 201/350 is taken.
This is 4 layning project of whole NH50 form Pune to
nashik. It is divided in 4 phases each phase being
constructed by different subcontract.
Name of department/authority: The chief engineer,
National Highway (P.W.D) Maharashtra, kokan Bhawan,
Navi Mumbai-400614
Cost of project (INR): Rs. 313.00 Crores.
Date of completion: 2 years after appointed date.
3.1 Economics of equipment:
Cost of equipment comprises the major part of economy of
the project. It is very important to know the equipment
economy in order to optimize the expense spend on these
equipments, total cost required to operate these
equipments.
Economy of construction equipment can be divided in two
parts one of them being ownership cost and another being
operation cost.
3.1.1. Ownership cost:
Every equipment enters in organization’s resource pool
through purchase or lease or renting basis. The ownership
cost is sum of various expense required to owning the
equipment.
Purchase cost at showroom.
If money is borrowed from then rate of interest.
Taxes as property.
Insurance against the security.
Storage cost.
Some time transportation charges are also becomes part
of ownership cost.
Ownership cost is have to pay weather equipment is
operating nor not. It is cost related with finance of
equipment and not the expenses required for operating it.
From the well maintain record of previous equipments it
easy to understand relatively accurate ownership cost.
Annualized purchase can said as the cost equivalent to
purchase cost for every year calculated with some rate of
interest on capital.
3.1.2 Operating cost:
Operating cost of equipment is expense required to operate
the equipment. The difference between ownership cost and
operating cost is that ownership cost is there whether
equipment is working or static but operating cost is
required only when the equipment is under operation.
Like ownership cost, operating cost also comprises various
cost like
Minor maintenance charges
Fuel and lubrication cost
Operator wages
Repair charges
In this project following operating costs are considered
Fuel Consumption
Engine oil
Hydraulic oil
Paper ID: NOV163975 2267
International Journal of Science and Research (IJSR) ISSN (Online): 2319-7064
Index Copernicus Value (2013): 6.14 | Impact Factor (2015): 6.391
Volume 5 Issue 5, May 2016
www.ijsr.net Licensed Under Creative Commons Attribution CC BY
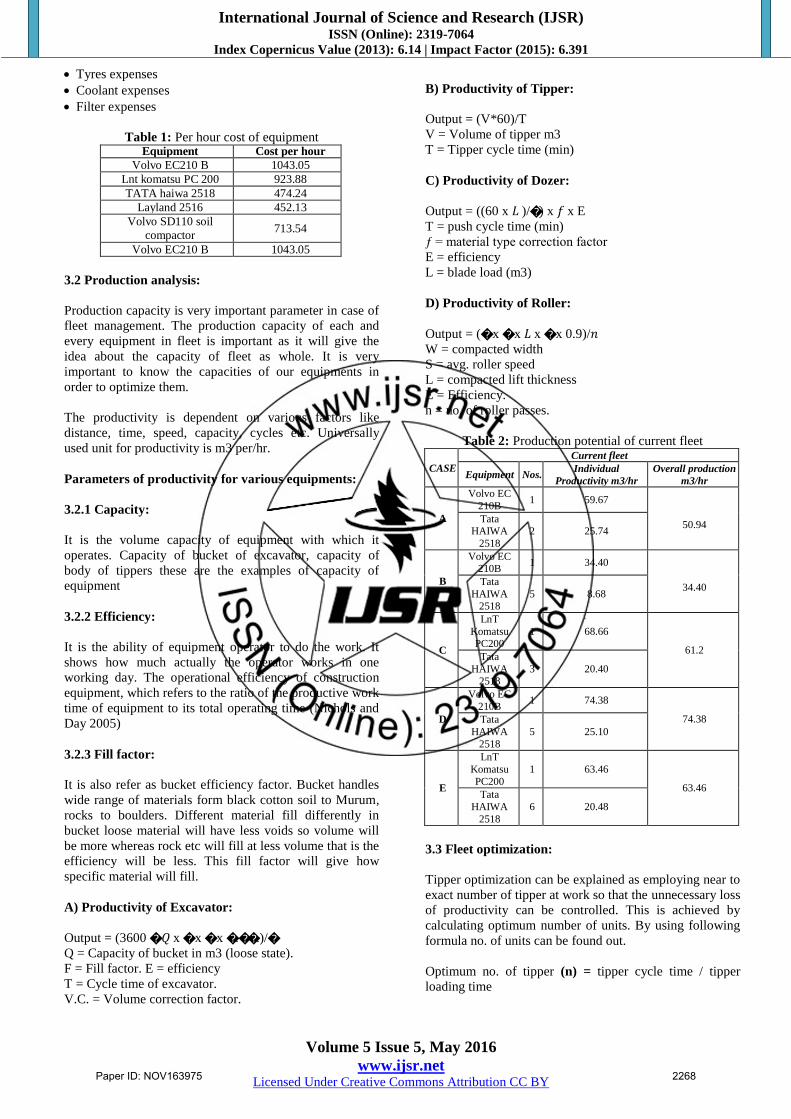
Tyres expenses
Coolant expenses
Filter expenses
Table 1: Per hour cost of equipment Equipment Cost per hour
Volvo EC210 B 1043.05
Lnt komatsu PC 200 923.88
TATA haiwa 2518 474.24
Layland 2516 452.13
Volvo SD110 soil
compactor 713.54
Volvo EC210 B 1043.05
3.2 Production analysis:
Production capacity is very important parameter in case of
fleet management. The production capacity of each and
every equipment in fleet is important as it will give the
idea about the capacity of fleet as whole. It is very
important to know the capacities of our equipments in
order to optimize them.
The productivity is dependent on various factors like
distance, time, speed, capacity, cycles etc. Universally
used unit for productivity is m3 per/hr.
Parameters of productivity for various equipments:
3.2.1 Capacity:
It is the volume capacity of equipment with which it
operates. Capacity of bucket of excavator, capacity of
body of tippers these are the examples of capacity of
equipment
3.2.2 Efficiency:
It is the ability of equipment operator to do the work. It
shows how much actually the operator works in one
working day. The operational efficiency of construction
equipment, which refers to the ratio of the productive work
time of equipment to its total operating time (Nichols and
Day 2005)
3.2.3 Fill factor:
It is also refer as bucket efficiency factor. Bucket handles
wide range of materials form black cotton soil to Murum,
rocks to boulders. Different material fill differently in
bucket loose material will have less voids so volume will
be more whereas rock etc will fill at less volume that is the
efficiency will be less. This fill factor will give how
specific material will fill.
A) Productivity of Excavator:
Output = (3600 � 𝑄 x � x � x �.��.)/� Q = Capacity of bucket in m3 (loose state).
F = Fill factor. E = efficiency
T = Cycle time of excavator.
V.C. = Volume correction factor.
B) Productivity of Tipper:
Output = (V*60)/T
V = Volume of tipper m3
T = Tipper cycle time (min)
C) Productivity of Dozer:
Output = ((60 x 𝐿 )/�) x 𝑓 x E
T = push cycle time (min)
ƒ = material type correction factor
E = efficiency
L = blade load (m3)
D) Productivity of Roller:
Output = (� x � x 𝐿 x � x 0.9)/𝑛 W = compacted width
S = avg. roller speed
L = compacted lift thickness
E = Efficiency.
n = no. of roller passes.
Table 2: Production potential of current fleet
CASE
Current fleet
Equipment Nos. Individual
Productivity m3/hr
Overall production
m3/hr
A
Volvo EC
210B 1 59.67
50.94 Tata
HAIWA
2518
2 25.74
B
Volvo EC 210B
1 34.40
34.40 Tata
HAIWA 2518
5 8.68
C
LnT
Komatsu PC200
1 68.66
61.2 Tata
HAIWA 2518
3 20.40
D
Volvo EC
210B 1 74.38
74.38 Tata
HAIWA
2518
5 25.10
E
LnT
Komatsu
PC200
1 63.46
63.46 Tata
HAIWA
2518
6 20.48
3.3 Fleet optimization:
Tipper optimization can be explained as employing near to
exact number of tipper at work so that the unnecessary loss
of productivity can be controlled. This is achieved by
calculating optimum number of units. By using following
formula no. of units can be found out.
Optimum no. of tipper (n) = tipper cycle time / tipper
loading time
Paper ID: NOV163975 2268

International Journal of Science and Research (IJSR) ISSN (Online): 2319-7064
Index Copernicus Value (2013): 6.14 | Impact Factor (2015): 6.391
Volume 5 Issue 5, May 2016
www.ijsr.net Licensed Under Creative Commons Attribution CC BY
Table 3: Optimized numbers and production potential of optimizes fleet
CASE
Optimized fleet
Equipment Nos. Individual Productivity m3/hr Overall production
m3/hr
A
Volvo EC
210B 1 59.67
59.67 Tata
HAIWA
2518
4 25.74
B
Volvo EC
210B 1 34.40
34.40 Tata
HAIWA
2518
8 8.68
C
LnT
Komatsu
PC200
1 68.66
68.66
Tata
HAIWA
2518
6 20.40
D
Volvo EC
210B 1 74.38
74.38 Tata
HAIWA
2518
9 25.10
E
LnT
Komatsu
PC200
1 63.46
63.46 Tata
HAIWA
2518
5 20.48
Table 4: Cost of excavation of current fleet Case Quantity (m3) Cost of Excavation( Rs)
A 2453.84 85585.98
B 1350.96 50618.48
C 1652.40 45231.40
D 10150.00 149088.63
E 2639.80 33537.16
Table 5: Cost of excavation of optimized fleet Case Quantity (m3) Cost of Excavation (Rs)
A 2453.84 37655.09
B 1350.96 29507.75
C 1652.40 18325.33
D 10150.00 58954.20
E 2639.80 27947.64
4. Result and Discussion
4.1 Optimize fleet:
The following table shows the o fleet of TATA Hyva
14.95m3 for each case under consideration. The table
gives the difference of number of hauling units between
current fleet engaged on site and the optimize fleet that is
derived from the calculation performed.
Table 6: Nos no hauling units Case Current Fleet Optimized Fleet
A 2 Nos. 4 Nos.
B 5 Nos. 8 Nos
C 3 Nos. 6 Nos.
D 5 Nos. 9 Nos.
E 6 Nos. 5 Nos.
3.4 Cost of excavation:
Total Cost of excavation is nothing but the cost required to
complete the processes of excavation and hauling. This
can be found out by using following formula
Paper ID: NOV163975 2269

International Journal of Science and Research (IJSR) ISSN (Online): 2319-7064
Index Copernicus Value (2013): 6.14 | Impact Factor (2015): 6.391
Volume 5 Issue 5, May 2016
www.ijsr.net Licensed Under Creative Commons Attribution CC BY
TC = M (c) (Hn + He) / N (sh) 60
4.2 Production potential:
After the productivity analysis for both cases following
table shows the difference in production potential of the
both fleets i.e. current and optimized.
Table 7: Cost of excavation of current fleet
Case
Current Fleet Optimize fleet %
Productivity
m3 Type
Productivity
m3 Type
increase in
productivity
A 50.94 Tipper
59.67 Excavator
17.13% control control
B 34.4 Excavator
34.4 Excavator
- control control
C 61.2 Tipper
68.66 Excavator
12.18% control control
D 74.38 Excavator
74.38 Excavator
- control control
E 63.46 Excavator
63.46 Excavator
- control control
Where,
M = Project quantity (M3)
C = tipper corrected cycle time (min) Hn = tipper O&O
cost
He = Excavator O&O cost
N = Number of tipper
Sh = Size of tipper (M3)
5.3 Cost comparison:
Following table shows the comparison between total cost
of excavation between current fleet and optimized fleet. It
can be seen that the cost has decrease in case of optimized
fleet. This happened because of change of fleet from tipper
control to excavator.
Table 8: Cost of excavation of optimized fleet
Case Cost of current
fleet
Cost of optimized
fleet
% reduction in
cost
A 85585.98 37655.09 56.00
B 50618.48 29507.75 41.71
C 45231.40 18325.33 59.49
D 149088.63 58954.20 60.46
E 33537.16 27947.64 16.67
Total 364061.66 172390.013 52
5. Conclusion
From the above discussed results it can be concluded that:
The optimized fleet gives more productivity than current
fleet employed at site.
Cost comparison shows the up to 50% reduction in the
cost of excavation for optimized fleet than current fleet.
References [1] Amir Tavakoli, Johannes J. Masehi and Cynthia S. Collyard,
FLEET: Equipment Management System, Journal of
Management in Engineering, Vol.6, 1990, 211-220.
[2] Douglas D Gransberg, Optimizing Haul Unit Size And
Number Based On Loading Facility Characteristics, Journal
Of Construction Engineering And Management, 1996, 248-
253.
[3] Serji Amirkhanian and Nancy J. Baker, Expert System For
Equipment Selection For Earth-Moving Operations, Journal
of construction engineering and management, 1992, 318-
331.
[4] Nipesh Pradhanga and Jochen Teizer, Automatic spatio-
temporal analysis of construction site equipment operations
using GPS data, Automation in Construction, 2013, 107-122
[5] Simon D. Smith, Earthmoving Production Estimation using
Linear Regression Techniques, Journal of construction
engineering and management, 1999, 133-141.
[6] C William Ibbs and Kenneth R. Tarveer, Integrated
Construction Preventive Maintenance System, Journal of
Construction Engineering and Management, 1984, 43-59.
[7] Thanapun Prasertunganian and B.H.W Hadikusumo,
Modeling the Dynamics of Heavy Equipment Management
Practices and Downtime in Large Highway Contractors,
Journal of Construction Engineering and Management,
2009, 939-947.
[8] Y.R. Anbhule, Prof. M.B. Kumthekar, 3D Equipment
Management System for Highway Construction Projects:
Conceptual Design, Journal of Mechanical and Civil
Engineering, 2013, 1-4
[9] IS.11399.1.1985
[10] Construction planning, equipment, methods – Peurifoy,
Schnexyder, shapira
[11] Norms for Production of Construction Machinery and
Manual Labour- V.B. Pandit
Paper ID: NOV163975 2270