cost and volume trends in health care facility construction · cost and volume trends in health...
TRANSCRIPT

Cost and volume trends in health care facility construction by William L England
In 1987 the Health Care Financing Administration proposed adding capital cost reimbursement w the prospective payment system A data base was developed from which an index was calculated to adjust for geographic variation in construction cost Findings from the data base along with a description of trends in health care facility construction from 970 through 1986
are presemed Spending (in constant 1986 dollars) and volume of health care facility construction declined from 1970 to 1986 Construction cost per square foot increased umil 1983 followed by a decline to pre-1980 levels after the 1983 implementation of the prospective paymellt system
Introduction
In May 1987 the Health Care Financing Administration (HCFA) published a proposal to incorporate capital-related costs into the Medicare prospective payment system (Federal Register 1987a) Included in the proposal was an index to adjust the proposed fixed capital (construction cost) reimbursement system for historical geographic variation in the cost of hospital construction HCF As proposal was not implemented because with the Omnibus Budget Reconciliation Act of 1987 Congress pushed back the question of including capital in the prospective payment system (PPS) until 1991 However the data base used by HCF A to compute the PPS construction cost index is of historical interest for analysis of health care facility construction trends
Health care facility construction data
After reviewing a number of potential data sources HCFA selected the DodgeData Resources Incorporated (DodgeORI) Construction Potentials data base as the best data source for calculating the PPS construction cost index The DodgeDRI data base is widely used by the construction industry and it contains information on all major building projects in the country both new construction and alterations that have a projected value of more than $25000 The data are collected from building permit offices and other sources by a network of I 500 field correspondents The data recorded on each project include the project starting date type of facility to be built contract cost square footage to be constructed and location by city and county Data are entered into the data base after a contract has been signed and construction is to begin within 60 days (Federal Register 1987a)
To maintain consistency with the PPS wage index and to obtain a reasonable degree of specificity in geographic variation HCFA chose to calculate the construction cost index at the level of metropolitan statistical areas (MSAs)
This report was written with the support of Grant No 11829 from the Robert Wood Johnson Foundation while the author was at the University of Wisconsin-Madison The opinions expressed are those of the author and do not necessarily reflect the opinions of the Foundation
Reprint requegtts William L England PhD Health Care Financing Administration Room 2306 Oak Meadows Building 6325 Security Boulevard Baltimore Maryland 21207
and New England county metropolitan areas (NECMAs) which are the equivalent of MSAs in the New England area (Federal Register 1986) This produced a separate index value for each of the 317 MSAs and NECMAs as well as for the 48 State rural areas outside MSA or NECMA boundaries (Using MSA or NECMA definitions New Jersey and Rhode Island have no rural areas)
OriginaJly HCFA planned to calculate the index using only health care facility construction data from Dodge DRI This data set included hospitals clinics medical offices nursing and convalescent facilities and other health treatment buildings However for the 17 years of data available (1970-86) 36 percent of the data cells for MSAs NECMAs or rural areas were empty Of the 365 areas 110 had no reported health care facility construction in at least 9 of the 17 years and 12 areas had 3 or fewer years of construction during the 17-year period
To avoid the controversy of developing a method to accommodate the random variation that would result from calculating the index with such scarce data in some areas HCFA instead merged the health care facility construction data with non-health care non-residential institutional construction data from DodgeDRL This second set of data was thought to be a reasonable proxy for geographic variation in the cost of hospital construction It included schools and colleges laboratories not owned by manufacturers libraries and museums capitols courthouses city halls other government buildings houses of worship and other religious buildings However merging the two sets of data without adjusting for differences in the types and cost of construction also proved controversial (Federal Register 987b)
When these two sets of data were combined all areas had data recorded for each year the total volume of recorded construction increased from 06 to 42 billion square feet and the total cost of construction in the data base increased from $77 billion to $330 billion in constant 1986 dollars (As used in this article volumemiddotmiddot means square feet of construction and cost and spending for construction are synonymous)
The PPS construction cost index was computed by calculating an annual index for each of the 365 areas (the ratio of each areas cost per square foot to the national average for the respective year) and then computing a 17-year index for each area by weighting the 17 annual indexes for each area by the volume of construction in each area for each year Any of the 6205
Health Care Financing ReviewSummer 1990Volumc 11 Number~ 87
(365 x 17) area values for cost per square foot that exceeded three times or were less than one-third the national average for their respective year were excluded as outliers The final index was normalized to have a national mean of 10 For the published index only 15 years of data were used 1972~86 rather than the full 17 years of data available because it was found that the 2 additional years had almost no impact in further stabilizing the index from random year-to-year variation (Federal Register I987b)
The data used for this article include both the health care facility construction data set and the institutional construction data set A population data set was also developed for each area to normalize the cost and volume of construction to a per capita basis (US Bureau of the Census 1976 and 1986) US Department of Commerce data were used to deflate costs to constant 1986 dollars (US Department of Commerce 1987) In the Commerce Department data 1982 was the base year (1982 = 100) For this article a conversion was made to 1986 = 100 The resulting cost deflators were 1970 3063 1971 2874 1972 2700 1973 2484 1974 2158 1975 1982 1976 1898 1977 1758 1978 1564 1979 1382 1980 1246 1981 1151 1982 1118 1983 1090 1984 1051 1985 1020 and 1986 1000
The analysis for this article is at the national and census division level rather than at the level of MSAs NECMAs and rural areas At this level the health care facility construction data and the institutional construction data can be directly compared without adjusting for empty data cells because on the division level none of the cells in the health care facility construction data set was empty However because the analysis is not at the level of MSAs NECMAs and rural areas it is not directly comparable with the PPS construction cost index
Methods
The 17 years of MSA NECMA and rural area data were aggregated into the nine census divisions and costs were multiplied by the US Commerce Department deflation factors to give constant 1986 dollars In the graphs in Figures 1-5 and the corresponding Tables 1-5 the national and division averages are shown The solid and gray shading in the graphs is used to separate adjacent years
To distinguish the possible influence of PPS on trends in the data separate graphs were developed for the PPS waiver States (Massachusetts Maryland New Jersey and New York) and for the remaining nonwaiver States The States comprising each division and their waiver status are given in Table 6 Because costs for construction in Alaska and Hawaii were thought to be substantially different from costs for the 48 contiguous States their data were excluded from this analysis Separate graphs were developed for urban and rural areas The urban graph is the average for all MSAs and NECMAs in the country the rural graph is the average for all State rural areas and the national average includes all States and areas
The graphs in Figure I and the values in Table I were derived by dividing the total annual spending for health care facility construction in each area by the area
population to give the annual per capita health care facility construction spending For Figure 2 and Table 2 the annual volume of health care facility construction was divided by the population to give the annual per capita square feet of health care facility construction For Figure 3 and Table 3 the total annual cost was divided by the total annual volume of health care facility construction to give the average health care facility construction cost per square foot For Figure 4 and Table 4 the cost per square foot of health care facility construction in an area was divided by the area cost per square foot of institutional construction to produce a ratio of health care facility to institutional construction costs For Figure 5 and Table 5 the volume of health care facility construction was computed as a percentage of the total volume of health care facility and institutional construction in the data base (ie both data sets)
Descriptive statistics for the graphs in the figures are given in the tables The mean is the average of the data over the 17 years The coefficient of variation was computed by dividing the standard devialion by the mean The annualized rate is the slope of a simple linear regression line fit to the data converted to a compound annual percentage rate of change R2 is the amount of variation explained by the regression
To aid in discerning short-term trends in the data a piecewise linear regression model was used For such a model the regression line is a series of connected straight line segments or pieces with one or more breakpoints (changes in the slope of the graph) over the 17~year interval A multiple linear regression was run with 16 dummy variables to determine the best piecewise linear fit of the data Dummy variable I contained the numbers 0 through 16 in ascending order dummy variable 2 contained two zeros followed by I through 15 and so on to dummy variable 16 which contained 16 zeros followed by a I Regression with these variables allowed the slope of a regression for each graph to change in any year Dummy variables were entered into the regression until R2 exceeded 070 or until five variables were entered (The choice of using 0 70 or five variables was made to balance simplicity and accuracy in the model)
The piecewise linear model for each graph begins at the left-axis intercept value in 1970 and has zero slope until the year of breakpoint I which may also be 1970 In that year the regression line begins sloping at the annualized rate shown for breakpoint I In the year shown as breakpoint 2 the slope changes to the annualized tale shown for breakpoint 2 and so on to the last breakpoint year shown The slope from the last breakpoint continues to 1986 If less than five breakpoints are shown then R2 the percent of variation explained by the piecewise linear regression exceeded 0 70 with fewer than five breakpoints and additional dummy variables were not entered into the model
Results
As shown in Figures 1-3 and Tables 1-3 per capita spending and square feet of health care facility construction declined significantly from 1970 to 1986 but the cost per square foot remained relatively constant (in 1986 dollars) An exception to these trends took place in
Health Care Financing ReviewSummer 1990Volnmc II Nnmber 4 88
Figure 1 Health care facility construction spending per person In 1986 constant dollars by census division
waiver status of States and urban-rural areas United States 1970-86
1970 1975 1980 1985 1970 1975 1980 1985 Division 1 Division 2 1
New England Middle A11an1ic 1(CTMEMANHRIVT) (NJNYPA)
NCSCVAWV)
1970 1975 1980 198511970 1975 1980 198511970 1975 1980 1985 Division 3 Division 4 Division 5
South Atlantic East North Central East Sooth Central (OCDEFLGAMO (llINMIOHWI) (ALKYMSTN)
Division 8 Division 9 Mountain Pacific
(AZCOIDMT (CAORWA) NVNMUTWY)
1970 1975 1980 1985 1970 197S 1980 1985 1970 1975 1980 1985 Urban areas Rural areas Nalional average
Division 6 West N011h Central
(IAKSMNMO
Division 7 West South Central
(AALAOKTX) NENDSD)
1970 1975 1980 1985 1970 1975 1980 1985 Waiver States Non-waiver States
(MAMDNJNY) (All other States)
Alaska and Hawaoi are also in this census dMsoon but were excluded from the analyses
SOURCES DodgeData Resources Incorporated Construction Potentials data base (US Bureau of the Census 1976 and 1986)
Healtb Care Financing ReviewSummer 1990volon 11 Number 4 89
Table 1 Regression models for graphs In Figure 1
Model statistic
Division
WaNer States
Nonwaiver States aro areas
National average
Now England
(1)
Middle Atlantic
(2) AUantlc
(3)
North Central
(4)
East Soltrth Central
(51
West North
Central (6)
w South
Contral (7)
Mountain (8)
Poclflc (9)
Single-variable linear regression MoM Coefficient of variation Annualized rate R
Piecewlse2 Hnear regression left-axis Intercept R Breakpoint 1
Annualized rate Yoar
Breakpoint 2 Annualized rate Year
Breakpoint 3 Annualized rate Year
Breakpoint 4 Annualized rate Year
Breakpoint 5 Annualized rate Year
$1837 424 -3~9
284
$2409 708
200 1970
-359 1972
-3 1974
26 1976
~76 1985
$2019 476
-462 521
$3637 748
148 1970
-296 1971
-37 1973
$2266 299
-315 474
$2431 717
57~ 1970
-153 1971
-26 1974
$2041 356
-395 607
$2569 704
-38 1974
-241 1982
$2190 w
-167 130
$2361 473
-49 1977
228 1981
-594 1983
758 1984
-336 1985
$2136 420
-406 468
$1869 750
206 1970
-45 1973
-124 1976
$2374 ~14
-118 043
$2270 731
142 1971
-216 1974
312 1978
146 1980
-279 1983
$2056 292 41
005
$1434 584
565 1971
-10 1972
617 1981
-334 1982
90 1984
$1678 ~95
-322 289
$2234 783
308 1970
-158 1971
92 1978
$1965 559
-531 561
$4362 792
-178 1970
-27 1975
$2088 231
-281 597
$2662 807
-58 1972
57 1979
-208 1983
$2266 Z12
-315 574
$3246 723
-99 1971
0 1975
-155 1983
$1441 288
-358 710
$1798 770
-73 1975
$2074 284
-324 655
$2905 831
-7~ 1971
middot~1978
-145 1982
1The cumulative slope of the regression Is shown converted Into a oompound annual percentage rate of dlange 2A piecewise ~nampar regression approximates the graph as a series of oonnected straight ~neMgments wltn 1 or mor breakpoints or dlanges In the slope ol the graph determined tyen multiple linear 181~- RZindlcates the amount of varlallon explained by the regression
middot-
SOURCES OodgeiData Resourt~N lll(X)rporated Construction Potentials data base (US Bureau of the Census 1976 and 1986)
=
Figure 2 Health care facility square feet of construction per person by census division waiver status of
States and urban-rural areas United States 1970-86
Division 1 Division 2 Division 3 Dlvision4 Division 5 New England Middle Allantic South Atlantic East North Central East South Central
(CTMEMANHRIVT) (NJNYPA) (OCOEFLGAMO (ILINMIOHWt) (ALKYMSTN)
Division 6 West North Central
(IAKSMNMO NENOSO)
Waiver States Non-waiver States
NCSCVAWV)
Division 8 Mountain
(AZCOIOMT NVNMUTWY)
Urban areas
1
1970 1~si~~ 198S
Pacific (CAOAWA)
Rural areas National average (MAMONJNY) (All other States)
Alaska and Hawau are also on thos census division bul were excluded I rom the analyses
SOURCESmiddot OodgeiDaa Resources Incorporated Constructoon PotenJals data basemiddot (US Bureau olthe Census 1976 and 1986)
Health Care Financing ReviewSummer 1990Volume 11 Number 4 91
Table 2
Regression models for graphs In Figure 2 Division
East Eost Wegtt West Now Middle South Noltth South North Soth
Model statistic England
(t) Atlantic
(2) Atlantic
(3) Central
(4) Central
(5) Central
(6) Central
(7) MOIIltain
(B) Pacitlc
(9) Waiver States
Nonwaiver States
Rural
National average
Slngl~variable linear regression
1192 t302 t936 1499 1922 1735 2054 1735 1400 1186 1699 1750 1211 1625 CoeffiCient o1 variation 408 457 309 272 237 419 225 Z17 520 545 253 273 304 271 Annualized rate1 -380 -469 -lt330 -lt394 -183 -375 -188 -43 -468 -640 -313 -lt322 -lt373 -lt340 R 417 568 499 550 203 280 115 007 452 622 654 651 709 708
Plecewlse2 linear regression Left-axis Intercept 1903 2585 2093 2017 2422 1320 1864 1520 2622 2598 2280 2501 1605 2314
737 711 811 717 494 728 876 468 811 628 829 822 801 945 Breakpoint 1
Annualized rate 22 -171 280 -102 -113 315 376 85 -164 -168 -75 -79 -93 -74 Ye 1970 1970 1970 1974 1971 1970 1971 1971 1970 1970 1972 1971 1974 1971
Breakpoint 2 Annualized rate -233 -62 -246 16 1 -22~ -241 7 82 -lt37 32 39 -1 27 Ye 1972 1973 1972 1978 1973 1973 1973 1975 1978 1975 1978 1978 1978 1978
Breakpoint 3 Annualized rate 21 -26 -lt345 -(392 286 137 878 -178 -164 -206 -168 Ye 1975 1974 1993 1993 1975 ton 1981 1983 1983 1983 1993
Breakpoint 4 AnnuaHzed rate -622 841 -112 -217 -312 Ye 1985 1984 1976 1983 1982
Breakpoint 5 Annualized rate -414 140 Ye 1985 1984
lfhe cumulative slope of the regression Is shown convened lniO a compound amual peroenlage rate of change 2A piecewise linear egression approximates the graph as a series of oomeoled straight line segll1Eiflts wilt11 ()( mmt biHkpolnts or changes In the slope of the graph determined bf multiple lklear regression R2 indlcales the amount of variation explained by the regression SOURCES DodgEIOata Resources Incorporated Construction Potentials date base (US Bureau of the Census 1976 and 1986)
=
Figure 3 Health care facility construction cost per square foot in 1986 constant dollars by census division
waiver status of States and urban-rural areas United States 1970-86
1970 1975 1980 1985 Division 1 Division 2
New England i Middle Allan he (CTME MANH RIVT) 1 (NJNYPA)
1970 1975 1980 1985 1970 1975 1980 1985 Division 6 Division 1
WSt North Central West South Central (IAKSMNMO (ARLAOKTX)
NENDSD) I
Division 3 South Atlanlrc
(OCDEFLGAMD NCSCVAWV)
1970 1975 1980 1985 Division 8 Mountain
(AZCOIDMT NVNMUTWYI
Division 4 East Nonh Central (llINMIOHWI)
i g
i I ~
~ ~
~ ~ ~
s
i iI i i I
~
Ii ~
0 i sect ~ ~
1970 1975 1980 1985
Division 9 Pacitic
(CAORWA)
DivisionS Eas1 Soulh Cenlral
(AlKYMSTN)
Waiver States (MAMDNJNY)
Urban areas Rural areas National average Non-waiver States (All olher States)
1Alaska and Hawai1 are also in thiS census divisugtn but were excluded from the analyses
SOURCE DodgeData Resources Incorporated Construction Potentbullals data base
Health Care Financing Re~middotiewSummer 1990Volbullmlt 11 Numigter 4 93
Table 3
Regression models for graphs in Figure 3 Division
Model statistic
New England
(1)
Middle AUantic
(2)
Sooth Atlantic
(3)
East Nonh
Central (4)
Eost South Central
(5)
West North
Central (6)
West Soth
Central (7)
Mountain (8)
Pacific (9)
Waiver States
Nonwaiver States
Urban areas
Aural areas
National average
Slnglbullvarlable linear regression MeM Coeffident of variation Annualized rate1 R
Plecewise2 linear regression left-axis intercept R Breakpoint 1
Annualized rate Year
Breakpoint 2 Annualized rate Year
Breakpoint 3 Annualized rate Year
Breakpoint 4 Annualized rate y
Breakpoint 5 Annualized rate Year
$1535 11 1
51 060
$1269 798
228 1970
2 1971
-273 19n
155 1978
-33 1981
$1549 105
38 035
$1597 760
-27 1972
45 1978
-276
$1177 065
32 064
$1211 689
-73 1971
45 1973
-10 19n
-32 1982
86 1984
$1368 072 -11 006
$1485 724
-40 1970
19 1974
27 1976
-lt2 1981
194 1985
$1135 098 13
004
$1102 661
39 1975
-39 19n
53 1979
-274 1983
42 1984
$1234 106 -65 107
$1259 784
61 1980
-369 1982
440 1993
-104 1984
$1163 104
66 115
$1139 731
-82 1971
17 1972
220 1980
-91 1981
16 1984
$1190 138 93
134
$983 580
101 1970
-91 1972
77 1974
-63 1979
-28 1980
$1270 150 te7 539
$1063 735
-31 1970
50 1972
-16 1980
$1648 119
13 003
$16EL2 764
-40 1975
126 1979
-114 1982
216 1984
-312 1985
$1236 052 43
192
$1217 731
-32 1971
20 1973
-22 1981
$1296 049
24 062
$1337 742
-82 1971
42 1973
15 1974
-25 1982
$1196 063 18
023
$1113 762
15 1970
-45 1980
141 1983
-89 1984
$1280 047
24 071
$1305 718
-45 1971
16 1973
-27 1982
The cumulaHve slope of the reogreS~Ion Js shoWn converted Into a compound annual percentage rate of change 2A piecewise tinear regression approximates lhe graph as a series of connected straight line segments wiltl1 or more breakpoints ordlanges in the slope of the graph determined by multiple liJlear regression Rbull indicates the amount ol variation explain~ by the regression
SOURCE DodgeData Resouroes Incorporated COnstruction Potentials data base
=
the early I Y80s when the spending volume and cost per square foot of health care facility construction all increased rapidly for a few years then declined abruptly after 1983 These trends are most apparent in the national average graphs Whether these trends are continuing cannot be predicted because the large discontinuity in the graphs between 1983 and I 984 makes forecasting beyond 1986 ba~ed on pre-1984 data highly speculative
As seen from the three-breakpoint regression fit for the national average in Table I per capita construction spending (in 1986 dollars) declined an average of 75 percent annually from 1971 to 1978 then increased 63 percent annually from 1978 to 1982 followed by a 145-percent annual decline from 1982 to 1986 However these rates are only averages In particular the post-1983 decline took place mostly in 1984 when per capita spending decreased 38 percent to below the 1978 leveL From 1984 to 1986 spending remained nearly constant Overall construction spending declined an average of 32 percent per year throughout the 17-year period
The same pattern is seen for urban areas except that urban spending averaged 9 percent more than the national average throughout the period ($2266 per capita versus $2074 per capita) Conversely per capita spending in rural areas averaged 30 percent less than the national average ($1441 versus $2074) or 36 percent less than urban spending Also the elevated 1971-72 spending shown in the urban and national graphs is absent in the rural graph and the 36-percent average annual decline in rural spending exceeds the 32-percent average annual decline in urban spending
The pattern for the nonwaiver States is quite similar to the national average (as expected because this graph is an average of the data for 46 of the 50 States) The pattern for the waiver States is like the national pattern but greatly exaggerated with per capita spending dropping from $42 in 1971 to $9 in 1978 The reason these States received waivers is that they had implemented alternative hospital cost-containment systems prior to 1983 The presumed impact of these systems in reducing construction spending compared with the rest of the country is evident in this graph Per capita spending in the waiver States declined an average of 53 percent annualy almost twice the 28-percent rate of decline in the nonwaiver States
The division graphs in Figure I have patterns similar to the national graph with per capita spending declining throughout the period The exception is Division 8 (the Mountain States) where spending increased an average of OA percent per year including a 1982 jump that far exceeded the highs of the early 1970s Average spending in the last 3 years varied among the divisions by more than 100 percent ranging from a low of $8 per capita annually in Division 6 (the West N01th Central States) and in the rural areas to a high of $17 per capita annualy in Division 7 (the West South Central States)
The trends in per capita health care facility construction volume in Figure 2 are similar to the spending trends in Figure I with the 34-percent national average decline being interrupted by a rapid increase from 1981 to 1983 The volume of construction averaged 31 percent less in rural areas than in urban areas and the rate of decline in
the waiver States was almost twice the rate of decline in the nonwaiver States Division 8 (the Mountain States) had the smallest average annual decline Again the 1984-86 values varied by more than 100 percent among the divisions from a low of 007 square feet per capita in Division 6 (the West North Centml States) and in the rural areas to a high of 016 in Division 7 (the West South Central States)
As seen in Figure 3 the national average cost per square foot displays an M pattern with cost peaking at $133 in 1971 decreasing to $116 in 1973 then slowly climbing to $139 in 1981 declining to $126 in 1983 and remaining at that level through 1986 Overall the cost per square foot of health care facility construction is seen to be relatively stable in constant dollars increasing only 024 percent per year However the R 2 of 0071 indicates that a linear fit of these data is a poor model of the yearshyto-year variation The three-breakpoint regression fit is much better with an R2 of 0 718 As seen from this model the cost per square foot declined 45 percent annually from 1971 to 1973 then increased 16 percent annually to 1982 followed by a 27-percent average annual decline to 1986
Considerably more year-to-year variation and more rapid rates of change are seen in the other graphs in Figure 3 than in the national graph On average the cost per square foot was 84 percent higher in urban areas ($1296) than in rural areas ($1116) No mid-1170s decline in cost occurred in the rural areas rather there was a 15-percent average annual increase from 1970 to 1980 After peaking at $135 per square foot in 1980 rural cost declined significantly through 1983 rose 14 percent in 1984 and then dropped sharply in 1985 and 1986 This pattern is different from that seen for the urban areas where cost peaked at $142 per square foot in 1982 and remained constant from 1984 to 1986
The waiver States had much greater year-to-year variability in cost per square foot than the nonwaiver States had This may be because of the smoothing effect of the larger volume of data for the nonwaiver States However the increase in cost per square foot that took place nationally in the early 1980s appears to have been more exaggerated for the waiver States than for the nonwaiver States and the 1985 jump in cost for the waiver States did not take place in the nonwaiver States Most of this jump is attributable to New Jersey (which accounted for 23 percent of the waiver States construction volume) where cost rose from $127 to $225 per square foot in 1985 and to New York (44 percent of the volume) where cost rose from $159 to $184 per square foot in 1985 In 1986 New Jersey dropped to $180 per square foot and 4 percent of the waiver States volume and New York dropped to $125 per square foot but increased to 63 percent of the volume
For Divisions I and 2 (the New England and Middle Atlantic States respectively) and for the waiver States the M pattern of the national graph is greatly exaggerated Overall the cost per square foot was consistently much higher in these divisions and the waiver States than in the other divisions However the large 1986 cost decline in Divisions I and 2 not experienced by the other divisions brought them more in line with the rest of the Nation
Health Care inandng ReviewSummer 1990volumo 11 Numbe~ ~ 95
As seen in Figure 4 and Table 4 the ratio of the cost per square foot of health care facility construction to the cost per square foot of institutional construction had a national average of 1819 and a range over the I7 years from 155 in 1973 to 205 in 1981 Throughout the 1970s the cost of heallh care facility construction increased an average of 25 percent faster per year than the cost for institutional construction did However after the peak in 1981 the cost of institutional construction increased an average of 35 percent faster per year than the cost of health care facility construction did with most of the increase occurring in 1983
On the division level the ratios in Figure 4 vary greatly For Divisions I and 2 (the New England and Middle Atlantic States respectively) and for the waiver States the ratio was generally at or below the national average meaning that allhough health care facility construction cost was high in those areas (Figure 3) the cost was relatively low when nonnalized by institutional construction cost The 335-percent drop in the ratio for the waiver States in 1986 is significant because it is an indication that the 1986 drop in the cost per square foot of health care facility construction for the waiver States (Figure 3) did not result from a general decline in construction cost in those States
Ideally for the institutional construction data to be used as a proxy for hospital construction the ratios in Figure 4 should be relatively constant Because they are not merging the two sets of data together biased the index for or against some areas For example the ratio in Division 5 (the East South Centml States) tended to be above the national average except in 1984 and 1985 but the cost per square foot of health care facility construction in that division (Figure 3) was generally below the national average This suggests that the cost of institutional construction in Division 5 was even further below the national average than the cost of health care facility construction was Therefore merging the two data sets to compute the PPS construction cost index biased the index against Division 5
In addition merging the data sets to compute an index middotImplied an assumptlon that geograpllic variation in the volume of health care facility and institutional construction in the data was random However as seen in Figure 5 and Table 5 the variation was not random For example the urban average was 375 percent higher than the rural average In Division 8 (the Mountain States) health care facility construction averaged only 10 percent of the total volume compared with 19 percent of the volume in Division 2 (the Middle Atlantic States) From 1970 to 1986 the national percentage of health care facility construction ranged from 10 to 215 percent with even larger variation at the division level Thus merging the two sets of data without adjusting for differences in the volume and type of construction biased the index For example Division 2 (the Middle Atlantic States) was favored and Division 8 (the Mountain States) was disadvantaged Smaller biases occurred for other divisions and urban areas were favored over rural areas
An additional comparison of the health care facility and institutional construction data sets was accomplished by performing the PPS construction cost index calculations on each data set individually This produced two indexes
that were computationally equivalent to the original index The correlation coefficient for the two indexes was 0525 for 17 years of data or 0467 if only the 15 years 1972-86 were used The standard deviation for the 17-year health care facility construction index was 0197 In comparison the standard deviation was 0162 f~)fthe institutional construction index (The standard devmtwn equals the coefficient of variation because the index was normalized to a mean of 10)
Discussion
Around 1980 a reversal occurred in the trend toward declining health care facility construction volume and spending that began in the early 1970s A possible explanation of this reversal is that it resulted from concerns about a possible Medicare hospital cost-control system (the prospective payment system) before it was determined that caphal (construction) cost would be excluded Hospitals may have rushed to begin construction projects in the early 1980s expecting that a capital reimbursement system might be more generous with old construction debt than with new debt When the actual legislation in April 1983 placed a moratorium on including capital costs in PPS the rush of capital projects subsided leading to the large downturn in construction that occurred in 1984
Another theory for the increase in health care facility construction volume and spending of the early 1980s at least for tax-exempt facilities is the demand for taxshyexempt bonds that was fueled by tax changes making it advantageous to purchase such bonds before 1983 (Merrill Lynch Pierce Fenner and Smith Inc 1983) Although the early 1980s were a period of high interest rates hospitals that could use tax-exempt financing for construction enjoyed much lower rates
Other factors that may have contributed to the increased construction volume and spending in the early 1980s include the loss of regulatory influence of health systems agencies which may have temporarily depressed construction in the late 1970s and the growth of alternative delivery systems It is notable that the surge in construction volume and spending in the early 1980s did not generally bring volume and spending back up to the levels of the early 1970s except in Division 8 (the Mountain States) as shown in Figure I
The 1981-82 upturn in the graphs of Figure 3 indicates that not only were health care facilities doing more construction than in previous years but they were also paying more per square foot (in constant dollars) Perhaps the increased construction volume created a builders market and contractors became less competitive in pricing Alternatively in a rush to beat PPS and tax law changes health care facilities may not have sought or obtained as competitive rates as they might otherwise have The health care facility construction data set does not contain information to permit adjusting for the specific types of construction that took place Therefore it is also possible that health care facilities rushed to get capital-intensive projects such as surgery unit renovations underway before PPS began and that may have caused a temporary increase in the construction cost per square foot
Health Care Financing ReviewSummer I99GVolumc 11 Numlgtcr 4 96
Figure 4 Ratio of health care facility to non-health care institutional construction cost per square foot
by census division waiver status of States and urban-rural areas United States 1970-86
1970 1975 1980 1985 Division 1
New England (CTMEMANHRIVT)
1970 1975 1980 1985 Division 2
Middle Atlantic (NJNYPA)
1970 1975 1980 1985 Division 3
South Atlantic (DCDEFLGAMD
NCSCVAWV)
1970 1975 1980 1985 Division 4
East North Central (llINMIOHWI)
1970 1975 1980 1985 Divisions
East South Central (ALKYMSTN)
Division 6 West North Central
(IA_KSMNMO NENDSD)
Division 7 West South Central
(ARLAOKTX)
Division a Mountain
(AZCOIDMT NVNMUTWY)
Division 9 Pacific
(CAORWA)
I
I sect
j iII ~ ~ E sect
sect nl
13
E
E ~
EI-l I I ~ sect Ei ~sectsect E 1I
t970 t975 1980 1985 National averageWaiver States Urban areas Rural areasNon-waiver States
(MAMONJNY) (All other States)
Alaska and Hawaibull are also on thos census dovosoon but were excluded from the analyses
SOURCE DodgeData Resources Incorporated Constructoon Potentoals data base
Health Care Financing ReviewSummer 1990Volumo 11 Number 4 97
Table 4 Regression models for graphs in Figure 4
Model statistic
Division
Waiver States
Nonwaiver States
Urban areas
Rural National average
New England
(1)
Middle Allan tic
(2)
South Atlantic
(3)
North middotmiddot~ Central
(4)
East South
Central (5)
We~ North
Central (6)
w Soth
Central (7)
Mountain (8)
Pacific (9)
Single-variable linear regression Meon Coefficient of variation Annualized rate1
R
Plecewlse2 linear regression Left-axis intercept R Breakpoint 1
Annualized rata Ye
Breakpoint 2 Annualized rate v
Breakpoint 3 Annualized rate Ye
Breakpoint 4 Annualized rate Ye
Breakpoint 5 Annualized rate Yealt
1766 130
91 144
1236 648
2Z5 1970
-15 1972
195 1979
-16 1980
-133 1985
1727 083 69
155
15euro6 716
15 1970
-122 1963
207 1984
-272 1985
1785 101 101 301
1650 781
-54 1971
64 1973
-15 1978
1910 091 15
007
1801 717
46 1974
-78 1978
40 1979
-67 1981
159 1985
1903 125 44
034
1750 722
26 1973
-292 1983
42 1984
1886 123 -32 018
1837 789
17 1973
-364 1982
50~ 1963
-148 1984
1906 115 59
074
1853 706
-98 1971
27 1972
163 1980
-109 1961
49 1984
1763 131 82
114
1542 671
15 1970
219 1976
-195 19n
277 1978
-38 1979
1692 149 182 509
1472 701
-102 1971
46 1972
-23 1981
1794 124 46
037
1630 704
16 1970
63 1900
-113 1982
169 1984
-335 1985
1819 083 82
285
15n 817
24 1970
-34 1981
1798 089 98
369
1530 847
26 1970
-32 1981
1868 086 17
011
1673 884
24 1970
-73 1980
170 1983
-99 1984
1819 084 86
308
1567 883
25 1970
-35 1981
1The cumulative slope of the JVQression b shown converted into a compound annual peroentage rate of dlange 211 piecewise linear IV(Ireuion appmximates the graph as aseries of connected straight lne segments wilh 1or more brea~ or changes in the slope of the graph detennined by multiple linampar regression R2 indicatamps the amount of variation explained by the ~egression
shy SOURCE DodgeJ()ata Resouron lnoorporaled constnJctlon Potentials clata base
Figure 5 Health care facility square feet of construction as a percentage of total institutional square feet of
construction by census division waiver status of States and urban-rural areas United States 1970-86
Division 1 New England
(CTMEMANHRIVT)
Division 2 Middle Atlan11c
(NJNYPA)
1970 1975 1960 1985 Division 3
South Atlantic (OCDEFLGAMO
Division 5 East South Central
(AlKYMSTN)
Division 4 East North Central (tlINMIOHWI)
NCSCVAWV)
1970 1975 1980 1985 Division 6
West N0gt1h Central (IAKSMNMO
NENDSO)
1970 1975 1980 1985 1970 1975 1980 1985 1970 1975 1980 1985 Division 7 Division 8 I Division 9
West South Central Mountain Pacif1c (ARLAOKTX) (AZCOIOMT (CAORWAJ
NVNMUTWY)
1970 197S 1980 1985 1970 1975 1980 1985 Waiver States Non-waiver States Urban areas Rural areas National average
(MAMONJNY) (All other States)
1Aiaska and Hawa1i are also in this census d1vision but were excluded from the analyses
SOURCE- DodgeData Resources Incorporated Construction Potentoals data base
Health Care Financing ReviewSummer 1990voturre 11 Number 4 99
Table 5 g Regression models for graphs in Figure 5
Division
East East w~ Wo~ New Middle South North South North South
Model statistic England
(1) Atlantic
(2) Atlantic
(3) Central
(4) Central
(5) Central
(6) Central
(7) Mountain
(8) Pacific
(9) wStates
Nonwaiver States
urn areas
Rural areas
Nationalaverage
Single-variable linear regression MoM 1424 1880 1386 1497 1601 1551 1398 1008 1409 1575 1441 1530 1155 1448 Coefficient of variation 387 347 234 ~bullo 285 348 277 279 343 337 209 213 222 206 Annualized rate 237 175 -27 71 161 -81 -134 125 -262 138 -23 14 -92 -06 R 141 086 003 011 106 016 073 062 229 054 003 001 051 000
Plecewlse2 linear regression Left-axis Intercept 985 1161 1320 1347 1621 1428 1649 1134 R 684 678 537 713 787 740 729 759
1650 1193 1399 1458 1159 1401 777 489 822 782 768 823
Breakpoint 1 Annualized rate 571 98 84 169 -149 21 -160 -291 y 1971 1970 1976 1978 1972 1970 1974 1970
480 69 104 83 231 105 1970 1971 1979 1978 1981 1979
Breakpoint 2 Annualized rate -303 -120 -263 -225 113 501 60 26 -196 -105 -420 -419 -436 -421 Yoalt 1972 1977 1979 1982 1975 1982 1977 1971 1971 1977 1983 1983 1983 1983
Breakpoint 3 Annualized rate 155 1025 162 -lt43 -461 -721 164 310 119 1044 -117 -90 -170 -103 Yoalt 1974 1980 1980 1983 1983 1983 1979 1980 1976 1980 1984 1984 1984 1984
Breakpoint 4 Annualized rate -329 -79 -350 716 46 -421 -322 -124 -197 Yoalt 1982 1981 1983 1984 1984 1983 1982 1982 1981
Breakpoint 5 AnnuaUzad rate -115 -196 -144 -467 -125 74 -135 Yoalt 1983 1982 1984 1985 1984 1984 1982
1The cumulallve slope of the regression Is shown converted lnlo a compound annual peroentage rate of change 2A pleoewlse linear regression approximate$ the graph as a series of connected straight line segments with 1 or more breakpoints or chan~ In the slope of the graph determined by multiple linear regression R21ndlcates the amount of variation explained by the regression
SOURCE DodgeJData Aesounes IBCOrpora1ed construction Potentials data base
=
Table 6 States by census division and waiver status United States 1970-86
Division and waiver status States included
Division New England
Middle Atlantic
South Atlantic
East North Central East South Central West North Central West South Central
Mountain
Pacific
Waiver status Waiver
Nonwaiver
Connecticut Maine Massachusetts New Hampshire Rhode Island Vermont
New Jersey New York Pennsylvania District of Columbia Delaware Florida Georgia Maryland North Carolina South Carolina Virginia West Virginia
Illinois Indiana Michigan Ohio Wisconsin Alabama Kentucky Mississippi Tennessee Iowa Kansas Minnesota Missouri Nebraska North Dakota South Dakota
Arkansas Louisiana Oklahoma Texas Arizona Colorado Idaho Montana Nevada New Mexico Utah Wyoming California Oregon Washington
Massachusetts Maryland New Jersey New YorK Remainder
bullAlaska and Hawaii are also in this census division but were excluded from the analyses
NOTE Wabullver States were exempt from the Medicare prospective payment system implemented in 1983 nonwaiver States were not
SOURCES US Bureau ol he Census Divisional groupbullngs Health Care Financing Administration Wabullver status_
Perhaps the most interesting aspect of these graphs concerns the changes that took place after 1983 The fact that almost every graph reflects an abrupt decline in 1984 strongly suggests that the implementation of PPS had a pronounced effect on health care facility construction Even though PPS did not directly affect construction reimbursemen health care facilities may have cautiously slowed construction out of concern that if or when capital reimbursement was inCOlJOrated into PPS postshyPPS construction debt might be handled less generously than pre-PPS debt
This theory is somewhat supported by the graphs for the waiver States where it is seen that health care facility construction spending and volume underwent a major boom in 1985 prior to the end of the PPS demonstration waivers in New York and Massachusetts in 1986 For New York and Massachusetts the volume of construction increased 133 percent from 1984 to 1985 compared with a lO-percent increase in the other two waiver States (Maryland and New Jersey) and only a small increase in the nonwaiver States Although some health planners were concerned that hospitals would respond to PPS by increasing construction spending in an effort to reduce operating cost by renovation this does not appear to have taken place during the first 3 years of PPS
The significant variation by division in cost per square foot (Figure 3) suggests that a construction cost index was appropriate for the PPS capital reimbursement proposal Although the correlation between the health care facility and institutional construction data sets was only 0525 the institutional construction data were not necessarily inappropriate as a proxy for hospital construction Instead the mediocre correlation could result from the scarcity of data in the health care facility construction data set which caused it to vary widely as evidenced by the 21 percent larger standard deviation for the health care facility construction cost index than for the institutional construction cost index The results shown in Figures 4 and 5 suggest that some sort of
weighting to adjust for geographic variation in the percentage volume of health care facility construction would have been preferable to simply merging the two data sets
Conclusions
Although the per capita annual spending and volume of health care facility construction decreased more than 45 percent during the 17 years 1970-86 the cost per square foot of construction (in 1986 dollars) remained relalively constant In the early 1980s many health care facilities initiated construction projects interrupting the general decline in construction that had lasted throughout the 1970s However the intenuption ended abruptly in 1984 after the implementation of PPS Spending volume and cost per square foot of health care facility construction leveled off and remained quite stable from 1984 to 1986 In spite of the fact that capital cost was excluded from PPS spending for health care facility construction was significantly reduced in 1984 Among the possible explanations for this decline are tax law changes and a concern that capital costs might soon be included in PPS To accommodate what appears to be sizable geographic variation in the cost of health care facility construction this analysis supports the need to include a construction cost index in any future plan to add capital reimbursement to the prospective payment system
References Federal Register Medicare program Changes to the inpatient hospital prospective paymem system and fiscal year 1987 rates Vol 51 No 170 31555-31660 Office of the Federal Register National Archives and Records Administration Washington US Government Printing Office Sept 3 1986
Health Care Financing Re~iewSummer 199tlvoluonc II Numtgtor 4 101
Federal Regisrer Capital payments under the inpatient hospital prospective payment system V-B-1 Detennination of Federal capital payment rates Proposed rule Vol 52 No 18846-18848 and 18858-18864 Office of the Federal Register National Archives and Records Administration Washington US Government Printing Office May 19 1987a
Federal Register Capital payments under the inpatient hospital prospective payment system Il-B-1 Construction costs Final rule VoL 52 No 169 33173-33175 Office of the Federal Register National Archives and Records Administration Washington US Government Printing Office Sept I 1987b
Merrill Lynch Pierce Fenner and Smith Inc Fixed Income Research Department Bond Market Commem 6(12) Mar 25 1983
US Bureau of the Census Statistical Abstract af the United States 1977 98th ed Tables 17 and 21 Washington US Government Printing Office 1976
US Bureau of the Census Statistiml Abstract of the United Swte 1987 107th ed Table~ 33 and 34- Washington US Government Printing Office 1986
US Department of Commerce International Trade Administration Construction Reriew Table E-Ja Monthly Department of Commerce composite construction cost indecs 1964-1987 p 67 Sept-Oct 1987
Health ltare lltimmcing ReviewSummer 19901Wiumo II Numbor 4 102
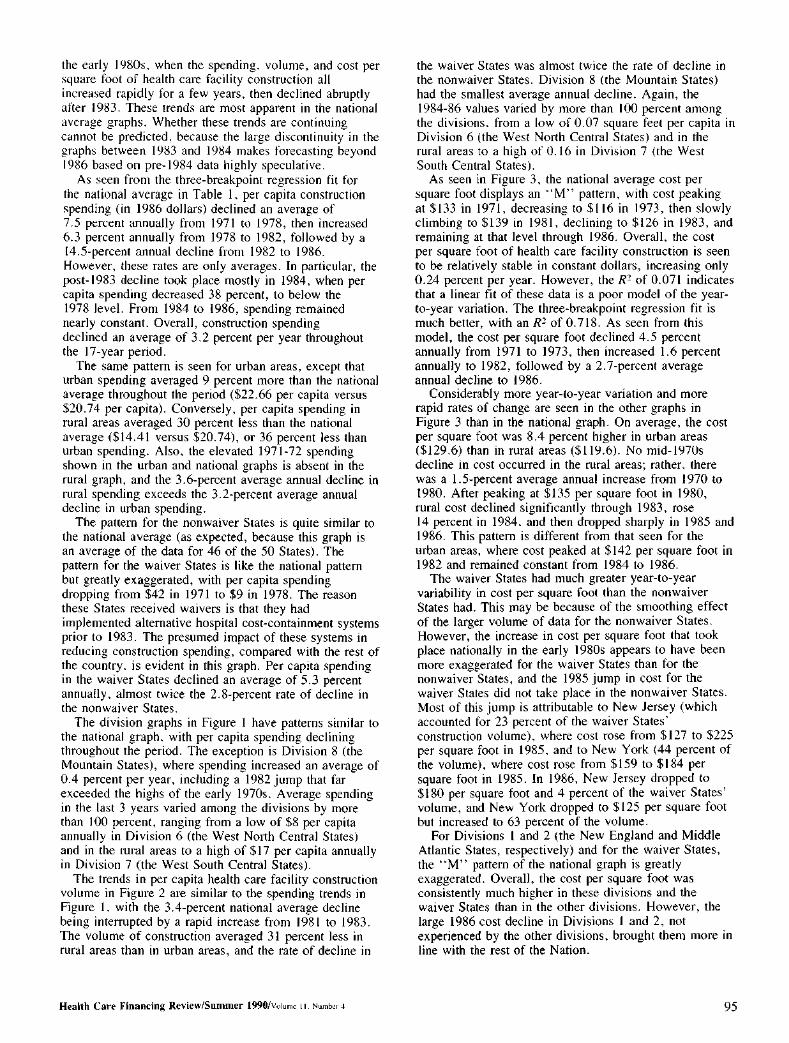
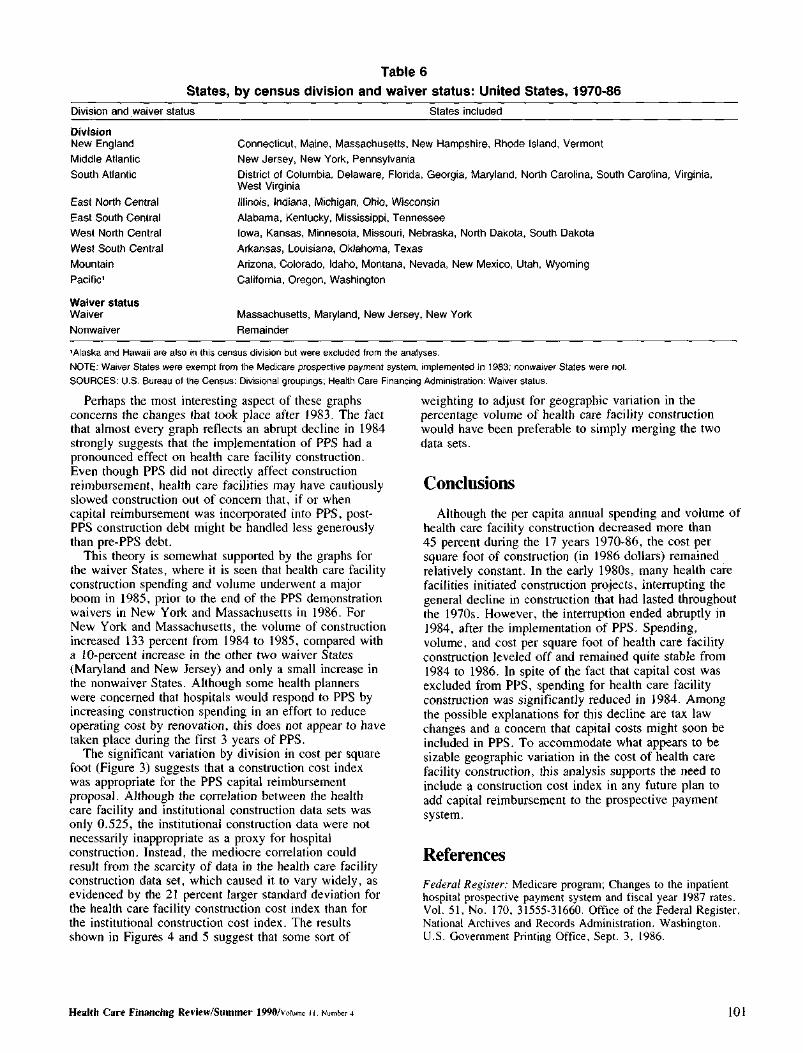