cost and quality consequences of shortening the project ... · ... outline recommendations about...
TRANSCRIPT

Cost and Quality Consequences of Shortening the Project Life Cycle
Mohammadreza Rasta
Master of Science in Mechanical Engineering
Supervisor: Bjørn Andersen, IPKCo-supervisor: Jan Alexander Langlo, SINTEFF
Department of Production and Quality Engineering
Submission date: June 2013
Norwegian University of Science and Technology


]_r:[:i- -i:_i- Date Our reference2013.01.14 BAN/KEDA
Faculty of Engineering Science and Technology
Department of Production and Quality Engineering
MASTER ASSIGNMENT SPRING 2013for
stud. techn. Mohammadreza Rasta
COST AND QUALITY CONDEQUENCES OF SHORTENING THE PROJECTLIFE CYCLE
(Kostnads- og kvalitetskonsekvenser av korte prosjektlivssyklus)
This master thesis work is connected to on-going research to shortening the project life cycle. Specifically, thestudent will investigate the consequences regarding cost and quality when the project time is shortened.
For instance, if the project schedule is shortened, perhaps crash conditions come into effect and more budgetand money is needed to add extra resources to complete the work in less time. If such a cost increase is notpossible, the scope or quality ofthe project could be reduced to accomplish the project within the defined timeand budget.
Thus, when we decide to shrink the project lifecycle and duration of project, it is crucial that different aspectsof shortening the project lifecycle are taken into account. There are several techniques or approaches inliterature that discuss reducing the time and accelerating the project pace, for example like fast tracking andoverlapping either in activity level or phase to phase level, dependency structure matrix and managingiteration and rework, critical chain and buffer management, introducing critical chain rather than critical path,or lean thinking and eliminating waste. The candidate should systematically analyze each phase of a projectand each approach to shortening the project life cycle, to assess possible consequences for cost and quality.
More specifically, the candidate should undertake the following tasks:
1 . Undertake a literature review of theories and approaches that exist for shortening the project durationand ofliterature discussing the relationship between time, cost, and quality.
2. Conduct a systematic analysis of how cost and quality are affected in different project stages byapplying the different approaches and techniques for shortening the duration.
3 . If feasible, perform a survey among proj ect personnel to obtain their views on how shortening timeaffects cost and quality.
4. Based on tasks 2 and 3, outline recommendations about how projects can shorten their durationwithout negative consequences for cost and quality.
Date Our referenceMaster Thesis 201 3 for stud. techn. Mohammadreza Rasta 2013.01.14 BAN/KEDA
5. Outline a plan for testing ofthe framework in real-life projects.
Within three weeks after the date of the task handout, a pre-study report shall be prepared. The reportshall cover the following:
. An analysis of the work task’s content with specific emphasis of the areas where newknowledge has to be gained.
. A description of the work packages that shall be performed. This description shall lead to aclear definition of the scope and extent of the total task to be performed.
. A time schedule for the project. The plan shall comprise a Gantt diagram with specificationof the individual work packages, their scheduled start and end dates and a specification ofproject milestones.
The pre-study report is a part of the total task reporting. It shall be included in the final report.Progress reports made during the project period shall also be included in the final report.
The report should be edited as a research report with a summary, table of contents, conclusion, list ofreference, list of literature etc. The text should be clear and concise, and include the necessaryreferences to figures, tables, and diagrams. It is also important that exact references are given to anyexternal source used in the text.
Equipment and software developed during the project is a part of the fulfilment of the task. Unlessoutside parties have exclusive property rights or the equipment is physically non-moveable, it shouldbe handed in along with the final report. Suitable documentation for the correct use of such materialis also required as part of the final report.
The student must cover travel expenses, telecommunication, and copying unless otherwise agreed.
If the candidate encounters unforeseen difficulties in the work, and if these difficulties warrant areformation ofthe task, these problems should immediately be addressed to the Department.
The assignment text shall be enclosed and be placed immediately after the title page.
Deadline: June 1 Ot1 2013.
Two bound copies of the final report and one electronic (pdf-format) version are required.
Date Our referenceMaster Thesis 2013 for stud. techn. Mohammadreza Rasta 2013.01.14 BAN/KEDA
Responsible supervisor: Bjøm Andersen
Telephone: 73590561 I 92602882
E-mail: bjom.andersen(ntnu.no
Supervisors: Jan Alexander Langlo
Telephone: 92248747
E-mail: jan.a.langlo(sintef.no
DEPARTMENT OF PRODUCTION
AND QUALITY ENGINEERING
I /:‘‘
Per Schjølber
Associate Professor/Head of Department
?Bjøm Andersen
Responsible Supervisor

i
Dedication
This master dissertation is dedicated to my lovely parents who have been supported and encouraged me in all stages of my life. I would like to especially dedicate this work to my father who taught me to stand firm like a mountain against hardships and not be disappointed over failures. I would like to especially dedicate this work to my mother who is emblem of love, forbearance, and warm heartedness.
ii
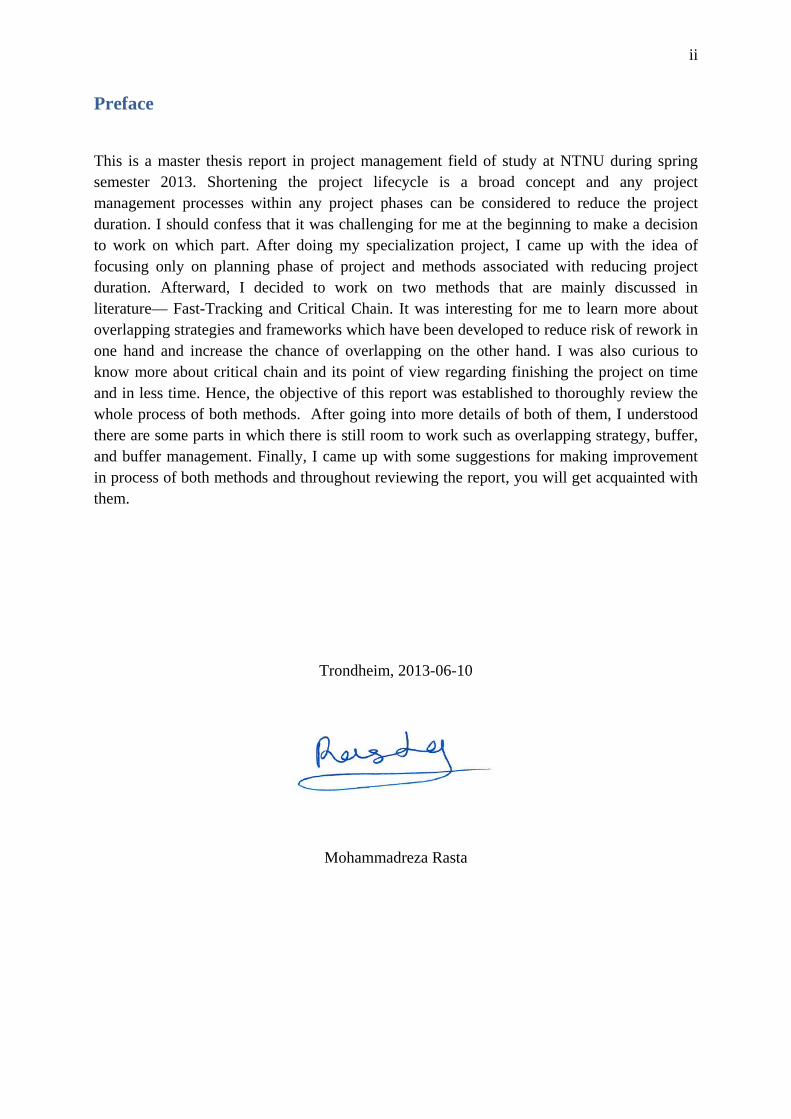
Preface
This is a master thesis report in project management field of study at NTNU during spring semester 2013. Shortening the project lifecycle is a broad concept and any project management processes within any project phases can be considered to reduce the project duration. I should confess that it was challenging for me at the beginning to make a decision to work on which part. After doing my specialization project, I came up with the idea of focusing only on planning phase of project and methods associated with reducing project duration. Afterward, I decided to work on two methods that are mainly discussed in literature— Fast-Tracking and Critical Chain. It was interesting for me to learn more about overlapping strategies and frameworks which have been developed to reduce risk of rework in one hand and increase the chance of overlapping on the other hand. I was also curious to know more about critical chain and its point of view regarding finishing the project on time and in less time. Hence, the objective of this report was established to thoroughly review the whole process of both methods. After going into more details of both of them, I understood there are some parts in which there is still room to work such as overlapping strategy, buffer, and buffer management. Finally, I came up with some suggestions for making improvement in process of both methods and throughout reviewing the report, you will get acquainted with them.
Trondheim, 2013-06-10
Mohammadreza Rasta

iii
Acknowledgment
This thesis project would not have been completed without tremendous contribution of many people. First of all, I would like to express my very great appreciation to my day to day supervisor Associate Professor Dr. Jan Alexander Langlo for his invaluable support and endless patience throughout the work; Advices and guidance given by him has been a great help to accomplish the research. I wish to acknowledge Professor Dr. Bjørn Andersen for his precious and constructive comments. My grateful thanks are also extended to Ms. Siri Bøe Halvorsen for her time and tolerance during the meetings and Ms. Elin Tronhus at library of Valgrinda for helping me in providing needful references. Finally, I would like to offer my special thanks to my dear parents for their generous support and constant encouragement throughout my study.
iv
Abstract
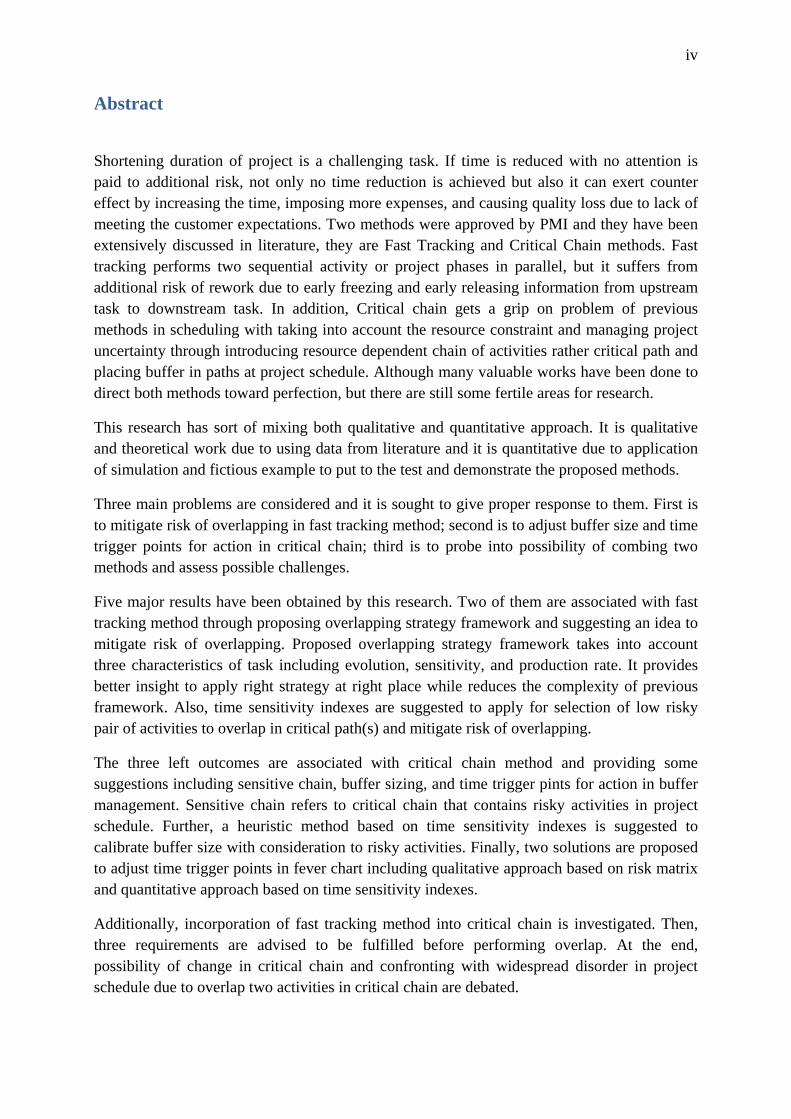
Shortening duration of project is a challenging task. If time is reduced with no attention is paid to additional risk, not only no time reduction is achieved but also it can exert counter effect by increasing the time, imposing more expenses, and causing quality loss due to lack of meeting the customer expectations. Two methods were approved by PMI and they have been extensively discussed in literature, they are Fast Tracking and Critical Chain methods. Fast tracking performs two sequential activity or project phases in parallel, but it suffers from additional risk of rework due to early freezing and early releasing information from upstream task to downstream task. In addition, Critical chain gets a grip on problem of previous methods in scheduling with taking into account the resource constraint and managing project uncertainty through introducing resource dependent chain of activities rather critical path and placing buffer in paths at project schedule. Although many valuable works have been done to direct both methods toward perfection, but there are still some fertile areas for research.
This research has sort of mixing both qualitative and quantitative approach. It is qualitative and theoretical work due to using data from literature and it is quantitative due to application of simulation and fictious example to put to the test and demonstrate the proposed methods.
Three main problems are considered and it is sought to give proper response to them. First is to mitigate risk of overlapping in fast tracking method; second is to adjust buffer size and time trigger points for action in critical chain; third is to probe into possibility of combing two methods and assess possible challenges.
Five major results have been obtained by this research. Two of them are associated with fast tracking method through proposing overlapping strategy framework and suggesting an idea to mitigate risk of overlapping. Proposed overlapping strategy framework takes into account three characteristics of task including evolution, sensitivity, and production rate. It provides better insight to apply right strategy at right place while reduces the complexity of previous framework. Also, time sensitivity indexes are suggested to apply for selection of low risky pair of activities to overlap in critical path(s) and mitigate risk of overlapping.
The three left outcomes are associated with critical chain method and providing some suggestions including sensitive chain, buffer sizing, and time trigger pints for action in buffer management. Sensitive chain refers to critical chain that contains risky activities in project schedule. Further, a heuristic method based on time sensitivity indexes is suggested to calibrate buffer size with consideration to risky activities. Finally, two solutions are proposed to adjust time trigger points in fever chart including qualitative approach based on risk matrix and quantitative approach based on time sensitivity indexes.
Additionally, incorporation of fast tracking method into critical chain is investigated. Then, three requirements are advised to be fulfilled before performing overlap. At the end, possibility of change in critical chain and confronting with widespread disorder in project schedule due to overlap two activities in critical chain are debated.

v
List of Acronyms
AD Axiomatic Design
CCM Critical Chain method
CE Concurrent Engineering
CI Criticality Index
CPM Critical Path Method
CRI Cruciality Index
DPM Dynamic Planning Methodology
GERT Graphical Evolution and Review Technique
MCS Monte Carlo Simulation
PERT Program Evaluation and Review Technique
PMBOK Project Management Body of Knowledge
PMI Project Management Institute
SD System Dynamics
SI Significance Index
SSI Schedule Sensitivity Index
SSQ Square root of the Sum of the Squares
TOC Theory of Constraint
vi
Table of Contents Dedication ................................................................................................................................... i
Preface ........................................................................................................................................ ii
Acknowledgment ....................................................................................................................... iii
Abstract ..................................................................................................................................... iv
List of Acronyms ........................................................................................................................ v
Table of Figures ....................................................................................................................... viii
Table of Tables .......................................................................................................................... ix
1 Introduction ........................................................................................................................ 2
1.1 Background ................................................................................................................ 2
1.2 Objectives ................................................................................................................... 3
1.3 Problem formulation ................................................................................................... 3
1.4 Literature survey ......................................................................................................... 5
1.5 Structure of the report ................................................................................................. 5
2 Research Methodology ....................................................................................................... 9
2.1 Research type ............................................................................................................. 9
2.2 Research approach ...................................................................................................... 9
2.3 Research design ........................................................................................................ 10
2.4 Method of research ................................................................................................... 12
2.5 Limitation of research .............................................................................................. 14
2.6 References and software ........................................................................................... 14
2.7 Deviation report ........................................................................................................ 14
3 Affecting theories in problem formulation ....................................................................... 16
3.1 Six sigma essentials .................................................................................................. 16
3.2 Lean fundamentals ................................................................................................... 17
3.3 Application of lean and six sigma perspectives to formulate the problem .............. 19
4 Shed light on the secrets of Fast-Tracking method .......................................................... 21
4.1 Introduction .............................................................................................................. 21
4.2 Fast Track approach general principles .................................................................... 22
4.3 Fast track overlapping strategies .............................................................................. 23
4.4 Discussion ................................................................................................................ 34
5 Critical Chain method demystification ............................................................................. 39
5.1 Introduction .............................................................................................................. 39
5.2 Critical chain key components ................................................................................. 40
vii
5.2.1 Theory of Constraint ............................................................................................ 40
5.2.2 Critical chain ........................................................................................................ 42
5.2.3 Buffer size ............................................................................................................ 46
5.2.4 Buffer Management .............................................................................................. 49
5.3 Up & downside of Critical Chain Method ............................................................... 50
5.4 Discussion ................................................................................................................ 53
6 Make improvement in Fast Tracking & Critical Chain methods ..................................... 62
6.1 Introduction .............................................................................................................. 62
6.2 Activity-based sensitivity indexes ............................................................................ 62
6.3 Enhancement approach to Fast tracking method ...................................................... 64
6.4 Sensitive chain or critical chain ................................................................................ 68
6.5 A heuristic method for buffer size calculation ......................................................... 69
6.6 Improvement approach to adjust time trigger points in fever chart ......................... 73
7 Make synergy by combination of Fast tracking and critical chain methods .................... 76
7.1 Opportunity and threat .............................................................................................. 76
7.2 Demonstration in fictious example ........................................................................... 78
8 Conclusion and suggestion for future research ................................................................ 82
8.1 Findings and results summary .................................................................................. 82
8.2 Results Vs. objectives ............................................................................................... 84
8.3 Assessment of project work methodology ............................................................... 85
8.4 Pros and cons of results and findings ....................................................................... 86
8.5 Suggestion for future research .................................................................................. 86
9 Reference .......................................................................................................................... 88
10 Appendix .......................................................................................................................... 91
10.1 Overlapping framework ........................................................................................... 91
10.2 Simulation results for both simple and fairly large project network ........................ 92
10.3 Pre study report ........................................................................................................ 93
viii
Table of Figures Figure 1-1: Time reduction and risk ........................................................................................... 2 Figure 1-2: Structure of report .................................................................................................... 7 Figure 2-1: Research design process ........................................................................................ 12 Figure 2-2: Data collection ....................................................................................................... 13 Figure 3-1: Five steps of Six Sigma method (DMAIC) ........................................................... 17 Figure 3-2: Eight types of waste ............................................................................................... 18 Figure 3-3: Problem formulation with Lean and Six Sigma perspectives ............................... 19 Figure 4-1: Types of task relationship ...................................................................................... 23 Figure 4-2: Extremes values of evolution and sensitivity ........................................................ 25 Figure 4-3: Types of overlapping framework .......................................................................... 26 Figure 4-4: Influence of evolution characteristic ..................................................................... 27 Figure 4-5: Effect of design and construction overlapping ...................................................... 28 Figure 4-6: Basic overlapping strategy framework .................................................................. 32 Figure 4-7: Example of enhanced overlapping strategy framework ........................................ 33 Figure 4-8: Proposed overlapping strategy framework ............................................................ 36 Figure 5-1. Theory of Constraints Steps .................................................................................. 41 Figure 5-2: TOC Thinking process .......................................................................................... 41 Figure 5-3: Typical project task / performance / time probability distribution ........................ 43 Figure 5-4: Aggregating uncertainty reduces planned project lead-time ................................. 44 Figure 5-5: Merging paths along with feeding buffers ............................................................. 44 Figure 5-6: Activity time under different uncertainties ............................................................ 47 Figure 5-7: Fever chart sample from CCPM+ .......................................................................... 49 Figure 5-8: Resource conflict vs. feeding buffer role example ................................................ 52 Figure 5-9: schematic comparison of conventional methods ................................................... 53 Figure 5-10: Example fictious project ...................................................................................... 54 Figure 5-11: Fictious project after resource leveling ............................................................... 54 Figure 5-12: Critical chain in fictious project .......................................................................... 55 Figure 5-13: Risk matrix application in both chain and project level ...................................... 58 Figure 5-14: Scoring matrix ..................................................................................................... 59 Figure 6-1: A fictious project network ..................................................................................... 65 Figure 6-2: Sensitivity indexes result after overlapping .......................................................... 67 Figure 6-3: Critical chain and sesitive chain evaporating cloud .............................................. 68 Figure 6-4: Fairly large fictious project ................................................................................... 70 Figure 6-5: Fictious project after resource leveling and adding buffer .................................... 72 Figure 7-1: Critical chain and Fast Track evaporating cloud ................................................... 76 Figure 7-2: overlapping two critical chain activities ................................................................ 77 Figure 7-3: Fairly large project with resources ........................................................................ 78 Figure 7-4: Critical chain view of fairly complex project ........................................................ 79 Figure 7-5: Critical chain after overlapping ............................................................................. 79 Figure 8-1: Results vs. Objectives ............................................................................................ 85

ix
Table of Tables Table 5-1: Buffer size of different activities ............................................................................ 48 Table 5-2: Comparison of buffer size calculation methods ..................................................... 56 Table 5-3: Proposed fever chart time thresholds together with example ................................. 60 Table 6-1: Simulation result for fictious project network ........................................................ 66 Table 6-2: Simulation result after performing overlapping with 2 days’ time reduction ......... 67 Table 6-3: Simulation result for resource level fictious project ............................................... 69 Table 6-4: Comparison among different buffer calculation methods & proposed method ...... 71 Table 6-5: Buffer size modification by applying sensitivity coefficients ................................ 72 Table 6-6: Simulation result of fictious project after resource leveling and adding buffer ..... 74

1 Introduction
Introduction
Chapter1
2 Introduction
1 Introduction
This chapter describes briefly background of research, research questions that create the basis of this research study, and objectives of research. Then, you get acquaintance with main and important resources which are used. At the end, structure of report is represented.
1.1 Background
It is heard and read that “Any project worth doing is worth doing fast” or “completing project faster in less time”. This is strongly advocated by companies and project managers considering to enormous benefits are reaped such as to move forward paying back investment or make more profits by increasing quantity of projects in portfolio of company etc.
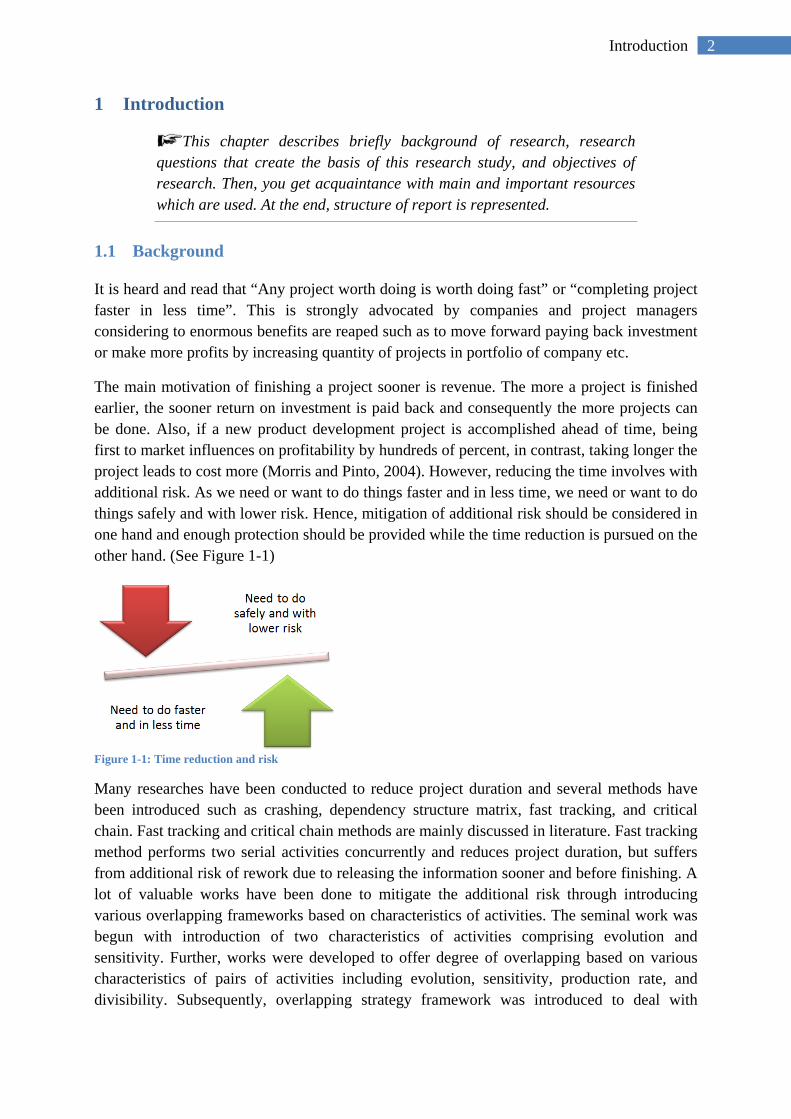
The main motivation of finishing a project sooner is revenue. The more a project is finished earlier, the sooner return on investment is paid back and consequently the more projects can be done. Also, if a new product development project is accomplished ahead of time, being first to market influences on profitability by hundreds of percent, in contrast, taking longer the project leads to cost more (Morris and Pinto, 2004). However, reducing the time involves with additional risk. As we need or want to do things faster and in less time, we need or want to do things safely and with lower risk. Hence, mitigation of additional risk should be considered in one hand and enough protection should be provided while the time reduction is pursued on the other hand. (See Figure 1-1)
Figure 1-1: Time reduction and risk
Many researches have been conducted to reduce project duration and several methods have been introduced such as crashing, dependency structure matrix, fast tracking, and critical chain. Fast tracking and critical chain methods are mainly discussed in literature. Fast tracking method performs two serial activities concurrently and reduces project duration, but suffers from additional risk of rework due to releasing the information sooner and before finishing. A lot of valuable works have been done to mitigate the additional risk through introducing various overlapping frameworks based on characteristics of activities. The seminal work was begun with introduction of two characteristics of activities comprising evolution and sensitivity. Further, works were developed to offer degree of overlapping based on various characteristics of pairs of activities including evolution, sensitivity, production rate, and divisibility. Subsequently, overlapping strategy framework was introduced to deal with
3 Introduction
evolution and sensitivity of tasks based on their key determinants to make more opportunity even for those which have no suitable conditions for overlapping such as slow evolving upstream and high sensitive downstream tasks. What can be improved is to reduce the additional risk by selecting pair of activities that are not high risky even in critical path that any reduction in time activity leads to reduce the project duration. Hence, selection of low risky pairs of activities can help to reduce the additional risk of overlapping in project schedule at initial step.
Critical chain after Gantt, CPM, PERT, MCS is a breakthrough point in project planning and control by introducing both resource dependent critical path and buffer to deal with resource constraint and project uncertainty. Many efforts were made to show the pitfalls of critical chain method and calibrate buffer size to provide enough protection for project. However, identifying critical chain, buffer sizing and buffer management are issues that still have potentiality to conduct more researches and this master thesis concentrates on mentioned parts.
1.2 Objectives
Fast tracking is PMI approved schedule compression technique that suffers from resource constraint and additional risk due to perform concurrently either in project phase or project activity level and make decision based on incomplete or limited information. On the other hand, Critical Chain Method deals with limited resources and project uncertainty by applying buffer to project path of schedule. Hence, two objectives are specified for this research:
First purpose of this research is to go through process of fast tracking and critical chain methods with critical eye of improvement initiative techniques such as lean and Six Sigma to find the likely waste and defect of process and explore possible way(s) of improvement.
The second purpose of this research is to probe into possibility of applying both methods-Fast tracking and critical chain- to project schedule in order to achieve compressed schedule while it is reliable and additional risks are handled.
1.3 Problem formulation
Critical chain method is an innovative approach to project scheduling; it addresses to underlying problem of project in proper fashion. Critical chain deals with resource constraint and project uncertainty by applying buffer to paths in project schedule; it also touches some undesirable behaviors cause unnecessary extension in the project duration such as deliberate padding, student syndrome, bad multi-tasking, and date-driven. On the other hand, Fast tracking tries to find a way to reduce the project schedule through performing serial activities or phases in parallel, but it needs to grapple with problems in resource strategy, additional risk of overlapping, and making early decision based on limited or incomplete information. For sake of tackling mentioned issues, fast tracking needs providing resource level rather resource leveling as well as it requires structured risk analysis and management to accomplish the project; it also advocates some behaviors such as more multi-tasking and early start of activity to accelerate the project pace.
4 Introduction
A question may pose how project manager or project planner can take advantage of applying both techniques in project schedule in order to accelerate project pace while manage or reduce additional risk.
Moreover, no technique is perfect and flawless; hence if one looks into them with the eye of improvement initiative methods such as lean and Six Sigma, the following defects or wastes can be recognized:
With regard to critical chain, if it is looked into by lean perspective, two wastes are highlighted— overproduction and inventory. It actually happens in light of simple assumption of 50% for calculating buffer size, for instance, if amount of buffer is not calculated precisely, resources are squandered owing to keeping them idle without usage (inventory waste, more than minimum to get the job done) or in case of exhausting the buffers and consuming more resources than need, work is extended unreasonably (over production waste).
If six sigma’s perspective is used for investigation, a defect can be addressed in both buffer size and buffer management process and that is, uncertainty in calculating buffer size for encountering with risk and unexpected events and also uncertainty in calculating time trigger points for action in fever chart— green, yellow, and red regions. Buffer size is calculated based on simple assumption of 50% of activities duration and Buffer management divides the calculated buffer to one third of its size and allocates it to each region. For example, if calculated buffer is 30 days, it is divided to one third of 30 and amount of 10 is assigned to each region respectively. When buffer exhaustion exceeds green region- 11 days- planning process is started, but no action will be taken; when buffer consumption exceeds yellow region, needful action is taken to recover the buffer and avoid slippage.
A question may pose the extent to which calculated buffer can handle the risk of overrun while there are activity uncertainty, path uncertainty, and merge bias uncertainty. The same issue exists for buffer management that to what extent calculated time intervals can handle the risk of overrun, to wit, when project or activity is on the red region of fever chart to what extent calculated amounts for time intervals can provide proper time to plan and take on time action. If previous example is considered, For instance, allocating fewer days- 4 or 5 days – to green region may lead to give early warning to project manager as well as provide more time for planning and taking action to recover the buffer.
Concerning to fast tracking method, many works have been done to manage the additional risk of rework when two serial activities are overlapped. It is started with overlapping framework based on two characteristics of tasks (evolution and sensitivity) and it has been developed to overlapping strategy framework together with key determinants of characteristics of task to make the slow evolving upstream task faster and make high sensitive downstream task low sensitive to changes from upstream task. A question may bring up that how additional risk of overlapping can be mitigated by selecting low risky activities in project network and among critical path activities. Because through overlapping any pair of activities in critical path project duration is reduced, but additional risk of overlapping increases if high risky activities are selected.
5 Introduction
To summarize the problem statement, research questions are defined in following:
1. How buffer size in critical chain and time trigger points for action in buffer management can be improved while there is simple assumption behind of their calculations?
2. How additional risk of overlapping can be mitigated in fast tracking method? 3. How fast tracking method and overlapping point of view is incorporated into critical
chain method while there are different assumptions about resource strategies?
1.4 Literature survey
In order to write this thesis report, valid scientific resources have been used including books, international journals in project management or relevant field of study, conference paper etc.
Resources that are utilized with regard to fast tracking method including initial article (Rolstadås, 1995), seminal overlapping framework (Krishnan et al., 1997), pitfall of overlapping framework (Loch and Terwiesch, 1998), developed overlapping framework (Pena-Mora and Li, 2001), key determinants of task characteristics (Bogus et al., 2005), overlapping strategy framework (Bogus et al., 2006) and fast track manual book (Eastham, 2002).
Resources that are used about critical chain contain main books published in this field such as project management in fast lane (Newbold, 1998), critical chain project management (Leach, 2005), project in less time (Woeppel, 2006), theory of constraint handbook (Cox and Schleier, 2010), and several articles about merits and pitfalls (Herroelen and Leus, 2001), (Herroelen et al., 2002), buffer sizing new approaches with more emphasis on project management rather pure mathematical point of view (Newbold, 1998), (Shou and Yao, 2000), (Leach, 2005),(Tukel et al., 2006), (Yang et al., 2008).
Finally, for time sensitivity indexes resources contain book of measuring time (Vanhoucke, 2009) and fundamental articles in this regard (Williams, 1992), (Elmaghraby et al., 1999), (Elmaghraby, 2000), and (Cho and Yum, 1997).
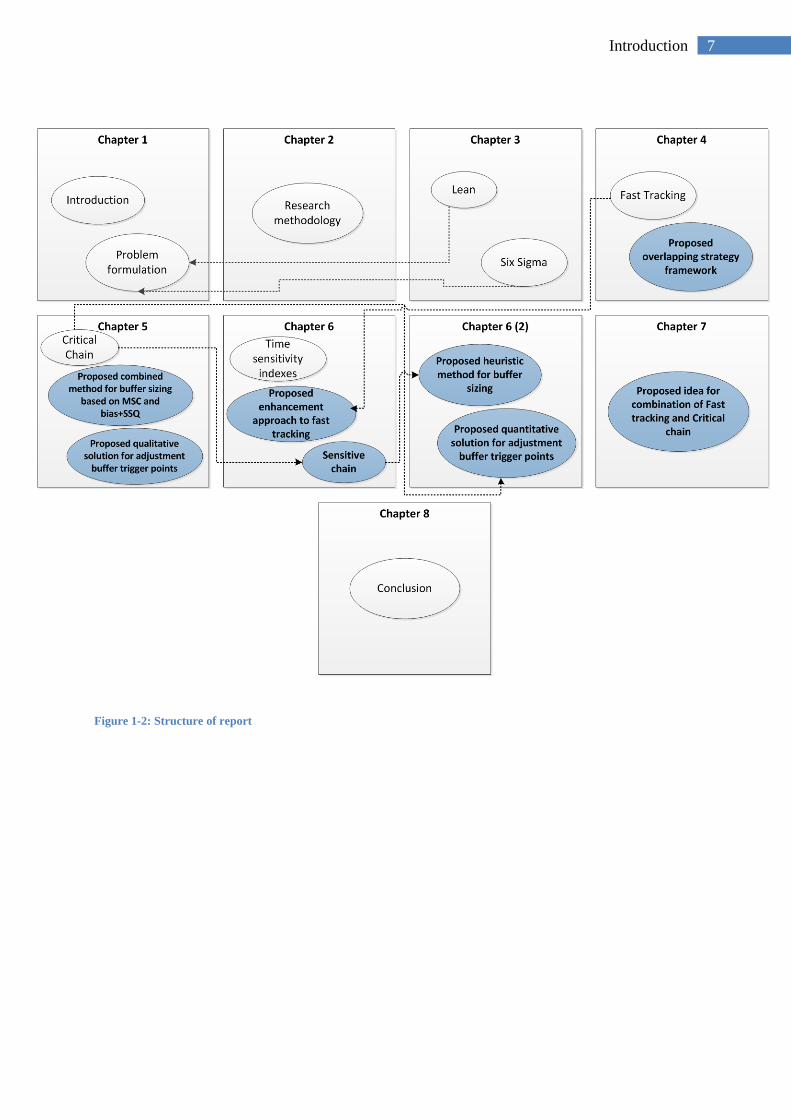
1.5 Structure of the report
This report consists of eight chapters. Figure 1-2 illustrates the organization of report and relationship among chapters. Dark blue ellipses show the proposed methods and suggestions of author. A brief description of each chapter is given in following:
• Chapter one describes briefly background of research, formulation of problem, research questions, objectives, and a short summary of main references.
• Chapter two declares research methodology including type of research, approach of research, research design as well as real method of research, data collection approach
6 Introduction
and programs are utilized for analyzing. At the end, it implies deviations from main assignment and new orientation.
• Chapter three explains succinctly two quality initiatives theories comprising Lean and Six Sigma. Further, it indicates application of their perspectives regarding waste and defect to formulate the problem. As you can see from arrows, they have direct impact on problem formulation at chapter 1.
• Chapter four elucidates fast tracking method and evolvement of overlapping strategies and frameworks from seminal work to complicated approach. Finally, a suggestion for improvement in overlapping strategy framework is offered and pros and cons of it against overlapping strategy framework in literature are discussed.
• Chapter five expounds critical chain method and its principles including critical chain, buffer, and buffer management. Moreover, you get acquaintance with merits and pitfalls of method. Ultimately, two suggestions are provided and discussed. First, it is a suggestion of combining two methods for buffer sizing based on Monte Carlo Simulation and bias plus SSQ. Second, it is a qualitative solution for adjustment of buffer trigger points in fever chart.
• Chapter six introduces and describes concisely time sensitivity indexes. Further, suggestion of author with regard to application of time sensitivity indexes for making improvement in both fast tracking and critical chain methods are offered and debated. This chapter contains two main parts. First part includes proposed idea for improvement in fast tracking method and mitigation of risk of overlapping; second part is about proposed ideas for enhancement in critical chain including sensitive chain, heuristic method for buffer sizing, and a quantitative solution for adjustment of buffer trigger points in fever chart.
• Chapter seven elucidates idea and challenges of incorporating fast tracking method into critical chain method. Moreover, this chapter takes you through example to overlap pair of activities in critical chain and possible consequences are assessed and discussed.
• Chapter eight is conclusion and summing up the finding and results. Results against defined objectives and research questions are argued. Finally, an assessment is conducted regarding pros and cons of results and project work methodology.
7 Introduction
Figure 1-2: Structure of report

8 Research Methodology
Research Methodology
Chapter2
9 Research Methodology
2 Research Methodology
This chapter describes research type and research approaches which are applied to accomplish the work. Then, Research design and respective processes are explained. In addition, method of research along with limitation is discussed. Finally, you get to know the way of collecting data and various programs are used to produce and analyze the data.
2.1 Research type
Type of this research is combination of analytical and conclusion-oriented types. Kothari (2009) defines both research types in following:
“Analytical research is the research has to use facts or information already available, analyze these to make a critical evaluation of material”
“Conclusion-oriented research is kind of research that researcher is free to pick up a problem, redesign the enquiry as he proceeds and is prepared to conceptualize as he wishes”
This research is analytical due to purpose of the research which has been directed toward finding waste and defect in the process of both fast tracking and critical chain methods. Fulfillment of such purpose requires critical evaluation of existing facts or information regarding to both methods in literature.
In another point of view, this research is conclusion-oriented due to flexibility and freedom was given to researcher to emphasize on the areas where new knowledge can be gained. Since the topic was wide, any project phases or any project management processes within project phases could be chosen for more focus. At the end, it was decided to go into more details of two methods within project planning phase to explore possibility of improvement on them. Such decision was made because of many discussions and popularity of both mrthods in literature and also, they were approved by PMI.
2.2 Research approach
There are two basic approaches to research, quantitative and qualitative. Kothari (2009) defines quantitative approach “approach involves the generation of data in quantitative form which can be subjected to rigorous quantitative analysis in formal and rigid fashion”. Quantitative approach is classified into three categories including inferential, experimental and simulation. Inferential approach forms a database from which to infer characteristics or relationships of population; it usually means survey research. Experimental approach provides much more control on the research environment through manipulating variables to observe their effect on the other variables. Simulation approach constructs an artificial environment within which relevant information and data can be generated. Bui (2009) says quantitative research has a hypothesis that is tested by researcher in order to support or not support the given hypothesis. Typically quantitative research uses deductive reasoning— moving from the general to the specific. He also indicates two strengths of quantitative research such as
10 Research Methodology
more control of researcher over many aspects of the study and result of study can be generalized to a broad population.
Qualitative approach is explained “an approach is concerned with subjective assessment of attitude, opinions and behaviors and it is function of researcher’s insights and impressions”. Brannen (1995) indicates “quantitative researcher isolates and defines variables and variables categories while qualitative researcher begins with defining very general concept which, as the research progresses, change their definition”. She adds qualitative work is theoretical in its aim and associated with analytic induction, by contrast, quantitative work is descriptive and associated with enumerative induction. Bui (2009) represents qualitative research begins with specific situations, patters or themes in the data, establishing a tentative hypothesis, and developing theories and conclusions. Typically qualitative research uses inductive reasoning. Further, two strengths of qualitative method are mentioned as creating a holistic picture of the situation and investigating a topic in depth.
According to mentioned definitions, this research is perceived as mixing of both approaches. It is qualitative because shortening the project lifecycle was taken as general concept and as the research proceeded, it was narrowed down to specific phase of project and two methods among various methods within planning phase. Moreover, this research is a theoretical work due to using data from literature rather practical case. Also, research questions can be supposed as hypotheses for conducting in-depth study and analysis in order to offer proper response for them.
In another point of view, this research is sort of quantitative research because Simulation approach was selected due to lack of access to real data, hence practicality of some proposed ideas and comparisons between results in literature were put to the test through application of simulation and fictious examples. In fact, proposed ideas can be assumed as hypotheses and they are verified through fictious example. According to strength of quantitative approach, the results which are obtained through fictious examples can be generalized to real project. However, there is an uncertainty here the extent to which the fictious examples can show the real life and actual situation in real project. To solve this problem partially, it was tried to select the examples from literature. Actually, it was assumed that examples in literature were applied deliberately and they might be more close to real life.
2.3 Research design
Research design is a blueprint of research to facilitate conducting the research. Research design is defined as “advance planning of the methods to be adopted for collecting the relevant data and techniques to be used in their analysis and keeping in view the objective of the research”(Kothari, 2009). Further, Kothari (2009) states “the main purpose of research design in case of exploratory research studies is to formulate a problem for more precise investigation or of developing the working hypothesis from an operational point of view. Discovery of ideas and insights are major emphasis and study must be flexible enough to provide opportunity for considering different aspects of a problem”. He also introduces survey of concerning literature method as the most simple and fruitful method of formulating the
11 Research Methodology
research problem precisely or developing hypothesis. In this method, researcher should review and build upon the work already done by others and problem or hypothesis should be formulated through reviewing of the available material.
According to explanations in above, research design and problem formulation of this master thesis are based on method of survey of concerning literature since problem was formulated based on the works already done in the literature regarding overlapping strategies in fast tracking method as well as buffer sizing and buffer management in critical chain method. It was also tried to add Lean and Six Sigma perspective in process of formulating the problem.
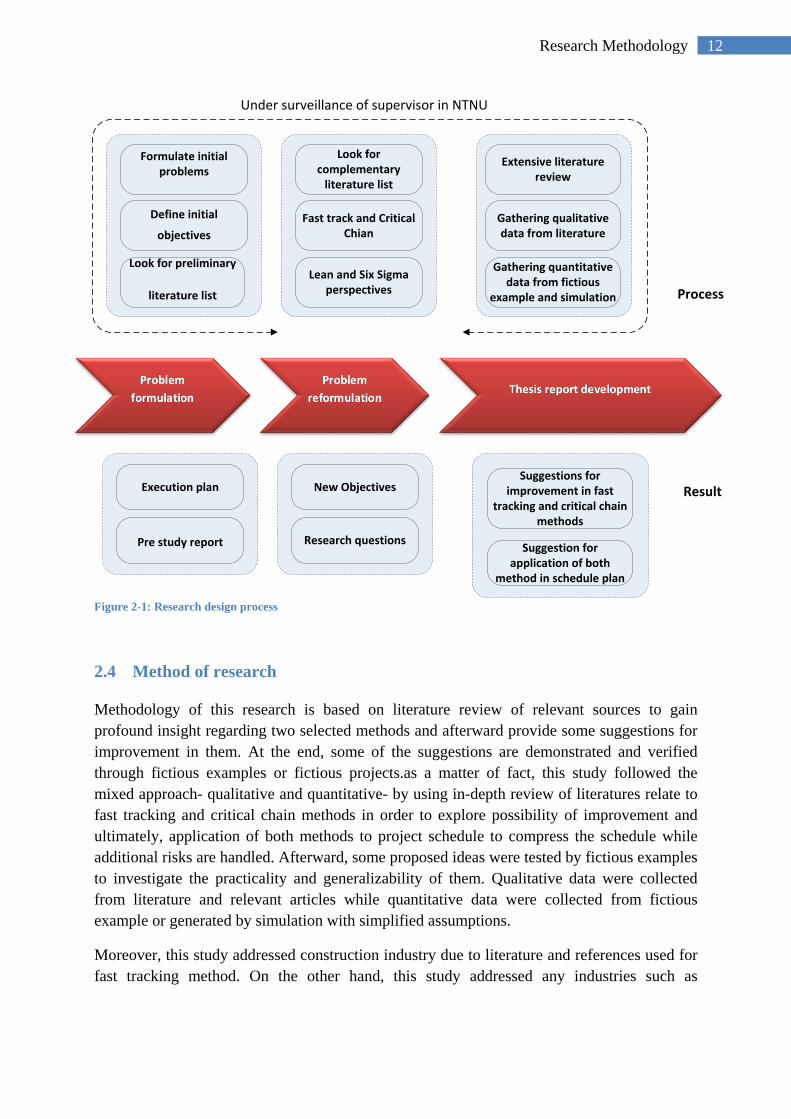
Research design is illustrated in Figure 2-1. As you can see, research design has three stages including problem formulation, problem reformulation, and thesis report development and each stage contains some processes and results.
At first stage (problem formulation), initial problem was formulated, initial objectives were defined, and preliminary literature list was specified. This process leaded to devise execution plan and prepare pre study report.
At second stage (problem reformulation), complementary literature list was frozen and simultaneously, scope of work was narrowed down. In fact, planning phase of project was targeted and among several techniques and methods in literature that address the time reduction, two methods were chosen that they have mainly been discussed in literature and they were approved by PMI. Two methods are Fast tracking and critical chain. Then, possibility of wastes and defects were investigated through application of lean and six sigma perspectives and some parts in process of both methods that seemed need of improvement were particularly concentrated. Such process brought about defining new objectives and research questions.
At third stage (thesis report development), an extensive literature review was conducted. Afterward, qualitative data were collected from literature as well as quantitative data were generated and collected from fictious example and simulation. Mentioned process resulted in offering some suggestions for improvement in fast tracking and critical chain methods which have been covered the first objective of research. Also, another suggestion was offered to make synergy by application of both fast tracking and critical chain method to project schedule which has been covered the second objective of this research.
It is worth to mention that whole process was overseen by supervisor in NTNU and any deviations or changes in objectives, scope, and research questions were done after getting approval.
12 Research Methodology
Figure 2-1: Research design process
2.4 Method of research
Methodology of this research is based on literature review of relevant sources to gain profound insight regarding two selected methods and afterward provide some suggestions for improvement in them. At the end, some of the suggestions are demonstrated and verified through fictious examples or fictious projects.as a matter of fact, this study followed the mixed approach- qualitative and quantitative- by using in-depth review of literatures relate to fast tracking and critical chain methods in order to explore possibility of improvement and ultimately, application of both methods to project schedule to compress the schedule while additional risks are handled. Afterward, some proposed ideas were tested by fictious examples to investigate the practicality and generalizability of them. Qualitative data were collected from literature and relevant articles while quantitative data were collected from fictious example or generated by simulation with simplified assumptions.
Moreover, this study addressed construction industry due to literature and references used for fast tracking method. On the other hand, this study addressed any industries such as
Process
Result
Formulate initial problems
Define initial
objectives
Look for preliminary
literature list
Execution plan
Pre study report
Look for complementary
literature list
Fast track and Critical Chian
Lean and Six Sigma perspectives
New Objectives
Research questions
Extensive literature review
Gathering qualitative data from literature
Gathering quantitative data from fictious
example and simulation
Suggestions for improvement in fast
tracking and critical chain methods
Suggestion for application of both
method in schedule plan
Under surveillance of supervisor in NTNU
13 Research Methodology
telecommunication, oil and gas, construction, pharmaceutical, maintenance and modification etc. owing to general approach of literatures used for investigation of critical chain method.
Additionally, Monte Carlo Simulation tool was utilized to collect data from fictious example especially for calculation of time sensitivity indexes and total project duration with consideration to all schedule risks. Fictious examples were selected or they were developed based on literature because it was supposed that those examples were chosen deliberately by previous researchers and they were close to real situation. Also, fictious examples were implemented step by step in respective software such as MS Excel and Pro Track and simulation was run to get the results and data was collected for further analysis. Moreover, in order to make sure about the validity and reliability associated with results of application of MCS to my proposed ideas, I tried to implement the example in literature at first. Then, when I could get the same result as literature and learned the procedures, it was applied to my proposed ideas accordingly.
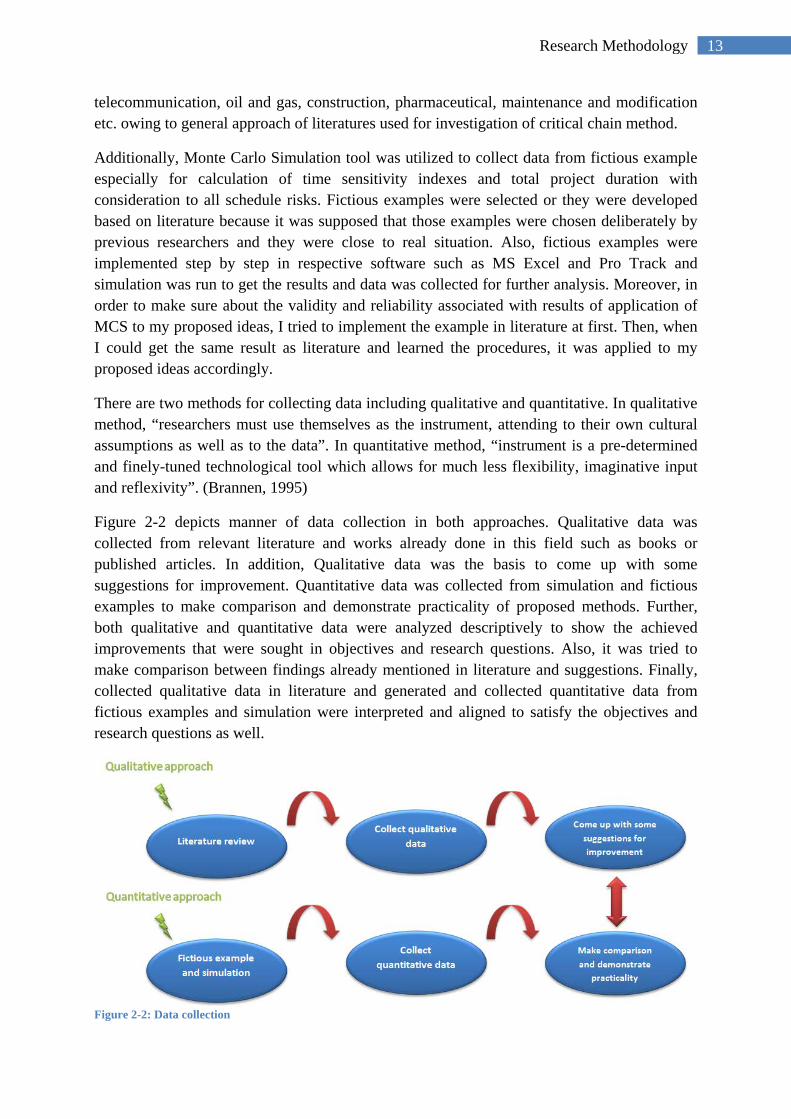
There are two methods for collecting data including qualitative and quantitative. In qualitative method, “researchers must use themselves as the instrument, attending to their own cultural assumptions as well as to the data”. In quantitative method, “instrument is a pre-determined and finely-tuned technological tool which allows for much less flexibility, imaginative input and reflexivity”. (Brannen, 1995)
Figure 2-2 depicts manner of data collection in both approaches. Qualitative data was collected from relevant literature and works already done in this field such as books or published articles. In addition, Qualitative data was the basis to come up with some suggestions for improvement. Quantitative data was collected from simulation and fictious examples to make comparison and demonstrate practicality of proposed methods. Further, both qualitative and quantitative data were analyzed descriptively to show the achieved improvements that were sought in objectives and research questions. Also, it was tried to make comparison between findings already mentioned in literature and suggestions. Finally, collected qualitative data in literature and generated and collected quantitative data from fictious examples and simulation were interpreted and aligned to satisfy the objectives and research questions as well.
Figure 2-2: Data collection
14 Research Methodology
2.5 Limitation of research
The main limitation of this research was lack of access to real data to verify proposed ideas and suggestions in real project. Although it was tried to demonstrate some of them in fictious examples, but practicality of them should be verified in real project and real situation.
2.6 References and software
Valid databases have been utilized for seeking references and articles such as:
• Books and e–books from Library of NTNU • Science Direct • Project Management Institute • Elsevier • American Society of Civil Engineers (ASCE), etc.
Additionally, various programs were utilized for analysis and simulation. Programs are listed in following:
1. Microsoft Excel 2. Microsoft Project 3. Pro Track (http://www.protrack.be) 4. CCPM+ (http://advanced-projects.com)
Microsoft Excel and Microsoft project are applied for data analysis and mapping out project schedule respectively; Pro Track for calculation of time sensitivity indexes and CCPM+ for critical chain method are used.
2.7 Deviation report
Objectives and scope of work were changed and frozen under direct supervision and based on approval of supervisor. Scope of work was limited to planning phase of project and objectives were specified to make improvement in process of fast tracking and critical chain method as well as probe into possibility of applying both methods to project schedule in order to achieve compressed schedule while it is reliable and additional risks are handled.
Moreover, research questions were defined in following:
1. How buffer size in critical chain and time trigger points for action in buffer management can be improved while there is simple assumption behind of their calculations?
2. How additional risk of overlapping can be mitigated in fast tracking method? 3. How fast tracking method and overlapping point of view is incorporated into critical
chain method while there are different assumptions about resource strategies?

15 Affecting theories in problem formulation
Affecting theories in problem formulation
Chapter3
16 Affecting theories in problem formulation
3 Affecting theories in problem formulation
In this chapter, two quality initiative theories including Lean and Six Sigma are briefly explained. Then, application of their viewpoints to formulate the problem is elucidated.
3.1 Six sigma essentials
Origin of Six Sigma backed to 1730 and introduction of theory of probability to management system by French mathematician De Moivre. Afterward, application of theory of probability to management system was developed by Carl Frederick Gauss through adding normal curve for understanding the probability. Walter Shewhart showed three sigma deviations from mean in processes needs to be assessed and amended. Term of Six Sigma was coined by Bill Smith, a Motorola engineer and first time it was deployed in Motorola for achieving quality improvement. As a matter of fact, Six Sigma method is a statistical based technique to define, measure, analyze, improve, and control (DMIC) manufacturing processes. Defect-free process and product is ultimate performance of Six Sigma and it is measured as 3.4 or fewer defects per million(Jugulum and Samuel, 2010).
Sigma (σ) is a Greek symbol that shows the standard deviation in statistics. In normal distribution 1σ means 64% of result falls within one standard deviation of the mean; 2σ shows 95% of result falls within two standard deviation of the mean and 99.9% falls within 3σ. About six sigma (6σ), the percentage is 99.999999998% which represents 2 parts in billion(Neuendorf, 2004). Jugulum and Samuel (2010) says “the term six sigma process, sigma score level, or sigma value of a process refer to the idea that if we have six standard deviations between the mean of a process and the specification limit, we will make virtually no items that exceed the specifications limits”.
Neuendorf (2004) says Six Sigma is achieved when faults are discovered and eliminated because by eliminating faults all types of defects and all types of failures associated with defects are eliminated. In order to show the importance of defect, he emphasizes on making distinction between a failure and a defect because many defects can cause a single failure in one hand and one defect can cause many failures on the other hands. Hence, focusing on faults is more important than errors as root cause of failure. Further, he implies to Six Sigma as strategic-level metric that describes the characteristics of a process to produce defects or the results of a process to contain defects.
Another important point about six sigma method is changing the result requires to change the process. Also application of six sigma is not just reaching to quality level of six sigma (3.4 per million) and it is not just counting the numbers of defects, in addition six sigma looks for improving the process and maintain the improvement; in other words intolerance for defect is far more important than counting down the number of defects. Jugulum and Samuel (2010) also indicates that “Six Sigma has evolved to become a vision, philosophy, goal, metric, improvement methodology, management system, and customer-centric strategy”.
17 Affecting theories in problem formulation
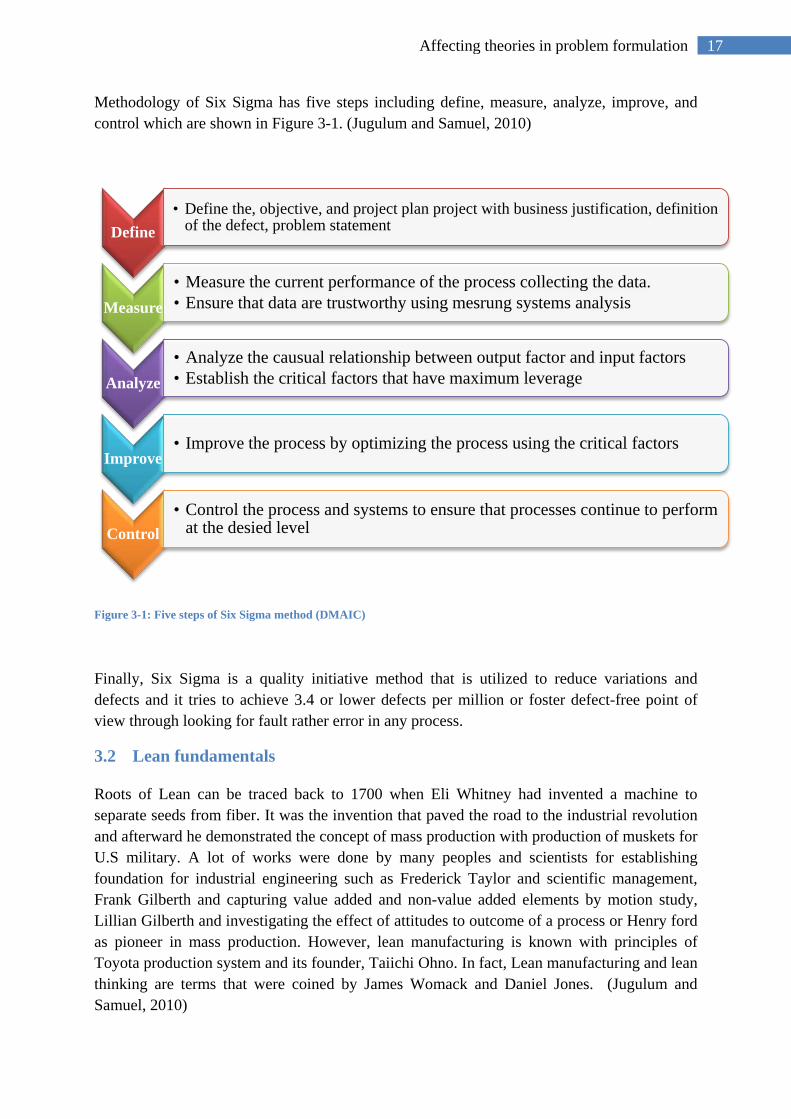
Methodology of Six Sigma has five steps including define, measure, analyze, improve, and control which are shown in Figure 3-1. (Jugulum and Samuel, 2010)
Figure 3-1: Five steps of Six Sigma method (DMAIC)
Finally, Six Sigma is a quality initiative method that is utilized to reduce variations and defects and it tries to achieve 3.4 or lower defects per million or foster defect-free point of view through looking for fault rather error in any process.
3.2 Lean fundamentals
Roots of Lean can be traced back to 1700 when Eli Whitney had invented a machine to separate seeds from fiber. It was the invention that paved the road to the industrial revolution and afterward he demonstrated the concept of mass production with production of muskets for U.S military. A lot of works were done by many peoples and scientists for establishing foundation for industrial engineering such as Frederick Taylor and scientific management, Frank Gilberth and capturing value added and non-value added elements by motion study, Lillian Gilberth and investigating the effect of attitudes to outcome of a process or Henry ford as pioneer in mass production. However, lean manufacturing is known with principles of Toyota production system and its founder, Taiichi Ohno. In fact, Lean manufacturing and lean thinking are terms that were coined by James Womack and Daniel Jones. (Jugulum and Samuel, 2010)
Define • Define the, objective, and project plan project with business justification, definition
of the defect, problem statement
Measure • Measure the current performance of the process collecting the data. • Ensure that data are trustworthy using mesrung systems analysis
Analyze • Analyze the causual relationship between output factor and input factors • Establish the critical factors that have maximum leverage
Improve • Improve the process by optimizing the process using the critical factors
Control • Control the process and systems to ensure that processes continue to perform
at the desied level
18 Affecting theories in problem formulation
Lean consists of five principles as follows(Jugulum and Samuel, 2010):
1. Value: Specify in the eyes of the customer 2. Value Stream: Identify all the steps in the value stream and eliminate waste 3. Flow: Allow the value to flow without interruptions 4. Pull: Let the customer pull value from the process 5. Continuously improve in pursuit of perfection
Jugulum and Samuel (2010) say “lean approach is to improve process speed and reduce cost by eliminating waste”. Further, they add that lean thinking applies different approach to problem solving in comparison to Six Sigma; it is called Kaizen events. Kaizen is a Japanese word for incremental continuous improvement and Kaizen event is gathering a small group of employees to improve certain aspect of the business through a series of quick and focused sessions.
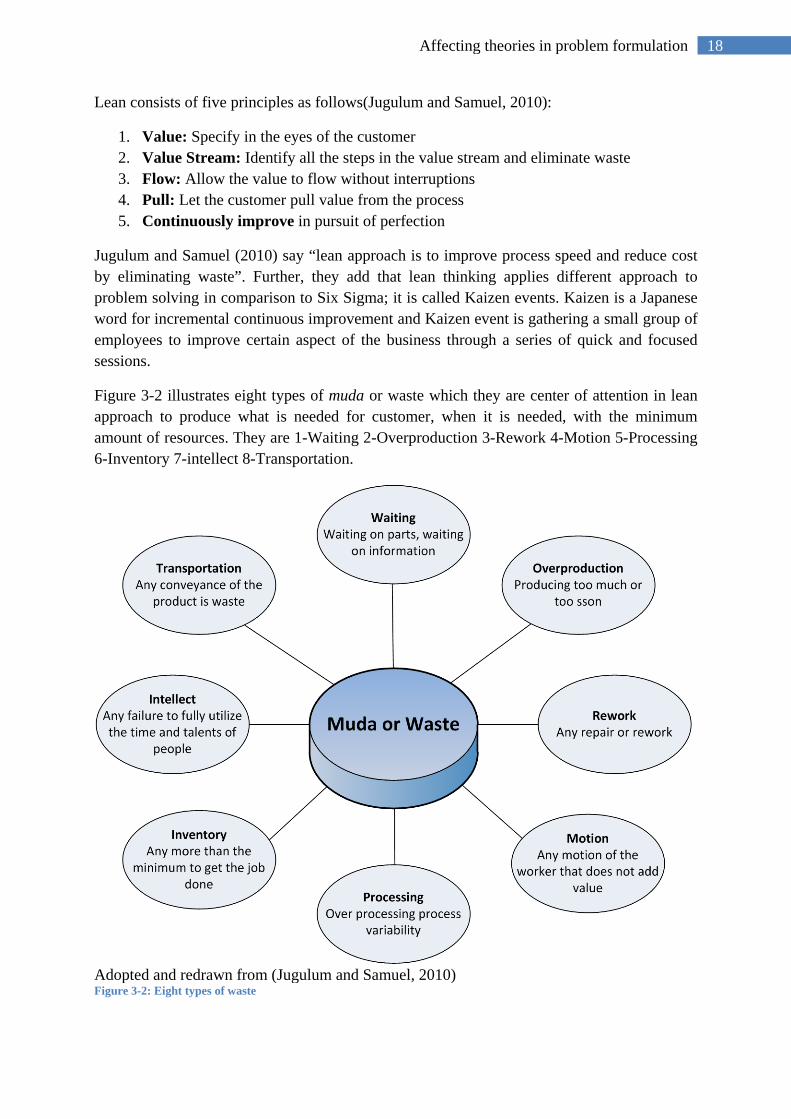
Figure 3-2 illustrates eight types of muda or waste which they are center of attention in lean approach to produce what is needed for customer, when it is needed, with the minimum amount of resources. They are 1-Waiting 2-Overproduction 3-Rework 4-Motion 5-Processing 6-Inventory 7-intellect 8-Transportation.
Adopted and redrawn from (Jugulum and Samuel, 2010) Figure 3-2: Eight types of waste
19 Affecting theories in problem formulation
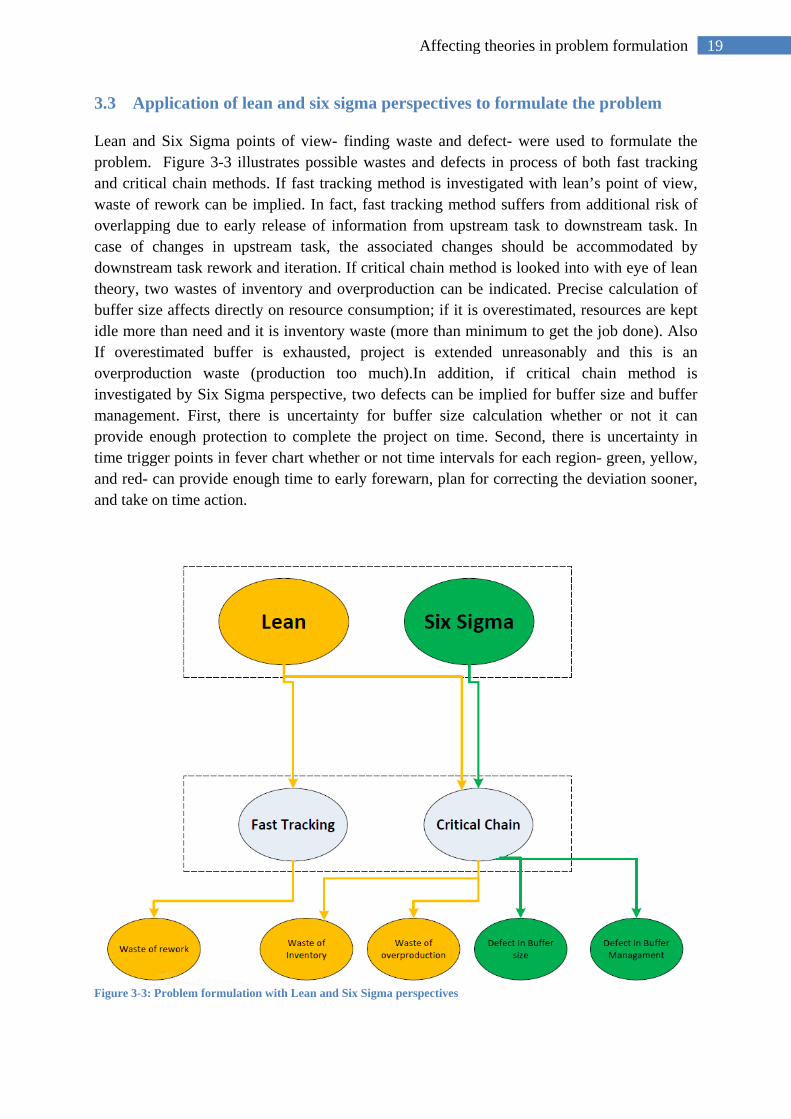
3.3 Application of lean and six sigma perspectives to formulate the problem
Lean and Six Sigma points of view- finding waste and defect- were used to formulate the problem. Figure 3-3 illustrates possible wastes and defects in process of both fast tracking and critical chain methods. If fast tracking method is investigated with lean’s point of view, waste of rework can be implied. In fact, fast tracking method suffers from additional risk of overlapping due to early release of information from upstream task to downstream task. In case of changes in upstream task, the associated changes should be accommodated by downstream task rework and iteration. If critical chain method is looked into with eye of lean theory, two wastes of inventory and overproduction can be indicated. Precise calculation of buffer size affects directly on resource consumption; if it is overestimated, resources are kept idle more than need and it is inventory waste (more than minimum to get the job done). Also If overestimated buffer is exhausted, project is extended unreasonably and this is an overproduction waste (production too much).In addition, if critical chain method is investigated by Six Sigma perspective, two defects can be implied for buffer size and buffer management. First, there is uncertainty for buffer size calculation whether or not it can provide enough protection to complete the project on time. Second, there is uncertainty in time trigger points in fever chart whether or not time intervals for each region- green, yellow, and red- can provide enough time to early forewarn, plan for correcting the deviation sooner, and take on time action.
Figure 3-3: Problem formulation with Lean and Six Sigma perspectives

20 Shed light on secrets of Fast Tracking method
Shed light on secrets of Fast Tracking method
Chapter4
21 Shed light on secrets of Fast Tracking method
4 Shed light on the secrets of Fast-Tracking method
This chapter first presents the overall principles of Fast Tracking method and then describes the development of overlapping frameworks and strategies to mitigate the risk of overlapping and rework. This is begun from seminal work and introduction of task characteristics to enhanced overlapping strategy framework which is more complicated. At the end, a proposed overlapping strategy framework is introduced that has lower complexity and provides more insight to apply right strategy at right place.
4.1 Introduction
Fast tracking is PMI-approved schedule compression technique; it actually stemmed from concurrent engineering (CE) and paralleling philosophy. Eldin (1997) offers concurrent engineering approach as a suitable schedule reduction tool which does not increase project overall cost— CE was chosen among five tools and based on three criteria.
The most common definition of fast tracking is given by PMI (2013) as “A schedule compression technique in which activities or phases normally done in sequence are performed in parallel for at least a portion of their duration” and further adds that fast tracking may result in rework and increase of risk. Eastham (2002) , in fast track manual, provides a very broad definition as “reduction of the schedule to minimum practicable is the principal driving force for one or more stages of the project”. Turner (1999) differentiates between fast track and fast build based on level of additional risk— fast build, in the building industry, is to overlap design and construction process of different stages with little additional risk and fast track in oil, gas and chemical industry is to overlap design and construction of different sections of plant with significant additional risk.
From above definitions, two contradictory aspects of fast tracking can be interpreted: reducing project duration while increasing additional risk and rework.Alhomadi et al. (2011) mention to shortening period from 50% to 70% in engineering, procurement and construction (EPC) projects, or Williams (1995) says fast track projects can be accomplished in less than 70% of time in comparison to traditional projects. The negative aspect is mainly stated as delay and schedule overrun, but different authors indicate the various dimensions of delay and slippage in schedule. Alhomadi et al. (2011) pinpoint to predictability indices (cost variance, time variance and quality variance). They bring together some reasons for schedule delay and time variance from point of departure of different authors as mentioned below.
a) Overlapping incomplete design prior to the start of construction (Laufer and Cohenca, 1990)
b) Fast tracking critical phase such as front-end phase (Michalak, 1997, Jergeas, 2008) c) Absence of a cushion in nuclear power plant construction because of overlapping
engineering and construction (Baker and Boyd, 1983) d) More design changes, longer activities and total delays due to overlapping (Park,
1999)
22 Shed light on secrets of Fast Tracking method
e) Communication difficulties, design errors and omission (Miles, 1997) f) Additional changes in design and construction due to increase overlapping between
design and construction (Pena-Mora and Park, 2001)
Additionally, Williams (1995) points out other issues as regards fast tracking and reduced schedule such as there is no time to optimization; egos and politics cannot be afforded; there is no opportunities for long term development activities and organizational investment like training; quality is compromised; materials are squandered, and extra costs are expended.
Eastham (2002) implies most likely penalty for successful delivery of a fast track project is increasing in the amount of project management, planning and control efforts which are a great percentage of total project cost.
It is crystal clear when one decides to use fast track approach for reducing the project time; he or she should consider the both opportunity and threat of method.
4.2 Fast Track approach general principles
Fast track is the quickest route to achieve a particular goal or position (Eastham, 2002); hence, it is worth to talk about its principles as well.
In Fast Track manual, Eastham (2002) implies following major principles of Fast Track approach:
• Project stage overlap: Project process consists of several sequential stages (phases) and there is a gate between two stages. Gate opens and let the project progress to next stage when its defined conditions are completely satisfied. This is where there is possibility to reduce overall project time through performing some degree of overlap between stages. Gate condition is usually defined with some level of conservative bias due to bad experience on past projects to reduce risk and increase certainty of outcome. For instance, when 50 percent of design completes, construction or procurement stage can be started.
• Work package overlap: In addition to stage (phase) overlap, performing in parallel can be done at lower level and between work packages. It is tangible due to project stages includes work packages and project is finished when work packages are accomplished.
• Early decisions: Overlapping means starting the successor work package before predecessor work package done completely; this process needs early decision making based on limited information. Organizations decide to execute fast track approach should be alarmed and prepared for risk of change owing to making wrong or sub-optimized decision and necessity of giving authorization and empowerment to team members in this way. Eldin (1997) , based on findings form survey conducted, indicates success factors for early decision making based on partial data such as management support, team member authority, and risk-taking culture of company too.
• Integrated project team: Most of delays and wastes occur when responsibility transfers from one stage to next stage, for instance, from client responsibility for
23 Shed light on secrets of Fast Tracking method
definition to contractor responsibility for design or from contractor responsibility for design to subcontractor responsibility for construction. Thus, developing an integrated project team consists of main parties and stakeholders in project as early as possible can lead to eliminate waste and delay and derive many benefits such as continuity of involvement and avoiding learning curve error, reduction in overall work load, commitment to project definition, proceed design and construction phase together, and so on.
• Additional staff: Perform sequential activities in parallel causes to increase the need of more resources; it means resource strategy should be changed from resource leveling to resource level providing. Also, management work load increases due to his responsibility about smoothing coordination between activities and resource conflicts. It is out of scope of this study, however, for whom he is interested to know more about resource-constrained project scheduling with activity overlapping, it is referred to recent article published and their heuristic method by Grèze et al. (2012).
• Additional risks: A project involves risk and uncertainty. Risk becomes more highlighted in fast track project due to early decision making based on incomplete or limited information and there is additional risk of change and rework owing to wrong information or decision. Hence, a structured and thorough risk management is highly needed.
Any principles of Fast tracking method can be investigated, but rest of chapter is dealing with additional risk of change and rework.
4.3 Fast track overlapping strategies
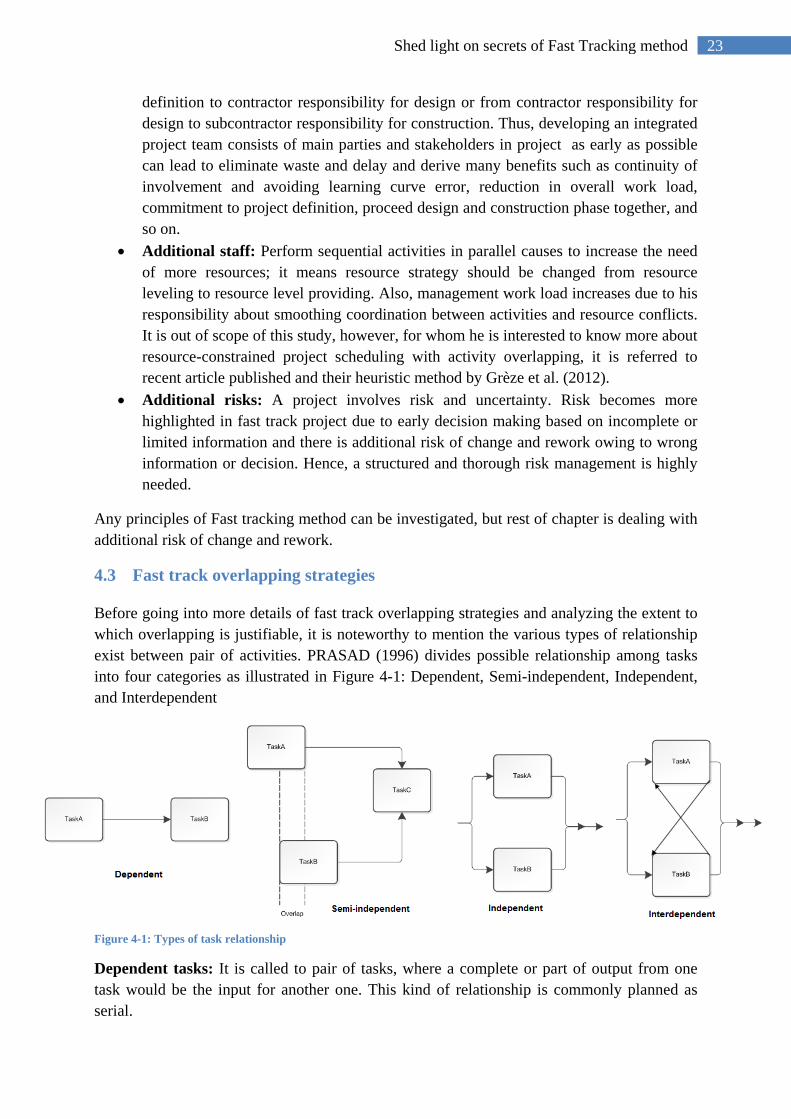
Before going into more details of fast track overlapping strategies and analyzing the extent to which overlapping is justifiable, it is noteworthy to mention the various types of relationship exist between pair of activities. PRASAD (1996) divides possible relationship among tasks into four categories as illustrated in Figure 4-1: Dependent, Semi-independent, Independent, and Interdependent
Figure 4-1: Types of task relationship
Dependent tasks: It is called to pair of tasks, where a complete or part of output from one task would be the input for another one. This kind of relationship is commonly planned as serial.
24 Shed light on secrets of Fast Tracking method
Semi-independent tasks: It is defined as a pair of dependent task that only a partial output is transferred to another and there is weak interaction among them. It is also called pseudo parallel.
Independent Task: It is defined as a pair of tasks which can be completed without any contribution of others. It is commonly planned as parallel.
Interdependent task: It is delineated as a pair of tasks which their outcomes are interrelated reciprocally. For example result of task A is input for task B and outcome of task B would be the input for task A.
In fast tracking approach, semi-independent relation is speculated and independent relationship is taken into account as especial case when 100% overlapping performed between two activities or phases.
Fast track approach and overlapping strategies for performing serial activities in parallel evolved throughout past two decades.
Rolstadås (1995) discusses overlapping as a possibility for reducing the time and provides two options which derived from production:
a) Splitting activity and adding resources which conduce to run in parallel with itself b) Overlapping through rearranging activities with partly simultaneity
First option is the same as crashing method and putting more resources to reduce the time, thus costs increase like adding two engineers to design one plan. The second option is the idea of fast tracking and to do some degree of overlap between pair of activities. Whereas there is uncertainty about selection of pair of activities and the extent to which they should be overlapped, he sets a policy of shortening most the activities with the least uncertainty and he figures out size of overlapping considering to uncertainty of each pair of activities. Uncertainty of activities can be calculated by triple estimates for all durations.
Further, In order to perform serial activities in parallel, two options are speculated: first is to remove the coupling between the activities which is usually very difficult and it needs redefinition of the development activities; second is to overlap activities through more frequent exchange of preliminary information and begin early the downstream activity with preliminary information given by upstream activity. Such overlapping process does not always happen without any risk, by contrast, whereas the upstream activity does not finish completely yet and downstream activity starts early with preliminary information, thus, any changes at upstream activity can cause subsequent iterations and reworks to downstream activity. On the other hand, when part of the upstream activities freezes and respective information transfers to subsequent activity, it actually leads to lose the flexibility of upstream task for future improvement— called loss of quality for upstream task.(Krishnan et al., 1997)
Appreciation of exchanged information can assist to better manage the risk of overlapping, thus to prevent or at least lower these risks and quality loss, a framework is established in product development process based on two characteristics of pair of activities called evolution
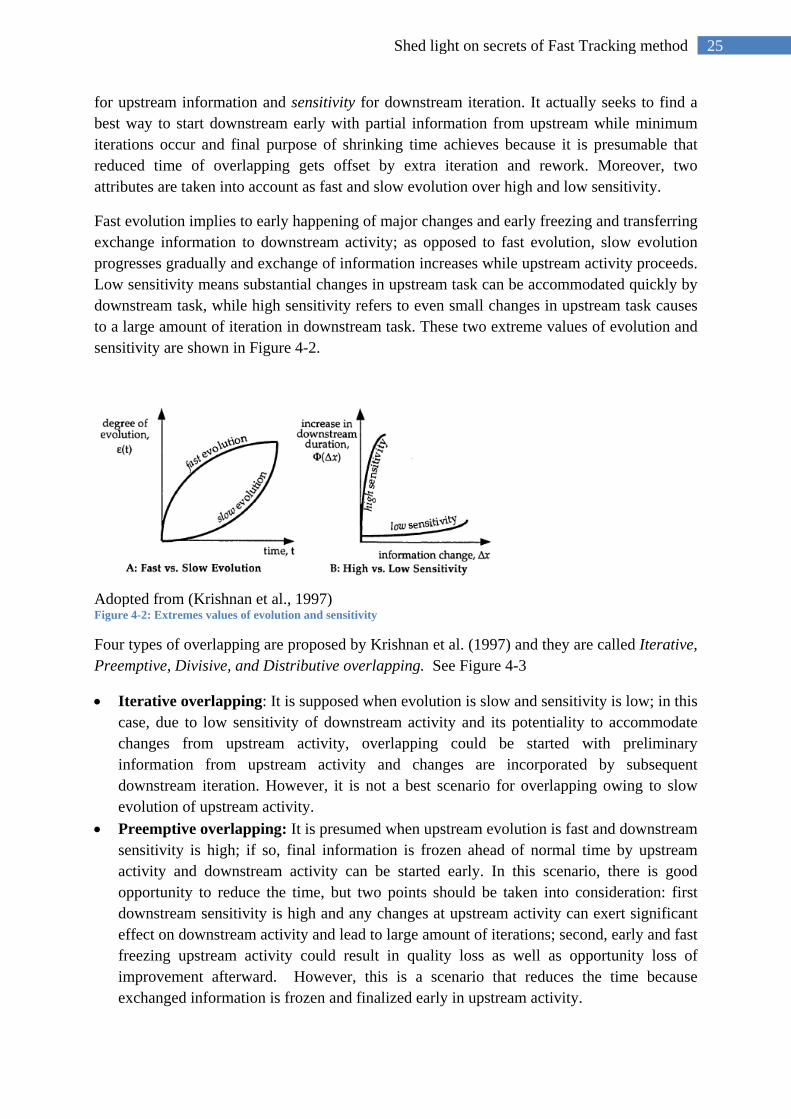
25 Shed light on secrets of Fast Tracking method
for upstream information and sensitivity for downstream iteration. It actually seeks to find a best way to start downstream early with partial information from upstream while minimum iterations occur and final purpose of shrinking time achieves because it is presumable that reduced time of overlapping gets offset by extra iteration and rework. Moreover, two attributes are taken into account as fast and slow evolution over high and low sensitivity.
Fast evolution implies to early happening of major changes and early freezing and transferring exchange information to downstream activity; as opposed to fast evolution, slow evolution progresses gradually and exchange of information increases while upstream activity proceeds. Low sensitivity means substantial changes in upstream task can be accommodated quickly by downstream task, while high sensitivity refers to even small changes in upstream task causes to a large amount of iteration in downstream task. These two extreme values of evolution and sensitivity are shown in Figure 4-2.
Adopted from (Krishnan et al., 1997) Figure 4-2: Extremes values of evolution and sensitivity
Four types of overlapping are proposed by Krishnan et al. (1997) and they are called Iterative, Preemptive, Divisive, and Distributive overlapping. See Figure 4-3
• Iterative overlapping: It is supposed when evolution is slow and sensitivity is low; in this case, due to low sensitivity of downstream activity and its potentiality to accommodate changes from upstream activity, overlapping could be started with preliminary information from upstream activity and changes are incorporated by subsequent downstream iteration. However, it is not a best scenario for overlapping owing to slow evolution of upstream activity.
• Preemptive overlapping: It is presumed when upstream evolution is fast and downstream sensitivity is high; if so, final information is frozen ahead of normal time by upstream activity and downstream activity can be started early. In this scenario, there is good opportunity to reduce the time, but two points should be taken into consideration: first downstream sensitivity is high and any changes at upstream activity can exert significant effect on downstream activity and lead to large amount of iterations; second, early and fast freezing upstream activity could result in quality loss as well as opportunity loss of improvement afterward. However, this is a scenario that reduces the time because exchanged information is frozen and finalized early in upstream activity.
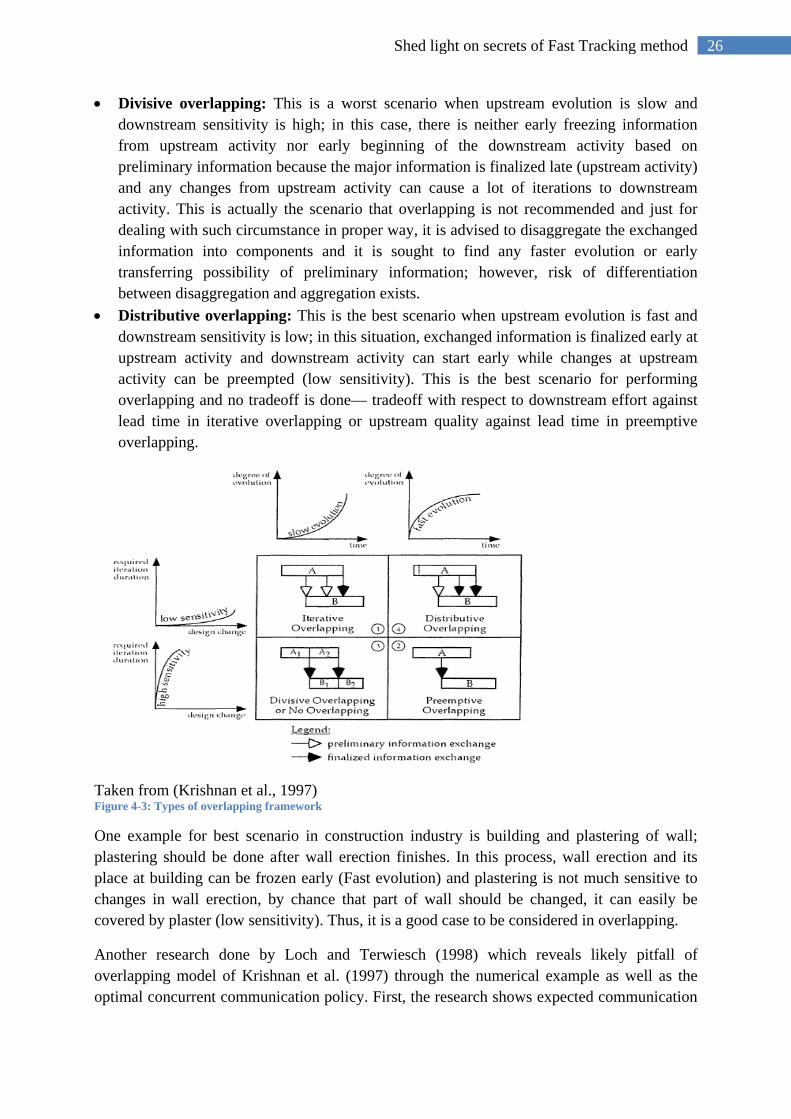
26 Shed light on secrets of Fast Tracking method
• Divisive overlapping: This is a worst scenario when upstream evolution is slow and downstream sensitivity is high; in this case, there is neither early freezing information from upstream activity nor early beginning of the downstream activity based on preliminary information because the major information is finalized late (upstream activity) and any changes from upstream activity can cause a lot of iterations to downstream activity. This is actually the scenario that overlapping is not recommended and just for dealing with such circumstance in proper way, it is advised to disaggregate the exchanged information into components and it is sought to find any faster evolution or early transferring possibility of preliminary information; however, risk of differentiation between disaggregation and aggregation exists.
• Distributive overlapping: This is the best scenario when upstream evolution is fast and downstream sensitivity is low; in this situation, exchanged information is finalized early at upstream activity and downstream activity can start early while changes at upstream activity can be preempted (low sensitivity). This is the best scenario for performing overlapping and no tradeoff is done— tradeoff with respect to downstream effort against lead time in iterative overlapping or upstream quality against lead time in preemptive overlapping.
Taken from (Krishnan et al., 1997) Figure 4-3: Types of overlapping framework
One example for best scenario in construction industry is building and plastering of wall; plastering should be done after wall erection finishes. In this process, wall erection and its place at building can be frozen early (Fast evolution) and plastering is not much sensitive to changes in wall erection, by chance that part of wall should be changed, it can easily be covered by plaster (low sensitivity). Thus, it is a good case to be considered in overlapping.
Another research done by Loch and Terwiesch (1998) which reveals likely pitfall of overlapping model of Krishnan et al. (1997) through the numerical example as well as the optimal concurrent communication policy. First, the research shows expected communication
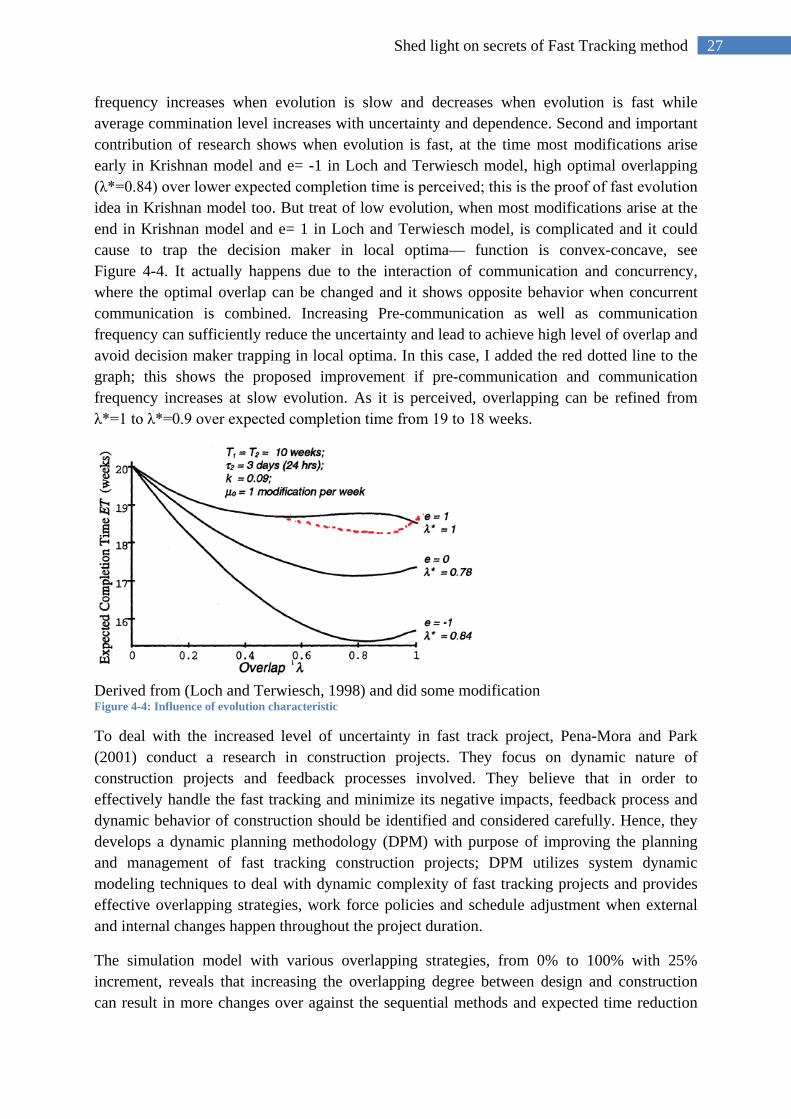
27 Shed light on secrets of Fast Tracking method
frequency increases when evolution is slow and decreases when evolution is fast while average commination level increases with uncertainty and dependence. Second and important contribution of research shows when evolution is fast, at the time most modifications arise early in Krishnan model and e= -1 in Loch and Terwiesch model, high optimal overlapping (λ*=0.84) over lower expected completion time is perceived; this is the proof of fast evolution idea in Krishnan model too. But treat of low evolution, when most modifications arise at the end in Krishnan model and e= 1 in Loch and Terwiesch model, is complicated and it could cause to trap the decision maker in local optima— function is convex-concave, see Figure 4-4. It actually happens due to the interaction of communication and concurrency, where the optimal overlap can be changed and it shows opposite behavior when concurrent communication is combined. Increasing Pre-communication as well as communication frequency can sufficiently reduce the uncertainty and lead to achieve high level of overlap and avoid decision maker trapping in local optima. In this case, I added the red dotted line to the graph; this shows the proposed improvement if pre-communication and communication frequency increases at slow evolution. As it is perceived, overlapping can be refined from λ*=1 to λ*=0.9 over expected completion time from 19 to 18 weeks.
Derived from (Loch and Terwiesch, 1998) and did some modification Figure 4-4: Influence of evolution characteristic
To deal with the increased level of uncertainty in fast track project, Pena-Mora and Park (2001) conduct a research in construction projects. They focus on dynamic nature of construction projects and feedback processes involved. They believe that in order to effectively handle the fast tracking and minimize its negative impacts, feedback process and dynamic behavior of construction should be identified and considered carefully. Hence, they develops a dynamic planning methodology (DPM) with purpose of improving the planning and management of fast tracking construction projects; DPM utilizes system dynamic modeling techniques to deal with dynamic complexity of fast tracking projects and provides effective overlapping strategies, work force policies and schedule adjustment when external and internal changes happen throughout the project duration.
The simulation model with various overlapping strategies, from 0% to 100% with 25% increment, reveals that increasing the overlapping degree between design and construction can result in more changes over against the sequential methods and expected time reduction
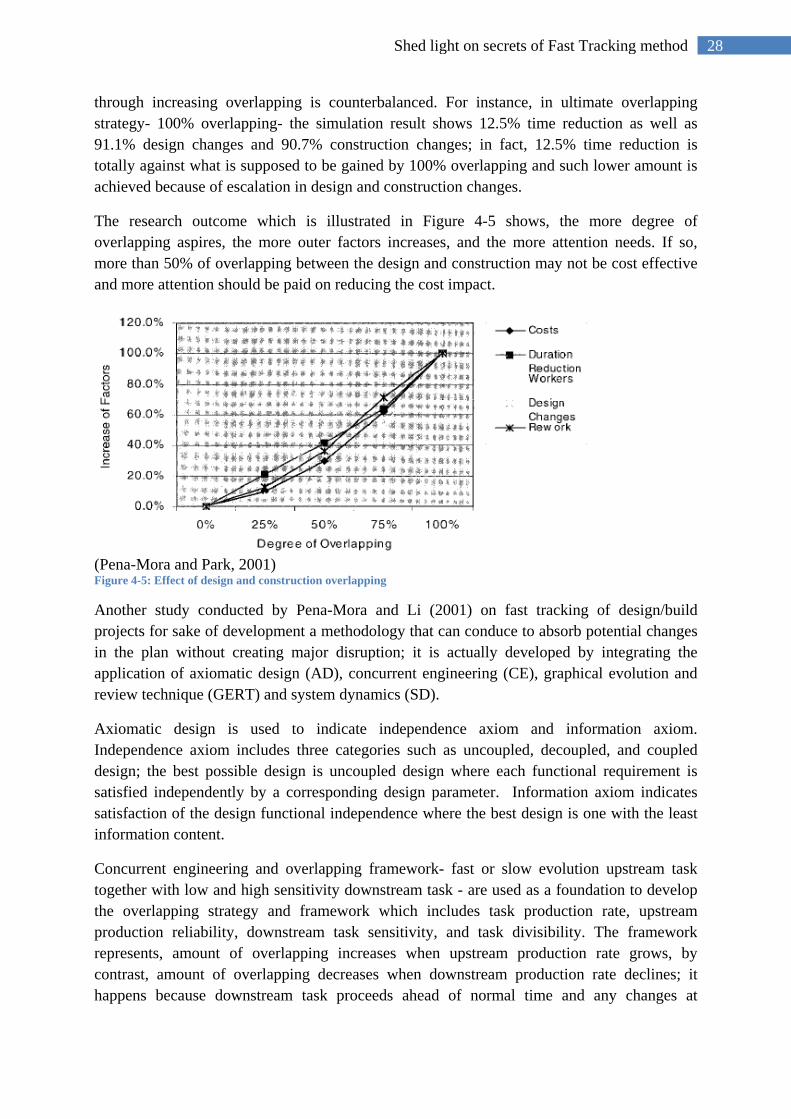
28 Shed light on secrets of Fast Tracking method
through increasing overlapping is counterbalanced. For instance, in ultimate overlapping strategy- 100% overlapping- the simulation result shows 12.5% time reduction as well as 91.1% design changes and 90.7% construction changes; in fact, 12.5% time reduction is totally against what is supposed to be gained by 100% overlapping and such lower amount is achieved because of escalation in design and construction changes.
The research outcome which is illustrated in Figure 4-5 shows, the more degree of overlapping aspires, the more outer factors increases, and the more attention needs. If so, more than 50% of overlapping between the design and construction may not be cost effective and more attention should be paid on reducing the cost impact.
(Pena-Mora and Park, 2001) Figure 4-5: Effect of design and construction overlapping
Another study conducted by Pena-Mora and Li (2001) on fast tracking of design/build projects for sake of development a methodology that can conduce to absorb potential changes in the plan without creating major disruption; it is actually developed by integrating the application of axiomatic design (AD), concurrent engineering (CE), graphical evolution and review technique (GERT) and system dynamics (SD).
Axiomatic design is used to indicate independence axiom and information axiom. Independence axiom includes three categories such as uncoupled, decoupled, and coupled design; the best possible design is uncoupled design where each functional requirement is satisfied independently by a corresponding design parameter. Information axiom indicates satisfaction of the design functional independence where the best design is one with the least information content.
Concurrent engineering and overlapping framework- fast or slow evolution upstream task together with low and high sensitivity downstream task - are used as a foundation to develop the overlapping strategy and framework which includes task production rate, upstream production reliability, downstream task sensitivity, and task divisibility. The framework represents, amount of overlapping increases when upstream production rate grows, by contrast, amount of overlapping decreases when downstream production rate declines; it happens because downstream task proceeds ahead of normal time and any changes at
29 Shed light on secrets of Fast Tracking method
upstream task can lead to ripple effect and more rework. In terms of upstream reliability, downstream sensitivity, and task production rate, amount of overlapping fluctuates; it can augment when upstream reliability and production rate increases as well as downstream sensitivity and production rate decreases. Amount of overlapping is also alerting from 25% of upstream task completion (the best case when upstream is fast and highly reliable and downstream is insensitive) until 175% of upstream task completion (the worst case when upstream is slow and highly unreliable as well as downstream is highly sensitive). Therefore, the ideal situation occurs when there are fast and reliable upstream task together with a slow and insensitive downstream task. (Overlapping framework is attached in appendix)
GERT is chosen to probabilistically incorporate the possible loops and branches in the network; it complements the overlapping framework and probability is added to benefits of overlapping.
Finally, system dynamics modeling technique is used to incorporate the causality links between variables in construction system and feedback processes to increase the chance of implementing fast tracking. The proposed overlapping strategy including task production rate, upstream reliability, and downstream sensitivity is influenced by other variables and factors. Three variables are determined for upstream task and work reliability such as learning effect on reliability, staff experience, and schedule pressure. When construction crew and team member become more familiar with equipment, material and work procedures as well as ratio of experienced staff on team increases, it leads to increase the reliability; in contrast, when pressure on schedule increases, possibility of occurring errors and additional rework rises and consequently leads to decrease the reliability. For downstream task and level of sensitivity, two factors are determined— inspection effectiveness and number of upstream task segments. A robust inspection process can reduce the sensitivity of downstream task to upstream task through early uncovering errors made at upstream and preventing the downstream to proceed based on them. Two contributions are presumable by dismantling upstream task to subtasks; first is increasing the chance of discovering more errors; second is learning from mistakes in previous segments and avoiding recurrence in the next segment.
The explained model was run and result shows, amount of overlapping increases when upstream reliability rises and downstream sensitivity decreases; for instance, in the best scenario when there are highly reliable and fast upstream together with insensitive and slow downstream task, 75% overlapping is recommended, to wit, downstream task can start when 25% of upstream task completes. Two counterintuitive circumstances are observed between simulation model and overlapping strategy; first one happens when there is slow production rate, either upstream or downstream, with two combinations of fairly reliable upstream task and insensitive downstream task as well as highly reliable upstream task and sensitive downstream task, the overlapping strategy says overlapping can be done when 50% of upstream task completes while the simulation states 25% and 75% completion of upstream task is better alternative rather than 50%. Such inconsistency can be the proof on the study and numerical model of Loch and Terwiesch (1998) which they showed when most of modification happens at the end of task and there is slow evolution the behavior of function is complicated and function is convex-concave (Figure 4-4). Another counterintuitive
30 Shed light on secrets of Fast Tracking method
circumstance occurs when there are fast and highly unreliable upstream task together with fast and highly sensitive downstream task as well as slow and highly unreliable upstream task with fast and highly sensitive downstream task, in both mentioned scenarios overlapping strategy recommends to start overlapping in 175% of upstream completion while the simulation states best overlapping could be done on 150% of upstream completion. This contradiction may happen due to other factors like learning effect or inspection effectiveness.
In another study, Bogus et al. (2005) carried out a research based on findings from Krishnan et al. (1997) , Pena-Mora and Li (2001) and their overlapping strategy— it is discussed by them that best scenario for overlapping is when there are upstream task with fast evolution and downstream task with low sensitivity. In practice, it is rare to encounter with mentioned circumstance, Hence, Bogus et al. (2005) introduces some key determinants for evolution and sensitivity; if they are considered, they can help to increase the chance of overlapping. Their study focus on information dependency between activities and exploring ways to move from slow to fast evolution in upstream task as well as high sensitive to low sensitive in downstream task.
Key determinants of evolution are mentioned as design optimization, constraint satisfaction, external information exchange and standardization. Design optimization refers to the level of optimization performed on design elements or the number of design alternatives evaluated, in fact, activity with evaluation of many alternatives or optimization of a parameter has slower characteristic; Constraint satisfaction describes the flexibility of the design in meeting physical limitations and loss of flexibility causes more iteration to meet the constraint and leads to slow evolution; External information exchange refers to the amount of information that is received from or reviewed by external sources and activities that require information from outside resources induce to more iteration and slow down the evolution pace; and finally Standardization describes the extent to which design calculations or the design process is standardized, using off-the-shelf standards can help the designer to speed up the evolution.
Three key determinants of sensitivity are identified as Constraint sensitive, Input sensitive, Integration sensitive. Constraint sensitive refers to the proximity of downstream design to a boundary or a constraint; Input sensitive refers to the level of dependence of the downstream design on specific inputs from other activities; Integration sensitive refers to the ability of downstream design elements to be separated from the entire system.
Generally, Fast evolving activities are ones that are standardized, without optimization, alternative evaluation, and constraint satisfaction or external information exchange. In another word, the more iteration is required in a design activity, the slower the evolution. Downstream activities are more sensitive to changes in upstream information when the downstream design is near a constraint or boundary; when it depends on one key upstream input or when it is integrated such that changes cannot be isolated.(Bogus et al., 2006)
Eight overlapping strategies are taken into consideration, either to speed up the evolution of upstream activity or to reduce the sensitivity of downstream activity, that can assist to reduce information dependency between activities and consequently, increase the amount of overlap
31 Shed light on secrets of Fast Tracking method
and decrease the respective risk (Bogus et al., 2006). The following are overlapping strategies:
1. Early freezing of design criteria: In this strategy, design criteria are frozen early and before upstream design complete, information from upstream activity is released to the downstream activity. It has risk of increasing the cost due to lack of design optimization and infeasibility of pre-established criteria. It is recommended only when the upstream activity is fast revolving.
2. Overdesign: In this strategy, conservative assumption made on the size or strength of project, and then downstream activity can proceed before the upstream activity is complete. This strategy includes risk of lack of enough conservative assumption which can lead to redesign or reconstruction. This strategy for reducing sensitivity in downstream activity is appropriate when there is upstream activity with slow evolution, thus more conservative assumption could be made for overdesign.
3. Early release of preliminary information: This strategy was used already by Krishnan et al. (1997) and in iterative overlapping; it accompanies by risk of change in upstream activity and significant rework in downstream activity due to information is not finalized yet and it may change during the progress. This strategy is advised to be applied to upstream activity when downstream activity is low sensitive to changes in preliminary information from upstream activity.
4. Prototyping: This strategy is similar to early release of preliminary information, but applies for complex system. It is also a first-cut and not necessarily the final system (often used in manufacturing industry); however, downstream activity can begin while risks of deploying poor criteria and substantial revision as well as significant rework exist.
5. No iteration or optimization: This is the suitable strategy for slow evolution activity, where iteration or optimization delays the time of transferring information to downstream activity, hence limiting iteration or optimization accelerates evolution of activity form slow to fast. Risk of raise in cost should be taken into account due to lack of design optimization— similar to early freezing of design criteria.
6. Standardization: This strategy is used to expedite the evolution of upstream activity by adopting standardized product, components, or design. It contains risk of escalation in project cost due to lack of design optimization, in contrary, it accompanies by opportunity of decreasing cost by removing sub-optimal design and increasing constructability. It is advised when upstream activity has slow evolution.
7. Set-based design: This strategy is first utilized by Toyota to reduce product development time. In set-based design, sets of solution or design for one component are developed concurrently with other component by designers, and finial design freezes based on consensus of designers and convergence of the individual design for all components into a final integrated solution. This approach reduces the time by allowing the start of downstream activity while upstream activity is developing. The negative consequence of this strategy can be mentioned as added cost for developing multiple designs for each activity or a more conservative single design. It is
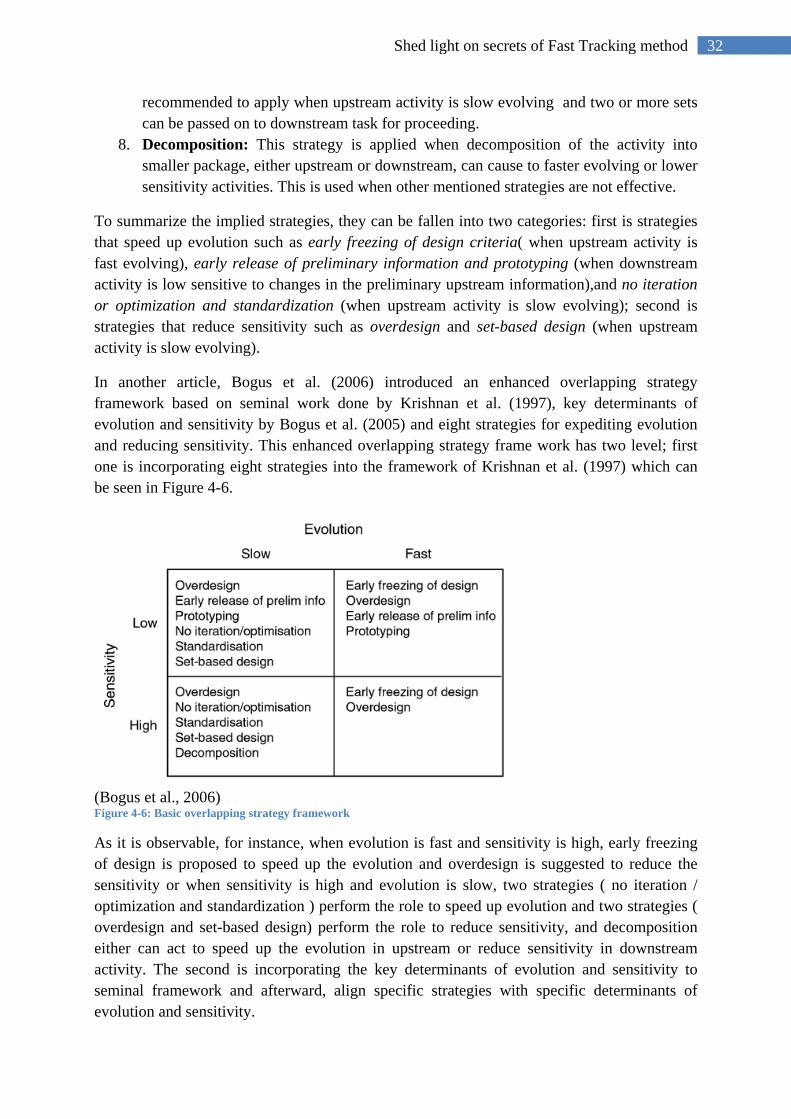
32 Shed light on secrets of Fast Tracking method
recommended to apply when upstream activity is slow evolving and two or more sets can be passed on to downstream task for proceeding.
8. Decomposition: This strategy is applied when decomposition of the activity into smaller package, either upstream or downstream, can cause to faster evolving or lower sensitivity activities. This is used when other mentioned strategies are not effective.
To summarize the implied strategies, they can be fallen into two categories: first is strategies that speed up evolution such as early freezing of design criteria( when upstream activity is fast evolving), early release of preliminary information and prototyping (when downstream activity is low sensitive to changes in the preliminary upstream information),and no iteration or optimization and standardization (when upstream activity is slow evolving); second is strategies that reduce sensitivity such as overdesign and set-based design (when upstream activity is slow evolving).
In another article, Bogus et al. (2006) introduced an enhanced overlapping strategy framework based on seminal work done by Krishnan et al. (1997), key determinants of evolution and sensitivity by Bogus et al. (2005) and eight strategies for expediting evolution and reducing sensitivity. This enhanced overlapping strategy frame work has two level; first one is incorporating eight strategies into the framework of Krishnan et al. (1997) which can be seen in Figure 4-6.
(Bogus et al., 2006) Figure 4-6: Basic overlapping strategy framework
As it is observable, for instance, when evolution is fast and sensitivity is high, early freezing of design is proposed to speed up the evolution and overdesign is suggested to reduce the sensitivity or when sensitivity is high and evolution is slow, two strategies ( no iteration / optimization and standardization ) perform the role to speed up evolution and two strategies ( overdesign and set-based design) perform the role to reduce sensitivity, and decomposition either can act to speed up the evolution in upstream or reduce sensitivity in downstream activity. The second is incorporating the key determinants of evolution and sensitivity to seminal framework and afterward, align specific strategies with specific determinants of evolution and sensitivity.
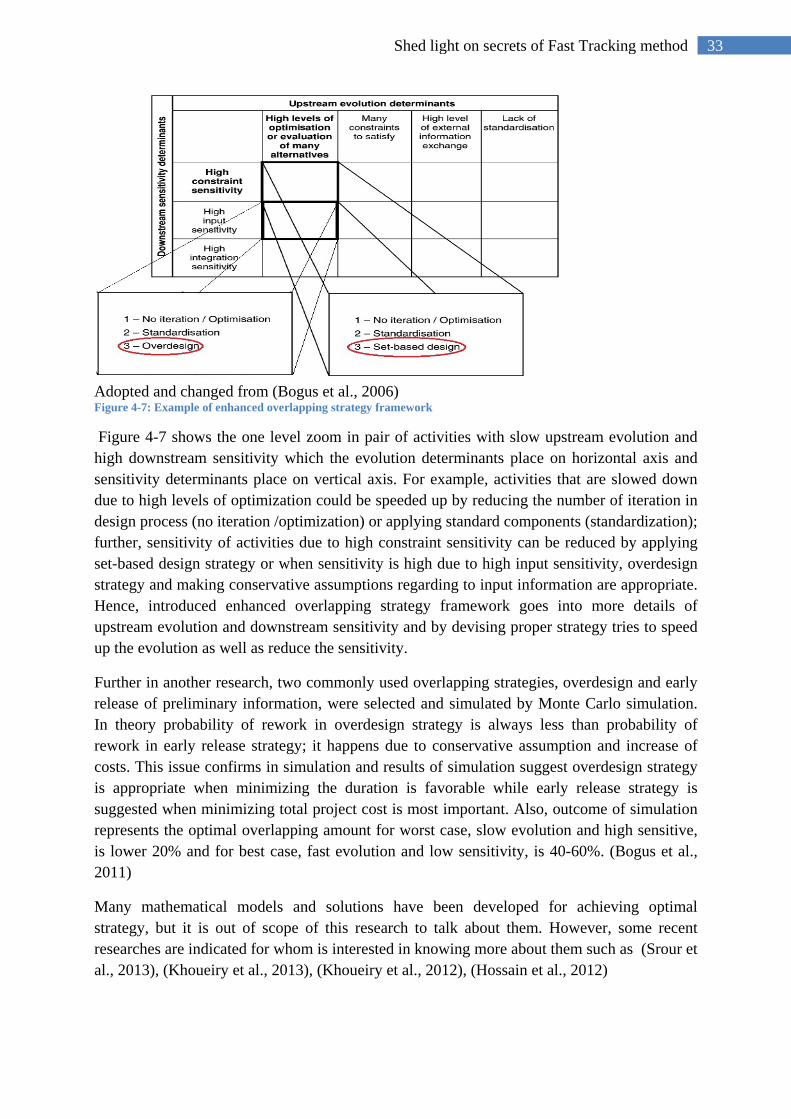
33 Shed light on secrets of Fast Tracking method
Adopted and changed from (Bogus et al., 2006) Figure 4-7: Example of enhanced overlapping strategy framework
Figure 4-7 shows the one level zoom in pair of activities with slow upstream evolution and high downstream sensitivity which the evolution determinants place on horizontal axis and sensitivity determinants place on vertical axis. For example, activities that are slowed down due to high levels of optimization could be speeded up by reducing the number of iteration in design process (no iteration /optimization) or applying standard components (standardization); further, sensitivity of activities due to high constraint sensitivity can be reduced by applying set-based design strategy or when sensitivity is high due to high input sensitivity, overdesign strategy and making conservative assumptions regarding to input information are appropriate. Hence, introduced enhanced overlapping strategy framework goes into more details of upstream evolution and downstream sensitivity and by devising proper strategy tries to speed up the evolution as well as reduce the sensitivity.
Further in another research, two commonly used overlapping strategies, overdesign and early release of preliminary information, were selected and simulated by Monte Carlo simulation. In theory probability of rework in overdesign strategy is always less than probability of rework in early release strategy; it happens due to conservative assumption and increase of costs. This issue confirms in simulation and results of simulation suggest overdesign strategy is appropriate when minimizing the duration is favorable while early release strategy is suggested when minimizing total project cost is most important. Also, outcome of simulation represents the optimal overlapping amount for worst case, slow evolution and high sensitive, is lower 20% and for best case, fast evolution and low sensitivity, is 40-60%. (Bogus et al., 2011)
Many mathematical models and solutions have been developed for achieving optimal strategy, but it is out of scope of this research to talk about them. However, some recent researches are indicated for whom is interested in knowing more about them such as (Srour et al., 2013), (Khoueiry et al., 2013), (Khoueiry et al., 2012), (Hossain et al., 2012)
34 Shed light on secrets of Fast Tracking method
4.4 Discussion
Overlapping and performing sequential pair of activities in parallel does not occur with a simple assumption and without risk. On the one hand, downstream activity starts early and ahead of its plan with preliminary information and incomplete data from upstream activity; on the other hand, upstream activity changes throughout the time until it accomplishes totally. Mentioned process of exchanging information may result in iteration and rework in downstream activity which is the major risk that project manager/planner encounters with. The first work to deal with such risk was done through introducing and analyzing exchanged information and the characteristics of activities, evolution and sensitivity. Evolution indicates freezing and transferring the exchanged information from upstream task to downstream task either early (fast evolution) or late (slow evolution); sensitivity implies amount of rework and iteration needs for downstream activity to accommodate upstream changes. It is high sensitive when large amount of iteration is needed; by contrast, it is low sensitive when small of amount of iteration is required to adapt changes. Further, another factors including production rate and task divisibility were added to activity characteristics and a comprehensive framework was built for degree of overlapping based on percent completion of upstream task with range from 25% to 175%— best and worst scenario. Another breakthrough of managing risk in overlapping strategies was done through introducing determinants of evolution and sensitivity and further, applying an overlapping strategy framework to move the evolution of activity from slow to fast as well as sensitivity of activity from high to low. In ideal case, fast evolution makes faster and low sensitive makes lower sensitive through applying proper strategies. However, there are following discussions with regard to Bogus’ strategy framework in my point of departure.
First of all, besides the novelty of overlapping strategy framework (Figure 4-6) and its innovation for providing more opportunity to perform overlap especially where no overlapping is naturally presumed, what should not be overlooked is justification of applying the strategies and making tradeoff among saved time, imposed cost and plausible quality loss. In case, no iteration or optimization strategy is applied to speed up the evolution, limiting iteration or optimization to accelerate speed of evolution may cause to lose the quality and consequently, expectations may not be met. Or when sensitivity is too high and overdesign strategy are applied to reduce the sensitivity, overdesign and making conservative assumption can only impose extra expenses to activity and such assumptions cannot reduce the amount of reworks for adapting changes produced in upstream activity. In fast evolution activities applying early freezing of design or early release of preliminary information to speed up evolution should be done with paying more attention because it may lead to add more risk of loss of quality or more iteration in downstream due to pushing the activity to release the information very early while the activity is naturally able to finalize the information ahead of time. with regard to enhanced overlapping strategy framework (Figure 4-7), it seems the time elapses to gather the needful information for analysis and applying proper strategy in detailed level, key determinants of sensitivity and evolution, counterbalances the expected time saving. Hence, high complexity and its counter effect should be considered.
35 Shed light on secrets of Fast Tracking method
Another discussion relates to the way in which strategies sorted out in framework. Whereas the authors did not mention it, I have a criticism to putting the overdesign strategy in cell where evolution is fast and sensitivity is low. In my opinion, when upstream activity is fast and exchanged information can be finalized and passed on to downstream task early, on the other hand, downstream activity is low sensitive and with small amount of iteration can conform the changes from upstream, hence applying overdesign and conservative assumption just can hinder the process as well as incur more expenses. In mentioned circumstance, applying such strategy is not justifiable unless high level of quality is needed.
Another debate is attributed to enhanced overlapping strategy framework and going into more details with taking into account evolution and sensitivity determinants. This process may induce to increase the complexity of framework and affect main purpose of applying it which is actually making more overlapping opportunities between pair of activities and ultimately reducing the time; in other words, reduced time might be offset by extra time elapses to gather data and incorporate into framework as well as increase complexity of framework in such level that loss is more than expected benefits. Instead of that, I think overlapping strategy framework can take the benefit of production rate factor, it was introduced by Pena-Mora and Li (2001), and it can be expanded like Figure 4-8. In fact, when characteristics of activities-evolution and sensitivity- are identified and analyzed in order to find the opportunity for overlapping, there is a chance to identify the production rate too, hence this process does not take extra time in comparison to enhanced strategy framework, but on other hand it goes into more details and provide vivid picture for decision makers.
The Proposed framework is mainly built on framework of Bogus et al. (2006) with some changes in sorting of strategies. As it is observable from Figure 4-8, it has three factors; evolution and sensitivity are the same as before and production rate is added as third criteria. Just to recall, in fast production rate 25% of work completes in much less time over the low production rate.
Let me start from upper quadrant in left, where evolution is slow and sensitivity is low. In case, the production rate of downstream task is also slow, no iteration/optimization (putting limit for number of iteration), standardization (refers to adoption of practices or components from repetitively used in project), early release of preliminary information and prototyping are recommended to speed up the process of transferring information from upstream to downstream. On the other hand, downstream is low sensitive to changes and has low production rate which means gradually can adapt upstream changes. Thus, set-based design strategy can be a good choice to work concurrently on components and keep the sensitivity in low level. Further, when downstream production rate is fast, conservative assumption of overdesign strategy is justifiable because although downstream activity is low sensitive to changes from upstream activity, but its production rate is fast and overdesign strategy can reduce the sensitivity or keep the sensitivity in low level.
In second quadrant at down left, evolution is slow and sensitivity is high while production rate of downstream activity is slow, the same as previous quadrant, no iteration/optimization and standardization are suitable to speed up slow evolution while early release of preliminary
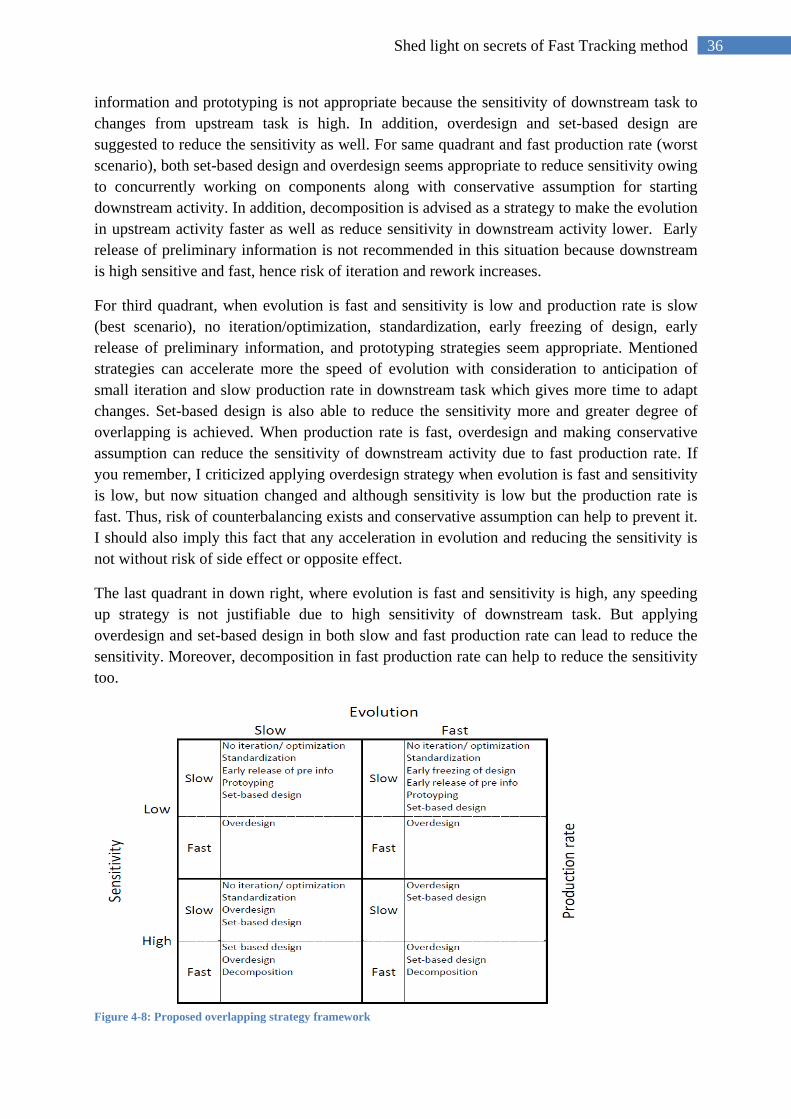
36 Shed light on secrets of Fast Tracking method
information and prototyping is not appropriate because the sensitivity of downstream task to changes from upstream task is high. In addition, overdesign and set-based design are suggested to reduce the sensitivity as well. For same quadrant and fast production rate (worst scenario), both set-based design and overdesign seems appropriate to reduce sensitivity owing to concurrently working on components along with conservative assumption for starting downstream activity. In addition, decomposition is advised as a strategy to make the evolution in upstream activity faster as well as reduce sensitivity in downstream activity lower. Early release of preliminary information is not recommended in this situation because downstream is high sensitive and fast, hence risk of iteration and rework increases.
For third quadrant, when evolution is fast and sensitivity is low and production rate is slow (best scenario), no iteration/optimization, standardization, early freezing of design, early release of preliminary information, and prototyping strategies seem appropriate. Mentioned strategies can accelerate more the speed of evolution with consideration to anticipation of small iteration and slow production rate in downstream task which gives more time to adapt changes. Set-based design is also able to reduce the sensitivity more and greater degree of overlapping is achieved. When production rate is fast, overdesign and making conservative assumption can reduce the sensitivity of downstream activity due to fast production rate. If you remember, I criticized applying overdesign strategy when evolution is fast and sensitivity is low, but now situation changed and although sensitivity is low but the production rate is fast. Thus, risk of counterbalancing exists and conservative assumption can help to prevent it. I should also imply this fact that any acceleration in evolution and reducing the sensitivity is not without risk of side effect or opposite effect.
The last quadrant in down right, where evolution is fast and sensitivity is high, any speeding up strategy is not justifiable due to high sensitivity of downstream task. But applying overdesign and set-based design in both slow and fast production rate can lead to reduce the sensitivity. Moreover, decomposition in fast production rate can help to reduce the sensitivity too.
Figure 4-8: Proposed overlapping strategy framework

37 Shed light on secrets of Fast Tracking method
In a nutshell, the proposed approach by adding production rate to overlapping strategy framework provides more insight to apply the right strategy, at right place. For instance, when evolution is fast and sensitivity is low, applying overdesign strategy and conservative assumption seems to make hindrance in process. But when production rate is considered and there is fast production rate with low sensitivity, applying overdesign strategy makes sense and can help to reduce the sensitivity as well. Hence, the proposed overlapping strategy framework unlike the enhanced overlapping strategy framework does not increase the complexity and it is not time-consuming to collect data and create it. Also, it provides more insight and information to make right decision for application of strategy.
38 Critical Chain method demystification
Critical Chain method demystification
Chapter5
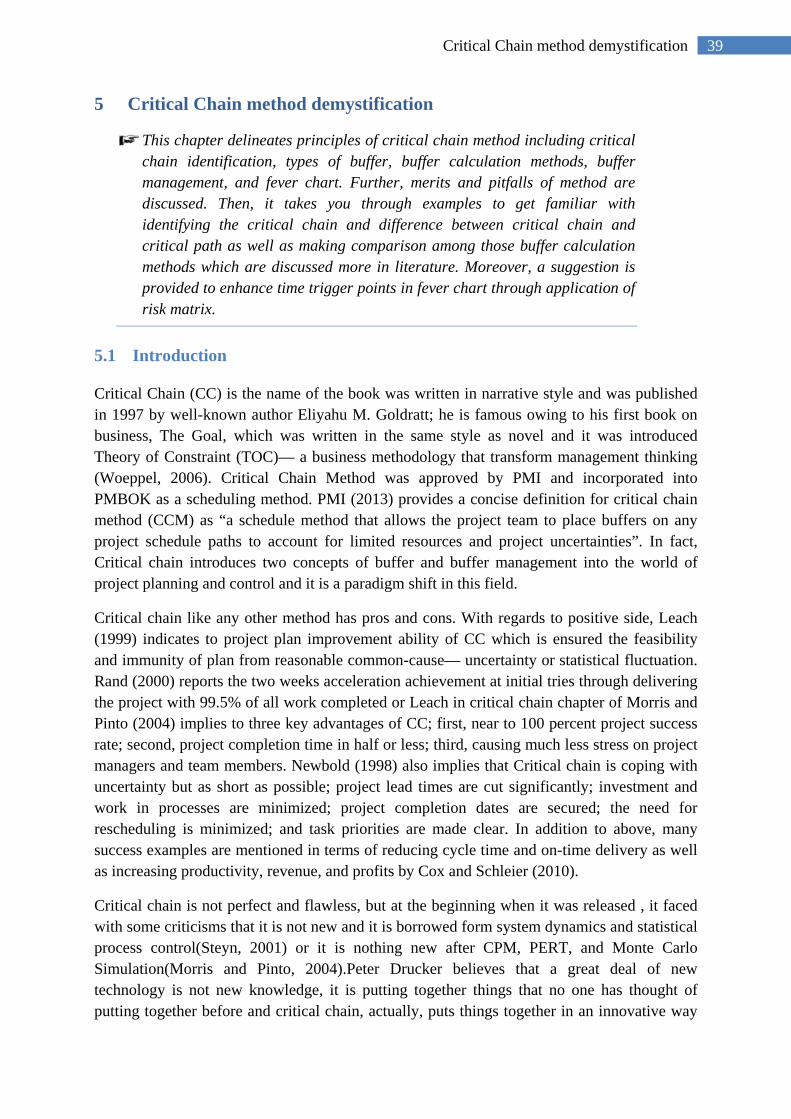
39 Critical Chain method demystification
5 Critical Chain method demystification
This chapter delineates principles of critical chain method including critical chain identification, types of buffer, buffer calculation methods, buffer management, and fever chart. Further, merits and pitfalls of method are discussed. Then, it takes you through examples to get familiar with identifying the critical chain and difference between critical chain and critical path as well as making comparison among those buffer calculation methods which are discussed more in literature. Moreover, a suggestion is provided to enhance time trigger points in fever chart through application of risk matrix.
5.1 Introduction
Critical Chain (CC) is the name of the book was written in narrative style and was published in 1997 by well-known author Eliyahu M. Goldratt; he is famous owing to his first book on business, The Goal, which was written in the same style as novel and it was introduced Theory of Constraint (TOC)— a business methodology that transform management thinking (Woeppel, 2006). Critical Chain Method was approved by PMI and incorporated into PMBOK as a scheduling method. PMI (2013) provides a concise definition for critical chain method (CCM) as “a schedule method that allows the project team to place buffers on any project schedule paths to account for limited resources and project uncertainties”. In fact, Critical chain introduces two concepts of buffer and buffer management into the world of project planning and control and it is a paradigm shift in this field.
Critical chain like any other method has pros and cons. With regards to positive side, Leach (1999) indicates to project plan improvement ability of CC which is ensured the feasibility and immunity of plan from reasonable common-cause— uncertainty or statistical fluctuation. Rand (2000) reports the two weeks acceleration achievement at initial tries through delivering the project with 99.5% of all work completed or Leach in critical chain chapter of Morris and Pinto (2004) implies to three key advantages of CC; first, near to 100 percent project success rate; second, project completion time in half or less; third, causing much less stress on project managers and team members. Newbold (1998) also implies that Critical chain is coping with uncertainty but as short as possible; project lead times are cut significantly; investment and work in processes are minimized; project completion dates are secured; the need for rescheduling is minimized; and task priorities are made clear. In addition to above, many success examples are mentioned in terms of reducing cycle time and on-time delivery as well as increasing productivity, revenue, and profits by Cox and Schleier (2010).
Critical chain is not perfect and flawless, but at the beginning when it was released , it faced with some criticisms that it is not new and it is borrowed form system dynamics and statistical process control(Steyn, 2001) or it is nothing new after CPM, PERT, and Monte Carlo Simulation(Morris and Pinto, 2004).Peter Drucker believes that a great deal of new technology is not new knowledge, it is putting together things that no one has thought of putting together before and critical chain, actually, puts things together in an innovative way
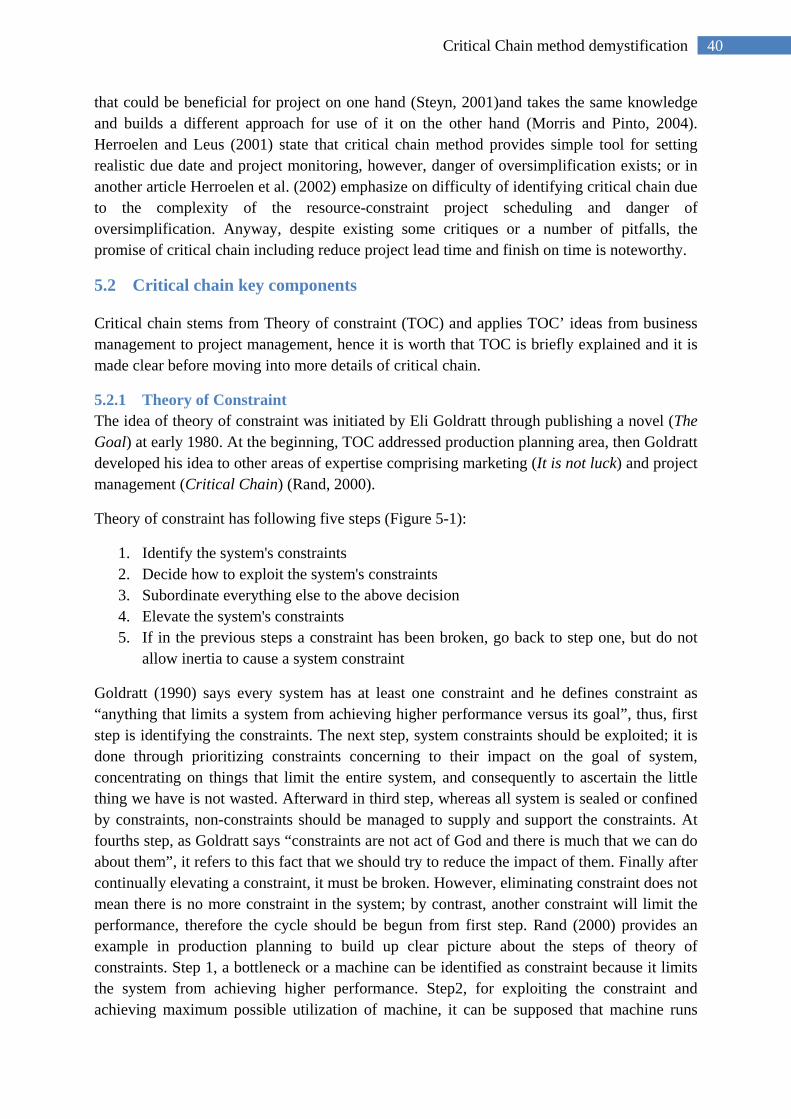
40 Critical Chain method demystification
that could be beneficial for project on one hand (Steyn, 2001)and takes the same knowledge and builds a different approach for use of it on the other hand (Morris and Pinto, 2004). Herroelen and Leus (2001) state that critical chain method provides simple tool for setting realistic due date and project monitoring, however, danger of oversimplification exists; or in another article Herroelen et al. (2002) emphasize on difficulty of identifying critical chain due to the complexity of the resource-constraint project scheduling and danger of oversimplification. Anyway, despite existing some critiques or a number of pitfalls, the promise of critical chain including reduce project lead time and finish on time is noteworthy.
5.2 Critical chain key components
Critical chain stems from Theory of constraint (TOC) and applies TOC’ ideas from business management to project management, hence it is worth that TOC is briefly explained and it is made clear before moving into more details of critical chain.
5.2.1 Theory of Constraint The idea of theory of constraint was initiated by Eli Goldratt through publishing a novel (The Goal) at early 1980. At the beginning, TOC addressed production planning area, then Goldratt developed his idea to other areas of expertise comprising marketing (It is not luck) and project management (Critical Chain) (Rand, 2000).
Theory of constraint has following five steps (Figure 5-1):
1. Identify the system's constraints 2. Decide how to exploit the system's constraints 3. Subordinate everything else to the above decision 4. Elevate the system's constraints 5. If in the previous steps a constraint has been broken, go back to step one, but do not
allow inertia to cause a system constraint
Goldratt (1990) says every system has at least one constraint and he defines constraint as “anything that limits a system from achieving higher performance versus its goal”, thus, first step is identifying the constraints. The next step, system constraints should be exploited; it is done through prioritizing constraints concerning to their impact on the goal of system, concentrating on things that limit the entire system, and consequently to ascertain the little thing we have is not wasted. Afterward in third step, whereas all system is sealed or confined by constraints, non-constraints should be managed to supply and support the constraints. At fourths step, as Goldratt says “constraints are not act of God and there is much that we can do about them”, it refers to this fact that we should try to reduce the impact of them. Finally after continually elevating a constraint, it must be broken. However, eliminating constraint does not mean there is no more constraint in the system; by contrast, another constraint will limit the performance, therefore the cycle should be begun from first step. Rand (2000) provides an example in production planning to build up clear picture about the steps of theory of constraints. Step 1, a bottleneck or a machine can be identified as constraint because it limits the system from achieving higher performance. Step2, for exploiting the constraint and achieving maximum possible utilization of machine, it can be supposed that machine runs
41 Critical Chain method demystification
during the lunch with operators stagger their break, or reduce the number of changeovers. Step3, in order to subordinate the constraint, there is no reason that other machines run at higher production rate; instead, they should be synchronized with constraint production rate. Step4, for elevating the constraint and increasing the output of machine, it is suggested that additional shift is added to its wok plan. Step5, by increasing the capacity of machine, it is possible that the original constraint is no longer the constraint of system; hence the process should be repeated again.
Figure 5-1. Theory of Constraints Steps
What has been explained so far is just a general view of five focusing steps of theory of constraint, while TOC has a thinking process along with some primary tools to answer three questions: what to change, what to change to, how to cause the change. Figure 5-2 illustrates the thinking process of TOC; I do not go into more details of them and just refer the one who is interested in acquiring more knowledge to theory of constraints handbook (Cox and Schleier, 2010)
(Leach, 2005) Figure 5-2: TOC Thinking process
1.Identify the system's constraints
2.Exploit the system's constraints
3.Subordinate everything else to the
above decision
4.Elevate the system's constraints
5.Go back to step one
42 Critical Chain method demystification
5.2.2 Critical chain Critical chain method has originated from theory of constraint; it means five focusing steps in TOC are applied in critical chain too. Hence, let me show you how critical chain incorporates into TOC’ steps. According to TOC, the first step is identifying the system constraint; it is important because if one who works on issues that are not constraint of system, he most probably cannot get a favorite result or on the opposite side, problem becomes worse by making new constraint and of course, no improvement is achieved. In project, constraint is the longest chain of tasks which show the project completion time and it is called critical path. PMI (2013) defines critical path “a method used to estimate the minimum project duration and determine the amount of scheduling flexibility on the logical network paths within the schedule model”. Critical path method has been discussed that it does not consider two key issues; first, there is no information about the task uncertainty and duration probability; second, there is no implication about the resource constraint.
Problem relates to task uncertainty was considered by PERT and Monte Carlo Simulation methods, but resource constraint was not addressed in calculation of longest path to find shorter project duration, except performing resource leveling after identifying critical path. This approach also has a problem because when resource leveling is done, paths may get float and critical path is no longer critical— critical path is a path in project network that has zero float. This is where the importance of critical chain is highlighted. in fact, critical chain includes the resource dependencies that define the overall longest path(Leach, 2005). Newbold (1998) states critical chain is the set of tasks that determine, when the project can finish; they are critical because any changes or improvements directly influence on overall duration of project, if they get improved, the project can finish earlier. They are chain and they are not path due to existence of resource dependency and it is obvious the project does not have infinite resources, such issue impacts on overall project duration.PMI (2013) indicates that resource-constrained critical path is known as the critical chain. Thus, the first step, identifying project constraint, is done by introducing critical chain rather critical path.
In sake of determining critical chain, Newbold (1998) suggests three steps; first, set up the initial plan including tasks, task dependencies and resource requirements and place the task at their late start time in order to minimize work in process(WIP); second step, make the plan realistic by removing resource contention which is called load leveling or resource leveling; third step, finding critical chain as a set of tasks that cannot be pushed to either past or future without pushing start and completion date. However, identifying the critical chain is not very easy due to resource dependencies and aggregate past slack, thus, he suggests to plan the schedule one time based on early start and another time based on late start and finally, those tasks with zero aggregate past slack are initial critical chain— Aggregate past slack is difference between task start times when the schedule is planned for early start and late start.
Second step is to exploit the Critical Chain.Newbold (1998) generally pinpoints that do everything we can consider to improve performance of critical chain; it can be creation of a detailed schedule without resource contention. The exploitation of critical chain is addressed by Leach (2005) through reducing both the planned time and the actual project performance time. To attain mentioned exploitation from critical chain, it is necessary to understand the
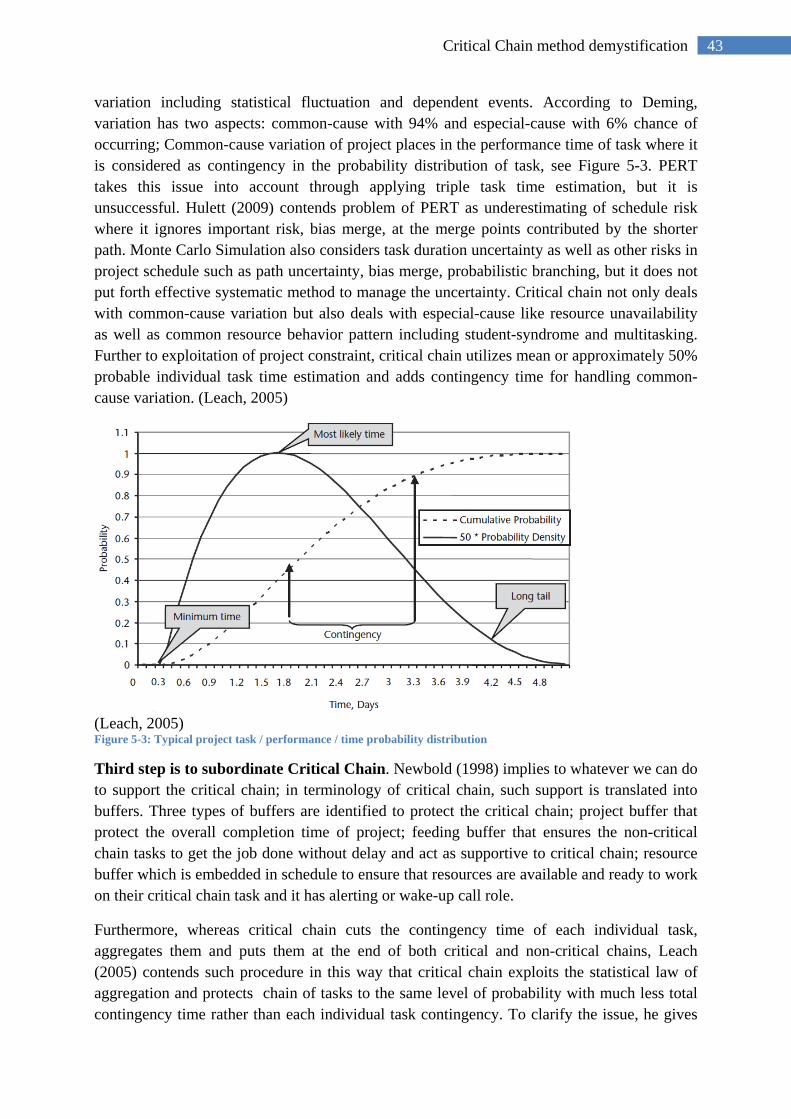
43 Critical Chain method demystification
variation including statistical fluctuation and dependent events. According to Deming, variation has two aspects: common-cause with 94% and especial-cause with 6% chance of occurring; Common-cause variation of project places in the performance time of task where it is considered as contingency in the probability distribution of task, see Figure 5-3. PERT takes this issue into account through applying triple task time estimation, but it is unsuccessful. Hulett (2009) contends problem of PERT as underestimating of schedule risk where it ignores important risk, bias merge, at the merge points contributed by the shorter path. Monte Carlo Simulation also considers task duration uncertainty as well as other risks in project schedule such as path uncertainty, bias merge, probabilistic branching, but it does not put forth effective systematic method to manage the uncertainty. Critical chain not only deals with common-cause variation but also deals with especial-cause like resource unavailability as well as common resource behavior pattern including student-syndrome and multitasking. Further to exploitation of project constraint, critical chain utilizes mean or approximately 50% probable individual task time estimation and adds contingency time for handling common-cause variation. (Leach, 2005)
(Leach, 2005) Figure 5-3: Typical project task / performance / time probability distribution
Third step is to subordinate Critical Chain. Newbold (1998) implies to whatever we can do to support the critical chain; in terminology of critical chain, such support is translated into buffers. Three types of buffers are identified to protect the critical chain; project buffer that protect the overall completion time of project; feeding buffer that ensures the non-critical chain tasks to get the job done without delay and act as supportive to critical chain; resource buffer which is embedded in schedule to ensure that resources are available and ready to work on their critical chain task and it has alerting or wake-up call role.
Furthermore, whereas critical chain cuts the contingency time of each individual task, aggregates them and puts them at the end of both critical and non-critical chains, Leach (2005) contends such procedure in this way that critical chain exploits the statistical law of aggregation and protects chain of tasks to the same level of probability with much less total contingency time rather than each individual task contingency. To clarify the issue, he gives
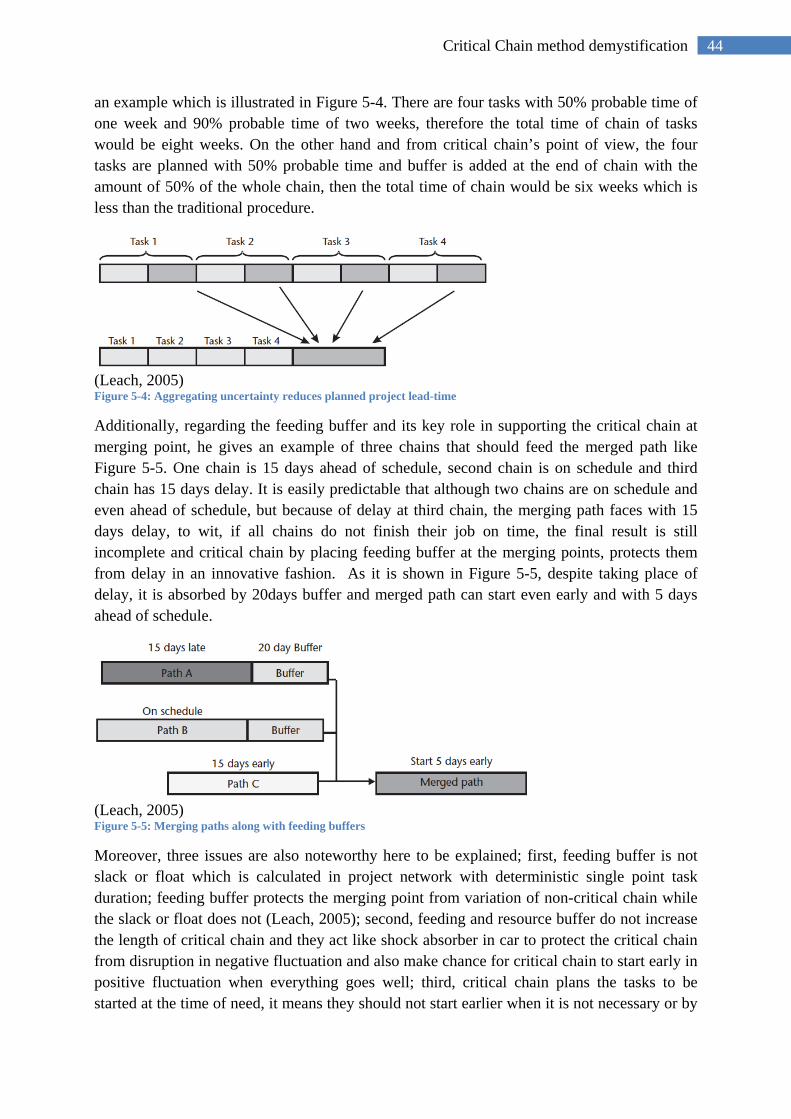
44 Critical Chain method demystification
an example which is illustrated in Figure 5-4. There are four tasks with 50% probable time of one week and 90% probable time of two weeks, therefore the total time of chain of tasks would be eight weeks. On the other hand and from critical chain’s point of view, the four tasks are planned with 50% probable time and buffer is added at the end of chain with the amount of 50% of the whole chain, then the total time of chain would be six weeks which is less than the traditional procedure.
(Leach, 2005) Figure 5-4: Aggregating uncertainty reduces planned project lead-time
Additionally, regarding the feeding buffer and its key role in supporting the critical chain at merging point, he gives an example of three chains that should feed the merged path like Figure 5-5. One chain is 15 days ahead of schedule, second chain is on schedule and third chain has 15 days delay. It is easily predictable that although two chains are on schedule and even ahead of schedule, but because of delay at third chain, the merging path faces with 15 days delay, to wit, if all chains do not finish their job on time, the final result is still incomplete and critical chain by placing feeding buffer at the merging points, protects them from delay in an innovative fashion. As it is shown in Figure 5-5, despite taking place of delay, it is absorbed by 20days buffer and merged path can start even early and with 5 days ahead of schedule.
(Leach, 2005) Figure 5-5: Merging paths along with feeding buffers
Moreover, three issues are also noteworthy here to be explained; first, feeding buffer is not slack or float which is calculated in project network with deterministic single point task duration; feeding buffer protects the merging point from variation of non-critical chain while the slack or float does not (Leach, 2005); second, feeding and resource buffer do not increase the length of critical chain and they act like shock absorber in car to protect the critical chain from disruption in negative fluctuation and also make chance for critical chain to start early in positive fluctuation when everything goes well; third, critical chain plans the tasks to be started at the time of need, it means they should not start earlier when it is not necessary or by
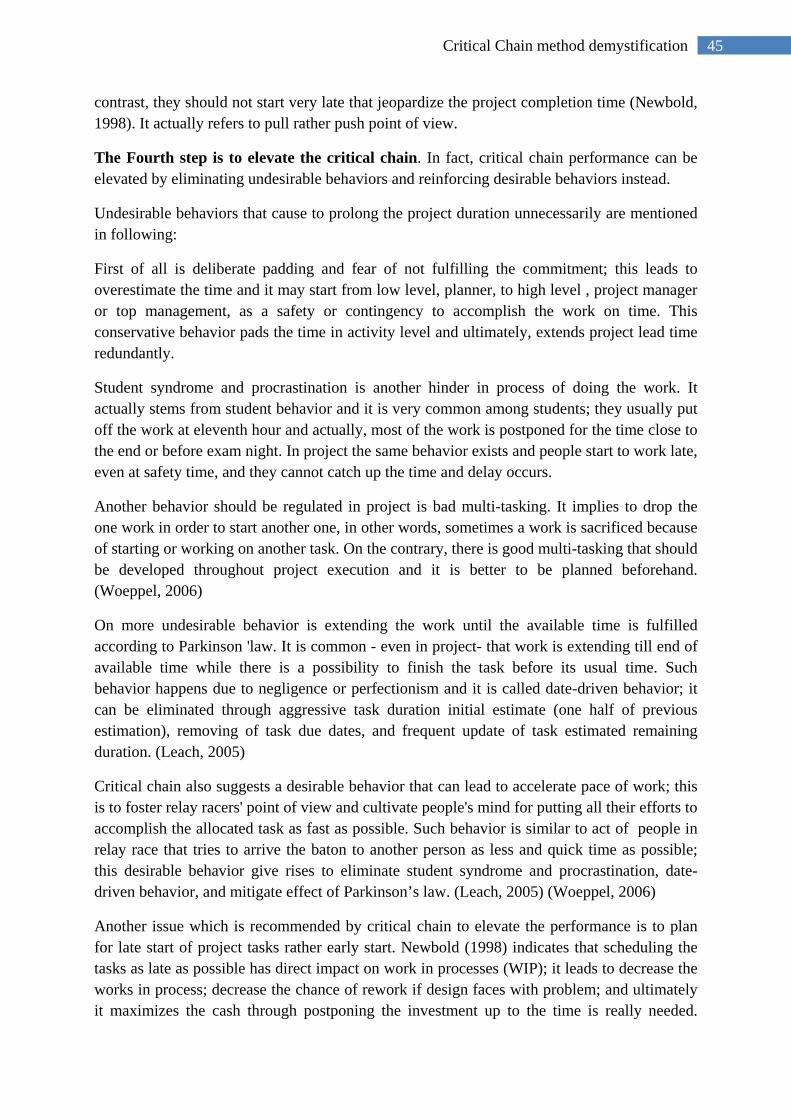
45 Critical Chain method demystification
contrast, they should not start very late that jeopardize the project completion time (Newbold, 1998). It actually refers to pull rather push point of view.
The Fourth step is to elevate the critical chain. In fact, critical chain performance can be elevated by eliminating undesirable behaviors and reinforcing desirable behaviors instead.
Undesirable behaviors that cause to prolong the project duration unnecessarily are mentioned in following:
First of all is deliberate padding and fear of not fulfilling the commitment; this leads to overestimate the time and it may start from low level, planner, to high level , project manager or top management, as a safety or contingency to accomplish the work on time. This conservative behavior pads the time in activity level and ultimately, extends project lead time redundantly.
Student syndrome and procrastination is another hinder in process of doing the work. It actually stems from student behavior and it is very common among students; they usually put off the work at eleventh hour and actually, most of the work is postponed for the time close to the end or before exam night. In project the same behavior exists and people start to work late, even at safety time, and they cannot catch up the time and delay occurs.
Another behavior should be regulated in project is bad multi-tasking. It implies to drop the one work in order to start another one, in other words, sometimes a work is sacrificed because of starting or working on another task. On the contrary, there is good multi-tasking that should be developed throughout project execution and it is better to be planned beforehand. (Woeppel, 2006)
On more undesirable behavior is extending the work until the available time is fulfilled according to Parkinson 'law. It is common - even in project- that work is extending till end of available time while there is a possibility to finish the task before its usual time. Such behavior happens due to negligence or perfectionism and it is called date-driven behavior; it can be eliminated through aggressive task duration initial estimate (one half of previous estimation), removing of task due dates, and frequent update of task estimated remaining duration. (Leach, 2005)
Critical chain also suggests a desirable behavior that can lead to accelerate pace of work; this is to foster relay racers' point of view and cultivate people's mind for putting all their efforts to accomplish the allocated task as fast as possible. Such behavior is similar to act of people in relay race that tries to arrive the baton to another person as less and quick time as possible; this desirable behavior give rises to eliminate student syndrome and procrastination, date-driven behavior, and mitigate effect of Parkinson’s law. (Leach, 2005) (Woeppel, 2006)
Another issue which is recommended by critical chain to elevate the performance is to plan for late start of project tasks rather early start. Newbold (1998) indicates that scheduling the tasks as late as possible has direct impact on work in processes (WIP); it leads to decrease the works in process; decrease the chance of rework if design faces with problem; and ultimately it maximizes the cash through postponing the investment up to the time is really needed.
46 Critical Chain method demystification
Leach (2005) defines early start as permitting all of the non-critical path tasks to start earlier than is necessary to meet the schedule date and he believes the existence of slack causes to encourage student syndrome.
To put in a nut shell, differences between critical chain method and critical path method can be summed up in following issues:
Applying average task duration rather safe duration; slacks are changed in the form of use as buffer at key point; tasks are planned for as late as possible to minimize the WIP; and both precedence and resource dependency are taken into account(Newbold, 1998).
5.2.3 Buffer size As it was mentioned in section 5.2.2, three types of buffers are presumed in critical chain method, project buffer, feeding buffer, and resource buffer. Except the resource buffer that has warning role and acts as wake-up call tool, the size of buffer in both project and feeding buffer should be calculated. Amount of buffer size is important due to their responsibilities to deal with project uncertainties, common-cause variation in activity duration, and determine total duration of project. Newbold (1998) emphasizes on significant role of buffer and of course, size of buffer to protect project commitment date and avoid rescheduling. He brings some reasons that schedules should be changed as in frequent as possible such as changing priorities of workers and managers, changing of critical chain, and changing buffer location and monitoring efforts.
According to assumptions of critical chain including eliminate of extra padding and 50% task time estimation as well as planning activities for starting as late as possible cause to increase the vulnerability of schedule, therefore proper buffer is needed to protect it as well. Newbold (1998) indicates that uncertainty related to any chain is aggregated at the end of that chain instead of padding or inflating task time and this approach protects entire chain rather individual tasks. Thus, the size of buffer does matters to provide enough protection.
Size of buffer determines the total duration of project and amount of contingency that is needed to protect the schedule. Goldratt applies two statistical rules for calculation of buffer size which lead to not only protect the schedule, but also reduce the overall project duration as well. First is the additive rule for variation; it says uncertainty of the sum of the events is much less than the sum of the uncertainty for each event. It is tangible because besides negative variation, positive variation can happen. The second rule is central-limit theorem which says as the samples increase, the distribution of different samples tends toward a normal distribution. In chain of tasks, mentioned rule means uncertainty of whole chain is symmetric, even though the spread of distribution of individual tasks are highly skewed (Leach, 2005).
Additionally, several methods have been developed and introduced to calculate buffer size and I try to review the principal ones.
First and fundamental method is 50% of the chain and it was introduced by Goldratt. In this method, buffer is computed as a half of the total sum of tasks duration in each path or chain.
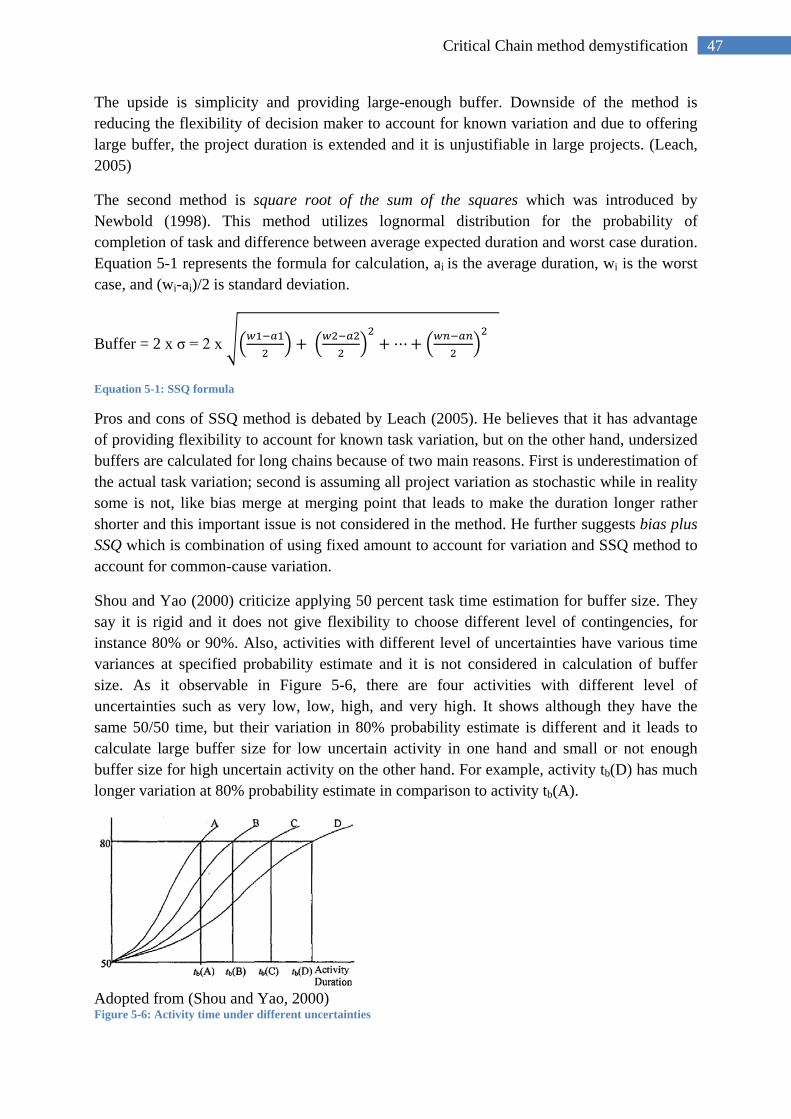
47 Critical Chain method demystification
The upside is simplicity and providing large-enough buffer. Downside of the method is reducing the flexibility of decision maker to account for known variation and due to offering large buffer, the project duration is extended and it is unjustifiable in large projects. (Leach, 2005)
The second method is square root of the sum of the squares which was introduced by Newbold (1998). This method utilizes lognormal distribution for the probability of completion of task and difference between average expected duration and worst case duration. Equation 5-1 represents the formula for calculation, ai is the average duration, wi is the worst case, and (wi-ai)/2 is standard deviation.
Buffer = 2 x σ = 2 x ��𝑤1−𝑎12
� + �𝑤2−𝑎22
�2
+ ⋯+ �𝑤𝑛−𝑎𝑛2
�2
Equation 5-1: SSQ formula
Pros and cons of SSQ method is debated by Leach (2005). He believes that it has advantage of providing flexibility to account for known task variation, but on the other hand, undersized buffers are calculated for long chains because of two main reasons. First is underestimation of the actual task variation; second is assuming all project variation as stochastic while in reality some is not, like bias merge at merging point that leads to make the duration longer rather shorter and this important issue is not considered in the method. He further suggests bias plus SSQ which is combination of using fixed amount to account for variation and SSQ method to account for common-cause variation.
Shou and Yao (2000) criticize applying 50 percent task time estimation for buffer size. They say it is rigid and it does not give flexibility to choose different level of contingencies, for instance 80% or 90%. Also, activities with different level of uncertainties have various time variances at specified probability estimate and it is not considered in calculation of buffer size. As it observable in Figure 5-6, there are four activities with different level of uncertainties such as very low, low, high, and very high. It shows although they have the same 50/50 time, but their variation in 80% probability estimate is different and it leads to calculate large buffer size for low uncertain activity in one hand and small or not enough buffer size for high uncertain activity on the other hand. For example, activity tb(D) has much longer variation at 80% probability estimate in comparison to activity tb(A).
Adopted from (Shou and Yao, 2000) Figure 5-6: Activity time under different uncertainties

48 Critical Chain method demystification
They further suggest to classify all activities based on level of uncertainty- it can be done through calculating relative dispersion(RD), RD = σ/te , σ is standard deviation and te is the average activity time- and they recommend Table 5-1 for different level of uncertainties and risk attitude management. For instance, for median safety (95%) and activities with very high level of uncertainty, 57% buffer size is most appropriate or for low safety and very low level of uncertainty, 4% buffer size seems suitable.
Table 5-1: Buffer size of different activities
Low safety (68%) Median safety (95%) High safety (99.7%) A(very low) 4 8 12
B( Low) 12 24 36 C(High) 20 40 60
D(very high) 28 57 85 Adopted form (Shou and Yao, 2000)
Another study was conducted by Tukel et al. (2006) for measuring smaller buffer size while sufficient protection is provided against delay. They introduce two methods based on incorporation of resource tightness and network complexity; they are called adaptive procedure with resource tightness (APRT) and adaptive procedure with density (APD). Results show APD method produces smaller buffer size while probability of delay is slightly larger; both of methods are good enough for low uncertain environment project like construction; on the other hand probability of completion at the appointed time for high uncertain environment project like new product development is as low as 60-70%. Planned completion time of cut and paste method (Goldratt method or 50% of chain) indicates 17-25% longer time in comparison to proposed methods; also, SSQ method (Newbold method) has completion time some amounts between Goldratt and proposed methods.
Another study for improving buffer size was carried out by Yang et al. (2008) through application of three attributes of project including the number of activities in chain, the uncertainty of activities duration and the flexibility of activities start time. Further, impact of mentioned three attributes was assessed in terms of two performance indicators comprising project duration and on time completion. The results represent that when number of activities are large, buffer size of cut and paste method (Goldratt method) is conservative and root square error (Newbolt method) is over optimistic and it is too small to ensure higher on time completion for medium number of activities. When there is low uncertain activities duration, the buffer size in RSE (Newbolt method) should be increased; also, buffer size should be increased appropriately when there is a project with low flexible start time. Ultimately, they proposes a revised buffer sizing method with taking into account the project attributes which remedy the deficiency of both methods- Goldratt and Newbold- through reducing project duration compared to C&P method as well as reaching high level of on time completion compared to RSE method.
Eventually, there are also other researches that address the buffer sizing, but whereas they tap the only mathematical side of buffer sizing and it is out of scope of this research, thus, I just mention them here for whom it might be interested. changing the shape parameter of
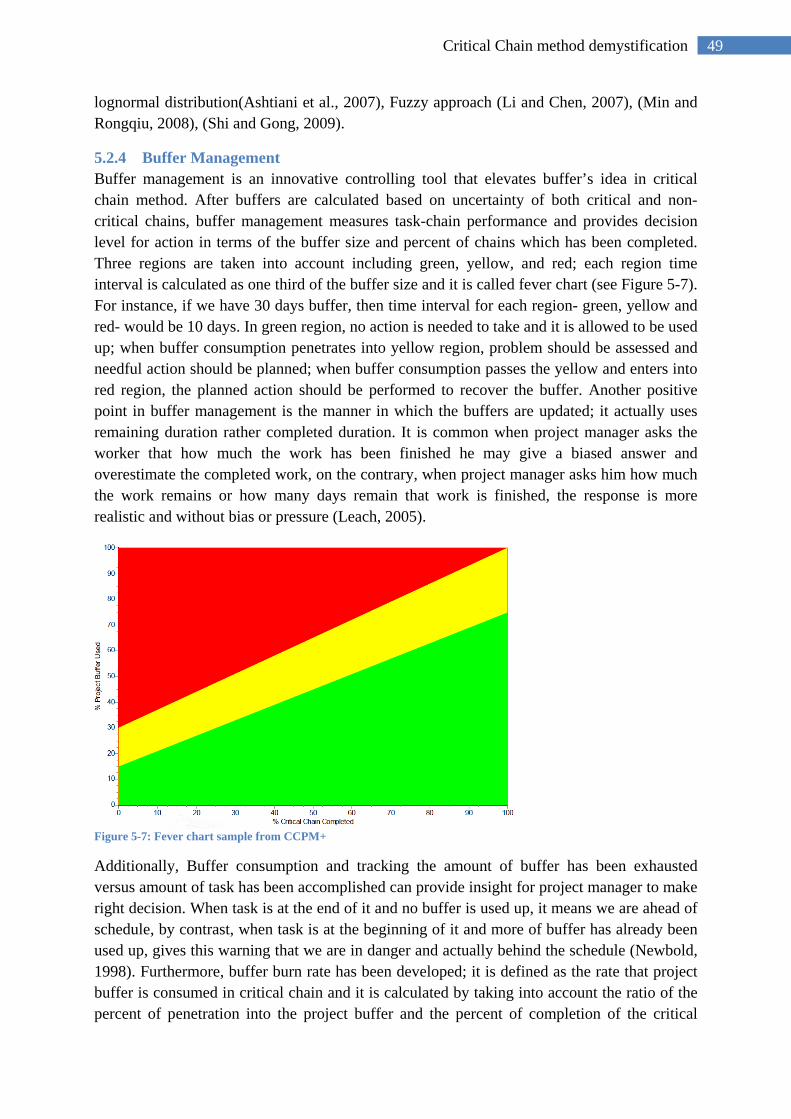
49 Critical Chain method demystification
lognormal distribution(Ashtiani et al., 2007), Fuzzy approach (Li and Chen, 2007), (Min and Rongqiu, 2008), (Shi and Gong, 2009).
5.2.4 Buffer Management Buffer management is an innovative controlling tool that elevates buffer’s idea in critical chain method. After buffers are calculated based on uncertainty of both critical and non-critical chains, buffer management measures task-chain performance and provides decision level for action in terms of the buffer size and percent of chains which has been completed. Three regions are taken into account including green, yellow, and red; each region time interval is calculated as one third of the buffer size and it is called fever chart (see Figure 5-7). For instance, if we have 30 days buffer, then time interval for each region- green, yellow and red- would be 10 days. In green region, no action is needed to take and it is allowed to be used up; when buffer consumption penetrates into yellow region, problem should be assessed and needful action should be planned; when buffer consumption passes the yellow and enters into red region, the planned action should be performed to recover the buffer. Another positive point in buffer management is the manner in which the buffers are updated; it actually uses remaining duration rather completed duration. It is common when project manager asks the worker that how much the work has been finished he may give a biased answer and overestimate the completed work, on the contrary, when project manager asks him how much the work remains or how many days remain that work is finished, the response is more realistic and without bias or pressure (Leach, 2005).
Figure 5-7: Fever chart sample from CCPM+
Additionally, Buffer consumption and tracking the amount of buffer has been exhausted versus amount of task has been accomplished can provide insight for project manager to make right decision. When task is at the end of it and no buffer is used up, it means we are ahead of schedule, by contrast, when task is at the beginning of it and more of buffer has already been used up, gives this warning that we are in danger and actually behind the schedule (Newbold, 1998). Furthermore, buffer burn rate has been developed; it is defined as the rate that project buffer is consumed in critical chain and it is calculated by taking into account the ratio of the percent of penetration into the project buffer and the percent of completion of the critical
50 Critical Chain method demystification
chain. For example, if the project buffer is 40% penetrated and critical chain is 20% completed, buffer burn rate is equal 2 which mean there is a problem in the project and if it continues in this fashion, project will encounter with delay. It is worth to be added that the buffer burn rate of 1 or less is perceived as good. (Cox and Schleier, 2010)
Monitoring the buffer consumption or buffer burn rate provides such opportunity that we can find the exact task that causes delay in that chain and consequently, we can take the proper action to solve the problem. This is an especial capability of buffer management that can provide new way of controlling the project. Newbold (1998) says without the buffers, there is frequently no good way to tell when a late task is a serious problem and consequently project manager is likely to under or overreact. In addition, it can be used to look ahead and predict effect of schedule disruption on overall project.
In order to compare the critical chain perspective and tradition perspective for project tracking and also showing the effectiveness of critical chain method to minimize and even eliminate rescheduling, Newbold (1998) illustrates the information flow in project in this way that schedule is created, then it is communicated; status is obtained from workers and evaluated; and problems are responded at the end. The difference in traditional perspective is recognized where problem is responded and cycle is started from the beginning, but in critical chain perspective because impact of delays can be assessed by tracking the buffers, thus as long as there is not serious circumstances, for instance all buffer has already been used up, no significant corrective action or rescheduling is needed. This is another positive side of critical chain method.
5.3 Up & downside of Critical Chain Method
There are two controversial issues that can be solved by critical chain principle. First if schedule is planned without padding in activity, it most probably encounters with problem and delay due to not measuring the uncertainty and risk; second, if padding is considered in activity estimation time, it results in long duration which is not desirable. Critical chain solves this problem by putting buffer; it plans for average completion time for tasks and let the buffers take care of the statistical fluctuation. Critical chain by placing buffer in schedule paths protects the schedule from disruption and cushions the impact of uncertainty and common-cause variation. There are three types of buffer including project buffer, feeding buffer, and resource buffer. Project buffer is easily placed at the end of project or goes after the last task; its initial responsibility is to protect the critical chain against fluctuation and its subordinate responsibility is to support non-critical chains, in case the feeding buffer on any feeding paths has been exhausted completely. Feeding buffer is placed in the schedule wherever a non-critical chain task joins the critical chain and it has two benefits; first, to protect the critical chain from interruption as result of delay in feeding tasks; second, give chance to critical chain to start early when everything goes well. Resource buffers are placed wherever a resource has a job on the critical chain and the previous critical chain task is done by a different resource and its responsibility is to make sure the needful resources for working on critical chain are available and ready in due time; Generally, resource buffer is perceived as wake-up call. (Newbold, 1998)
51 Critical Chain method demystification
Buffer management is a concept that can create the great possibility for project manager to take proper and on-time action when schedule is exposed to the danger of disruption and delay. Fever chart and buffer burn rate are tools that play key roles in buffer management concept to give early warning to project manager about real condition of project.
Besides buffer and buffer management, critical chain tries to eliminate bad behaviors that cause to extend the project duration such as:
• Remove deliberate padding by 50 percent task time estimation • Deal with student syndrome by planning the schedule as late as possible • Handle date-driven behavior by fostering relay race’ point of view; and • Eliminate bad multi-tasking and strengthen good multi-tasking instead.
Despite having many advantages, critical chain has some pitfalls which are mentioned in following:
First of all is to determine critical chain. Since critical chain takes into account both precedency and resource dependency to identify longest chain, multiple options may happens. In other words, various critical chains can be determined due to resource contention and applying heuristic methods which they do not provide steady result for the same situation; hence the way in which the resource contention is solved has significant impact to determine the critical chain. Newbold (1998) believes that term of determining should be used rather identifying, because it cannot be decided by an algorithm itself. Herroelen et al. (2002) also assess the possibility of the critical chain variety with some practical examples as well as output of different software with respect to resource leveling; they vividly show and discuss that various resource leveling results can end up with different critical chains. Thus, optimality of critical chain is largely dependent on optimality of resource-constraint schedule, to wit, optimality of resource leveling and result of heuristic methods.Newbold (1998) also suggests to take advantage of such flexibility to make the critical chain in the way that it is our favorite, for instance, change the place of high risk task from end of schedule to start, deploy tasks that are important to complete the project but they are not selected in the critical chain or we can change the critical chain toward the tasks that we have some control. Goldratt believes that it does not really matter which critical sequence is chosen and they are an objective fact (Herroelen and Leus, 2001) or elsewhere he says successful implementation is more important than coming up with a perfect plan (Tukel et al., 2006).
Another pitfall of critical chain is the size of buffer. It extensively has been discussed by many authors. First approach is back to founder of critical chain, Goldratt, by calculating 50% task time estimation and rest of them, remaining 50%, is aggregated and is put at the end of chain. Despite the simplicity of this approach and making high on-time completion time, but it is overestimated and it causes to make the project duration long. Other side of the coin, when shorter task estimation is calculated, as for Goldratt rule it should be cut in half and it causes to inadequate buffer size.
Next approach was introduced by Newbold and buffer size is calculated by applying the average time estimation and worst case time estimation. Two advantages of this method can
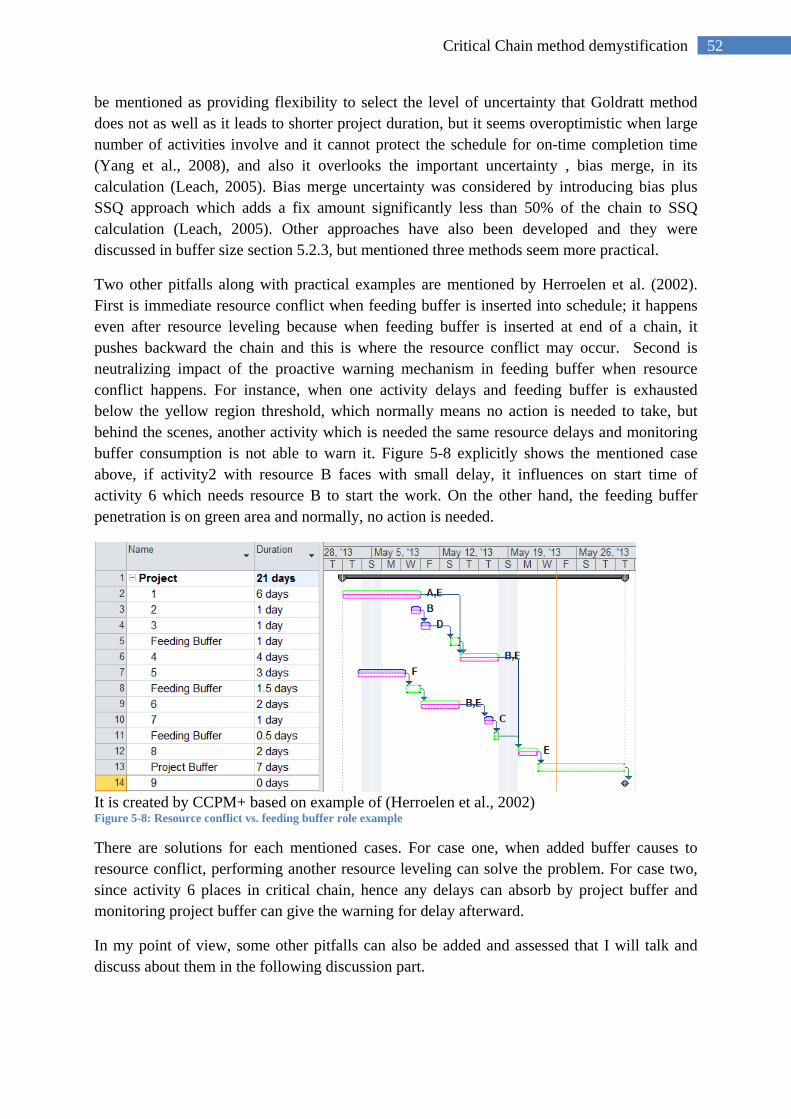
52 Critical Chain method demystification
be mentioned as providing flexibility to select the level of uncertainty that Goldratt method does not as well as it leads to shorter project duration, but it seems overoptimistic when large number of activities involve and it cannot protect the schedule for on-time completion time (Yang et al., 2008), and also it overlooks the important uncertainty , bias merge, in its calculation (Leach, 2005). Bias merge uncertainty was considered by introducing bias plus SSQ approach which adds a fix amount significantly less than 50% of the chain to SSQ calculation (Leach, 2005). Other approaches have also been developed and they were discussed in buffer size section 5.2.3, but mentioned three methods seem more practical.
Two other pitfalls along with practical examples are mentioned by Herroelen et al. (2002). First is immediate resource conflict when feeding buffer is inserted into schedule; it happens even after resource leveling because when feeding buffer is inserted at end of a chain, it pushes backward the chain and this is where the resource conflict may occur. Second is neutralizing impact of the proactive warning mechanism in feeding buffer when resource conflict happens. For instance, when one activity delays and feeding buffer is exhausted below the yellow region threshold, which normally means no action is needed to take, but behind the scenes, another activity which is needed the same resource delays and monitoring buffer consumption is not able to warn it. Figure 5-8 explicitly shows the mentioned case above, if activity2 with resource B faces with small delay, it influences on start time of activity 6 which needs resource B to start the work. On the other hand, the feeding buffer penetration is on green area and normally, no action is needed.
It is created by CCPM+ based on example of (Herroelen et al., 2002) Figure 5-8: Resource conflict vs. feeding buffer role example
There are solutions for each mentioned cases. For case one, when added buffer causes to resource conflict, performing another resource leveling can solve the problem. For case two, since activity 6 places in critical chain, hence any delays can absorb by project buffer and monitoring project buffer can give the warning for delay afterward.
In my point of view, some other pitfalls can also be added and assessed that I will talk and discuss about them in the following discussion part.
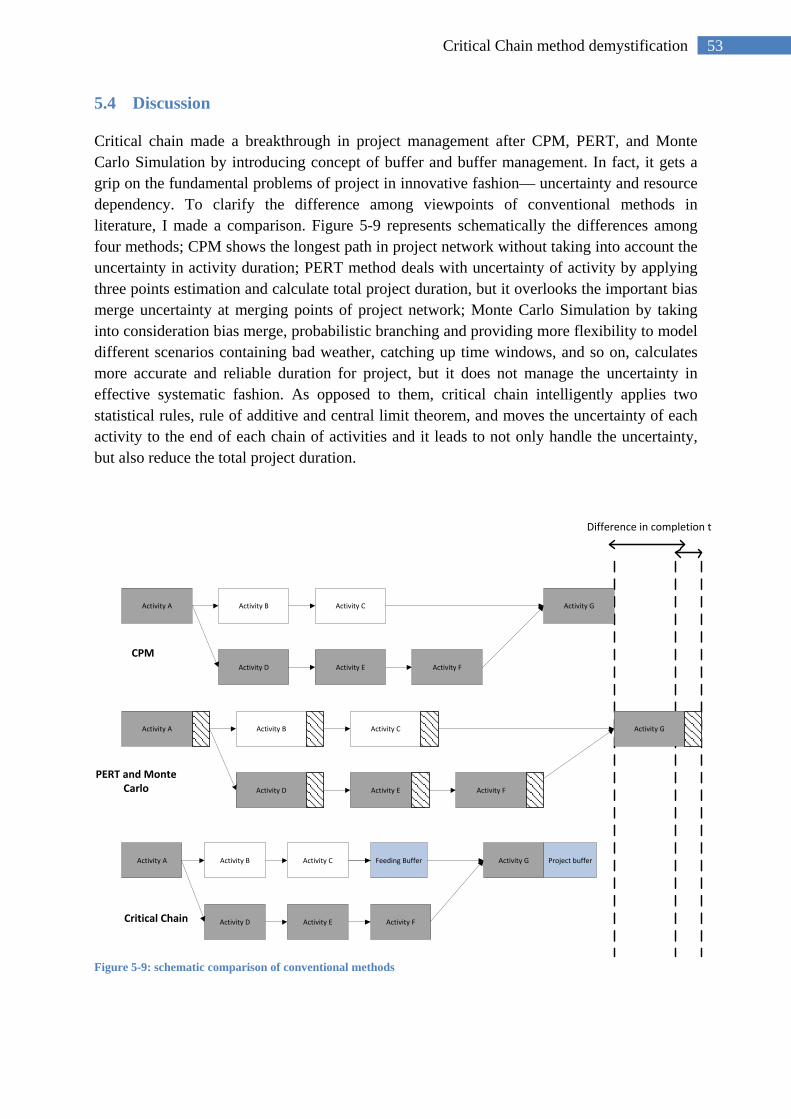
53 Critical Chain method demystification
5.4 Discussion
Critical chain made a breakthrough in project management after CPM, PERT, and Monte Carlo Simulation by introducing concept of buffer and buffer management. In fact, it gets a grip on the fundamental problems of project in innovative fashion— uncertainty and resource dependency. To clarify the difference among viewpoints of conventional methods in literature, I made a comparison. Figure 5-9 represents schematically the differences among four methods; CPM shows the longest path in project network without taking into account the uncertainty in activity duration; PERT method deals with uncertainty of activity by applying three points estimation and calculate total project duration, but it overlooks the important bias merge uncertainty at merging points of project network; Monte Carlo Simulation by taking into consideration bias merge, probabilistic branching and providing more flexibility to model different scenarios containing bad weather, catching up time windows, and so on, calculates more accurate and reliable duration for project, but it does not manage the uncertainty in effective systematic fashion. As opposed to them, critical chain intelligently applies two statistical rules, rule of additive and central limit theorem, and moves the uncertainty of each activity to the end of each chain of activities and it leads to not only handle the uncertainty, but also reduce the total project duration.
Figure 5-9: schematic comparison of conventional methods
Activity A Activity B Activity C
Activity D Activity E Activity F
Activity G
Activity A Activity B Activity C
Activity D Activity E Activity F
Activity G
Activity A Activity B Activity C
Activity D Activity E Activity F
Activity GFeeding Buffer Project buffer
Difference in completion time
CPM
PERT and Monte Carlo
Critical Chain
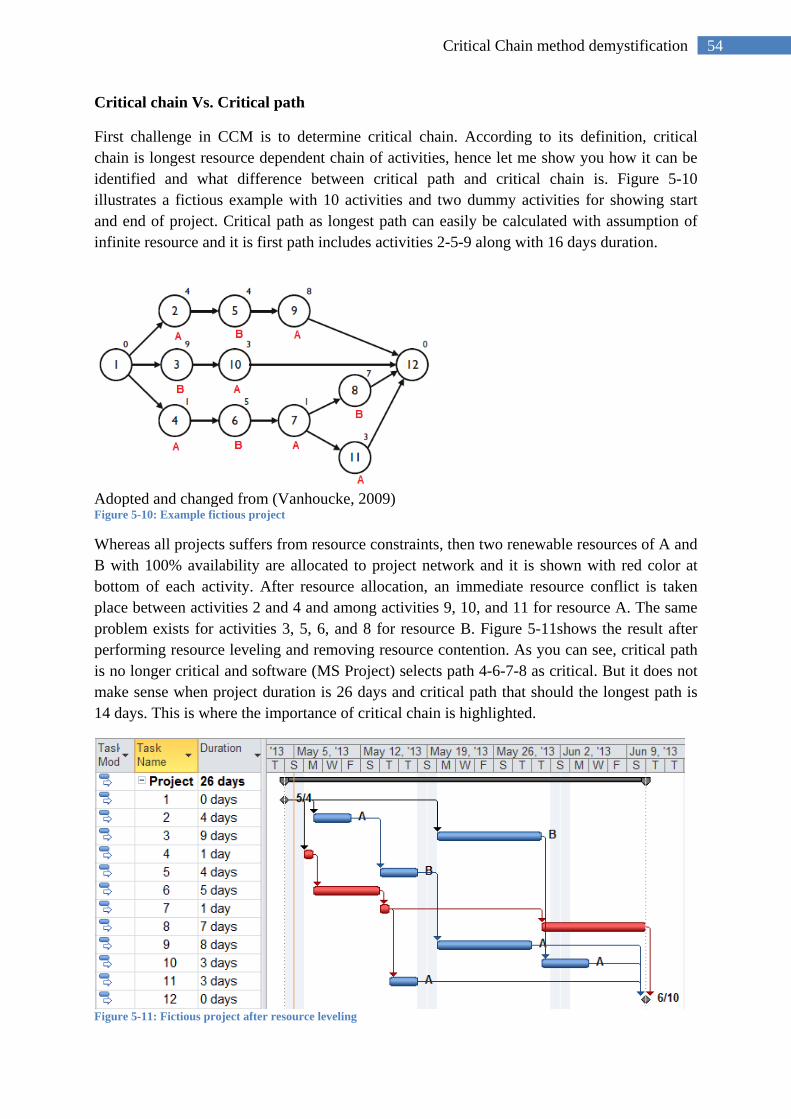
54 Critical Chain method demystification
Critical chain Vs. Critical path
First challenge in CCM is to determine critical chain. According to its definition, critical chain is longest resource dependent chain of activities, hence let me show you how it can be identified and what difference between critical path and critical chain is. Figure 5-10 illustrates a fictious example with 10 activities and two dummy activities for showing start and end of project. Critical path as longest path can easily be calculated with assumption of infinite resource and it is first path includes activities 2-5-9 along with 16 days duration.
Adopted and changed from (Vanhoucke, 2009) Figure 5-10: Example fictious project
Whereas all projects suffers from resource constraints, then two renewable resources of A and B with 100% availability are allocated to project network and it is shown with red color at bottom of each activity. After resource allocation, an immediate resource conflict is taken place between activities 2 and 4 and among activities 9, 10, and 11 for resource A. The same problem exists for activities 3, 5, 6, and 8 for resource B. Figure 5-11shows the result after performing resource leveling and removing resource contention. As you can see, critical path is no longer critical and software (MS Project) selects path 4-6-7-8 as critical. But it does not make sense when project duration is 26 days and critical path that should the longest path is 14 days. This is where the importance of critical chain is highlighted.
Figure 5-11: Fictious project after resource leveling
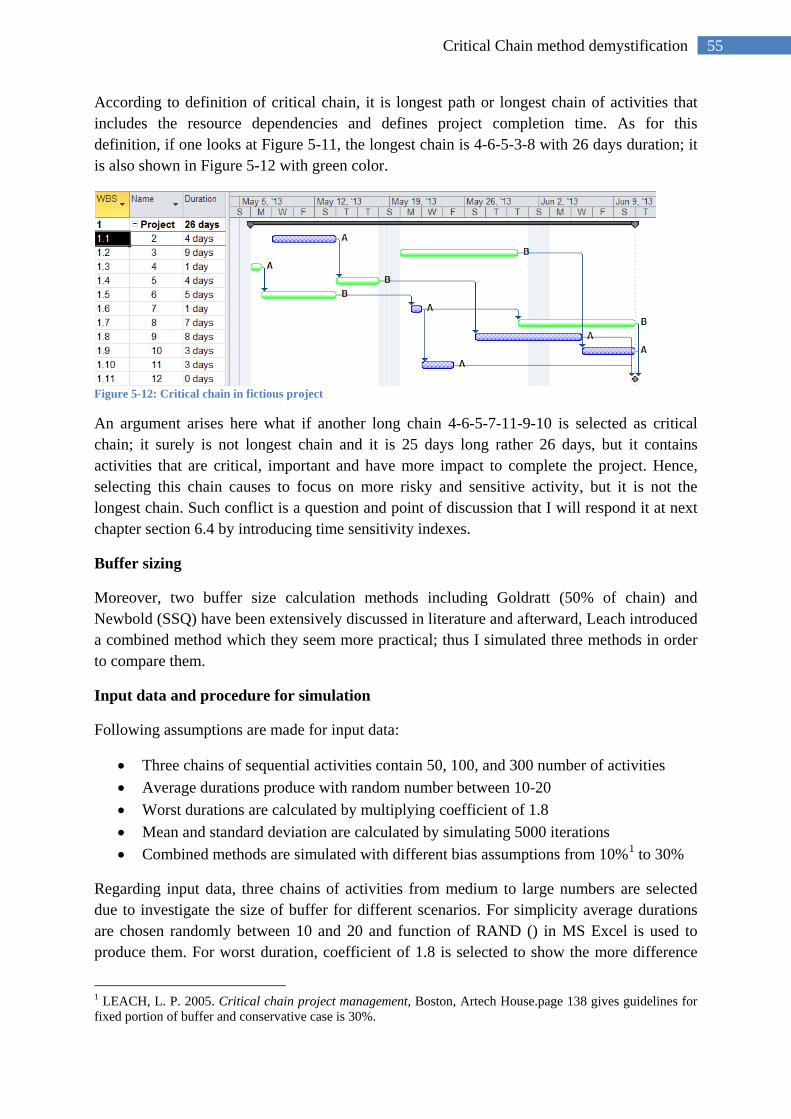
55 Critical Chain method demystification
According to definition of critical chain, it is longest path or longest chain of activities that includes the resource dependencies and defines project completion time. As for this definition, if one looks at Figure 5-11, the longest chain is 4-6-5-3-8 with 26 days duration; it is also shown in Figure 5-12 with green color.
Figure 5-12: Critical chain in fictious project
An argument arises here what if another long chain 4-6-5-7-11-9-10 is selected as critical chain; it surely is not longest chain and it is 25 days long rather 26 days, but it contains activities that are critical, important and have more impact to complete the project. Hence, selecting this chain causes to focus on more risky and sensitive activity, but it is not the longest chain. Such conflict is a question and point of discussion that I will respond it at next chapter section 6.4 by introducing time sensitivity indexes.
Buffer sizing
Moreover, two buffer size calculation methods including Goldratt (50% of chain) and Newbold (SSQ) have been extensively discussed in literature and afterward, Leach introduced a combined method which they seem more practical; thus I simulated three methods in order to compare them.
Input data and procedure for simulation
Following assumptions are made for input data:
• Three chains of sequential activities contain 50, 100, and 300 number of activities • Average durations produce with random number between 10-20 • Worst durations are calculated by multiplying coefficient of 1.8 • Mean and standard deviation are calculated by simulating 5000 iterations • Combined methods are simulated with different bias assumptions from 10%1 to 30%
Regarding input data, three chains of activities from medium to large numbers are selected due to investigate the size of buffer for different scenarios. For simplicity average durations are chosen randomly between 10 and 20 and function of RAND () in MS Excel is used to produce them. For worst duration, coefficient of 1.8 is selected to show the more difference
1 LEACH, L. P. 2005. Critical chain project management, Boston, Artech House.page 138 gives guidelines for fixed portion of buffer and conservative case is 30%.
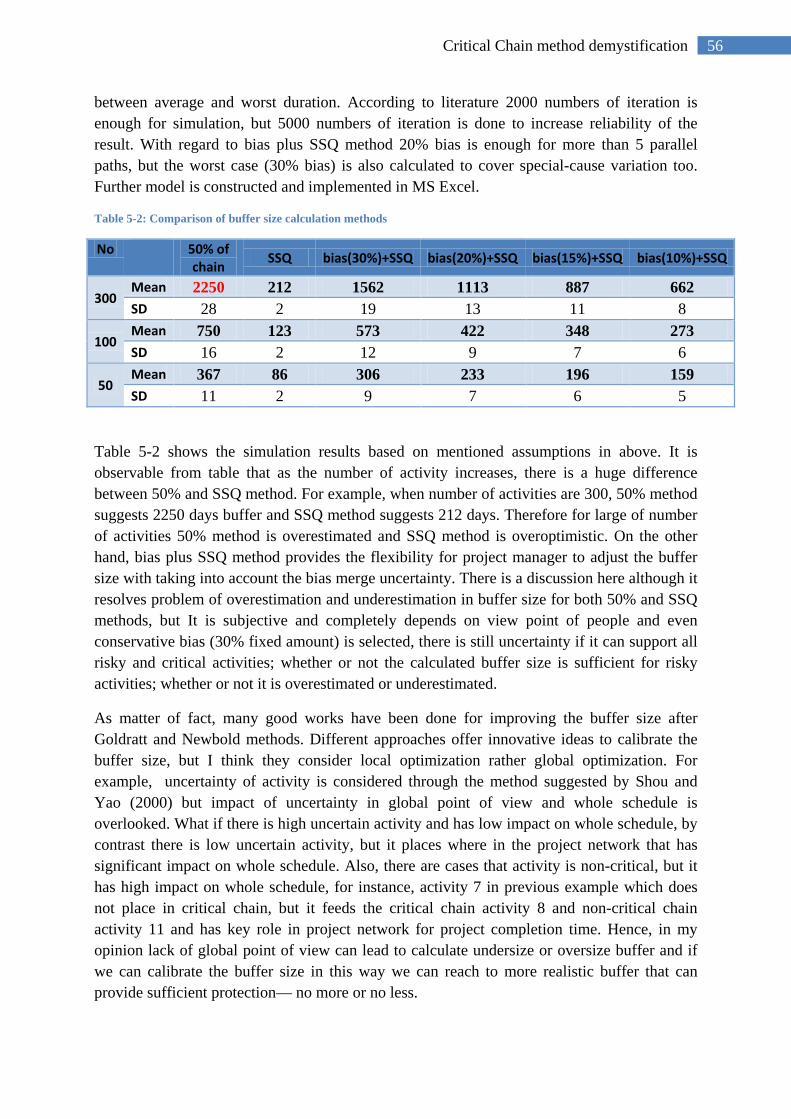
56 Critical Chain method demystification
between average and worst duration. According to literature 2000 numbers of iteration is enough for simulation, but 5000 numbers of iteration is done to increase reliability of the result. With regard to bias plus SSQ method 20% bias is enough for more than 5 parallel paths, but the worst case (30% bias) is also calculated to cover special-cause variation too. Further model is constructed and implemented in MS Excel.
Table 5-2: Comparison of buffer size calculation methods
No 50% of chain SSQ bias(30%)+SSQ bias(20%)+SSQ bias(15%)+SSQ bias(10%)+SSQ
300 Mean 2250 212 1562 1113 887 662 SD 28 2 19 13 11 8
100 Mean 750 123 573 422 348 273 SD 16 2 12 9 7 6
50 Mean 367 86 306 233 196 159 SD 11 2 9 7 6 5
Table 5-2 shows the simulation results based on mentioned assumptions in above. It is observable from table that as the number of activity increases, there is a huge difference between 50% and SSQ method. For example, when number of activities are 300, 50% method suggests 2250 days buffer and SSQ method suggests 212 days. Therefore for large of number of activities 50% method is overestimated and SSQ method is overoptimistic. On the other hand, bias plus SSQ method provides the flexibility for project manager to adjust the buffer size with taking into account the bias merge uncertainty. There is a discussion here although it resolves problem of overestimation and underestimation in buffer size for both 50% and SSQ methods, but It is subjective and completely depends on view point of people and even conservative bias (30% fixed amount) is selected, there is still uncertainty if it can support all risky and critical activities; whether or not the calculated buffer size is sufficient for risky activities; whether or not it is overestimated or underestimated.
As matter of fact, many good works have been done for improving the buffer size after Goldratt and Newbold methods. Different approaches offer innovative ideas to calibrate the buffer size, but I think they consider local optimization rather global optimization. For example, uncertainty of activity is considered through the method suggested by Shou and Yao (2000) but impact of uncertainty in global point of view and whole schedule is overlooked. What if there is high uncertain activity and has low impact on whole schedule, by contrast there is low uncertain activity, but it places where in the project network that has significant impact on whole schedule. Also, there are cases that activity is non-critical, but it has high impact on whole schedule, for instance, activity 7 in previous example which does not place in critical chain, but it feeds the critical chain activity 8 and non-critical chain activity 11 and has key role in project network for project completion time. Hence, in my opinion lack of global point of view can lead to calculate undersize or oversize buffer and if we can calibrate the buffer size in this way we can reach to more realistic buffer that can provide sufficient protection— no more or no less.
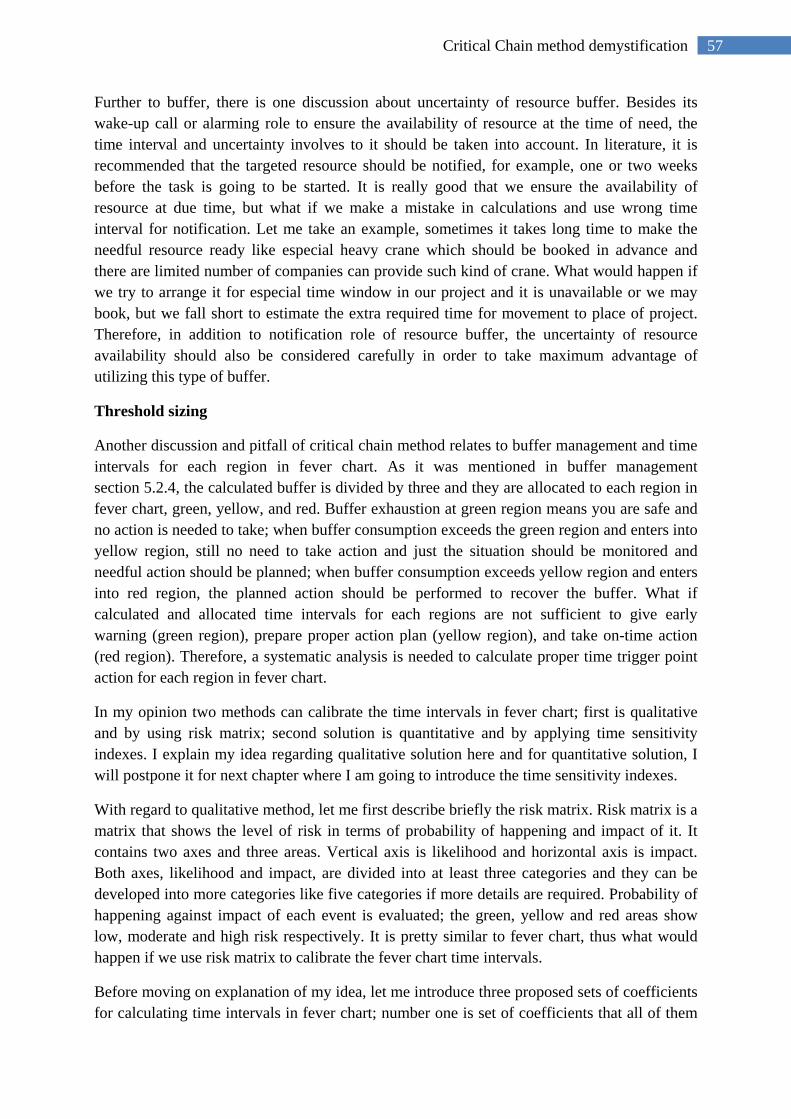
57 Critical Chain method demystification
Further to buffer, there is one discussion about uncertainty of resource buffer. Besides its wake-up call or alarming role to ensure the availability of resource at the time of need, the time interval and uncertainty involves to it should be taken into account. In literature, it is recommended that the targeted resource should be notified, for example, one or two weeks before the task is going to be started. It is really good that we ensure the availability of resource at due time, but what if we make a mistake in calculations and use wrong time interval for notification. Let me take an example, sometimes it takes long time to make the needful resource ready like especial heavy crane which should be booked in advance and there are limited number of companies can provide such kind of crane. What would happen if we try to arrange it for especial time window in our project and it is unavailable or we may book, but we fall short to estimate the extra required time for movement to place of project. Therefore, in addition to notification role of resource buffer, the uncertainty of resource availability should also be considered carefully in order to take maximum advantage of utilizing this type of buffer.
Threshold sizing
Another discussion and pitfall of critical chain method relates to buffer management and time intervals for each region in fever chart. As it was mentioned in buffer management section 5.2.4, the calculated buffer is divided by three and they are allocated to each region in fever chart, green, yellow, and red. Buffer exhaustion at green region means you are safe and no action is needed to take; when buffer consumption exceeds the green region and enters into yellow region, still no need to take action and just the situation should be monitored and needful action should be planned; when buffer consumption exceeds yellow region and enters into red region, the planned action should be performed to recover the buffer. What if calculated and allocated time intervals for each regions are not sufficient to give early warning (green region), prepare proper action plan (yellow region), and take on-time action (red region). Therefore, a systematic analysis is needed to calculate proper time trigger point action for each region in fever chart.
In my opinion two methods can calibrate the time intervals in fever chart; first is qualitative and by using risk matrix; second solution is quantitative and by applying time sensitivity indexes. I explain my idea regarding qualitative solution here and for quantitative solution, I will postpone it for next chapter where I am going to introduce the time sensitivity indexes.
With regard to qualitative method, let me first describe briefly the risk matrix. Risk matrix is a matrix that shows the level of risk in terms of probability of happening and impact of it. It contains two axes and three areas. Vertical axis is likelihood and horizontal axis is impact. Both axes, likelihood and impact, are divided into at least three categories and they can be developed into more categories like five categories if more details are required. Probability of happening against impact of each event is evaluated; the green, yellow and red areas show low, moderate and high risk respectively. It is pretty similar to fever chart, thus what would happen if we use risk matrix to calibrate the fever chart time intervals.
Before moving on explanation of my idea, let me introduce three proposed sets of coefficients for calculating time intervals in fever chart; number one is set of coefficients that all of them
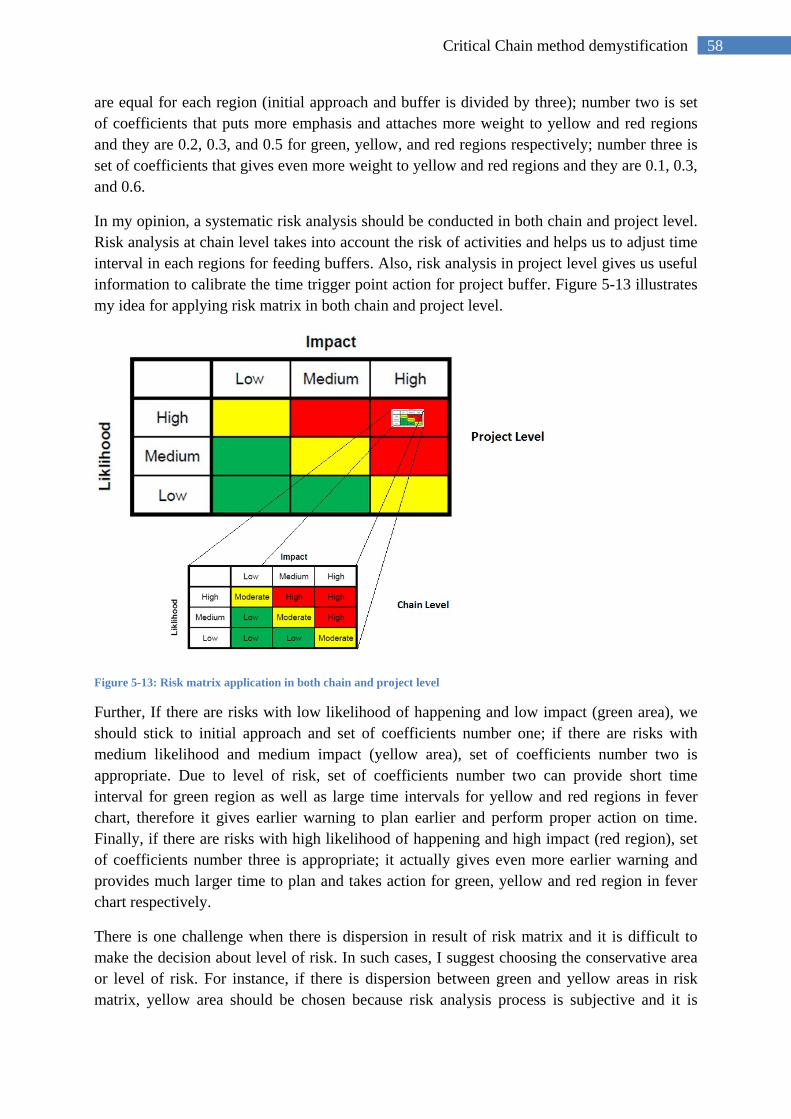
58 Critical Chain method demystification
are equal for each region (initial approach and buffer is divided by three); number two is set of coefficients that puts more emphasis and attaches more weight to yellow and red regions and they are 0.2, 0.3, and 0.5 for green, yellow, and red regions respectively; number three is set of coefficients that gives even more weight to yellow and red regions and they are 0.1, 0.3, and 0.6.
In my opinion, a systematic risk analysis should be conducted in both chain and project level. Risk analysis at chain level takes into account the risk of activities and helps us to adjust time interval in each regions for feeding buffers. Also, risk analysis in project level gives us useful information to calibrate the time trigger point action for project buffer. Figure 5-13 illustrates my idea for applying risk matrix in both chain and project level.
Figure 5-13: Risk matrix application in both chain and project level
Further, If there are risks with low likelihood of happening and low impact (green area), we should stick to initial approach and set of coefficients number one; if there are risks with medium likelihood and medium impact (yellow area), set of coefficients number two is appropriate. Due to level of risk, set of coefficients number two can provide short time interval for green region as well as large time intervals for yellow and red regions in fever chart, therefore it gives earlier warning to plan earlier and perform proper action on time. Finally, if there are risks with high likelihood of happening and high impact (red region), set of coefficients number three is appropriate; it actually gives even more earlier warning and provides much larger time to plan and takes action for green, yellow and red region in fever chart respectively.
There is one challenge when there is dispersion in result of risk matrix and it is difficult to make the decision about level of risk. In such cases, I suggest choosing the conservative area or level of risk. For instance, if there is dispersion between green and yellow areas in risk matrix, yellow area should be chosen because risk analysis process is subjective and it is
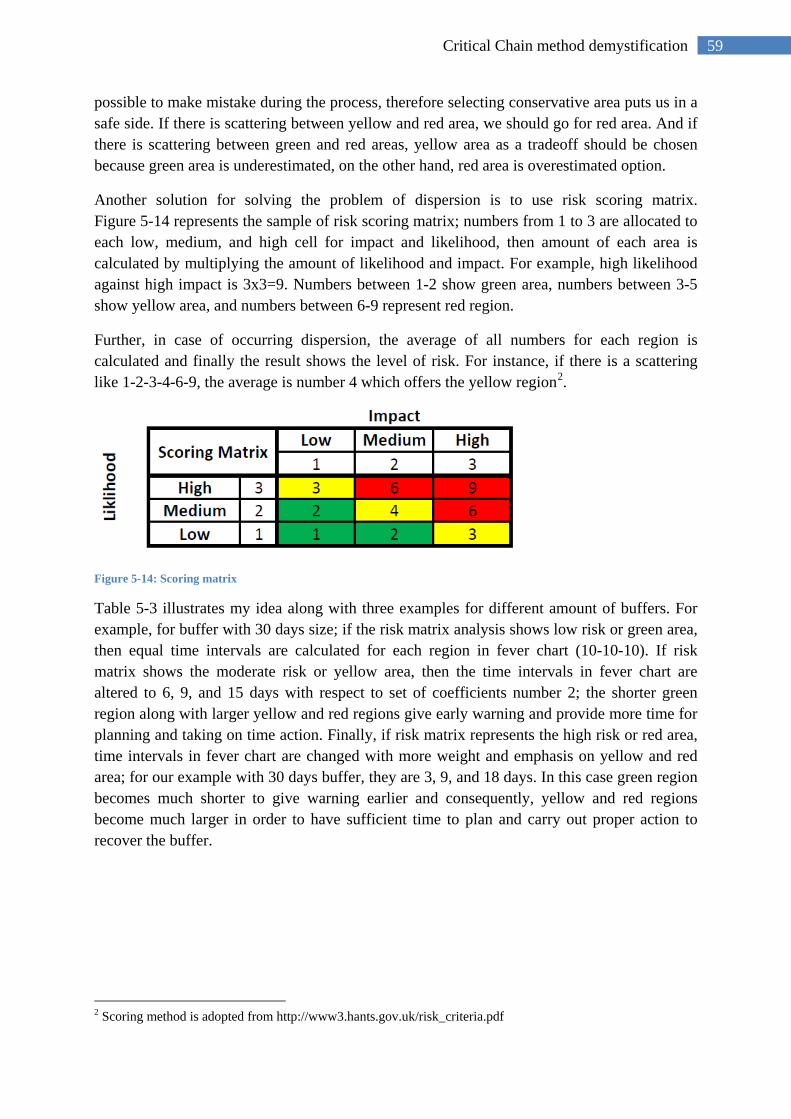
59 Critical Chain method demystification
possible to make mistake during the process, therefore selecting conservative area puts us in a safe side. If there is scattering between yellow and red area, we should go for red area. And if there is scattering between green and red areas, yellow area as a tradeoff should be chosen because green area is underestimated, on the other hand, red area is overestimated option.
Another solution for solving the problem of dispersion is to use risk scoring matrix. Figure 5-14 represents the sample of risk scoring matrix; numbers from 1 to 3 are allocated to each low, medium, and high cell for impact and likelihood, then amount of each area is calculated by multiplying the amount of likelihood and impact. For example, high likelihood against high impact is 3x3=9. Numbers between 1-2 show green area, numbers between 3-5 show yellow area, and numbers between 6-9 represent red region.
Further, in case of occurring dispersion, the average of all numbers for each region is calculated and finally the result shows the level of risk. For instance, if there is a scattering like 1-2-3-4-6-9, the average is number 4 which offers the yellow region2.
Figure 5-14: Scoring matrix
Table 5-3 illustrates my idea along with three examples for different amount of buffers. For example, for buffer with 30 days size; if the risk matrix analysis shows low risk or green area, then equal time intervals are calculated for each region in fever chart (10-10-10). If risk matrix shows the moderate risk or yellow area, then the time intervals in fever chart are altered to 6, 9, and 15 days with respect to set of coefficients number 2; the shorter green region along with larger yellow and red regions give early warning and provide more time for planning and taking on time action. Finally, if risk matrix represents the high risk or red area, time intervals in fever chart are changed with more weight and emphasis on yellow and red area; for our example with 30 days buffer, they are 3, 9, and 18 days. In this case green region becomes much shorter to give warning earlier and consequently, yellow and red regions become much larger in order to have sufficient time to plan and carry out proper action to recover the buffer.
2 Scoring method is adopted from http://www3.hants.gov.uk/risk_criteria.pdf
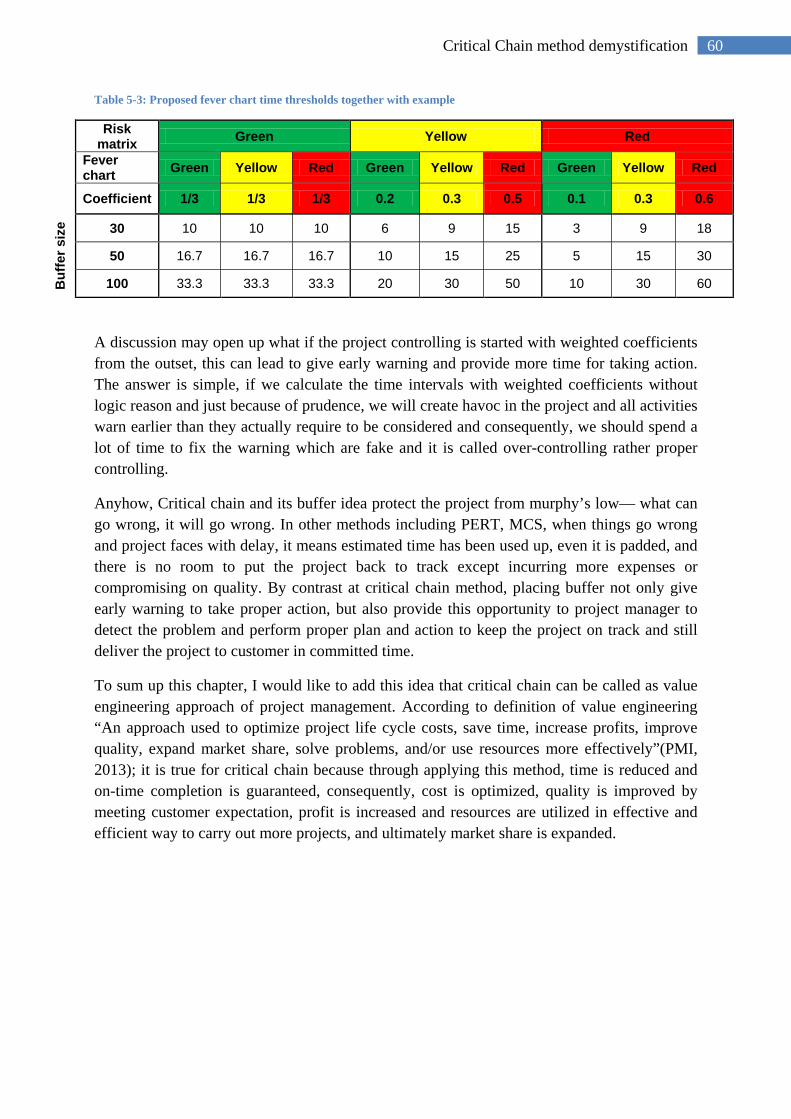
60 Critical Chain method demystification
Table 5-3: Proposed fever chart time thresholds together with example
Risk matrix Green Yellow Red
Fever chart Green Yellow Red Green Yellow Red Green Yellow Red
Coefficient 1/3 1/3 1/3 0.2 0.3 0.5 0.1 0.3 0.6
Buf
fer s
ize 30 10 10 10 6 9 15 3 9 18
50 16.7 16.7 16.7 10 15 25 5 15 30
100 33.3 33.3 33.3 20 30 50 10 30 60
A discussion may open up what if the project controlling is started with weighted coefficients from the outset, this can lead to give early warning and provide more time for taking action. The answer is simple, if we calculate the time intervals with weighted coefficients without logic reason and just because of prudence, we will create havoc in the project and all activities warn earlier than they actually require to be considered and consequently, we should spend a lot of time to fix the warning which are fake and it is called over-controlling rather proper controlling.
Anyhow, Critical chain and its buffer idea protect the project from murphy’s low— what can go wrong, it will go wrong. In other methods including PERT, MCS, when things go wrong and project faces with delay, it means estimated time has been used up, even it is padded, and there is no room to put the project back to track except incurring more expenses or compromising on quality. By contrast at critical chain method, placing buffer not only give early warning to take proper action, but also provide this opportunity to project manager to detect the problem and perform proper plan and action to keep the project on track and still deliver the project to customer in committed time.
To sum up this chapter, I would like to add this idea that critical chain can be called as value engineering approach of project management. According to definition of value engineering “An approach used to optimize project life cycle costs, save time, increase profits, improve quality, expand market share, solve problems, and/or use resources more effectively”(PMI, 2013); it is true for critical chain because through applying this method, time is reduced and on-time completion is guaranteed, consequently, cost is optimized, quality is improved by meeting customer expectation, profit is increased and resources are utilized in effective and efficient way to carry out more projects, and ultimately market share is expanded.
61 Make improvement in Fast Tracking & Critical Chain methods
Make improvement in Fast Tracking & Critical Chain methods
Chapter6
62 Make improvement in Fast Tracking & Critical Chain methods
6 Make improvement in Fast Tracking & Critical Chain methods
In this chapter, time sensitivity indexes are introduced and some suggestions are offered to make improvement in fast tracking and critical chain methods through application of time sensitivity indexes. Fast tracking method suffers from additional risk of overlapping and time sensitivity indexes can help to select the low risky pair of activities in order to mitigate the overall risk at the beginning. Further, critical chain against sensitive chain is discussed and a heuristic method is suggested to calibrate buffer size with consideration to risky activities. Finally, a quantitative solution is proposed to adjust time trigger points in fever chart.
6.1 Introduction
Activity-based sensitivity analysis focuses on those activities that influence the performance of the project and through providing understanding from sensitivity of all activities in project network leads to better management’s focus and more accurate response during project tracking. Several researches have been conducted and varied advantages, disadvantages, shortcomings, and counterintuitive have been addressed in literature and just partial answers have been reported. (Vanhoucke, 2009)
Besides the critical path, longest path in project network with zero float, there is another term as critical activity which implies to the activity lies on critical path and influences on making shorter or longer the critical path. Elmaghraby (2000) indicates to stochastic structure of PERT and this issue that any path might be critical with nonzero probability; he recommends analyzing criticality of activity rather criticality of path because of main interest in determining bothersome activities. Probability of a path is the longest path refers to path criticality index (PCI) and probability that an activity lies on a critical path denotes activity criticality index (ACI).
After introducing and computing critical index by applying Monte Carlo Simulation, the seminal work was done by Williams (1992) through criticizing shortcomings of criticality index and introducing two indexes as significance and cruciality. Afterward, whereas the cruciality is evaluating linear correlation between activity and total project duration, which is not always true, then nonlinear correlation measures including spearman rank correlation coefficient and Kendall’s tau were calculated by Cho and Yum (1997). Later, advanced calculations were done for effect of variability of activity duration on variability of duration of project with taxonomy of mean-mean, mean-variance, variance-mean, and variance-variance. (Elmaghraby, 2000)
6.2 Activity-based sensitivity indexes
Four basic indexes are applied to analyze the sensitivity of activity; they are criticality index (CI), Significance index (SI), cruciality index (CRI), and schedule sensitivity index (SSI).
63 Make improvement in Fast Tracking & Critical Chain methods
Criticality index (CI): It measures the probability that an activity lies on the critical path and it is done by Monte Carlo Simulation (Vanhoucke, 2009). Williams (1992) indicates to two flaws of critical index; first is considering only the probability aspect of activity while risk of activity is assessed based on combination of impact and likelihood. Vanhoucke (2009) says high CI does not necessarily mean that it has high impact on the critical path; he gives an example of the very low duration activity which lies on critical path. Elmaghraby (2000) states probabilistic measure of activity by critical index is far from management point of view and there are many cases that it runs counter to management’s expectation, therefore they do not pay attention to an activity on such a way. Second flaw is no possibility of calculation when there is resource constraint.
Significance Index (SI): It shows the significance of individual activities on the total project duration (Vanhoucke, 2009)and reflects the relative importance between the activities at least to a greater degree than the standard criticality(Williams, 1992). There is also a counterintuitive result that is mentioned by Elmaghraby (2000); he provides an example of two serial activities that have equal SI amount, but one of them is indeed more important than other with respect to large duration.
Cruciality Index (CRI): It represents the correlation between activity duration and total duration. Two main advantages are perceived; first, unlike previous indexes, it works when there is resource constraint; second, it can be applied to other uncertain aspects of project like stochastic branches rather activity duration (Williams, 1992). Three major drawbacks are mentioned by Elmaghraby (2000); first is measuring the linear correlation between the activity duration and total project duration which does not always happen. There are some cases when activity duration changes, the project duration shows non-linear behavior. Second is demanding computation of correlation between activity and project duration. Third is counterintuitive result due to taking into account the impact of uncertainty of an activity on the project duration. When there is a deterministic activity or stochastic activity with very small variance, the cruciality index is zero or close to zero while it is always on the critical path. Further to resolve the non-linearity behavior of cruciality index, Cho and Yum (1997) introduce two measures for nonlinear correlation. First is spearman’s rank correlation which converts the value of variable to rank and calculates the difference between the ranks of each observation on two variables. Second is Kendall’s tau rank correlation which measures the degree of correspondence between two rankings(Vanhoucke, 2009). Additionally, they propose uncertainty importance measure of activities (UIMA) to identify those activities that exert impact on reducing the magnitude of the uncertainty in total duration. Because there are cases the expected value of total duration is adequate, but uncertainty of it is so large due to the uncertainty of activity duration. UIMA also takes into account the interaction between two activities and impact of such interaction on total duration.
Many advanced calculations were done on sensitivity of variability in mean and variance of activity and their influence on mean and variance of project duration. They can be categorized as mean-mean, mean-variance, variance-mean, and variance-variance. Talking about mathematical computations and counterintuitive result of them are out of scope of this research, I just try to mention some interesting finding from project management and project
64 Make improvement in Fast Tracking & Critical Chain methods
scheduling point of view. Mean-mean result, change in mean duration of an activity and impact of it on mean duration of the project, shows “an increase (decrease) in the mean duration of an activity shall always lead to a non-decreasing (non-increasing) mean duration of the project completion time” (Elmaghraby, 2000). “The greater the variability in the project activities, the more the expected critical path length underestimates the actual expected project durations”. “ Increasing the mean duration of an activity may result in an increase or decrease in variance of the project duration”(Elmaghraby et al., 1999). Moreover, Elmaghraby (2000) shows in an example with large network that through reducing or increasing the mean duration of activity, increase or decrease may achieve in the variance of the project. Two outcomes are very interesting and should be paid more attention; one of them is increasing the mean duration can lead to reduce the variance of the project, on the other hand, reducing the mean duration can lead to increase the variance of the project.
Schedule sensitivity index (SSI): It applies activity and project duration standard deviation together with criticality index. It is calculated through multiplying activity duration standard deviation by criticality index, and then result is divided by project duration standard deviation. (Vanhoucke, 2009)
At the end, Elmaghraby (2000) conjectures that combination of three initial indexes and considering them in some fashion may result in meaningful indicator of the activity sensitivity. Also Vanhoucke (2009) uses them plus SSI during project tracking to improve the overall schedule performance by taking corrective actions.
6.3 Enhancement approach to Fast tracking method
Fast tracking is PMI approved technique for schedule compression. Main idea behind of fast tracking is performing sequential pair of activities or project phases concurrently, but it suffers from additional risk and possibility of rework due to early decision making based on limited or incomplete information.
A lot of valuable researches have been done in discovering best strategy to perform overlapping with minimum risk and iteration as well as optimum degree of overlapping. The seminal work was started with introduction of two characteristics for upstream and downstream tasks including evolution and sensitivity. The work was developed by adding production rate and task divisibility and consequently, a detailed framework for various possible cases along with proposed degree of overlapping was created. Next breakthrough in fast tracking strategy was related to introduce key determinants of evolution and sensitivity which gave rise to apply various strategies to make the slow evolving upstream task faster as well as make the high sensitivity of downstream task low sensitive to changes from upstream task. There is a challenge here how project manager can understand the additional risk of overlapping for selected pair of activities and afterward prepare a mitigation plan or pay more attention on risky activities. This is where the importance of sensitivity indexes are highlighted; they actually can support project manager through providing insight with regards to level of risk of each activity and giving more opportunity in execution phase to monitor and pay more attention on them.
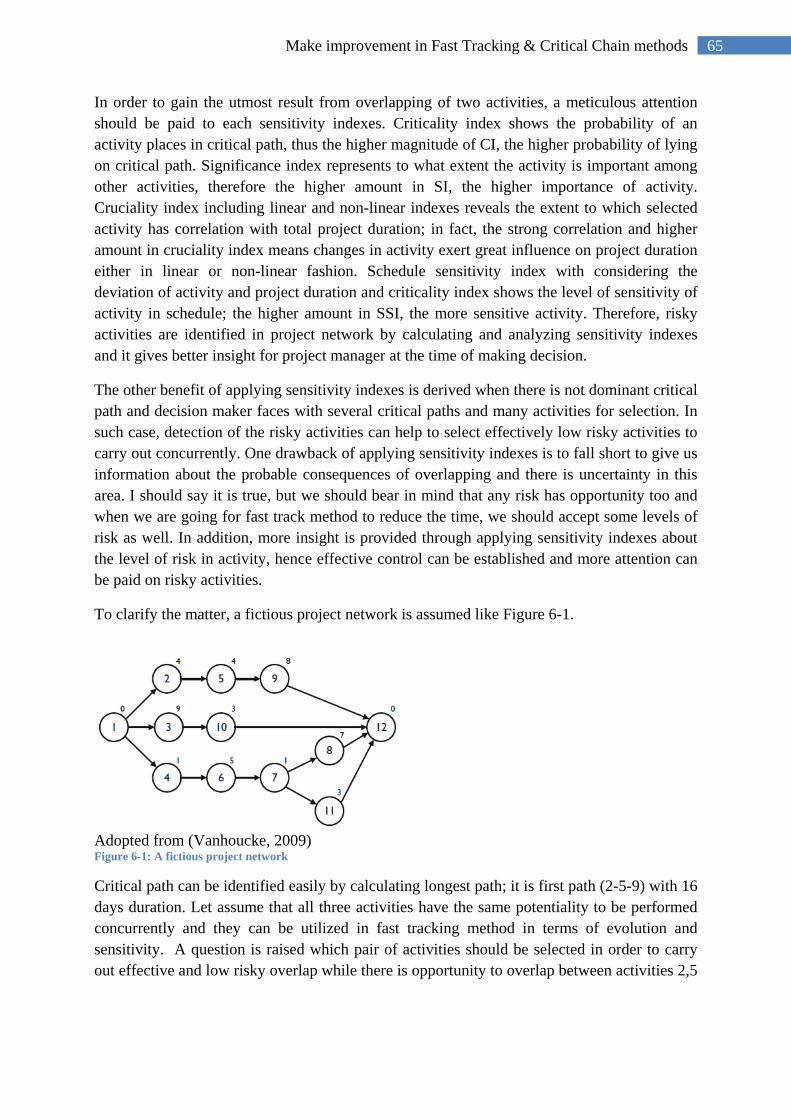
65 Make improvement in Fast Tracking & Critical Chain methods
In order to gain the utmost result from overlapping of two activities, a meticulous attention should be paid to each sensitivity indexes. Criticality index shows the probability of an activity places in critical path, thus the higher magnitude of CI, the higher probability of lying on critical path. Significance index represents to what extent the activity is important among other activities, therefore the higher amount in SI, the higher importance of activity. Cruciality index including linear and non-linear indexes reveals the extent to which selected activity has correlation with total project duration; in fact, the strong correlation and higher amount in cruciality index means changes in activity exert great influence on project duration either in linear or non-linear fashion. Schedule sensitivity index with considering the deviation of activity and project duration and criticality index shows the level of sensitivity of activity in schedule; the higher amount in SSI, the more sensitive activity. Therefore, risky activities are identified in project network by calculating and analyzing sensitivity indexes and it gives better insight for project manager at the time of making decision.
The other benefit of applying sensitivity indexes is derived when there is not dominant critical path and decision maker faces with several critical paths and many activities for selection. In such case, detection of the risky activities can help to select effectively low risky activities to carry out concurrently. One drawback of applying sensitivity indexes is to fall short to give us information about the probable consequences of overlapping and there is uncertainty in this area. I should say it is true, but we should bear in mind that any risk has opportunity too and when we are going for fast track method to reduce the time, we should accept some levels of risk as well. In addition, more insight is provided through applying sensitivity indexes about the level of risk in activity, hence effective control can be established and more attention can be paid on risky activities.
To clarify the matter, a fictious project network is assumed like Figure 6-1.
Adopted from (Vanhoucke, 2009) Figure 6-1: A fictious project network
Critical path can be identified easily by calculating longest path; it is first path (2-5-9) with 16 days duration. Let assume that all three activities have the same potentiality to be performed concurrently and they can be utilized in fast tracking method in terms of evolution and sensitivity. A question is raised which pair of activities should be selected in order to carry out effective and low risky overlap while there is opportunity to overlap between activities 2,5
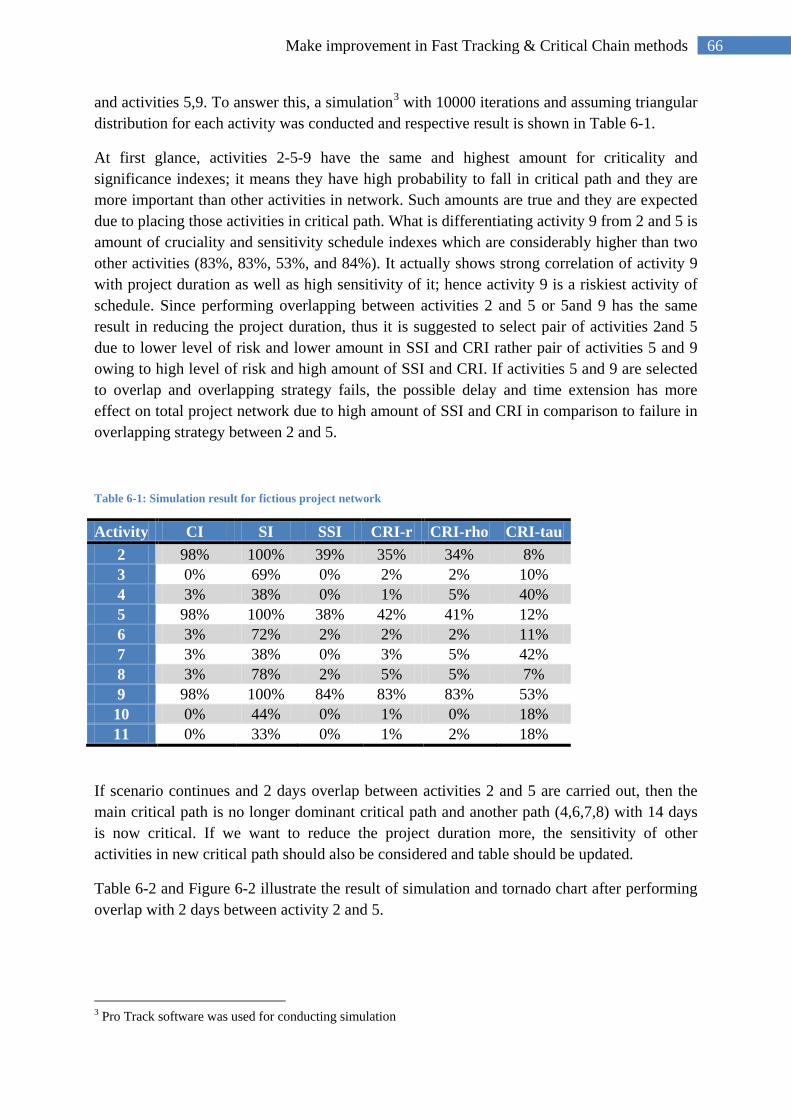
66 Make improvement in Fast Tracking & Critical Chain methods
and activities 5,9. To answer this, a simulation3 with 10000 iterations and assuming triangular distribution for each activity was conducted and respective result is shown in Table 6-1.
At first glance, activities 2-5-9 have the same and highest amount for criticality and significance indexes; it means they have high probability to fall in critical path and they are more important than other activities in network. Such amounts are true and they are expected due to placing those activities in critical path. What is differentiating activity 9 from 2 and 5 is amount of cruciality and sensitivity schedule indexes which are considerably higher than two other activities (83%, 83%, 53%, and 84%). It actually shows strong correlation of activity 9 with project duration as well as high sensitivity of it; hence activity 9 is a riskiest activity of schedule. Since performing overlapping between activities 2 and 5 or 5and 9 has the same result in reducing the project duration, thus it is suggested to select pair of activities 2and 5 due to lower level of risk and lower amount in SSI and CRI rather pair of activities 5 and 9 owing to high level of risk and high amount of SSI and CRI. If activities 5 and 9 are selected to overlap and overlapping strategy fails, the possible delay and time extension has more effect on total project network due to high amount of SSI and CRI in comparison to failure in overlapping strategy between 2 and 5.
Table 6-1: Simulation result for fictious project network
Activity CI SI SSI CRI-r CRI-rho CRI-tau 2 98% 100% 39% 35% 34% 8% 3 0% 69% 0% 2% 2% 10% 4 3% 38% 0% 1% 5% 40% 5 98% 100% 38% 42% 41% 12% 6 3% 72% 2% 2% 2% 11% 7 3% 38% 0% 3% 5% 42% 8 3% 78% 2% 5% 5% 7% 9 98% 100% 84% 83% 83% 53% 10 0% 44% 0% 1% 0% 18% 11 0% 33% 0% 1% 2% 18%
If scenario continues and 2 days overlap between activities 2 and 5 are carried out, then the main critical path is no longer dominant critical path and another path (4,6,7,8) with 14 days is now critical. If we want to reduce the project duration more, the sensitivity of other activities in new critical path should also be considered and table should be updated.
Table 6-2 and Figure 6-2 illustrate the result of simulation and tornado chart after performing overlap with 2 days between activity 2 and 5.
3 Pro Track software was used for conducting simulation
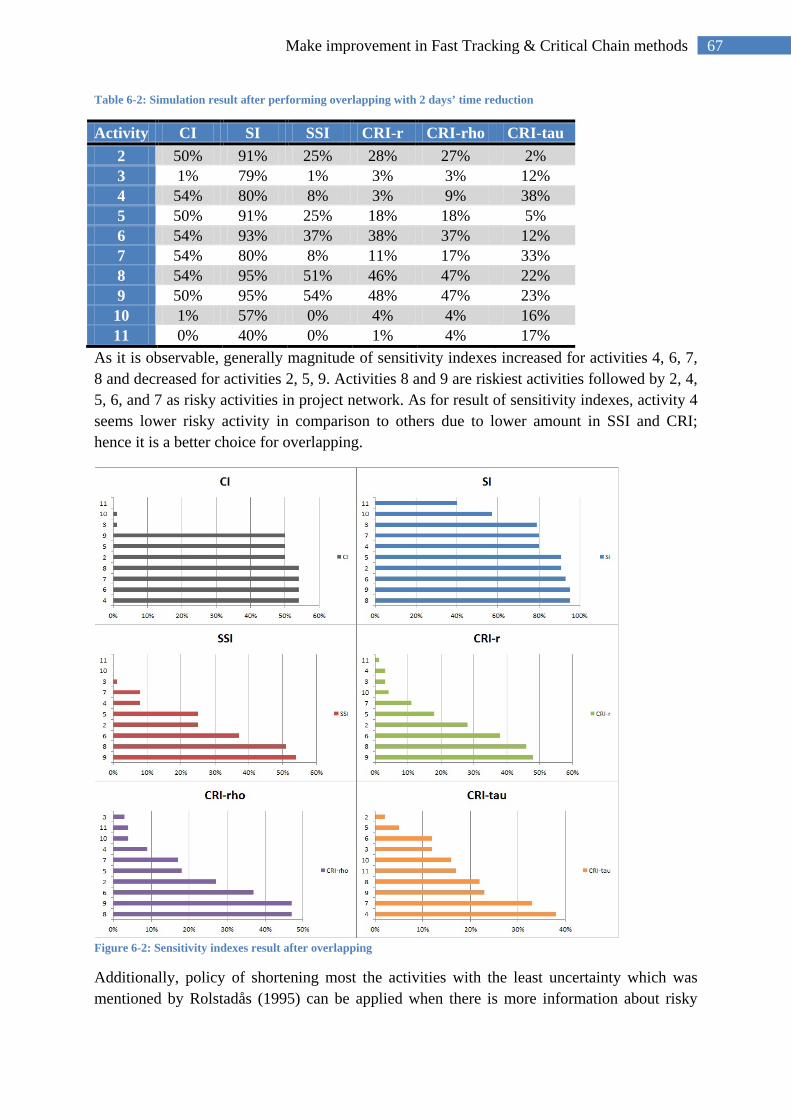
67 Make improvement in Fast Tracking & Critical Chain methods
Table 6-2: Simulation result after performing overlapping with 2 days’ time reduction
Activity CI SI SSI CRI-r CRI-rho CRI-tau 2 50% 91% 25% 28% 27% 2% 3 1% 79% 1% 3% 3% 12% 4 54% 80% 8% 3% 9% 38% 5 50% 91% 25% 18% 18% 5% 6 54% 93% 37% 38% 37% 12% 7 54% 80% 8% 11% 17% 33% 8 54% 95% 51% 46% 47% 22% 9 50% 95% 54% 48% 47% 23% 10 1% 57% 0% 4% 4% 16% 11 0% 40% 0% 1% 4% 17%
As it is observable, generally magnitude of sensitivity indexes increased for activities 4, 6, 7, 8 and decreased for activities 2, 5, 9. Activities 8 and 9 are riskiest activities followed by 2, 4, 5, 6, and 7 as risky activities in project network. As for result of sensitivity indexes, activity 4 seems lower risky activity in comparison to others due to lower amount in SSI and CRI; hence it is a better choice for overlapping.
Figure 6-2: Sensitivity indexes result after overlapping
Additionally, policy of shortening most the activities with the least uncertainty which was mentioned by Rolstadås (1995) can be applied when there is more information about risky
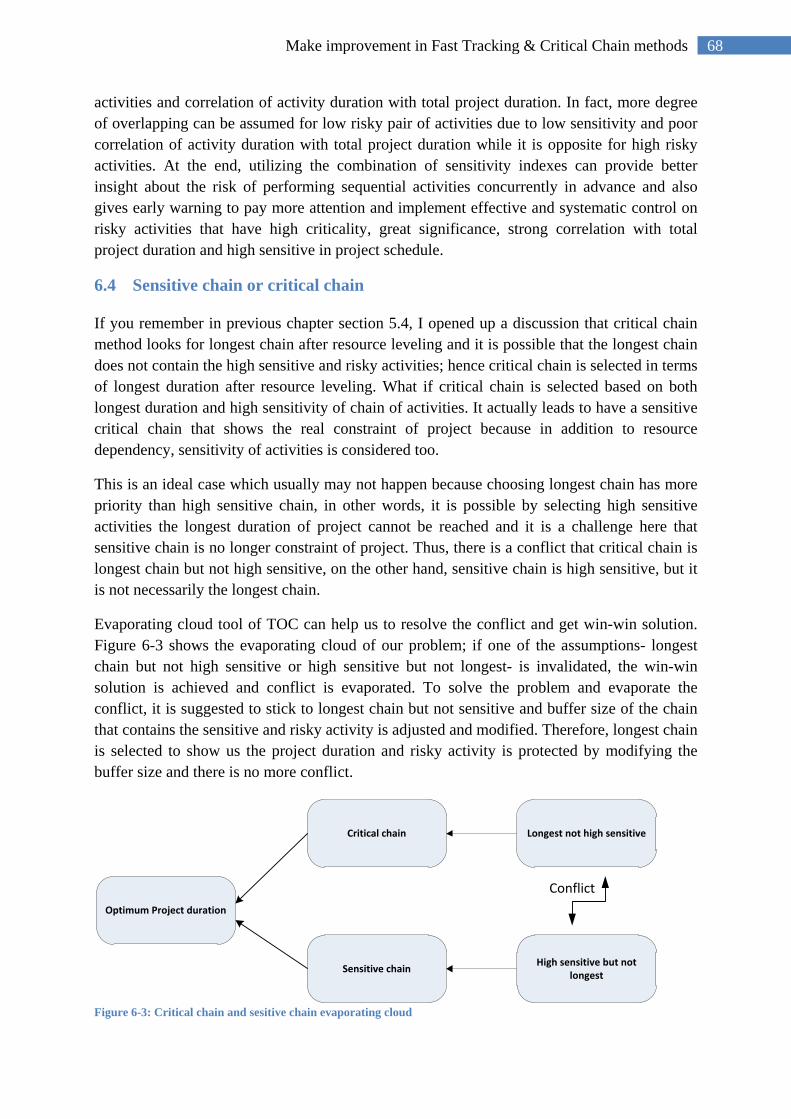
68 Make improvement in Fast Tracking & Critical Chain methods
activities and correlation of activity duration with total project duration. In fact, more degree of overlapping can be assumed for low risky pair of activities due to low sensitivity and poor correlation of activity duration with total project duration while it is opposite for high risky activities. At the end, utilizing the combination of sensitivity indexes can provide better insight about the risk of performing sequential activities concurrently in advance and also gives early warning to pay more attention and implement effective and systematic control on risky activities that have high criticality, great significance, strong correlation with total project duration and high sensitive in project schedule.
6.4 Sensitive chain or critical chain
If you remember in previous chapter section 5.4, I opened up a discussion that critical chain method looks for longest chain after resource leveling and it is possible that the longest chain does not contain the high sensitive and risky activities; hence critical chain is selected in terms of longest duration after resource leveling. What if critical chain is selected based on both longest duration and high sensitivity of chain of activities. It actually leads to have a sensitive critical chain that shows the real constraint of project because in addition to resource dependency, sensitivity of activities is considered too.
This is an ideal case which usually may not happen because choosing longest chain has more priority than high sensitive chain, in other words, it is possible by selecting high sensitive activities the longest duration of project cannot be reached and it is a challenge here that sensitive chain is no longer constraint of project. Thus, there is a conflict that critical chain is longest chain but not high sensitive, on the other hand, sensitive chain is high sensitive, but it is not necessarily the longest chain.
Evaporating cloud tool of TOC can help us to resolve the conflict and get win-win solution. Figure 6-3 shows the evaporating cloud of our problem; if one of the assumptions- longest chain but not high sensitive or high sensitive but not longest- is invalidated, the win-win solution is achieved and conflict is evaporated. To solve the problem and evaporate the conflict, it is suggested to stick to longest chain but not sensitive and buffer size of the chain that contains the sensitive and risky activity is adjusted and modified. Therefore, longest chain is selected to show us the project duration and risky activity is protected by modifying the buffer size and there is no more conflict.
Figure 6-3: Critical chain and sesitive chain evaporating cloud
Optimum Project duration
Critical chain
High sensitive but not longestSensitive chain
Longest not high sensitive
Conflict
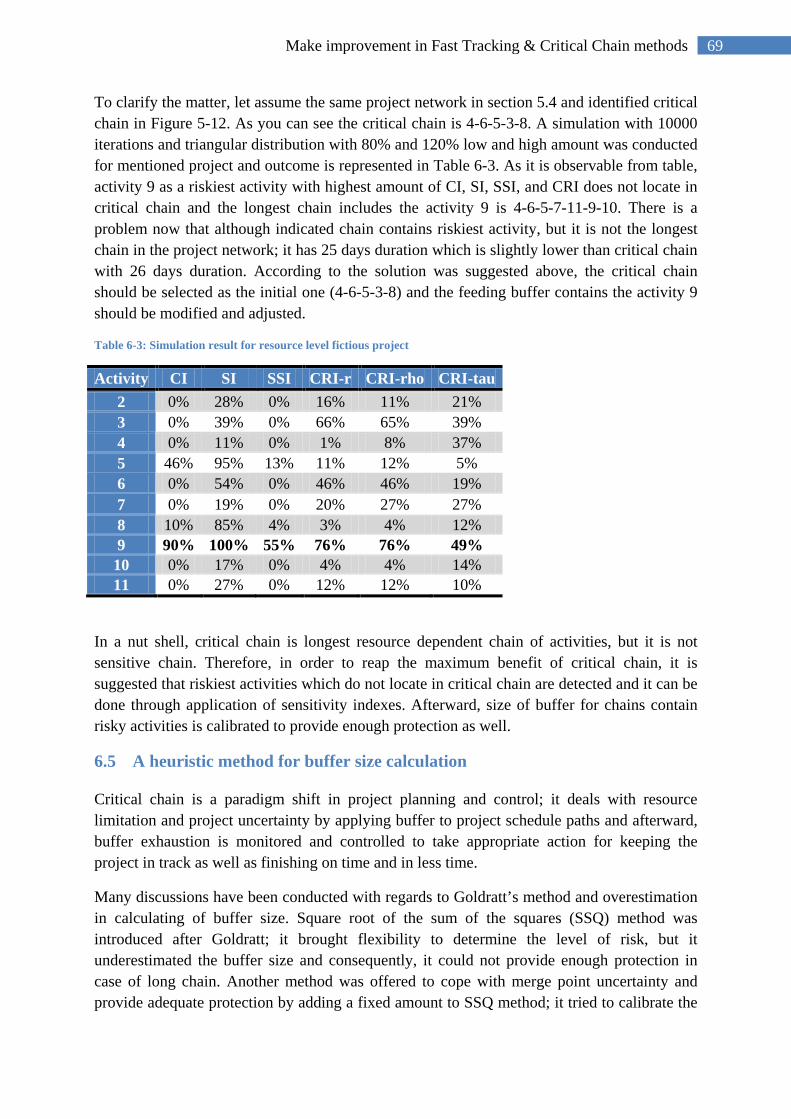
69 Make improvement in Fast Tracking & Critical Chain methods
To clarify the matter, let assume the same project network in section 5.4 and identified critical chain in Figure 5-12. As you can see the critical chain is 4-6-5-3-8. A simulation with 10000 iterations and triangular distribution with 80% and 120% low and high amount was conducted for mentioned project and outcome is represented in Table 6-3. As it is observable from table, activity 9 as a riskiest activity with highest amount of CI, SI, SSI, and CRI does not locate in critical chain and the longest chain includes the activity 9 is 4-6-5-7-11-9-10. There is a problem now that although indicated chain contains riskiest activity, but it is not the longest chain in the project network; it has 25 days duration which is slightly lower than critical chain with 26 days duration. According to the solution was suggested above, the critical chain should be selected as the initial one (4-6-5-3-8) and the feeding buffer contains the activity 9 should be modified and adjusted.
Table 6-3: Simulation result for resource level fictious project
Activity CI SI SSI CRI-r CRI-rho CRI-tau 2 0% 28% 0% 16% 11% 21% 3 0% 39% 0% 66% 65% 39% 4 0% 11% 0% 1% 8% 37% 5 46% 95% 13% 11% 12% 5% 6 0% 54% 0% 46% 46% 19% 7 0% 19% 0% 20% 27% 27% 8 10% 85% 4% 3% 4% 12% 9 90% 100% 55% 76% 76% 49% 10 0% 17% 0% 4% 4% 14% 11 0% 27% 0% 12% 12% 10%
In a nut shell, critical chain is longest resource dependent chain of activities, but it is not sensitive chain. Therefore, in order to reap the maximum benefit of critical chain, it is suggested that riskiest activities which do not locate in critical chain are detected and it can be done through application of sensitivity indexes. Afterward, size of buffer for chains contain risky activities is calibrated to provide enough protection as well.
6.5 A heuristic method for buffer size calculation
Critical chain is a paradigm shift in project planning and control; it deals with resource limitation and project uncertainty by applying buffer to project schedule paths and afterward, buffer exhaustion is monitored and controlled to take appropriate action for keeping the project in track as well as finishing on time and in less time.
Many discussions have been conducted with regards to Goldratt’s method and overestimation in calculating of buffer size. Square root of the sum of the squares (SSQ) method was introduced after Goldratt; it brought flexibility to determine the level of risk, but it underestimated the buffer size and consequently, it could not provide enough protection in case of long chain. Another method was offered to cope with merge point uncertainty and provide adequate protection by adding a fixed amount to SSQ method; it tried to calibrate the
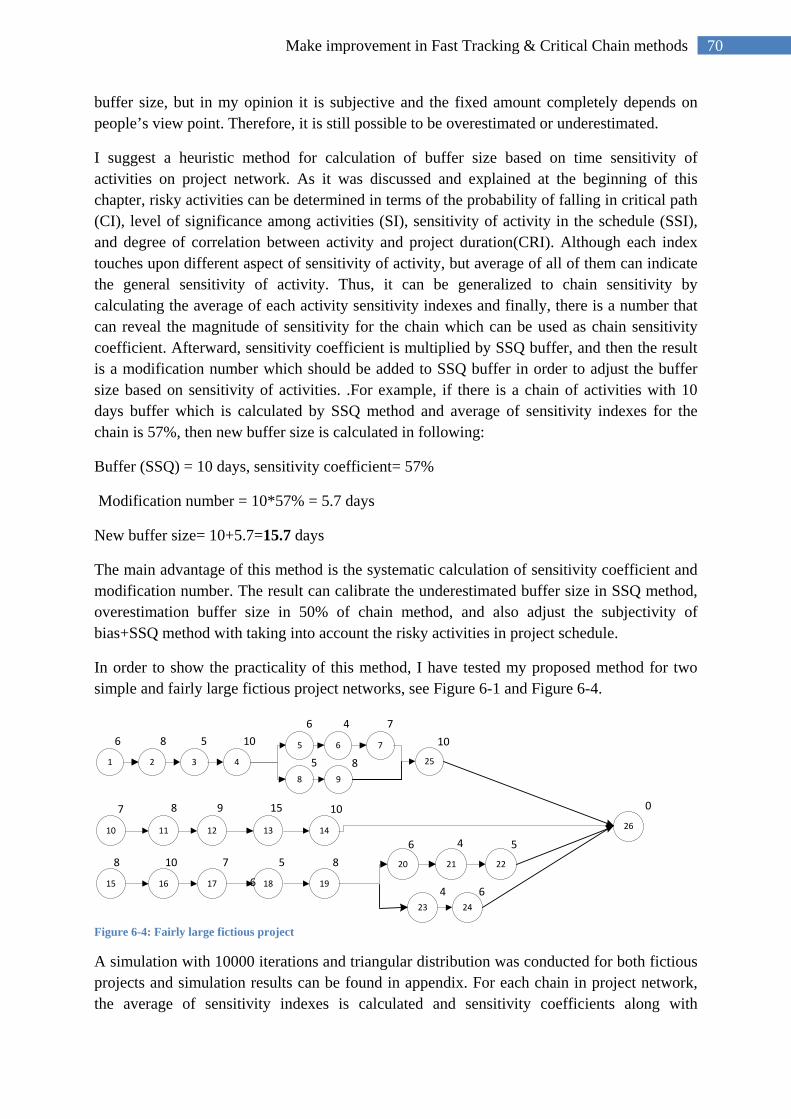
70 Make improvement in Fast Tracking & Critical Chain methods
buffer size, but in my opinion it is subjective and the fixed amount completely depends on people’s view point. Therefore, it is still possible to be overestimated or underestimated.
I suggest a heuristic method for calculation of buffer size based on time sensitivity of activities on project network. As it was discussed and explained at the beginning of this chapter, risky activities can be determined in terms of the probability of falling in critical path (CI), level of significance among activities (SI), sensitivity of activity in the schedule (SSI), and degree of correlation between activity and project duration(CRI). Although each index touches upon different aspect of sensitivity of activity, but average of all of them can indicate the general sensitivity of activity. Thus, it can be generalized to chain sensitivity by calculating the average of each activity sensitivity indexes and finally, there is a number that can reveal the magnitude of sensitivity for the chain which can be used as chain sensitivity coefficient. Afterward, sensitivity coefficient is multiplied by SSQ buffer, and then the result is a modification number which should be added to SSQ buffer in order to adjust the buffer size based on sensitivity of activities. .For example, if there is a chain of activities with 10 days buffer which is calculated by SSQ method and average of sensitivity indexes for the chain is 57%, then new buffer size is calculated in following:
Buffer (SSQ) = 10 days, sensitivity coefficient= 57%
Modification number = 10*57% = 5.7 days
New buffer size= 10+5.7=15.7 days
The main advantage of this method is the systematic calculation of sensitivity coefficient and modification number. The result can calibrate the underestimated buffer size in SSQ method, overestimation buffer size in 50% of chain method, and also adjust the subjectivity of bias+SSQ method with taking into account the risky activities in project schedule.
In order to show the practicality of this method, I have tested my proposed method for two simple and fairly large fictious project networks, see Figure 6-1 and Figure 6-4.
Figure 6-4: Fairly large fictious project
A simulation with 10000 iterations and triangular distribution was conducted for both fictious projects and simulation results can be found in appendix. For each chain in project network, the average of sensitivity indexes is calculated and sensitivity coefficients along with
1 2 3 4
5 6 7
8 9
25
10 11 12 13 14
15 16 17 18 19
20 21 22
23 24
26
6 8 5 106
6
4
5
7
8
7 8 9 15 10
8 10 7 5 86 4 5
4 6
10
0
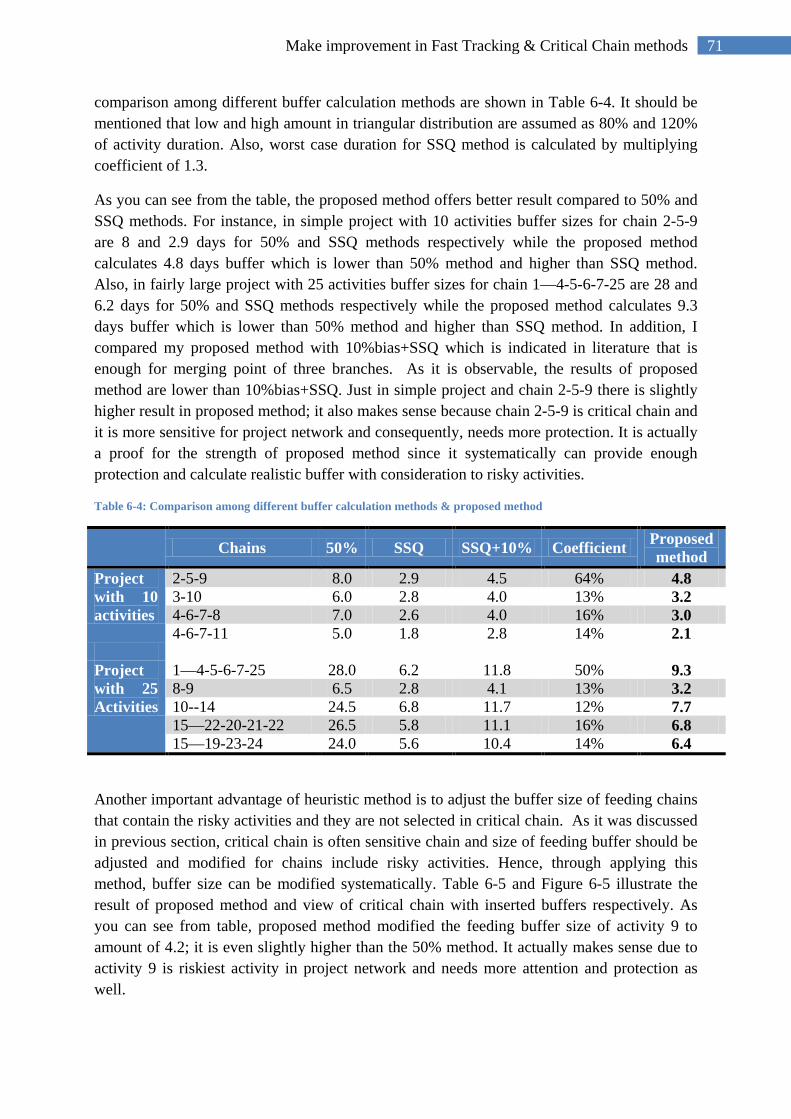
71 Make improvement in Fast Tracking & Critical Chain methods
comparison among different buffer calculation methods are shown in Table 6-4. It should be mentioned that low and high amount in triangular distribution are assumed as 80% and 120% of activity duration. Also, worst case duration for SSQ method is calculated by multiplying coefficient of 1.3.
As you can see from the table, the proposed method offers better result compared to 50% and SSQ methods. For instance, in simple project with 10 activities buffer sizes for chain 2-5-9 are 8 and 2.9 days for 50% and SSQ methods respectively while the proposed method calculates 4.8 days buffer which is lower than 50% method and higher than SSQ method. Also, in fairly large project with 25 activities buffer sizes for chain 1—4-5-6-7-25 are 28 and 6.2 days for 50% and SSQ methods respectively while the proposed method calculates 9.3 days buffer which is lower than 50% method and higher than SSQ method. In addition, I compared my proposed method with 10%bias+SSQ which is indicated in literature that is enough for merging point of three branches. As it is observable, the results of proposed method are lower than 10%bias+SSQ. Just in simple project and chain 2-5-9 there is slightly higher result in proposed method; it also makes sense because chain 2-5-9 is critical chain and it is more sensitive for project network and consequently, needs more protection. It is actually a proof for the strength of proposed method since it systematically can provide enough protection and calculate realistic buffer with consideration to risky activities.
Table 6-4: Comparison among different buffer calculation methods & proposed method
Chains 50% SSQ SSQ+10% Coefficient Proposed method
Project with 10 activities
2-5-9 8.0 2.9 4.5 64% 4.8 3-10 6.0 2.8 4.0 13% 3.2 4-6-7-8 7.0 2.6 4.0 16% 3.0 4-6-7-11 5.0 1.8 2.8 14% 2.1
Project with 25 Activities
1—4-5-6-7-25 28.0 6.2 11.8 50% 9.3 8-9 6.5 2.8 4.1 13% 3.2 10--14 24.5 6.8 11.7 12% 7.7 15—22-20-21-22 26.5 5.8 11.1 16% 6.8 15—19-23-24 24.0 5.6 10.4 14% 6.4
Another important advantage of heuristic method is to adjust the buffer size of feeding chains that contain the risky activities and they are not selected in critical chain. As it was discussed in previous section, critical chain is often sensitive chain and size of feeding buffer should be adjusted and modified for chains include risky activities. Hence, through applying this method, buffer size can be modified systematically. Table 6-5 and Figure 6-5 illustrate the result of proposed method and view of critical chain with inserted buffers respectively. As you can see from table, proposed method modified the feeding buffer size of activity 9 to amount of 4.2; it is even slightly higher than the 50% method. It actually makes sense due to activity 9 is riskiest activity in project network and needs more attention and protection as well.
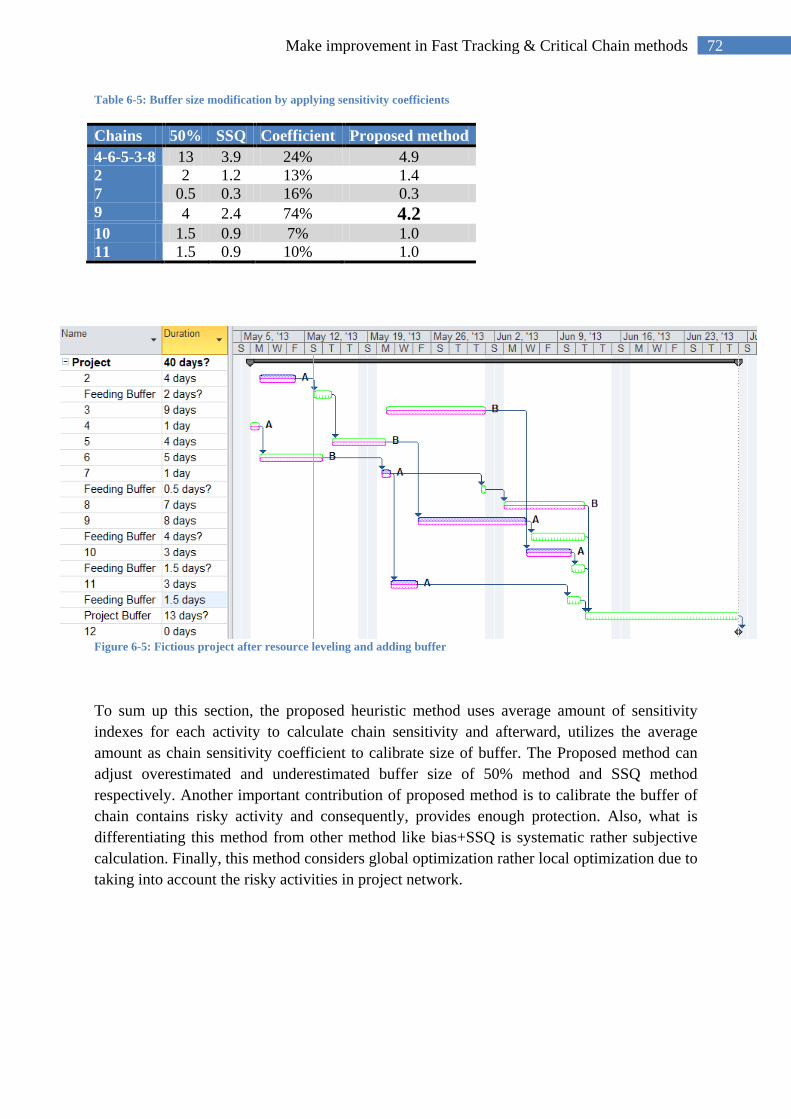
72 Make improvement in Fast Tracking & Critical Chain methods
Table 6-5: Buffer size modification by applying sensitivity coefficients
Figure 6-5: Fictious project after resource leveling and adding buffer
To sum up this section, the proposed heuristic method uses average amount of sensitivity indexes for each activity to calculate chain sensitivity and afterward, utilizes the average amount as chain sensitivity coefficient to calibrate size of buffer. The Proposed method can adjust overestimated and underestimated buffer size of 50% method and SSQ method respectively. Another important contribution of proposed method is to calibrate the buffer of chain contains risky activity and consequently, provides enough protection. Also, what is differentiating this method from other method like bias+SSQ is systematic rather subjective calculation. Finally, this method considers global optimization rather local optimization due to taking into account the risky activities in project network.
Chains 50% SSQ Coefficient Proposed method 4-6-5-3-8 13 3.9 24% 4.9 2 2 1.2 13% 1.4 7 0.5 0.3 16% 0.3 9 4 2.4 74% 4.2 10 1.5 0.9 7% 1.0 11 1.5 0.9 10% 1.0
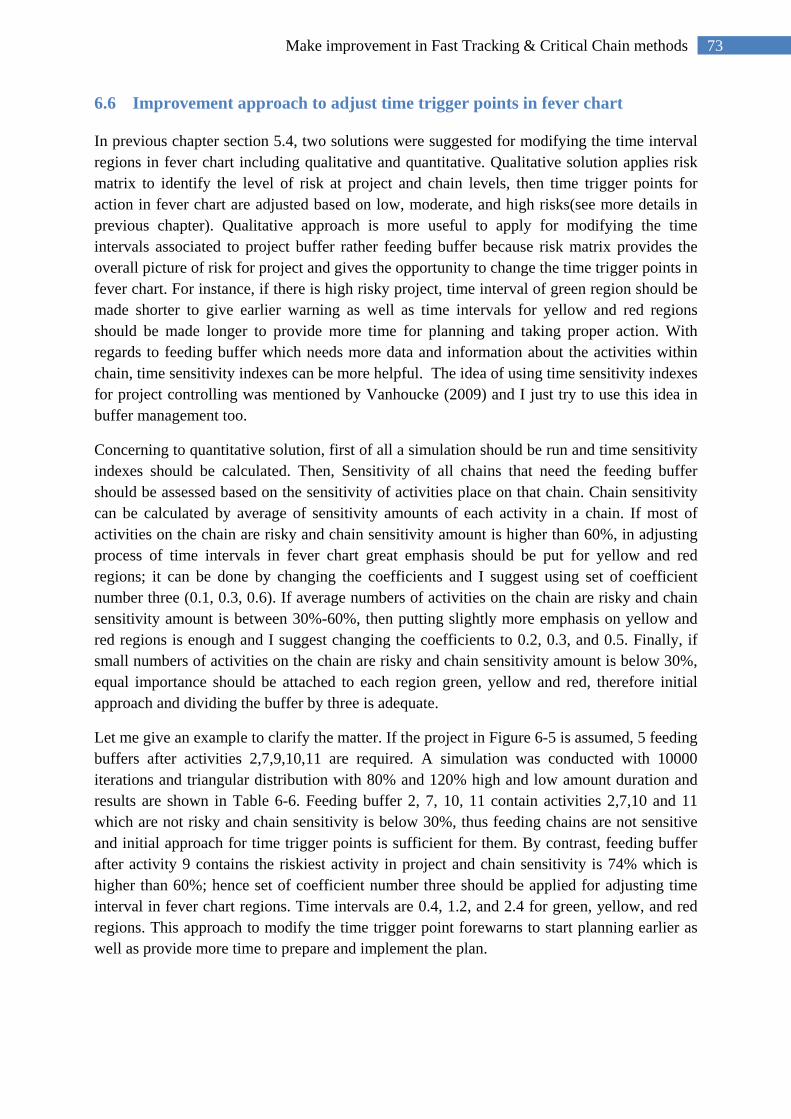
73 Make improvement in Fast Tracking & Critical Chain methods
6.6 Improvement approach to adjust time trigger points in fever chart
In previous chapter section 5.4, two solutions were suggested for modifying the time interval regions in fever chart including qualitative and quantitative. Qualitative solution applies risk matrix to identify the level of risk at project and chain levels, then time trigger points for action in fever chart are adjusted based on low, moderate, and high risks(see more details in previous chapter). Qualitative approach is more useful to apply for modifying the time intervals associated to project buffer rather feeding buffer because risk matrix provides the overall picture of risk for project and gives the opportunity to change the time trigger points in fever chart. For instance, if there is high risky project, time interval of green region should be made shorter to give earlier warning as well as time intervals for yellow and red regions should be made longer to provide more time for planning and taking proper action. With regards to feeding buffer which needs more data and information about the activities within chain, time sensitivity indexes can be more helpful. The idea of using time sensitivity indexes for project controlling was mentioned by Vanhoucke (2009) and I just try to use this idea in buffer management too.
Concerning to quantitative solution, first of all a simulation should be run and time sensitivity indexes should be calculated. Then, Sensitivity of all chains that need the feeding buffer should be assessed based on the sensitivity of activities place on that chain. Chain sensitivity can be calculated by average of sensitivity amounts of each activity in a chain. If most of activities on the chain are risky and chain sensitivity amount is higher than 60%, in adjusting process of time intervals in fever chart great emphasis should be put for yellow and red regions; it can be done by changing the coefficients and I suggest using set of coefficient number three (0.1, 0.3, 0.6). If average numbers of activities on the chain are risky and chain sensitivity amount is between 30%-60%, then putting slightly more emphasis on yellow and red regions is enough and I suggest changing the coefficients to 0.2, 0.3, and 0.5. Finally, if small numbers of activities on the chain are risky and chain sensitivity amount is below 30%, equal importance should be attached to each region green, yellow and red, therefore initial approach and dividing the buffer by three is adequate.
Let me give an example to clarify the matter. If the project in Figure 6-5 is assumed, 5 feeding buffers after activities 2,7,9,10,11 are required. A simulation was conducted with 10000 iterations and triangular distribution with 80% and 120% high and low amount duration and results are shown in Table 6-6. Feeding buffer 2, 7, 10, 11 contain activities 2,7,10 and 11 which are not risky and chain sensitivity is below 30%, thus feeding chains are not sensitive and initial approach for time trigger points is sufficient for them. By contrast, feeding buffer after activity 9 contains the riskiest activity in project and chain sensitivity is 74% which is higher than 60%; hence set of coefficient number three should be applied for adjusting time interval in fever chart regions. Time intervals are 0.4, 1.2, and 2.4 for green, yellow, and red regions. This approach to modify the time trigger point forewarns to start planning earlier as well as provide more time to prepare and implement the plan.
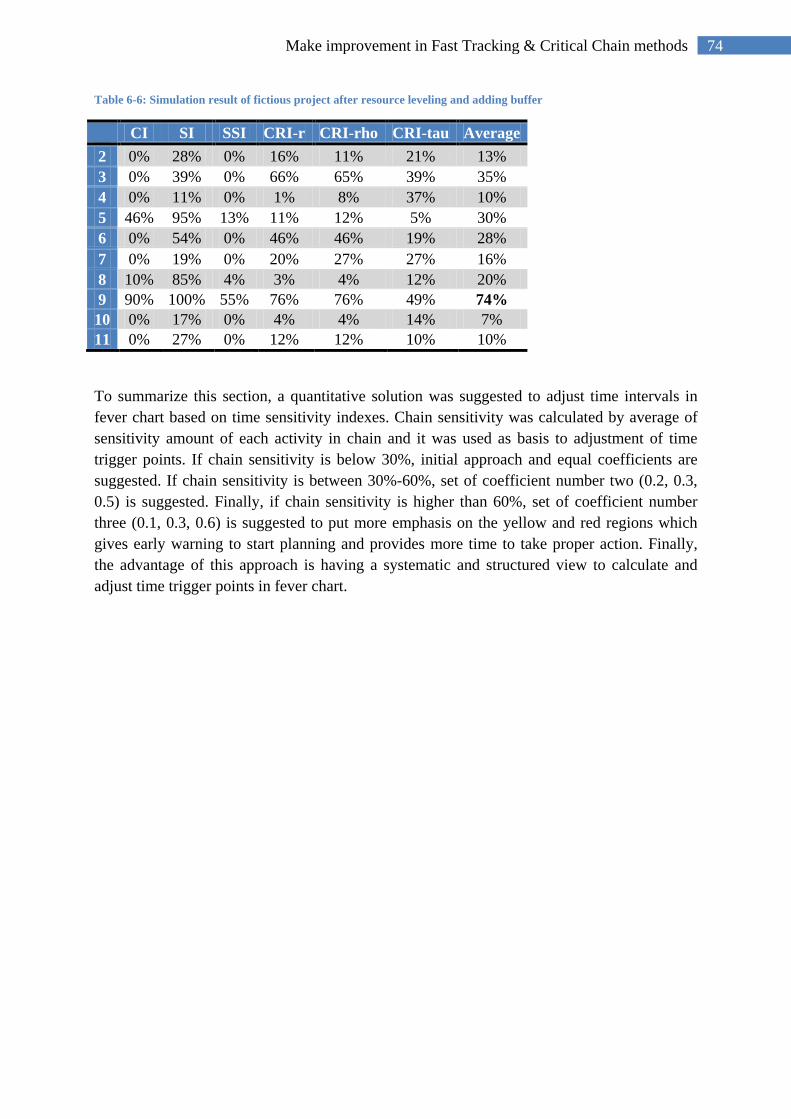
74 Make improvement in Fast Tracking & Critical Chain methods
Table 6-6: Simulation result of fictious project after resource leveling and adding buffer
CI SI SSI CRI-r CRI-rho CRI-tau Average 2 0% 28% 0% 16% 11% 21% 13% 3 0% 39% 0% 66% 65% 39% 35% 4 0% 11% 0% 1% 8% 37% 10% 5 46% 95% 13% 11% 12% 5% 30% 6 0% 54% 0% 46% 46% 19% 28% 7 0% 19% 0% 20% 27% 27% 16% 8 10% 85% 4% 3% 4% 12% 20% 9 90% 100% 55% 76% 76% 49% 74% 10 0% 17% 0% 4% 4% 14% 7% 11 0% 27% 0% 12% 12% 10% 10%
To summarize this section, a quantitative solution was suggested to adjust time intervals in fever chart based on time sensitivity indexes. Chain sensitivity was calculated by average of sensitivity amount of each activity in chain and it was used as basis to adjustment of time trigger points. If chain sensitivity is below 30%, initial approach and equal coefficients are suggested. If chain sensitivity is between 30%-60%, set of coefficient number two (0.2, 0.3, 0.5) is suggested. Finally, if chain sensitivity is higher than 60%, set of coefficient number three (0.1, 0.3, 0.6) is suggested to put more emphasis on the yellow and red regions which gives early warning to start planning and provides more time to take proper action. Finally, the advantage of this approach is having a systematic and structured view to calculate and adjust time trigger points in fever chart.
75 Make synergy by combination of Fast tracking and critical chain methods
Make synergy by combination of Fast tracking and critical chain methods
Chapter7
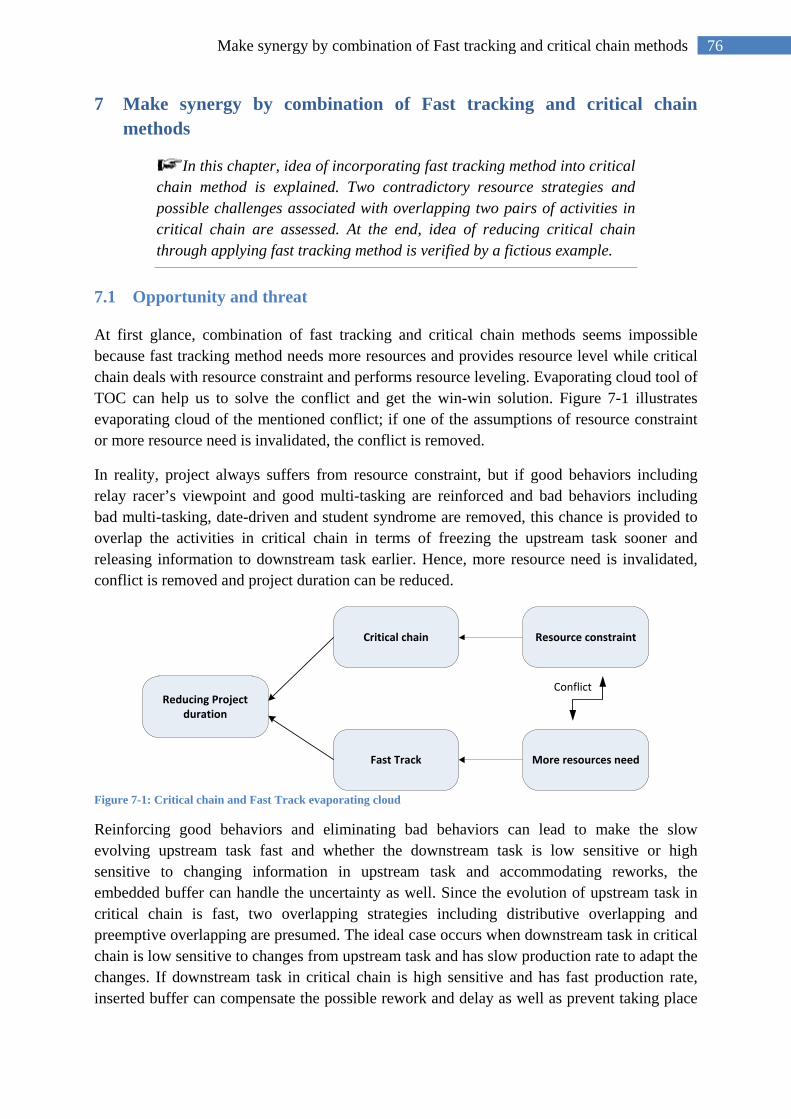
76 Make synergy by combination of Fast tracking and critical chain methods
7 Make synergy by combination of Fast tracking and critical chain methods
In this chapter, idea of incorporating fast tracking method into critical chain method is explained. Two contradictory resource strategies and possible challenges associated with overlapping two pairs of activities in critical chain are assessed. At the end, idea of reducing critical chain through applying fast tracking method is verified by a fictious example.
7.1 Opportunity and threat
At first glance, combination of fast tracking and critical chain methods seems impossible because fast tracking method needs more resources and provides resource level while critical chain deals with resource constraint and performs resource leveling. Evaporating cloud tool of TOC can help us to solve the conflict and get the win-win solution. Figure 7-1 illustrates evaporating cloud of the mentioned conflict; if one of the assumptions of resource constraint or more resource need is invalidated, the conflict is removed.
In reality, project always suffers from resource constraint, but if good behaviors including relay racer’s viewpoint and good multi-tasking are reinforced and bad behaviors including bad multi-tasking, date-driven and student syndrome are removed, this chance is provided to overlap the activities in critical chain in terms of freezing the upstream task sooner and releasing information to downstream task earlier. Hence, more resource need is invalidated, conflict is removed and project duration can be reduced.
Figure 7-1: Critical chain and Fast Track evaporating cloud
Reinforcing good behaviors and eliminating bad behaviors can lead to make the slow evolving upstream task fast and whether the downstream task is low sensitive or high sensitive to changing information in upstream task and accommodating reworks, the embedded buffer can handle the uncertainty as well. Since the evolution of upstream task in critical chain is fast, two overlapping strategies including distributive overlapping and preemptive overlapping are presumed. The ideal case occurs when downstream task in critical chain is low sensitive to changes from upstream task and has slow production rate to adapt the changes. If downstream task in critical chain is high sensitive and has fast production rate, inserted buffer can compensate the possible rework and delay as well as prevent taking place
Reducing Project duration
Critical chain
More resources needFast Track
Resource constraint
Conflict
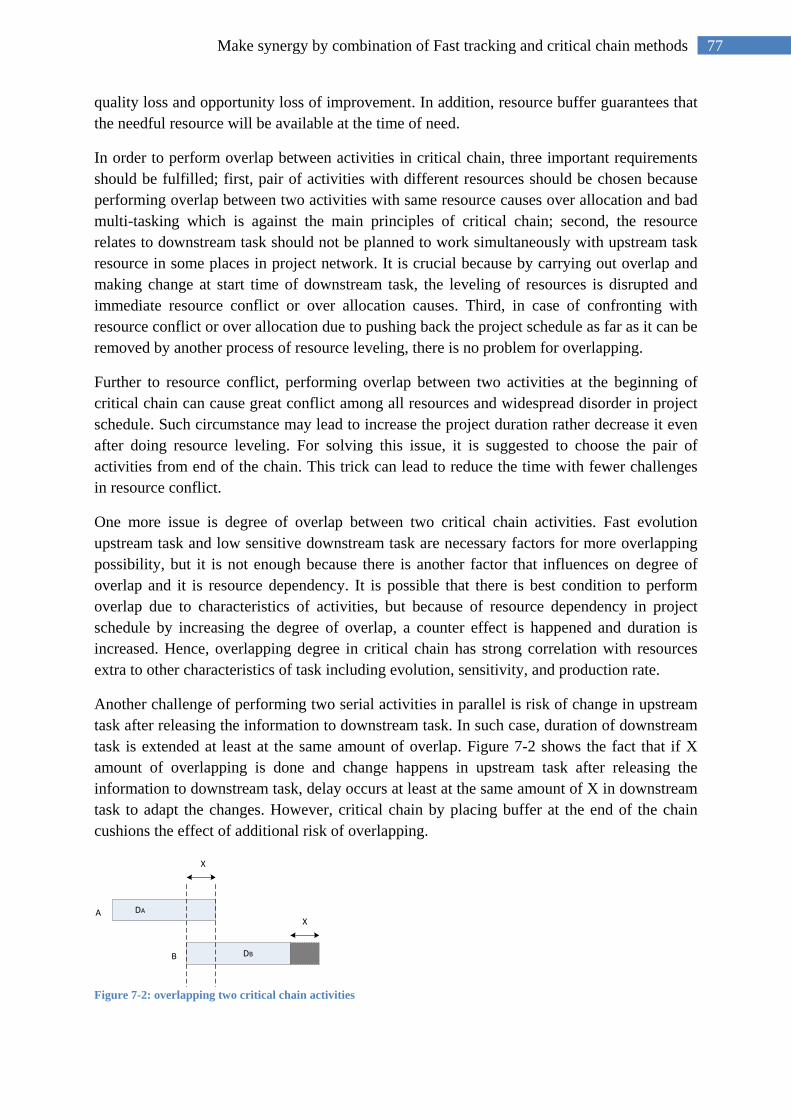
77 Make synergy by combination of Fast tracking and critical chain methods
quality loss and opportunity loss of improvement. In addition, resource buffer guarantees that the needful resource will be available at the time of need.
In order to perform overlap between activities in critical chain, three important requirements should be fulfilled; first, pair of activities with different resources should be chosen because performing overlap between two activities with same resource causes over allocation and bad multi-tasking which is against the main principles of critical chain; second, the resource relates to downstream task should not be planned to work simultaneously with upstream task resource in some places in project network. It is crucial because by carrying out overlap and making change at start time of downstream task, the leveling of resources is disrupted and immediate resource conflict or over allocation causes. Third, in case of confronting with resource conflict or over allocation due to pushing back the project schedule as far as it can be removed by another process of resource leveling, there is no problem for overlapping.
Further to resource conflict, performing overlap between two activities at the beginning of critical chain can cause great conflict among all resources and widespread disorder in project schedule. Such circumstance may lead to increase the project duration rather decrease it even after doing resource leveling. For solving this issue, it is suggested to choose the pair of activities from end of the chain. This trick can lead to reduce the time with fewer challenges in resource conflict.
One more issue is degree of overlap between two critical chain activities. Fast evolution upstream task and low sensitive downstream task are necessary factors for more overlapping possibility, but it is not enough because there is another factor that influences on degree of overlap and it is resource dependency. It is possible that there is best condition to perform overlap due to characteristics of activities, but because of resource dependency in project schedule by increasing the degree of overlap, a counter effect is happened and duration is increased. Hence, overlapping degree in critical chain has strong correlation with resources extra to other characteristics of task including evolution, sensitivity, and production rate.
Another challenge of performing two serial activities in parallel is risk of change in upstream task after releasing the information to downstream task. In such case, duration of downstream task is extended at least at the same amount of overlap. Figure 7-2 shows the fact that if X amount of overlapping is done and change happens in upstream task after releasing the information to downstream task, delay occurs at least at the same amount of X in downstream task to adapt the changes. However, critical chain by placing buffer at the end of the chain cushions the effect of additional risk of overlapping.
Figure 7-2: overlapping two critical chain activities
X
AX
B
DA
DB
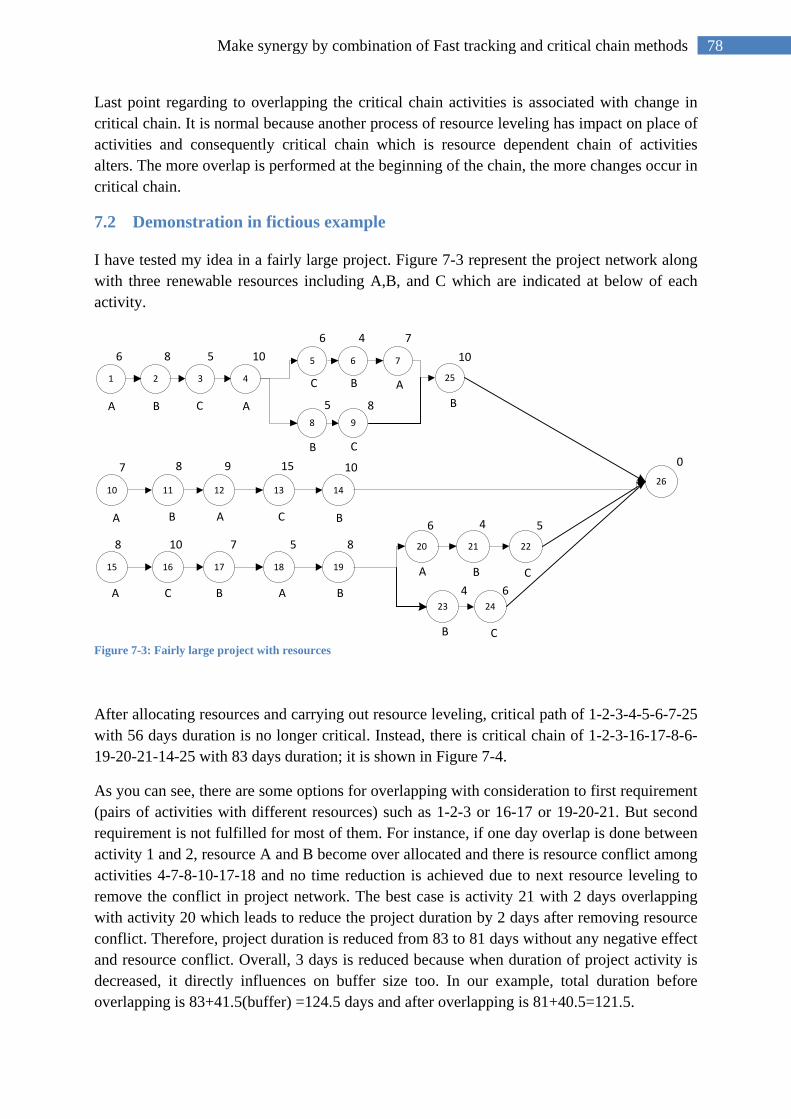
78 Make synergy by combination of Fast tracking and critical chain methods
Last point regarding to overlapping the critical chain activities is associated with change in critical chain. It is normal because another process of resource leveling has impact on place of activities and consequently critical chain which is resource dependent chain of activities alters. The more overlap is performed at the beginning of the chain, the more changes occur in critical chain.
7.2 Demonstration in fictious example
I have tested my idea in a fairly large project. Figure 7-3 represent the project network along with three renewable resources including A,B, and C which are indicated at below of each activity.
Figure 7-3: Fairly large project with resources
After allocating resources and carrying out resource leveling, critical path of 1-2-3-4-5-6-7-25 with 56 days duration is no longer critical. Instead, there is critical chain of 1-2-3-16-17-8-6-19-20-21-14-25 with 83 days duration; it is shown in Figure 7-4.
As you can see, there are some options for overlapping with consideration to first requirement (pairs of activities with different resources) such as 1-2-3 or 16-17 or 19-20-21. But second requirement is not fulfilled for most of them. For instance, if one day overlap is done between activity 1 and 2, resource A and B become over allocated and there is resource conflict among activities 4-7-8-10-17-18 and no time reduction is achieved due to next resource leveling to remove the conflict in project network. The best case is activity 21 with 2 days overlapping with activity 20 which leads to reduce the project duration by 2 days after removing resource conflict. Therefore, project duration is reduced from 83 to 81 days without any negative effect and resource conflict. Overall, 3 days is reduced because when duration of project activity is decreased, it directly influences on buffer size too. In our example, total duration before overlapping is 83+41.5(buffer) =124.5 days and after overlapping is 81+40.5=121.5.
1 2 3 4
5 6 7
8 9
25
10 11 12 13 14
15 16 17 18 19
20 21 22
23 24
26
6 8 5 106 4
5
7
8
7 8 9 15 10
8 10 7 5 86 4 5
4 6
10
0
BA A
A
B
B
B
C
C
C
A BCA B
A BC A B
A B C
B C
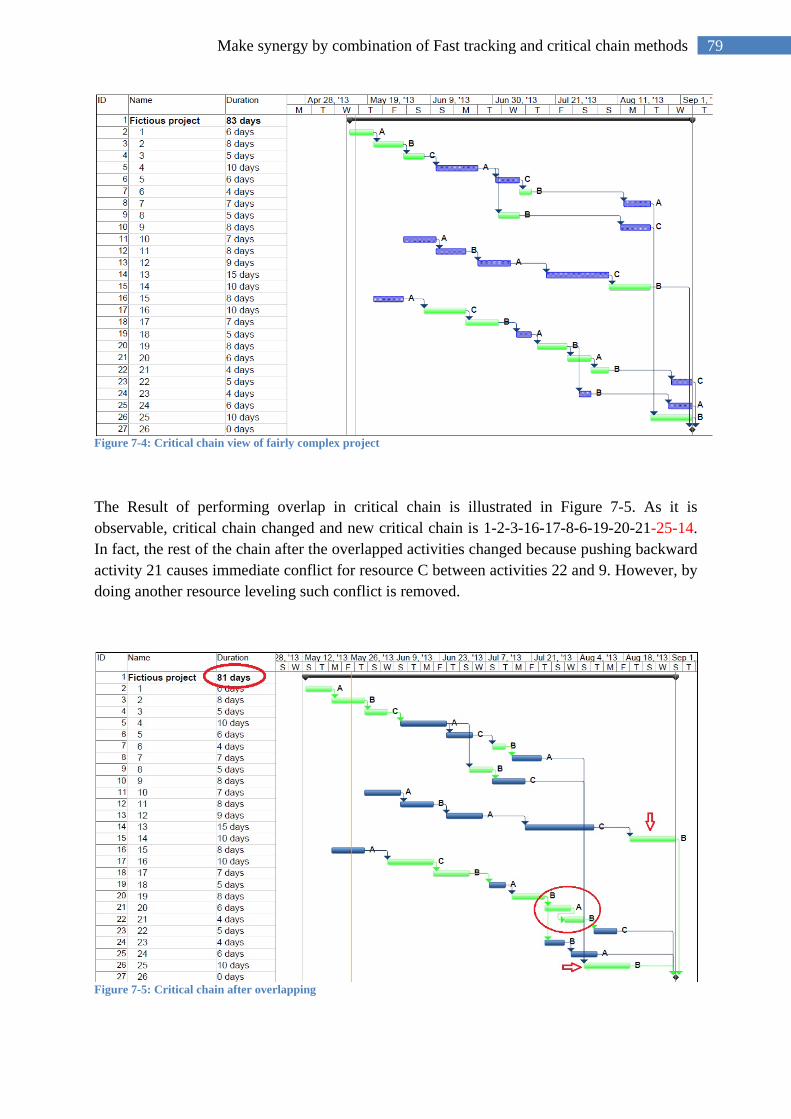
79 Make synergy by combination of Fast tracking and critical chain methods
Figure 7-4: Critical chain view of fairly complex project
The Result of performing overlap in critical chain is illustrated in Figure 7-5. As it is observable, critical chain changed and new critical chain is 1-2-3-16-17-8-6-19-20-21-25-14. In fact, the rest of the chain after the overlapped activities changed because pushing backward activity 21 causes immediate conflict for resource C between activities 22 and 9. However, by doing another resource leveling such conflict is removed.
Figure 7-5: Critical chain after overlapping

80 Make synergy by combination of Fast tracking and critical chain methods
As it was discussed, fast tracking can be combined with critical chain to reduce the project duration despite the resource dependency of critical chain and possibility of resource conflict. In fact, critical chain by eliminating bad behaviors and reinforcing good behaviors in project speeds up the project pace and makes the slow evolving activity fast and even makes the fast evolution activity faster, to wit, final information can be frozen and finalized early and overlapping strategies are changed to distributive or preemptive. Moreover, placing buffer at the end of chain can cushion the effect of additional risk of rework. Hence, a compressed schedule is achieved while additional risk of overlapping is handled.

81 Conclusion and suggestion for future research
Conclusion and suggestion for future research
Chapter8
82 Conclusion and suggestion for future research
8 Conclusion and suggestion for future research
8.1 Findings and results summary
Fast tracking and critical chain methods have mainly been discussed in literature for achieving shorter project duration. Fast tracking method reduces project duration by performing two sequential pair of activities concurrently. Critical chain deals with resource constraint and project uncertainty. Also, it introduces two concepts of buffer and buffer management in order to finish the project on time and in less time. Findings and results regarding to both methods are summarized in following:
Fast tracking method
Enhanced overlapping strategy framework is complicated and time-consuming to collect data and create it; hence a proposed overlapping strategy framework was suggested and discussed. This new approach to overlapping strategy framework can provide more information and insight to apply right strategy at right place and it is not complicated and time-consuming due to the information for production rate can be gathered along with information for basic characteristics- evolution and sensitivity. In addition, it can give proper response to challenge of initial overlapping strategy framework to apply right strategy at tight place like the overdesign strategy when evolution is fast and sensitive is low. In this case, applying overdesign strategy seems making hindrance in process, but when production rate is considered and there is fast production rate, application of overdesign strategy and conservative assumption makes sense and it can reduce the sensitivity.
Additionally, fast tracking method suffers from additional risk of overlapping due to early release of information from upstream task to downstream task. In fact, there is a possibility of change in upstream task, rework in downstream task, and consequently time reduction is compensated by reworking to adapt the changes and no time reduction is achieved. Time sensitivity indexes can assist us to mitigate the risk of overlapping at the beginning by choosing low risky pair of activities in project schedule. As a matter of fact, if overlapping strategy fails, low sensitivity and poor correlation of overlapped activities duration with total duration exert lower influence on overall project lead time.
Critical chain method
Critical chain method deals with resource constraint and project uncertainty through identifying resource dependent chain of activities rather critical path as well as aggregating uncertainty of each activities and putting them at the end of each chain as buffer. Critical chain not only provides enough protection for on-time completion, but also reduces the overall project duration; it is actually based on two statistical rules including additive and central theorem. In addition, critical chain method considers some behaviors that prolong the project duration unnecessarily comprising remove deliberate padding by 50 percent task time estimation; deal with student syndrome by planning the schedule as late as possible; handle date-driven behavior by fostering relay race’ point of view; and eliminate bad multi-tasking and strengthen good multi-tasking instead.
83 Conclusion and suggestion for future research
In addition to many advantages, critical chain method has some pitfalls and challenges include identifying critical chain which is resource dependent and it is not unique in project schedule owing to results of heuristic methods for resource contention removal or resource leveling. Size of buffer is overestimated despite providing enough protection. Time trigger point for action in fever chart is calculated without taking into consideration of risky activities and risky projects. Then it falls short to give early warning for starting preparation of proper plan earlier and consequently, there is not enough time to take on time action.
Buffer sizing
Two buffer calculation methods are mainly discussed in literature. First is 50% of chain (Goldratt) method which is contended, it overestimates the buffer size and consequently prolongs the project duration. Another method is SSQ method which is argued, it underestimates the buffer size and accordingly no adequate protection is provided as well as on time completion is not guaranteed. A heuristic method was proposed by application of time sensitivity indexes. It actually assumes that time sensitivity indexes can give useful information for risky activities and afterward it leads to detect the risky chain and calculation of sensitivity coefficient for each chain of activities. This sensitivity coefficient can be used to adjust the buffer size of both project and feeding buffer generally and specifically it can calibrate the size of buffer associated with chains contain the risky activities. As the proposed method was verified within fictious example, results showed it can solve the problem of overestimation, underestimation, and subjectivity of 50%, SSQ, and bias plus SSQ methods respectively.
Threshold sizing
Time trigger point to action and proper time interval is crucial to give early warning to start planning and take on time action to recover the buffer; hence I suggested two qualitative and quantitative solutions:
Qualitative solution applies risk matrix at both chain and project level and changes set of coefficients for calculating time interval of each region. As the risk matrix result shows more risky project toward yellow and red area, the set of coefficients are altered to put more emphasis on yellow and red regions in fever chart. For instance, when risk matrix is in red area, it is suggested to use set of coefficients 0.1, 0.3, 0.6 to give early warning to start monitoring the problem, preparing a plan for dealing with the problem and afterward, there is enough time to take proper action.
Quantitative solution uses time sensitivity indexes and determines the chain sensitivity through calculation of average of sensitivity amounts for each activity in chain. If the result is below the 30%, it shows low level of risk and initial equivalent coefficients are appropriate. If the result of chain sensitivity is between 30%-60%, there is medium level of risk and set of coefficients number two (0.2, 0.3, 0.5) is suggested. Lastly, if outcome of chain sensitivity shows the amount of higher than 60%, there is high level of risk and set of coefficients number three (0.1,0.3,0.6) is suggested to make the green region in fever chart shorter and make the yellow and red region longer. The main advantage of this method is the systematic
84 Conclusion and suggestion for future research
and structured calculation of level of risk and also it leads to give warning earlier and provide more time to plan and take on time action afterward.
Combination of fast tracking and critical chain method
The second purpose of this research is to incorporate fast tracking method into critical chain method to achieve compressed schedule while it is reliable and additional risks are handled. There is a challenge at the beginning concerning to conflict in resource strategies between two methods, resource leveling to deal with resource constraint versus resource level providing to cope with need of more resources. Critical chain through fostering good behaviors and eliminating bad behaviors makes slow evolving task faster and raises possibility of early freezing the exchanged information in upstream task for transferring to downstream task. Hence, even with limitation of resources, performing overlap between pair of activities can be done, and project duration can be reduced. The main challenge of overlapping activities in critical chain is immediate resource conflict in other activities in project network due to pushing backward the activities. This challenge can be solve by performing another resource leveling, but initial critical chain changes. Such change in critical chain is related to where the overlap is done at project network. The more overlap is performed at the beginning of the chain, the more changes occur in critical chain.
8.2 Results Vs. objectives
Two objectives were defined for this research. First is to find likely waste and defect in process of fast tracking and critical chain methods and explore possible ways of improvement. According to this objective, waste of rework in fast tracking method and two wastes of overproduction and inventory in critical chain were implied. In addition, one defect in buff sizing and uncertainty in providing enough protection to complete the project on time as well as one defect in buffer management and uncertainty for time intervals in fever chart were indicated. Further, research questions one and two were defined based on these wastes and defects (section 1.3). Second objective is to achieve compressed schedule while it is reliable and additional risks are handled. It was a basis to define third research question (section 1.3).
Figure 8-1 depicts the relationship between results and objectives. Arrows with red color indicate suggestions and proposed methods to respond research question number one regarding buffer size and time trigger point in buffer management. Heuristic method based on time sensitivity indexes calibrates buffer size with consideration to risky activities (section 6.5) and two qualitative and quantitative solutions based on risk matrix and time sensitivity indexes adjust time interval in fever chart. (Sections 5.4 and 6.6)
Arrow with green color implies suggestion that gives response to research question number two. An approach was offered based on time sensitivity indexes to mitigate the additional risk of overlapping through choosing low risky rather high risky activities. (Section 6.3)
Finally, arrow with yellow color indicates idea of incorporating fast tracking method and overlapping point of view into critical chain which replies to research question number three and challenges in front of combing two methods. (Chapter 7)
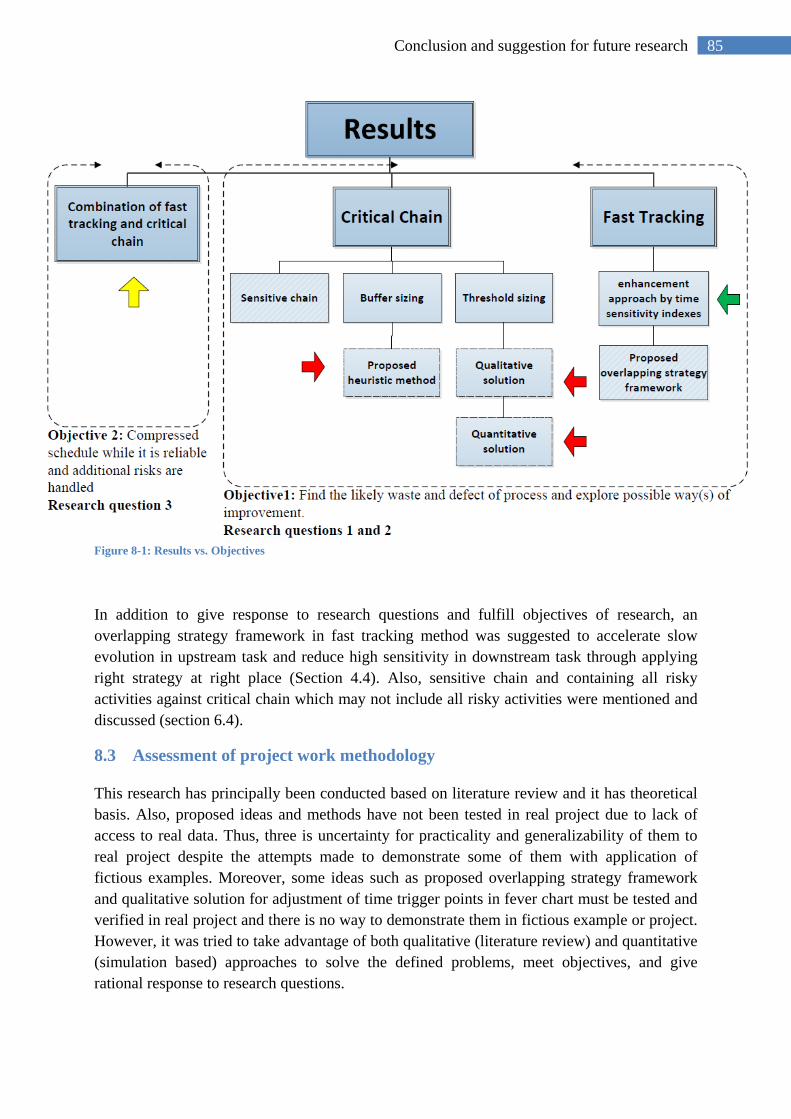
85 Conclusion and suggestion for future research
Figure 8-1: Results vs. Objectives
In addition to give response to research questions and fulfill objectives of research, an overlapping strategy framework in fast tracking method was suggested to accelerate slow evolution in upstream task and reduce high sensitivity in downstream task through applying right strategy at right place (Section 4.4). Also, sensitive chain and containing all risky activities against critical chain which may not include all risky activities were mentioned and discussed (section 6.4).
8.3 Assessment of project work methodology
This research has principally been conducted based on literature review and it has theoretical basis. Also, proposed ideas and methods have not been tested in real project due to lack of access to real data. Thus, three is uncertainty for practicality and generalizability of them to real project despite the attempts made to demonstrate some of them with application of fictious examples. Moreover, some ideas such as proposed overlapping strategy framework and qualitative solution for adjustment of time trigger points in fever chart must be tested and verified in real project and there is no way to demonstrate them in fictious example or project. However, it was tried to take advantage of both qualitative (literature review) and quantitative (simulation based) approaches to solve the defined problems, meet objectives, and give rational response to research questions.
86 Conclusion and suggestion for future research
8.4 Pros and cons of results and findings
Figure 8-1 illustrates the classification of all findings and results in this research as well as depicts a holistic picture for relationship among objectives, research questions and results. In following I am going to talk about general pros and cons of suggestions and proposed methods.
Proposed overlapping strategy framework reduces the complexity of previous enhanced overlapping strategy framework which results in taking longer time to create; on the other hand, it provides more insight in comparison to basic overlapping strategy framework to apply right strategy at right place.
Enhanced approach to overlapping strategy with application of time sensitivity can help decision maker to select low risky rather high risky activities at the beginning which can lead to mitigate the additional risk of overlapping as well. One limitation of this approach is incapability of assessing probable consequences.
Both qualitative and quantitative solutions for adjusting time trigger points in fever chart can help project manager to give early warning sooner and provides more time to plan and take on time action for recovering the buffer. Qualitative solution is subjective due to application of risk matrix while quantitative solution is structured and systematic due to application of time sensitivity indexes.
Main advantages of Heuristic method for calculation of buffer size is systematic calculation based on time sensitivity indexes and providing proper protection for project schedule based on risky activities. In addition, it can solve challenges associated with previous methods in literature regarding overestimation, underestimation, subjectivity, and local optimization.
Sensitive chain and putting more emphasis on risky activities either by placing them on critical chain or providing enough protection through proper buffer size can help project manager to consider such pitfall of critical chain as well.
Combination of both fast tracking and critical chain methods can lead to compress the schedule through overlapping the activities in critical chain. On other hand, the buffer in critical chain method can handle the risk and common-cause variation of project as well as especial-cause variation of overlapping. It should be taken into account that performs overlap between activities in critical chain is not easy due to resource dependency of activities and it may cause to widespread disorder in project schedule as well as change in critical chain.
8.5 Suggestion for future research
I would like to suggest some proposals for future work:
1. Whereas all proposed ideas, methods are theoretical basis and they were not tested in real project, hence next work is to put into practice all introduced and proposed methods in real project.

87 Conclusion and suggestion for future research
2. Application of time sensitivity indexes to fast tracking method was mentioned. One drawback of this approach is incapability to show us the consequence of overlapping after selecting two low risky activities. Thus, the next work can be focused in this area and finding way(s) for assessing possible consequences.
3. Idea of mitigating overlapping risk by application of time sensitivity can be generalized to critical chain too and probable outcome and improvement can be assessed.
4. Earned value management and buffer management are two methods with different approaches to control the project, thus compare two methods in terms of similarities and differences as well as pros and cons can be a fertile area for further work.
88 Reference
9 Reference ALHOMADI, A. A., DEHGHAN, R. & RUWANPURA, J. Y. 2011. The Predictability of
Fast-Track Projects. Procedia Engineering, 14, 1966-1972. ASHTIANI, B., JALALI, G.-R., ARYANEZHAD, M.-B. & MAKUI, A. A new approach for
buffer sizing in critical chain scheduling. Industrial Engineering and Engineering Management, 2007 IEEE International Conference on, 2007. IEEE, 1037-1041.
BAKER, A. & BOYD, K. 1983. Fast-tracking for nuclear power plant construction. International Journal of Project Management, 1, 148-154.
BOGUS, S., DIEKMANN, J., MOLENAAR, K., HARPER, C., PATIL, S. & LEE, J. 2011. Simulation of Overlapping Design Activities in Concurrent Engineering. Journal of Construction Engineering and Management, 137, 950-957.
BOGUS, S. M., MOLENAAR, K. R. & DIEKMANN, J. E. 2005. Concurrent engineering approach to reducing design delivery time. Journal of construction engineering and management, 131, 1179-1185.
BOGUS, S. M., MOLENAAR, K. R. & DIEKMANN, J. E. 2006. Strategies for overlapping dependent design activities. Construction Management and Economics, 24, 829-837.
BRANNEN, J. 1995. Mixing methods: qualitative and quantitative research, Aldershot, Hants, Avebury.
BUI, Y. N. 2009. How to write a master's thesis, Thousand Oaks, Calif., Sage. CHO, J. G. & YUM, B. J. 1997. An uncertainty importance measure of activities in PERT
networks. International Journal of Production Research, 35, 2737-2758. COX, J. F. & SCHLEIER, J. G. 2010. Theory of constraints handbook, New York, McGraw-
Hill. EASTHAM, G. 2002. The fast track manual, Loughborough, European Construction Institute. ELDIN, N. N. 1997. Concurrent engineering: A schedule reduction tool. Journal of
Construction Engineering and Management, 123, 354-362. ELMAGHRABY, S., FATHI, Y. & TANER, M. 1999. On the sensitivity of project
variability to activity mean duration. International Journal of Production Economics, 62, 219-232.
ELMAGHRABY, S. E. 2000. On criticality and sensitivity in activity networks. European Journal of Operational Research, 127, 220-238.
GOLDRATT, E. M. 1990. Theory of Constraints: What is this thing called the Theory of Constraints and how should it be implemented. Croton-on-Hudson, North River, New York.
GRÈZE, L., PELLERIN, R., LECLAIRE, P. & PERRIER, N. 2012. A Heuristic Method for Resource-Constrained Project Scheduling with Activity Overlapping.
HERROELEN, W. & LEUS, R. 2001. On the merits and pitfalls of critical chain scheduling. Journal of Operations Management, 19, 559-577.
HERROELEN, W., LEUS, R. & DEMEULEMEESTER, E. 2002. Critical chain project scheduling-Do not oversimplify. Project Management Journal, 33, 46-60.
HOSSAIN, M., CHUA, D. & LIU, Z. 2012. Optimizing Concurrent Execution of Design Activities with Minimum Redesign. Journal of Computing in Civil Engineering, 26, 409-420.
HULETT, D. 2009. Practical schedule risk analysis, Surrey, Gower. JERGEAS, G. 2008. Analysis of the front‐end loading of Alberta mega oil sands projects.
Project Management Journal, 39, 95-104. JUGULUM, R. & SAMUEL, P. 2010. Design for lean six sigma: A holistic approach to
design and innovation, Wiley.
89 Reference
KHOUEIRY, Y., SROUR, I. & YASSINE, A. An Optimization Model for Maximizing the Benefits of Fast-tracking Construction Projects. Construction Research Congress 2012@ sConstruction Challenges in a Flat World, 2012. ASCE, 247-257.
KHOUEIRY, Y., SROUR, I. & YASSINE, A. 2013. An optimization-based model for maximizing the benefits of fast-track construction activities. Journal of the Operational Research Society.
KOTHARI, C. 2009. Research methodology: methods and techniques, New Age International.
KRISHNAN, V., EPPINGER, S. D. & WHITNEY, D. E. 1997. A model-based framework to overlap product development activities. Management science, 43, 437-451.
LAUFER, A. & COHENCA, D. 1990. Factors affecting construction-planning outcomes. Journal of Construction Engineering and Management, 116, 135-156.
LEACH, L. P. 1999. Critical chain project management improves project performance. Project Management Journal, 30, 39-51.
LEACH, L. P. 2005. Critical chain project management, Boston, Artech House. LI, K. & CHEN, Y.-X. Applying critical chain in project scheduling and estimating buffer
size based on fuzzy technique. Industrial Engineering and Engineering Management, 2007 IEEE International Conference on, 2007. IEEE, 1068-1072.
LOCH, C. H. & TERWIESCH, C. 1998. Communication and uncertainty in concurrent engineering. Management Science, 44, 1032-1048.
MICHALAK, C. 1997. The cost of chasing unrealistic project schedules. Transactions of the American Association of Cost Engineers.
MILES, R. S. 1997. Ultra fast-track project delivery: 21st century partnering and the role of ADR. Lean Construction, 311-33.
MIN, Z. & RONGQIU, C. Buffer sized technique in critical chain management: a fuzzy approach. Wireless Communications, Networking and Mobile Computing, 2008. WiCOM'08. 4th International Conference on, 2008. IEEE, 1-4.
MORRIS, P. W. & PINTO, J. K. 2004. The Wiley guide to managing projects, Wiley Online Library.
NEUENDORF, S. 2004. Six sigma for project managers, Vienna, Va., Management Concepts.
NEWBOLD, R. C. 1998. Project management in the fast lane: applying the theory of constraints, Boca Raton, Fla., St. Lucie Press.
PARK, M. 1999. Robust control of cost impact on fast-tracking building construction projects. Massachusetts Institute of Technology.
PENA-MORA, F. & LI, M. 2001. Dynamic planning and control methodology for design/build fast-track construction projects. Journal of construction engineering and management, 127, 1-17.
PENA-MORA, F. & PARK, M. 2001. Dynamic planning for fast-tracking building construction projects. Journal of construction engineering and management, 127, 445-456.
PMI 2013. A guide to the project management body of knowledge : (PMBOK guide), Atlanta, Project Management Institute.
PRASAD, B. 1996. Concurrent engineering fundamentals: integrated product and process development. v. 1. New Jersey, Prentice Hall.
RAND, G. K. 2000. Critical chain: the theory of constraints applied to project management. International Journal of Project Management, 18, 173-177.
ROLSTADÅS, A. 1995. Planning and control of concurrent engineering projects. International Journal of Production Economics, 38, 3-13.
SHI, Q. & GONG, T. An improved project buffer sizing approach to critical chain management under resources constraints and fuzzy uncertainty. Artificial Intelligence
90 Reference
and Computational Intelligence, 2009. AICI'09. International Conference on, 2009. IEEE, 486-490.
SHOU, Y. & YAO, K. Estimation of project buffers in critical chain project management. Management of Innovation and Technology, 2000. ICMIT 2000. Proceedings of the 2000 IEEE International Conference on, 2000. IEEE, 162-167.
SROUR, I. M., ABDUL-MALAK, M.-A. U., YASSINE, A. A. & RAMADAN, M. 2013. A methodology for scheduling overlapped design activities based on dependency information. Automation in Construction, 29, 1-11.
STEYN, H. 2001. An investigation into the fundamentals of critical chain project scheduling. International Journal of Project Management, 19, 363-369.
TUKEL, O. I., ROM, W. O. & EKSIOGLU, S. D. 2006. An investigation of buffer sizing techniques in critical chain scheduling. European Journal of Operational Research, 172, 401-416.
TURNER, J. R. 1999. The handbook of project-based management, McGraw-Hill London. VANHOUCKE, M. 2009. Measuring time: improving project performance using earned
value management, Boston, Springer. WILLIAMS, G. V. 1995. Fast track pros and cons: Considerations for industrial projects.
Journal of Management in Engineering, 11, 24-32. WILLIAMS, T. 1992. Criticality in stochastic networks. Journal of the Operational Research
Society, 353-357. WOEPPEL, M. J. 2006. Projects in less time: a synopsis of critical chain, Plano, Texas,
Pinnacle strategies. YANG, L., FU, Y., LI, S., HUANG, B. & TAO, P. A buffer sizing approach in critical chain
scheduling with attributes dependent. Wireless Communications, Networking and Mobile Computing, 2008. WiCOM'08. 4th International Conference on, 2008. IEEE, 1-4.
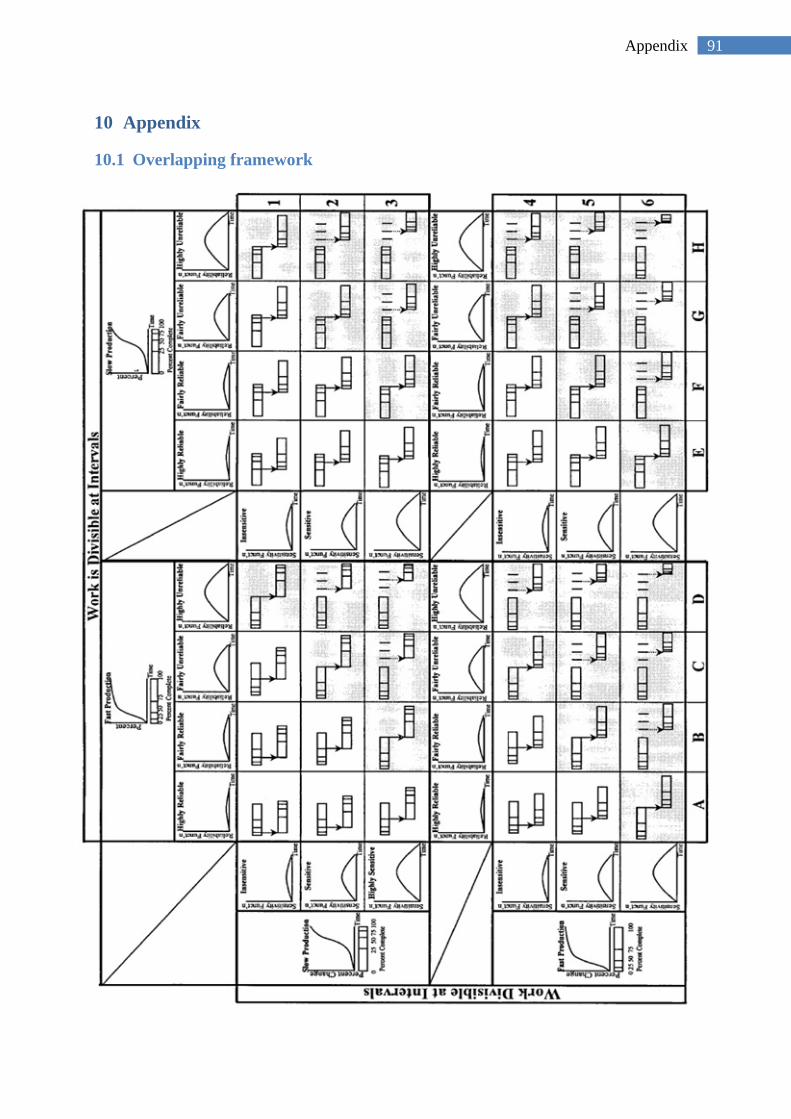
91 Appendix
10 Appendix
10.1 Overlapping framework
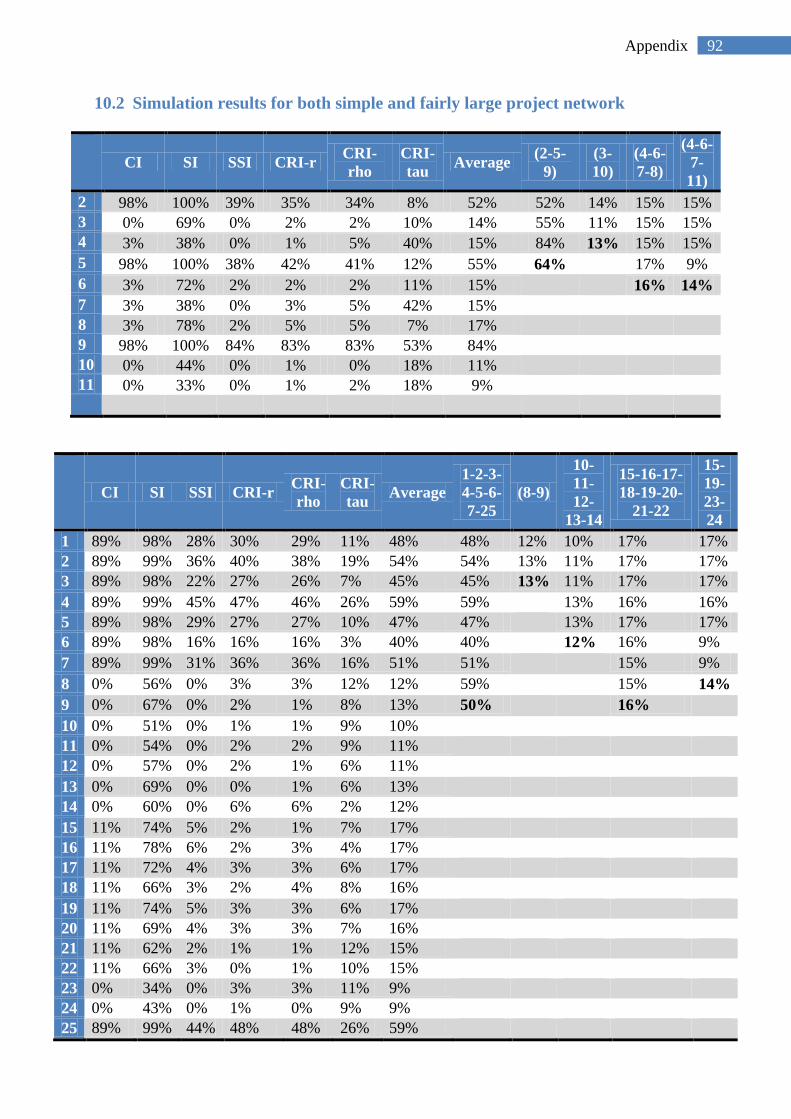
92 Appendix
10.2 Simulation results for both simple and fairly large project network
CI SI SSI CRI-r CRI-
rho CRI-tau Average (2-5-
9) (3-10)
(4-6-7-8)
(4-6-7-11)
2 98% 100% 39% 35% 34% 8% 52% 52% 14% 15% 15% 3 0% 69% 0% 2% 2% 10% 14% 55% 11% 15% 15% 4 3% 38% 0% 1% 5% 40% 15% 84% 13% 15% 15% 5 98% 100% 38% 42% 41% 12% 55% 64% 17% 9% 6 3% 72% 2% 2% 2% 11% 15% 16% 14% 7 3% 38% 0% 3% 5% 42% 15% 8 3% 78% 2% 5% 5% 7% 17% 9 98% 100% 84% 83% 83% 53% 84% 10 0% 44% 0% 1% 0% 18% 11% 11 0% 33% 0% 1% 2% 18% 9%
CI SI SSI CRI-r CRI-rho
CRI-tau Average
1-2-3-4-5-6-7-25
(8-9)
10-11-12-
13-14
15-16-17-18-19-20-
21-22
15-19-23-24
1 89% 98% 28% 30% 29% 11% 48% 48% 12% 10% 17% 17% 2 89% 99% 36% 40% 38% 19% 54% 54% 13% 11% 17% 17% 3 89% 98% 22% 27% 26% 7% 45% 45% 13% 11% 17% 17% 4 89% 99% 45% 47% 46% 26% 59% 59% 13% 16% 16% 5 89% 98% 29% 27% 27% 10% 47% 47% 13% 17% 17% 6 89% 98% 16% 16% 16% 3% 40% 40% 12% 16% 9% 7 89% 99% 31% 36% 36% 16% 51% 51% 15% 9% 8 0% 56% 0% 3% 3% 12% 12% 59% 15% 14% 9 0% 67% 0% 2% 1% 8% 13% 50% 16% 10 0% 51% 0% 1% 1% 9% 10% 11 0% 54% 0% 2% 2% 9% 11% 12 0% 57% 0% 2% 1% 6% 11% 13 0% 69% 0% 0% 1% 6% 13% 14 0% 60% 0% 6% 6% 2% 12% 15 11% 74% 5% 2% 1% 7% 17% 16 11% 78% 6% 2% 3% 4% 17% 17 11% 72% 4% 3% 3% 6% 17% 18 11% 66% 3% 2% 4% 8% 16% 19 11% 74% 5% 3% 3% 6% 17% 20 11% 69% 4% 3% 3% 7% 16% 21 11% 62% 2% 1% 1% 12% 15% 22 11% 66% 3% 0% 1% 10% 15% 23 0% 34% 0% 3% 3% 11% 9% 24 0% 43% 0% 1% 0% 9% 9% 25 89% 99% 44% 48% 48% 26% 59%
93 Appendix
10.3 Pre study report
Introduction
Shrinking the time and doing the work in less time is appealing. It is even more attractive for companies and project managers where project is addressed. Many benefits can be reaped by accelerating project pace and reducing project duration. The first and foremost one which is providing more stimulus is “monetary value”. In fact, a huge amount of blocked money is released and generating profit embarks early. At higher level of decision making, it impacts on devising strategy of organization and selecting portfolio of projects as well as boosting productivity.
Shortening project life cycle is not an easy work; it is not a dream will become true all of a sudden. It entails overcoming several challenges and overseeing possible consequences that are main objectives of this research. According to PMI (2013), although projects are unique and they are seeking to achieve specific goal, but they are bounded in generic lifecycle structure. Four main phases are proposed for project lifecycle and these are starting, organizing and preparing, carrying out, and closing the project respectively. When shortening the project lifecycle comes into question, deep appreciation of types of project life cycle- predictive, iterative and incremental, or adaptive- project phases, theories and approaches in literature that address to time reduction, and making rational connection between them is first challenge.
Another issue or concern should be given special importance is the plausible influence of reducing the time on other project constraints like cost and quality in specific manner. Shrinking the time is not free of charge and imposes extra expenses to project even if project is in conceptualization, planning or completion phase -not execution phase that major costs are incurred. In fact, as the project progresses throughout the time, cost of project increases incrementally from conceptualization to execution phase and afterward at completion phase due to lowering the allotted resources it decreases gradually; it is a typical mapping of project costs curve against time while sometimes project needs considerable expenditures at early phase. Typically, magnitude of effect and consequence of imposed costs are various from one phase to another phase. Evaluating the influence and consequence of cost as well as offering measures for mitigating negative impact of them when time is shortened in different phases of project are another part of this research.
Additionally, quality is a concrete part of project triple constraints. When time is shrunk and imposed cost is compromised, quality is another concern that should be taken into account. If quality is impaired, it has after-effect owing to its direct relation to customer expectations and deliverables. Hence, proactive action should be taken to maintain or improve the quality of project in the eyes of stakeholders. Assessing project quality while time and cost are changed is another part of this research.
94 Appendix
Objective of research
Objectives of this research are divided into minor and major.
Major objectives include putting forward recommendations with regard to shortening the project duration without negative consequences for cost and quality. It might be mapped in form of structured steps or a framework accompanied by outlining a plan for testing it in real-life projects.
Minor objectives comprises firstly, conduct a literature review of existing theories and approaches for shortening the project duration along with discussing literatures about the relationship between time, cost, and quality. Secondly, apply a systematic analysis of effect of cost and quality in different project stages while project duration is shortened by deploying different techniques and approaches.
Initial research question
Following key questions are sought to be answered in this research:
1. What are the possible ways of shortening project duration? 2. How project life cycle is shrunk? 3. How does shortening duration of project exert influence on shrinking life cycle of
project? 4. What are the consequences of reducing time of project on other project constraints
specifically cost and quality? 5. Is it possible to reduce time of project without encountering with negative cost and
quality consequences?
Thesis schedule
This is a master thesis assignment with definite beginning and end and it is seeking to achieve unique outcome, thus, it is worth to be treated as a project. It is also important to be finished and to be delivered on time and, of course, on quality. To meet the final goal, a project plan has been prepared and it has been tried the knowledge gained form previous semester is applied to improve it. Four main phases are supposed for this project – initiation, planning, execution, and completion. Five project management processes are also embodied in plan:
• Initiating— formulating problem, defining objective, detecting requirements • Planning—scheduling of needful activities • Executing— performing literature review, analysis and discussion • Monitoring and controlling— meeting with supervisors and receiving valuable
feedbacks • Closing— writing conclusion , abstract, preface as well as proofreading and polishing
up the report
Initiation and planning phases are proposed to be run simultaneously due to problem definition, requirements identification and general plan of work should be accomplished by
95 Appendix
4th of February—three weeks after receiving the assignment. To formulate the problem, rule of SMART—specific, measurable, attainable, relevant, and time-bounded— is worth to be considered. Besides being specific and measurable, the attainable, relevant and time-bounded characteristics of defined problems should be given especial importance. Problems in this project refer to research questions which should be answered, thus they should be tangible; they should be feasible and realistic; they should be defined in a proper way that satisfy the objective and goal of research; and ultimately limitation of time should be paid attention.
Another issue is identification of requirements. In the concept of research project, requirement might be defined as finding relevant articles or books in literature to produce the innovative idea and gathering data from real life to test and support the idea.
Next step is preparing a schedule plan to meet the goal of project. Whereas time and quality are much more highlighted than cost in this project, thus, some issues are taken into account to not only accelerate the pace of the project, but also manage the iteration, keep the quality of work at the desirable level, and decrease the uncertainty of facing with time overrun at the end. They are mentioned as below:
1. Running initiation and planning phases concurrently 2. Literature review and data collection are planned simultaneously and they have
overlap with activity of looking for complementary literature list. 3. Performing analysis and discussion, writing conclusion, abstract, preface and
proofreading and polishing up the report are overlapped with their upstream activities. 4. To reduce the impact of iteration and rework, fortnightly meeting with supervisors are
proposed by the time one month remains to submit the report. Afterward, contact with supervisors will be getting closer and meeting will change from fortnightly to weekly until the final deadline. In my opinion, it can be helpful to turn the work back to the track whenever it is moving off the track.
5. Another remedy for reducing iteration and rework is submitting report to supervisors gradually. It means rather than hand in complete report at end, it should be sent to them step by step for receiving comments. Therefore, if there is a variation in work, it requires low efforts to be corrected and it does not have catastrophic consequence at the end.
6. To reduce the uncertainty of slippage in schedule, one month buffer is proposed. Hence, if any unexpected event will happen, there is time to compensate it.
7. An activity called ad-hoc meeting is embedded in schedule. It actually acts as a project management activity throughout the project from outset to termination.
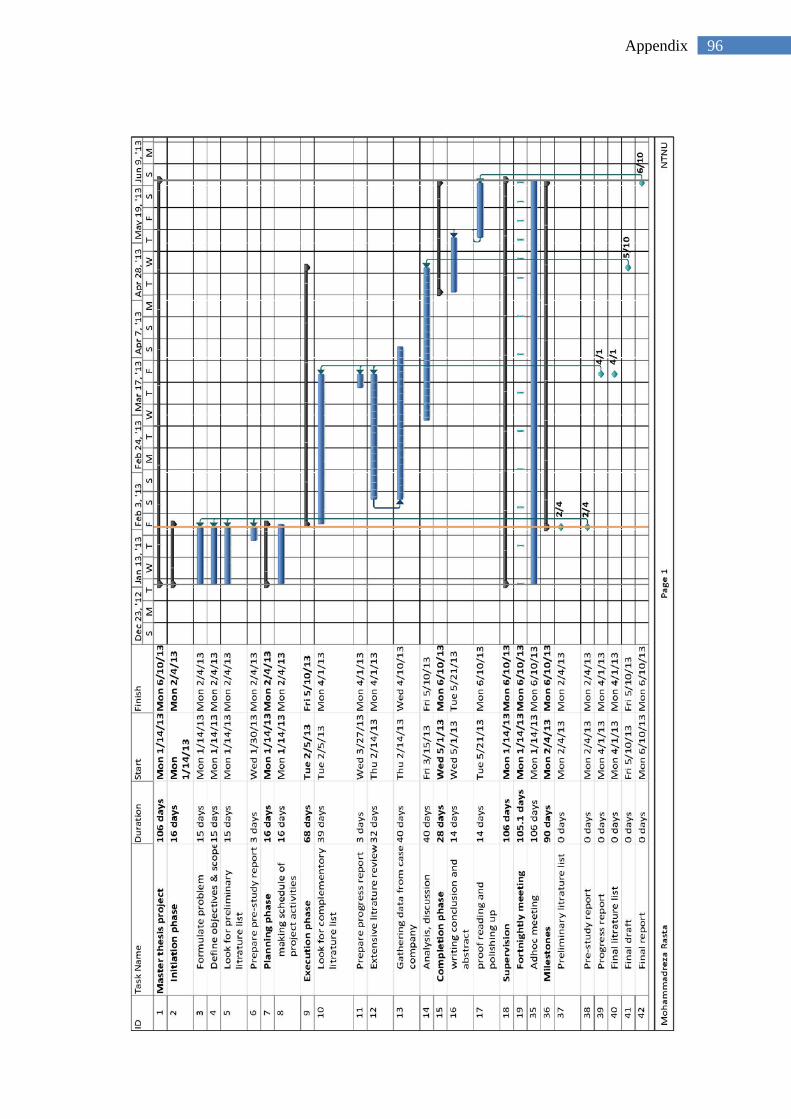
96 Appendix

97 Appendix