project duration forecasting - earned schedule europe 2009 project duration...es project duration...
TRANSCRIPT

ES
Project Duration Forecastinga comparison of EVM methods to ESWalt LipkePMI - Oklahoma City Chapter+1 405 364 [email protected]
14.216.4
23.1
27.7
4.6
14.413.8
22.4
26.3
4.0
15.315.2
23.3
17.3
1.6
15.815.8
23.9
15.6
1.4
0
10
20
30
Standard Deviation
10% - 100% 25% - 100% 50% - 100% 75% - !00%
Percent Complete
Comparison of Forecasting ConvergenceProject #13
PVav Var EVav Var PVlp Var EVlp Var ES Var

ES
EVA Europe 2009Copyright Lipke 2009 2
Abstract
EVM methods for forecasting project duration are generally accepted practice, yet they have not been well studied as to their predictive capability.
Using real project data, four EVM methods are examined and compared to the Earned Schedule prediction technique.

ES
EVA Europe 2009Copyright Lipke 2009 3
Overview
Introduction EVM & ES Duration Forecasting Discussion of Methods & Considerations Study Hypothesis & Methodology Data Description Results & Analysis Summary & Conclusions
ES
EVA Europe 2009Copyright Lipke 2009 4
Introduction
Earned Schedule introduced in 2003 Time-based indicators for schedule
ES extended to duration forecasting in 2004 Two efforts explored the capability of ES
forecasting Case study of US Navy project Comprehensive examination of two EVM-based
methods and ES using simulation
ES
EVA Europe 2009Copyright Lipke 2009 5
Introduction
“The results ..confirm ..that the ES method outperforms, on average, the other forecasting methods” - Vanhoucke & Vandevoorde
Results are supportive of ES, but there are lingering questions Does simulation, albeit comprehensive, truly
represent real project circumstances? Is broad validation possible from the single case study
and other sporadic application results?

ES
EVA Europe 2009Copyright Lipke 2009 6
Introduction
Results for ES have been studied to some degree …but traditional EVM forecasting methods have not
To bridge these gaps, the forecasting capabilities of four EVM duration forecasting methods are compared to the results for ES using data from 16 projects

ES
EVA Europe 2009Copyright Lipke 2009 7
EVM & ES Duration Forecasting Four EVM duration forecasting techniques have
been commonly applied for 40 years The EVM methods have the basic form
Duration Forecast = Elapsed Time + Forecast for Work Remaining
IEAC(t) = AT + (BAC – EV) / Work Rate Four Work Rates –
Average Planned Value: PVav = PVcum / n Average Earned Value: EVav = EVcum / n Current Period Planned Value: PVlp Current Period Earned Value: EVlp

ES
EVA Europe 2009Copyright Lipke 2009 8
EVM & ES Duration Forecasting
$$
5
Planned Value
Earned Value
71 2 3 4 6 8 9 10
EarnedSchedule
Time Periods
PVcum
EVcum=
Actual Time
The ES idea is to determine the time at which the EV accrued should have occurred.
Time based schedule performance efficiency: SPI(t) = ES / AT
ES
EVA Europe 2009Copyright Lipke 2009 9
EVM & ES Duration Forecasting Final cost forecast from EVM – IEAC = BAC / CPI
Similarly final duration is forecast using ES – IEAC(t) = PD / SPI(t)
where PD is the planned duration of the project

ES
EVA Europe 2009Copyright Lipke 2009 10
Methods & Considerations
The EVM methods have mathematical failings When a project executes past its planned
duration – PVcum = BAC and increases no further PVav = BAC / m …where m is larger than N, the
number of periods of the plan As m increases, PVav decreases causing forecast for
work remaining to be longer than its planned time
ES
EVA Europe 2009Copyright Lipke 2009 11
Methods & Considerations
When a project executes past its planned duration – For PVlp no periodic values exist beyond the PD Calculation of IEAC(t) is indeterminate These periods are excluded from the analysis …the
earlier forecasts may be good Desire is to allow each method to show well, despite
its limitations
ES
EVA Europe 2009Copyright Lipke 2009 12
Methods & Considerations
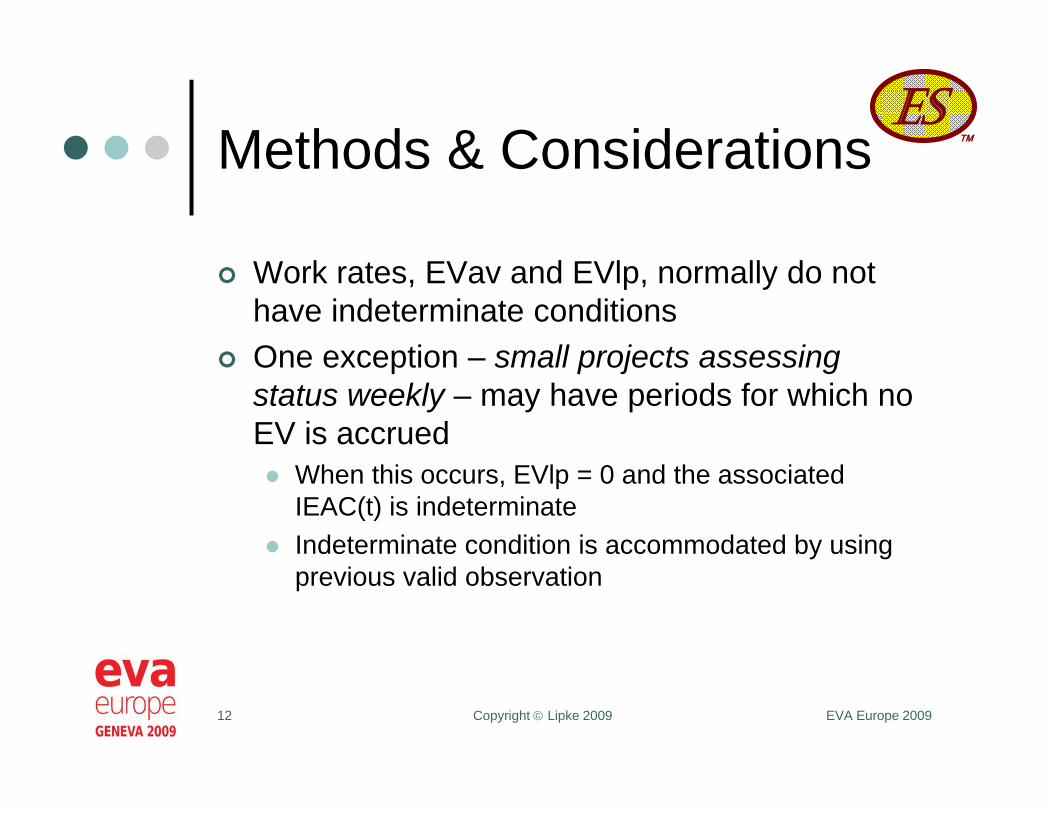
Work rates, EVav and EVlp, normally do not have indeterminate conditions
One exception – small projects assessing status weekly – may have periods for which no EV is accrued When this occurs, EVlp = 0 and the associated
IEAC(t) is indeterminate Indeterminate condition is accommodated by using
previous valid observation
ES
EVA Europe 2009Copyright Lipke 2009 13
Methods & Considerations
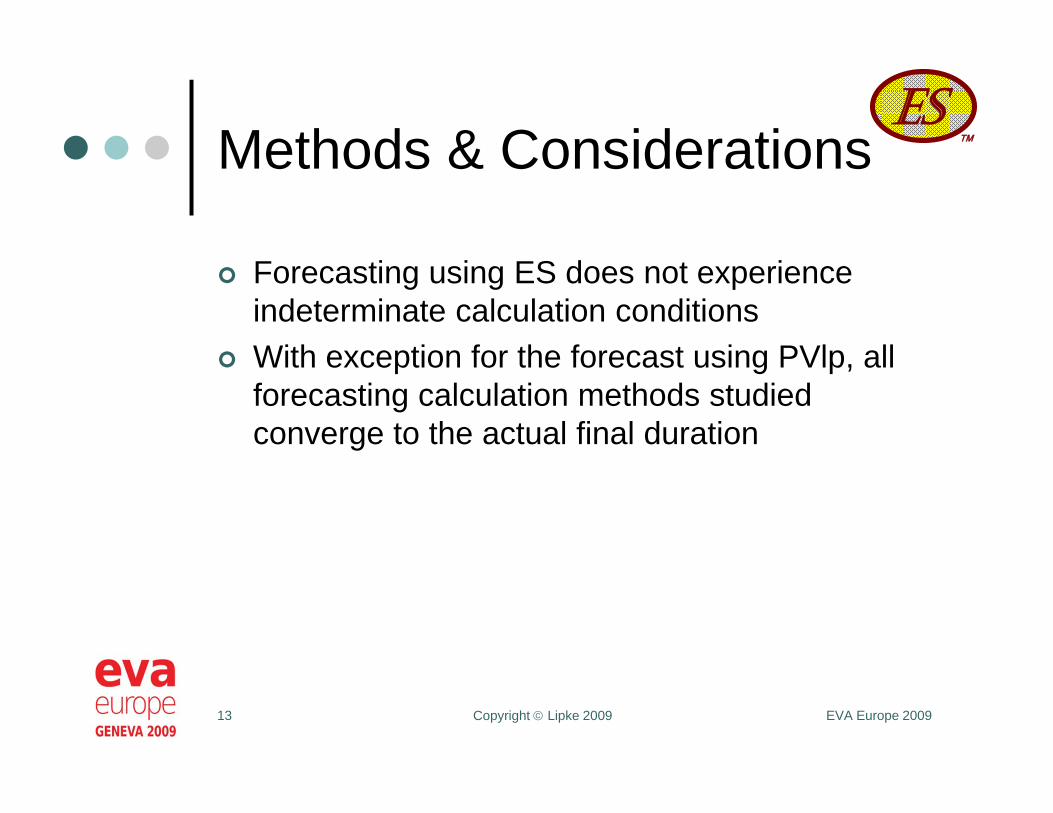
Forecasting using ES does not experience indeterminate calculation conditions
With exception for the forecast using PVlp, all forecasting calculation methods studied converge to the actual final duration

ES
EVA Europe 2009Copyright Lipke 2009 14
Study Hypothesis & Methodology The Earned Schedule method for forecasting
final duration is believed to be better than the four traditional EVM methods
The test for the conjecture is constructed to show that the aggregate of the EVM methods produce better forecasts than does ES If EVM methods prove superior, further examination is
necessary to identify which method is applicable for a set of conditions
ES
EVA Europe 2009Copyright Lipke 2009 15
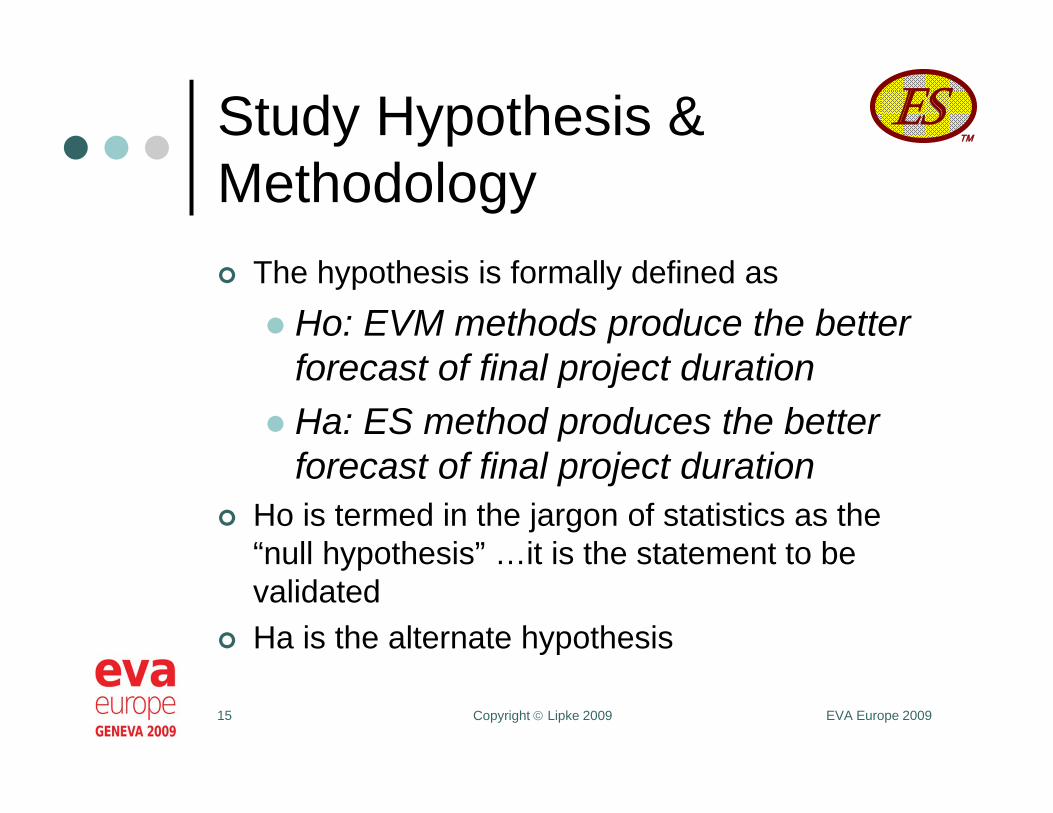
Study Hypothesis & Methodology The hypothesis is formally defined as Ho: EVM methods produce the better
forecast of final project duration Ha: ES method produces the better
forecast of final project duration Ho is termed in the jargon of statistics as the
“null hypothesis” …it is the statement to be validated
Ha is the alternate hypothesis
ES
EVA Europe 2009Copyright Lipke 2009 16
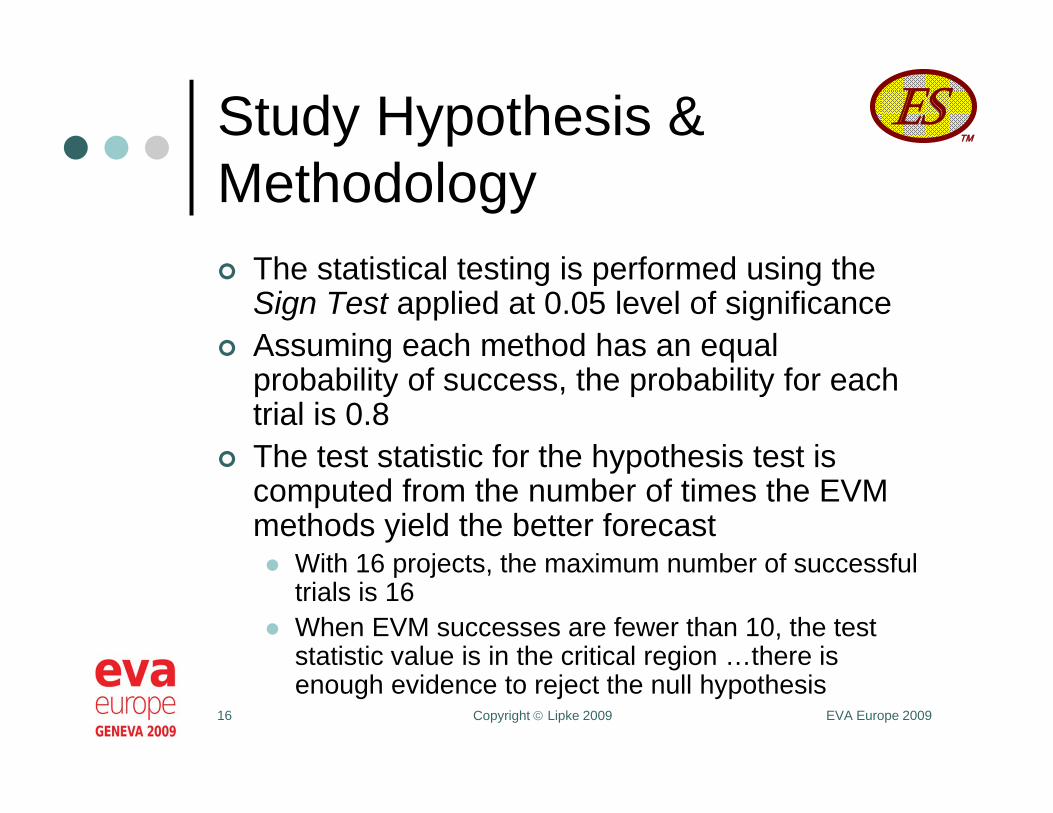
Study Hypothesis & Methodology The statistical testing is performed using the
Sign Test applied at 0.05 level of significance Assuming each method has an equal
probability of success, the probability for each trial is 0.8
The test statistic for the hypothesis test is computed from the number of times the EVM methods yield the better forecast With 16 projects, the maximum number of successful
trials is 16 When EVM successes are fewer than 10, the test
statistic value is in the critical region …there is enough evidence to reject the null hypothesis

ES
EVA Europe 2009Copyright Lipke 2009 17
Study Hypothesis & Methodology The test statistic is determined from the ranking
of the standard deviation for each of the five methods Standard deviation is computed from the variation
between forecast values and the actual final duration Smallest standard deviation is ranked “1”
…largest is “5” Number of times the EVM methods are ranked “1”
without ties determines the test statistic value The ranking approach normalizes the differences in
time units between projects
ES
EVA Europe 2009Copyright Lipke 2009 18
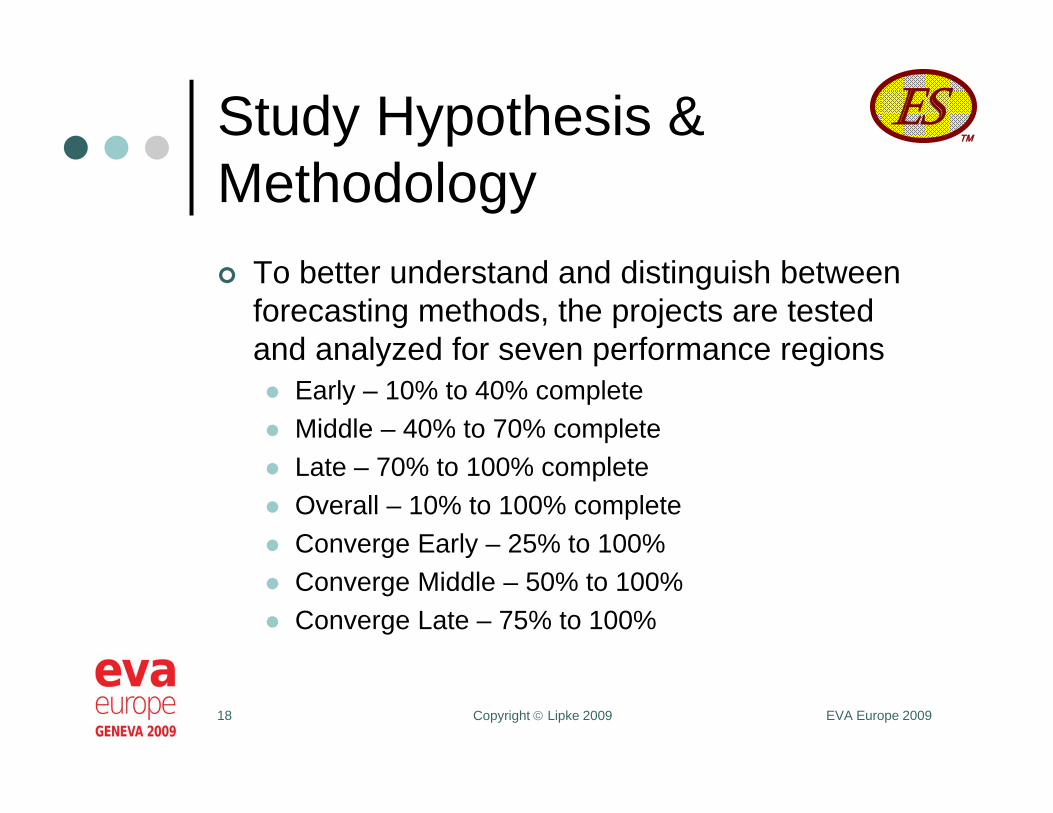
Study Hypothesis & Methodology To better understand and distinguish between
forecasting methods, the projects are tested and analyzed for seven performance regions Early – 10% to 40% complete Middle – 40% to 70% complete Late – 70% to 100% complete Overall – 10% to 100% complete Converge Early – 25% to 100% Converge Middle – 50% to 100% Converge Late – 75% to 100%
ES
EVA Europe 2009Copyright Lipke 2009 19
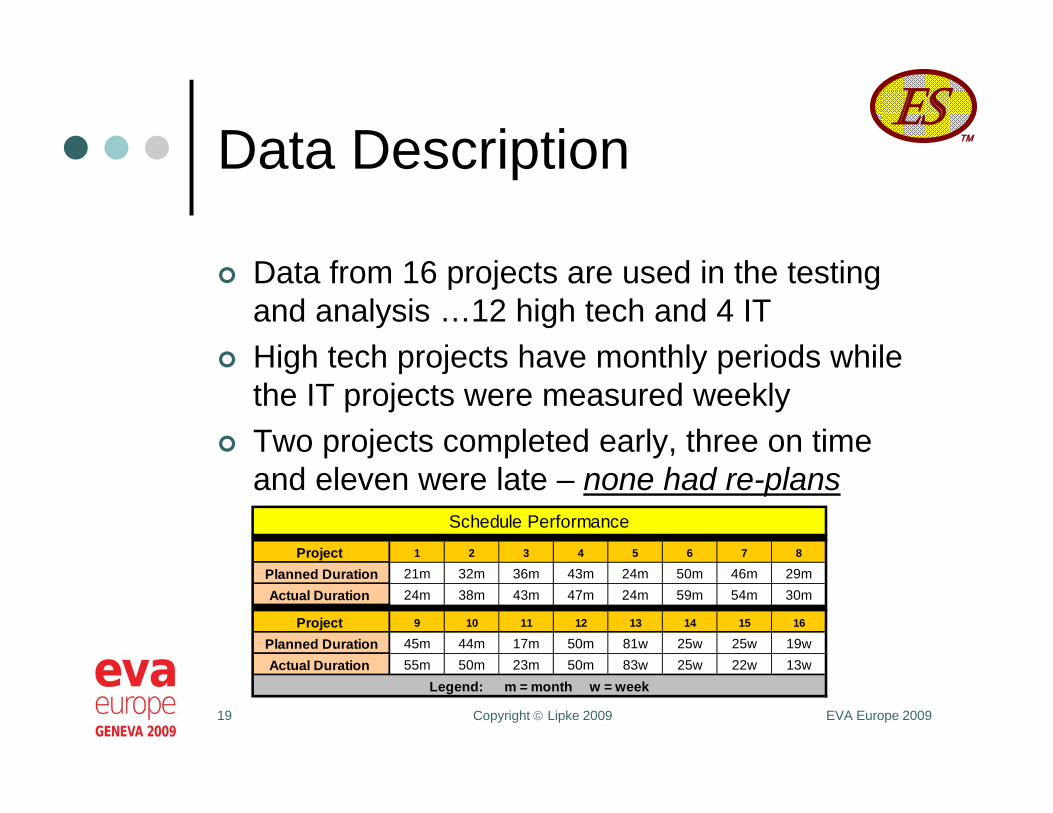
Data Description
Data from 16 projects are used in the testing and analysis …12 high tech and 4 IT
High tech projects have monthly periods while the IT projects were measured weekly
Two projects completed early, three on time and eleven were late – none had re-plans
Schedule Performance
Project 1 2 3 4 5 6 7 8
Planned Duration 21m 32m 36m 43m 24m 50m 46m 29mActual Duration 24m 38m 43m 47m 24m 59m 54m 30m
Project 9 10 11 12 13 14 15 16
Planned Duration 45m 44m 17m 50m 81w 25w 25w 19wActual Duration 55m 50m 23m 50m 83w 25w 22w 13w
Legend: m = month w = week
ES
EVA Europe 2009Copyright Lipke 2009 20
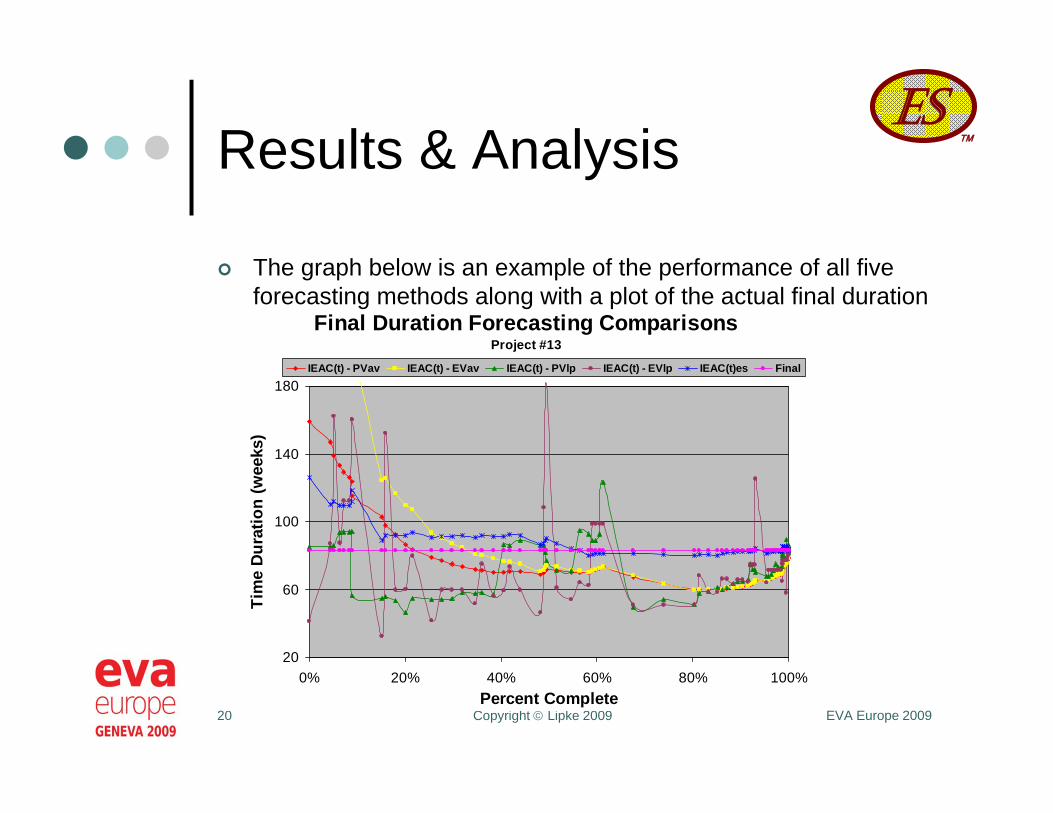
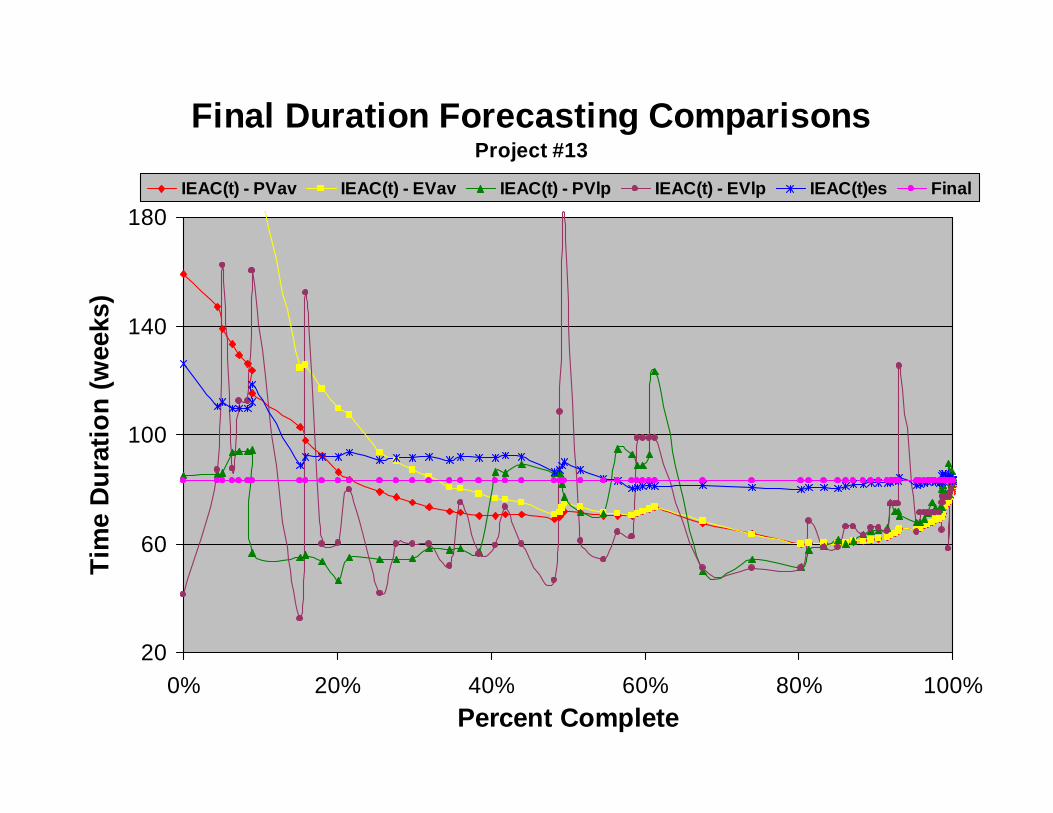
Results & Analysis
The graph below is an example of the performance of all five forecasting methods along with a plot of the actual final duration
Final Duration Forecasting ComparisonsProject #13
20
60
100
140
180
0% 20% 40% 60% 80% 100%Percent Complete
Tim
e D
urat
ion
(wee
ks)
IEAC(t) - PVav IEAC(t) - EVav IEAC(t) - PVlp IEAC(t) - EVlp IEAC(t)es Final

ES
EVA Europe 2009Copyright Lipke 2009 21
Results & Analysis
Forecast characteristics observed – PVlp and EVlp work rates produce volatile
results PVav and EVav work rates are smoother ES forecast is much better, especially after
40% complete …after 60% the forecast is very close to the final duration
22
Final Duration Forecasting ComparisonsProject #13
20
60
100
140
180
0% 20% 40% 60% 80% 100%Percent Complete
Tim
e D
urat
ion
(wee
ks)
IEAC(t) - PVav IEAC(t) - EVav IEAC(t) - PVlp IEAC(t) - EVlp IEAC(t)es Final
ES
EVA Europe 2009Copyright Lipke 2009 23
Results & Analysis
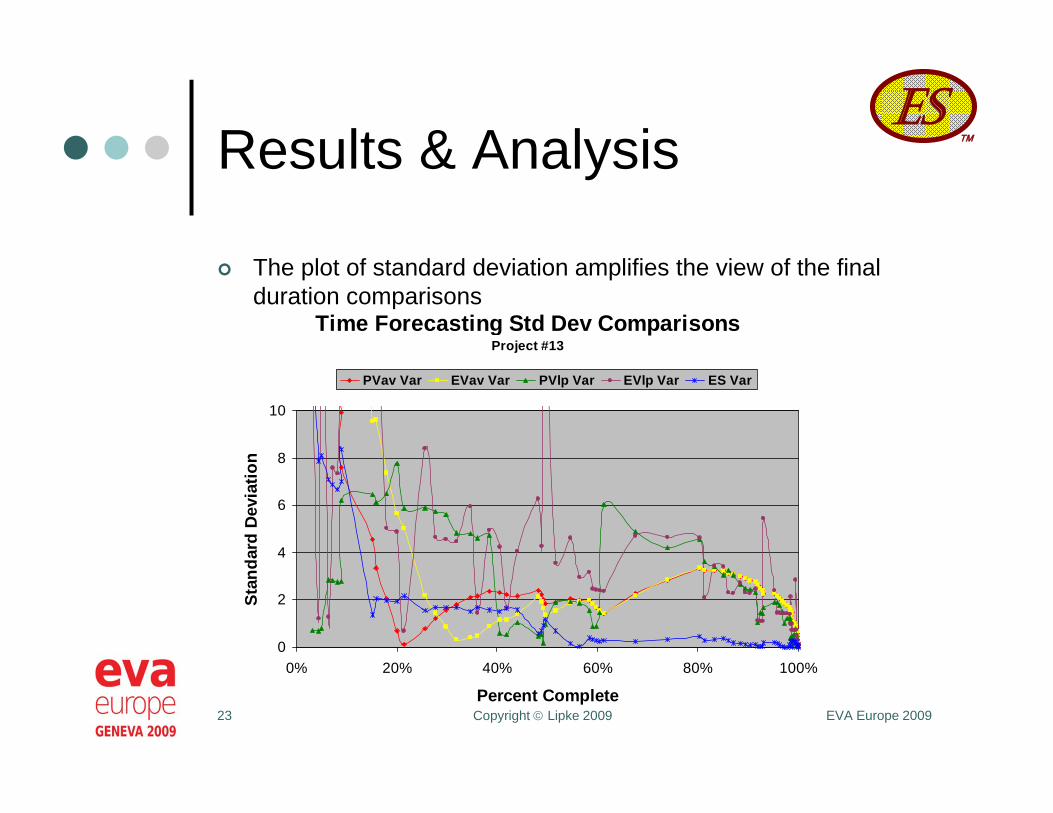
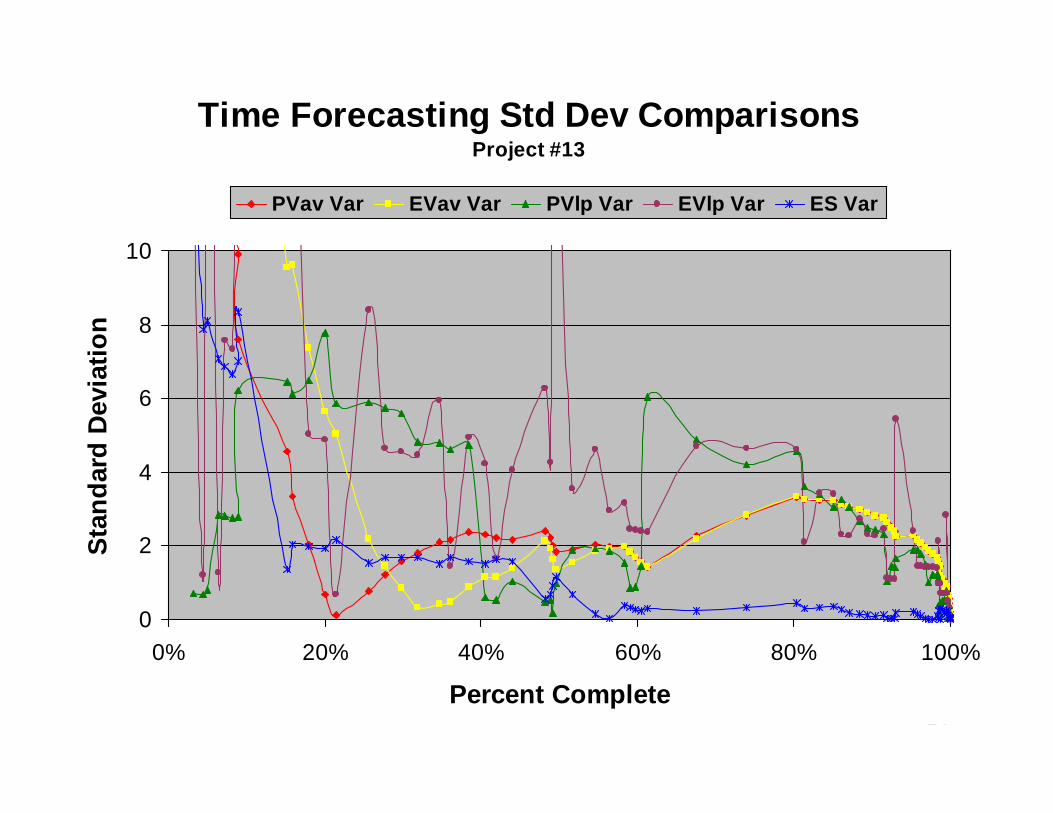
The plot of standard deviation amplifies the view of the final duration comparisons
Time Forecasting Std Dev Comparisons Project #13
0
2
4
6
8
10
0% 20% 40% 60% 80% 100%
Percent Complete
Stan
dard
Dev
iatio
n
PVav Var EVav Var PVlp Var EVlp Var ES Var
24
Time Forecasting Std Dev Comparisons Project #13
0
2
4
6
8
10
0% 20% 40% 60% 80% 100%
Percent Complete
Stan
dard
Dev
iatio
n
PVav Var EVav Var PVlp Var EVlp Var ES Var

ES
EVA Europe 2009Copyright Lipke 2009 25
Results & Analysis
The column graph of the project data more clearly illustrates the behavior for early, middle, late and overall groupings
10.6
22.828.3
33.6
8.612.3
10.614.8
40.8
4.9
15.915.9
24.1
16.2
1.4
14.216.4
23.1
27.7
4.6
0
10
20
30
40
Standard Deviation
10% - 40% 40% - 70% 70% - !00% 10% - 100%
Percent Complete
Comparison of Forecasting AccuracyProject #13
PVav Var EVav Var PVlp Var EVlp Var ES Var

ES
EVA Europe 2009Copyright Lipke 2009 26
Results & Analysis
The column graph assists examination of convergence characteristic
14.216.4
23.1
27.7
4.6
14.413.8
22.4
26.3
4.0
15.315.2
23.3
17.3
1.6
15.815.8
23.9
15.6
1.4
0
10
20
30
Standard Deviation
10% - 100% 25% - 100% 50% - 100% 75% - !00%
Percent Complete
Comparison of Forecasting ConvergenceProject #13
PVav Var EVav Var PVlp Var EVlp Var ES Var

ES
EVA Europe 2009Copyright Lipke 2009 27
Results & Analysis
The column graphs indicate, as expected, that the current period forecasting methods, EVlp & PVlp, produce more volatile results
For the project depicted, the ES forecast is the superior predictor in every range examined
The expectation of decreasing standard deviation as the percent complete range is increasingly focused toward completion is observed for ES and EVlp, only The characteristic is seen for PVav & EVav …but is
not strongly evident until after 80% complete (refer to line graphs)

ES
EVA Europe 2009Copyright Lipke 2009 28
Results & Analysis
Below is an example of the compilation of the standard deviations and rankings for the 10% - 40% grouping
Standard Deviation Results & Ranking for 10% - 40% Completion GroupProject ID Project #1 Project #2 Project #3 Project #4 Project #5 Project #6
Std Dev Rank Std Dev Rank Std Dev Rank Std Dev Rank Std Dev Rank Std Dev RankPVav 14.95 5 13.01 4 11.93 2 25.59 2 4.38 2 29.76 2EVav 2.65 1 9.35 2 8.28 1 48.68 4 5.82 3 42.64 4PVlp 5.47 2 13.62 5 77.74 5 42.77 3 8.67 4 42.11 3EVlp 6.00 3 12.14 3 22.38 3 103.15 5 9.89 5 263.03 5ES 8.28 4 4.78 1 46.76 4 14.03 1 1.88 1 3.57 1
Project ID Project #7 Project #8 Project #9 Project #10 Project #11 Project #12Std Dev Rank Std Dev Rank Std Dev Rank Std Dev Rank Std Dev Rank Std Dev Rank
PVav 9.79 3 16.16 3 6.75 2 9.06 1 7.66 4 15.06 3EVav 6.00 2 33.17 5 15.63 3 10.55 2 6.63 3 30.49 5PVlp 17.95 5 20.69 4 20.80 4 39.11 4 7.70 5 9.06 1EVlp 15.07 4 5.69 2 525.62 5 102.21 5 6.58 2 26.86 4ES 4.31 1 5.09 1 3.74 1 15.22 3 4.54 1 12.49 2
Project ID Project #13 Project #14 Project #15 Project #16Std Dev Rank Std Dev Rank Std Dev Rank Std Dev Rank
PVav 10.57 2 2.36 1 15.93 3 20.18 5EVav 22.78 3 5.90 5 18.12 5 17.10 4PVlp 28.25 4 2.36 1 11.24 2 12.37 2EVlp 33.59 5 5.49 4 16.87 4 16.49 3ES 8.62 1 4.46 3 4.45 1 5.20 1
Methods
Methods
Methods

ES
EVA Europe 2009Copyright Lipke 2009 29
Results & Analysis
For the table shown, the rank for the ES method is “1” for eleven projects …a large majority …even so, we see that the ES forecast is not best for every project
Every range is examined in the same way …to have a more complete understanding of how the various forecasting methods perform under differing circumstances
ES
EVA Europe 2009Copyright Lipke 2009 30
Results & Analysis
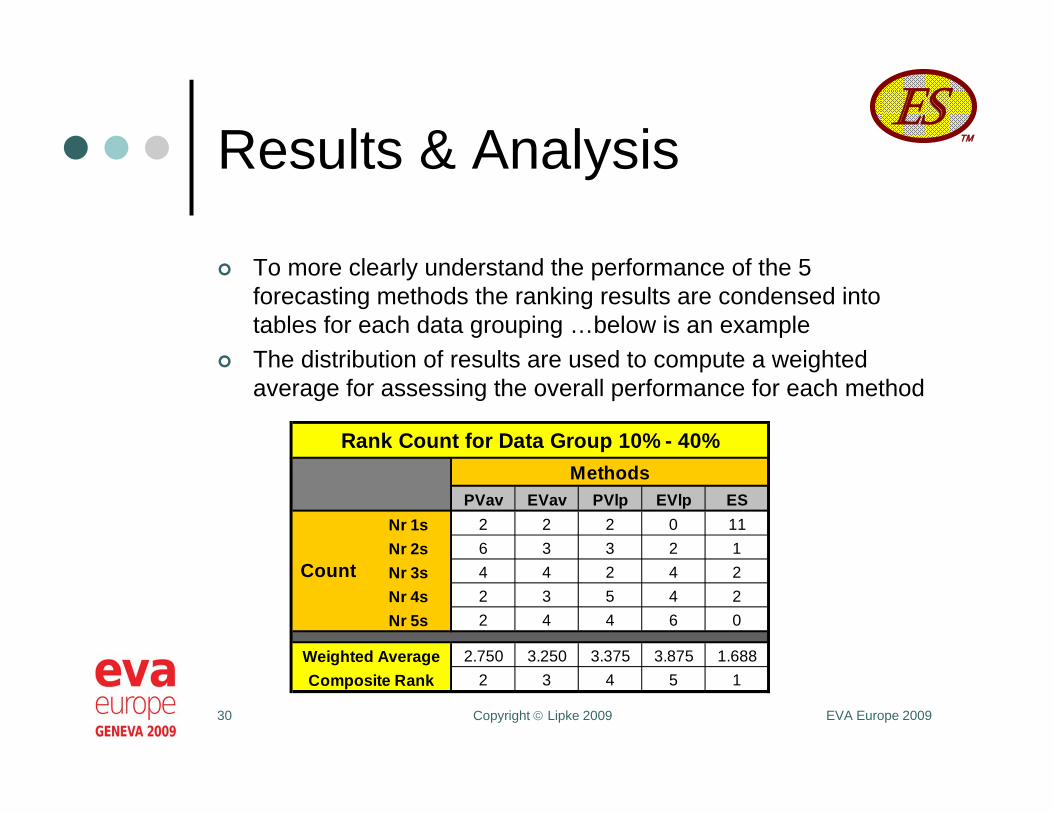
To more clearly understand the performance of the 5 forecasting methods the ranking results are condensed into tables for each data grouping …below is an example
The distribution of results are used to compute a weighted average for assessing the overall performance for each method
Rank Count for Data Group 10% - 40%Methods
PVav EVav PVlp EVlp ESNr 1s 2 2 2 0 11Nr 2s 6 3 3 2 1Nr 3s 4 4 2 4 2Nr 4s 2 3 5 4 2Nr 5s 2 4 4 6 0
Weighted Average 2.750 3.250 3.375 3.875 1.688Composite Rank 2 3 4 5 1
Count
ES
EVA Europe 2009Copyright Lipke 2009 31
Results & Analysis
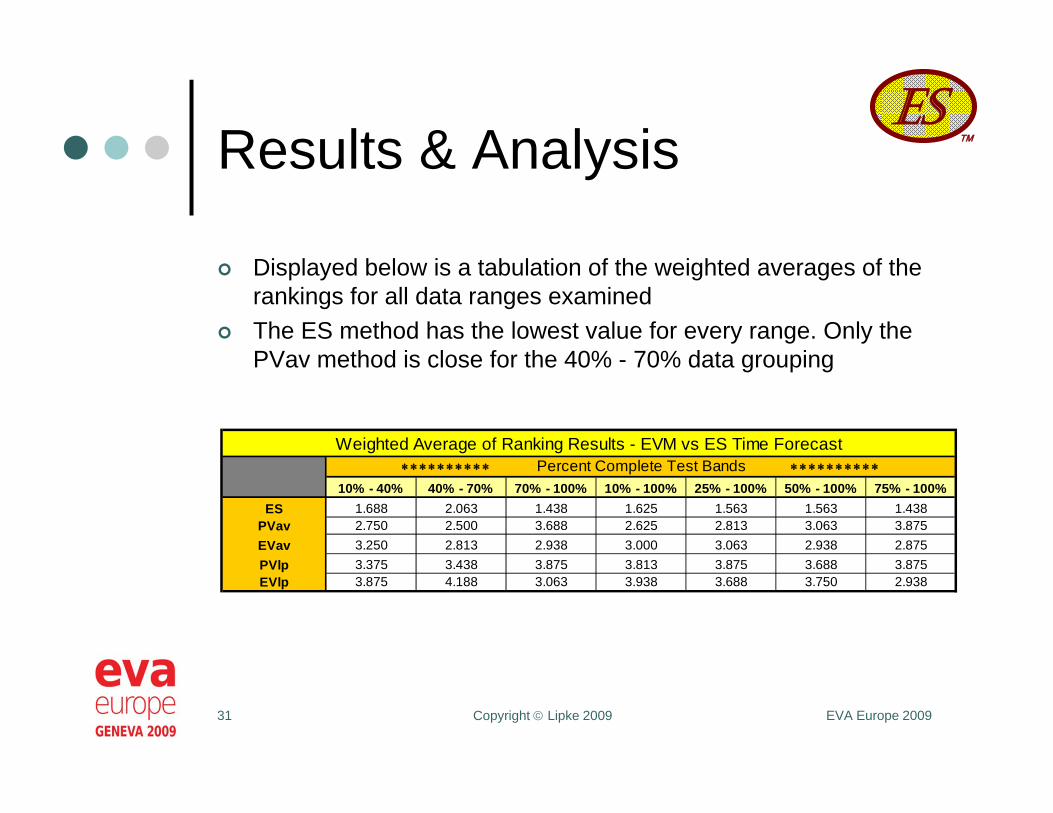
Displayed below is a tabulation of the weighted averages of the rankings for all data ranges examined
The ES method has the lowest value for every range. Only the PVav method is close for the 40% - 70% data grouping
Weighted Average of Ranking Results - EVM vs ES Time Forecast Percent Complete Test Bands
10% - 40% 40% - 70% 70% - 100% 10% - 100% 25% - 100% 50% - 100% 75% - 100%ES 1.688 2.063 1.438 1.625 1.563 1.563 1.438
PVav 2.750 2.500 3.688 2.625 2.813 3.063 3.875EVav 3.250 2.813 2.938 3.000 3.063 2.938 2.875PVlp 3.375 3.438 3.875 3.813 3.875 3.688 3.875EVlp 3.875 4.188 3.063 3.938 3.688 3.750 2.938

ES
EVA Europe 2009Copyright Lipke 2009 32
Results & Analysis
The results of the statistical hypothesis testing is compiled in the table below
With the exception of the 40% - 70% range, the ES method is clearly superior to the EVM methods combined …the test statistic is in the critical region, thereby rejecting the Ho hypothesis
The ES method is shown to be the better forecasting method, regardless of project completion stage
Hypothesis Test Results - EVM vs ES Time ForecastSignificance Percent Complete Test Bands = 0.05 10% - 40% 40% - 70% 70% - 100% 10% - 100% 25% - 100% 50% - 100% 75% - 100%
Test Statistic 0.0000 0.0267 0.0000 0.0000 0.0000 0.0002 0.0000Sign Test Ha Ha Ha Ha Ha Ha Ha
Count ES 11 7 12 11 11 10 12#1s EVM 5 9 4 5 5 6 4
Hypothesis Test: Sign Test at 0.05 level of significance. Ho: The aggregate of EVM forecasts is better / the null hypothesis Ha: ES forecast is better / the alternate hypothesis

ES
EVA Europe 2009Copyright Lipke 2009 33
Summary
Four traditional EVM forecasting methods were examined and compared to the ES technique
Data from 16 projects was used to examine the performance of the 5 forecasting methods
Seven ranges of percent complete were applied to isolate forecasting characteristics or tendencies
The standard deviation from the actual final duration was used to evaluate forecasting performance

ES
EVA Europe 2009Copyright Lipke 2009 34
Summary
Forecasting performance for each project was ranked from best to worst for the seven ranges of project completion
The weighted averages of the rankings were used to evaluate goodness of performance
Hypothesis testing of the best forecasts for each completion range was evaluated
ES
EVA Europe 2009Copyright Lipke 2009 35
Conclusions
The weighted average of rankings indicate ES is a better predictor of final duration than any of the EVM methods The PVav method showed to be close, but slightly
worse than the ES technique for the 40% - 70% project completion range
The hypothesis testing of best forecast yielded identical results to the weighted rankings
For every range of data grouping the ES forecast is identified as the better predictor of final duration

ES
EVA Europe 2009Copyright Lipke 2009 36
Acknowledgement
Project data was made available by – Dr. Ofer Zwikael
Professor of BusinessAustralian National University
Kym HendersonIT Project ManagerSydney, AU

ES
EVA Europe 2009Copyright Lipke 2009 37
References
“Prediction of Project Outcome: The Application of Statistical Methods to Earned Value Management and Earned Schedule Performance Indexes,” International Journal Of Project Management, May 2009 Vol 27: 400-407 [Lipke, Zwikael, Anbari, Henderson]
“Statistical Methods Applied to EVM …the next frontier,” CrossTalk, June 2006: 20-23 [Lipke]
“A Case Study of Earned Schedule to do Predictions,” The Measurable News, Winter 2007-2008: 16-18 [Hecht]
“Measuring the Accuracy of Earned Value/Earned Schedule Forecasting Predictors,” The Measurable News, Winter 2007-2008: 26-30 [Vanhoucke & Vandevoorde]
“A Simulation and Evaluation of Earned Value Metrics to Forecast Project Duration,” Journal of Operations Research Society, October 2007, Vol 58: 1361-1374 [Vanhoucke & Vandevoorde]
Earned Schedule Website: www.earnedschedule.com