cortland climate action plan (draft 1 0) · section!2.1!mmethodology ......
TRANSCRIPT

SUNY Cortland Climate Action Plan: A Roadmap to a Carbon Free Campus
Principal Author:
Dr. Brice Smith , Associate Professor and Chair of Physics
Climate Action Planning Committee:
• Dr. Virginia Levine , Executive Assistant to the President • Nasrin Parvizi , Associate Vice President of Faci l i t ies Management • Pierre Gagnon , Executive Director of Auxil iary Services Corporation • Jeff Lallas , Director of Faci l i t ies Planning, Design and Construction • Timothy Slack , Director of Physical Plant • Ralph Carrasquillo , Director of Residence Life and Housing • Sarah Williams , former Assistant Director of Residence Life and Housing Operations • Byron Norelius , Lecturer in Biological Sciences and Campus Sustainabil i ty
Coordinator • Jeremy Zhe-Heimerman , Coordinator , Assist ive Technology and Test
Administration Services for Student Disabil i ty Services
Version 1.0 September 27, 2011

i
Table of Contents Table of Contents........................................................................................................................................................ i Acknowledgements ..................................................................................................................................................ii Glossary and Acronyms......................................................................................................................................... iii Chapter 1: Introduction and Summary of Main Findings ............................................................................1 Section 1.1 – Introduction and Overview ...................................................................................................................... 1 Section 1.2 – The ACUPCC and the Role of the Climate Action Plan...................................................................... 3 Section 1.3 - Summary of Key Findings .......................................................................................................................... 8
Chapter 2: SUNY Cortland’s Carbon Footprint.............................................................................................. 16 Section 2.1 - Methodology.................................................................................................................................................16 Section 2.2 - Results............................................................................................................................................................20
Chapter 3: Academic Programs, Research, and College Initiatives....................................................... 24 Section 3.1 - Curricular Activities ..................................................................................................................................24 Section 3.2 – Scholarship and Creative Activities.....................................................................................................27 Section 3.3 - Student Activities .......................................................................................................................................29 Section 3.4 - Conferences and Speaker Series ...........................................................................................................30 Section 3.5 - Community Engagement ..........................................................................................................................32
Chapter 4: Heating ................................................................................................................................................. 33 Section 4.1 – Recent Historical Trends.........................................................................................................................33 Section 4.2 - Future Projections .....................................................................................................................................35 Section 4.3 – The “Wedge Model” for Heating............................................................................................................37
Chapter 5: Electricity ............................................................................................................................................ 42 Section 5.1 - Recent Historical Trends .........................................................................................................................42 Section 5.2 - Future Projections .....................................................................................................................................44 Section 5.3 – The “Wedge Model” for Electricity .......................................................................................................48
Chapter 6: Commuting and On-Campus Transportation .......................................................................... 52 Section 6.1 - Recent Historical Trends .........................................................................................................................52 Section 6.2 - Future Projections .....................................................................................................................................55 Section 6.3 – The “Wedge Model” for Transportation.............................................................................................60
Chapter 7: Food Services ..................................................................................................................................... 65 Section 7.1 - Recent Historical Trends .........................................................................................................................65 Section 7.2 - Future Projections .....................................................................................................................................68 Section 7.3 – Illustrative Cost Estimate for Reductions in Food Sector.............................................................77
Chapter 8: Conclusions and Recommendations .......................................................................................... 82 Appendix A – SUNY Energy and Sustainability Policy ................................................................................ 85 Appendix B – The Presidents’ Climate Commitment.................................................................................. 88 Appendix C – Executive Order No. 24 .............................................................................................................. 91 Appendix D – The Carbon Intensity Surveys................................................................................................. 95 Appendix E – Summary of Key Assumptions used in the Wedge Models ..........................................100 Section E.1 - Heating ........................................................................................................................................................ 101 Section E.2 - Electricity ................................................................................................................................................... 102 Section E.3 - Transportation ......................................................................................................................................... 104
References ..............................................................................................................................................................109

ii
Acknowledgements
The Carbon Neutrality Committee’s ad hoc Climate Action Planning sub-‐committee responsible for overseeing the drafting of this document included the following members:
Dr. Virginia Levine (Executive Assistant to the President); Nasrin Parvizi (Associate Vice President of Facilities Management); Pierre Gagnon (Executive Director of Auxiliary Services Corporation); Jeff Lallas (Director of Facilities Planning, Design and Construction); Timothy Slack (Director of Physical Plant); Ralph Carrasquillo (Director of Residence Life and Housing); Sarah Williams (former Assistant Director of Residence Life and Housing Operations); Dr. Brice Smith (Associate Professor and Chair of the Physics Department); Byron Norelius (Lecturer in Biological Sciences and Campus Sustainability Coordinator); and Jeremy Zhe-‐Heimerman (Coordinator, Assistive Technology and Test Administration Services for Student Disability Services)
As the principal author of the report and the designer of the wedge models used to project future greenhouse gas reductions and their associated costs, any errors or omissions remain, of course, my responsibility. In addition to members of the committee, there are a number of people I would like to acknowledge for their contributions to this work. First, I would like to thank the students from my Fall 2010 PHY 505: Energy and Sustainability class (Laura Bald, Michael Baldino, Stephen Brown, Bryan Davey, Ann Knickerbocker, Caitlin Rouse, and Christopher Todd) who helped to collect information regarding historical sustainability efforts undertaken by the campus and to prepare the carbon footprint surveys for distribution and Matthew Rankin, my research student in Fall 2010 and Spring 2011 whose work on the potential for geothermal heat pumps and biomass boilers to meet the demands of heating on upper campus was instrumental in preparing the model present in Chapter Four. I would also like to thank Don Chisholm, former Energy Management Engineer and head of the Heating Plant at SUNY Cortland, who passed away on November 10, 2010. Don was a major supporter of campus sustainability efforts and helped to provide much of the campus information used in the initial construction of the campus heating and electricity models. Second, I would like to acknowledge Bill McNamara, Director of Dining Services for the Auxiliary Services Corporation, for his role in providing much of the information on the ASC sustainability initiatives highlighted in Chapter Seven. In addition, Cynthia Lake, Amanda Anderson, and Courtney Andros from Residence Life and Housing aided in collecting information on sustainability initiatives underway in the residence halls. I am also grateful to the chairs of the Art and Art History, Psychology, History, Political Science, and Philosophy departments as well as the Directors for the Center for Gender and Intercultural Studies, the Center for Environmental and Outdoor Education, and the New York State Inclusive Recreation Resource Center for their time and efforts in filling out the committee’s survey on departmental actions supporting sustainability. Much of the data on curricular and programmatic activities cited in Chapter Three comes directly from these responses and could not have been collected without their assistance. In addition, I would like to thank Dr. Beth Klein from the Childhood/Early Childhood Education Department who provided valuable insight and helped to review the sections of this report relating to local foods production. Finally, I would like to thank all those who took the time to fill out and return the Campus Carbon Intensity Survey, the faculty who agreed to hand these surveys out in your classes, and Haley Zurell, the secretary for the Geology and Physics Departments, for her help in entering the data from the more than one thousand surveys that were returned. Without all of your help, none of the transportation or food analysis in this report could have been completed. Brice Smith Cortland, New York September 2011

iii
Glossary and Acronyms AASHE Association for the Advancement of Sustainability in Higher Education – an
independent 501(c)3 nonprofit organization intended to empower colleges and universities to play a leadership role in transforming society to being more sustainable
ACUPCC American College and University Presidents’ Climate Commitment – a voluntary institutional commitment to eliminate greenhouse gas emissions from campus operations by mid-‐century and to promote research and educational efforts aimed at addressing the threat of anthropogenic climate disruption
ASC Auxiliary Services Corporation – a not-‐for-‐profit, campus based organization that provides services to the community such as running the dining halls and the College Store
BTU British Thermal Unit – a unit of energy equivalent to the amount of heat required to raise one pound of water one degree Fahrenheit
C-‐SAVE The SUNY Cortland Environmental Science Club (formally Cortland Students Advocating for a Valuable Environment)
CO2 Carbon dioxide – the most prevalent and important of the greenhouse gases associated with anthropogenic global climate disruption
CO2-‐equivalent The amount of carbon dioxide that would have the same effect as a given amount of non-‐CO2 greenhouse gases like nitrous oxide (N2O) or methane (CH4). This takes into account the different heat trapping ability (the so-‐called “global warming potential”) of the various greenhouse gases and puts them all into a common unit to ease comparisons.
Dth Decatherm – a unit of energy usually used for natural gas (1 Dth is equal to 1,000,000 BTU)
EIA U.S. Energy Information Administration – a research and reporting arm of the U.S. Department of Energy
EO 24 Executive Order #24 – an executive order signed by then Governor David Paterson on August 6, 2009 which sets forth a goal of achieving 80 percent reductions in greenhouse gas emission by 2050 and creates a Climate Action Council charged with crafting a State level climate action plan
EPA U.S. Environmental Protection Agency
GHG Greenhouse gas – any of a group of heat trapping gases associated with human caused disruption of the climate including carbon dioxide, methane, and nitrous oxide. There are currently at least 18 such gasses listed by the Intergovernmental Panel on Climate Change as long-‐lived greenhouse gases.
HDD Heating Degree Day – a measure used to quantify the heating demand of buildings. Roughly it measures how cold the air is over a given time period compared to the temperature set points used for heating

iv
IPCC Intergovernmental Panel on Climate Change – an international body of experts established in 1988 as part of the World Meteorological Organization and the United Nations Environment Programme tasked with reviewing the latest scientific information and producing reports and assessments relating to climate change, its causes, consequences, and potential solutions
kcal kilocalorie – a unit of energy equivalent to the amount of heat required to raise one kilogram of water one degree Celsius (1 kcal is equal to 3.97 BTU and is also equal to one “food calorie”)
kWh kilowatt-‐hour – a unit of energy usually used for electricity (1 kWh is equal to 3,412 BTU)
LEED Leadership in Energy and Environmental Design – a certification scheme developed by the U.S. Green Building Council to enable buildings to be rated based on their environmental impacts. The four levels of LEED certification are, in increasing level of performance; (1) certified, (2) silver, (3) gold, and (4) platinum.
SCRA SUNY Cortland Recreation Association
STARS Sustainability Tracking, Assessment, and Rating System – a self-‐reporting system designed by the Association for the Advancement of Sustainability in Higher Education intended to allow colleges and universities to measure their sustainability performance against a common set of metrics
UNFCCC United Nations Framework Convention on Climate Change – an international treaty aimed at limiting greenhouse gas emissions to prevent dangerous levels of climate change. The treaty was ratified by the United States in 1992 and entered force in 1994. The chief protocol to the treaty laying out specific and binding emissions reduction targets is the Kyoto Protocol which was signed in 1998 by then President Clinton, but was never ratified by the U.S. Senate.

1
Chapter 1: Introduction and Summary of Main Findings
Section 1.1 – Introduction and Overview
“We face an unprecedented threat to our very way of life from climate change.”1 -‐ Dr. Steven Chu, Secretary of Energy and winner of the Nobel Prize in Physics (July 7, 2009)
Apart from the risk of global thermonuclear war, the disruption of the global climate system resulting from human activities is likely to be the most wide reaching environmental threat facing humanity in the 21st century. Chief among the causes of this anthropogenic climate change are the emissions of heat-‐trapping greenhouse gases from the combustion of fossil fuels, from agricultural practices, and from changes in land-‐use patterns.2 Over the past two decades, a growing scientific consensus has been reached concerning both the role of human activities in causing climate change as well as the potential hazards that such changes pose to the global ecosystem. This has, in turn, led to an emerging consensus concerning the need for immediate actions to try to minimize these risks. For example, as summarized by the Committee on America’s Climate Choices of the National Research Council of the U.S. National Academies of Science
Although the exact details cannot be predicted with certainty, there is a clear scientific understanding that climate change poses serious risks to human society and many of the physical and ecological systems upon which society depends—with the specific impacts of concern, and the relative likelihood of those impacts, varying significantly from place to place and over time. It is likewise clear that actions to reduce GHG [greenhouse gas] emissions and to increase adaptive capacity will lower the likelihood and the consequences of these risks.
Waiting for unacceptable impacts to occur before taking action is imprudent because many of the impacts of GHGs emitted today will not fully manifest themselves for decades; and once they do appear, they can be with us for hundreds or even thousands of years. The amount of warming is expected to increase with the cumulative amount of GHGs emitted, and thus the chances of encountering dangerous climate impacts grows with every extra ton we emit.3
The committee goes on to note that these are not just purely environmental concerns and that “[t]he physical and social impacts of climate change are expected to have substantial economic implications throughout the United States.”4 As such, they concluded
Finally, in the committee’s judgment, the risks associated with doing business as usual are a much greater concern than the risks associated with engaging in ambitious but measured response efforts. This is because many aspects of an “overly ambitious” policy response could be reversed or otherwise addressed, if needed, through subsequent policy change, whereas adverse changes in the climate system are much more difficult (indeed, on the time scale of our lifetimes, may be impossible) to “undo.”5
Significantly, these kinds of conclusions regarding the potential dangers posed by human induced climate change are not limited to the sphere of scientists, and have been recently endorsed by elements representing every branch of the U.S. government. While a complete review of the government’s position is far beyond the scope of the current document, we will note three brief examples to illustrate this point. First, in their April 2007 ruling that carbon dioxide’s role as a greenhouse gas makes it a “pollutant” under the Clean Air Act and, thus, that the Environmental Protection Agency has the statutory authority to regulate its emissions, the U.S. Supreme Court noted that “[t]he harms associated with climate change are serious and well recognized” and that the government’s own analysis “identifies a number of environmental changes that have already inflicted
1 Statement before the Committee on Environment and Public Works, United States Senate [DOE 2009] 2 For an extensive review of the science underlying climate change and the role of human activities in it see [IPCC 2007]. 3 NAS/NRC 2011 p. 24 to 25 4 NAS/NRC 2011 p. 23 5 NAS/NRC 2011 p. 36

2
significant harms.”6 As a second example, H.R. 2454 (the American Clean Energy and Security Act of 2009) passed by the U.S. House of Representative on June 26, 2009, notes that “[t]he Congress finds as follows: (1) Global warming poses a significant threat to the national security, economy, public health and welfare, and environment of the United States, as well as of other nations.”7 As a final example, the 2010 Quadrennial Defense Review produced by the Pentagon included for the first time an explicit and detailed discussion of the security risks posed by climate change. In this review the Department of Defense noted that
Assessments conducted by the intelligence community indicate that climate change could have significant geopolitical impacts around the world, contributing to poverty, environmental degradation, and the further weakening of fragile governments. Climate change will contribute to food and water scarcity, will increase the spread of disease, and may spur or exacerbate mass migration.
While climate change alone does not cause conflict, it may act as an accelerant of instability or conflict, placing a burden to respond on civilian institutions and militaries around the world. In addition, extreme weather events may lead to increased demands for defense support to civil authorities for humanitarian assistance or disaster response both within the United States and overseas.8
In addition, the Pentagon’s review warned that sea level rise will pose challenges for the Defense Department due to the long coast line and numerous coastal military bases in the U.S. and that, as a result, they will work to mitigate the impacts of climate change by, among other activities, investing in energy efficiency and increasing their use of renewable energy.9 Responding to these risks and the lack of an overarching federal policy, a number of State and local initiatives have been created in order to mobilize resources from the bottom up in the fight against climate change. Two such initiatives with particular relevance to New York State in general, and to the Cortland area in particular, are the U.S. Conference of Mayors’ Climate Protection Agreement and the Regional Greenhouse Gas Initiative. Started in 2005 as a response to the U.S. Senate’s failure to ratify the Kyoto Protocol to the United Nations’ Framework Convention on Climate Change (UNFCCC), the Mayors’ Climate Protection initiative was launched by then Seattle Mayor Greg Nickels at the annual U.S. Conference of Mayors. To date, more than 1,050 mayors representing cities and towns with a combined population of over 88 million have signed the agreement committing their cities to achieving the Kyoto Protocol’s intended mandate of reducing greenhouse gas emissions by 7 percent below 1990 levels by the end of next year. Within New York, 46 cities, towns, and villages have signed on to this agreement, including the neighboring communities of Syracuse, Binghamton, and Ithaca.10 As a second example, the Regional Greenhouse Gas Initiative is an agreement between 10 northeast and mid-‐Atlantic states including Connecticut, Delaware, Maine, Maryland, Massachusetts, New Hampshire, New Jersey, New York, Rhode Island and Vermont aimed at reducing the CO2 emissions from their electric power sectors by 10 percent by 2018. This effort, initiated by then New York Governor George Pataki in 2003, has created a market based, cap-‐and-‐trade type system to achieve these reductions.11 Between 2008, when emissions permit auctioning began, and the end of 2010, a total of nearly $789.3 million had been raised by this initiative. Of that, $410 million had been reinvested by these states in programs to improve energy efficiency, $86.8 million had been invested in efforts to accelerate the growth of renewable energy resources in their states, and more than $110 million had been used to help directly offset the burden of increased energy costs for low-‐income ratepayers.12 Of these amounts, New York’s share includes planned investments of $182 million in energy efficiency programs and $51.6 million in renewable energy.13
6 Supreme Court 2007 p. 18 and 29 to 30 7 H.R. 2454 Section 701 8 DOD 2010 p. 85 9 DOD 2010 p. 85 to 87 10 Available online at http://www.usmayors.org/climateprotection/agreement.htm 11 For more information see http://www.rggi.org/ 12 RGGI 2011 p. 4 13 RGGI 2011 p. 4 and 48

3
Thus, as this brief review illustrates, there is a clear and growing consensus that immediate action aimed at reducing the emissions of greenhouse gases is needed in order to try to avoid the most hazardous of the potential consequences of climate change and that institutions from states to cities and beyond have an obligation to work towards these goals. It is within this larger context that SUNY as a whole promulgated its 2007 policy on energy conservation and sustainability calling for large increases in the use of renewable energy and steep near-‐term reductions in greenhouse gas emissions (see Appendix A) and that SUNY Cortland itself decided to join a nation-‐wide effort to leverage the unique assets of institutions of higher education in the fight against climate change. It is to this effort that we will turn in the coming section.
Section 1.2 – The ACUPCC and the Role of the Climate Action Plan
Given the clear and widely recognized need for action at all levels of society in combating the threat of global climate change and the unique position many institutions of higher education occupy within their communities, a group of 12 college and university presidents, representing schools of all sizes and types, launched the American College and University Presidents’ Climate Commitment (ACUPCC) in 2006.14 In this commitment, the Presidents stated that they
…believe colleges and universities must exercise leadership in their communities and throughout society by modeling ways to minimize global warming emissions, and by providing the knowledge and the educated graduates to achieve climate neutrality.
and that
Campuses that address the climate challenge by reducing global warming emissions and by integrating sustainability into their curriculum will better serve their students and meet their social mandate to help create a thriving, ethical and civil society. These colleges and universities will be providing students with the knowledge and skills needed to address the critical, systemic challenges faced by the world in this new century and enable them to benefit from the economic opportunities that will arise as a result of solutions they develop.15
SUNY Cortland joined in this effort in 2007 when the commitment was signed by President Erik Bitterbaum. As of this writing, we are now one of nearly 670 signatories to the commitment nationwide, including at least 55 colleges and universities in New York State and 16 within the SUNY system alone.16 As part of the Presidents’ Climate Commitment, SUNY Cortland has agreed to produce periodic inventories of the campus’s greenhouse gas emissions and to produce a Climate Action Plan laying out strategies and a time-‐line for eliminating those emissions. It is within that framework that the present document was produced. To begin with, it is important to lay out from the start what this document is and what it is not. The Climate Action Plan is intended to be a strategic planning tool that will allow the campus community to: (1) gauge the extent and success of past efforts to reduce our greenhouse gas emissions; (2) to make realistic projections about the changes needed in the future and the likely or illustrative technologies that could realistically meet the energy service needs of the campus; and (3) to project the likely costs and cash flow requirements of a strategy that would have a high probability of achieving climate neutrality by the target date of 2050 in order to inform decisions regarding resource allocation and fundraising goals. What the plan is not intended to be is either a facilities plan in which detailed engineering and project management plans are described in detail nor a commitment that the reference technologies described will be the ones ultimately implements by the College. Like a true roadmap, or a GPS enabled smart phone for those who prefer, the Climate Action Plan tells us how we can get from here to there, the burden of finding ways to implement the plan and to arrive at the destination that it outlines, however, remains with the administration and the campus community as a whole. In addition, it is important to note at the beginning that the plan will try to make use of words like “sustainable” as little as possible when referring to the emissions reductions strategies laid out in Chapters Four through
14 For more information, see http://www.presidentsclimatecommitment.org/ 15 The complete text of the Presidents’ Climate Commitment is included as Appendix B 16 For a current list of signatories see http://www.presidentsclimatecommitment.org/signatories/list

4
Seven. This is because the document is focused solely on the greenhouse gas emissions of the campus as intended by the Presidents’ Climate Commitment. As such, we have not attempted to take into consideration broader questions of sustainability such as resource depletion beyond where it may impact projections for the future cost of energy or the potential environmental impacts of large scale use of hydraulic fracture drilling techniques for natural gas extraction from shale formations beyond those associated with increased greenhouse gas emissions due to methane leakage. Thus, the future energy system that we outline in this work is best described as a “carbon neutral” or “climate neutral” system. That being said, many of the strategies we will outline were chosen for their likely compatibility with a long-‐term sustainable energy system. These include such things as our reliance on efficiency, conservation, and renewable resources whenever possible and our goal of minimizing the use of biomass or biofuels due to the greater complexity associated with analyzing their overall environmental impacts. In order to quantify more precisely what we will mean by the term “carbon neutral,” we have adopted the goal of an 85 to 95 percent reduction in greenhouse gas emissions by 2050 from the campus energy system and a goal of achieving 80 to 85 percent reductions in the campus’s total, overall emissions, including those associated with food service. These goals are consistent with the Presidents’ Climate Commitment which notes “the need to reduce the global emission of greenhouse gases by 80% by mid-‐century at the latest, in order to avert the worst impacts of global warming” (see Appendix B). In addition, our targeted reductions are inline with the goal set forth by then Governor Paterson in Executive Order #24 that the State of New York seek to reduce its greenhouse gas emissions by 80 percent by 2050.17 Finally, we note that our goal of achieving an 80 to 85 percent reduction is also broadly consistent with the targets set forth by national and international bodies as well as with assessments of the level of emissions reductions that are possible for the United States as a whole.18 Finally, one of the most important goals of this work will be to quantify the meaning of words such as “Green” that are often used, but have no intrinsic meaning in and of themselves. To illustrate this point, we will consider the residence halls on campus as a brief case study. As noted in the SUNY Cortland Sustainability Master Plan,
Since 2003, the College has proceeded with major renovations to the Sperry Center, Moffett Center, Brockway Hall, Cornish Hall, and nine residence halls. Another important addition to the campus was the Glass Tower Hall, which is a LEED certified residential facility.19
LEED certification is used to distinguish a building as having been designed and built using ”Green” building practices. As described on the website of the U.S. Green Building Council
LEED, or Leadership in Energy and Environmental Design, is an internationally-‐recognized green building certification system. Developed by the U.S. Green Building Council (USGBC) in March 2000, LEED provides building owners and operators with a framework for identifying and implementing practical and measurable green building design, construction, operations and maintenance solutions.20
Buildings are ranked within the LEED framework as certified, silver, gold, or platinum, depending on how many green building practices were used in their design and construction. Such practices can range from the use of renewable energy like solar photovoltaics, to adding bike racks, to using locally sourced building materials. As such, the LEED review process is quite extensive and time consuming. For example, Glass Tower began the process in spring 2006 and did not receive official certification until the middle of summer 2008. In light of this, buildings that meet the standards may not always undergo formal certification. For example, all of the
17 See Appendix C for the complete text of this executive order (EO 24). 18 For example, the Intergovernmental Panel on Climate (IPCC) has estimated that reductions in greenhouse gas emissions of 80 to 95 percent over 1990 levels in Annex I countries like the U.S. will be needed by 2050 to have a reasonable chance at limiting the global temperature increase to a level that may avoid the most dangerous risks associated with climate change. [IPCC 2007 p. 775 to 776 and 826] As a further example, this type goal was adopted in June 2009 by the House of Representatives when they passed the American Security and Clean Energy Act that (had the bill passed the Senate and been signed into law) would have created a cap-‐and-‐trade system intended to achieve reductions in U.S. greenhouse gas emissions of more than 80 percent by 2050. [NAS/NRC 2011 p. 12 and H.R. 2454 Sec. 702] For a further discussion of greenhouse gas reduction goals in the context of the U.S. energy system as a whole see [Makhijani 2007 p. 166 to 167] 19 JMZ 2011 p. 13 20 U.S. Green Building Council website http://www.usgbc.org/DisplayPage.aspx?CMSPageID=1988 (viewed on 6/21/11)

5
residence halls renovated since 2005 have been built to meet LEED silver standards, but none have actually yet received the formal designation. Among these residence halls is Fitzgerald Hall, reopened in October 2009. As noted, it was designed to meet LEED Silver standards or better, and thus both Glass Tower and Fitzgerald Hall would often be considered “Green” buildings. However, when one takes a closer look, things are found to be more complicated. The Sustainability Master Plan compared the energy performance of 29 buildings on campus, including 12 residence halls, to the national averages for comparable types of buildings. In making this comparison they found that
According to the compiled energy performance of the studied buildings, most of the documented buildings are underperforming taking into consideration that:
• Most documented buildings perform within the national average or below; • No buildings meet the first target of the 2030 challenge by performing 50 percent better then [the] national average for energy consumption; and
• Residential buildings, as a group, have the worst performance.21
In fact, only two residence halls, Hayes and Hendrick, performed better than the national average while Glass Tower and Fitzgerald Hall both used about 10 percent more energy than the average (see Figure 1.1). Therefore the “Green” buildings are found to be within the groups of underperforming buildings as far as reductions in energy use (and by extension reductions in greenhouse gas emissions) was concerned. Thus, as was noted in the Sustainability Master Plan the “[a]doption of LEED Silver or Equivalent as the Standard for New Construction may not be Sufficient for Achieving Significant Energy Performance Improvements.”22 Figure 1.1: Average annual energy consumption per square foot for 12 on-campus residence halls. The green line indicates the national average of 100,000 BTU per square foot for comparable buildings.23
As a response to this need to bring more specificity to the term “Green building” in the present context, the roadmap presented in this report establishes the average annual energy reductions needed as well as the rates at which conventional fuels need to be replaced by low-‐CO2 sources that will be required to meet the goal of carbon neutrality by 2050. Thus, the roadmap will allow for the performance of new or renovated buildings to 21 JMZ 2011 p. 13 22 JMZ 2011 p. 20 23 JMZ 2011 p. 12
1 3 5 7 9 11
0
20
40
60
80
100
120
140
0
20
40
60
80
100
120
140
Alger
Bishop
Cheney
Clark
DeGroat
Fitzgerald
Glass Tow
er
Hayes
Hendrick
Higgins
Randall
Shea
Annual Energy Consumption
(Thousand BTU per Square Foot)

6
be quantified and to provide a point of comparison for how well or poorly a particular proposal fits with the goal of eliminating greenhouse gas emissions from the campus. This capability will complement the more general goal outlined in the Sustainability Master Plan that the college seek to “[r]equire new buildings and major renovations to meet an energy consumption performance standard of 50 percent of the regional average” (or roughly 50,000 BTU per square foot for residence halls).24 This case study of the energy performance of residence halls also provides the important conclusion that, as Figure 1.1 shows, we still have substantial opportunities for improvements in efficiency and increased conservation in the residence halls and that, despite recent improvements, we have in no way exhausted the potential for significantly lowering the campus’s overall energy consumption. As such, we will set aggressive goals for the implementation of efficiency and conservation measures as part of the present roadmap for campus heating and electricity use. In addition, the higher energy use of most residence halls reveals the importance of the Residence Life and Housing Office to the carbon neutrality efforts. Finding ways to lower the energy use by on-‐campus students will be critical to achieving our goals. Significantly, Residence Life and Housing has already begun several important projects that will help to pave the way for those needed improvements. For example, Residence Life and Housing staff began a competition in the West Campus Apartments for the buildings to compete with each other over who could lower their energy demand the most with a refund at the end of the year being the prize for winning. In addition, Residence Life and Housing now oversees the Green Reps Program (see Section 3.3) which places paid student staff into the residence halls tasked with educating the students about sustainability issues. The proactive role already being played by the Residence Life and Housing Office further supports our aggressive targets for future energy reductions, particularly in light of the relatively high starting point for the residence halls’ current energy consumption. As highlighted by the residence hall case study, the need to reduce energy consumption will be a major part of the roadmap we are outlining for greenhouse gas reductions. In addition to the associated carbon reductions, lower energy use will also have added financial benefits and will often be among the cheapest alternatives for eliminating greenhouse gas emissions in the near to medium-‐term. For example, earlier energy saving programs put in place by the college have already saved roughly $1 million, due to such improvements as introducing high efficiency lighting, adding satellite boilers for domestic hot water, and setting up an energy management system that allows the facilities department to better control the lighting, heating, and cooling of buildings. These kinds of efficiency and conservation projects will likely become even more important in the future as energy prices rise. To give some perspective on what we may be facing in the future in terms of energy price increases, it is illustrative to consider the past. Figure 1.2 shows the average cost of energy (oil, natural gas, electricity, etc.) delivered to customers in New York State from 1970 to 2008.
24 JMZ 2011 p. 22

7
Figure 1.2: Average cost of primary energy for all customers in New York State from 1970 to 2008. All figures are in constant 2008 dollars, and thus the graph reflects real changes in the cost of energy and not merely the impacts of inflation.
As seen from this graph, energy prices in New York rose sharply through the 1970s at a rate of nearly 8.5 percent per year before reversing course and decreasing throughout the 1980s and early 90s. Of greatest significance to us presently, however, is the second onset of energy price escalation that is evident since the late 1990s. Over the decade 1998 to 2008, energy prices in New York State rose at a rate of nearly 6.6 percent per year due primarily to increases in the cost of oil and, more recently, of natural gas. While great care must always be taken when seeking to predict the future, it seems very reasonable to plan for a future with increasing costs for energy, particularly if the kinds of aggressive changes such as those we are laying out in this roadmap are not undertaken by the global community as a whole resulting in supplies of energy resources such as oil coming under ever greater demand pressure. As a final note, in light of both the environmental and the economic incentives to reduce our energy consumption and overall greenhouse gas emissions, the campus has made three significant moves recently to expand the administrative and human infrastructure necessary to help the campus achieve these goals. The first move was to create a part-‐time Campus Sustainability Coordinator position to work with the various committees on campus to compile and analyze data regarding energy and environmental issues, to disseminate that information to the campus and, more broadly, to serve as a source of outreach to the faculty, staff, and students. In Spring 2011, Byron Norelius, a graduate of the University of Richmond and the SUNY College of Environmental Science and Forestry and a Lecturer in the Biological Sciences Department was hired as the first part-‐time Campus Sustainability Coordinator. In addition to this more broadly focused position on the academic side, the Physical Plant division has also recently begun a search for a full-‐time Campus Energy Manager. This person will serve as the key advisor to the Director of the Physical Plant on energy matters and will be responsible for such tasks as monitoring and analyzing energy consumption and costs for electrical power, chilled water, domestic hot water, heating, cooling, and ventilation, conducting energy audits of all buildings and campus wide energy use, developing and administering a campus-‐wide Energy Management Plan with a goal of reducing SUNY Cortland's costs for energy, and identifying opportunities, priorities, and funding possibilities in pursuit of NYSERDA and other energy grant opportunities. As with the recently created Green Reps program now in Residence Life and Housing, the addition of these new positions helps to build the capabilities that will be needed by the college if
0
5
10
15
20
25
30
1965 1970 1975 1980 1985 1990 1995 2000 2005 2010
Average Energy Price in New
York
(dollars per million BTU)
8
we are to be able to achieve the kinds of large scale change to the campus energy and food service sectors outlined in this work. Finally, the third infrastructure building action recently undertaken by the campus has been to adopt the Association for the Advancement of Sustainability in Higher Education’s Sustainability Tracking, Assessment, and Rating System (STARS). This reporting scheme will allow the college to better track and assess the impact of its sustainability initiatives and will provide a simple and transparent way to compare our progress against both objective goals and against the performance of other colleges and universities within SUNY as well as nation-‐wide. To date, there are currently nearly 280 schools registered with AASHE STARS including 6 within the SUNY system.25 While the STARS framework considers sustainability more broadly, its adoption by the campus will aid in the updating of future versions of the Climate Action Plan and, as such, will provide a valuable tool for evaluating our campus’s progress toward carbon neutrality.
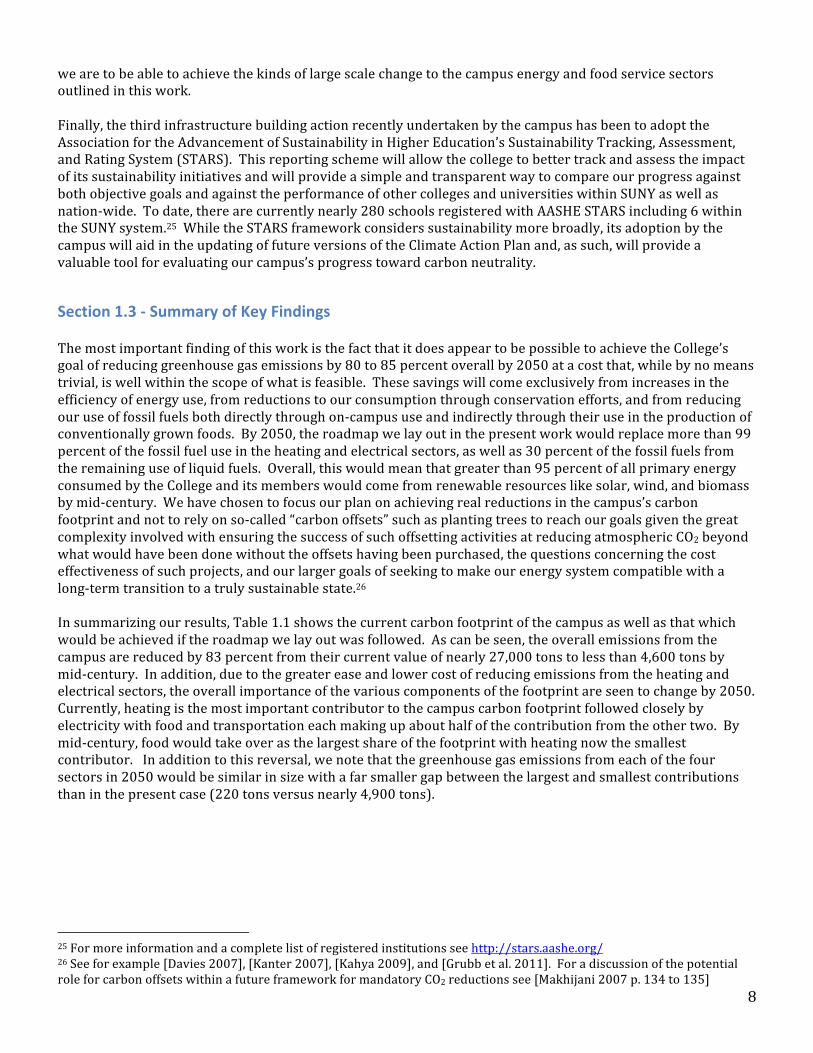
Section 1.3 -‐ Summary of Key Findings The most important finding of this work is the fact that it does appear to be possible to achieve the College’s goal of reducing greenhouse gas emissions by 80 to 85 percent overall by 2050 at a cost that, while by no means trivial, is well within the scope of what is feasible. These savings will come exclusively from increases in the efficiency of energy use, from reductions to our consumption through conservation efforts, and from reducing our use of fossil fuels both directly through on-‐campus use and indirectly through their use in the production of conventionally grown foods. By 2050, the roadmap we lay out in the present work would replace more than 99 percent of the fossil fuel use in the heating and electrical sectors, as well as 30 percent of the fossil fuels from the remaining use of liquid fuels. Overall, this would mean that greater than 95 percent of all primary energy consumed by the College and its members would come from renewable resources like solar, wind, and biomass by mid-‐century. We have chosen to focus our plan on achieving real reductions in the campus’s carbon footprint and not to rely on so-‐called “carbon offsets” such as planting trees to reach our goals given the great complexity involved with ensuring the success of such offsetting activities at reducing atmospheric CO2 beyond what would have been done without the offsets having been purchased, the questions concerning the cost effectiveness of such projects, and our larger goals of seeking to make our energy system compatible with a long-‐term transition to a truly sustainable state.26 In summarizing our results, Table 1.1 shows the current carbon footprint of the campus as well as that which would be achieved if the roadmap we lay out was followed. As can be seen, the overall emissions from the campus are reduced by 83 percent from their current value of nearly 27,000 tons to less than 4,600 tons by mid-‐century. In addition, due to the greater ease and lower cost of reducing emissions from the heating and electrical sectors, the overall importance of the various components of the footprint are seen to change by 2050. Currently, heating is the most important contributor to the campus carbon footprint followed closely by electricity with food and transportation each making up about half of the contribution from the other two. By mid-‐century, food would take over as the largest share of the footprint with heating now the smallest contributor. In addition to this reversal, we note that the greenhouse gas emissions from each of the four sectors in 2050 would be similar in size with a far smaller gap between the largest and smallest contributions than in the present case (220 tons versus nearly 4,900 tons).
25 For more information and a complete list of registered institutions see http://stars.aashe.org/ 26 See for example [Davies 2007], [Kanter 2007], [Kahya 2009], and [Grubb et al. 2011]. For a discussion of the potential role for carbon offsets within a future framework for mandatory CO2 reductions see [Makhijani 2007 p. 134 to 135]

9
Table 1.1: Greenhouse gas emissions from each sector as well as their percentage of the overall carbon footprint from the current data (2009-10) and for the projections in 2050 from the models presented in this work.
2010 2050
GHG Emissions (tons per year)
Percent of Total GHG Emissions (tons per year)
Percent of Total
Heating 9,080 34% 980 21%
Electricity 8,880 33% 1,100 24%
Food Service 4,650 17% 1,280 28%
Transportation 4,200 16% 1,200 26%
Total 26,800 4,560
As will be described in Section 4.3, we have chosen to visualize the results of our models using wedge diagrams similar to those originally proposed by researchers at Princeton University.27 In this analysis, we began by predicting the greenhouse gas emissions that would be emitted under a business-‐as-‐usual approach where no efforts are made to reduce emissions. From there, we identified viable strategies for lowering those emissions that are compatible with other conditions we chose to impose such as maximizing the use of renewable energy resources. Each of the selected strategies was then evaluated for its potential to reduce greenhouse gas emissions resulting in a series of wedge shaped reductions from the business-‐as-‐usual projection when plotted on a graph of emissions versus time, hence the name. In the three models presented in this work for heating, electricity, and transportation, we have chosen to utilize sigmoidal wedges rather than the more traditional straight edged, triangular shaped wedges. This is to allow us to take into account a more realistic rate of implementation that starts out slowly, increases rapidly as the institutional momentum for change increases over time, and then slows again at the end as the hardest and most complicated changes are assumed to be held until last. In the case of emissions from food service on campus, we did not have adequate information to propose a complete wedge model and have, instead, present a simple illustrative analysis in which the needed reductions are assumed to occur at a constant, linear rate. The overall results of our models are summarized in Figure 1.3 showing the aggregated reductions for each of the four main contributors to the campus footprint.
27 See for example [Pacala and Socolow 2004] and [Socolow et al. 2004]

10
Figure 1.3: Summary of the results from our models showing the remaining greenhouse gas emissions from each sector as well as the projections for what could be saved between 2015 and 2050. These results are built on the wedge models for heating, electricity, and transportation presented in Chapters 4, 5, and 6 and the illustrative analysis for the food service sector presented in Chapter 7. The jump in 2013-14 is due to the new Student Life Center and renovated Bowers Hall coming online while the reductions between now and then are due primarily to the introduction of satellite boilers on upper campus and the shutting down of the Central Heating Plant.
In order to put the reductions projected by our models into perspective and to determine if they are reasonable, it is important to have appropriate benchmarks against which they can be measured. As such, we have chosen to consider not only the goals of the Presidents’ Climate Commitment, but also to compare our projections against three other relevant goals that have recently been set for greenhouse gas reductions. First, there is the November 2007 State University of New York policy on energy conservation and sustainability which set a goal for colleges and universities within the SUNY system to reduce their emissions by 20 percent by 2014 relative to their level in 2006-‐07.28 This date is now just three years away and, as such, is within the timeframe of actions already planned out by the campus. While this roadmap primarily concerns itself with the 2015 to 2050 timeframe in order to focus on choices not already made by the campus, we do note that the College is likely to come close to achieving the goal of the SUNY policy, although it is currently unlikely to be able to fully meet the level of reductions it envisions. Specifically, we predict that by the end of 2012-‐13 campus emissions will have been reduced by about 18 percent relative to the 2006-‐07 footprint. This is very close to the desired reductions of 20 percent, however, by the end of the following year, both the new Student Life Center and the renovated Bowers Hall will have come online, adding significantly to our energy consumption and thus to the College’s greenhouse gas emissions. Our current estimates are that we will have achieved a net reduction of only about 15 percent from 2006-‐07 levels by the end of 2014, and will not reach the level of reductions targeted in the SUNY policy until we are about four years late. However, if more efficiency and conservation efforts are undertaken by the campus than are currently assumed or if more effort is placed on expanding the use of renewable sources of heating and electricity, it could still be possible for the College to meet the SUNY target for
28 The complete text of the SUNY policy on energy and sustainability is included in Appendix A.
0
5,000
10,000
15,000
20,000
25,000
30,000
2010 2015 2020 2025 2030 2035 2040 2045 2050
Annual Greenhouse Gas Emission from
the Campus
(metric tons CO2 per year)
CO2 Saved - Transportation
CO2 Saved - Food Service
CO2 Saved - Heating
CO2 Saved - Electricity
Remaining CO2 - Transportation
Remaining CO2 - Food Service
Remaining CO2 - Heating
Remaining CO2 - Electricity
11
greenhouse gas reductions. It should be a near-‐term goal for the campus to try and meet the reductions targeted by SUNY. If such efforts were successful, the lower starting emissions in 2015 would simplify somewhat our present roadmap and would have a substantial effect on the most important metric by which such programs should be judged, namely the total, cumulative amount of CO2 that is prevented from entering the atmosphere between now and 2050. The second metric by which we can benchmark the reductions predicted by our models is the goal set forth in Executive Order #24 signed by then Governor David Paterson on August 6, 2009. This executive order states
It shall be a goal of the State of New York to reduce current greenhouse gas emissions from all sources within the State eighty percent (80%) below levels emitted in the year nineteen hundred ninety (1990) by the year two-‐thousand fifty (2050).29
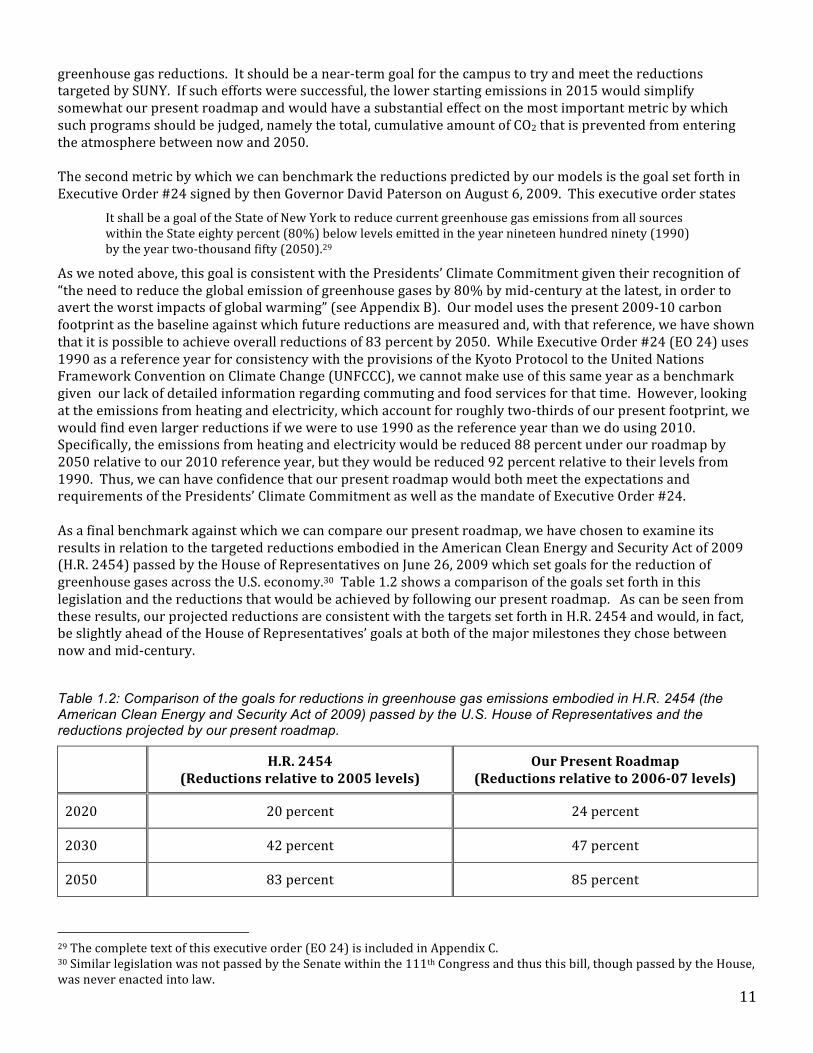
As we noted above, this goal is consistent with the Presidents’ Climate Commitment given their recognition of “the need to reduce the global emission of greenhouse gases by 80% by mid-‐century at the latest, in order to avert the worst impacts of global warming” (see Appendix B). Our model uses the present 2009-‐10 carbon footprint as the baseline against which future reductions are measured and, with that reference, we have shown that it is possible to achieve overall reductions of 83 percent by 2050. While Executive Order #24 (EO 24) uses 1990 as a reference year for consistency with the provisions of the Kyoto Protocol to the United Nations Framework Convention on Climate Change (UNFCCC), we cannot make use of this same year as a benchmark given our lack of detailed information regarding commuting and food services for that time. However, looking at the emissions from heating and electricity, which account for roughly two-‐thirds of our present footprint, we would find even larger reductions if we were to use 1990 as the reference year than we do using 2010. Specifically, the emissions from heating and electricity would be reduced 88 percent under our roadmap by 2050 relative to our 2010 reference year, but they would be reduced 92 percent relative to their levels from 1990. Thus, we can have confidence that our present roadmap would both meet the expectations and requirements of the Presidents’ Climate Commitment as well as the mandate of Executive Order #24. As a final benchmark against which we can compare our present roadmap, we have chosen to examine its results in relation to the targeted reductions embodied in the American Clean Energy and Security Act of 2009 (H.R. 2454) passed by the House of Representatives on June 26, 2009 which set goals for the reduction of greenhouse gases across the U.S. economy.30 Table 1.2 shows a comparison of the goals set forth in this legislation and the reductions that would be achieved by following our present roadmap. As can be seen from these results, our projected reductions are consistent with the targets set forth in H.R. 2454 and would, in fact, be slightly ahead of the House of Representatives’ goals at both of the major milestones they chose between now and mid-‐century. Table 1.2: Comparison of the goals for reductions in greenhouse gas emissions embodied in H.R. 2454 (the American Clean Energy and Security Act of 2009) passed by the U.S. House of Representatives and the reductions projected by our present roadmap.
H.R. 2454 (Reductions relative to 2005 levels)
Our Present Roadmap (Reductions relative to 2006-07 levels)
2020 20 percent 24 percent
2030 42 percent 47 percent
2050 83 percent 85 percent
29 The complete text of this executive order (EO 24) is included in Appendix C. 30 Similar legislation was not passed by the Senate within the 111th Congress and thus this bill, though passed by the House, was never enacted into law.
12
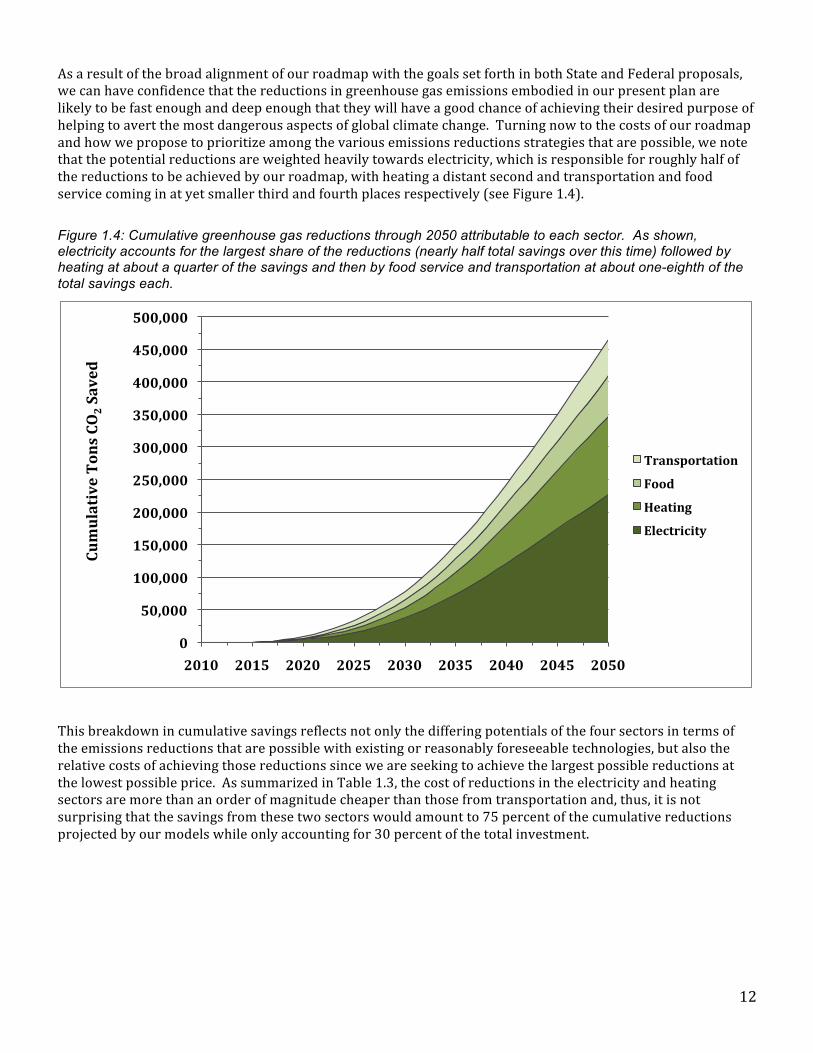
As a result of the broad alignment of our roadmap with the goals set forth in both State and Federal proposals, we can have confidence that the reductions in greenhouse gas emissions embodied in our present plan are likely to be fast enough and deep enough that they will have a good chance of achieving their desired purpose of helping to avert the most dangerous aspects of global climate change. Turning now to the costs of our roadmap and how we propose to prioritize among the various emissions reductions strategies that are possible, we note that the potential reductions are weighted heavily towards electricity, which is responsible for roughly half of the reductions to be achieved by our roadmap, with heating a distant second and transportation and food service coming in at yet smaller third and fourth places respectively (see Figure 1.4). Figure 1.4: Cumulative greenhouse gas reductions through 2050 attributable to each sector. As shown, electricity accounts for the largest share of the reductions (nearly half total savings over this time) followed by heating at about a quarter of the savings and then by food service and transportation at about one-eighth of the total savings each.
This breakdown in cumulative savings reflects not only the differing potentials of the four sectors in terms of the emissions reductions that are possible with existing or reasonably foreseeable technologies, but also the relative costs of achieving those reductions since we are seeking to achieve the largest possible reductions at the lowest possible price. As summarized in Table 1.3, the cost of reductions in the electricity and heating sectors are more than an order of magnitude cheaper than those from transportation and, thus, it is not surprising that the savings from these two sectors would amount to 75 percent of the cumulative reductions projected by our models while only accounting for 30 percent of the total investment.
0
50,000
100,000
150,000
200,000
250,000
300,000
350,000
400,000
450,000
500,000
2010 2015 2020 2025 2030 2035 2040 2045 2050
Cumulative Tons CO
2 Saved
Transportation
Food
Heating
Electricity

13
Table 1.3: Cumulative reductions in greenhouse gases attributable to each sector and the associated costs. As can be seen, the electricity sector has the largest potential savings at the lowest cost per ton, while transportation has the lowest potential savings and the highest cost per ton.
Cumulative Reductions (tons CO2)
Percent of Cumulative Reductions
Cumulative Investments
Percent of Cumulative Investment
Average Cost per ton CO2 Saved
Heating 121,000 26% $4.6 million 11% $38
Electricity 226,400 49% $8.0 million 19% $35
Food Service 61,700 12% $5.8 million 13% $93 (1)
Transportation 55,500 13% $25 million 58% $450
Total 464,700 $43.3 million $93
(1) Note: We have not been able to propose a wedge model for the food service sector in the present work and, as such, have chosen to use the average cost of reductions from the energy sector as an illustrative estimate of the cost for reductions in greenhouse gas emissions from agriculture (see Chapter 7). With respect to the transportation sector, some care must be taken to distinguish between the investments required by the College to make changes in its bus and vehicle fleets and those that will be required of the faculty, staff, and students in order to improve the way they commute to campus. Of the $25 million required for the transportation sector as a whole, $16.6 million will be required for commuters while the remaining $8.3 million will be required for campus vehicles. For comparison, the average cost for commuters would amount to nearly $475,000 per year which represents an increase of about 37 percent over the $1.3 million the campus community currently pays for the gasoline required to commute to and from campus. If the costs of car insurance, oil changes, and vehicle maintenance attributable to commuting were added to the cost of gasoline noted above, the relative increase in expenditures required for making the sustainability improvements we propose would be even less. For another way to compare the needed investments, we note that the average cost per commuter would amount to roughly $165 per year (or roughly 45 cents per day) which can be compared to the current student transportation fee of $164 per year. Turning to the campus itself, the overall cost to the College that would be required to follow the roadmap we have outlined would be $26.7 million or an average of about $740,500 per year. This would represent an increase of about 17 percent over the $4.3 million per year the campus currently pays for the electricity, natural gas, and liquid fuels it consumes. This cost would amount to roughly $93 per person per year which, for comparison, is less than half of the current student activity fee of $200 per year. The cumulative investment required by our present roadmap between 2015 and 2050 is shown in Figure 1.5.

14
Figure 1.5: The cumulative amount of money above and beyond what would normally be spent under a business-as-usual strategy that would be required if the roadmap we present was to be implemented. This total takes into account both the capital costs of projects as well as any costs or savings in fuel costs through 2050.
From Figure 1.5, it can be seen that the cost of achieving the projected reductions in greenhouse gas emissions for the campus does not rise steadily and, in fact, reaches a maximum of roughly $30 million in the early 2040s before beginning to decrease. This turn-‐around in the cumulative cost occurs because the efficiency and conservation projects built into the model result in reduced energy expenditures when implemented and because the future increase in electricity costs from the grid outstrip the cost of electricity from many types of renewables resulting in eventual cost savings from having made this switch. Figure 1.5 also shows that the rate of expenditures is not constant over time and ramps up during the first 20 years of the plan before beginning to decrease. As such, we have recommended that the campus form a high-‐level committee whose chief responsibility is to develop five-‐year funding plans aimed at providing the needed investment capital for the campus (see Chapter 8). The overall funding needs for the College will rise from a little over $2.8 million during the first five years of the plan (2015 to 2020) to a maximum of $8.6 million for the period between 2030 and 2035. By the last five years of the plan, however, these funding needs will actually drop to a negative number as the roadmap would result in substantial savings over what would need to be spent under a business-‐as-‐usual scenario. In addition, we note that these funding requirements are weighted heavily to the heating and electricity sectors in the near term with nearly 80 cents of every dollar to be spent over the first 20 years of the plan going to improvements in just these two sectors alone. As noted above, this is in large part a result of their greater potential for greenhouse gas savings as well as their far lower costs as compared to transportation. In closing, it is important to note that we have chosen not to take into account any future economic cost associated with the campus’s emission of carbon dioxide and other greenhouse gases. As discussed above, the Regional Greenhouse Gas Initiative (RGGI) currently imposes an average cost of $4.62 per metric ton for the
$0
$5,000,000
$10,000,000
$15,000,000
$20,000,000
$25,000,000
$30,000,000
$35,000,000
2010 2015 2020 2025 2030 2035 2040 2045 2050
Cumulative Cost (constant dollars)
Cumulative Cost - On Campus
Cumulative Cost - Commuters

15
carbon allowances it sells and auctions off to northeast and mid-‐Atlantic utilities.31 If such a cost was imposed on the emissions from SUNY Cortland over the time frame of our roadmap, the total, net costs to the campus for our proposals would be reduced by roughly $2 million. More dramatically, in their analysis of the American Clean Energy and Security Act, the EPA estimated that the average cost of the carbon allowances associated with the cap-‐and-‐trade and other programs included in this legislation would amount to an average of $15.50 per ton in 2015 rising to $86 per ton in 2050.32 If these prices for carbon were included in our analysis the net, cumulative cost to the College would drop by more than 80 percent to a total of just $4.5 million or an average annual cost of just $127,000 per year. Thus, great care should be taken as this action plan is updated to investigate the potential for any such costs to be imposed on the College’s greenhouse gas emissions in the future. Finally, we conclude this summary with a reminder that the climate action plan should be viewed as a dynamic, living document that will need to be regularly updated to take into account changes occurring in the world of energy efficiency and renewable energy and the changing availabilities and access to local foods. In addition, future versions of this plan will be able to incorporate the smaller sources of greenhouse gas emissions that we were not able to be include in this initial roadmap. These areas include such things as air travel by faculty and staff, non-‐food waste created on-‐campus, travel to and from home by the students during the year and over holidays, travel for classroom observation, field-‐practicum, and student teaching by pre-‐service teachers, and commuting by students to summer session classes. While predictions of the future are always fraught with uncertainties, particularly those looking out as far as the present roadmap is required to, regularly reviewing the assumptions and structure of the models we have proposed will help to ensure that the College and its leaders have the very best information available when seeking to make decisions regarding campus sustainability. As such, we have recommended that the action plan be revised at least once every two years to ensure its results remain relevant (see Chapter 8). With that, we will now turn to the details of our analysis. We will begin with a discussion of the campus carbon footprint before turning to the efforts that are already underway and those that will be needed in order to reduce the College’s emissions by the amounts summarized in this section.
31 RGGI 2011 p. 3 to 4 32 EPA 2010 p. 18

16
Chapter 2: SUNY Cortland’s Carbon Footprint
Section 2.1 -‐ Methodology
The carbon footprint for the campus was calculated using a custom designed tool originally developed by the author and Justin Winters, a physics major taking the environmental science concentration. As part of Justin’s ENS 487: Environmental Science Internship course, an overall approach to calculating the greenhouse gas emissions for the campus was developed that focused on five major areas: (1) the direct emissions from burning natural gas and fuel oil for heating, (2) the direct emissions associated with the production of electricity used by the campus, (3) the direct and indirect emissions from the production, transport, and processing of the food served on campus, (4) the direct emissions from gasoline consumed during the daily commute of the campus community, and (5) the direct emissions from gasoline and diesel fuel consumed by on-‐campus vehicles such as the buses, maintenance vehicles, and catering trucks. For the greenhouse gas emissions associated with heating, electricity, and on-‐campus vehicle use, the needed information was readily available from the College. For these areas, the total amount of energy consumed by the campus was used along with the emissions factors shown in Table 2.1 to determine the total amount of CO2 released over the year. For example, in the 2009-‐2010 fiscal year, the campus consumed 171,260 decatherms (Dth) of natural gas for heating and hot water. Each Dth of gas releases 53.0 kilograms of CO2 when it is burned, so the natural gas consumed by the campus released a total of 9,100 tons of CO2 into the environment. The complete results of this analysis are included in the following section. Table 2.1: Energy related emissions factors used in calculating the 2009-10 campus carbon footprint.33
Energy Source Emissions Factor (Standard Units)
Emissions Factor (1) (Common Energy Unit)
Electricity 0.395 kg CO2 per kWh 116 kg CO2 per million BTU
Diesel Fuel 10.3 kg CO2 per gallon 74.0 kg CO2 per million BTU
Heating Oil 10.3 kg CO2 per gallon 74.0 kg CO2 per million BTU
Gasoline 8.86 kg CO2 per gallon 71.3 kg CO2 per million BTU
Natural Gas 53.0 kg CO2 per Dth 53.0 kg CO2 per million BTU
The emissions factor for electricity of 0.395 kg CO2 per kWh was derived from data on the average emissions in 2009 associated with the electricity generated in Connecticut, Massachusetts, Maine, New Hampshire, New Jersey, New York, Pennsylvania, Rhode Island, and Vermont. We chose to consider these nine northeast and mid-‐Atlantic states in combination in order to more accurately capture the footprint of the electricity flowing through the larger grid to which SUNY Cortland is connected. If we had chosen to consider only the closest large-‐scale commercial generating station to SUNY Cortland (i.e. the coal fired AES Cayuga plant located on Cayuga Lake near Ithaca, NY) we would have found significantly higher emissions per kWh than what we are using (about 2.5 times higher). On the other hand, if we had only used the average emissions factor for electricity generated in New York state alone, we would have found a somewhat lower value (about 27% less). The emissions factors for diesel fuel, heating oil, gasoline, and natural gas were all derived from the Environmental Protection Agency’s 2009 estimates for the emissions from fossil fuel combustion in the United
33 EIA 2011b, EIA 2011c, and EPA 2011 p. A-‐25

17
States. If we had used the generic emissions factors recommended by the IPCC instead, the resulting estimates for the emissions from these fuels would have increased by 2.5 percent for gasoline, 5.7 percent for diesel, and 12 percent for natural gas.34 For consistency with our use of the EPA’s estimates for agricultural emissions (see below) we chose to make use of the Agency’s emission factors for fossil fuels as well. Thus, our current methodology most closely resembles a Tier 2 carbon inventory under the IPCC classification scheme which is appropriate given the availability of country-‐specific emissions factors.35 Turning to the remaining categories of emissions from personal commuting and food service, a more complicated assessment was required given the fact that the university does not directly track consumption in these two areas. Thus, in order to gather the required information, a survey instrument was developed to collect data on commuting patterns, the age of vehicles driven by members of the community, the use of carpooling, and other transportation data, as well as to collect information on the use of campus dining services. The original survey developed by Justin Winters was extended and revised as part of a project with students from the Fall 2010 section of PHY 505: Energy and Sustainability. Copies of two carbon intensity surveys used for this report are included in Appendix D. After receiving approval from the Institutional Review Board (IRB) for our proposed survey protocol, roughly 40 classes including students from across all three schools at the college (Arts and Sciences, Professional Studies, and Education) were chosen in which the instructors had agreed to distribute the surveys to their students. These classes included:
AED 442, AED 642, AED 668, AED 669, BIO 111, BIO 533, CHE 125, CHE 222, CHE 302, ECO 110, ECO 325, EDU 632, ENG 431, ENG 616, ENS 486, EST 100, EXS 201, EXS 387, GLY 171, GLY 172, HIS 432, HIS 648, HIS 660, HLH 390, HLH 693, HLH 694, PHY 106, PHY 150, PHY 201, PHY 203, PHY 440, PHY 450, PHY 576, PSY 433, REC 380, REC 445, SCI 141, SCI 142, and SPM 360
From these classes a total of 959 student surveys were returned accounting for nearly 14 percent of the overall student body. Faculty from 18 departments spanning all three schools were approached with a survey as well. These included the departments of:
Biological Sciences, Chemistry, Childhood/Early Childhood Education, Communications Disorders and Sciences, Economics, English, Foundations and Social Advocacy, Geology, History, Kinesiology, Literacy, Mathematics, Philosophy, Physical Education, Physics, Recreation, Parks and Leisure Studies, Sociology/Anthropology, and Sports Management
From these departments a total of 110 faculty (78 full-‐time and 32 part-‐time) returned the surveys representing more than 18 percent of the faculty as a whole. Finally, staff and administrators were selected from across the campus with representatives from more than 20 departments or divisions returning surveys. These included:
Academic Affairs, Academic Computing Services, Admissions Office, Auxiliary Services Corporation (ASC), Environmental Health and Safety Office, Facilities Management, Finance and Management, Human Resources Office, Information Resources, International Programs, Mail Services, Motor Vehicle Maintenance, Physical Plant, President's Office, Provost's Office, Registrar's Office, Research and Sponsored Programs, Residence Life and Housing, Student Affairs, and the University Police Department
From these areas, a total of 95 administrators and staff returned surveys (71 full-‐time staff, 14 administrators, and 10 part-‐time staff) representing nearly 14 percent of the total population. Figures 2.1 and 2.2 show the size of the various populations on campus as well as the breakdown of survey coverage. It is easy to see from these figures that we achieved statistical significance in every population with a low return rate of just over nine percent for graduate students and the high rate of nearly 19 percent for juniors. 34 IPCC 2006 p. 2.20 to 2.21 and 3.16 35 IPCC 2006 p. 2.12 and 2.15

18
Figure 2.1: Total population of the different communities on campus as of Fall 2010.
Figure 2.2: Percentages of the different communities on campus that were surveyed for this work. While faculty and staff are shown here as single blocks, individual data sets for full and part-time faculty as well as full and part-time staff, and administrators were collected to account for internal differences within these populations.
0
500
1,000
1,500
2,000
2,500
Faculty
Staff / Admin
First year
Sophmore
Junior
Senior
Graduate
Number of People
0%
5%
10%
15%
20%
Faculty
Staff / Admin
First year
Sophmore
Junior
Senior
Graduate
Percent of Population Surveyed

19
From the data on commuting patterns as well as the age and type of vehicle driven to campus, total weekly commuting distances, total gasoline consumption per week, and the average number of people driving to work versus walking or taking the bus were calculated. Using the emissions factor for gasoline in Table 2.1, the average weekly CO2 emissions for members of each sub-‐population was then calculated and used to find the total emissions from the campus as a whole by multiplying the weekly average by the numbers of weeks per year that faculty, students, and staff commute to campus. In addition to the amounts of CO2 calculated using the average emissions factors in Table 2.1, an additional source term was included to account for the impact of so-‐called “excess cold-‐start emissions”. When a vehicle’s engine is cold, it will emit a larger amount of CO2 and other pollutants until it has warmed sufficiently for the engine and the catalytic converter to reach peak efficiency.36 These excess emissions are less important for long trips accounting, for example, to only about a 6 percent increase in the commuting emissions from full-‐time staff. However, for short trips these cold-‐start emissions are more important. For example, a model year 2002 car (the average age of cars for juniors and seniors at SUNY Cortland) being driven from West Campus to the street-‐side parking areas near Memorial Library travels a distance of approximately 2.3 miles. The excess emissions associated with its engine being cold during this trip would amount to an increase of about 25 percent over those that would be calculated from simply considering the car’s average fuel efficiency. Similarly, a maintenance or delivery truck driven across campus and then shut off would have roughly 15 to 30 percent higher emissions per trip due to these cold start emissions. As a result, the impact of short trips is disproportionately large in a colder climate like Cortland, and thus the elimination of these trips should remain a priority even though they result in much less overall gasoline consumption than the long-‐distance commutes of some faculty, staff, and graduate students. The results of our assessment of commuting are discussed in greater detail in Chapter 6. Turning to the calculation of agricultural emissions, it is important to consider a complete life-‐cycle analysis due to the importance of non-‐carbon dioxide greenhouse gases such as nitrous oxide (N2O) released from the oxidation of nitrogenous fertilizer and methane (CH4) created by ruminant animals and from manure management. The impact of these gases on global climate change is higher than that of CO2 for the same amount of gas. As a result, this difference is often expressed in terms of what is called their “global warming potential” which compares their heat trapping power to that of carbon dioxide in order to make comparisons between gases easier. For example, on a 100 year basis, the global warming potential for methane is 21 times that of CO2 while nitrous oxide is 310 times as powerful as carbon dioxide.37 In order to take these emissions into account, we used the Environmental Protection Agency’s estimates for the total agricultural emissions associated with the production of food in the U.S. and added to it an estimate for the emissions due to the transport and delivery of that food.38 From this, an average of 1.89 metric tons CO2-‐equivalent per person per year was derived. In deriving this result, we used the conclusions of Weber and Matthews that, on average, the emissions associated with the transportation and delivery of food represent only 11 percent of their life-‐cycle emissions.39 Thus, we took the EPA’s per-‐capita estimate and increased it to 1.89 tons so that the EPA’s estimate for emissions from production alone (1.68 tons per person per year) represented 89 percent of the total once transportation and delivery was included. In comparing our estimate to that of Weber and Matthews, we note that our value is about 40 percent less than what they had derived (i.e. 3.06 tons per person per year in 1997). However, using the older EPA data available for 1995 in order to estimate a value closer in time to that used by Weber and Matthews, we find that our methodology would result in an estimate for per-‐capita emissions that is
36 See for example, [Blaikley et al. 2001], [Smith 2001], and [Weilenmann et al. 2005] 37 EPA 2011 p. ES-‐3 38 Weber and Matthews 2008 and EPA 2011 p. 2-‐20 and 6-‐17 to 6-‐19 [Note: The GHG emissions from non-‐food producing agricultural lands such as forests and settlements have been subtracted from the overall figure we use in our calculations.] 39 [Weber and Matthews 2008 p. 3508 and 3511] This estimate is consistent with earlier investigations from the 1980s that found that transportation amounted to about 16 percent of the primary energy consumed by U.S. agriculture. [McLaughlin et al. 2000 p. 2.2]
20
within 10 percent of that used by Weber and Matthews.40 Thus, we can have confidence that our methodology is resulting in a reasonable estimate of the impact of on-‐campus food service. As a second reasonableness check on the validity of our methodology, we note that our values for the total per-‐capita emissions from the agricultural sector are also consistent with another major study of the impacts of food production, namely that of Eshel and Martin.41 In this work, the authors used estimates of the energy intensity of different foods to estimate the CO2 emissions associated with their production and then added to that the contribution of non-‐CO2 greenhouse gases like methane and nitrous oxide released on the farm. In this work, Eshel and Martin implied an estimate for the per capita emissions of the average U.S. diet in 2003 that ranged from 2.18 to 2.46 tons CO2-‐eq per person per year. Interesting, 72 to 82 percent of these emissions were found to come from meat and animal products such as eggs and dairy despite only making up less than 28 percent of the modeled caloric intake.42 Using our methodology, the EPA’s estimate for the per-‐capita emissions in 2003 would have amounted to 2.44 tons CO2-‐eq per person per year after taking transportation and delivery into account.43 Thus, our current methodology is found to also be consistent with the results of Eshel and Martin lending further confidence to our results. Once the total annual per-‐capita emissions for food production and delivery were known for an individual, information from the carbon intensity survey was used to determine the fraction of food consumed by the various college populations that is supplied by the Auxiliary Services Corporation (ASC). This fraction was then used to allocate the share of annual food-‐based emissions for each sub-‐population between school and home. In order to try to increase the accuracy of this self-‐reporting scheme for food consumption, we asked about eating patterns in two different and distinct ways and averaged the two responses together for each survey. The estimate for the greenhouse gas emissions from food service resulting from this analysis is discussed in detail in Chapter 7. As a final note, we must point out that we have chosen not to include in the current footprint two areas that had previously been examined for the campus by Justin Winters, namely those associated with paper use on campus and those from air-‐travel booked by the university. In the previous carbon footprint study these were found to amount to 1.0 percent and 0.5 percent of the overall campus greenhouse gas emissions respectively. Given their small contributions and the already significant complexity of the models used to project future emissions for electricity, heating, and vehicular transportation, these two areas were dropped from this version of the carbon footprint. As future work continues, they and other areas not currently captured by the footprint such as the amount of driving associated with student teaching and other field placement activities will be included. As a brief note in closing, however, it is important to point out that, while we have not quantified their emissions, the campus is making efforts to reduce the amounts of waste, including paper. For example, the campus recycling program has recently increased the amount of material that is recycled by approximately 65 tons, representing a nearly 50 percent decrease in waste and an annual savings of $4,000 in disposal costs. This effort is enhanced by those of several academic departments to reduce their use of paper during the academic year through such things as increasing their use of online delivery of course documents. As a final example of these waste reduction efforts, Residence Life and Housing helps to organize and run a program that helps to refurbish and restore furniture that is then either reused in the residence halls themselves or is donated to an organization that makes the furniture available to families in need.
Section 2.2 -‐ Results
The results of the carbon footprint assessment are shown in Figures 2.3 and 2.4. These graphs show that the overall footprint from the campus amounts to 26,800 tons of CO2-‐equivalent per year or a per-‐capita emission of 3.3 tons of CO2 per person per year. This is roughly a 12 percent reduction from the previous assessment of
40 Weber and Matthews 2008 p. 3509 and EPA 2007 p. 2-‐26 and 6-‐18 to 6-‐19 41 Eshel and Martin 2006 42 Eshel and Martin 2006 p. 5 to 13 43 EPA 2007 p. 2-‐26 and 6-‐18

21
30,600 tons per year (without paper or air travel included). This reduction is due in large part to a reduction in the usage of natural gas by the campus for heating, a sharp reduction in the carbon intensity of the electricity purchased from the grid, and an overall reduction in the estimated emissions from the agricultural sector due to changes in the EPA’s methodology. These three components of the campus footprint are discussed further in Chapters 4, 5, and 6. The largest contributions to the carbon footprint are heating (33.9 percent) and electricity (33.1 percent) followed by food (17.4 percent) and transportation (16.0 percent for both commuting and on-‐campus vehicles). This is consistent with our findings from the last carbon footprint study in which heating and electricity accounted for 33.9 percent and 34.5 percent respectively, while food and transportation accounted for 18.4 percent and 13.2 percent respectively. The four sectors separate easily into two groups within which each member is of roughly equal importance to the other (i.e. heating and electricity as one group in which each sector is responsible for about one-‐third of the total footprint and food and transportation as the other group with each making up about one-‐sixth of the total). This grouping will allow us to more easily prioritize our efforts to eliminate these emissions by focusing on the biggest contributors first and will help to guide decisions regarding the most important areas where investments should be made. Figure 2.3: Contributions to SUNY Cortland’s carbon footprint in metric tons-CO2 per year from heating, electricity, food, and transportation. The left-most column (blue) shows the results from the current study covering 2009-10, while the right-most column (red) shows the results from the previous estimate from 2006-07.
0
2,000
4,000
6,000
8,000
10,000
12,000
Heating Electricity Food Transportation
Annual Greenhouse Gas Emissions
(tons CO
2 per year)
2009-10
2006-07

22
Figure 2.4: Relative importance of each of the four sectors (heating, electricity, food, and transportation) to the overall carbon footprint of the campus in 2009-10.
In addition to the breakdown of the campus’s carbon footprint shown on the previous page, the data we have collected can also be used to determine the primary energy use by the College (i.e. the direct use of energy by the campus and its community excluding the indirect energy imbedded in things like food). This breakdown is helpful because electricity, while a high quality form of energy, currently has disproportionately large greenhouse gas emissions compared to natural gas (see Table 2.1). Thus, it is important to keep this distinction in mind between reductions in CO2 and reductions in energy use. From Figure 2.5, we can see that, unsurprisingly, the largest use of energy on campus comes from heating. Burning natural gas and fuel oil to heat the campus accounts for nearly three-‐fifths of all energy consumption, while electricity follows in second place with roughly one-‐quarter of the campus energy demand, and transportation comes in third at just 16 percent of the total. Thus, despite being responsible for virtually identical amounts of greenhouse gases, heating consumes almost two and a quarter times as much energy as does the electrical sector on campus. Of the energy used for transportation, more than 80 percent of it is consumed by daily commuting to and from campus while less than a fifth of transportation energy is consumed by all of the on-‐campus vehicles (including the catering trucks, maintenance vehicles, and campus buses).
Heating; 34%
Electricity; 33%
Food; 17%
Transportation; 16%
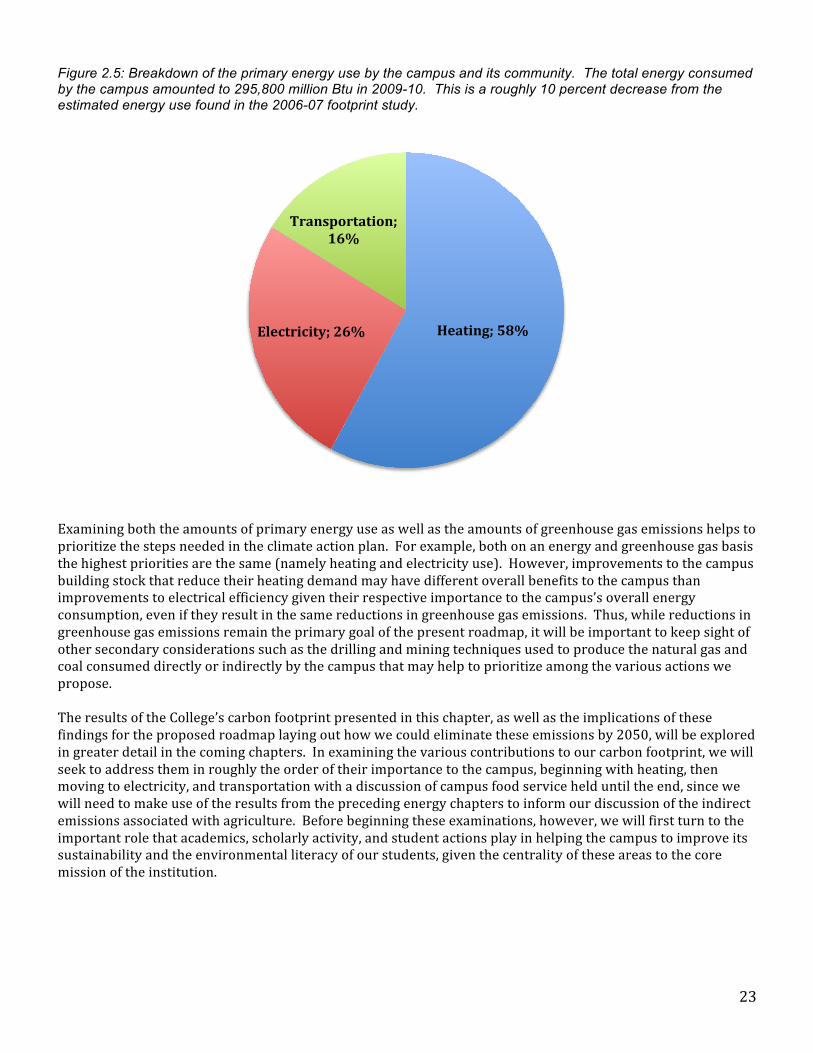
23
Figure 2.5: Breakdown of the primary energy use by the campus and its community. The total energy consumed by the campus amounted to 295,800 million Btu in 2009-10. This is a roughly 10 percent decrease from the estimated energy use found in the 2006-07 footprint study.
Examining both the amounts of primary energy use as well as the amounts of greenhouse gas emissions helps to prioritize the steps needed in the climate action plan. For example, both on an energy and greenhouse gas basis the highest priorities are the same (namely heating and electricity use). However, improvements to the campus building stock that reduce their heating demand may have different overall benefits to the campus than improvements to electrical efficiency given their respective importance to the campus’s overall energy consumption, even if they result in the same reductions in greenhouse gas emissions. Thus, while reductions in greenhouse gas emissions remain the primary goal of the present roadmap, it will be important to keep sight of other secondary considerations such as the drilling and mining techniques used to produce the natural gas and coal consumed directly or indirectly by the campus that may help to prioritize among the various actions we propose. The results of the College’s carbon footprint presented in this chapter, as well as the implications of these findings for the proposed roadmap laying out how we could eliminate these emissions by 2050, will be explored in greater detail in the coming chapters. In examining the various contributions to our carbon footprint, we will seek to address them in roughly the order of their importance to the campus, beginning with heating, then moving to electricity, and transportation with a discussion of campus food service held until the end, since we will need to make use of the results from the preceding energy chapters to inform our discussion of the indirect emissions associated with agriculture. Before beginning these examinations, however, we will first turn to the important role that academics, scholarly activity, and student actions play in helping the campus to improve its sustainability and the environmental literacy of our students, given the centrality of these areas to the core mission of the institution.
Heating; 58% Electricity; 26%
Transportation; 16%

24
Chapter 3: Academic Programs, Research, and College Initiatives
Section 3.1 -‐ Curricular Activities
As with all of the chapters in this report, the examples highlighted here are in no way meant to be an exhaustive listing of all activities on campus, and are instead intended to serve only as illustrations of the activities being undertaken by the campus community. One of the requirements of the Presidents’ Climate Commitment is to develop “[a]ctions to make climate neutrality and sustainability a part of the curriculum and other educational experience for all students”. While there is always room for continued improvement, it is important to note that SUNY Cortland has a long and successful track record when it comes to integrating environmentalism, environmental science, and sustainability related issues into the broader curriculum. For example, a partial listing of courses that focus on these issues or where such topics are a major theme within the curriculum includes: ANT 410 -‐ Cultural Ecology GRY 370 -‐ Will the World Provide? A Research
Experience for Students
ATH 321 -‐ Seminar in Art History: Environmentalism and Art
GRY 470 -‐ Resource Geography
ATT 115 -‐ Field Study at Raquette Lake HIS 432 -‐ World Environmental History BIO 310 -‐ Field Biology HLH 390 -‐ Environmental Health and Ecology
BIO 405 – Conservation Biology HLH 392 -‐ Environmental Pollutants and Toxicology
BIO 412 -‐ General Ecology HLH 590 -‐ Public Health and the Environment BIO 505 -‐ Case Studies in Conservation Biology PHI 320 -‐ Environmental Ethics
BIO 524 – Physiological Ecology PHI 329 -‐ Special Topics: Animals and Ethics
CHE 125 -‐ Chemistry and the Environment PHY 405 -‐ Energy and Sustainability CON 460 -‐ Conservation Biology Seminar PHY 505 -‐ Energy and Sustainability
CON 461 -‐ Conservation Biology Internship PHY 567 -‐ Thermodynamics of Building Design and Technology
ECO 335 -‐ Resource and Environmental Economics PHY 576 -‐ Physics of Renewable Energy Technologies EDU 462 -‐ Environmental and Outdoor Education POL 242 -‐ Environmental Policy
EDU 548 -‐ The Adirondack Classroom POL 308 -‐ Environmental Law
ENS 486 -‐ Seminar in Environmental Science POL 342 -‐ Environmental Policy and Biodiversity ENS 487 -‐ Environmental Science Internship POL 345 -‐ Adirondack Park Policies and Issues
EST 100 – Introduction to Environmental Studies REC 310 -‐ Wilderness and American Culture
EST 176 -‐ Green Representative: Sustainability in the Campus Community
REC 315 -‐ Ecotourism
EST 548 -‐ The Adirondack Classroom REC 462 -‐ Environmental and Outdoor Education
GLY 160 -‐ Environmental Geology REC 469 -‐ Environmental and Cultural Interpretation
GLY 371 – Meteorology REC 610 -‐ Wilderness and American Culture GLY 579 -‐ Climate Change SCI 300 -‐ Science and Its Social Context
GRY 301 -‐ Science, Human Affairs and the Environment SCI 320 -‐ Science, Technology and Culture
GRY 315 -‐ Ecotourism SOC 340 -‐ Environmental Sociology Besides the nearly 50 courses highlighted above, other areas within the curriculum have also been adapted by the faculty at SUNY Cortland to include a focus on sustainability and environmental issues. For example, many
25
art studio courses support the creative efforts of students in their choice of topics, which often includes environmental issues, as well as the purposeful use of sustainable materials. In addition, the genre of landscape in contemporary art is generally ecologically, rather than topographically based, so environmentalism and sustainability related themes are a perennial topic with many courses that cover these forms of art. As a further example, Scott Moranda from the History Department teaches HIS 111: Western Civilization since 1715 as part of the “Our Storied Land” Learning Community. This Learning Community focuses on environmental issues with, for example, HIS 111 being taught in such a way that the importance of the environment is factored into major periods of modern western civilization. In addition, students in the “Our Storied Land” Learning Community participate in an educational hike at the Lime Hollow Center for Environment and Culture. During the hike, students are asked to consider the various uses of the land since the 1600’s, many of which can still be read in the landscape today. The hike connects to classroom activities in the Learning Community, and asks students to think about the consequences of market pressures on local land uses. Students also attend an overnight field trip to Raquette Lake, during which they learn about the development of a wilderness ethic during the period of the Great Camps in the late nineteenth century and participate in a visit to Blue Mountain’s Adirondack Museum. A final example of the imbedding of environmental topics within the curriculum involves student internship experiences. Seniors taking the CPV 400 Internship in Social Justice, for instance, have taken on such topics as exploring the potential risks associated with the large scale use of hydraulic fracture drilling for natural gas (hydrofracking) or activities such as working with the Lime Hollow Center for Environment and Culture teaching young children about sustainability and about the value of deepening their appreciation of nature. Similar environmentally focused internships and summer programs have recently been undertaken by students in departments ranging from biology to political science as well. Integrating many of the individual courses discussed above, there are nearly a dozen majors and at least one minor offered at SUNY Cortland which have a primary focus or concentration on issues relating to sustainability, environmental science, or other environmental topics. These include:
Majors:
Biology: Concentration in Environmental Science
Business Economics: Concentration in Environmental Management
Chemistry: Concentration in Environmental Science Childhood Education: Environmental Studies Concentration
Community Health: Concentration in Environmental Health
Conservation Biology Early Childhood Education: Environmental Studies Concentration
Early Childhood and Childhood Education: Environmental Studies Concentration
Geology: Concentration in Environmental Science Outdoor Recreation: Concentration in Environmental and Cultural Interpretation
Physics: Concentration in Environmental Science
Minor:
Environmental and Outdoor Education Minor
In addition to these existing programs, SUNY Cortland is also in the process of seeking approval for a new Masters of Science degree in Sustainable Energy Systems to be offered by the Physics Department. This degree program aligns both with the campus’s strategic plan and the SUNY policy on energy and sustainability that encourages academic departments to “[d]evelop and expand energy related curriculum and cross-‐disciplinary

26
programs.”44 The proposed masters of science includes both straight physics classes such as PHY 505 -‐ Energy and Sustainability, PHY 541 -‐ Electronics II: Power Electronics, PHY 567 -‐ Thermodynamics of Building Design and Technology, and PHY 576 -‐ Physics of Renewable Energy Technologies as well as interdisciplinary courses on accounting, marketing, management, and professional writing offered by the Economics and English Departments. Further, in support of the SUNY energy and sustainability policy’s encouragement to “[b]uild strategic alliances with public and private sector partners by providing research and analysis to regulators, elected officials, private industry, and New York’s citizens”, the proposed masters degree would require an internship with a regional renewable energy or building performance company, a local or state government agency, or a community based non-‐profit organization as a capstone experience. This internship would require the students to work more than 330 hours with one of these organizations and is intended to both provide the students with real-‐world experience and to help make use of the skills they gained in the program to support and enhance the regional “Green Economy.” This masters program has been approved by campus governance and the college is currently hoping to be able to receive approval by SUNY administration and the New York State Department of Education in time to begin offering the program during the 2012-‐13 academic year. Finally, at least two centers on campus have also taken an active role in exploring issues relating to sustainability. For example, the Center for Gender and Intercultural Studies (CGIS) has formed an Environmental Justice Committee and has hosted events surrounding the issue of hydraulic fracture natural gas drilling (hydrofracking) such as the Sustainability Week 2011 “Earth Day Open House” at the Cortland Main Street Building. This event was held in conjunction with the Gas Drilling Awareness for Cortland County community group (GDACC). CGIS also featured a workshop on sustainability at their Fall 2010 retreat at Raquette Lake for women students, faculty, and community members. In addition, the Center for Environmental and Outdoor Education (CEOE) has a number of activities focused on sustainability and other environmental issues. For example, beginning in the summer of 2011, the Raquette Lake Outdoor Education Center (RLOEC) will host a 14-‐week internship for a recreation studies major that will include aspects of natural history and conservation in the Adirondack Park. In addition, as noted above, the Center offers a minor in environmental and outdoor education, which is administered through the Recreation, Parks, and Leisure Studies Department. There are currently three tracks within the minor that students can choose including environmental education and interpretation, outdoor pursuits, and organized camping. In addition, the Center for Environmental and Outdoor Education manages four sites that are used by SUNY Cortland to provide our students with opportunities for experiential education. For example, at the Brauer Education Center, located on the outskirts of Albany, NY, near the Helderberg escarpment, geology majors spend three to five weeks in the field learning to measure, interpret, and analyze rock formations and how they relate to the ecosystems they support. Because of this training, they have a broadened perspective on issues like mining, drilling, and erosion. At Hoxie Gorge, located near the SUNY Cortland campus, biology students study flora and fauna, including topics like soil erosion, invasive plant species, forest succession, nutrient cycling, and carbon sequestration. Through hands-‐on learning and research projects, students learn about the importance of open space and the interaction between humans and nature. At Antlers and Camp Huntington in the Adirondacks, students from the Physical Education and the Recreation, Parks and Leisure Studies Departments complete a two-‐week course that engages them fully with the wilderness, including primitive camping, canoeing, backpacking, rock climbing, cross-‐country skiing and snowshoeing. They also learn “Leave No Trace” camping techniques which minimize their impact on the land they travel across. For some of these future teachers and recreation professionals, this is the most comprehensive environmental education experience they will have while at SUNY Cortland, and it can have important impacts on how they teach conservation and recreation practices to their future students. Also at Antlers, biology students spend two weeks doing intensive field study both at Raquette Lake and in the High Peaks region. This firm grounding in flora and fauna, limnology, mycology, dendrology and other topics prepares them to make more conscientious decisions concerning conservation and environmental science in their teaching and other professional work. Finally, students in childhood and early childhood education also come to Raquette Lake for a number of courses that focus on outdoor and environmental issues. Some of these courses, like EDU 548: Adirondack
44 See Appendix A for the full text of the SUNY policy on energy and sustainability.

27
Classroom, focus specifically on environmental concepts and how to integrate them in classroom teaching. Others, like EDU 374: Teaching Elementary School Science and ECE 431: Curriculum Development II incorporate a three-‐day program at Camp Huntington that includes sessions on environmental education methods suitable for the school yard.
Section 3.2 – Scholarship and Creative Activities
In addition to infusing the curriculum with environmental topics, several faculty on campus are engaged in research or other creative activities aimed at expanding our knowledge and experiences regarding these topics as well. For example, Scott Moranda from the History Department is completing a manuscript on environmental planning in communist East Germany from 1945 to 1989. His next project will compare German and American conservation efforts on private property (as opposed to conservation and preservation on public lands. In particular, the project will look at German influences on American conservation. In addition, one of the history master’s students has become interested in environmental history and is currently working independently on a thesis about the anti-‐nuclear protests that occurred in the wake of the Chernobyl disaster. Other work in these areas includes studies of climate change, ethics and social policy by Kathy Russell from the Philosophy Department and research pertaining to the Belize rain forest and the Adirondack Park in New York State by Thomas Pasquarello from the Political Science Department. As a final example, the author’s research focuses on U.S. energy policy and the structure and functioning of sustainable energy systems as well as on the environmental and health impacts of nuclear waste management and radioactive contamination at both civilian and military nuclear sites. Other scholarly activities are being supported by the centers on campus. For example, the Coalition for Education in the Outdoors (CEO) produces a journal twice a year called Taproot, which showcases innovative environmental practices and education. Member organizations of this effort collaborate on environmental topics and share best practices. The CEO also hosts a biannual research symposium at Bradford Woods, Indiana, and publishes a Proceedings document from the conference. Charles Yaple, an emeritus professor in the Recreation, Parks and Leisure Studies department, is the editor of this journal. As another example, the Center for Ethics Peace and Social Justice within the Philosophy department recently hosted a visiting scholar who was exploring issues surrounding the use of coal and natural gas. Finally, in keeping with the College’s strong commitment to engaging graduate and undergraduate students in research and creative activities, there have been a number of talks and posters presented at the annual Scholar’s Day that related to environmental and sustainability issues. A partial listing of such projects presented within the last three years includes:
2009 – Concurrent Sessions Conservation Biology and Adirondack State Park Presenters: Jason Gorman, Justin Kindt, Mark Morrell, Amanda Neville, Jack Ruggirello, Undergraduate Students and Steven B. Broyles, Professor, Biological Sciences Sustainability of the SUNY Cortland Community Bike Project Presenters: Lynn Anderson, Professor and Chair, Recreation, Parks and Leisure Studies, Eddie Hill, Assistant Professor, Recreation, Parks and Leisure Studies, Brandi Crowe, Lindsey Brown, Graduate Students, and Jeff Radcliffe, Undergraduate Student Scallop Farming in the Peconic Bay: Water Quality and Environmental Concerns Presenter: Nick Krupski, Undergraduate Student Beavers and Trail Establishment at the Lime Hollow Center for Environment and Culture Presenter: Elizabeth Hensel, Undergraduate Student Resource Management at the Morristown National Historic Park Presenter: Ben Guidarelli, Undergraduate Student

28
GIS and Mathematical Modeling for a Distributed Watershed Application Model Presenter: Matthew Vitale, Undergraduate Student
Poster Session
Converting the SUNY Cortland Buses to Biodiesel Presenters: Rich Rose, Kevin Stimson, Alana Zahn, Kaitlin Russo, Undergraduate Students and Brice Smith, Assistant Professor and Chair, Physics
2010 – Concurrent Sessions The SUNY Cortland Community Bike Project: 5 Years and Going Strong Presenters: Lindsey Brown, Graduate Student, Caleb VanSickle, Undergraduate Student, Lynn Anderson, Professor and Chair, Recreation, Parks and Leisure Studies, and Eddie Hill, Assistant Professor, Recreation, Parks and Leisure Studies Measuring the Educational Impact of the Promoting Environmental Awareness in Kids (PEAK) Kit: The Development and Implementation of a New Scale Presenters: Jennifer Miller and Lindsey Brown, Graduate Students, Eddie Hill, Assistant Professor, Recreation, Parks and Leisure Studies, Amy Shellman, Assistant Professor, Recreation, Parks and Leisure Studies, and Ron Ramsing, Assistant Professor, Western Kentucky University
Poster Session
Environmental Enrichment of South American Tamarin Monkeys at the Utica Zoo Presenter: Marjorie Pulver, Undergraduate Student The Capacity of Trees at Hoxie Gorge to Mitigate Global Warming Presenters: Eugene Aarnio, Undergraduate Student and R. Lawrence Klotz, Distinguished Teaching Professor, Biological Sciences Dissolved Oxygen as a Measure of Productivity in a Hoxie Gorge Beaver Pond Presenters: Danielle Birmingham, Kyle Kufs, Ben Schuerlein, Undergraduate Students, and R. Lawrence Klotz, Distinguished Teaching Professor, Biological Sciences Using Geographic Information Systems (GIS) to Update the New York State Department of Environmental Conservation Herpetology Atlas Presenters: David Delcourt, Angelika Beckmann, Eugene Aarnio, Glen Brozio, Rebecca Aungst, Ian Burk, Lindsey Rothschild, Undergraduate Students, and Wendy Miller, Assistant Professor, Geography A Geographic Analysis of Energy Consumption in European Nations in 2000 Presenters: Kristen Buck, Undergraduate Student, and Wendy Miller, Assistant Professor, Geography
2011 – Concurrent Sessions Sustainable Heating at SUNY Cortland using Biomass and Geothermal Energy Presenters: Brice Smith, Associate Professor and Chair, Physics and Matthew J. Rankin, Undergraduate Student Lime Hollow Center for Environment and Culture: An Assessment for the Future Presenters: Lynn Anderson, Professor, Recreation, Parks and Leisure Studies, Ben Banker, John Banuski, Amber Busby, Adam Campbell, Mitch Lemery, Juleen Matthews, Erik Wilson, Undergraduate Students
Poster Session
Human Power Project Presenters: Jeff Bauer, Associate Professor, Kinesiology Charles R. Westgate, Dean Emeritus and Bartle Professor, Binghamton University Vishal Anand, Associate Professor, Computer Science, SUNY Brockport, Joseph Cipollina, Christopher Bauer, Alyssa George, Matthew Kattell, and Kimberley Pereira, Undergraduate Students The Effect of Delayed Harvesting on Grassland Birds in New York State Presenters: Daniel Inserillo, Undergraduate Student and Jason Gorman, 2010 Graduate Ecosystem Processes of a Beaver Pond at Hoxie Gorge Presenters: Laura Platt, Undergraduate Student and Larry Klotz, Distinguished Teaching professor, Biological Sciences

29
As a final example, an undergraduate has also recently presented original environmental science research at the 2011 National Conference on Undergraduate Research held at Ithaca College. Following a competitive process, Matthew Rankin, a senior in the Biological Sciences Department, was selected to present his findings at a talk during the conference session focused on sustainability research. His presentation, entitled “Sustainable Heating at SUNY Cortland Using Biomass and Geothermal Energy,” was the culmination of a nearly year-‐long independent research project undertaken with the author. A longer version of this talk was delivered by the student on campus as a sandwich seminar during the second annual SUNY Cortland Sustainability Week (see below).
Section 3.3 -‐ Student Activities
Complementing the efforts of the faculty and staff, there are a number of student organizations that have greatly enhanced the campus’s commitment to sustainability. For example, SUNY Cortland hosts a chapter of the New York Public Interest Research Group (NYPIRG) which has focused in recent years on such environmental issues as climate change, diesel emissions from vehicles, and the risks associated with hydrofracking as a means of extracting natural gas from shale formations. In addition, many student clubs have organized events or talks relating to sustainability. For the sake of brevity, we will focus only on the recent activities of three groups that have a strong, central focus on environmental issues. First, the Environmental Science Club (C-‐SAVE) was formed in Fall of 2007 and received formal recognition from the student government the following spring. In its first four years, the Environmental Science Club has undertaken a number of activities and projects including:
• Carrying out a light-‐bulb exchange program with the help of Timothy Slack, the Director of Physical Plant in which the students from C-‐SAVE helped distribute compact florescent light-‐bulbs purchased by the University and installed them into the residence halls while at the same time providing tips on how students could save energy.
• Organizing three Black Out events conducted in the residence halls to highlight wasteful energy consumption patterns on October 28, 2008, October 29, 2009, and October 28, 2010. The first two of these events were organized in cooperation with the Green Reps (see below).
• Helping to create two “bottle tree” exhibits to highlight the number of plastic water bottles the campus consumes every week which were on display during December 2008 and April 2010. These projects were also done with the cooperation of the Green Rep Program.
• Traveling to the Maple Ridge Wind Farm in Lewis County, New York on October 4, 2009 and September 25, 2010, to the Lackawanna Coal Mine in Scranton, Pennsylvania on November 18, 2007 and May 1, 2010, and to the Seneca Meadows Landfill in Waterloo, NY on April 17, 2011. The trips to both the wind farm and the coal mine were organized in conjunction with the Physics and Engineering Club.
• Showing the film "Split Estate: What You Don't Know CAN Hurt You" regarding the impacts of natural gas drilling on November 12, 2009.
• Presenting the Earth Café 2050 program developed at Ithaca College to illustrate the concept of the ecological footprint at the first SUNY Cortland Sustainability Week on Earth Day April 22, 2010.
A second student organization focused on environmental issues is the Green Reps. The Green Reps are a group of 15 to 17 students paid to educate residents of on-‐campus housing about sustainability through programs, bulletin boards, and other means. The goal of this program is to increase environmental awareness and inspire behavior change in the on-‐campus student body. The program was founded in Fall 2008 and, after being housed on the academic side for its first two years under the direction of a faculty member, is currently being overseen by the Residence Life and Housing Office. It is funded by the Campus Recycling Committee and the Physical Plant. The Green Reps can also choose to enroll in an optional one credit course (EST 176 -‐ Green Representative: Sustainability in the Campus Community) offered in the spring semester to explore topics related to campus sustainability more deeply. The general responsibilities of the Green Reps include the
30
creation and updating of a bulletin board in their residence hall, conducting audits of trash and recycling bins in their buildings, and organizing at least two programs or activities for the students in their hall each semester. Examples of recent programs organized by the Green Reps range from a door-‐to-‐door exchange of old light bulbs for new energy efficient compact florescent bulbs, to discussions of films such as An Inconvenient Truth or FernGully: The Last Rainforest, to contests testing whether students could correctly identify whether objects taken from the Hilltop Dining Hall were compostable, recyclable, or trash. As a final example, the SUNY Cortland Recreation Association (SCRA) is another student club that actively engages its members with environmental issues. For example, members of SCRA work closely with volunteers from courses such as REC 445: Administration of Recreation class and REC 470: Senior Seminar as well as with members of the Recreation, Parks and Leisure Studies Department in taking a leadership role in the Community Bike Project. The project, supported by Action Sports, Auxiliary Services Corporation (ASC), SUNY Cortland Cycling Club, the Cortland County Healthy Heart Program, and Kionix, provides bicycles to the campus community to help reduce its reliance on vehicles for transportation. These include: (1) Yellow Bikes, which can be checked out free of charge for short-‐term use from the Bike Shop located near the Lusk Field House; (2) Red Bikes, which can be checked out for the whole semester for a $25 fee; and (3) Green Bikes, which are three wheel hauler bikes that can be purchased by departments or other groups to aid in moving things around campus without having to resort to using a vehicle. In addition, members of SCRA have participated in other activities such as the River Clean Up at Suggett Park and the Finger Lake Trail Clean Up as well as helping with trail maintenance at Lime Hollow and organizing many outdoor trips to places such as the Cayuga Nature Center, Beaver lake, Raquette Lake, and Buttermilk Falls. Finally, members of SCRA have also helped to organize an annual outdoor gear swap each of the last three years in which everything from hiking boots to a kayak have been brought in and resold, allowing for the gear to be reused by new owners.
Section 3.4 -‐ Conferences and Speaker Series
In addition to a number of individual talks, events, and teach-‐ins on environmental topics organized by groups across campus there have been several larger conferences and speaker series organized over the past few years which have chosen sustainability or environmentalism as their central theme. For example, during the 2007-‐08 academic year the Cultural and Intellectual Climate Committee chose the topic “Earthly Matters” and organized a year-‐long series of events around this theme. These included lectures and performances by leading environmental thinkers, artists, and activists such as; (1) Bill McKibben, a scholar-‐in-‐residence at Middlebury College in Vermont and author of The End of Nature; (2) Alfred Crosby, a historian and professor emeritus at the University of Texas at Austin; (3) Chris Shaw, a singer and songwriter; (4) Paul Roberts, an environmental journalist; (5) Michael Klare, director of the Five College Program in Peace and World Security at Hampshire College in Western Massachusetts; (6) Angus Wright, a professor emeritus of environmental studies at California State University; (7) Diana Muir, author of Reflections in Bullough’s Pond: Economy and Ecosystem in New England; (8) Sandra Steingraber, author of Living Downstream: An Ecologist Looks at Cancer and the Environment; and (9) William Reese, a population ecologist at the University of British Columbia. These events were funded by the President’s Office and the Office of the Provost and were widely attended by the campus community as well as by members of the broader Cortland community. As a second example, on April 26, 2008 the Environmental Science Club (C-‐SAVE) held a day-‐long Earth Day conference entitled “A Green Idea: Moving Cortland to a Sustainable Future”. This event featured many speakers from both on and off campus and concluded with a concert by student bands and a keynote talk by Bruce Barcott, the author of The Last Flight of the Scarlet Macaw. For this event, C-‐SAVE was the Northeast Regional winner of “Organization of the Month” for April 2008 from the National Association of College and University Residence Halls, National Residence Hall Honorary. This conference helped to set the stage for the larger and more widespread Sustainability Week activities that have been organized for the last two Earth Day’s on campus (see below). As a third example, the student run 59th Annual Recreation Conference held on November 5 and 6, 2009 chose the theme “Destination Rec-‐Green-‐ation” and featured a wide variety of talks and research symposium on topics relating to how individuals can enjoy recreation and leisure as well as reduce their impact on the environment.

31
The conference concluded with a keynote address by Fran Mainella, a visiting scholar at the Clemson University Department of Parks, Recreation and Tourism Management and former Director of the National Park Service, the first woman to ever hold that post. Finally, in April 2010 SUNY Cortland began a yearly tradition of celebrating a week of events intended to focus the campus on issues relating to sustainability. These Sustainability Week events are timed to coincide with the week of Earth Day. In 2010 the events included
• a Community Cleanup Day, • a public forum on the potential impacts of hydrofracture natural gas drilling on drinking water, • a showing of artworks relating to issues surrounding hydrofracture drilling in the Marcellus Shale, • a showing of the documentary Food Inc. with a discussion following the film led by a panel of local
farmers and local food experts, • a day long conference featuring 11 talks by more than 25 presenters including faculty, staff, and
students as well as experts from the surrounding community and featuring a free sustainable lunch prepared by ASC,
• a keynote address by Dr. Arjun Makhijani, President of the Institute for Energy and Environmental Research and author of Carbon Free - Nuclear Free: A Roadmap for U.S. Energy Policy,
• a Wellness Wednesday “…Going Green!” event organized by the Student Affairs Sustainability Committee, RAs, Eco-‐Reps and Health Promotion Interns,
• a sandwich seminar on the “The Cortland County Relocalization and Resilience Initiative: Building Community Sustainability”, and
• two days of student and staff-‐led activities such as campus cleanups, building working models of wind turbines, a bike ride through campus, and an outdoor recreation gear swap.
The 2011 Sustainability Week built on the success of the first year’s activities and included events such as
•
• a Community Cleanup Day, • a trip to the Seneca Meadows Landfill and wetland preserve, • a keynote address by Dr. David Goodrich, former Director of Climate Observations at the National
Oceanic and Atmospheric Administration (NOAA) and former director of the Global Climate Observing System Secretariat in Geneva, Switzerland,
• a total of six afternoon talks featuring nearly 20 speakers including faculty, staff, and students as well as experts from other universities and the surrounding community,
• a free sustainable lunch accompanied by a presentation on the recent sustainability initiatives undertaken by ASC,
• a student poster session with seven different student posters focusing on environmental issues, • a tour of Hoxie Gorge guided by two faculty from the Biology and Geology Departments focusing on
carbon sequestration; biomimicry, and nutrient cycling in the local environment, • the annual Connie Wilkins Bird Lecture featuring John Marzluff, Professor of Wildlife -‐ Habitat
Relationships and Avian Social Ecology & Demography at the University of Washington in Seattle, • a showing of the documentary film The Greenhorns exploring how young people are making a
difference in America’s sustainable food movement followed by a discussion led by local farmers, • a sandwich seminar on “Sustainable Heating at SUNY Cortland Using Biomass and Geothermal
Energy” presented by Matthew Rankin, a senior in the Biological Science Department, • a talk on energy and sustainability entitled “The Deepwater Horizon Oil Spill and the Fukushima
Daiichi Nuclear Accident: Lessons for U.S. Energy Policy in the Era of Extreme Energy”, • a day of student and staff led activities such as building working models of wind turbines, a bike ride
through campus, an outdoor recreation gear swap, and a display and information table on hydrofracking, and

32
• an Earth Day Open House organized by the Center for Gender and Intercultural Studies (CGIS), Environmental Justice Committee and the Gas Drilling Awareness for Cortland County community group (GDACC) at the Cortland Main Street Building.
The campus plans to continue the Sustainability Week events as an annual tradition and to continue to seek to expand its offerings as well as the integration of these events with course curriculum in partnership with interested instructors.
Section 3.5 -‐ Community Engagement
We will conclude this chapter, with a look at two examples of broader community efforts in which the College and its members play important roles. These efforts align not only with campus priorities, but also with the goal of the 2007 SUNY policy on energy and sustainability of “[r]aising awareness” by utilizing “capabilities of the University to educate students, faculty, staff, local community and global community about the nexus between energy and the environment.”45 Of particular note in this context is the creation of a new Cortland Community Forum track for sustainability in early 2010 and its connection with the previously existing Cortland County Relocalization and Resilience Initiative (CCRRI) started by Beth Klein from the Childhood/Early Childhood Education Department and others. The Cortland Counts Community Forum is presented by the Community Assessment Team, a collaboration of the Seven Valleys Health Coalition, Cortland Regional Medical Center, Cortland County Health Department, United Way for Cortland County Inc., and SUNY Cortland’s Institute for Civic Engagement. The proposal to add the fifth track on sustainability to the four existing tracks on youth, housing, health, and economic development was approved at their January 2010 meeting and since then track’s two co-‐chairs have been Beth Klein and the author. The committee first met on February 2, 2010 and has met roughly once a month since then. There are more than 80 people on the track’s mailing list and approximately 10 to15 members who routinely attend meetings. Among other activities, the group has been accepted to participate in the beta-‐testing of GreeningUSA’s 12 Traits of Sustainable Communities self-‐assessment methodology which will help identify the strengths and weaknesses of the county with respect to sustainability. In addition, the track is looking to support the work of the County Local Agricultural Promotions Subcommittee and the Seven Valleys Health Coalition’s Healthy Places Grant, as well as to assist in campaigns that support local foods being served in restaurants and being sold by local merchants in order to try to further develop the local foods production capacity in Cortland County. This will be an important goal if SUNY Cortland is to ultimately be able to begin purchasing a far higher percentage of its foods from local suppliers as required by the climate action plan (see Section 7.2). Another example of community outreach efforts relating to sustainability is the College’s Sustainable Partnership to Power Cars. This project was initiated with funding received from SUNY Cortland’s Regional Professional Development School program by Katina Sayers-‐Walker from the Childhood/Early Childhood Education Department and Kevin Sommer, a teacher from the Tully Central School District. The Professional Development School program encompasses 17 schools and allows pre-‐service teachers from SUNY Cortland to work with students and teachers in the schools on educational projects. In this case, the wind and solar system created to power a scoreboard at Tully High School has now been adapted to charge an electric car as well. The students will be able to use this renewable energy system to charge a Chevy Volt, a plug-‐in hybrid car, which was provided by Jack McNerney Chevrolet for them to use in their year-‐end driver’s education course. Such outreach to the community is a valuable part of the College’s educational mission and an important component of making sure sustainability can be a part of the educational experience for our students.
45 See appendix A for the complete text of the SUNY policy on energy and sustainability.

33
Chapter 4: Heating
Section 4.1 – Recent Historical Trends
As noted in Section 2.2, the largest single contributor to both the primary energy use on campus as well as to the campus’s greenhouse gas emissions is the heating system. Heating accounts for nearly three-‐fifths of the campus’s primary energy and more than one third of its greenhouse gases. As such, we will begin with an examination of the current heating system and, in particular, the recent efforts to improve its efficiency and to reduce demand. Over the past several years, a number of changes both to the infrastructure and to the operation of buildings have been made to try to lower the amount of energy required for heating. Some of these were conservation efforts, such as implementing new temperature set points of 68 degrees Fahrenheit for the heating season and 78 degrees for the cooling season or closing the Moffett swimming pool so it would not need to be heated. Others were infrastructure changes, such as replacing old leaking windows in Old Main and Bowers Hall with newer, more energy efficient models. Still others focused on implementing very high-‐efficiency systems for generating or distributing the heat and cooling desired. For example, the renovated Moffett Building makes use of new kinds of distribution systems that take advantage of natural conductive and convective forces to reduce the amount of electricity consumed by fans and blowers. Even more significant is the fact that the new 20,000 square foot addition to the Professional Studies Building and the renovated original building share a ground source heat pump which provides a portion of their heating and cooling loads with an efficiency of as much as 300 to 350 percent. Of course, the actual efficiency is not really bigger than 100 percent, but the Earth itself is used to supply the excess heating and cooling through a series of 60 geothermal wells drilled roughly 300 feet into the ground. At depths below about 10 feet, the ground remains at a fairly constant temperature in the mid-‐50s so it can be used both as a source for heating during the winter and for cooling in the summer. As a result of these and other initiatives, such as improvements to the Central Heating Plant, the amount of energy required for heating has been falling over the past 20 years as can be seen in Figure 4.1. While there is significant volatility year to year, the general trend is clear and averages out to reductions of about one percent per year. With heating usage, however, care must be taken to avoid attributing lower energy use due to warmer weather to actual improvements in efficiency. To explore this question, Figure 4.2 shows the total heating degree days (HDDs) for the Cortland area over this same timeframe. As can be seen, the HDDs also show wide variability year to year, but only minor reductions over time. This reduction in HDDs is nowhere near dramatic enough to explain the drop in the campus’s use of energy for heating. If the heating use by the campus is normalized to the average heating degree days over these 20 years for example, it still shows an average annual reduction of roughly 0.8 percent per year. Thus, we can have confidence that the campus’s efforts have been successful at achieving real reductions in the energy used for heating. We will make use of this historical experience in setting the targets for heating efficiency improvements in the model described in Section 4.2.

34
Figure 4.1: Annual consumption of natural gas and fuel oil by the campus over the past 20 years showing significant year-to-year variability, but a generally downward trend over this time period. The total reduction over these two decades amounts to roughly 15 percent.
Figure 4.2: Annual heating degree days for the Cortland area showing significant year-to-year variability, but only a slight average decrease over the past 20 years of about 1.4 percent as compared to the 15 percent decrease in energy consumption for heating over the same time.
150,000
160,000
170,000
180,000
190,000
200,000
210,000
220,000
1985 1990 1995 2000 2005 2010 2015
Heating Fuel Consumption (Dth)
Year
5,000
5,500
6,000
6,500
7,000
7,500
1985 1990 1995 2000 2005 2010 2015
Heating Degree Days
Year

35
In addition to the amount of energy consumed, the other important historical consideration that must be made is the cost of the heating fuel used by the campus. Over the last 12 years (1998 to 2010), SUNY Cortland received roughly 95 percent of its heat from natural gas with the remaining 5 percent coming from #2 and #4 fuel oil. As such, we will report the average cost of heating on a per decatherm (Dth) basis so that it is most easily compared to typical natural gas pricing. Figure 4.3 shows that the average cost of heating fuel for the campus has risen significantly since 1998 although the last four years have shown what could be a new trend as the price decreased 35 percent from the high point of nearly $16 per Dth in the 2006-‐07 fiscal year to roughly $10 per Dth in 2009-‐10. We will address this last point further in the following section. Figure 4.3: Average price for heating fuel purchased by SUNY Cortland since 1998 (in constant 2010 dollars). Over these 12 years, the cost of natural gas increased by an average of more than 4 percent per year.
With these historical considerations, we can now turn to the predictions for future greenhouse gas emissions from the heating sector.
Section 4.2 -‐ Future Projections
The details of the models used to project future emissions reductions and their associated costs are included within a series of four linked Microsoft Excel spreadsheets that are intended to serve as technical support underlying this report. A summary of the key input parameters and assumptions used in the models can be found in Appendix E. As such, only the most important of the input parameters and resulting predictions will be detailed here. These include; (1) the assumptions underlying the calculation of future emissions (i.e. the emissions factors for future technologies); (2) the projected future demand for heating taking into account both increased demand as well as an increase in the efficiency of how the heat is supplied; and (3) the cost of conventional energy resources in the future as well as the capital and fuel costs/savings associated with conservation efforts and with switching to low-‐CO2 renewables energy resources such as biomass. First, the emissions from burning natural gas and fuel oil are generally taken to be fixed numbers set by the amount of carbon in the fuel and we have treated them as such for the purposes of this assessment. However, it
0.00
2.00
4.00
6.00
8.00
10.00
12.00
14.00
16.00
18.00
1996 1998 2000 2002 2004 2006 2008 2010 2012
Heating Fuel Cost (dollars per Dth)
Year

36
is important to note that this may not remain a valid assumption in the future if there is a large scale use of hydraulic fracture drilling (i.e. hydrofracking) to release natural gas from shale formations such as the Marcellus Shale. A recent study led by researchers at Cornell University found that, when the impact of methane leakage from the wells and other sources is taken into account, the effective impact on the climate of using natural gas from shale would be much greater than expected due to the high global warming potential of methane gas. Specifically, over a 100 year timeframe, methane will trap about 21 times as much heat as the same mass of carbon dioxide so even small releases of methane are important. In light of this, the authors concluded that
The footprint for shale gas is greater than that for conventional gas or oil when viewed on any time horizon, but particularly so over 20 years. Compared to coal, the footprint of shale gas is at least 20% greater and perhaps more than twice as great on the 20-‐year horizon and is comparable when compared over 100 years.46
This is a real potential concern for the campus, given both the amount of land in Cortland County that has been leased for gas exploration as well as predictions from the EIA that over the next 20 years nearly 40 percent of all natural gas produced in the U.S. will come from shale deposits. This can be compared to the fact that less than 5 percent of gas produced in the previous 20 years has been extracted from shale.47 If it does become the case in the future that the natural gas being consumed by SUNY Cortland is predominately shale gas, then the emissions from our heating sector could increase dramatically over those presented in this report and would likely force a more aggressive approach to phasing out natural gas to be adopted in future versions of this climate action plan. Second, turning to the projections of future heating demand, there are three principle considerations that must be made. The first of these relates to the projections for future conservation and efficiency targets. Given the recent experience of the campus with reducing its heating demand as seen in Figure 4.1, we will adopt future demand reductions of about one percent per year as the target goal.48 This would result in cumulative savings of just over 30 percent by 2050 and would be equivalent to a reduction in future heating demand by about 38,000 decatherms per year by mid-‐century. This is an aggressive, but reasonable, goal in light of the roughly 0.8 percent per year decrease we have already achieved over the past two decades even after variations in the weather were taken into account. Our goal is further supported by the IPCC’s conclusions that between now and 2030, “about 30% of the projected GHG emissions in the building sector can be avoided with net economic benefit.”49 Achieving such sustained reductions will require a variety of strategies from the technological like installing better heat recovery systems, using improved design features to capture and store more passive solar energy, and installing revolving doors to avoid the long periods when doors are held open between classes to the operational such as preventing windows from being left open in the fall and spring when the buildings are being heated at night, but the weather is milder during the day. Another major consideration regarding the campus heating system that must be made is the fact that we have already begun the process of switching the upper campus buildings from a reliance on the Central Heating Plant to the use of satellite natural gas boilers. This change, which is scheduled to take place over the next few years, will result in dramatic reductions in the amount of energy required for heating the buildings on upper campus. Specifically, this project is projected to reduce the natural gas consumption for these buildings by as much as 40 percent. These kinds of savings are possible because of such improvements as; (1) the elimination of large losses in the steam tunnels currently distributing the heat from the Heating Plant behind Bowers Hall throughout upper campus; (2) the higher efficiency of modern satellite boilers compared to the older and larger heating plant boilers; (3) the elimination of losses and inefficiencies that currently occur when the high-‐
46 Howarth, Santoro, and Ingraffea 2011 p. 679 47 EIA 2011 Figure 89 48 In the absence of conservation and efficiency measures, we have included a small increase in heating demand of 0.1 percent per year to account for potentially higher heat loads caused by such things as increased air changes per hour or other changes in future building codes, as well as a continued expansion of fume hood use. This assumption was made to be conservative. If there is, in fact, no baseline growth in heating demand, then the required reductions in greenhouse gas emissions would be less costly than we have modeled in the present work. 49 IPCC 2007 p. 13

37
pressure steam delivered from the heating plant is converted first into low-‐pressure steam and then again to hot-‐water within the various buildings; and (4) the significant increase in control that this system will allow which will enable better energy management practices to match heating supply with building occupancy and use. These changes are already planned and scheduled so they will be included specifically in the model as part of the known changes coming over the next five years. The third consideration we need to take note of in this context is the addition of new square footage to the campus. SUNY Cortland has recently added significant amounts of new space to the Professional Studies Building and to the New Education Building and it has plans to add further square footage with the planned Bowers Hall renovations and the construction of the new Student Life Center. Each of these new or expanded buildings bring with them new demands for energy. As with the satellite boiler project, the Bowers Hall and Student Life Center projects are already planned and scheduled so we will be able to include them specifically as near-‐term components in the model. With respect to changes in square footage planned for the future, we included the final renovations to Moffett which will involve the addition of 8,000 square feet of programmable space in place of the present gym and the ultimate removal of Winchell Hall and its 28,640 square feet of space. While the model would allow for it, we have chosen to include no other increases in the future size of campus buildings. This decision was made in light of the fact that the current utilization of space on campus and the projections for future enrollments make it unlikely that significant amounts of new construction will be required. This choice is further supported by the overall goal of reducing the demand for future energy services whenever possible since the cheapest and least impactful BTU of energy is the one that is never used. Finally, turning to the projections for the future cost of energy, we note that despite the apparent historical trend visible in Figure 4.3, future natural gas prices are projected to remain roughly constant through 2025 due to increased domestic supply. In particular, the Energy Information Administration’s most recent energy outlook predicts that the average price of natural gas will rise by only about 0.03 percent on average between 2010 and 2025. After that time, the price of natural gas is assumed to begin increasing at a rate of about 0.8 percent per year as demand continues to rise.50 As noted above, however, the increased supply responsible for this stability in price is likely to come largely from shale gas recovered by hydrofracking which could lead to significant revisions in our current estimates of future greenhouse gas emissions. We also note that the assumption of relatively stable natural gas prices over the next decade or more is not necessarily inconsistent with the data in Figure 4.3, given that, as we noted previously, the last four years have seen declining costs for natural gas for SUNY Cortland. On the other hand, the EIA does predict that the price of fuel oil will increase far more dramatically than that of natural gas. In fact, they predict a doubling of commercial fuel oil prices between 2015 and 2035. However, the fact that fuel oil makes up such a small part of the heating supply at SUNY Cortland means that the overall cost of heating the campus will likely increase at only a very slow rate for the near term, and then only modestly beyond that.51 With these considerations, we are finally ready to turn to a description of the wedge model we propose for how to reduce the greenhouse gas emissions from the heating sector and to examine its results for the cost of these emission reduction strategies.
Section 4.3 – The “Wedge Model” for Heating
In preparing our predictions for the future of the campus energy system, we chose to adopt a strategy inspired by the stabilization wedge model proposed by researchers at Princeton University.52 In this type of analysis, you begin by projecting the demand for energy services into the future and then find the greenhouse gas emissions that would be associated with meeting those demands using a business-‐as-‐usual approach (i.e. continuing to purchase natural gas and fuel oil for heating in the same way we do now with no efforts to reduce
50EIA 2011 in Natural Gas Table 137 (Commercial: New England and Middle Atlantic) 51 EIA 2001 in Oil/Liquids Table 12 52 See for example [Pacala and Socolow 2004] and [Socolow et al. 2004]

38
consumption). From there, you identify specific strategies for lowering those emissions that are both available and compatible with other conditions you wish to impose such as minimizing reliance on biomass to avoid their potentially higher environmental impacts than other renewable resources. Each of the selected strategies is then evaluated for its potential to reduce greenhouse gas emissions as they are phased in. This results in a series of wedge shaped CO2 reductions falling below the business-‐as-‐usual line when plotted on a graph of emissions versus time hence the name. In all of the models presented in this work, we have chosen to utilize sigmoidal wedges for the major reductions rather than the more traditional straight edged, triangular shaped wedges. This is to allow us to take into account a more realistic rate of implementation that starts out slowly, increases rapidly as the institutional momentum for change increases, and then slows again at the end since the hardest and most complicated changes are assumed to be implemented last. The results for the wedge model we developed for the campus heating sector are shown in Figure 4.4. Figure 4.4: The wedge model for the SUNY Cortland heating system showing four wedges that combine to result in an 89 percent reduction in greenhouse gases by 2050 compared to those in 2009-10.
As can be seen from Figure 4.4, the four wedges chosen for the heating system were, in order from top to bottom; (1) conservation and improved efficiency (orange); (2) solar thermal collectors for producing domestic hot water in the residence halls and pools (teal); (3) switching from natural gas boilers to biomass boilers (light green); and (4) the use of geothermal (i.e. ground source) heat pumps like the one installed in the recently renovated Professional Studies Building (dark green). The principle reason the emissions are not reduced all the way to zero in our proposal is not due to the continued use of conventional fuels. In fact, our proposals call for obtaining more than 99 percent of our heating energy from renewable resources by mid-‐century. The primary cause of the residual emissions is due to the fact that SUNY Cortland is too land constrained to rely very heavily on geothermal heating and, as such, it must receive a large share of its heating from the combustion of biomass. While the CO2 released by the combustion of biomass is simply returning CO2 to the atmosphere that the plant extracted during its growth which makes this part of the cycle carbon neutral, there will remain indirect emissions associated with the energy and other inputs needed to grow, process, and transport the biomass just as there are indirect agricultural emissions associated with the production of food (see Chapter
0
1,000
2,000
3,000
4,000
5,000
6,000
7,000
8,000
9,000
10,000
2010 2015 2020 2025 2030 2035 2040 2045 2050
Annual Greenhouse Gas Emission from
Heating
(metric tons CO
2 per year)
Efmiciency / Conservation
Solar Thermal Hot Water
Biomass Boilers
Geothermal Heat Pumps
Remaining CO2 Emissions

39
6).53 When these indirect emissions from biomass are included, we find that we are able to almost reach the middle of our desired range of 85 to 95 percent reductions in greenhouse gas emissions from the energy sector compared to our current 2009-‐10 carbon footprint. From the graph we can see that the three principle wedges result in roughly similar reductions, while the use of solar thermal for the production of hot water results in relatively small savings. When their overall contributions are calculated we predict that conservation and efficiency will account for 32 percent of the ultimate reductions, geothermal heat pumps another 32 percent, and switching to biomass boilers will save 34 percent. Thus our model indicates that a roughly equal amount of effort should be spent on each of the big three strategies with economic indicators likely playing the deciding factor as to which projects are undertaken first. In order to better facilitate such economic assessments, the wedge model also predicts the cumulative reductions in CO2 as well as the cost of implementing the technologies and other strategies contained within the proposed wedges. These results are shown in Figures 4.5 and 4.6 and will be used to determine the cost per ton of CO2 saved in the heating sector. It is this metric, dollars per ton of avoided emissions, that will prove to be among the most important numbers to consider when seeking to prioritize between different greenhouse gas reduction strategies. Another important number will be the rate at which the strategies can be implemented since earlier reductions will have a proportionally greater impact on the climate than those that occur more slowly given the long residence time of CO2 in the atmosphere. Figure 4.5: Cumulative reductions in greenhouse gas emissions from the SUNY Cortland heating system that would be realized if the proposed wedge model was implemented.
Between 2015 and 2050 the proposed pathway would result in a cumulative savings amounting to just over 121,100 tons of CO2 with an average annual reduction of roughly 3,460 tons per year. For comparison, this
53 For more details see the work prepared by Matthew Rankin and Brice Smith entitled “Sustainable Heating at SUNY Cortland using Biomass and Geothermal Energy” currently under review for potential publication in the Proceedings of the National Council of Undergraduate Research Conference 2011.
0
20,000
40,000
60,000
80,000
100,000
120,000
140,000
2010 2015 2020 2025 2030 2035 2040 2045 2050
Cumulative Tons CO
2 Saved

40
average annual savings would be equivalent to removing a fleet of more than 1,220 new cars from the road54 or to reducing the campus’s current 2009-‐10 carbon footprint by about 13 percent. Looking in more detail at the annual reductions projected for individual years, an important observation can be made. As noted above, in order to have the biggest impact on climate change earlier reductions are of greater value that those that do not occur until closer to mid-‐century. Given the large reductions already committed to with the introduction of the satellite boilers and the reductions proposed beyond that in our present model, we note that by 2030 we would have already achieved a reduction of greenhouse gas emissions of about 48 percent compared to 2009-‐2010 levels. This is a significant fraction of the 89 percent reduction that will have been achieved by 2050 and compares well with targets set forth in other climate mitigation programs.55 Turning now to the price of these reductions in greenhouse gas emissions, we can see from Figure 4.6 that the cost of achieving the projected savings does not rise steadily and, in fact, reaches a maximum in the late 2030s before beginning to decrease. This turn-‐around in the cost occurs because the efficiency and conservation projects built into the model result in reduced energy costs when implemented and can therefore often have negative costs (i.e. cost savings) over their life-‐time. In terms of helping to inform decisions regarding fundraising and cash flow targets, we note that the final overall cost of the heating system changes we propose through 2050 would amount to roughly $4.6 million over the next three and a half decades with a peak investment of just over $10.4 million being reached in 2039. In terms of annual cash flows, the highest annual cost of following this path would amount to roughly $750,000 while the average annual cash flow requirement would be roughly $130,000 per year. These costs do not include those of the electricity required to run the geothermal heat pumps as those costs are included in the figures for the electricity sector.
54 Assumes a fuel efficiency of 34.5 mpg (i.e. a new 2011 car) and a total annual driving distance of 11,000 miles. 55 For example, in the American Clean Energy and Security Act of 2009 passed by the House of Representatives, the cap-‐and-‐trade system was designed to achieve 42 percent reductions relative to 2005 levels by 2030 and 83 percent reductions by 2050. [H.R. 2454 Section 702]

41
Figure 4.6: The cumulative amount of money above and beyond what would normally be spent under a business-as-usual strategy that would be required if the wedge model for heating was to be implemented. This total takes into account both capital costs of projects as well as differences in their fuel costs through 2050.
For comparison, we note that the average excess costs we estimate for reducing the emissions from the heating sector by 89 percent (i.e. roughly $130,000 per year) would amount to just over 6 percent of the average price paid by SUNY Cortland over the last three fiscal years for its natural gas and fuel oil usage ($2.10 million). Thus, this additional cost, while by no means trivial, is not likely to result in a dramatic increase in the overall energy budget for the campus. If, as we pointed out in Section 1.3, a price was to ultimately be placed on the emission of greenhouse gases through a carbon tax or cap-‐and-‐trade type system, the amount of this increased cost could be reduced significantly. Finally, taking the total cost of the proposed changes and dividing it by the total amount of CO2 that would be saved, we find that the cost of the proposed improvements to the heating system would amount to roughly $38 per ton CO2 on average. It is this cost per ton that we will use to compare different strategies for reducing greenhouse gases and it will be a consideration that should be given significant weight in the decision-‐making process given the limited monetary resources available at this time as well as the fact that early reductions in CO2 will have greater positive effects on the climate than those that do not occur until just before 2050. As with most things, how we get from here to there is, at times, as important as the destination itself. With this, we will now turn to a consideration of the second most important contribution to both primary energy use and greenhouse gas emissions, namely the consumption of electricity.
$0
$2,000,000
$4,000,000
$6,000,000
$8,000,000
$10,000,000
$12,000,000
2010 2015 2020 2025 2030 2035 2040 2045 2050
Cumulative Cost (constant dollars)

42
Chapter 5: Electricity
Section 5.1 -‐ Recent Historical Trends
After heating, the electric sector is the next largest contribution to both campus energy use (26 percent of the total) as well as greenhouse gas emissions (34 percent). In addition, with the added electricity demand that will come from the increased use of geothermal heat pumps and electric vehicles on campus, the importance of the electricity sector to the campus will only increase. As noted previously, the climate impacts of electricity are higher than might be expected from its share of primary energy use due to the high levels of emissions associated with the current electricity system. Figure 5.1 shows the fraction of the electricity in the Northeast and mid-‐Atlantic region that is generated by various energy sources. It is interesting to note the relatively high dependence on nuclear power and natural gas and the correspondingly lower dependence on coal for these nine States as compared to the U.S. as a whole. It is also of interest to note that wind accounts for less than three-‐quarters of one percent of the present electricity on the grid and that solar photovoltaics are such a small percentage that they do not even show up as a category. Given the fact that wind penetrations of roughly 20 to 25 percent of total electricity supply can be dealt with without straining the stability of the current grid, this figure highlights the significant growth potential for both wind and solar. In fact, the current levels are so low that substantial growth would be possible with only relatively modest costs associated with the adaptations needed to compensate for their intermittency and for other issues related to grid interconnection.56 Figure 5.1: Share of electricity in the Northeast and mid-Atlantic generated by various sources of energy in 2009.
56 See for example [Smith 2006 p. 65 to 71 and 79 to 85], [Makhijani 2007 p. 30 to 45, 62 to 71, 153 to 157, and 168 to 169], [DOE 2008 p. 7 to 12, 18 to 20, and 93 to 100] and [IPCC 2011 p. 42 to 59, 90 to 102, and 107 to 111 ] for more detail on the growth potential of solar and wind.
Nuclear; 36%
Natural Gas; 27%
Coal; 26%
Hydroelectric; 7%
Biomass; 2% Petroleum; 1%
Other; 1% Wind; 0.7%

43
As we found when discussing the heating sector, SUNY Cortland has demonstrated a strong commitment to reducing its use of electricity. As part of their efforts to reduce electricity use three primary areas have been targeted, namely lighting, motors and HVAC equipment, and the plug load driven primarily by computers and other types of personal electronics. Each of these areas are being addressed by different programs. For example, the campus has been replacing all old CRT computer monitors with new LCD monitors that use far less energy. In the area of lighting, several major projects have recently been undertaken with the help of State and Federal grant monies. For example, the campus received two American Recovery and Reinvestment Act (ARRA) energy conservation grants. The first was an $80,000 grant which was used along with $20,000 of campus money to replace 200 metal halide lights with 150 high-‐efficiency T-‐5 fluorescent fixtures. This project alone was projected to save an estimated $21,700 per year. A second, $95,680 grant was received which, together with roughly $24,000 in campus monies, was used to replace a further 188 metal halide lights with high-‐efficiency T-‐5 fluorescents. This project resulted in further projected cost savings of roughly $18,500 per year. These two projects alone will reduce the campus’s carbon footprint by roughly 170 tons of CO2 per year, an amount equivalent to taking more than 50 new cars off the road. It is important to note as well that the combined payback of these two lighting projects is roughly 5.5 years, which supports the assumptions we have built into our model for the cost of similar efficiency and conservation efforts to be made in the future (see Appendix E). There are several other examples of campus efficiency improvements involving lighting as well. For example, the same kind of switch from metal halide to fluorescent lights was also undertaken at the Tomik Fitness Facility and the Park Center rock climbing gym with financial support from the New York State Energy Research and Development Authority (NYSERDA). Other examples, include the changing of the lights in the lampposts from high-‐pressure sodium light bulbs to metal halide lamps which consume less than half the power and the efforts supported by the Residence Life and Housing Office to provide compact florescent light bulbs to all residents who were willing to trade in their old incandescent light bulbs which consume about four to five times the power of compact fluorescents. Unfortunately, when we look at the electricity consumption for the campus as a whole (see Figure 5.2), we do not see the kind of consistent decreases that were found for heating. In fact, we see a sharp decrease in the early 1990s, but since about 2000 the consumption of electricity has increased at a rate of about one percent per year despite the efforts to improve the efficiency of the campus. Figure 5.2: Total annual consumption of electricity by the campus showing a steep decline from the early 1990s through 2000, followed by a generally steady increase of about one percent per year over the last decade.
16,000,000
18,000,000
20,000,000
22,000,000
24,000,000
26,000,000
28,000,000
1990 1995 2000 2005 2010 2015
Annual Electricity Consumption
(kWh)

44
Turning to the cost of electricity consumed by the campus we again find significant differences from the case of the heating sector. Figure 5.3 shows the annual cost of electricity from 1998 to 2010 in constant dollars. While the data shows high year to year variability, there is a slight trend towards decreased costs overtime as opposed to the generally increasing costs of natural gas and fuel oil (see Figure 4.3). Figure 5.3: Average price for electricity purchased by SUNY Cortland since 1998 (in constant 2010 dollars). Over this timeframe, the cost of electric power decreased by an average of less than one percent per year.
With these historical considerations, we can now turn to our predictions for the future greenhouse gas emissions from the electricity sector.
Section 5.2 -‐ Future Projections
As with heating, we only consider the most important input assumptions for the electricity models in detail here including; (1) the assumptions underlying the calculation of future emissions; (2) the projected future demand for electricity on campus; and (3) the future costs of electricity purchased from the grid. Turning first to the emissions from electricity, we note that will vary greatly depending upon what fuel mix is being used by the utilities. The difference between the emissions from burning coal can be as much as 15 to 70 times higher than those associated with using solar photovoltaics or wind turbines.57 As such, the future emissions from electricity will depend in detail on the assumptions we make regarding the fuels to be used by the utilities in the Northeast and mid-‐Atlantic region. To illustrate this point, Figure 5.4 shows the carbon intensity of the Northeast grid to which SUNY Cortland is connected over the past two decades. Aside from a brief period in the mid-‐1990s, the greenhouse gas emissions per kilowatt-‐hour of electricity generated has steadily decreased. This is due mainly to up-‐rating of the regions nuclear power plants and to an increased reliance on natural gas.
57 See for example [Meier 2002 p. 70 to 73], [POST 2006 p. 3 to 4], and [Fthenakis, Chul Kim, and Alsema 2008 p. 2170]
0.00
2.00
4.00
6.00
8.00
10.00
12.00
14.00
1996 1998 2000 2002 2004 2006 2008 2010 2012
Electricity Cost (cents per kWh)
Year

45
Figure 5.4: Average carbon intensity of the electricity supplied to the northeast electric grid showing a significant and sustained reduction over the past 20 years.
While this downward trend in the carbon intensity of the grid is expected to continue, there are two points of caution that should be noted. First, if the nuclear power plants in the region (responsible for 36 percent of the electricity in 2009) are replaced following the end of their operating licenses by either coal or natural gas fired plants instead of renewable resources, the carbon intensity of the electricity would increase significantly. For example, the carbon intensity of the grid’s electricity in 2009 would have increased 16 to 89 percent if the nuclear power plants were replaced by natural gas or coal. In addition, if the natural gas used in the future to generate electricity (currently accounting for 27 percent of the total) was produced in large measure by hydrofracture drilling in shale formations, the carbon emissions could also increase significantly due to the leakage of methane, a highly potent greenhouse gas, from the wells and other areas. This point is discussed further in Section 4.2. Turning now to the question of future electricity demand, there are again three considerations to take into account. The first of these is one already noted in Section 4.2, namely the coming addition of the new Student Life Center and the new labs and additional square footage being added to Bowers Hall. As with their impact on the heating demand, the increased electrical demand from these new buildings is included in the 2011 to 2015 portion of our model accounting for the steep increase around 2014. The second consideration is the increase in consumption from the expanded use of geothermal heat pumps for heating and electric cars for transportation. As part of the heating and transportation models (see Chapters 4 and 6), the increase in electrical demand from switching to electricity from natural gas and petroleum is calculated and is then added into the projections for future electricity consumption used in the present model. For our current proposal, this increased use of electricity for heating and transportation would result in an average annual increase in electricity demand of roughly 1.3 percent per year. The third consideration that must be taken into account is the fact that the campus’s electricity consumption has already been increasing fairly steadily at around one percent per year over the last decade. In order to allow this growth rate to be included in the model with greater flexibility, separate growth rates were specified for the plug load, for lighting, and for motors and HVAC equipment. While the electric use for lighting was not assumed to grow even under the business-‐as-‐usual scenario, given the steady climb in historical electricity use
0.300
0.350
0.400
0.450
0.500
0.550
0.600
1985 1990 1995 2000 2005 2010 2015
kg CO
2 per kWh
Year
46
the consumption by motors and HVAC equipment was assumed to increase at about 1.3 percent per year while the plug load’s growth rate was taken to be 0.8 percent per year. While it is true that consumer electronics are continuing to become more energy efficient (laptops versus desktops for example) it is also true that the number of electrical devices brought to campus or integrated as parts of the classrooms and other areas on campus also continues to rise. For example, in the newly renovated Bowers Hall almost every teaching lab will have a computer station and an LCD projector whereas very few of the labs have such equipment currently. While the business-‐as-‐usual scenario assumes no efforts on the part of the campus to reduce the electrical demand, and thus has increasing overall electricity usage, the final consideration that must be taken into account is the amount of energy savings that can be accomplished by aggressive conservation measures and efficiency improvements. Given the recent campus experience in lowering its electrical demand as well as the rapid decrease in electricity use in the mid-‐1990s (see Figure 5.2), we proposed realistic but aggressive energy reduction targets amounting to an average annual reduction of just over 1.4 percent per year. This would result in a 40 percent reduction through 2050 and would represent a decrease in annual electricity use of nearly 9.4 million kilowatt-‐hours by mid-‐century.58 As significant as these reductions are, however, it is important to note that they will only barely stay ahead of the increased demand placed on the electricity sector from the use of geothermal heating and the increased use of electric vehicles on campus. The fourth consideration we must make concerns the future cost of electricity to be purchased from the grid. As can be seen in Figure 5.3, the price of electricity for SUNY Cortland has actually declined slightly over the last decade from more than 10 cents per kWh in 1998 to less than 8 cents per kWh in 2009 (in constant dollars). Interestingly, just as we found that while historical natural gas prices have risen recently, the projection for its future cost is that it will be remain virtually stagnant in the coming years, we find the opposite being true with electricity. Despite a relatively constant and, in fact, slightly decreasing cost of electricity historically, the assumption is that the near to medium term will see substantial increases in electricity costs due to changes in the fuel mix on the grid as well as to social factors such as potentially higher default rates for residential customers in the future. Given the importance of this parameter, as well as the desire to make the economic model err on the side of conservatism rather than optimism, we chose a growth rate of two percent per year for the first 10 years and then a one percent increase after that. This is equivalent to an average increase in the cost of electricity of about 1.28 percent per year. Finally, before building the long-‐term model for the electricity section, we must explore what mixture of on and off-‐site renewable resources the campus would consider building based on such factors as available space and the limitations imposed by our demand profile. Given the limited available roof space on campus and the shading of some of the larger parking lots such as those surrounding Bowers Hall, the amount of solar PV power that the campus can reasonably develop is somewhat limited. In addition, the demand for electricity on campus peaks in the fall and spring when classes are in session and is lowest in the summer which does not match the output profile of solar power (see Figure 5.5)59. Thus, we have chosen to limit the amount of solar PV on campus assumed in our model to 10 percent of the total supply in 2050. This would still be a large amount of solar capacity compared to current installation and would be equivalent to a total installed capacity of 4.1 megawatts (MW). Using SunPower 320 modules as a reference, this would amount to an array of roughly 12,800 modules and would cover an area about half the size of the lower campus parking lots (i.e. PER, Professional Studies Building, and Route 281). On the other hand, Cortland County has a relatively high wind capacity and the production of electricity from wind turbines in Central New York peak during the winter making them a good match for campus demand (see Figure 5.5).60 As such, we will assume that up to 60 percent of our total electricity demand in 2050 could be met 58 For more information on the potential energy reductions in commercial buildings see [Makhijani 2007 p. 79 to 83] 59 NREL 1994 p. 157 and 162 60 Electric Power Generation and Consumption Data by Month and State, 2001 to the Present (online at http://www.eia.gov/cneaf/electricity/epa/generation_state_mon.xls) and Electric power plants generating capacity Generating Units by State, by Company, by Plant, by dominant Source (online at http://www.eia.gov/cneaf/electricity/page/capacity/existingunitsbs2008.xls)

47
through purchase power agreements or other types of arrangements with regional wind farm developers. In order to meet the projected demand at mid-‐century, this would require either five turbines of 2.5 MW each or about eight and a half turbines at 1.5 MW each. For comparison, the Fenner Wind Facility in Madison County has 20 wind turbines at 1.5 MW each, the Noble Bliss Windpark in Wyoming County has 67 turbines at 1.5 MW each, and the Maple Ridge Wind Farm in Lewis County has 195 turbines at 1.65MW each. Thus, even taking the increased demand through 2050 into account, the campus would not require more than a fraction of the output of any new wind farm to meet the levels of demand included in our present model.61 When combined with the output of the on-‐site solar arrays, the electricity purchased from an off-‐site wind farm would create a baseline supply that closely follows the campus electricity demand (see Figure 5.6). Thus, we can have confidence that these levels of renewables are reasonable to include in our model as long-‐term targets. Figure 5.5: Graph of monthly production for solar PV and wind farms in Central New York compared to current campus electrical demand. The production/consumption per month is shown as a fraction of the annual average to aid comparisons. As expected, the demand is highest during the academic year and lowest during the summer and winter break.
61 For example, our campus demand in 2050 would amount to roughly 40 percent of the output from the Fenner Wind facility or just 4 percent of the average output from the Maple Ridge Wind Farm.
0%
20%
40%
60%
80%
100%
120%
140%
160%
Jul Aug Sep Oct Nov Dec Jan Feb Mar Apr May Jun
Campus Demand
Wind Farms
Solar PV

48
Figure 5.6: Graph showing the demand matching of our model’s assumed mix of 10% solar PV and 60% wind power. This mixture results in monthly production that closely matches campus demand and would thus be likely to impose acceptably few issues with respect to grid interconnection.
With these considerations, we are finally ready to turn to a description of the wedge model we propose for reducing greenhouse gas emissions from the electricity sector and to examine its resulting costs for these reductions.
Section 5.3 – The “Wedge Model” for Electricity
As with the heating sector, we chose to organize our model for the electricity sector around a collection of different strategies that could be combined to yield the desired level of greenhouse gas reductions. The results for this wedge model are shown in Figure 5.7 below.
0%
20%
40%
60%
80%
100%
120%
140%
Jul Aug Sep Oct Nov Dec Jan Feb Mar Apr May Jun
Campus Demand
Solar / Wind Mix

49
Figure 5.7: The wedge model for the SUNY Cortland electricity system showing four wedges that combine to result in an 88 percent reduction in greenhouse gases by 2050 compared to those in 2009-10.62
As can be seen from Figure 5.7, the four wedges chosen for the electricity system were (from top to bottom); (1) conservation and improved efficiency (orange), (2) replacing conventional electricity with that from solar photovoltaics (light blue), (3) replacing conventional electricity with that from wind (light green), and (4) replacing conventional electricity with that from other renewable resources like biomass and hydroelectric power (dark green). As we found with heating, despite getting more than 99 percent of our electricity from renewable resources, the emissions are not reduced all the way to zero. The principle reason for this is the fact that even renewables like wind and solar, while not emitting carbon dioxide during the generation of electricity, still have some greenhouse gas emissions associated with the production and transport of the materials needed to create the solar panels and wind turbines and to maintain them following installation. For the purposes of this work we used emissions factors for renewables equal to 5 percent of today’s emissions from the grid for wind, 7.5 percent for solar PV, and 12.5 percent for other renewable resources.63 Despite these residual emissions, our proposed pathway would still result in reductions near the middle of our goal of eliminating 85 to 95 percent of emissions from the energy sector as a whole. Examining Figure 5.7, we see that, unlike heating where there was one very small wedge and three wedges of roughly equal size, the largest share of the CO2 reductions in the electricity sector will come from switching to wind (47 percent) given the large wind resource in Cortland County and its excellent match for campus demand (i.e. high levels of production in the winter and lower levels in the summer). This is followed by conservation and efficiency efforts (25 percent) and switching to other renewables (21 percent) with solar photovoltaics making up the smallest share (7.5 percent) given the tight land constraints on campus and the large areas shaded by surrounding buildings. Despite the greater overall potential of renewable resources for reducing CO2 62 The large jump in electrical usage in 2014 is due to the new Student Life Center and Bowers Hall renovations coming online. The higher rates of growth evident in the future are due in large part to the additional electricity demand of the geothermal heat pumps and, to a lesser extent, the increased used of electrified vehicles on campus. 63 See for example [Meier 2002 p. 70 to 73], [POST 2006 p. 3 to 4], and [Fthenakis, Chul Kim, and Alsema 2008 p. 2170]
0
2,000
4,000
6,000
8,000
10,000
12,000
14,000
2010 2015 2020 2025 2030 2035 2040 2045 2050
Annual Greenhouse Gas Emissions from
Electricity (metric tons CO2 per year)
Efmiciency / Conservation
Solar PV
Wind
Other Renewables
Remaining CO2 Emissions

50
emissions (three-‐quarters of the total), conservation and efficiency measures will still likely have high priority given their associated costs savings from reduced energy consumption. As before, we can use our model to predict the cumulative reductions in greenhouse gases and the total costs for these reductions from the electricity sector. These results are shown in Figures 5.8 and 5.9 and will be used to determine the cost per ton of CO2 saved for our proposal. Figure 5.8: Cumulative reductions in greenhouse gas emissions from the SUNY Cortland electricity system that would be realized if the proposed wedge model was implemented.
Between 2015 and 2050 the proposed pathway would result in cumulative savings amounting to just over 256,400 tons of CO2 with an average annual reduction of just over 6,469 tons per year. For comparison, this average annual savings would be equivalent to removing a fleet of roughly 2,290 new cars from the road or to reducing the campus’s current carbon footprint by about 24 percent. Looking in more detail at the annual reductions projected by our model, we find that, as with the reductions in the heating sector described in Section 4.3, our model predicts an acceptably rapid rate of decline for the emissions from the electricity sector. For example, by 2030 following our proposed model would have achieved a reduction of about 40 percent as compared to 2009-‐2010 levels and a reduction of roughly 88 percent by 2050. As before, these values are broadly consistent with targets set forth in other climate mitigation programs.64 However, it is important to note that, as always, earlier reductions are of greater value than reductions that occur closer to 2050, so any possibilities of accelerating the pace of these reductions should be carefully considered if and when they arise. Finally, turning to the economic cost of these reductions in greenhouse gas emissions, we can see from Figure 5.9 that the cost of achieving the projected savings does not steadily increase and, instead, reaches a maximum of about $11.25 million in 2039 before beginning to decrease. This turn-‐around in the cost occurs in large part 64 For example, in the American Clean Energy and Security Act of 2009 passed by the House of Representatives, the cap-‐and-‐trade system was designed to achieve 42 percent reductions relative to 2005 levels by 2030 and 83 percent reductions by 2050. [H.R. 2454 Section 702]
0
50,000
100,000
150,000
200,000
250,000
2010 2015 2020 2025 2030 2035 2040 2045 2050
Cumulative Tons CO
2 Saved

51
because the efficiency and conservation projects built into the model will result in reduced energy costs and because the increases in electricity costs from the grid outstrip the price of electricity from some types of renewables. In terms of helping to inform decisions regarding fundraising and cash flow targets, we note that the final overall cost of the proposed changes to the electrical system would amount to just over $8.0 million over the next three and a half decades. The peak annual cost of following this path would amount to roughly $686,500 while the average annual cash flow requirement would be roughly $229,500 per year. Figure 5.9: The cumulative amount of money above and beyond what would normally be spent under a business-as-usual strategy that would be required if the wedge model was to be implemented. This total takes into account both capital costs of projects as well as differences in their life-cycle fuel costs.
For comparison, we note that the average cost we estimate for reducing the emissions from the electricity sector (i.e. $229,500 per year) would amount to just 11 percent of the average price paid by SUNY Cortland over the last three fiscal years for its electricity usage ($2.09 million). Thus, as we found for the cost of our proposed changes in the heating sector, while this additional cost is by no means trivial, it is not likely to result in a dramatic increase in the overall energy budget for the campus. As before, if a price was to ultimately be placed on the emission of greenhouse gases, the amount of this increased cost could be reduced dramatically. Finally, taking the total cost of the proposed changes in the electricity sector and dividing it by the total amount of CO2 that would be saved, we find that the proposed improvements would cost roughly $35 per ton CO2 on average. This is quite close to the cost for comparable emissions reductions in the heating sector ($38 dollars per ton) so we find that both areas are of roughly equal value in terms of the savings achieved per dollar of investment. Thus, since reductions in the electricity sector are slightly cheaper, and the potential overall reductions larger (226,400 tons versus 121,000 tons), it should be a major focus for near term reductions in greenhouse gas emissions once the satellite boiler project is completed. This is consistent with recent campus efforts such as the lighting projects supported by the ARRA and NYSERDA grants. With this, we will now turn to a consideration of the final piece of the campus energy sector, namely the emissions associated with on-‐campus transportation and the daily commuting of faculty, staff, and students.
$0
$2,000,000
$4,000,000
$6,000,000
$8,000,000
$10,000,000
$12,000,000
2010 2015 2020 2025 2030 2035 2040 2045 2050
Cumulative Cost (constant dollars)

52
Chapter 6: Commuting and On-‐Campus Transportation
Section 6.1 -‐ Recent Historical Trends
As noted in Section 2.2, daily commuting by the members of the SUNY Cortland community makes up more than four-‐fifths of the total greenhouse gas emissions associated with transportation even when the campus buses are included. Thus, addressing the emissions associated with commuting will have to be the major focus of the roadmap for transportation. In order to determine the carbon emissions for commuting we analyzed the survey data to determine four key parameters; (1) the percent of the various campus populations that drive to school rather than walk, bike, or take the bus; (2) the average round-‐trip distance for those who drive taking carpooling into account; (3) the number of days per week they commute to campus; and (4) the age of their vehicle and whether it is a car or a light truck. This last point is important given the recent increases in fuel economy for new vehicles. To highlight this fact, Figure 6.1 shows the distribution of ages for vehicles driven to campus overlaid with the average fuel efficiency of cars and light trucks sold in those years in the U.S. Figure 6.1: Breakdown of the age of personal vehicles driven by the campus community as well as the average fuel economy for new cars (blue line at top) and light trucks (red line below) that were sold in the United States. Since 2000, the average fuel efficiency of new cars has increased at roughly 1.8 percent per year while that for light trucks has increased at a slightly higher rate of 2.0 percent per year.
Turning now to the other parameters concerning campus commuting patterns, Figures 6.2 and 6.3 show the percent of people driving to school as well as the weighted average distance traveled by those populations. Several expected trends can be seen in this data. For example, part-‐time adjunct faculty tend to live further away from campus than full-‐time faculty. First year and sophomore students drive very little on average while the commuting distance increases from junior to senior year and then again from seniors to graduate students.
1989.5 1990.5 1991.5 1992.5 1993.5 1994.5 1995.5 1996.5 1997.5 1998.5 1999.5 2000.5 2001.5 2002.5 2003.5 2004.5 2005.5 2006.5 2007.5 2008.5 2009.5 2010.5 2011.5
15
20
25
30
35
40
0.0%
1.0%
2.0%
3.0%
4.0%
5.0%
6.0%
7.0%
8.0%
9.0%
10.0%
1990
1991
1992
1993
1994
1995
1996
1997
1998
1999
2000
2001
2002
2003
2004
2005
2006
2007
2008
2009
2010
2011
Average Mileage of New
Cars
and Light Trucks (mpg)
Percent of Cortland Vehicle Fleet

53
Figure 6.2: Percentage of the various sub-populations who drive to campus at least one day a week on average.
Figure 6.3: Weighted average commuting distance for the various sub-populations on campus. This result takes into account both the average round-trip distance for those who drive as well as the lack of commuting for those who walk, bike, or take the bus.
0%
20%
40%
60%
80%
100%
120%
Full time faculty
Part time faculty
Staff / Admin
First year
Sopohmore
Junior
Senior
Graduate Percent Driving to Cam
pus
0
5
10
15
20
25
Full time faculty
Part time faculty
Staff / Admin
First year
Sopohmore
Junior
Senior
Graduate
Average Daily Com
muting Distance

54
From these results, the total annual commuting distances and the overall greenhouse gas emissions for each population were calculated. For simplicity of presentation, the full and part-‐time faculty were merged into a single category in Figures 6.4 and 6.5 by taking a weighted average of their results. Figure 6.4: Total annual commuting distances for the various populations on campus.
As would be expected, staff and administrators dominate the overall commuting distance due both to their higher average driving distance and the greater number of weeks per year on average in which they commute to campus. All told, the cumulative annual commuting distance driven by members of SUNY Cortland is nearly 10.8 million miles. Of this, 36 percent is driven by staff and administrators alone despite only making up just over 8 percent of the campus population. In driving this distance a total of 318,800 gallons of gasoline is estimated to be consumed which, at $4.00 dollars a gallon, would amount to a total out-‐of-‐pocket fuel cost of nearly $1.3 million per year. For comparison, this fuel use is roughly eight times that of all vehicles driven on campus. As another way to consider the magnitude of this commuting, we note that on a typical school day, the total daily commuting distance driven by the campus community as a whole is roughly 60,500 miles round-‐trip, or more than 2.4 times around the Earth at the equator. Turning to Figure 6.5, we see that, like the total commuting distance, the staff and administrators are the largest single source of transportation emissions. Together faculty, staff, and administrators account for more than 55 percent of the carbon dioxide released as a result of driving to campus. Interestingly, graduate students, who were not included in the previous carbon footprint study due to a failure to achieve statistical significance with their survey results, are found to make up the second highest source of commuting emissions on campus. Combined with the faculty, staff, and administrators, these groups account for nearly three-‐quarters of all commuting emissions with nearly all of the unaccounted for emissions attributable to juniors and seniors.
0
500,000
1,000,000
1,500,000
2,000,000
2,500,000
3,000,000
3,500,000
4,000,000
4,500,000
Faculty
Staff / Admin
First year
Sophom
ore
Junior
Senior
Graduate
Total Annual Com
muting Distance

55
Figure 6.5: Total annual carbon dioxide emissions attributable to the commuting patterns of the campus community.
Finally, we note that our current estimate for the greenhouse gas emissions from commuting (3,600 tons of CO2 per year) is very close to the estimate of 3,560 tons per year reported in the previous carbon footprint. The closeness of these numbers however, is coincidental, and results from two canceling factors. First, as noted above, the previous transportation assessment did not include a contribution from graduate students which, in our current assessment, account for roughly 20 percent of the total emissions. The second factor is a reduction in the emissions for faculty due to an improvement in our methodology in which separate results are calculated for full-‐time tenure track, full-‐time non-‐tenure track, and part-‐time faculty after which the results are then combined in a weighted average to derive a single “faculty” result. In the previous study all faculty were treated the same in the data collection process and no intra-‐population differences were taken into consideration. In addition to the improved methodology, there are also now nearly 25 fewer faculty than when the previous footprint study was completed due to budgetary constraints which also acts to decrease the overall emissions from commuting for this population. These improvements to the prior footprint study simply happen to cancel out resulting in little overall change to the final estimate for the total annual emissions from commuting. With these results, we can now turn to our predictions for the future greenhouse gas emissions from the transportation sector.
Section 6.2 -‐ Future Projections
Unlike the heating and electricity sectors discussed in Section 4.3 and 5.3, where the energy use was principally under the direct control of the College, the transportation sector is dominated by personal commuting making it a much more difficult problem to model. Since making changes in this sector will require the participation of the majority of the campus community it is important to begin by considering their willingness to participate in such an endeavor. As part of the carbon intensity survey, the participants were asked about their willingness to make personal efforts to improve the sustainability of the campus transportation system. Their responses to this question on a scale of (1) Very Unwilling to (5) Very Willing are shown in Figure 6.6.
0
200
400
600
800
1,000
1,200
1,400
Faculty
Staff / Admin
First year
Sophom
ore
Junior
Senior
Graduate
Metric tons CO
2 per year

56
Figure 6.6: Percent of the campus community responding to the survey question: “As part of a campus wide effort, including improved public transportation and support for carpooling, would you be willing to adjust your travel habits in order to help create a campus with a less destructive impact on the environment?”
Compared to the similar question asked regarding their willingness to make changes in their eating habits (see Section 7.2), there is somewhat less support for changing the transportation sector. This is a reflection of the greater complexity involved with changing commuting patterns than food choices. That being said, the average score was a 3.6 indicating a neutral to willing attitude overall. In fact, there was a clear majority (57.5 percent) who were either willing or very willing to change while only 18 percent were unwilling or very unwilling. Thus, those who are willing to change outnumber those who are unwilling by a factor of three to one. Despite this willingness of the community to make changes there are limited options available that would substantively reduce the total amount of commuting due to the rural nature of Cortland County. Thus, it is likely that the demand will remain relatively high and, as such, we will mostly focus on transitioning away from fossil fuels for transportation to energy sources such as electricity that can be made more compatible with carbon neutrality. Before turning to those considerations, however, there are three potential strategies available for making reductions in the amount of vehicle miles that should be considered. The first of these is focused on students. While undergraduates only contribute about one-‐quarter of the total greenhouse gases from commuting, they do have the advantage of being a more concentrated population that generally lives much closer to campus than most faculty and staff. As such, the Sustainability Master Plan for the campus has recommended that the campus explore options for both deincentivizing driving to campus by examining the policies on the pricing of parking permits as well as enhancing the walking and biking culture of the campus by improving the experience for pedestrians and bicyclists when traveling through the central parts of upper campus and in particular to focus on the areas along Neubig Road.65 While the weather and the topography of the campus will remain challenges to biking, creating a more enjoyable experience for walking and biking combined with efforts to reduce the ease and convenience of driving to campus could help to decrease the
65 JMZ 2011 p. 34 and 41
0.0%
5.0%
10.0%
15.0%
20.0%
25.0%
30.0%
35.0%
Very Willing Willing Uncertain Unwilling Very Unwilling
Percent of Overall Cam
pus Population
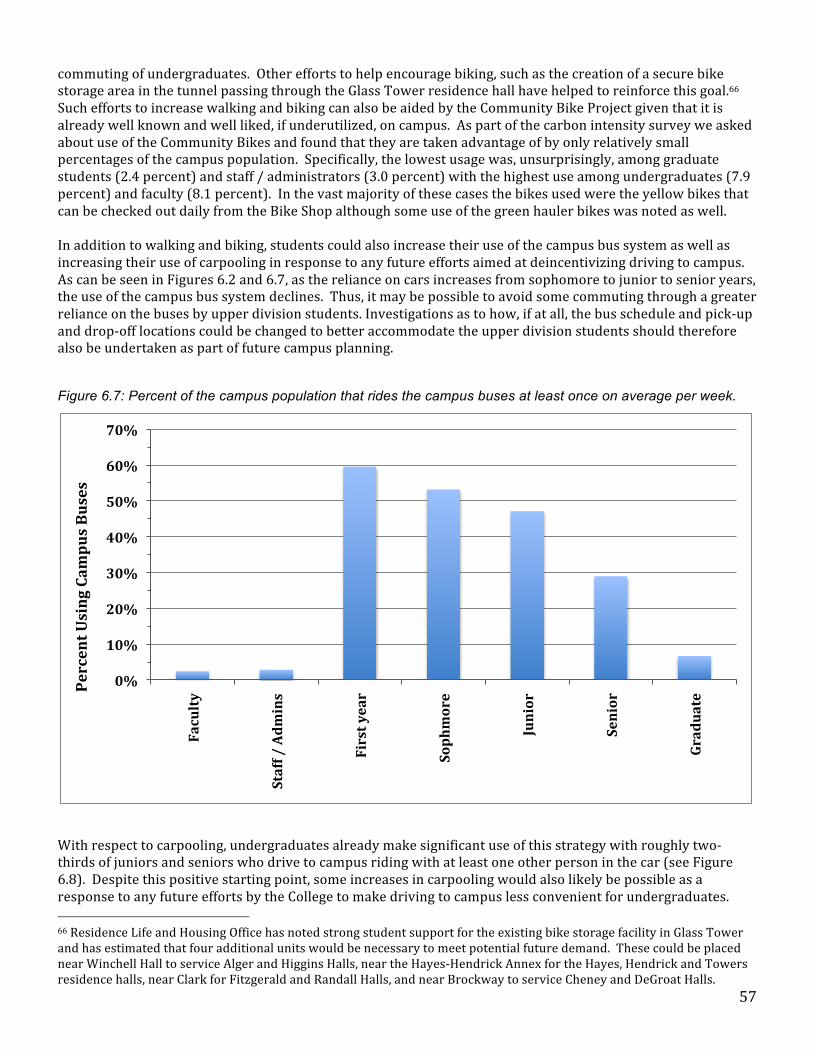
57
commuting of undergraduates. Other efforts to help encourage biking, such as the creation of a secure bike storage area in the tunnel passing through the Glass Tower residence hall have helped to reinforce this goal.66 Such efforts to increase walking and biking can also be aided by the Community Bike Project given that it is already well known and well liked, if underutilized, on campus. As part of the carbon intensity survey we asked about use of the Community Bikes and found that they are taken advantage of by only relatively small percentages of the campus population. Specifically, the lowest usage was, unsurprisingly, among graduate students (2.4 percent) and staff / administrators (3.0 percent) with the highest use among undergraduates (7.9 percent) and faculty (8.1 percent). In the vast majority of these cases the bikes used were the yellow bikes that can be checked out daily from the Bike Shop although some use of the green hauler bikes was noted as well. In addition to walking and biking, students could also increase their use of the campus bus system as well as increasing their use of carpooling in response to any future efforts aimed at deincentivizing driving to campus. As can be seen in Figures 6.2 and 6.7, as the reliance on cars increases from sophomore to junior to senior years, the use of the campus bus system declines. Thus, it may be possible to avoid some commuting through a greater reliance on the buses by upper division students. Investigations as to how, if at all, the bus schedule and pick-‐up and drop-‐off locations could be changed to better accommodate the upper division students should therefore also be undertaken as part of future campus planning. Figure 6.7: Percent of the campus population that rides the campus buses at least once on average per week.
With respect to carpooling, undergraduates already make significant use of this strategy with roughly two-‐thirds of juniors and seniors who drive to campus riding with at least one other person in the car (see Figure 6.8). Despite this positive starting point, some increases in carpooling would also likely be possible as a response to any future efforts by the College to make driving to campus less convenient for undergraduates. 66 Residence Life and Housing Office has noted strong student support for the existing bike storage facility in Glass Tower and has estimated that four additional units would be necessary to meet potential future demand. These could be placed near Winchell Hall to service Alger and Higgins Halls, near the Hayes-‐Hendrick Annex for the Hayes, Hendrick and Towers residence halls, near Clark for Fitzgerald and Randall Halls, and near Brockway to service Cheney and DeGroat Halls.
0%
10%
20%
30%
40%
50%
60%
70%
Faculty
Staff / Admins
First year
Sophmore
Junior
Senior
Graduate
Percent Using Campus Buses

58
Figure 6.8: Percent of those who drive to campus at least one day a week who carpool with at least one other person in the car on a routine basis.
The second strategy that should be explored for reducing the amount of commuting to campus would be to increase the number of full-‐time faculty and correspondingly reduce the number of part-‐time adjuncts teaching on campus. As we found in Figure 6.3, full-‐time faculty commute, on average, shorter distances to school. This is due in large part to the number of full-‐time faculty that can walk to campus and thus contribute no commuting distance at all. Therefore, despite the fact the full-‐time faculty travel to school more days per week on average (4.4 days per week versus 2.4 for part-‐time faculty) they still commute shorter total distances. For comparison the average distance traveled by full-‐time faculty per week is nearly 25 percent less than that for adjuncts (79 miles per week versus 105 miles). This is not merely due to a few outliers with unusually long commutes, since a similar difference is also found in the median commuting distance (65 miles per week for full-‐time faculty versus more than 82 miles per week for adjuncts). Particular focus in such a strategy should be on increases to the tenure track faculty given that they tend to live much closer to campus and have more consistent schedules making them easier to integrate into any future plans to improve public transit in the region. For example, more than seven out of every ten tenure track faculty live within 10 miles of campus while only about one in five part-‐time faculty lived that close to campus. In addition, the concentration of the faculty and their greater frequency of traveling to campus would also be conducive to initiatives aimed at increasing faculty carpooling and, potentially, to greater use of public transportation systems if they were to become a viable option in the future. Finally, increasing the number of full-‐time faculty would also help to reduce the total number of faculty employed by the College, and thus the number of people driving to campus. For example, in Fall 2010, full-‐time faculty (both tenure track and non-‐tenure track) made up just 44.4 percent of the faculty on campus, but taught 57.3 percent of the classes and laboratories. Thus, there are a number of reasons to give serious consideration to the hiring of new full-‐time faculty as part of the campus’s move towards climate neutrality.
0%
10%
20%
30%
40%
50%
60%
70%
80%
Faculty
Staff / Admins
First year
Sophmore
Junior
Senior
Graduate
Percent of People Driving Who Carpool

59
The third option for reducing commuting distances is associated with potential changes to the methods of course delivery. In particular, an expanded use of online courses would have the potential to reduce both faculty and student travel to campus. This would be of greatest potential significance in the context of graduate classes given the longer commutes and lower car pooling rates of graduate students compared to undergraduates and the fact that graduate students often travel to campus for only one or two classes per day during the semester. However, unless there was a significant shift in the delivery of courses at SUNY Cortland, the use of online curriculum is not likely to play a major role in reducing commuting. For example, in Fall 2009 and Fall 2010, just one percent of course sections taught college-‐wide were offered asynchronously and thus are not a major contributor to overall student credit hours. Before turning to our projections for the future costs of transportation, it is important to note that there are additional strategies available to the College in terms of reducing the amount of driving by on-‐campus vehicles. For example, in order to reduce the use of gas for lawn mowers and other grounds keeping vehicles, the campus plans to declare as much as one-‐fourth of the campus as “natural” areas and thus eliminate mowing for these regions altogether. In addition, the campus has switched to slower growing varieties of grass in an effort to reduce the frequency of mowing in areas where it will not be eliminated. As a second example, it would be possible to reduce the number of short trips across campus by maintenance and other workers, which as noted in Section 2.1, have higher impacts due to cold-‐start emissions. In order to accomplish this, it would be necessary to establish a satellite office and staging area and to hire additional staff so that they could be located closer to the buildings they service. However, if such a strategy was to be pursued it would be critically important to ensure that the amount of CO2 off-‐set by reducing the amount of driving by on-‐campus vehicles was not made up for or surpassed by the additional commuting emissions from the new hires. Finally, as we did with heating and electricity, we must now consider the future cost of both unleaded gasoline and diesel fuel. This is a particularly challenging task given the high degree of volatility in fuel costs due to changes in oil prices, to weather, and to economic and political conditions both domestic and international. Looking at the recent past, we note that the average price of all unleaded gasoline sold in New York State rose steadily from 2001 until 2008 at a rate of increase of more than five percent per year. Following a brief reduction in the price following the financial crisis and the onset of the recession, the price began to rise again in early 2009 and has grown at roughly the same rate over the last year and a half as it had before the economic crash.67 In light of this, and such factors as the increasing demand for oil in countries like China, India, and Brazil, it would seem reasonable to assume a sustained increase in the cost of transportation fuels. However, the Energy Information Administration predicts no such growth in their most recent outlook and, instead, predicts growth rates of just 0.6 percent per year for unleaded gasoline and 0.8 percent per year for diesel.68 While we have chosen to make use of the EIA projections, it is possible, perhaps likely, that the true cost of gasoline will increase far faster than what we are assuming. This would make the transition to the kinds of sustainable technologies considered in our model far more attractive from an economic perspective. As with our decision to assume limited increases in the cost of natural gas for heating (see Section 4.2), we chose to use the EIA’s estimates for small increases in the cost of transportation fuels so as to be more likely to err on the side of conservatism rather than optimism in our economic predictions. With these considerations, we are ready to turn to our final wedge model quantifying the reduction of greenhouse gas emissions from the transportation sectors.
67 U.S. Retail Gasoline Historical Prices: New York, Energy Information Administration, online at http://www.eia.gov/oog/ftparea/wogirs/xls/pswrgvwsny.xls (viewed on 6/25/11) 68 EIA 2011 in Petroleum Table 12

60
Section 6.3 – The “Wedge Model” for Transportation
As with the heating and electricity sectors, we chose to organize our model for the transportation sector around a variety of strategies that could be combined to yield the desired level of greenhouse gases reductions. The results for this wedge model are shown in Figure 6.9. Figure 6.9: The wedge model for the SUNY Cortland transportation system showing six wedges that combine to result in nearly 71 percent reductions in greenhouse gases by 2050 compared to those in 2009-10.
As can be seen from Figure 6.9, the complexity of the transportation system and the diversity of its sources of emissions is reflected in the larger number of wedges required. The six wedges chosen for analysis were, in order from top to bottom; (1) switching commuter vehicles from those receiving average fuel economy to those that are among the top performers in their class for conventional gasoline vehicles (orange); (2) reduction in commuting from increased walking, biking, use of public transportation, and carpooling (teal); (3) use of electric cars for commuting to and from campus (light green); (4) and (5) switching buses from either diesel or propane to biodiesel (purple and light blue); and (6) an increased use of electric cars for on-‐campus transportation (dark green). As we found in the electricity sector, the wedges are not all of equal value in their ability to reduce emissions. The share of total emissions reduction attributable to each wedge is
(1) switching buses to propane = 1.1 percent
(2) switching buses to biodiesel = 4.4 percent
(3) increased use of electric cars on-‐campus = 3.6 percent
(4) use of electric cars for commuting = 13 percent
(5) reduction in commuting through carpool, etc. (i.e. conservation) = 19 percent
(6) increased fuel economy of commuter fleet (i.e. efficiency) = 59 percent
0
500
1,000
1,500
2,000
2,500
3,000
3,500
4,000
4,500
5,000
2010 2015 2020 2025 2030 2035 2040 2045 2050
Annual Greenhouse Gas Emissions from
Transportation (metric tons CO
2 per year)
Increased MPG
Reduced Commuting
Electric Cars - Commuting
Biodiesel Buses
Propane Buses
Electric Cars - On Campus
Remaining CO2 Emissions

61
Even taking all six of these wedges into account, the overall reductions in greenhouse gases only amounts to roughly 71 percent which again highlights the many difficulties involved with efforts to address the emissions from a highly decentralized transportation system. In addition, unlike heating and electricity, we find that there are still substantial amounts of conventional energy resources required. For example, despite eliminating nearly 85 percent of gasoline use and more than 75 percent of diesel fuel, the campus would still consume nearly 70,000 gallons of unleaded gasoline and more than 3,100 gallons of diesel in 2050. Helpfully, the transportation sector only accounts for about 16 percent of the primary energy use on campus and so when these reductions are combined with those from the heating and electricity sectors (see Sections 4.3 and 5.3), the roadmap we propose would still achieve an overall reduction in greenhouse gases emissions from SUNY Cortland’s energy system as a whole of just over 85 percent, which is just above the low end of our targeted range of 85 to 95 percent reductions overall. As we have done with heating and electricity, we will now look at our model’s predictions for what the cumulative reductions in greenhouse gas emissions would be as well as what the overall cost would amount to. These results are shown in Figures 6.10 and 6.11 and will be used to determine the cost per ton of CO2 saved for our proposal. The one new complexity to this strategy, however, is the fact that the costs for transportation improvements will not be borne by the College alone. In order to achieve the increased use of electric and high-‐efficiency gasoline powered cars for use in daily commuting, the campus community as a whole would need to individually choose to make direct investments as well. We have broken the costs out into the on-‐campus and off-‐campus components to allow each area to be considered separately. In determining the cost per ton of CO2 saved, however, we will sum the two investments to allow the most direct comparison possible to the costs of reductions in the electricity and heating sectors. Figure 6.10: Cumulative reductions in greenhouse gas emissions from the SUNY Cortland transportation system that would be realized if the proposed wedge model was implemented.
Between 2015 and 2050 the proposed pathway would result in a cumulative savings amounting to just over 55,250 tons of CO2 with an average annual reduction of roughly 1,580 tons per year. For comparison, this
0
10,000
20,000
30,000
40,000
50,000
60,000
2010 2015 2020 2025 2030 2035 2040 2045 2050
Cumulative Tons CO
2 Saved

62
average annual savings would be equivalent to removing a fleet of about 560 new cars from the road or to reducing the campus’s current 2009-‐10 carbon footprint by about 5.9 percent. Looking in at the annual reductions projected for individual years we note that, by 2030 our proposal would have achieved a reduction of only about 32 percent as compared to the 71 percent reductions that will have been achieved by 2050. This is a relatively slow rate of reduction and efforts to accelerate it should be explored wherever possible. However, it is clear the higher cost per ton of these CO2 reductions as highlighted below will remain a potential barrier to accelerating these efforts. One final note on this point is that our proposal includes a convenient means of communicating a nearer term goal so that we do not risk complacency with having a target date of 2050 that is set so far into the future. In particular, we find that our proposed pathway would result in reductions for the energy system as a whole of approximately 25 percent by 2025 which, lends itself nicely to a “25 in 25” goal for use in communicating medium term goals with the campus community. Turning now to the cost of our proposed reductions in greenhouse gas emissions, we can see from Figure 6.11 that, unlike the heating and electricity sectors the costs for the transportation sector will continue to rise through 2050. This is due in large part to our assumption that the costs of conventional fossil fuels rise only slowly over this time. If a rate of increase comparable to that of recent history is used instead, the cumulative costs would come down significantly. As it stands, the overall investment needed totals roughly $16.6 million for individuals in the campus community and $8.3 million for the College itself. The peak annual cost of following this path would amount to roughly $1.8 million for the community and $205,000 for the College while the average annual cash flow requirements would be roughly $460,000 per year and $140,000 respectively. Figure 6.11: The cumulative amount of money above and beyond what would be spent under a business-as-usual strategy that would be required if our wedge model was to be implemented. The top line (red) is the cost to the commuters while the bottom line (blue) is the cost to the campus.
For comparison, our projected average annual cost for commuters would amount to less than $165 per person per year for their personal travel and $194 per year if their share of the on-‐campus expenses were added in. On
$0
$2,000,000
$4,000,000
$6,000,000
$8,000,000
$10,000,000
$12,000,000
$14,000,000
$16,000,000
$18,000,000
2010 2015 2020 2025 2030 2035 2040 2045 2050
Cumulative Cost (constant dollars)
Cumulative Cost - On Campus
Cumulative Cost - Commuters

63
the other hand, the cost for non-‐commuters would amount to just $29 per year. While we do not propose here specific strategies for raising the needed capital and have recommended the formation of a separate committee to prepare such plans (see Chapter 8), by way of comparison we do note that these levels of investments are not particularly large when compared to such things as the current SUNY Cortland transportation fee paid by students of $164 per person per year or the current average gasoline bill of commuters for their travel to and from campus of $440 per year assuming a cost of approximately $4.00 per gallon for gas. As a further way to compare the size of these required investments, we note that the College could raise all of the capital it requires for conversion of the on–campus fleet by raising the cost of registering a car for parking by less than $57 per year. Such an increase, if it were ultimately chosen as part of a plan to fund these changes, would raise parking costs at SUNY Cortland to $72 per year for faculty, staff, and first-‐year undergraduates and to $169.50 per year for other students. This can be compared to the costs of parking at Cornell ($346.90 to $777.30 per year) or at Syracuse University ($50 to $994 per year for employees depending on their salary and $74 to $682 for students) for example . While not making a recommendation one way or the other, we do note that if parking permit and vehicle registration fees were raised in support of these goals it would be consistent with the recommendations of the Sustainability Master Plan that “parking permit fees should serve as a disincentive to automobile use.”69 However, great care would need to be taken by the funding committee we propose in considering any such strategy to ensure that it would not place an undue burden on any members of the community, with particular care given to populations such as staff, working students, and part-‐time faculty. A sliding scale, such as that employed by Syracuse University, might be explored for its potential to be part of a solution to these concerns. As we have done before with our analysis of heating and electricity, we can now take the total cost of the proposed transportation changes and divide it by the total amount of CO2 that would be saved. In this case, we find that the cost of the proposed improvements would amount to roughly $450 per ton CO2 on average. As would be expected from the complexity of the challenges facing any effort to address the transportation sector, the costs of reducing greenhouse gas emissions in this area are found to be much higher than those for the heating and electricity sectors ($38 per ton and $35 per ton respectively). Thus, it is reasonable to conclude that near-‐term efforts should focus on improvements in heating and electricity given their larger absolute potential for reductions and their much lower costs. In this respect it is interesting to note that our models are consistent with this timing in that heating and electricity are found to have 59 and 68 percent of their peak cumulative investment occur before 2030, while transportation has less than 16 percent of its total investment occurring before 2030. To put this another way, our models support investing 80 cents of every dollar the campus plans to spend on greenhouse gas reduction between now and 2030 on improvements in the heating and electricity sectors with the remaining 20 cents spent on the transportation and food service sectors. The weighting of near-‐term investments to the heating and electricity sectors has the added advantage that, if improvements in automotive technologies such as batteries for electric cars were to occur faster than currently projected, the required investments in transportation would decrease dramatically given their slower start and rapid increase only in the final 20 years of the plan. In addition, the slower start to investments in transportation will also allow for potential improvement in biomass technology to meet the demand for liquid fuels. In looking at the six wedges included in Figure 6.9, we note that our present model has taken no credit for an increased use of ethanol for personal vehicle travel. This is due in large part to such considerations as; (1) the serious environmental concerns that surround the present production of ethanol from corn in the U.S.; (2) the questions over how much corn ethanol actually reduces greenhouse gas emissions compared to gasoline; and (3) the uncertainties surrounding the future commercial development and cost effectiveness of non-‐corn and non-‐sugarcane based ethanol.70 If technologies such as micro-‐algae or cellulosic ethanol derived from switch grass and other high-‐productivity plants were to become commercially viable and widely implemented in the near to medium term, the reductions in greenhouse gas emissions from the transportation sector could 69 JMZ 2011 p. 34 70 See for example [Pimentel and Patzek 2005], [Hill et al. 2006], [Food & Water Watch et al. 2007], [Solomon, Barnes, and Halvorsen 2007], [Makhijani 2007 p. 45 to 59], and [Schmer et al. 2008]

64
potentially become more dramatic and could come at a lower cost. While we have not taken credit for such advances in ethanol production in the present model in order to be conservative in our assumptions, it is important that this be revisited in future versions of the roadmap as these technologies advance. As a final note, similar to the concerns regarding non-‐conventional natural gas extraction outline in section 4.2, there are potential concerns regarding the sourcing of oil used to produce the liquid fuels consumed by the campus and its community and the impact of future greenhouse gas emissions from transportation. Currently, the EIA projects that nearly 10 percent of the oil produced between 2015 and 2035 will come from non-‐conventional sources such as tar sands and oil shale.71 This increased reliance on non-‐conventional oil will likely increase the life-‐cycle CO2 emissions associated with gasoline and diesel fuel use in the future. For example, recent studies of oil shale operations such as those at the Green River Formation in the western U.S., find that the CO2 emissions from liquid fuels produced by this oil are likely to be between 25 and 75 percent higher than those associated with conventional oil.72 Similarly, studies of liquid fuels derived from oil extracted from tar sands located in western Canada found that the life cycle CO2 emissions would vary from 7 percent less to as much as 40 percent more than those from conventional oil extraction techniques depending on the specific technologies being compared.73 Thus, future versions of the climate action plan should take care to monitor the use of liquid fuels from unconventional oil resources given their potential to increase the associated emissions from the transportation sector. In summary, we note that, when all three areas (heating, electricity, and transportation) are added together, the total reductions in greenhouse gas emissions amount to 85 percent from the energy sector as a whole compared to our current levels. These reductions would require a projected total cost of $37.5 million. Of that, approximately $20.9 million would come from on-‐campus expenditures while the remaining $16.6 million must be supplied by commuters. This level of overall investment could be expected to result in cumulative savings of roughly 402,700 tons through 2050 or average annual reductions of more than 11,500 tons per year. This is an amount equivalent to removing nearly 4,100 new cars from the road or of reducing our current carbon footprint by just over two-‐fifths. All told, our model predicts an average cost of roughly $93 per ton of CO2 eliminated from the energy system as a whole which compares quite well with the range of carbon reduction costs examined in global studies of greenhouse gas mitigation strategies.74 With this, we have completed our analysis of the campus energy system and will now turn to the final source of greenhouse gas emissions examined in this study, namely the emissions associated with the production and transport of the food that is served on campus.
71 EIA 2011 in Oil/Liquids Table 21 72 Brandt, Boak, and Burnham 2010 73 Charpentier, Bergerson, and MacLean 2009 74 See for example [IPCC 2007 p. 9]

65
Chapter 7: Food Services
Section 7.1 -‐ Recent Historical Trends
On-‐campus dining is administered by the Auxiliary Services Corporation (ASC), a not-‐for-‐profit, campus based organization that provides services to the community such as running the dining halls and the College Store. There are currently at least nine facilities where food is served on campus. These include, Neubig, Dragon's Court, Raquette Pizza, Friendly's, Dunkin' Donuts, Poolside, Bookmark, Dragon's Den, and Hilltop. In the past, there were also two additional facilities, the Caleion Room and Colloquium which have been closed. There are currently no plans to re-‐open these dining facilities in the future as areas where food is to be prepared or served. In order to gain a sense of the relative importance of these dining facilities to the campus food system, their weekly hours of operation and the average number of transactions per week that they carry out are detailed in Figures 7.1 and 7.2. Figure 7.1: Normal hours of operation per week during the academic year for the nine on-campus food service facilities currently in operation.
0
10
20
30
40
50
60
70
80
90
100
Neubig
Dragon's Court
Raquette Pizza
Friendly's
Dunkin' Donuts
Poolside
Bookmark
Dragon's Den
Hilltop
Normal Operating Hours per Week

66
Figure 7.2: Average number of transactions per week during the academic year for the nine on-campus food service facilities currently in operation.
Before turning to the greenhouse gas emissions associated with the food served in these facilities, it is important to note the many projects that have been undertaken by ASC to improve the energy efficiency of these facilities and to reduce the amounts of both food and non-‐food waste that they produce. Among the more notable improvements undertaken in the past few year include; (1) the replacement of an old dishwasher in Neubig in the summer of 2007 with a more energy efficient model that also uses less water than the old model; (2) the replacement of an electric boiler in the Commissary in the summer of 2008 with a gas fired model that uses far less energy; (3) the replacement of an electric pizza oven in Raquette Pizza with a more efficient steam-‐fired oven in the summer of 2009; and (4) the replacement of an electric fryer in Raquette Pizza with a gas fryer in the winter of 2011. These four projects cost a combined $211,000, but resulted in energy savings in excess of $1,100 a month in addition to helping to reduce the electric demand on campus. All together, therefore, these projects have average paybacks of less than 16 years. Additional improvements from ASC include their decision in spring 2008 to begin the practice of only purchasing Energy Star compliant appliances and their efforts to ensure that the vending machines on campus are equipped with automatic shut-‐off capabilities so that they can go dormant if unused over a certain amount of time. In fact, 33 of the 47 beverage vending machines on campus were replaced by new models in the summer of 2010, leaving only 7 machines at the College that are more than 5 years old. Finally, ASC has also sought to optimize the hours of operation for the various food service facilities (see Figure 7.1) to reduce energy consumption at facilities that were being under utilized during times of low customer traffic. In addition to their efforts focused on reducing energy consumption, ASC has also undertaken a number of recent initiatives to reduce the amount of food and non-‐food waste they generate. For example, in spring 2010, Neubig eliminated the use of trays which significantly reduced the amount of food waste from students taking more than they wished to eat and, as an added benefit, left fewer items to be washed saving both water and energy. In addition, the dining facilities now donate all perishable items to Loaves and Fishes, a not-‐for-‐profit soup kitchen in Cortland, before shutting down for extended breaks. With respect to non-‐food waste, ASC has done such things as; (1) working with their partners to eliminate the mandatory bags usually given to customers at Dunkin Donuts and the Subway franchises; (2) introducing biodegradable/compostable products into The Dragon’s Court and Hilltop; (3) offering a 15 percent discount on beverages when using a refillable
0
1,000
2,000
3,000
4,000
5,000
6,000
7,000
8,000
9,000
10,000
Neubig
Dragon's Court
Raquette Pizza
Friendly's
Dunkin' Donuts
Poolside
Bookmark
Dragon's Den
Hilltop
Average Transactions per Week

67
mug rather than a disposable cup; (4) upgrading their website to reduce paper use for applications, surveys, and ordering / transfer requests; and (5) increasing fountain beverage service and other efforts to reduce the consumption of bottled beverages, and in particular, bottled water on campus. This last initiative has been particularly successful resulting in a greater than 98 percent reduction in sales of bottled water between the 2006-‐07 and 2009-‐10 academic years. Finally, ASC has also sought to reduce its waste by donating approximately 3,500 gallons of used vegetable oil each year to a farmer in Marathon, New York who filters it and uses it to run his farm equipment rather than diesel fuel refined from oil and by beginning a program at Hilltop where the food waste from that dining facility is given to a farmer for use in his compost rather than being disposed of as trash. With that brief review of ASC’s energy and waste reduction efforts, we will now turn to the primary focus of this chapter, namely the estimated greenhouse gas emissions associated with the production and transport of the food they serve. As noted in Chapter 2, the emissions are estimated based on the reported percentage of food consumed by the campus community that is provided by on-‐campus food service. Figure 7.3 shows the survey results and, as would be expected, faculty, staff, and graduate students have the lowest reported use of campus dining while first years and sophomores report the highest usage getting a combined 85 percent of their food from on-‐campus sources. Figure 7.3: Percent of food consumed by the campus community during the academic year that is provided by on-campus sources.
Using our estimate for the annual per capita greenhouse gas emissions from the production of food of 1.69 tons per person per year and an estimate for the number of weeks the different populations are on campus, we found the total emissions that should be allocated to the campus food service. These results are shown in Figure 7.4. As would be expected, the large populations of first year and sophomore students as well as their high reliance on campus dining during the academic year make them by far the most important contributors to the footprint. Together they account for more than three-‐quarters of the campus’s food related emissions while the majority of the remaining emissions are attributable to the juniors and seniors.
0%
20%
40%
60%
80%
100%
Faculty
Staff / Admins
First year
Sophom
ore
Junior
Senior
Graduate
Percent of Food from
On Cam
pus

68
Figure 7.4: Total annual greenhouse gas emissions in tons of CO2-equivalent per year attributable to each population from on-campus food service.
All told, the total estimated agricultural emissions from food services provided on campus is 4,650 tons CO2-‐equivalent. This is a 17 percent reduction from the estimate of 5,630 tons from the previous carbon footprint. This reduction is not, however, likely to be due to actions by the campus and, in fact, is not likely to represent much of a real reduction at all. Between 2007 and 2011, the Environmental Protection Agency changed the way in which they estimate agricultural emissions and, as a result, the new estimates are roughly 25 percent less than those reported in the 2007 document which was used to determine the previous campus footprint. This change in the EPA’s methodology, therefore, accounts for the vast majority of the differences between our present estimate and that from three years ago. With these results, we are now ready to turn to a consideration of our predictions for the future greenhouse gas emissions from the on-‐campus food service.
Section 7.2 -‐ Future Projections
Before discussing how the campus might seek to reduce the greenhouse gas emissions from its food services, we must first briefly consider projections for the future emissions from the agricultural system. This is similar to our consideration of the future emissions associated with electricity purchased from the grid discussed in Section 5.2 in that the emissions from agriculture and electricity are determined by a complex set of choices made by producers and are not simply determined by the physics of combustion as are the direct emissions from the use of natural gas, diesel fuel, or gasoline. Globally, we note that the total emissions of non-‐CO2 greenhouse gases such as methane and nitrous oxide from the agricultural sector are expected to increase sharply in the near future. For example, the EPA estimates that global N2O emissions from fertilizer use and other soil management practices will increase nearly 40 percent by 2020 relative to 2000 levels. Similar increases are expected for methane emissions from livestock (30 percent increase), methane and nitrous oxide emissions from manure (24 percent increase), and methane emissions from rice cultivation (22 percent
0
500
1,000
1,500
2,000
2,500
Faculty
Staff / Admins
First year
Sophom
ore
Junior
Senior
Graduate
Metric tons CO
2 per year

69
increase).75 However, somewhat smaller increases are expected in the United States. For example, N2O emissions from soil management in the U.S. are expected to increase by only about 20 percent between 2000 and 2020.76 In the present case, however, we are not interested in the total emissions, but are only interested in per capita emissions. As a result of population growth, the per capita emissions will not increase at these rates and may, in fact, decrease in some areas. For example, over the last 20 years, per capita agricultural emissions in the U.S. have fallen by an average of roughly 0.4 percent per year (see Figure 7.5). However, it is important to note that they have shown a fair degree of volatility with emissions increasing by 3.1 percent one year only to decrease by nearly 3.4 percent the next.77 Figure 7.5: Total per capita, annual greenhouse gas emissions in tons of CO2-equivalent per person per year from the U.S. agricultural system including estimated emissions associated with transportation of food.
To be conservative in our estimates for the needed scale of future reductions in greenhouse gas emissions from food, we have chosen not to take credit for this slow, business-‐as-‐usual reduction in emissions from the overall agricultural system. Thus, the size of the needed reduction we will calculate for the campus as well as the cumulative cost are likely to be conservative when future changes to the agriculture as a whole are taken into account. For example, if the recent trend in per capita emissions was to continue unabated through 2050, it alone would result in roughly a 12 percent reduction in the overall emissions from the food service at SUNY Cortland without any specific efforts having to be made by the college. Turning now to the question of reducing these greenhouse gas emissions, we note that, when compared to the carbon footprint associated with the energy sectors described in the three previous chapters, the emissions associated with the on-‐campus food services are substantially more challenging to address. This is due to the greater variety of greenhouse gases that must be considered (CO2, N2O, and CH4), the greater number of sources they are emitted from, and the greater complexity of the chemical and biological processes responsible for their release. In addition, the sources of these gases are often located remote from campus (sometimes separated 75 EPA 2006 p. V-‐1 76 EPA 2006 p. V-‐6 77 EPA 2011 p. 2-‐19 to 2-‐20
y
1.4
1.6
1.8
2
2.2
2.4
2.6
1985 1990 1995 2000 2005 2010 2015
Metric tons CO
2 per person per year

70
from the end users by hundreds or even thousands of miles) and it may not always be easy to find ways to reduce them that are within the control of the College.78 In addition, there are complex trade-‐offs that can be involved with activities aimed at improving the sustainability of agriculture which are beyond the scope of the present work to consider. For example, the use of riparian buffer zones (i.e. areas of dense vegetation along waterways) can improve water quality by reducing nitrate run-‐off entering streams and rivers and thus reducing one of the main causes of eutrophication. However, these buffer zones achieve these improvements by enhancing denitrification processes that can lead to increased emission of nitrous oxide (N2O) associated with fertilizer use which, as we have noted, is a powerful greenhouse gas and one of the major components of agriculture’s carbon footprint.79 As a result of these complexities, we have not attempted to propose a detailed wedge model for food in this initial version of the climate action plan. Future versions of this roadmap will seek to expand on our current illustrative analysis and to place emissions reductions from food service on the same footing as those from heating, electricity, and transportation. As part of that effort, we have identified five initial areas where detailed feasibility and cost information is to be collected by ASC as a starting point for deriving the needed model inputs. These areas of investigation include determining the cost of; (1) reducing overall meat consumption on campus by offering a greater number and variety of vegetarian and vegan meals (2) switching suppliers of meat to those producing grass fed, organic and/or local beef; (3) switching to organic produce; (4) eliminating long-‐distance transport of refrigerated and frozen foods; and (5) eliminating internationally-‐sourced produce or meat. Each of these five investigations addresses an area of particular significance to the emissions from the agricultural sector including methane emissions from animals and manure, the nitrous oxide and other emissions associated with the production and use of synthetic fertilizers, and the energy required to transport certain types of foods over long-‐distances. We will briefly consider each of these points below, before turning to our conclusions and recommendations in our final chapter. In looking at the cost of switching meals from meat-‐based to vegetarian or vegan options, we would be taking advantage of the large differences in greenhouse gas emissions that are associated with these foods. For example, in a study using the energy intensity of different foods as a means of estimating the CO2 emissions associated with their production, Eshel and Martin estimated that roughly 72 to 82 percent of the per capita emissions associated with the average U.S. diet comes from meat and animal products despite their making up less than 28 percent of the total caloric intake.80 This implies a level of emissions per kilocalorie (kcal) of food energy for non-‐meat based foods of just 10 to 15 percent of those for meat. Similar results were found in the study of Weber and Martin in which the greenhouse gas emissions per kcal of food energy for fruits and vegetables was found to be less than 40 percent of those associated with red meat while the emissions for cereals and grains were estimated to be less than 15 percent of those from red meat.81 Interestingly, Weber and Martin also found that the emissions from poultry and fish (i.e. non-‐ruminant animals that have much lower methane emissions) are comparable to those of fruits and vegetables but still about 2.5 times those of cereals and other carbohydrates.82 We have not included in the present effort an examination of large-‐scale switching from red meat and pork to poultry or fish because of the fact that fish currently presents its own environmental concerns with fisheries facing serious challenges to their sustainability83 and the fact that SUNY Cortland already serves a high proportion of poultry compared to other meats. For example, in 2006-‐07, more than two-‐thirds of the meat ordered by ASC from Maines Paper and Food Service by catch weight was chicken and turkey (amounting to more than 73 tons of poultry) with the remaining meat a mixture of beef (20 percent) and pork (12 percent). Thus, the easiest way to reduce future beef and pork consumption is to
78 For example, Weber and Matthews estimate that the average distance directly traveled by food as of 2004 amounted to roughly 1,250 miles. [Weber and Matthews 2008 p. 3512] 79 NAS/NRC 2010 p. 28 to 29 80 Eshel and Martin 2006 p. 5 to 13 81 Weber and Martin 2008 p. 3510 82 Weber and Martin 2008 p. 3510 and 3511 83 See for example [Pauly et al. 2002] and [Pauly et. al. 2003]

71
consider the cost and feasibility of increased vegetarian and vegan meals and not those of switching to less greenhouse gas intensive meats like chicken. The advantages of such a strategy of food substitution are widely recognized. For example, in addressing the option of increased offering of vegetarian and vegan options in university dining systems, Bowen and Martin from the University of Chicago noted
Reduced overall meat consumption through “meatless meals” can constitute an easy and cost-‐effective GHG emissions reductions strategy for college and university dining halls to implement. The university already offers daily meatless choices for vegetarians and vegans in its dining halls; promoting a “meatless meal”, for example, once a week might actually lead to budgetary savings while demonstrating significant environmental savings as well. Such a programme would not mandate removing dining hall meal options containing meat, but would highlight vegetarian or vegan options and encourage students to choose these meals instead. This idea is already being instituted in school dining halls and cafeterias across the country; Johns Hopkins Bloomberg School of Public Health facilitates a nation-‐wide “Meatless Monday” campaign providing a toolkit for implementation by food service providers. While this particular campaign is focused solely on nutrition education and awareness, a similar model could be used to accomplish a number of goals, not only improving nutrition, but also reducing environmental impact.84
Similar possibilities can be explored for the SUNY Cortland campus as well. For example, ASC already offers The Veggie Patch in the Dragon’s Court featuring the motto “all vegetarian all the time.” This facility offers foods such as soups, sandwiches, casseroles, rice, vegetables, meatless burgers, and salads and is open for business 46 hours a week. In addition, ASC introduced four “sustainable food days” in Neubig during the fall 2010 semester which featured local foods and could be considered for expansion in the future to include greater amounts of vegetarian and vegan food as well and could be explored as a model for the potential adoption of a “Meatless Monday” type program should such an event be of interest to the campus. Finally, we note that there appears to already be some support on campus for exploring these kinds of expanded vegetarian offerings. On the carbon intensity surveys described in Section 2.1, we asked the respondents for the number of meals per week that they eat each week that do not contain meat. We found that the population with the lowest percentage of fully vegetarian meals was first years and sophomores with only 30 percent of their meals being meat-‐free. This fraction rose to nearly 40 percent of meals for juniors, seniors, and graduate students, and to nearly 50 percent for faculty and staff. We also asked the survey respondents if these percentages would be likely to increase if ASC was to offer a greater number as well as more varied vegetarian options. Interestingly, the populations with the greatest use of campus dining and the lowest percentage of meat-‐free meals (i.e. first years and sophomores) also had the most positive response to this question. Roughly a third of the respondents indicated that they would eat less meat if more vegetarian or vegan foods were offered as compared to about one-‐fifth for the rest of the community being willing. Given that first-‐year and sophomore students are responsible for more than three-‐quarters of the campus’s food related emissions, this could provide an interesting opportunity for the Office of Residential Life and Housing to leverage programs like the Green Reps to educate incoming undergraduate students living on campus regarding the impact of their food choices and the ability of individual changes in this area to positively affect the carbon footprint of the campus. Similar programs to promote more sustainable food choices for incoming students have been proposed, for example, at schools like Duke University.85 Reducing the consumption of beef and pork is clearly the easiest way to reduce their associated greenhouse gas emissions, however there are also opportunities for making choices about how and where the animals are raised that can result in the lowering of emissions from the meat that will continue to be served by campus food service. Thus, the second question under investigation by ASC is the cost of switching to the procurement of more meat from local farmers and/or from farmers raising organic, grass fed animals. The campus has already had success in procuring such meat in small quantities. For example, ASC purchased grass-‐fed, hormone free beef from their normal distributor Maines for the New York Jets football team during their training camp on
84 Bowen and Martin 2010 p. 254 85 Giuliano 2010 p. 87

72
campus. They have also recently ordered more than 380 pounds of local beef from a nearby farmer at a cost premium of $0.60 per pound for ground beef and $2.15 per pound for top round. In seeking to estimate the greenhouse gas savings from switching to these more sustainable agricultural practices, however, we find that the question becomes highly complex with the results depending in detail on the specifics of how the animals are raised including exactly how they are ranched, what happens to the manure and urine they produce, what agricultural practices are used to grow the grain fed to animals on conventional farms compared to those used to maintain the pasture lands for grass fed cattle, and even on such details as where watering troughs are located.86 For example, grain fed cattle tend to produce more methane per animal than those fed on grass, but due to differences in the rate at which they add muscle mass, the emissions per pound of beef produced may show the opposite trend in some cases.87 Similar complexities arise in considering the impacts of the fact that pastures for cattle require far fewer fertilizers, pesticides, and herbicides than lands growing grain crops for conventional fed-‐lot operations, but the nitrogen deposited by cattle in manure on pastures may be more highly oxidized than the synthetic fertilizers used on crops resulting in higher rates of nitrous oxide emissions per pound.88 Despite these complexities, it can be shown that, at least in some cases, organic farming practices do, in fact, reduce the overall emissions associated with raising cattle and pigs. For example, a life-‐cycle assessment of suckler-‐beef production in Ireland found that organic farming practices reduced the emissions per pound of beef produced by about 15 percent compared to conventional practices and by nearly 57 percent per hectare of land used for raising the cattle.89 However, this was also accompanied by a decrease in the productivity of the farms in terms of the amount of beef produced per unit of land of about a factor of two.90 There are, however, a number of important heath, environmental, and animal welfare considerations not considered here that should also be taken into account when deciding between sourcing options for meat and other animal products.91 In considering these results, both the relatively modest reductions per pound (15 percent) and the reduction in productivity per hectare of land (57 percent) that accompany switching to organic practices further argue for the importance of exploring options for reducing overall meat consumption in addition to exploring alternative sourcing options for the meat. In addition, the complexity of ensuring that organic beef is actually lowering the campus emissions compared to conventional techniques argues for the importance of local sourcing since this will allow the campus to be sure of the details associated with how the animals are raised and that there are not hidden sources of emissions not being taken into account. Thus, even though transportation is a small part of the overall greenhouse gas emissions associated with beef,92 the need for the campus to know exactly what is occurring on the farm appears to be a strong argument for exploring options to purchase a greater percentage of our meat from local sources. The third question under investigation by ASC concerns the costs associated with switching to organic produce. Organic farming practices for fruits, vegetables, cereals, and grains, unlike those for animals discussed above, unambiguously lowers emissions of greenhouse gases compared to conventional tillage practices although some questions remain comparing organic agriculture to no-‐till farming strategies that still uses herbicides and fertilizers. For example, in one study, no-‐till practices reduced greenhouse gas emissions by 88 compared to conventional tillage for a typical corn-‐soy-‐wheat rotation while organic farming practices with legume cover
86 See for example [NAS/NRC 2010 p. 237 to 239 and 244 to 245] for their comparisons of Management-‐Intensive Rotational Grazing Systems for cattle and Low-‐Confinement Hog Systems to more conventional agricultural systems and [EPA 2006 p. V-‐21 to V-‐29 and IPCC 2007 p. 510 to 511] for their descriptions of mitigation options for non-‐CO2 greenhouse gases associated with conventional livestock and manure management practices. 87 NAS/NRC 2010 p. 237 88 NAS/NRC 2010 p. 238 to 239 89 Casey and Holden 2006 p. 231 90 Casey and Holden 2006 p. 239 91 See for example [NAS/NRC 2010 p. 239 to 241 and 248 to 249] 92 Weber and Matthews estimate that delivery accounts for just 1 percent of the greenhouse gas emission associated with red meat as compared to 11 percent for fruits and vegetables. [Weber and Matthews 2008 p. 3511]

73
resulted in reduced emissions per square meter of land by 64 percent.93 More complex and bio-‐diverse crop rotations such as corn–corn–soybean–wheat with the use of red clover as an under-‐seed, may result in even larger reductions in greenhouse gas emissions when compared to traditional crop rotations.94 Similar results have been found in studies of other crops such as wheat, although the reductions were somewhat smaller.95 Among the most important mechanisms by which the switch to no-‐till and organic farming practices result in reduced greenhouse gas emissions is their ability to increase the amount of carbon locked up in the soil by fungi and other microorganisms.96 This so-‐called soil sequestration can be a major sink for removing atmospheric carbon dioxide because the top soil of agricultural lands have lost an estimated 50 to 70 percent of their carbon content due to modern farming practices which can be, at least partially, restored through alternative soil management techniques such as “conservation tillage, use of manures, and compost as per integrated nutrient management and precision farming strategies, conversion of monoculture to complex diverse cropping systems, meadow-‐based rotations and winter cover crops and establishing perennial vegetation on contours and steep slopes.”97 In addition to increases in soil carbon, organic farming practices will also result in reductions in greenhouse gas emissions due to the fact that they make use of no synthetic fertilizers which can be a major contributor to the emissions of conventional agriculture. In part, these reductions can be achieved by any practice that results in more careful and controlled application of the nitrogen in compost and natural fertilizers minimizing the amount of excess nitrogen available for oxidization into nitrous oxide.98 However, even using the same method of application, it also appears that natural fertilizers such as composted plant residues or manure can have lower N2O emissions compared to those associated with synthetic fertilizers.99 Adding to the direct emissions of nitrous oxides from their use on fields, the production of synthetic fertilizers represents a large fraction of the direct and indirect energy use on modern farms. For example, estimates put the amount of energy required to create the nitrogen fertilizers used on corn fields in the U.S. at 40 to 50 percent of the total energy required by the farm. Overall, estimates place the amount of energy used in making synthetic fertilizers at roughly 31 percent of the total energy consumed in the U.S. agricultural sector with pesticide production making up another 5 percent. This can be compared to 19 percent of total energy consumption on farms that comes from the operation of all onsite agricultural equipment or 13 percent for the operation of all irrigation equipment.100 Switching to natural fertilizers like manure for corn can result in saving as much as 60 to 85 percent of the energy required for manufacturing the synthetic fertilizers.101 As a final note on this, it is important to point out that much of the energy consumed for fertilizer production is in the form of natural gas. As we noted in Section 4.2, a recent study found that, when the impact of methane leakage from wells and other areas is taken into account, the effective impact on the climate of using natural gas from shale formations could be comparable to that of coal when considered over a 100 year timeframe.102 This is a serious potential concern for the future given the predictions from the EIA that over the next 20 years nearly 40 percent of all natural gas produced in the U.S. will come from shale deposits. This can be compared to the fact that less than 5 percent of gas produced in the previous 20 years was extracted from shale.103 If it does become the case in the future that the natural gas being consumed for the production of synthetic fertilizers is coming
93 NAS/NRC 2010 p. 89 to 92 94 NAS/NRC 2010 p. 101 95 NAS/NRC 2010 p. 228 96 See for example [Lal 2003] and [IPCC 2007 p. 14]. Care must be taken not to over simplify these analyses, however, given the impact of such things as changes in soil moisture on denitrification and the resulting N2O emissions from fertilizer application. [EPA 2006 p. V-‐9 to V-‐12] 97 Lal 2003 p. 151 and 161 to 173 98 EPA 2006 p. V-‐8 and IPCC 2007 p. 506 to 507 99 Akiyama et al. 2004 100 McLaughlin et al. 2000 p. 2.2 and 2.5 101 McLaughlin et al. 2000 p. 2.1 and 2.5 102 Howarth, Santoro, and Ingraffea 2011 p. 679 103 EIA 2011 Figure 89

74
predominately from shale formations, than the emissions savings from switching to organic produce and grains could be substantially larger than what would currently be estimated. The two final questions being explored by ASC involve efforts to reduce the impact of emissions caused by energy used in the shipment of foods to campus. To begin with ASC is exploring the costs that would be associated with making changes to how we procure foods that are likely to have particularly high amounts of transportation energy use, namely those foods that must remain refrigerated or frozen during shipment and foods shipped to the U.S. from overseas. In addition to the reduction in transportation energy, internationally sourced foods may also require a more thorough analysis in future determinations of campus purchasing policies. For example, as summarized by Bowen and Martin in their analysis of campus dining:
Not dealt with extensively in this study due to lack of data, banana cultivation presents a useful anecdotal example demonstrating both the need for more metrics and other environmental advantages of sustainable (specifically organic) production beyond decreased energy intensity and CO2 emissions. In a review of world agricultural practices, Clay (2004) finds that “bananas produced for international trade are the most pesticide-‐intensive of the major tropical food crops.” Clay (2004) also finds that conventional bananas grown for export are also particularly fertilizer-‐intensive, and that fertilizers are rarely applied with site-‐specific requirements taken into consideration. Additionally, the method of irrigation associated with this cultivation regime for bananas intensifies the resulting environmental degradation through water runoff. Although organic production of bananas likely does lead to CO2 emissions reduction or energy savings through reduced use of agrochemical inputs, organic production might also reduce other significant ecological impacts from conventional banana cultivation, such as water runoff and resulting watershed impacts; long-‐term contamination of soils and rates of tropical deforestation (due to differences in how long banana plantations remain productive under different management regimes).104
With reference to these last two questions and their focus on the localization of food more generally, it is important to note that there is ongoing work within the Community Forum Sustainability Track (see Section 3.5) and other local organizations that will allow more detailed explorations of the costs and potential availability of local foods to be made in subsequent action plans. The ability to buy locally will likely be of greatest importance for produce given that transportation energy is a much larger fraction of the overall greenhouse gas emissions from produce than it is for meat or dairy where gases like methane and nitrous oxide released on the farm play a more significant role.105 In this context, it is important to note that, ASC already carries several locally sourced products such as milk, yogurt, cottage cheese, and bagels from local vendors such as Upstate Farms, Bagel Lovers, Coffee Mania, Crowley’s Soft Serve, Great Lakes Cheese, Cornell Dairy, and Cornell Cider. In addition, as noted above, ASC already introduced four “sustainable food days” in Neubig for the Fall 2010 semester which featured local foods and provided a model for future near-‐term expansion of these kinds of offerings. In looking to the future availability of local foods and the feasibility of ASC being able to source a greater percentage of its staple foods locally, it is interesting to note that studies of so-‐called “foodsheds” in New York State, it was found that, outside of New York City, most of the other areas in the state would be capable of providing “the vast majority of their food needs” within a distance far shorter than the nearly 1,300 miles currently traveled by our food.106 Specifically, the study found that most of the population centers in the State outside NYC could get between 80 and 100 percent of their food within distances of just 22 to 71 miles.107 As such we will adopt a somewhat more conservative range and seek to define “local” in the context of assessments for future climate action plans as having been sourced within 100 miles of campus. For example, this would represent an area running essentially from Watertown, New York in the north to Scranton, Pennsylvania in the south and could result in as much as a 90 percent reduction in the average distance traveled by the food served at SUNY Cortland.
104 Bowen and Martin 2010 p. 255 105 Weber and Matthews 2008 p. 3511 106 Peters et al. 2009 p. 80 107 Peters et al. 2009 p. 79

75
Finally, with respect to the future availability of local foods for use on campus we can point to the growth of the local foods movement in the County over the last decade. Today, there are at least five farmers’ markets operating within the communities immediately surrounding SUNY Cortland including the Cortland Farmers’ Market, the Homer Farmer’s Market, the Virgil Farmers Market, the Groton Farmers’ Market, the Cincinnatus Farmer’s Market, and the Ithaca Farmers’ Market with many others operating in cities, towns, and villages throughout the Finger Lakes Region. In addition, the County has established a Local Agriculture Promotion Committee, new stores focused on providing local foods and products such as Oh My Goodness Health Food in Homer have opened, and organizations such as Cornell Cooperative Extension work with programs such as the Buy Local Campaign to prepare a bi-‐annual Guide to Foods Produced in the Southern Tier & Finger Lakes aimed at promoting local agriculture. As a final note, with respect to the localization of food, in addition to general issues of overall supply availability, one of the major obstacles to the increased use of local produce in college and university dining services is the mismatch of the growing season with the school year. In our climate, the growing season for many crops typically overlap with just the first few or last few weeks of the school year. In seeking to address this constraint, greater flexibility in procurement policies and priorities may need to be explored as part of future climate plans. For example, as noted by Bowen and Martin
Flexibility to work within the local food context can be introduced through two key strategies: (1) modifying composition of the fruit and vegetable portion of the diet during months of limited fresh produce options to incorporate local, seasonal items that, for example, are cultivated through passive greenhouses (i.e., leafy greens) and (2) purchasing produce preserved during its season of production that will allow “out-‐of-‐season” consumption.108
In expanding on these suggestions, Bowen and Martin found from investigations of the food service at their own institution that preservation of local foods for use at a later date would be easiest to integrate with existing procurement strategies if they were implemented early in the supply chain. As an example, they noted a case where frozen green beans from a regional supplier were processed and frozen at the farm level prior to being sold to the University and, despite the energy associated with freezing, transport, and storage, were still able to lower overall greenhouse gas emissions compared to conventionally sourced produce.109 If such strategies are found to be useful as a result of ASC’s exploration of seasonality issues, then these questions of local and regional processing capacity can be raised with the community groups noted above that already work to promote the expansion of local agriculture. Other options for addressing the seasonal mismatch of production and demand could also be explored for their potential to support the increased use of local foods. For example, these options could include such strategies as the construction of expanded on-‐campus storage facilities and root cellars to store and preserve certain types of long-‐lasting produce or the construction of Earth-‐bermed, passive solar greenhouses on campus for growing produce during the academic year. This last strategy would have potential pedagogical advantages as well since these greenhouses could be used as teaching tools by Departments on campus. Finally, in looking to make the needed changes in food service at SUNY Cortland, it is important to note that we are not the first institution to consider these questions and we should seek to learn from the efforts of those who have gone before wherever possible. Among the many potential sources of insight that the campus should consider in looking to create a more complete action plan for campus dining in the future are university and region specific polices, resources, and assessments such as:
1. Appalachian State University: “A Sustainable Food System at ASU”110
2. Cornell University: “Farm to School in the Northeast: Making the Connection for Healthy Kids and Healthy Farms”111
3. Duke University: “Green Dining at Duke University: Facilitating Local and Sustainable Food Procurement”112
108 Bowen and Martin 2010 p. 252 109 Bowen and Martin 2010 p. 249 and 252 110 ASU 2010 111 Cornell et al. 2007

76
4. Emory University: “Sustainability Guidelines for Food Service Purchasing”113
5. University of British Columbia: “University of British Columbia Food System Project: Towards Sustainable and Secure Campus Food Systems”114
6. Yale University: “Sustainable Food Purchasing Guide”115
as well as more general guidance and informational resources such as:
1. “A Guide to Developing a Sustainable Food Purchasing Policy” from the Association for the Advancement of Sustainability in Higher Education, Food Alliance, Health Care Without Harm, Institute for Agricultural Trade and Policy, and Oregon Center for Environmental Health116
2. “Local Foods: From Farm to College and University Foodservice” by Catherine Strohbehn and Mary Gregoire with support provided by the Iowa State University Hotel, Restaurant and Institution Management Development Fund117
3. “Something to Cheer About: National Trends and Prospects for Sustainable Agriculture Products in Food Service Operations of Colleges and Universities”, by Douglas Johnson and George Stevenson with funding provided by The Center for Integrated Agricultural Systems at the University of Wisconsin-‐Madison118
4. The Community Food Security Coalition’s National Farm to College Program which seeks to encourage connections between colleges and universities and the local agricultural producers in their region.119
These resources can provide valuable models from which to begin any future consideration of new procurement polices or other strategies that may ultimately be needed in order to increase the use of local and more sustainable foods on campus. Considering the scope of the challenges involved with reducing the greenhouse gas emissions from food service on campus and the active role individuals will need to play in facilitating and supporting these changes, we chose to explore the willingness of the campus community to participate in such an endeavor. Specifically, as part of the carbon intensity survey, the participants were asked to report their willingness to adjust their eating habits in order to help create a more sustainable campus. Their responses to this question on a scale of (1) Very Unwilling to (5) Very Willing are shown in Figure 7.6.
112 Giuliano 2010 113 Emory 2011 114 Rojas, Richer, and Wagner 2007 115 Yale 2008 116 Buck et al. 2007 117 Strohbehn and Gregoire 2004 118 Johnson and Stevenson 1998 119 For more information see http://farmtocollege.org/

77
Figure 7.6: Percent of the campus community responding to the survey question: “As part of a campus wide effort, would you be willing to adjust your eating habits to include more local and organic foods in order to help create a campus with a less destructive impact on the environment?”
Compared to the similar question asked regarding the campus community’s willingness to make changes in its commuting patterns (see Section 6.2), there is somewhat more support for making the needed changes to campus dining. This may, in part, reflect the greater individual cost and complexity involved with the actions required to change commuting patterns compared to those involved with changing food choices. For this question, the average score was a 3.9 indicating an overall willingness to changing how we get our food. Looking at this another way, we find that a super majority (67.5 percent) were either willing or very willing to change while only about 12 percent of the campus was unwilling or very unwilling to change. Thus, with those willing to change outweighing those who are unwilling by more than five and a half to one, this support appears strong enough to lend further encouragement to the efforts of ASC to explore the questions laid out above and to help craft a more detailed roadmap for reducing the greenhouse gas emissions from campus food services in future versions of this action plan.
Section 7.3 – Illustrative Cost Estimate for Reductions in Food Sector
Given the willingness of the community to change their eating habits and the lack of currently available information sufficient to construct a wedge model for campus food services, we chose to examine the possible costs associated with the needed reductions in greenhouse gases through a simplified, illustrative analysis. It was found in the previous chapters that our proposed roadmap for the heating, electricity, and transportation sectors would result in a combined 85 percent reduction in their associated emissions. Recalling that our overall goal was for an 80 to 85 percent reduction in the total greenhouse gas emission from all sources on campus, we find that the reductions in the emissions associated with food required to meet this goal would be between 55 and 85 percent. In lieu of a more detailed model, we will adopt a target around the mid-‐point of this range (i.e. 72.5 percent) as an interim goal for the present action plan. Achieving this level of emissions reduction, along with those for the energy sector outlined in the preceding chapters, would result in an 83
0.0%
5.0%
10.0%
15.0%
20.0%
25.0%
30.0%
35.0%
40.0%
45.0%
Very Willing Willing Uncertain Unwilling Very Unwilling
Percent of Overall Cam
pus Population

78
percent reduction for the campus’s carbon footprint as a whole relative to 2009-‐2010 levels. While not truly carbon neutral, this level of reduction in overall emissions would be within the range of what is currently believed necessary to avoid the most dangerous potential consequences of global climate change.120 In addition, it is consistent with the goal embodied in the Presidents’ Climate Commitment of reducing “the global emission of greenhouse gases by 80% by mid-‐century at the latest,” as well as the goal set forth in the Governor’s Executive Order 24.121 To conclude this section, we will again make use of the results from the energy analyses presented in the earlier chapters of this work to try to gain at least some illustrative sense of what level of investment may be required to achieve the desired 72.5 percent reduction in emissions from campus food service. In lieu of detailed cost and feasibility data for the five areas of investigation discussed in the previous section, we will make use of a simple assumption for this illustrative example, namely that every ton of CO2 avoided in the food sector will cost, on average, the same as it would to eliminate a ton of CO2 from the energy sector (i.e. $93 per ton CO2 as found in our present work). While it is true that there is no fundamental reason that the two costs should be exactly the same given the dramatic differences between agricultural emissions and those from burning fossil fuels, there is reason to believe that they should not be too very different from each other either. As one would expect, the greenhouse gas emissions associated with conventional agricultural practices and the potential strategies for mitigating these emissions has been extensively studied.122 As part of these studies efforts have been made to determine the potential amounts of greenhouse gas reductions that could be achieved at a given price per ton of CO2 given the usefulness of this as a metric to compare different strategies for combating global warming. For example, the IPCC included in their most recent assessment report an estimate for the global potential for greenhouse gas reductions for such sectors as energy supply, transit, buildings, and agriculture that could be achieved at the cost of $20, $50, and $100 per ton. In light of our average cost of $93 per ton of CO2 saved from the heating, electricity, and transportation sectors on campus, we will focus only on the IPCC’s estimates for emissions reductions that are possible at a cost of up to $100 per ton.123 Figure 7.7 shows the IPCC’s estimates for the potential reductions that could be made with investments of this level.
120 For example, this goal is consistent with the targeted reductions in greenhouse gas emissions for 2050 included in the American Clean Energy and Security Act of 2009 passed by the U.S. House of Representatives. [H.R. 2454 Section 702] 121 See Appendices B and C 122 See for example, [EPA 2006 p. V-‐1 to V-‐72], [IPCC 2007 p. 499 to 532], and [Vandermeer et al. 2009] 123 IPCC 2007 p. 11
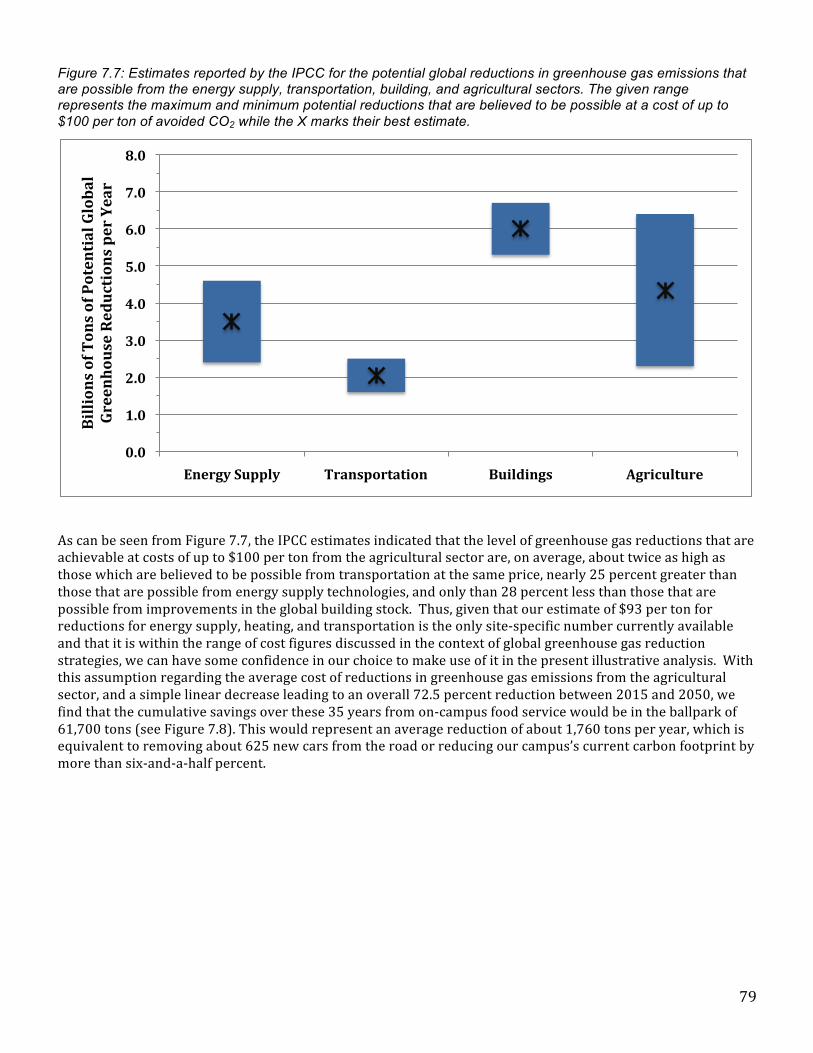
79
Figure 7.7: Estimates reported by the IPCC for the potential global reductions in greenhouse gas emissions that are possible from the energy supply, transportation, building, and agricultural sectors. The given range represents the maximum and minimum potential reductions that are believed to be possible at a cost of up to $100 per ton of avoided CO2 while the X marks their best estimate.
As can be seen from Figure 7.7, the IPCC estimates indicated that the level of greenhouse gas reductions that are achievable at costs of up to $100 per ton from the agricultural sector are, on average, about twice as high as those which are believed to be possible from transportation at the same price, nearly 25 percent greater than those that are possible from energy supply technologies, and only than 28 percent less than those that are possible from improvements in the global building stock. Thus, given that our estimate of $93 per ton for reductions for energy supply, heating, and transportation is the only site-‐specific number currently available and that it is within the range of cost figures discussed in the context of global greenhouse gas reduction strategies, we can have some confidence in our choice to make use of it in the present illustrative analysis. With this assumption regarding the average cost of reductions in greenhouse gas emissions from the agricultural sector, and a simple linear decrease leading to an overall 72.5 percent reduction between 2015 and 2050, we find that the cumulative savings over these 35 years from on-‐campus food service would be in the ballpark of 61,700 tons (see Figure 7.8). This would represent an average reduction of about 1,760 tons per year, which is equivalent to removing about 625 new cars from the road or reducing our campus’s current carbon footprint by more than six-‐and-‐a-‐half percent.
0.0
1.0
2.0
3.0
4.0
5.0
6.0
7.0
8.0
Energy Supply Transportation Buildings Agriculture
Billions of Tons of Potential Global
Greenhouse Reductions per Year

80
Figure 7.8: Simple linear model for reductions in greenhouse gas emissions from on-campus food service that would result in the required 72.5 percent reduction by 2050. The small increase through 2015 is included to be conservative regarding our estimates for future food service on campus given the pending construction of the new Student Life Center.
The total cost for these reductions in greenhouse gas emissions would amount to roughly $5.75 million using our estimate of an average price of $93 per ton. For comparison, these reductions can be compared to savings of more than 402,700 tons at a total cost of roughly $37.5 million from the energy sector. In light of the fact that the cumulative reductions in the food service sector are only about 15 percent of those from heating, electricity, and transportation, the simplicity of the model we have used in this initial action plan appears not to be an unreasonable starting point. Finally, in order to put the total cost for the reductions in greenhouse gas emissions from the food sector into perspective, we note that the average annual investment of just under $164,200 projected by our current illustrative analysis would amount to an increase in the average cost of student meal plans of just 1.3 percent for on-‐campus meal plans ($57 per year) and 0.7 percent for off-‐campus meal plans ($12 per year) assuming a equal distribution of the total cost among all meals offered by the various plans.124 Further work quantifying the costs associated with the five strategies for reducing the greenhouse gas emissions from food at SUNY Cortland discussed in the previous section will help to significantly narrow the uncertainty of these figures. Such work will help to provide greater confidence in our results and to address the questions that remain regarding the applicability of our current estimate of $93 per ton for reductions in the emissions from food service. This is particularly important given the wide range of reported costs associated with specific mitigation efforts due to the complexity of looking at such large-‐scale and varied systems as U.S. or world agriculture. For example, the EPA estimates that global nitrous oxide reductions and soil carbon increases could achieve reductions in emissions of about 15 percent over conventional practices at no cost whatsoever but that prices of around $50 per tons would be needed to eliminate the next 10 percent of these
124 ASC 2010 Appendices B and C, http://www.cortlandasc.com/mealplans/on-‐campus.cfm, and http://www.cortlandasc.com/mealplans/off-‐and-‐west-‐campus.cfm
0
500
1,000
1,500
2,000
2,500
3,000
3,500
4,000
4,500
5,000
2010 2015 2020 2025 2030 2035 2040 2045 2050
Metric tons CO
2 per year from
On-Cam
pus Food Service

81
emissions.125 Altogether, the EPA estimated that U.S. greenhouse gas emissions from agriculture could be reduced by about 25 percent for a cost of $60 per ton of CO2, however, both numbers are well below our current use of $93 per ton to achieve 72.5 percent reductions.126 Similar patterns can be found in looking at the cost estimates of the IPCC as well. For example, in their most recent assessment, the IPCC estimated that global emissions from agriculture could be reduced by 20 to 52 percent at a cost of $50 per ton depending on the assumptions for the business-‐as-‐usual case that are used and that these reductions could be increased on a global scale of 23 to 63 percent if the cost was increased to $100 per ton.127 In light of the current uncertainties that remain about the mixture of mitigation strategies that will ultimately be employed for the SUNY Cortland food sector and the specific costs they will entail, it is useful to note in concluding our present work that, even if we are underestimating the costs of the needed reductions from food by as much as a factor of 3.75 (i.e. even if the actual cost of reducing these agricultural emissions ultimately amounts to as much as $350 per ton of CO2 instead of the $93 per ton used in the present work), the total additional costs per year would not exceed an amount equal to five percent of the revenue ASC receives from the sale of campus meal plans.128 As such, it seems reasonable to conclude that the costs associated with the needed reductions in greenhouse gas emissions from food, while by no means trivial, will fall well within a reasonable range for the campus to act upon. With this illustrative analysis of the food services sector, we have finally completed our description of the initial roadmap for what will be necessary in order to achieve the overall “climate neutrality” to which the campus has committed itself through the Presidents’ Climate Commitment. In the concluding chapter we will summarize our recommendations for what should be considered with respect to actions to be taken during the next five years as the College moves forward towards the goals outlined in this work.
125 EPA 2006 p. V-‐65 to V-‐66 126 EPA 2006 p. V-‐34, V-‐35, V-‐37, V-‐39, V-‐46, V-‐47, V-‐49, V-‐51, V-‐53, and V-‐56 127 IPCC 2007 p. 9 128 At an average price of $350 per ton of CO2 avoided, the average annual cost of the reductions in emissions from the food services sector at SUNY Cortland would amount to $617,300. As before, to illustrate the scale of this cost we note that such an annual investment could be covered by an increase in the price of meals plans by just 5.0 percent for on-‐campus plans ($215.50 per year) and 2.7 percent for off-‐campus plans ($45.20 per year).

82
Chapter 8: Conclusions and Recommendations
As noted in Section 1.3, the most important conclusion of this work is the fact that it does appear to be possible to achieve the College’s goal of reducing greenhouse gas emissions by 80 to 85 percent overall by 2050 at a cost that, while by no means trivial, is well within the scope of what is reasonable. These reductions will come exclusively from increases in the efficiency of energy use, from reductions in consumption through conservation efforts, and from reducing the use of fossil fuels both directly as a source of primary energy and indirectly through their use in the production of conventionally grown foods. By 2050, the roadmap we lay out in the present work would replace more than 99 percent of the fossil fuel use in the heating and electrical sectors, as well as 30 percent of remaining conventional liquid fuels. Overall, this would mean that greater than 95 percent of all primary energy consumed by the College would come from renewable resources like solar, wind, and biomass by mid-‐century. These changes would save a total of 464,700 tons of CO2 at an overall cost of $43.4 million ($26.7 million for the campus and $16.6 million from commuters) over 35 years. The average annual reductions would amount to 13,300 tons, equivalent to removing roughly 4,700 new cars from the road or to eliminating nearly half of the current campus carbon footprint. To put these costs into perspective, we note that the investment need from commuters would amount to nearly $475,000 per year which would represent an increase of about 37 percent over the $1.3 million the campus community pays for the gasoline required to commute to and from the College. If the costs of car insurance, oil changes, and vehicle maintenance attributable to commuting were added to the cost of gasoline, the relative increase required for making the improvements we propose would be even less. For another way to compare these needed investments, we note that the average cost per commuter would amount to roughly $165 per year which can be compared to the current student transportation fee of $164 per year. Turning to the campus as a whole, the average cost for the College itself would be an average of about $740,500 per year. This would represent an increase of about 17 percent over the $4.3 million per year the campus currently pays for the electricity, natural gas, and liquid fuels it consumes. This cost would amount to roughly $93 per person per year which, for comparison, is less than half the current student activity fee of $200 per year charged by the campus. In looking to implement the substantial changes proposed in our roadmap, the campus can look to a wide variety of resources that are available which offer helpful guidance and useful case studies of best practices from other colleges and universities. Many such resources are available through the website of the Association for the Advancement of Sustainability in Higher Education (AASHE) of which SUNY Cortland is already a member.129 Other books and reports such as the Rocky Mountain Institute’s “Accelerating Campus Climate Initiatives”, the National Association of College and University Business Officers’ “Boldly Sustainable: Hope and Opportunity for Higher Education in the Age of Climate Change”, and the collaboratively written “Universities and Climate Change: Introducing Climate Change to University Programmes” are also readily available and offer helpful guidance in how to both integrate sustainability into campus planning and, perhaps more important, how to think about funding such efforts.130 In light of the serious challenges that following our proposed roadmap will likely present, we will conclude this work with six recommendations aimed at establishing the infrastructure necessary to begin implementing this action plan. They will focus primarily on activities that should be done within the next two to three years since these actions will need to be completed and the infrastructure we propose to put in place before any longer-‐term recommendations can be made. As such, our present recommendations are as follows:
Recommendation One: The College should commit itself to achieving the 20 percent reduction in greenhouse gases by 2014 relative to 2006-‐07 levels set forth as a goal in the 2007 SUNY policy on energy conservation and sustainability. Current estimates put the campus on track for a 15 percent reduction and a plan for achieving the needed additional needed reductions should be prepared. This plan will in large part
129 For more information see their website at http://www.aashe.org/ 130 Kinsley and DeLeon et al. 2009, Bardaglio and Putman 2009, and Filho et al. 2010

83
need to address the additional energy consumption, and thus CO2 emissions, of the new Student Life Center and the renovated Bowers Hall and can serve as a test run for future planning activities aimed at achieving the far larger reductions envisioned by this roadmap. In preparing this plan, particular attention should be given to the SUNY policy’s goal of increasing the use of renewable electricity to 30 percent by 2014 as well. Current estimates place the likely percentage of renewable electricity for SUNY Cortland at about 10 percent in 2014 and one of the best ways to move forward with the present roadmap and to meet the reductions targeted in the SUNY policy would be to explore offsetting the additional energy consumption of the new buildings with renewable sources of electricity.
Recommendation Two: The College should commit to updating the entire climate action plan, including preparing a new carbon footprint, at least once every two years. This would be consistent with the reporting timeline required by the Presidents’ Climate Commitment and would help to ensure that this document remains the best possible source of information for use by the campus in planning strategies for future carbon reductions.
Recommendation Three: The College should prepare an annual report outlining the progress made during the year on implementing the emissions reductions envisioned by the most recent version of the climate action plan as well as the success of fundraising efforts for future plans. As part of the preparation of these progress reports, the College should adopt a uniform reporting procedure for all divisions on campus such that any effort undertaken by the campus aimed at reducing greenhouse gas emissions costing more than $5,000 should be required to report a short description of the project, total project cost, projected annual energy and/or CO2 savings, projected annual financial savings if any, and project lifetime. Activities costing less than $5,000 would be encouraged to report this same information, but would be required only to report total project costs and a short description of the project. This information should be collected by the Campus Sustainability Coordinator for all curricular efforts or other programmatic activities from academic departments while the Physical Plant Energy Manager should collect this information for all other campus efforts. This uniform reporting scheme would aid in the preparation of campus reports for the Sustainability Tracking, Assessment and Rating System (STARS) as well.
Recommendation Four: The Campus Sustainability Coordinator and the Physical Plant Energy Manager should present the annual progress report and updated climate action plans to the campus at multiple venues at the start of the each school year. These presentations could take such forms as a Sandwich Seminar, a presentation to the Student Government Association (SGA), or a presentation at a Physical Plant staff meeting. This would ensure that the campus community remains up-‐to-‐date on the progress that has been made and that they will be provided with opportunities to give their feedback and input on this initiative at the start of each new academic year. Other methods for seeking to keep the campus informed of the goals of the climate action plan and to seek their input and support should be explored as well.
Recommendation Five: A permanent standing committee should be established by President Bitterbaum with a specific charge to, in consultation with all relevant stakeholders, prepare five-‐year funding plans to ensure that adequate monies are available to make the required investments outlined in the climate action plan. These five-‐year plans should be submitted to the President’s Cabinet for approval and presented to the campus community at public meetings. Given the central importance of finding the needed capital to the success of this effort, the committee should include high-‐level representation from the following divisions on campus Finance and Management, Facilities Management, the Physical Plant, Facilities Planning, Design and Construction, Student Affairs, and the Auxiliary Services Corporation (ASC). In addition, it should include three tenured faculty at the Associate or Full Professor level, with one coming from each of the College’s three schools (Arts and Science, Professional Studies, and Education) as well as one student from each school who are either juniors or seniors. The funding plan prepared by this committee should be updated following years two and four of each five-‐year period with the progress of these funding efforts reported each year as part of the annual report described above in recommendation three. In order to

84
highlight the need for such five year plans, Figure 8.1 shows the cumulative investment needs of the present roadmap between 2015 and 2050. The needed investments rise from just roughly $565,000 per year for the 2015 to 2020 timeframe ($2.8 million over five years) to a maximum of nearly $1.72 million per year from 2030 to 2035 ($8.6 million over five years) before dropping off dramatically after that.
Figure 8.1: Total investment above and beyond that for a business-as-usual scenario required by the College for all sectors (heating, electricity, on-campus transportation, and food service) over each five year period between 2015 and 2050.
Recommendation Six: The Auxiliary Services Corporation (ASC) should seek to create a general sustainable foods procurement policy in order to allow local farmers and agricultural producers to have a clearer sense of what we are planning and what we are seeking in terms of foods and other products over the near to medium term. In addition to this more general procurement policy, ASC should, in consultation with members of the local foods community both on campus and throughout Cortland County, seek to create a five-‐year strategic plan for implementing the required emissions reductions including measurable annual targets and funding mechanisms for the proposed strategies. This plan should be publically available and should be updated on the same schedule as the five year funding plan detailed in recommendation five. In addition, ASC should provide annual progress reports on the implementation of these plans for use in the campus-‐wide annual report described in recommendation three. Consideration should be given to the creation of a standing local foods committee on campus to serve in an advisory role for the creation of these plans and as a means of simplifying information gathering from and contacts with area farmers and agricultural producers.
Implementing these six recommendations will strengthen the already substantial infrastructure on campus focused on improving the sustainability of the College and will help to create the necessary foundation upon which we can build the carbon free campus envisioned by this roadmap, by the Presidents’ Climate Commitment, by SUNY’s energy and sustainability policy, and by the Governor’s Executive Order.
-$4,000,000
-$2,000,000
$0
$2,000,000
$4,000,000
$6,000,000
$8,000,000
$10,000,000
2015-19 2020-24 2025-29 2030-34 2035-39 2040-44 2045-49
Five Year Investment Totals that will be
Required by the College

85
Appendix A – SUNY Energy and Sustainability Policy

86
State University of New York Energy and Sustainability Policy131 I. INTRODUCTION
Based on the recommendations of the University Strategic Energy Planning Task Force, this establishes the State University of New York’s Policy on Energy Conservation and Sustainability. The supply of oil and natural gas is dwindling, greatly increasing costs and making prices volatile. The environmental damage from air pollution and greenhouse gases is changing world climates and adversely affecting society. The State University of New York must take action now to reduce its environmental impact and assume a national leadership in the transformation to sustainability through its actions, teaching, research, and the analysis and enactment of good public policy.
II. MISSION/OBJECTIVE
SUNY will assume a national leadership role in energy sustainability, education, technology, economics, and public policy through the integration of practice, teaching, and research. SUNY will meet and exceed the requirements of Executive Orders 111 and 142.
III. GOALS
A. Conservation and Sustainability: 1. Reduce energy use to lowest level possible. By 2010 reduce energy use in buildings by 37% as
compared to FY 89-‐90 on a BTU/sq. ft. basis. (Campus specific goals are attachment A [not shown])
2. Cap green house gas emissions to current levels and reduce emissions of carbon dioxide by 20% by 2014.
3. Increase the use of renewable electricity (purchased or generated on-‐site) to 30% by 2014. 4. Increase the use of bio diesel to 10% of total usage by 2008. 5. Increase the use of bio heating oil to 10% of number 2 oil use by 2010. 6. Develop five new combined heat and power projects by 2010. 7. Design new buildings and rehab existing ones in accordance with Leadership in Energy and
Environmental Design (LEED) silver rating, higher standards are encouraged. 8. Procure energy and fuel at competitive prices, while managing price risk. 9. Continue to take a proactive role in rate cases before the New York State Public Service
Commission and the Federal Energy Regulatory Commission, to protect the University’s interests. B. Transformational Opportunities:
1. Advance SUNY’s educational mission in energy and the environment. a. Academic Programs -‐ Develop and expand energy related curriculum and cross-‐disciplinary
programs. b. General Education -‐ Develop curriculum within campus general education programs related to
energy and the environment. c. K-‐12 Teacher Education -‐ Support Teacher Education Programs to strengthen their offerings
in the energy-‐environment area. d. Work Force Training -‐ Develop academic programs at the technical level through Continuing
Education Programs to meet the needs of SUNY, energy service companies, regulators, and Local Delivery Companies.
e. Raising Awareness -‐ Utilize capabilities of the University to educate students, faculty, staff, local community and global community about the nexus between energy and the environment.
2. Expand energy related research to achieve national leadership in the development and use of renewable energy.
131 www.sunyppaa.org/Portals/2/Docs/EnergySustainabilityPolicy11-‐5-‐07.pdf (last viewed on 7/12/11)

87
3. Build strategic alliances with public and private sector partners by providing research and analysis to regulators, elected officials, private industry, and New York’s citizens.
C. Management and Planning: 1. Use SUNY’s size and individual campus expertise to the benefit of all campuses. Encourage and
facilitate cooperation regarding best practices, campus based initiatives, and externally funded projects
2. Procure energy and fuel at competitive prices while managing price risk in accordance with a prudent, clearly defined, and documented University Risk Management Policy that utilizes financially sound market based products.
3. Take a proactive role in rate cases before the New York State Public Service Commission and the Federal Energy Regulatory Commission to protect the University’s interests.
IV. EXECUTION
A. Energy Conservation and Sustainability plans and procedures will be based on attachment B Energy Conservation and Sustainability Implementation Plan [not shown]. Reporting on mile stones will be to SUNY Energy Office.
B. Transformational Opportunities planning and reporting will be developed on campuses and coordinated with the Office of the Provost.

88
Appendix B – The Presidents’ Climate Commitment
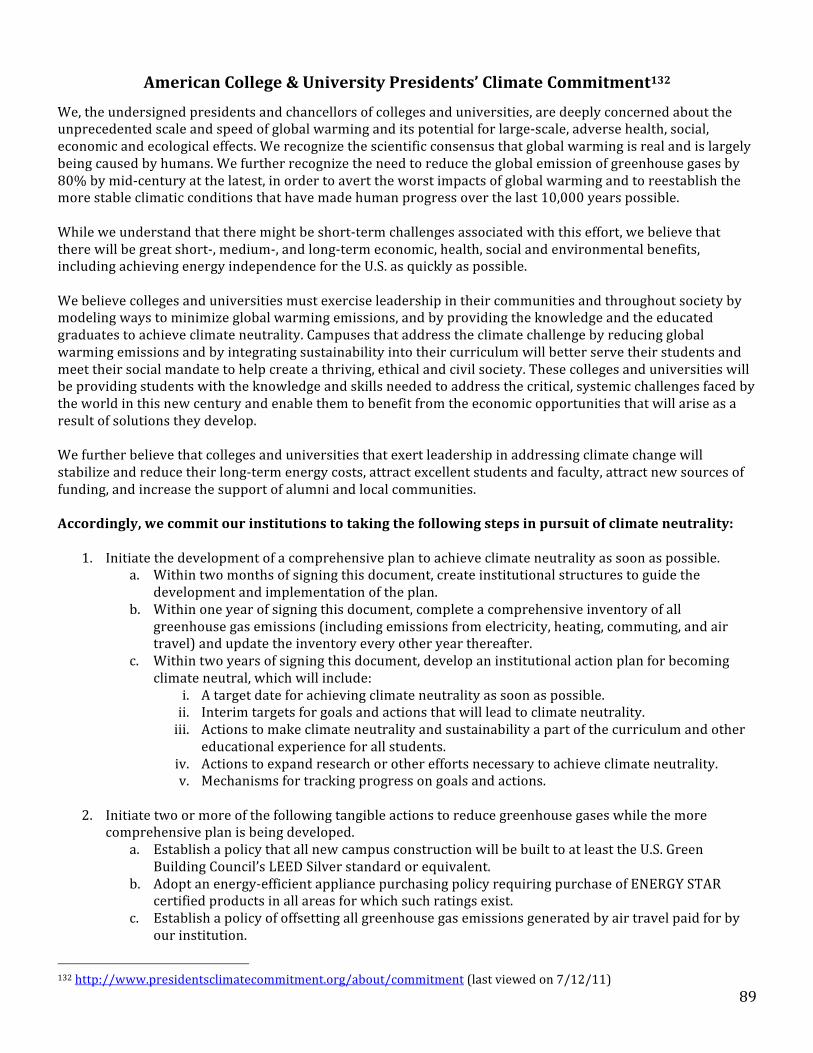
89
American College & University Presidents’ Climate Commitment132
We, the undersigned presidents and chancellors of colleges and universities, are deeply concerned about the unprecedented scale and speed of global warming and its potential for large-‐scale, adverse health, social, economic and ecological effects. We recognize the scientific consensus that global warming is real and is largely being caused by humans. We further recognize the need to reduce the global emission of greenhouse gases by 80% by mid-‐century at the latest, in order to avert the worst impacts of global warming and to reestablish the more stable climatic conditions that have made human progress over the last 10,000 years possible. While we understand that there might be short-‐term challenges associated with this effort, we believe that there will be great short-‐, medium-‐, and long-‐term economic, health, social and environmental benefits, including achieving energy independence for the U.S. as quickly as possible. We believe colleges and universities must exercise leadership in their communities and throughout society by modeling ways to minimize global warming emissions, and by providing the knowledge and the educated graduates to achieve climate neutrality. Campuses that address the climate challenge by reducing global warming emissions and by integrating sustainability into their curriculum will better serve their students and meet their social mandate to help create a thriving, ethical and civil society. These colleges and universities will be providing students with the knowledge and skills needed to address the critical, systemic challenges faced by the world in this new century and enable them to benefit from the economic opportunities that will arise as a result of solutions they develop. We further believe that colleges and universities that exert leadership in addressing climate change will stabilize and reduce their long-‐term energy costs, attract excellent students and faculty, attract new sources of funding, and increase the support of alumni and local communities. Accordingly, we commit our institutions to taking the following steps in pursuit of climate neutrality:
1. Initiate the development of a comprehensive plan to achieve climate neutrality as soon as possible. a. Within two months of signing this document, create institutional structures to guide the
development and implementation of the plan. b. Within one year of signing this document, complete a comprehensive inventory of all
greenhouse gas emissions (including emissions from electricity, heating, commuting, and air travel) and update the inventory every other year thereafter.
c. Within two years of signing this document, develop an institutional action plan for becoming climate neutral, which will include:
i. A target date for achieving climate neutrality as soon as possible. ii. Interim targets for goals and actions that will lead to climate neutrality. iii. Actions to make climate neutrality and sustainability a part of the curriculum and other
educational experience for all students. iv. Actions to expand research or other efforts necessary to achieve climate neutrality. v. Mechanisms for tracking progress on goals and actions.
2. Initiate two or more of the following tangible actions to reduce greenhouse gases while the more
comprehensive plan is being developed. a. Establish a policy that all new campus construction will be built to at least the U.S. Green
Building Council’s LEED Silver standard or equivalent. b. Adopt an energy-‐efficient appliance purchasing policy requiring purchase of ENERGY STAR
certified products in all areas for which such ratings exist. c. Establish a policy of offsetting all greenhouse gas emissions generated by air travel paid for by
our institution.
132 http://www.presidentsclimatecommitment.org/about/commitment (last viewed on 7/12/11)

90
d. Encourage use of and provide access to public transportation for all faculty, staff, students and visitors at our institution.
e. Within one year of signing this document, begin purchasing or producing at least 15% of our institution’s electricity consumption from renewable sources.
f. Establish a policy or a committee that supports climate and sustainability shareholder proposals at companies where our institution’s endowment is invested.
g. Participate in the Waste Minimization component of the national RecycleMania competition, and adopt 3 or more associated measures to reduce waste.
3. Make the action plan, inventory, and periodic progress reports publicly available by submitting them to
the ACUPCC Reporting System for posting and dissemination. In recognition of the need to build support for this effort among college and university administrations across America, we will encourage other presidents to join this effort and become signatories to this commitment. Signed, The Signatories of the American College & University Presidents Climate Commitment

91
Appendix C – Executive Order No. 24
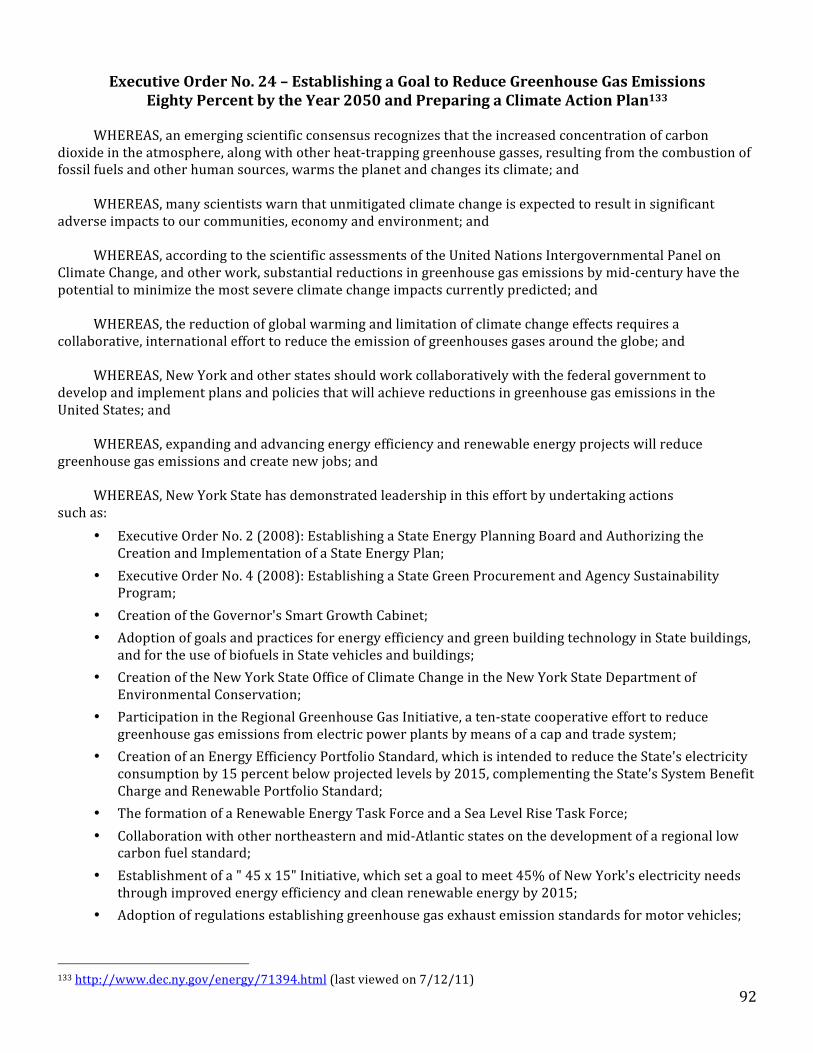
92
Executive Order No. 24 – Establishing a Goal to Reduce Greenhouse Gas Emissions Eighty Percent by the Year 2050 and Preparing a Climate Action Plan133
WHEREAS, an emerging scientific consensus recognizes that the increased concentration of carbon
dioxide in the atmosphere, along with other heat-‐trapping greenhouse gasses, resulting from the combustion of fossil fuels and other human sources, warms the planet and changes its climate; and
WHEREAS, many scientists warn that unmitigated climate change is expected to result in significant adverse impacts to our communities, economy and environment; and
WHEREAS, according to the scientific assessments of the United Nations Intergovernmental Panel on Climate Change, and other work, substantial reductions in greenhouse gas emissions by mid-‐century have the potential to minimize the most severe climate change impacts currently predicted; and
WHEREAS, the reduction of global warming and limitation of climate change effects requires a collaborative, international effort to reduce the emission of greenhouses gases around the globe; and
WHEREAS, New York and other states should work collaboratively with the federal government to develop and implement plans and policies that will achieve reductions in greenhouse gas emissions in the United States; and
WHEREAS, expanding and advancing energy efficiency and renewable energy projects will reduce greenhouse gas emissions and create new jobs; and
WHEREAS, New York State has demonstrated leadership in this effort by undertaking actions such as:
• Executive Order No. 2 (2008): Establishing a State Energy Planning Board and Authorizing the Creation and Implementation of a State Energy Plan;
• Executive Order No. 4 (2008): Establishing a State Green Procurement and Agency Sustainability Program;
• Creation of the Governor's Smart Growth Cabinet; • Adoption of goals and practices for energy efficiency and green building technology in State buildings,
and for the use of biofuels in State vehicles and buildings; • Creation of the New York State Office of Climate Change in the New York State Department of
Environmental Conservation; • Participation in the Regional Greenhouse Gas Initiative, a ten-‐state cooperative effort to reduce
greenhouse gas emissions from electric power plants by means of a cap and trade system; • Creation of an Energy Efficiency Portfolio Standard, which is intended to reduce the State's electricity
consumption by 15 percent below projected levels by 2015, complementing the State's System Benefit Charge and Renewable Portfolio Standard;
• The formation of a Renewable Energy Task Force and a Sea Level Rise Task Force; • Collaboration with other northeastern and mid-‐Atlantic states on the development of a regional low
carbon fuel standard; • Establishment of a " 45 x 15" Initiative, which set a goal to meet 45% of New York's electricity needs
through improved energy efficiency and clean renewable energy by 2015; • Adoption of regulations establishing greenhouse gas exhaust emission standards for motor vehicles;
133 http://www.dec.ny.gov/energy/71394.html (last viewed on 7/12/11)

93
• Enactment of legislation requiring new motor vehicles to bear labels disclosing information to consumers about vehicle greenhouse gas emissions;
• Enactment of legislation establishing "green" residential and State building programs; • Enactment of legislation expanding the State's "net metering" laws, allowing increased development of
renewable energy by electricity customers; • Enactment of Legislation expanding energy efficiency and clean energy initiatives of the New York
Power Authority to public entities; and • Investment of billions of dollars by the New York State Energy Research and Development Authority,
the New York Power Authority and the Long Island Power Authority in existing, expanded and new energy efficiency and renewable energy programs; and
WHEREAS, it is appropriate to build upon the important environmental benefits obtained through these
actions and to establish a State-‐wide goal for the reduction of greenhouse gasses, and to develop a plan that enables New York to participate fully in the national and international efforts to combat climate change.
NOW, THEREFORE, I, David A. Paterson, Governor of the State of New York, by virtue of the authority vested in me by the Constitution and laws of the State of New York, do hereby order as follows:
1. It shall be a goal of the State of New York to reduce current greenhouse gas emissions from all sources within the State eighty percent (80%) below levels emitted in the year nineteen hundred ninety (1990) by the year two-‐thousand fifty (2050).
2. There is hereby created a Climate Action Council ("Council") consisting of the Commissioners of Agriculture and Markets, Economic Development, Environmental Conservation, Housing and Community Renewal, and Transportation; the Chairs of the Public Service Commission, and Metropolitan Transportation Authority; the Presidents of the New York State Energy Research and Development Authority, Long Island Power Authority, New York Power Authority and Dormitory Authority of the State of New York; the Secretary of State; the Director of the Budget; the Director of State Operations; and the Counsel to the Governor. The Director of State Operations shall serve as the Chair of the Council.
3. The Council shall prepare a draft Climate Action Plan on or before September 30, 2010. The Council shall hold regional public comment hearings on the draft Plan, and shall allow at least 60 days for the submission of public comment. Thereafter, the Council shall prepare a final Climate Action Plan which shall be reviewed and, if warranted, adjusted annually by the Council.
4. In aspiring to meet the greenhouse gas emission reduction goal, the Council, in preparing the Climate Action Plan, shall: a. inventory greenhouse gas emissions within the State, including the relative contribution of each
type of emission source; b. identify and assess short-‐term and long-‐term actions to reduce greenhouse gas emissions and
adapt to climate change across all economic sectors, including industry, transportation, agriculture, building construction and energy production;
c. identify and analyze the anticipated reductions, and the economic implications thereof, as a result of each action;
d. identify the anticipated life-‐cycle implications, consequences, benefits and costs of implementing each action, including implications, consequences, benefits and costs to the State, local governments, business and residents from implementation of each option and action;
e. identify whether such actions support New York's goals for clean energy in the new economy, including specific short-‐term and long-‐term economic development opportunities and disadvantages related to greenhouse gas emission reductions and the development and deployment of new and emerging technologies and energy sources;
94
f. coordinate its activities with the State energy planning process of the State Energy Planning Board;
g. identify existing legal, regulatory and policy constraints to reducing greenhouse gas emissions, assessing the impacts of climate change, and adapting to climate change, and recommend ways to address any such constraints;
h. establish estimated timelines for considering and implementing actions; and i. undertake such actions, and compile such additional material, as deemed appropriate by the
Council in carrying out its responsibilities under this Order 5. Members of the Council may designate an executive staff member to represent them and participate
on the Council on their behalf, subject to the approval of the Chair. A majority of the members of the Council shall constitute a quorum, and all actions and recommendations of the Council shall require approval of a majority of the total members or their representatives.
6. The entities represented on the Council are authorized to provide the primary staff and other resources that are necessary for the Council to comply with this Order. In addition, every other agency, department, office, division and public authority of this State shall cooperate with the Council and furnish such information and assistance as the Council determines is reasonably necessary for it to comply with this Order.
7. The Council may convene advisory panels to assist or advise it in areas requiring special expertise or knowledge.
8. The Climate Action Plan is not intended to be static, but rather a dynamic and continually evolving strategy to assess and achieve the goal of sustained reductions of greenhouse gas emissions.
G I V E N under my hand and the Privy Seal of the State in the City of Albany this sixth day of August in the year two thousand nine. David A. Paterson Governor Lawrence Schwartz Secretary to the Governor

95
Appendix D – The Carbon Intensity Surveys

96
Continued on Back
Carbon Intensity Survey
1. Year: 2. Department / Division: __________________________________________________ 3. In what city do you live: _________________________________________________ 4. On a typical day, how do you get to campus (walk, drive, bike, etc.)? _______________ 5. If you drive, how many days in an average week do you commute to campus? _______ 6. If you drive, how far do you drive on average per day (in miles)? _______________ 7. What type of vehicle do you drive? (Please give the year and circle the type) Year_______________ Type of Vehicle: Car / Other (Truck / SUV / Jeep) 8. Do you carpool? [ ] No [ ] Yes If yes, how many ride in the vehicle___________ 9. How many times do you ride the Cortland bus in an average day? _________________ 10. In the past year have you supervised student teaching or field experiences?
[ ] No [ ] Yes
If yes, how far do you drive there and back in a typical week? _________________
Do you ever carpool to observations? [ ] No [ ] Yes 11. Do you use the bikes from the “Community Bike Project”? [ ] No [ ] Yes
If so, which color? (check all that apply) [ ] Yellow [ ] Red [ ] Green
and how often per semester? ______________ 12. Do you have a campus meal plan? [ ] No [ ] Yes
[ ] Full-time Faculty (Tenure Track)
[ ] Full-time Faculty (Non-tenure Track)
[ ] Part-time Faculty
[ ] Administration [ ] Full-time Staff [ ] Part-time Staff
This anonymous and voluntary survey is designed to help determine the greenhouse gas emissions associated with the travel and food consumption patterns of the students, faculty and staff at SUNY Cortland. This effort is being undertaken as part of the President’s Climate Commitment signed by President Bitterbaum.

97
Please return this survey either to (1) the person who handed them out, (2) the office of Professor Brice Smith (Bowers 143), or (3) the box labeled “Carbon Intensity Surveys” in the Physics Department Office. Thank you for your participation in this effort.
13. What is your estimate for the percentage of the total amount of food you consume in
a typical week that comes from all off campus sources? _______________ 14. How many meals provided by on campus food services (i.e. not food you brought
from home, etc.) do you eat in an average day? _______________ 15. What is your estimate for the number of meals you eat in a typical week that do NOT
contain meat? _________
Would that percentage be likely to increase if the University provided more vegetarian or vegan options? [ ] No [ ] Yes 16. What percentage of your recyclables do you separate from your trash? ___________ 17. What is the percentage of times that you use a reusable water bottle compared to
buying plastic water bottles? __________
Would that percentage be likely to increase if the University provided larger discounts than the current 10% on beverages for using a reusable bottle? [ ] No [ ] Yes 18. As part of a campus wide effort, would you be willing to adjust your eating habits to include more local and organic foods in order to help create a campus with a less destructive impact on the environment?
Not willing [ ] 1 [ ] 2 [ ] 3 [ ] 4 [ ] 5 Very
willing 19. As part of a campus wide effort, including improved public transportation and support for carpooling, would you be willing to adjust your travel habits in order to help create a campus with a less destructive impact on the environment?
Not willing [ ] 1 [ ] 2 [ ] 3 [ ] 4 [ ] 5 Very
willing 20. Do you have any comments or suggestions about how SUNY Cortland could reduce its impact on global warming and other environmental problems? ____________________________________________________________________________ ____________________________________________________________________________ ____________________________________________________________________________ ____________________________________________________________________________ ____________________________________________________________________________

98
Continued on Back
Carbon Intensity Survey
1. Year: 2. Major: _______________________ or Department: _______________________ 3. Where do you live: [ ] On Campus [ ] Off campus (If so, in what city? ___________ ) 4. On a typical day, how do you get to campus (walk, drive, bike, etc.)? _______________ 5. If you drive, how many days in an average week do you commute to campus? _______ 6. If you drive to campus, how far do you drive on average (in miles)? ________________ 7. What type of vehicle do you drive? (Please give the year and circle the type) Year_______________ Type of Vehicle: Car / Other (Truck / SUV / Jeep) 8. Do you carpool? [ ] No [ ] Yes If yes, how many ride in the vehicle___________ 9. How many times do you ride the Cortland bus in an average day? _________________ 10. How many times a semester (including holidays) do you travel home? ____________
How far do you travel? _________ How do you get there (car, bus, plane)? _________ 11. How many times a semester (including holidays) do you travel outside of Cortland
(excluding trips home & trips for Cortland sports travel)? _________________
How far do you travel? _________ How do you get there (car, bus, train)? _________ 12. In the past two years have you done student teaching or practicum? [ ] No [ ] Yes
If so, how many times a week did you drive there? ________________________
How far did you drive? _____________ Did you carpool? [ ] No [ ] Yes 13. Do you use the bikes from the “Community Bike Project”? [ ] No [ ] Yes
If so, which color? (check all that apply) [ ] Yellow [ ] Red [ ] Green
and how often per semester? ________________
[ ] Freshman [ ] Sophomore [ ] Junior [ ] Senior [ ] Graduate [ ] Faculty [ ] Staff [ ] Administration
The following voluntary survey is designed to help determine the greenhouse gas emissions associated with the travel and food consumption patterns of the students, faculty and staff at SUNY Cortland. This effort is being undertaken as part of the President’s Climate Commitment signed by President Bitterbaum.

99
Please return this survey either to (1) the person who handed them out, (2) the office of Professor Brice Smith (Bowers 126), or (3) the box labeled “Carbon Intensity Surveys” outside Bowers 141. Thank you for your participation in this effort.
14. Do you have a campus meal plan? [ ] No [ ] Yes 15. What is your estimate for the percentage of the total amount of food you consume in
a typical week that comes from all off campus sources? _______________ 16. How many meals provided by on campus food services (i.e. not food you brought from home, etc.) do you eat in an average day? _______________ 17. What is your estimate for the number of meals you eat in a typical week that do NOT contain meat? _________
Would that percentage be likely to increase if the University provided more vegetarian or vegan options? [ ] No [ ] Yes 18. How many times in an average week do you have food delivered to your home or living space? _______________ 19. What percentage of your recyclables do you estimate that you separate from your trash? ___________ 20. What is the percentage of times that you use a reusable water bottle compared to buying plastic water bottles? __________
Would that percentage be likely to increase if the University provided larger discounts than the current 10% on beverages for using a reusable bottle? [ ] No [ ] Yes 21. As part of a campus wide effort, would you be willing to adjust your eating habits to include more local and organic foods in order to help create a campus with a less destructive impact on the environment?
Not willing [ ] 1 [ ] 2 [ ] 3 [ ] 4 [ ] 5 Very
willing 22. As part of a campus wide effort, including improved public transportation and support for carpooling, would you be willing to adjust your travel habits in order to help create a campus with a less destructive impact on the environment?
Not willing [ ] 1 [ ] 2 [ ] 3 [ ] 4 [ ] 5 Very
willing 23. Do you have any comments or suggestions about how SUNY Cortland could reduce its impact on global warming and other environmental problems? ____________________________________________________________________________ ____________________________________________________________________________ ____________________________________________________________________________

100
Appendix E – Summary of Key Assumptions used in the Wedge Models

101
Section E.1 -‐ Heating
Baseline growth rate for heating without conservation efforts for academic and residential buildings on upper and lower campus
0.1 percent per year
Baseline growth rate for hot-‐water use without conservation efforts for academic and residential buildings on upper and lower campus
0.1 percent per year
Rate of decrease in heating and hot-‐water use for academic and residential buildings resulting from conservation efforts and efficiency improvements
1.1 percent (equivalent to a reduction of just over 30 percent between 2015 and 2050)
-‐-‐-‐-‐-‐-‐-‐-‐-‐-‐-‐-‐-‐-‐-‐-‐-‐-‐-‐-‐-‐-‐-‐-‐-‐-‐-‐-‐-‐-‐-‐-‐-‐-‐-‐-‐-‐-‐-‐-‐-‐-‐-‐-‐-‐-‐-‐-‐-‐-‐-‐-‐-‐-‐-‐-‐-‐-‐-‐-‐-‐-‐-‐-‐-‐-‐-‐-‐-‐-‐-‐-‐-‐-‐-‐-‐-‐-‐-‐-‐-‐-‐-‐-‐-‐-‐-‐-‐-‐-‐-‐-‐-‐-‐-‐-‐-‐-‐-‐-‐-‐-‐-‐-‐-‐-‐-‐-‐-‐-‐-‐-‐-‐-‐-‐-‐-‐-‐-‐-‐-‐-‐-‐-‐-‐-‐-‐-‐-‐-‐-‐-‐-‐-‐-‐-‐-‐-‐-‐-‐-‐ Additional programmatic square footage and heating demand from Moffett renovation in 2016
8,000 square feet resulting in an annual increase of 530 Dth
Reduction in square footage and heating demand from removal of Winchell Hall in 2027
28,640 square feet resulting in an annual decrease of 1,680 Dth
-‐-‐-‐-‐-‐-‐-‐-‐-‐-‐-‐-‐-‐-‐-‐-‐-‐-‐-‐-‐-‐-‐-‐-‐-‐-‐-‐-‐-‐-‐-‐-‐-‐-‐-‐-‐-‐-‐-‐-‐-‐-‐-‐-‐-‐-‐-‐-‐-‐-‐-‐-‐-‐-‐-‐-‐-‐-‐-‐-‐-‐-‐-‐-‐-‐-‐-‐-‐-‐-‐-‐-‐-‐-‐-‐-‐-‐-‐-‐-‐-‐-‐-‐-‐-‐-‐-‐-‐-‐-‐-‐-‐-‐-‐-‐-‐-‐-‐-‐-‐-‐-‐-‐-‐-‐-‐-‐-‐-‐-‐-‐-‐-‐-‐-‐-‐-‐-‐-‐-‐-‐-‐-‐-‐-‐-‐-‐-‐-‐-‐-‐-‐-‐-‐-‐-‐-‐-‐-‐-‐-‐ Percent of heating and hot-‐water demand supplied by ground source heat pumps in 2050
20 percent (upper campus) 45 percent (lower campus)
Coefficient of performance (COP) for ground source heat pumps 3.5 (in 2015) 4.5 (in 2050)
Percent of hot-‐water supplied by solar thermal in 2050 15 percent (upper campus) 25 percent (lower campus)
-‐-‐-‐-‐-‐-‐-‐-‐-‐-‐-‐-‐-‐-‐-‐-‐-‐-‐-‐-‐-‐-‐-‐-‐-‐-‐-‐-‐-‐-‐-‐-‐-‐-‐-‐-‐-‐-‐-‐-‐-‐-‐-‐-‐-‐-‐-‐-‐-‐-‐-‐-‐-‐-‐-‐-‐-‐-‐-‐-‐-‐-‐-‐-‐-‐-‐-‐-‐-‐-‐-‐-‐-‐-‐-‐-‐-‐-‐-‐-‐-‐-‐-‐-‐-‐-‐-‐-‐-‐-‐-‐-‐-‐-‐-‐-‐-‐-‐-‐-‐-‐-‐-‐-‐-‐-‐-‐-‐-‐-‐-‐-‐-‐-‐-‐-‐-‐-‐-‐-‐-‐-‐-‐-‐-‐-‐-‐-‐-‐-‐-‐-‐-‐-‐-‐-‐-‐-‐-‐-‐-‐ Cost of conventional heating fuel for campus $10.2 per Dth in 2015. Increases
consistent with EIA projections to $13.3 per Dth in 2050.
Cost of biomass fuel for heating $9.1 per Dth in 2015 rising to $18.2 per Dth in 2050 due to increased demand and competition for arable land with local foods production.
-‐-‐-‐-‐-‐-‐-‐-‐-‐-‐-‐-‐-‐-‐-‐-‐-‐-‐-‐-‐-‐-‐-‐-‐-‐-‐-‐-‐-‐-‐-‐-‐-‐-‐-‐-‐-‐-‐-‐-‐-‐-‐-‐-‐-‐-‐-‐-‐-‐-‐-‐-‐-‐-‐-‐-‐-‐-‐-‐-‐-‐-‐-‐-‐-‐-‐-‐-‐-‐-‐-‐-‐-‐-‐-‐-‐-‐-‐-‐-‐-‐-‐-‐-‐-‐-‐-‐-‐-‐-‐-‐-‐-‐-‐-‐-‐-‐-‐-‐-‐-‐-‐-‐-‐-‐-‐-‐-‐-‐-‐-‐-‐-‐-‐-‐-‐-‐-‐-‐-‐-‐-‐-‐-‐-‐-‐-‐-‐-‐-‐-‐-‐-‐-‐-‐-‐-‐-‐-‐-‐-‐ Capital cost of ground source heat pumps $204 per Dth of annual production
in 2015 decreasing 10 percent by 2050
Capital cost of biomass boilers $250 per Dth of annual production in 2015 decreasing 50 percent by 2050
Capital cost of solar thermal collectors $610 per Dth of annual production in 2015 decreasing 30 percent by 2050

102
Capital cost of conservation efforts/efficiency improvements $122 per annual Dth saved in 2015 (equivalent to a 12 year payback) rising to $265 per Dth in 2050 (equivalent to a 20 year payback)
Life-‐time of efficiency improvement projects 20 years
-‐-‐-‐-‐-‐-‐-‐-‐-‐-‐-‐-‐-‐-‐-‐-‐-‐-‐-‐-‐-‐-‐-‐-‐-‐-‐-‐-‐-‐-‐-‐-‐-‐-‐-‐-‐-‐-‐-‐-‐-‐-‐-‐-‐-‐-‐-‐-‐-‐-‐-‐-‐-‐-‐-‐-‐-‐-‐-‐-‐-‐-‐-‐-‐-‐-‐-‐-‐-‐-‐-‐-‐-‐-‐-‐-‐-‐-‐-‐-‐-‐-‐-‐-‐-‐-‐-‐-‐-‐-‐-‐-‐-‐-‐-‐-‐-‐-‐-‐-‐-‐-‐-‐-‐-‐-‐-‐-‐-‐-‐-‐-‐-‐-‐-‐-‐-‐-‐-‐-‐-‐-‐-‐-‐-‐-‐-‐-‐-‐-‐-‐-‐-‐-‐-‐-‐-‐-‐-‐-‐-‐ Life-‐cycle greenhouse gas emissions from biomass production 17.0 kilograms of CO2-‐equivalent
per Dth
-‐-‐-‐-‐-‐-‐-‐-‐-‐-‐-‐-‐-‐-‐-‐-‐-‐-‐-‐-‐-‐-‐-‐-‐-‐-‐-‐-‐-‐-‐-‐-‐-‐-‐-‐-‐-‐-‐-‐-‐-‐-‐-‐-‐-‐-‐-‐-‐-‐-‐-‐-‐-‐-‐-‐-‐-‐-‐-‐-‐-‐-‐-‐-‐-‐-‐-‐-‐-‐-‐-‐-‐-‐-‐-‐-‐-‐-‐-‐-‐-‐-‐-‐-‐-‐-‐-‐-‐-‐-‐-‐-‐-‐-‐-‐-‐-‐-‐-‐-‐-‐-‐-‐-‐-‐-‐-‐-‐-‐-‐-‐-‐-‐-‐-‐-‐-‐-‐-‐-‐-‐-‐-‐-‐-‐-‐-‐-‐-‐-‐-‐-‐-‐-‐-‐-‐-‐-‐-‐-‐-‐
Section E.2 -‐ Electricity
Baseline growth rate for electric demand for lighting in the absence of conservation efforts
0.0 percent per year
Rate of decrease in electric demand for lighting resulting from conservation efforts and efficiency improvements
1.4 percent (equivalent to a reduction of just over 40 percent between 2015 and 2050)
Baseline growth rate for electric demand for the plug loads (principally things like computers and other electronics) in the absence of conservation efforts
0.8 percent per year
Rate of decrease in electric demand for plug loads resulting from conservation efforts and efficiency improvements
1.4 percent (equivalent to a reduction of just over 40 percent between 2015 and 2050)
Baseline growth rate for electric demand for motors and HVAC equipment in the absence of conservation efforts
1.3 percent per year
Rate of decrease in electric demand for motors and HVAC equipment resulting from conservation efforts and efficiency improvements
1.4 percent (equivalent to a reduction of just over 40 percent between 2015 and 2050)
-‐-‐-‐-‐-‐-‐-‐-‐-‐-‐-‐-‐-‐-‐-‐-‐-‐-‐-‐-‐-‐-‐-‐-‐-‐-‐-‐-‐-‐-‐-‐-‐-‐-‐-‐-‐-‐-‐-‐-‐-‐-‐-‐-‐-‐-‐-‐-‐-‐-‐-‐-‐-‐-‐-‐-‐-‐-‐-‐-‐-‐-‐-‐-‐-‐-‐-‐-‐-‐-‐-‐-‐-‐-‐-‐-‐-‐-‐-‐-‐-‐-‐-‐-‐-‐-‐-‐-‐-‐-‐-‐-‐-‐-‐-‐-‐-‐-‐-‐-‐-‐-‐-‐-‐-‐-‐-‐-‐-‐-‐-‐-‐-‐-‐-‐-‐-‐-‐-‐-‐-‐-‐-‐-‐-‐-‐-‐-‐-‐-‐-‐-‐-‐-‐-‐-‐-‐-‐-‐-‐-‐ Increase in electricity demand due to expanded use of ground source heat pumps
0 kWh in 2015 rising to 12.0 million kWh in 2050 (equivalent to a 50 percent increase over usage in 2015)
Increase in electricity demand due to expanded use of electric vehicles on campus
100 kWh in 2015 rising to 96,200 kWh in 2050 (equivalent to a 0.4 percent increase over usage in 2015)
-‐-‐-‐-‐-‐-‐-‐-‐-‐-‐-‐-‐-‐-‐-‐-‐-‐-‐-‐-‐-‐-‐-‐-‐-‐-‐-‐-‐-‐-‐-‐-‐-‐-‐-‐-‐-‐-‐-‐-‐-‐-‐-‐-‐-‐-‐-‐-‐-‐-‐-‐-‐-‐-‐-‐-‐-‐-‐-‐-‐-‐-‐-‐-‐-‐-‐-‐-‐-‐-‐-‐-‐-‐-‐-‐-‐-‐-‐-‐-‐-‐-‐-‐-‐-‐-‐-‐-‐-‐-‐-‐-‐-‐-‐-‐-‐-‐-‐-‐-‐-‐-‐-‐-‐-‐-‐-‐-‐-‐-‐-‐-‐-‐-‐-‐-‐-‐-‐-‐-‐-‐-‐-‐-‐-‐-‐-‐-‐-‐-‐-‐-‐-‐-‐-‐-‐-‐-‐-‐-‐-‐ Additional programmatic square footage and electricity consumption from Moffett renovation in 2016
8,000 square feet resulting in an annual increase of 71,700 kWh

103
Reduction in square footage and electricity consumption from removal of Winchell Hall in 2027
28,640 square feet resulting in an annual decrease of 245,300 kWh
-‐-‐-‐-‐-‐-‐-‐-‐-‐-‐-‐-‐-‐-‐-‐-‐-‐-‐-‐-‐-‐-‐-‐-‐-‐-‐-‐-‐-‐-‐-‐-‐-‐-‐-‐-‐-‐-‐-‐-‐-‐-‐-‐-‐-‐-‐-‐-‐-‐-‐-‐-‐-‐-‐-‐-‐-‐-‐-‐-‐-‐-‐-‐-‐-‐-‐-‐-‐-‐-‐-‐-‐-‐-‐-‐-‐-‐-‐-‐-‐-‐-‐-‐-‐-‐-‐-‐-‐-‐-‐-‐-‐-‐-‐-‐-‐-‐-‐-‐-‐-‐-‐-‐-‐-‐-‐-‐-‐-‐-‐-‐-‐-‐-‐-‐-‐-‐-‐-‐-‐-‐-‐-‐-‐-‐-‐-‐-‐-‐-‐-‐-‐-‐-‐-‐-‐-‐-‐-‐-‐-‐ Percent of renewable electricity from solar photovoltaics 10 percent (due to space
constraints and competition for roofs with solar thermal collectors for hot water)
Percent of renewable electricity from commercial wind farms 60 percent (due to the high wind potential of New York in general and Cortland County in particular)
Percent of renewable electricity from other renewables like hydroelectric and biomass
30 percent (Note: renewables already accounts for nearly 10 percent of electricity on the grid)
-‐-‐-‐-‐-‐-‐-‐-‐-‐-‐-‐-‐-‐-‐-‐-‐-‐-‐-‐-‐-‐-‐-‐-‐-‐-‐-‐-‐-‐-‐-‐-‐-‐-‐-‐-‐-‐-‐-‐-‐-‐-‐-‐-‐-‐-‐-‐-‐-‐-‐-‐-‐-‐-‐-‐-‐-‐-‐-‐-‐-‐-‐-‐-‐-‐-‐-‐-‐-‐-‐-‐-‐-‐-‐-‐-‐-‐-‐-‐-‐-‐-‐-‐-‐-‐-‐-‐-‐-‐-‐-‐-‐-‐-‐-‐-‐-‐-‐-‐-‐-‐-‐-‐-‐-‐-‐-‐-‐-‐-‐-‐-‐-‐-‐-‐-‐-‐-‐-‐-‐-‐-‐-‐-‐-‐-‐-‐-‐-‐-‐-‐-‐-‐-‐-‐-‐-‐-‐-‐-‐-‐ Cost of electricity purchased from the grid 9.1 cents per kWh
Escalation in future cost of electricity from the grid 1.28 percent per year (equivalent to an increase of two percent per year for the first 10 years and then one percent after that)
Life-‐cycle cost of electricity from solar photovoltaics 17.5 cents per kWh ($6.75 per watt plus $0.25 per watt for replacement inverter)
Reduction in future costs of electricity from solar photovoltaics 2.6 percent per year (7 cents per kWh in 2050)
Life-‐cycle cost of electricity from commercial wind farms 10.9 cents per kWh (1.8 cent per kWh premium)
Reduction in future costs of electricity from commercial wind farms 1.2 percent per year (7.1 cents per kWh in 2050)
Life-‐cycle cost of electricity from other renewables such as hydroelectric and biomass
15.9 cents per kWh (6.8 cent per kWh premium)
Reduction in future costs of electricity from other renewables such as hydroelectric and biomass
1.1 percent per year (11 cents per kWh in 2050)
-‐-‐-‐-‐-‐-‐-‐-‐-‐-‐-‐-‐-‐-‐-‐-‐-‐-‐-‐-‐-‐-‐-‐-‐-‐-‐-‐-‐-‐-‐-‐-‐-‐-‐-‐-‐-‐-‐-‐-‐-‐-‐-‐-‐-‐-‐-‐-‐-‐-‐-‐-‐-‐-‐-‐-‐-‐-‐-‐-‐-‐-‐-‐-‐-‐-‐-‐-‐-‐-‐-‐-‐-‐-‐-‐-‐-‐-‐-‐-‐-‐-‐-‐-‐-‐-‐-‐-‐-‐-‐-‐-‐-‐-‐-‐-‐-‐-‐-‐-‐-‐-‐-‐-‐-‐-‐-‐-‐-‐-‐-‐-‐-‐-‐-‐-‐-‐-‐-‐-‐-‐-‐-‐-‐-‐-‐-‐-‐-‐-‐-‐-‐-‐-‐-‐-‐-‐-‐-‐-‐-‐ Capital cost of conservation efforts/efficiency improvements for lighting
54.6 cents per first year kWh saved in 2015 (equivalent to a 6 year payback versus conventional electricity) rising to 82.5 cents per first year kWh saved (equivalent to a 10 year payback versus renewable electricity in 2050)
Life-‐time of efficiency improvement projects for lighting 10

104
Capital cost of conservation efforts/efficiency improvements for plug loads
27.3 cents per first year kWh saved in 2015 (equivalent to a 3 year payback versus conventional electricity) rising to 41.2 cents per first year kWh saved (equivalent to a 5 year payback versus renewable electricity in 2050)
Life-‐time of efficiency improvement projects for plug loads 5
Capital cost of conservation efforts/efficiency improvements for motors and HVAC equipment
109 cents per first year kWh saved in 2015 (equivalent to a 12 year payback versus conventional electricity) rising to 165 cents per first year kWh saved (equivalent to a 20 year payback versus renewable electricity in 2050)
Life-‐time of efficiency improvement projects for motors and HVAC equipment
20
-‐-‐-‐-‐-‐-‐-‐-‐-‐-‐-‐-‐-‐-‐-‐-‐-‐-‐-‐-‐-‐-‐-‐-‐-‐-‐-‐-‐-‐-‐-‐-‐-‐-‐-‐-‐-‐-‐-‐-‐-‐-‐-‐-‐-‐-‐-‐-‐-‐-‐-‐-‐-‐-‐-‐-‐-‐-‐-‐-‐-‐-‐-‐-‐-‐-‐-‐-‐-‐-‐-‐-‐-‐-‐-‐-‐-‐-‐-‐-‐-‐-‐-‐-‐-‐-‐-‐-‐-‐-‐-‐-‐-‐-‐-‐-‐-‐-‐-‐-‐-‐-‐-‐-‐-‐-‐-‐-‐-‐-‐-‐-‐-‐-‐-‐-‐-‐-‐-‐-‐-‐-‐-‐-‐-‐-‐-‐-‐-‐-‐-‐-‐-‐-‐-‐-‐-‐-‐-‐-‐-‐ Greenhouse gas emissions from electricity purchased from the grid 0.412 kg CO2 per kWh in 2015
falling linearly to 0.247 in 2050 due to increased efficiencies and more widespread use of renewables and other low-‐carbon sources of electricity by the utilities
Life-‐cycle greenhouse gas emissions from solar photovoltaics 0.031 kg CO2 per kWh (7.5 percent of current emissions)
Life-‐cycle greenhouse gas emissions from commercial wind farms 0.021 kg CO2 per kWh (5 percent of current emissions)
Life-‐cycle emissions from other renewables such as hydroelectric and biomass
0.052 kg CO2 per kWh (12.5 percent of current emissions)
-‐-‐-‐-‐-‐-‐-‐-‐-‐-‐-‐-‐-‐-‐-‐-‐-‐-‐-‐-‐-‐-‐-‐-‐-‐-‐-‐-‐-‐-‐-‐-‐-‐-‐-‐-‐-‐-‐-‐-‐-‐-‐-‐-‐-‐-‐-‐-‐-‐-‐-‐-‐-‐-‐-‐-‐-‐-‐-‐-‐-‐-‐-‐-‐-‐-‐-‐-‐-‐-‐-‐-‐-‐-‐-‐-‐-‐-‐-‐-‐-‐-‐-‐-‐-‐-‐-‐-‐-‐-‐-‐-‐-‐-‐-‐-‐-‐-‐-‐-‐-‐-‐-‐-‐-‐-‐-‐-‐-‐-‐-‐-‐-‐-‐-‐-‐-‐-‐-‐-‐-‐-‐-‐-‐-‐-‐-‐-‐-‐-‐-‐-‐-‐-‐-‐-‐-‐-‐-‐-‐-‐
Section E.3 -‐ Transportation
Population of campus in 2015 Full-‐time faculty = 272 Part-‐time faculty = 301 Administration = 28 Staff = 660 First-‐year = 2,124 Sophomore = 1,641 Junior = 1,128 Senior = 1,096 Graduate = 949

105
Rate of population growth for faculty Full-‐time faculty increase by 0.92 percent per year to a total of 375 in 2050 (60 percent of total faculty by mid-‐century) Part-‐time faculty decrease by 0.53 percent per year to a total of 250 in 2050 (40 percent of total faculty by mid-‐century)
Rate of population growth for staff and administrators Staff increase by 0.33 percent per year to a total of 742 in 2050 Administrators increase by 0.25 percent per year to a total of 31 in 2050
Rate of population growth for undergraduates First-‐years remain constant at 2,124 through 2050 Sophomores remain constant at 1,641 through 2050 Juniors increase by 0.14 percent per year to a total of 1,184 in 2050 due to increased retention efforts Seniors increase by 0.14 percent per year to a total of 1,151 in 2050 due to increased retention efforts
Rate of population growth for graduate students Graduate students increase by 0.40 percent per year to a total of 1,091 in 2050 due to new graduate programs and efforts to increase enrollment in existing programs
-‐-‐-‐-‐-‐-‐-‐-‐-‐-‐-‐-‐-‐-‐-‐-‐-‐-‐-‐-‐-‐-‐-‐-‐-‐-‐-‐-‐-‐-‐-‐-‐-‐-‐-‐-‐-‐-‐-‐-‐-‐-‐-‐-‐-‐-‐-‐-‐-‐-‐-‐-‐-‐-‐-‐-‐-‐-‐-‐-‐-‐-‐-‐-‐-‐-‐-‐-‐-‐-‐-‐-‐-‐-‐-‐-‐-‐-‐-‐-‐-‐-‐-‐-‐-‐-‐-‐-‐-‐-‐-‐-‐-‐-‐-‐-‐-‐-‐-‐-‐-‐-‐-‐-‐-‐-‐-‐-‐-‐-‐-‐-‐-‐-‐-‐-‐-‐-‐-‐-‐-‐-‐-‐-‐-‐-‐-‐-‐-‐-‐-‐-‐-‐-‐-‐-‐-‐-‐-‐-‐-‐ Reduction in commuting distance for faculty due to increased carpooling, increased used of public-‐transit, etc.
Full-‐time faculty per capita commuting distance decreases by 15 percent by 2050 Part-‐time faculty per capita commuting distance decreases by 10 percent by 2050
Reduction in commuting distance for staff and administrators due to increased carpooling, increased used of public-‐transit, etc.
Staff per capita commuting distance decreases by 20 percent by 2050 Administrator per capita commuting distance decreases by 20 percent by 2050

106
Reduction in commuting distance for undergraduates due to increased carpooling, increased used of public-‐transit, etc.
First-‐year per capita commuting distance decreases by 5 percent by 2050 Sophomore per capita commuting distance decreases by 10 percent by 2050 Junior per capita commuting distance decreases by 60 percent by 2050 (equivalent to a net of just 10 percent of juniors driving to campus) Senior per capita commuting distance decreases by 50 percent by 2050 (equivalent to a net of just 20 percent of seniors driving to campus)
Reduction in commuting distance for graduate students due to increased carpooling, increased used of public-‐transit, etc.
Graduate student commuting distance decreases by 10 percent by 2050
-‐-‐-‐-‐-‐-‐-‐-‐-‐-‐-‐-‐-‐-‐-‐-‐-‐-‐-‐-‐-‐-‐-‐-‐-‐-‐-‐-‐-‐-‐-‐-‐-‐-‐-‐-‐-‐-‐-‐-‐-‐-‐-‐-‐-‐-‐-‐-‐-‐-‐-‐-‐-‐-‐-‐-‐-‐-‐-‐-‐-‐-‐-‐-‐-‐-‐-‐-‐-‐-‐-‐-‐-‐-‐-‐-‐-‐-‐-‐-‐-‐-‐-‐-‐-‐-‐-‐-‐-‐-‐-‐-‐-‐-‐-‐-‐-‐-‐-‐-‐-‐-‐-‐-‐-‐-‐-‐-‐-‐-‐-‐-‐-‐-‐-‐-‐-‐-‐-‐-‐-‐-‐-‐-‐-‐-‐-‐-‐-‐-‐-‐-‐-‐-‐-‐-‐-‐-‐-‐-‐-‐ Percent of commuting done by faculty with electric cars in 2050 75 percent of commuting by full-‐
time faculty 65 percent of commuting by part-‐time faculty
Percent of commuting done by staff and administrators with electric cars in 2050
65 percent of commuting by staff 75 percent of commuting by administrators
Percent of commuting done by undergraduates with electric cars in 2050
75 percent of commuting for all undergraduate students
Percent of commuting done by graduate students with electric cars in 2050
75 percent of commuting for all graduate students
-‐-‐-‐-‐-‐-‐-‐-‐-‐-‐-‐-‐-‐-‐-‐-‐-‐-‐-‐-‐-‐-‐-‐-‐-‐-‐-‐-‐-‐-‐-‐-‐-‐-‐-‐-‐-‐-‐-‐-‐-‐-‐-‐-‐-‐-‐-‐-‐-‐-‐-‐-‐-‐-‐-‐-‐-‐-‐-‐-‐-‐-‐-‐-‐-‐-‐-‐-‐-‐-‐-‐-‐-‐-‐-‐-‐-‐-‐-‐-‐-‐-‐-‐-‐-‐-‐-‐-‐-‐-‐-‐-‐-‐-‐-‐-‐-‐-‐-‐-‐-‐-‐-‐-‐-‐-‐-‐-‐-‐-‐-‐-‐-‐-‐-‐-‐-‐-‐-‐-‐-‐-‐-‐-‐-‐-‐-‐-‐-‐-‐-‐-‐-‐-‐-‐-‐-‐-‐-‐-‐-‐ Cost of electricity purchased by commuters from the grid 14 cents per kWh in 2015 rising to
22 cents per kWh in 2050 (same as the cost escalation assumed in the electric sector of an increase of two percent per year for the first 10 years and then one percent per year after that)
Cost of unleaded gasoline purchased by commuters $3.14 per gallon in 2015 rising to $3.85 per gallon in 2050 following EIA projections
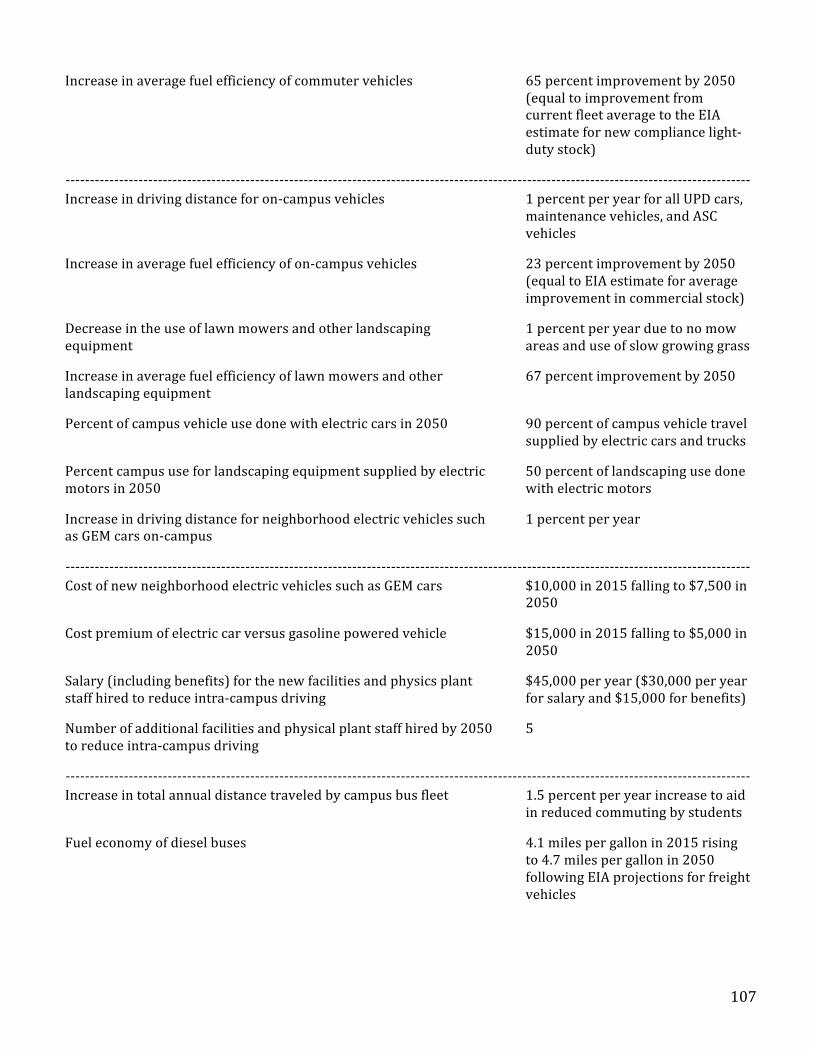
107
Increase in average fuel efficiency of commuter vehicles 65 percent improvement by 2050 (equal to improvement from current fleet average to the EIA estimate for new compliance light-‐duty stock)
-‐-‐-‐-‐-‐-‐-‐-‐-‐-‐-‐-‐-‐-‐-‐-‐-‐-‐-‐-‐-‐-‐-‐-‐-‐-‐-‐-‐-‐-‐-‐-‐-‐-‐-‐-‐-‐-‐-‐-‐-‐-‐-‐-‐-‐-‐-‐-‐-‐-‐-‐-‐-‐-‐-‐-‐-‐-‐-‐-‐-‐-‐-‐-‐-‐-‐-‐-‐-‐-‐-‐-‐-‐-‐-‐-‐-‐-‐-‐-‐-‐-‐-‐-‐-‐-‐-‐-‐-‐-‐-‐-‐-‐-‐-‐-‐-‐-‐-‐-‐-‐-‐-‐-‐-‐-‐-‐-‐-‐-‐-‐-‐-‐-‐-‐-‐-‐-‐-‐-‐-‐-‐-‐-‐-‐-‐-‐-‐-‐-‐-‐-‐-‐-‐-‐-‐-‐-‐-‐-‐-‐ Increase in driving distance for on-‐campus vehicles 1 percent per year for all UPD cars,
maintenance vehicles, and ASC vehicles
Increase in average fuel efficiency of on-‐campus vehicles 23 percent improvement by 2050 (equal to EIA estimate for average improvement in commercial stock)
Decrease in the use of lawn mowers and other landscaping equipment
1 percent per year due to no mow areas and use of slow growing grass
Increase in average fuel efficiency of lawn mowers and other landscaping equipment
67 percent improvement by 2050
Percent of campus vehicle use done with electric cars in 2050 90 percent of campus vehicle travel supplied by electric cars and trucks
Percent campus use for landscaping equipment supplied by electric motors in 2050
50 percent of landscaping use done with electric motors
Increase in driving distance for neighborhood electric vehicles such as GEM cars on-‐campus
1 percent per year
-‐-‐-‐-‐-‐-‐-‐-‐-‐-‐-‐-‐-‐-‐-‐-‐-‐-‐-‐-‐-‐-‐-‐-‐-‐-‐-‐-‐-‐-‐-‐-‐-‐-‐-‐-‐-‐-‐-‐-‐-‐-‐-‐-‐-‐-‐-‐-‐-‐-‐-‐-‐-‐-‐-‐-‐-‐-‐-‐-‐-‐-‐-‐-‐-‐-‐-‐-‐-‐-‐-‐-‐-‐-‐-‐-‐-‐-‐-‐-‐-‐-‐-‐-‐-‐-‐-‐-‐-‐-‐-‐-‐-‐-‐-‐-‐-‐-‐-‐-‐-‐-‐-‐-‐-‐-‐-‐-‐-‐-‐-‐-‐-‐-‐-‐-‐-‐-‐-‐-‐-‐-‐-‐-‐-‐-‐-‐-‐-‐-‐-‐-‐-‐-‐-‐-‐-‐-‐-‐-‐-‐ Cost of new neighborhood electric vehicles such as GEM cars $10,000 in 2015 falling to $7,500 in
2050
Cost premium of electric car versus gasoline powered vehicle $15,000 in 2015 falling to $5,000 in 2050
Salary (including benefits) for the new facilities and physics plant staff hired to reduce intra-‐campus driving
$45,000 per year ($30,000 per year for salary and $15,000 for benefits)
Number of additional facilities and physical plant staff hired by 2050 to reduce intra-‐campus driving
5
-‐-‐-‐-‐-‐-‐-‐-‐-‐-‐-‐-‐-‐-‐-‐-‐-‐-‐-‐-‐-‐-‐-‐-‐-‐-‐-‐-‐-‐-‐-‐-‐-‐-‐-‐-‐-‐-‐-‐-‐-‐-‐-‐-‐-‐-‐-‐-‐-‐-‐-‐-‐-‐-‐-‐-‐-‐-‐-‐-‐-‐-‐-‐-‐-‐-‐-‐-‐-‐-‐-‐-‐-‐-‐-‐-‐-‐-‐-‐-‐-‐-‐-‐-‐-‐-‐-‐-‐-‐-‐-‐-‐-‐-‐-‐-‐-‐-‐-‐-‐-‐-‐-‐-‐-‐-‐-‐-‐-‐-‐-‐-‐-‐-‐-‐-‐-‐-‐-‐-‐-‐-‐-‐-‐-‐-‐-‐-‐-‐-‐-‐-‐-‐-‐-‐-‐-‐-‐-‐-‐-‐ Increase in total annual distance traveled by campus bus fleet 1.5 percent per year increase to aid
in reduced commuting by students
Fuel economy of diesel buses 4.1 miles per gallon in 2015 rising to 4.7 miles per gallon in 2050 following EIA projections for freight vehicles

108
Fuel economy of propane buses 4.1 miles per gallon in 2015 rising to 4.7 miles per gallon in 2050 following EIA projections for freight vehicles
Percent of bus fuel supplied by propane 33 percent in 2015 falling to 5 percent by 2050
Percent of bus fuel supplied by biodiesel 5 percent in 2015 rising to 85.5 percent by 2050 (equivalent to 90 percent of the buses’ non-‐propane fuel needs, i.e. a B90 blend)
-‐-‐-‐-‐-‐-‐-‐-‐-‐-‐-‐-‐-‐-‐-‐-‐-‐-‐-‐-‐-‐-‐-‐-‐-‐-‐-‐-‐-‐-‐-‐-‐-‐-‐-‐-‐-‐-‐-‐-‐-‐-‐-‐-‐-‐-‐-‐-‐-‐-‐-‐-‐-‐-‐-‐-‐-‐-‐-‐-‐-‐-‐-‐-‐-‐-‐-‐-‐-‐-‐-‐-‐-‐-‐-‐-‐-‐-‐-‐-‐-‐-‐-‐-‐-‐-‐-‐-‐-‐-‐-‐-‐-‐-‐-‐-‐-‐-‐-‐-‐-‐-‐-‐-‐-‐-‐-‐-‐-‐-‐-‐-‐-‐-‐-‐-‐-‐-‐-‐-‐-‐-‐-‐-‐-‐-‐-‐-‐-‐-‐-‐-‐-‐-‐-‐-‐-‐-‐-‐-‐-‐ Cost of converting buses to run on 90 percent biodiesel (B90) fuel $14,000 per bus
Cost of propane fuel for buses $2.60 per gallon in 2015 rising to $3.06 by 2050 following EIA projections
Cost of conventional diesel fuel $3.70 per gallon in 2015 rising to $4.88 by 2050 following EIA projections
Cost of biodiesel fuel $2.06 per gallon in 2015 rising to $5.12 by 2050 due to increased competition for waste vegetable oil and the resulting need to expand to other sources of biodiesel supply
-‐-‐-‐-‐-‐-‐-‐-‐-‐-‐-‐-‐-‐-‐-‐-‐-‐-‐-‐-‐-‐-‐-‐-‐-‐-‐-‐-‐-‐-‐-‐-‐-‐-‐-‐-‐-‐-‐-‐-‐-‐-‐-‐-‐-‐-‐-‐-‐-‐-‐-‐-‐-‐-‐-‐-‐-‐-‐-‐-‐-‐-‐-‐-‐-‐-‐-‐-‐-‐-‐-‐-‐-‐-‐-‐-‐-‐-‐-‐-‐-‐-‐-‐-‐-‐-‐-‐-‐-‐-‐-‐-‐-‐-‐-‐-‐-‐-‐-‐-‐-‐-‐-‐-‐-‐-‐-‐-‐-‐-‐-‐-‐-‐-‐-‐-‐-‐-‐-‐-‐-‐-‐-‐-‐-‐-‐-‐-‐-‐-‐-‐-‐-‐-‐-‐-‐-‐-‐-‐-‐-‐

109
References
ASC 2010 Auxiliary Services Corporation of SUNY Cortland, “Dining Services Master Plan”, Contributors: Pierre Gagnon, Michelle Brackin, Bill McNamara, Dan Davis, and Jeff Johnson, February 10, 2010
ASU 2010 ASU Sustainability Office, Cameron Farlow (Graduate Assistant), and Appalachian Food Services, “A Sustainable Food System at ASU”, Appalachian State University, Spring 2010
Bardaglio and Putman 2009
Peter Bardaglio and Andrea Putman, Boldly Sustainable: Hope and Opportunity for Higher Education in the Age of Climate Change, National Association of College and University Business Officers, 1st Edition (April 2009)
Blaikley et al. 2001 D.C.W. Blaikley, A.P. Smith, E.A. Feest, and A.H. Reading, “UG219 TRAMAQ - cold start emissions. Summary report”, AEAT/ENV/R/0638 Issue 1, May 2001
Bowen and Martin 2010
Esther E. Bowen and Pamela A. Martin, “CO2 Emissions Impact of Sustainable Food Procurement: Informing University Policy”, in Walter Leal Filho (ed.), Universities and Climate Change: Introducing Climate Change to University Programmes, Springer, 2010
Brandt, Boak, and Burnham 2010
Adam R. Brandt, Jeremy Boak, and Alan K. Burnham, “Carbon Dioxide Emissions from Oil Shale Derived Liquid Fuels”, In Oil Shale: A Solution to the Liquid Fuel Dilemma; Ogunsola, O., et al. ACS Symposium Series; American Chemical Society: Washington, DC, 2010
Buck et al. 2007 Matthew Buck et al., “A Guide to Developing a Sustainable Food Purchasing Policy”, Association for the Advancement of Sustainability in Higher Education, Food Alliance, Health Care Without Harm, Institute for Agricultural Trade and Policy, and Oregon Center for Environmental Health, 2007
Casey and Holden 2006
J.W. Casey and N.M. Holden, “Greenhouse Gas Emissions from Conventional, Agri-‐environmental Scheme, and Organic Irish Suckler-‐beef Units”, Journal of Environmental Quality, Vol. 35 Number 1, 231–239 (2006)
Charpentier, Bergerson, and MacLean 2009
Alex D. Charpentier, Joule A. Bergerson, and Heather L. MacLean, “Understanding the Canadian oil sands industry’s greenhouse gas emissions”, Environmental Research Letters, Vol. 4, 014005 (2009)
Cornell et al. 2007 Cornell Farm to School Program, NY Farms!, and the New York School Nutrition Association, “Farm to School in the Northeast: Making the Connection for Healthy Kids and Healthy Farms”, A Toolkit for Extension Educators and other Community Leaders, Project funded by the Northeast Sustainable Agriculture Research and Education Program, May 2007
Davies 2007 Nick Davies, “The inconvenient truth about the carbon offset industry”, The Guardian, June 16, 2007
DOD 2010 U.S. Department of Defense, “Quadrennial Defense Review Report”, February 2010
DOE 2008 U.S. Department of Energy, “20% Wind Energy by 2030: Increasing Wind Energy’s Contribution to U.S. Electricity Supply”, Office of Energy Efficiency and Renewable Energy, DOE/GO-‐102008-‐2567, May 2008
DOE 2009 U.S. Department of Energy, “Statement of Steven Chu, Secretary of Energy, Before the Committee on Environment and Public Works, United States Senate”, July 7, 2009, online at http://www.energy.gov/news/7612.htm

110
DOT 2011 U.S. Department of Transportation, “National Transportation Statistics: 2011”, Research and Innovative Technology Administration, Bureau of Transportation Statistics, April 25, 2011
EIA 2010 U.S. Energy Information Administration, “Annual Energy Review 2009”, U.S. Department of Energy Office of Energy Markets and End Use, DOE/EIA-‐0384(2009), August 2010
EIA 2010b U.S. Energy Information Administration, “State Energy Data 2008: Prices and Expenditures”, State Energy Data System, Table 1. Energy Price and Expenditure Estimates by Source, Selected Years, 1970-‐2008, New York, June 30, 2010
EIA 2011 U.S. Energy Information Administration, “Annual Energy Outlook 2011: With Projections to 2035”, U.S. Department of Energy Office of Integrated and International Energy Analysis, DOE/EIA-‐0383(2011), April 2011
EIA 2011b U.S. Energy Information Administration, “1990 – 2009 Net Generation by State by Type of Producer by Energy Source”, Electric Power Annual 2009 – Online Data Tables, Office of Energy Markets and End Use, Released: November 23, 2010 and Revised: January 4, 2011
EIA 2011c U.S. Energy Information Administration, “1990 – 2009 U.S. Electric Power Industry Estimated Emissions by State", Electric Power Annual 2009 – Online Data Tables, Office of Energy Markets and End Use, Released: November 23, 2010 and Revised: January 4, 2011
Emory 2011 Emory University Sustainable Food Committee, “Sustainability Guidelines for Food Service Purchasing”, Approved February 27, 2008, Revised March 29, 2011
EPA 2006 U.S. Environmental Protection Agency, “Global Mitigation of Non-CO2 Greenhouse Gases”, Office of Atmospheric Programs, EPA 430-‐R-‐06-‐005, June 2006
EPA 2007 U.S. Environmental Protection Agency, “Inventory of U.S. Greenhouse Gas Emissions and Sinks: 1990 – 2005”, Office of Atmospheric Programs, EPA 430-‐R-‐07-‐002, April 15, 2007
EPA 2010 U.S. Environmental Protection Agency, “Supplemental EPA Analysis of the American Clean Energy and Security Act of 2009 H.R. 2454 in the 111th Congress”, Office of Atmospheric Programs, January 29, 2010
EPA 2011 U.S. Environmental Protection Agency, “Inventory of U.S. Greenhouse Gas Emissions and Sinks: 1990 – 2009”, Office of Atmospheric Programs, EPA 430-‐R-‐11-‐005, April 15, 2011
Eshel and Martin 2006
Gidon Eshel and Pamela A. Martin, “Diet, Energy, and Global Warming”, Earth Interactions , Vol. 10 Paper No. 9, 1-‐17 (2006)
Filho et al. 2010 Walter Leal Filho (ed.), Universities and Climate Change: Introducing Climate Change to University Programmes, Springer, 1st Edition (June 2010)
Food & Water Watch et al. 2007
Food & Water Watch and Network for New Energy Choices in collaboration with the Institute for Energy and the Environment at the Vermont Law School, “The Rush to Ethanol: Not All Biofuels are Created Equal, Analysis and Recommendations for U.S. Biofuels Policy”, 2007
Fthenakis, Chul Kim, and Alsema 2008
Vasilis Fthenakis, Hyung Chul Kim, and Erik Alsema, “Emissions from Photovoltaic Life Cycles”, Environmental Science & Technology, Vol. 42, 2168–2174 (2008)

111
Giuliano 2010 Meg Giuliano, “Green Dining at Duke University: Facilitating Local and Sustainable Food Procurement”, Masters project submitted in partial fulfillment of the requirements for the Master of Environmental Management degree in the Nicholas School of the Environment of Duke University, April 2010
Grubb et al. 2011 Michael Grubb, Tim Laing, Thomas Counsell, and Catherine Willan, “Global carbon mechanisms: lessons and implications”, Climatic Change, Vol. 104, 539-‐ 573 (2011)
H.R. 2454 U.S. House of Representatives, “H. R. 2454: An Act To create clean energy jobs, achieve energy independence, reduce global warming pollution and transition to a clean energy economy”, Short Title: American Clean Energy and Security Act of 2009, 111th Congress, 1st Session, Passed June 26, 2009
Hill et al. 2006 Jason Hill, Erik Nelson, David Tilman, Stephen Polasky, and Douglas Tiffany, “Environmental, economic, and energetic costs and benefits of biodiesel and ethanol biofuels”, Proceedings of the National Academies of Science, Vol. 103 Number 30, 11206-‐11210 (2006)
Howarth, Santoro, and Ingraffea 2011
Robert W. Howarth, Renee Santoro, and Anthony Ingraffea, “Methane and the greenhouse-‐gas footprint of natural gas from shale formations: A letter”, Climatic Change, Vol. 106(4), 679-‐690 (2011)
IPCC 2006 Simon Eggleston, Leandro Buendia, Kyoko Miwa, Todd Ngara, and Kiyoto Tanabe (eds.), “2006 IPCC Guidelines for National Greenhouse Gas Inventories: Volume 2 Energy”, Task Force on National Greenhouse Gas Inventories of the Intergovernmental Panel on Climate Change, 2006
IPCC 2007 Solomon, S., D. Qin, M. Manning, Z. Chen, M. Marquis, K.B. Averyt, M. Tignor and H.L. Miller (eds.), “Climate Change 2007: The Physical Science Basis”, Contribution of Working Group I to the Fourth Assessment Report of the Intergovernmental Panel on Climate Change, Cambridge University Press, 2007
IPCC 2011 O. Edenhofer, R. Pichs-‐Madruga, Y. Sokona, K. Seyboth, P. Matschoss, S. Kadner, T. Zwickel, P. Eickemeier, G. Hansen, S. Schlömer, C. von Stechow (eds.), “IPCC Special Report on Renewable Energy Sources and Climate Change Mitigation”, Technical Support Unit Working Group III, Intergovernmental Panel on Climate Change, Cambridge University Press (2011)
JMZ 2011 JMZ Architects and Planners, P.C. and Sasaki Associates, Inc., “SUNY Cortland Sustainability Master Plan”, March 3, 2011
Johnson and Stevenson 1998
Douglas B. Johnson and George W. Stevenson, “Something to Cheer About: National Trends and Prospects for Sustainable Agriculture Products in Food Service Operations of Colleges and Universities”, Funding provided by The Center for Integrated Agricultural Systems at the University of Wisconsin-‐Madison, 1998
Kahya 2009 Damian Kahya, “30% of carbon offsets spent on reducing emissions”, BBC News, December 7, 2009
Kanter 2007 James Kanter, “Guilt-‐Free Pollution. Or Is It?”, New York Times, February 20, 2007
Kinsley and DeLeon et al. 2009
Michael Kinsley and Sally DeLeon (principal authors), “Accelerating Campus Climate Initiatives”, Rocky Mountain Institute, November 2009
Lal 2003 R. Lal, “Global Potential of Soil Carbon Sequestration to Mitigate the Greenhouse Effect”, Critical Reviews in Plant Sciences, Vol. 22 Number 2, 151-‐184 (2003)
Makhijani 2007 Arjun Makhijani, Carbon-Free and Nuclear-Free: A Roadmap for U.S. Energy Policy, IEER Press and RDR Books, August 2007

112
McLaughlin et al. 2000 N.B. McLaughlin, A. Hiba, G.J. Wall, And D.J. King, “Comparison of energy inputs for inorganic fertilizer and manure based corn production”, Canadian Agricultural Engineering, Vol. 42 No. 1, 2.1-‐2.4 (2000)
Meier 2002 Paul J. Meier, “Life-Cycle Assessment of Electricity Generation Systems and Applications for Climate Change Policy Analysis”, A dissertation submitted in partial fulfillment of the requirements for the degree of Doctor of Philosophy (Land Resources) at the University of Wisconsin – Madison, 2002
NAS/NRC 2010 National Research Council of the National Academies, “Toward Sustainable Agricultural Systems in the 21st Century”, Board on Agriculture and Natural Resources, Committee on Twenty-‐First Century Systems: Agriculture, National Academies Press, 2010
NAS/NRC 2011 National Research Council of the National Academies, “America’s Climate Choices”, Board on Atmospheric Sciences and Climate, Committee on America’s Climate Choices, National Academies Press, 2011
NREL 1994 National Renewable Energy Laboratory, “Solar Radiation Data Manual for Flat-Plate and Concentrating Collectors”, U.S. Department of Energy, 1994 (NREL/TP-‐463-‐5607)
Pacala and Socolow 2004
S. Pacala and R. Socolow, “Stabilization Wedges: Solving the Climate Problem for the Next 50 Years with Current Technologies,” Science, Vol. 305 Issue 5686, 968-‐972 (2004)
Pauly et al. 2002 Daniel Pauly, Villy Christensen, Sylvie Guénette, Tony J. Pitcher, U. Rashid Sumaila, Carl J. Walters, R. Watson & Dirk Zeller, “Towards sustainability in world fisheries”, Nature, Vol. 418, 689-‐695 (2002)
Pauly et al. 2003 Daniel Pauly, Jackie Alder, Elena Bennett, Villy Christensen, Peter Tyedmers, and Reg Watson, “The Future for Fisheries”, Science, Vol. 302 Number 5649, 1359-‐1361 (2003)
Peters et al. 2009 Christian J. Peters, Nelson L. Bills, Arthur J. Lembo, Jennifer L. Wilkins, and Gary W. Fick, “Mapping potential foodsheds in New York State: A spatial model for evaluating the capacity to localize food production”, Renewable Agriculture and Food Systems, Vol. 24 Number 1, 72–84 (2009)
Pimentel and Patzek 2005
David Pimentel and Tad W. Patzek, “Ethanol Production Using Corn, Switchgrass, and Wood; Biodiesel Production Using Soybean and Sunflower”, Natural Resources Research, Vol. 14 Number 1, 65-‐76 (2005)
POST 2006 Parliamentary Office of Science and Technology, “Carbon Footprint of Electricity Generation”, PostNote Number 268, October 2006
RGGI 2011 Regional Greenhouse Gas Initiative, Inc., “Investment Of Proceeds From RGGI CO2 Allowances: Benefits of Regional Greenhouse Gas Initiative (RGGI)-funded programs in Connecticut, Delaware, Maine, Maryland, Massachusetts, New Hampshire, New Jersey, New York, Rhode Island, and Vermont”, February 2011
Rojas, Richer, and Wagner 2007
Alejandro Rojas, Liska Richer, and Julia Wagner, “University of British Columbia Food System Project: Towards Sustainable and Secure Campus Food Systems”, EcoHealth, Vol. 4, 86-‐94 (2007)
Schmer et al. 2008 M. R. Schmer, K. P. Vogel, R. B. Mitchell, and R. K. Perrin, “Net energy of cellulosic ethanol from switchgrass”, Proceedings of the National Academies of Science, Vol. 105 Number 2, 464-‐469 (2008)

113
Smith 2001 A.P. Smith, “UG219 TRAMAQ. Excess emissions planning tool (EXEMPT) user guide”, AEAT/ENV/R/0639 Issue 1, May 2001
Smith 2006 Brice Smith, Insurmountable Risks: The Dangers of Using Nuclear Power to Combat Global Climate Change, IEER Press and RDR Books, May 2006
Socolow et al. 2004 Robert Socolow, Roberta Hotinski, Jeffery B. Greenblatt, and Stephen Pacala, “Solving the Climate Problem: Technologies Available to Curb CO2 Emissions”, Environment, Vol. 46 No. 10, 8-‐19 (2004)
Solomon, Barnes, and Halvorsen 2007
Barry D. Solomon, Justin R. Barnes, and Kathleen E. Halvorsen, “Grain and cellulosic ethanol: History, economics, and energy policy”, Biomass and Bioenergy, Vol. 31, 416-‐425 (2007)
Strohbehn and Gregoire 2004
Catherine H. Strohbehn and Mary B. Gregoire, “Local Foods: From Farm to College and University Foodservice”, Support for this project was provided by the Iowa State University Hotel, Restaurant and Institution Management Development Fund, 2004
Supreme Court 2007 Supreme Court of the United States, “Massachusetts et al. v. Environmental Protection Agency et al.”, On Writ of Certiorari to the United States Court of Appeals for the District of Columbia Circuit, No. 05-‐1120, Argued November 29, 2006, Decided April 2, 2007
Vandermeer et al. 2009
John Vandermeer, Gerald Smith, Ivette Perfecto, and Eileen Quintero (coordinators), “Effects of Industrial Agriculture on Global Warming and the Potential of Small-Scale Agroecological Techniques to Reverse Those Effects”, A report to Via Campesina by The New World Agriculture and Ecology Group, November 20, 2009
Weber and Matthews 2008
Christopher Weber and H. Scott Matthews, “Food-‐Miles and the Relative Climate Impacts of Food Choices in the United States”, Environmental Science & Technology, Vol. 42, 3508-‐3513 (2008)
Weilenmann et al. 2005
Martin Weilenmann, Patrik Soltic, Christian Saxer, Anna-‐Maria Forss, and Norbert Heeb, “Regulated and nonregulated diesel and gasoline cold start emissions at different temperatures”, Atmospheric Environment, Vol. 39, 2433–2441 (2005)
Yale 2008 Yale Sustainable Food Project, “Sustainable Food Purchasing Guide”, First Edition, 2008