correlation of proton and nitrogen-15 chemical shifts by multiple
TRANSCRIPT
JOURNAL OF MAGNETIC RESONANCE 55, 30 l-3 15 (1983)
Correlation of Proton and Nitrogen-15 Chemical Shifts by Multiple Quantum NMR*
AD BAX,’ RICHARD H. GRIFFEY,?~ AND BRUCE L. HAWKINS
Department of Chemistry, Colorado State University, Fort Collins, Colorado 80523, and TDepartment of Chemistry, University of Utah, Salt Lake City, Utah 84112
Received June 9, 1983
Techniques for the correlation of ‘H and “N chemical shifts based on zero and double quantum NMR are discussed. The indirect determination of nitrogen shiBs from the proton signals provides a dramatic gain in sensitivity over direct observation of r5N signals. Examples are given of applications of the methods to samples with natural abundance “N concentration and to a sample of 0.7 m&I 65% “N enriched tRNAya in HrO. Two- dimensional ‘H-15N shift correlation spectra of 0.1 M samples with natural abundance 15N concentration in a 5 mm sample tube can be obtained in measuring times on the order of 1 hr.
1. INTRODUCTION It was realized at an early stage that, in principle, detection of the nucleus with
the highest magnetogyric ratio in a heteronuclear shift correlation experiment offers the highest sensitivity (1, 2). However, in most two-dimensional shift correlation experiments one prefers to detect the rare nucleus, of usually low magnetogyric ratio (e.g., r3C, r5N), rather than the protons. Among other reasons (3), this is done to avoid dynamic range problems and suppression of signals from protons that are not coupled to the rare nucleus.
Bodenhausen and Ruben (4) have demonstrated that heteronuclear ‘H-“N shift correlation with direct detection of proton signals (here referred to as the Overbod- enhausen experiment) is feasible for small peptides at natural abundance r5N con- centration. In principle, this experiment gives close to optimal sensitivity for the indirectly measured 15N signals. In the Overbodenhausen experiment a set of 90 and 180” pulses is applied to the protons prior to data acquisition. This makes suppression of large unwanted signals, which are a major source of the dynamic range problem, very difficult. This problem is particularly severe in many compounds of biological interest that can only be dissolved in HzO. No saturation of the water resonance can be employed because chemical exchange with the imino protons would also saturate those latter signals. It is for this reason that Redfield (5) has modified the Overbod- enhausen experiment by omitting the 180” proton pulses, which are a basic bottleneck in the dynamic range problem. However, omitting the 180” pulses leads to a major loss in sensitivity and to a complication of the spectrum (5). The dynamic range
” Presented in part at the 24th ENC, Asilomar, April 1983. ’ Present address: National Institutes of Health, Building 2, Bethesda, Maryland 20205. ” Present address: Department of Biochemistry, Brandeis University, Waltham, Massachusetts 02254.
301 0022-2364183 $3.00 Copyright 0 1983 by Academic Press. Inc.
All rights of reproduction in any form reserved.
302 BAX, GRFFEY, AND HAWKINS
problem is still severe, since three (composite) 90” pulses are applied to the protons prior to acquisition.
We describe a set of chemical shift correlation experiments that are based on multiple quantum NMR and minimize dynamic range problems, while optimizing sensitivity. The principle of chemical shift correlation via multiple quantum NMR has been described by several workers (6-9), but its potential advantages in ‘H-‘*N shift correlation have never been demonstrated. Our new method gives excellent suppression of signals that are not coupled to a ‘*N nucleus (10, II) and is therefore directly applicable to samples with natural abundance ‘*N concentration. Very recently, experiments which are similar to those described and demonstrated in this paper have been proposed by Bendall et al. (12), using a Heisenberg vector picture. In our description we use the more familiar Schriidinger formalism.
2. ZERO AND DOUBLE QUANTUM COHERENCE
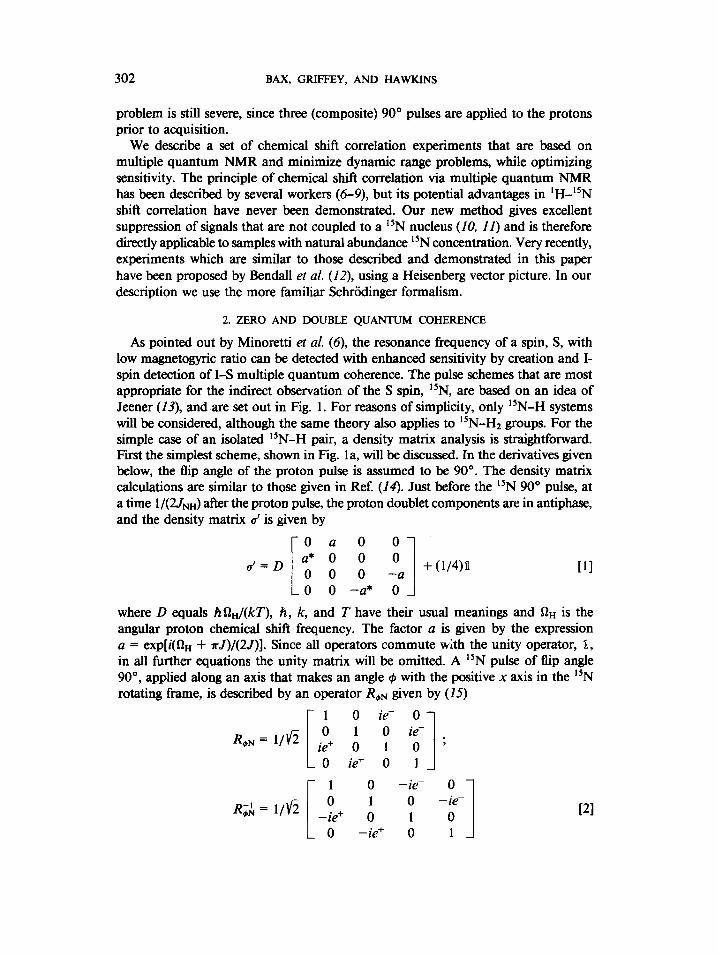
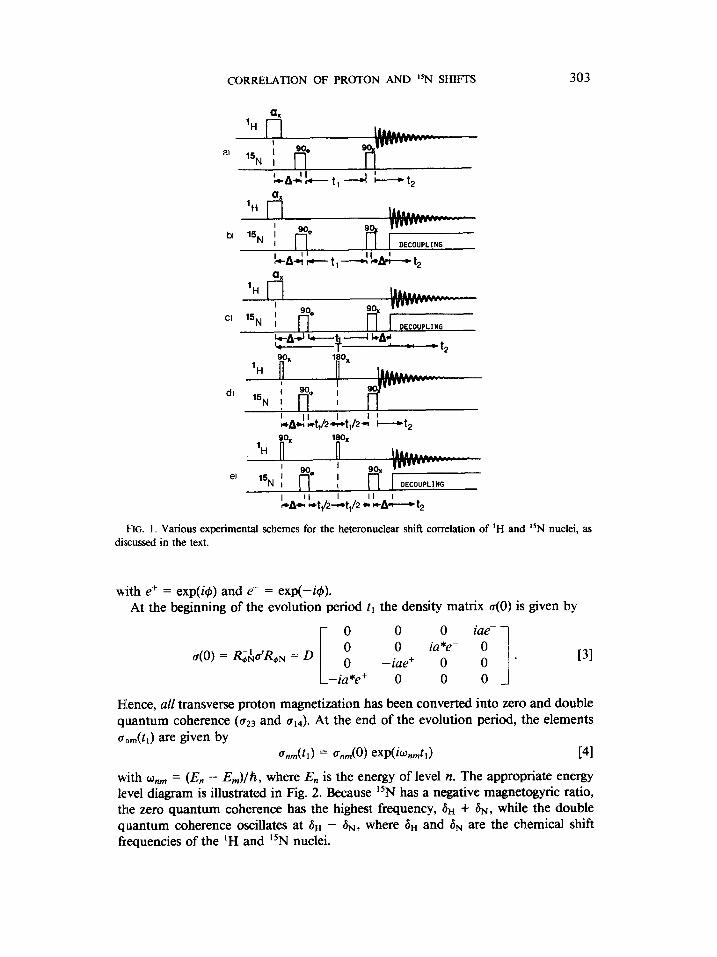
As pointed out by Minoretti et al. (6), the resonance frequency of a spin, S, with low magnetogyric ratio can be detected with enhanced sensitivity by creation and I- spin detection of I-S multiple quantum coherence. The pulse schemes that are most appropriate for the indirect observation of the S spin, ‘*N, are based on an idea of Jeener (13), and are set out in Fig. 1. For reasons of simplicity, only ‘*N-H systems will be considered, although the same theory also applies to ‘*N-H* groups. For the simple case of an isolated ‘*N-H pair, a density matrix analysis is straightforward. First the simplest scheme, shown in Fig. la, will be discussed. In the derivatives given below, the flip angle of the proton pulse is assumed to be 90”. The density matrix calculations are similar to those given in Ref. (14). Just before the ‘*N 90” pulse, at a time l/(21& after the proton pulse, the proton doublet components are in antiphase, and the density matrix d is given by
roa 0 01
-“, + (l/4)1
0 0 -a* 0
[II
where D equals h&/(kT), h, k, and T have their usual meanings and 52u is the angular proton chemical shift frequency. The factor a is given by the expression a = exp[i(Q, + ?rJ)/(U)]. Since all operators commute with the unity operator, ll, in all further equations the unity matrix will be omitted. A ‘*N pulse of flip angle 90”, applied along an axis that makes an angle 4 with the positive x axis in the ‘*N rotating frame, is described by an operator RON given by (15)
1 0 ie- 0 1 0
ie+ 0 1 0 ie+ 0
‘1 0 0 1
-ie+ 0 0 -ie+
0
ie-
. 0 ’ 1 1
-ie- 0 0 -ie- 1 0 0 1
PI
CORRELATION OF PROTON AND 15N SHIFTS 303
‘H
I al
15N 1
&&-t, _) i--t2
bl lSN DECOUPLING
I LAiv---t ,---k&-t*
‘H
I Cl 15N 1 DECOUPLING
k-A4 Lt A LA-’ f ‘t2
‘H
180,
dr
&! ~t,/&t,f2~ I
Lt,
‘H
I el
15N ; DECOUPLING
FIG. I. Various experimental schemes for the heteronuclear shift correlation of ‘H and 15N nuclei, as discussed in the text.
with e+ = exp(i4) and e- = exp(-i4). At the beginning of the evolution period t, the density matrix a(O) is given by
u(O) = R&fR,N = D
i
0 0 0 iae- 0 0 ia*e- 0 o -iae+ 0 0 . [31
-ia*e+ 0 0 0 1
HLence, all transverse proton magnetization has been converted into zero and double quantum coherence (uz3 and crr4). At the end of the evolution period, the elements a,,&,) are given by
unm(h) = u,,(O) ew(hdJ [41
with o,~ = (E,, - E,)/ti, where En is the energy of level n. The appropriate energy level diagram is illustrated in Fig. 2. Because 15N has a negative magnetogyric ratio, the zero quantum coherence has the highest frequency, bn f &, while the double quantum coherence oscillates at 8n - &,, where 8n and ~3~ are the chemical shift frequencies of the ‘H and 15N nuclei.

BAX, GRIFFEY, AND HAWKINS
‘HaN -4
FIG. 2. Energy levels and eigenfunctions of a ‘H-“N spin system.
A final 90”, “N read pulse converts the multiple quantum coherence into observable ‘H transverse magnetization:
and PaI
a12(tl, t2) = Y2[-ae+ exp(--iuz3tJ - ae- exp(iwi4tl)] exp(io& WI q4(tl, t2) = Y2[ae+ exp(-iu23tJ + ae- exp(iw14tl)] exp(iwj4t2). [5cl
From Eqs. [5b] and [%I, it is seen that the detected proton doublet components (ai2 and Q.,) are modulated by both the zero and double quantum frequencies, and that they have opposite phase just after the final 90” “N pulse. An example of spectra obtained with the method of Fig. la will be shown in Fig. 5. To determine the i5N resonance frequency relative to the 15N transmitter, one has to distinguish between the zero quantum frequency and the double quantum frequency for each ‘H-15N pair. Inspection of Eqs. [5b] and [5c] shows that this is easily done by cycling the phase C#J of the first “N pulse in two steps. In practice, four steps will be used, since this also provides cancellation of signals from protons not coupled to “N. In Table 1, the phase 4 of the first 90 ’ 15N pulse is given for the four steps of the experiment as well as the relative phases of the proton magnetizations that originate from zero quantum coherence (M,,) and double quantum coherence (M&. In analogy with conventional heteronuclear shift correlation (16-I9), broadband “N decoupling can
TABLE 1
PHASE, 6, OF THE FIRST 90 O lSN PULSE, AND RELATIVE PHASES OF THE DETECTED TRANSVERSE MAGNETIZA- TION THAT ORIGINATES FROM DOUBLE QUANTUM
COHERENCE (k&J AND FROM ZERO QUANTUM COHERENCE (Ma) FOR THE VARIOUS
STEAL OF THE EXPERIMENT
Step No. + MDQ MZQ
1 X X X
2 Y -Y Y 3 --x -X --x 4 -Y Y -Y
CORRELATION OF PROTON AND “N SHIFTS 305
be used during acquisition, if a delay on the order of l/(2&) is inserted between the final “N pulse and the onset of acquisition (Fig. 1 b). This delay is needed because the two proton doublet magnetization components are initially in antiphase after the final 90” I5 N pulse (Eqs. [5b] and [5c]), and mutual cancellation would occur if decoupling were started at this time.
DIRECT SHIFI CORRELATION
The zero and double quantum coherence frequencies, discussed above, provide the 15N shift information, since in the 2D spectra the resonances are centered at (F,, &) = (6u rfr &, au). A more convenient presentation of the data is obtained if the peaks are centered at (Fr , 1;2) = (G,, an). There are two different approaches to obtain this type of presentation: first by modification of the experimental scheme, and second, by manipulation of the spectrum obtained with the original schemes (F&s. la, b).
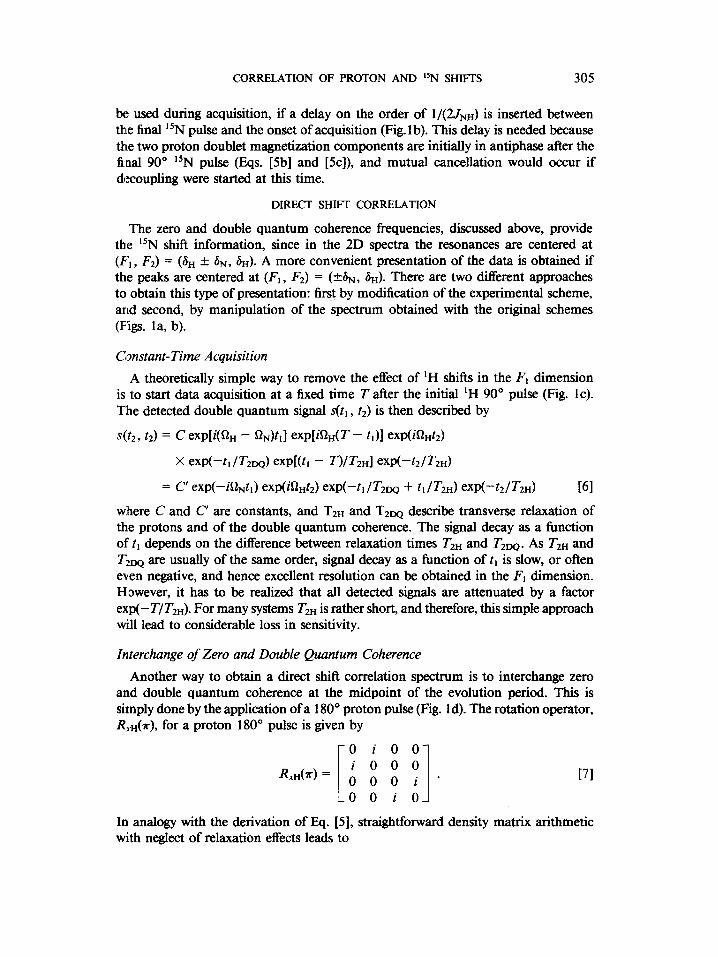
Constant- Time Acquisition A theoretically simple way to remove the effect of ‘H shifts in the F, dimension
is to start data acquisition at a fixed time T after the initial ‘H 90” pulse (Fig. Ic). T;he detected double quantum signal s(t, , t2) is then described by
s(tz, t2) = C exp[i(Qu - f2,)t,] exp[i&(T - t,)] exp(iQ&)
X exPt-t,/T2& exP[(h - T)/TzHI exPt-tdT2d
= C’ eXp(---in&) exp(if&) exp(-tl/T2w + tl/T& eXp(-tz/T& El wlhere C and C’ are constants, and TZH and TZW describe transverse relaxation of the protons and of the double quantum coherence. The signal decay as a function of t, depends on the difference between relaxation times TZH and T2Da. As T~H and T:!, are usually of the same order, signal decay as a function of tl is slow, or often even negative, and hence excellent resolution can be obtained in the F, dimension. H,owever, it has to be realized that all detected signals are attenuated by a factor eXp(-T/T&. For many systems Tw is rather short, and therefore, this simple approach will lead to considerable loss in sensitivity.
Interchange of Zero and Double Quantum Coherence Another way to obtain a direct shift correlation spectrum is to interchange zero
and double quantum coherence at the midpoint of the evolution period. This is simply done by the application of a 180” proton pulse (Fig. Id). The rotation operator, &.u(?r), for a proton 180” pulse is given by
171
In analogy with the derivation of Eq. [5], straightforward density matrix arithmetic with neglect of relaxation effects leads to

306 BAX, GIUFFEY, AND HAWKINS
u12(tl, t2) = --'/zu*[e+ exp(-zQNtl) + 4 exp(i&t,)] exp[i(& + 7rJ)t2] WI q4(fl, t2) = */2a*[e+ exp(-i&t,) + e- exp(i&t,)] exp[i& - 7rJ)t2] VW
with & = (oZ3 - o&2. Cyclic permutation of the phase 4 of the first 90” 15N pulse, and the receiver
reference phase in a way as given in Table 1, directly gives a conventional shift correlation spectrum with peaks at (F, ,1;;) = (&, 6n f J&2) in the case where the phase cycling selects Moo, and at (-&, 6n f J&2) in the case where Mzo is selected. An example of a spectrum obtained this way will be shown in Fig. 8. Of course, 15N decoupling can again be used during acquisition (Fig. le) to remove the ‘H-“N splitting in the Fz dimension and double the sensitivity.
Data Manipulation
A third way to obtain a pure chemical shift correlation spectrum is to shear a zero or double quantum spectrum in a way as described by Miiller (20). In the zero quantum spectrum, for example, a resonance in the decoupled spectrum appears at (F,, F2) = (& + bn, 6,). This can be sheared according to (F’, , F2) = (F, - I;;, F2) to give a spectrum with a resonance at (&, 6,). An effect similar to shearing of the data matrix can be obtained by proper phasing of the ,S(ti, F*) spectra (21), before transposition of the data matrix. If a linearly frequencydependent phase correction 4, = -27~ rad/Hz is applied to a spectrum, this has the same effect on the phase of a resonance line as a right shift of the data in the time domain by r sec. Therefore, by applying a linear phase correction,
4, = 2r(t, - T) rad/Hz 191
to each spectrum s(ti , Fz), where t is the largest value oft, , we obtain a data matrix with similar information to that of the constant-time version discussed earlier. It now appears as if the data acquisition starts at time T after the proton pulse. A second Fourier transformation on a data set S(t, , F2) manipulated with the phase correction of Eq. [9] gives resonances at (+b N, 6,) without the sensitivity loss of the constant- time experiment. Of course, the constant 2?rT in Eq. [9] is an identical phase factor for all S(t,, Fz) spectra and can be omitted, giving
r#q = 2ut, rad/Hz. [lOI In practice, quadrature detection is employed during t2, and therefore, if the F2 spectral width is +Q Hz, on most commercial spectrometers, a frequency-independent phase correction, 4, = -217Qt1, has to be applied to keep the phase of the S(ti , F2) spectra unchanged for F2 = 0. Another practical point requiring attention is that the frequency in a spectrum runs from high to low, and therefore, on some spectrometers opposite phase shifts
4, = -2?rt, rad/Hz [llal 4, = 2uqQt, rad [llbl
have to be applied. The type of phase correction required for a particular spectrometer is easily determined by phase correcting a spectrum of which the time domain data have been left shit&l by one data point.
CORRELATION OF PROTON AND “N SHIFTS 307
This type of linearly frequency-dependent phase shifts removes the effect of the $1 shift in the F, dimension and gives results very similar to the foldover correction routine described by Miiller (20), but avoids interpolation in the poorly digitized F1 dimension.
A simpler alternative to our phase correction, described above, is used by Redfield (22): data acquisition is started immediately after the proton pulse, but the receiver is not turned on until the detection period starts. A right shift of the data is thus produced, by exactly the amount necessary for removal of the ‘H shift from the F, dimension. A problem arises for samples in aqueous solutions using this approach: one cannot use a simple baseline correction routine on the imino proton region of the F2 spectra before transposition, to correct for the “baseline roll” caused by the tails of the nonsuppressed part of the water signal and the right shift. However, this technique is applicable in cases where excellent suppression of the water signal is obtained.
REPETITION RATE OF THE EXPERIMENT
As follows directly from the density matrix calculations given earlier, it is the longitudinal proton magnetization, present before the first proton pulse, that is con- verted into heteronuclear multiple quantum coherence. The sensitivity of the exper- iments in the sequences of Figs. la-c can be optimized, like in conventional one dilmensional FT experiments, by reducing the flip angle of the proton pulse to a value less than 90” (23). This reduction in flip angle is beneficial for obtaining spectra of concentrated samples or samples in aqueous solutions, where dynamic range problems can be severe. In those cases, a small flip angle will give sensitivity similar to a 90” proton pulse flip angle, but the smaller flip angle allows a higher experiment repetition rate, thus improving the overall sensitivity. It also appears that the effectiveness of the suppression of the signals from protons coupled to i4N is related to the number of acquisitions, and therefore a large number of acquisitions, using a small proton- flip angle, is desirable.
EXPERIMENTAL
All experiments were performed on a Nicolet-360 spectrometer, equipped with a 293A’ pulse programmer and a NT- 1180 computer. Phases of the 15N pulses and the composite WALTZ-16 “N decoupling (24) were controlled by an ADNIC phase programmer (25). The tuning circuit of a standard Nicolet 5 mm proton probe was modified in the way sketched in Fig. 3, to allow triple tuning (‘H, ‘H, “N) (Fig. 3). Unless explicitly stated otherwise, in all experiments a 15N band-reject filter was used in the 2H lock channel, to avoid disturbance of the lock signal by the “N irradiation. A stable lock is critical for good suppression of signals from protons not coupled to ‘9~. Experiments were pe rformed on a 0.15 M solution of 2’,3’,5’ tri-0-benzoyl-4- thiouridine (I) (Fig 4) (26) in CDC&, a 0.25 A4 1: 1 mixture of 2’,3’-O-isopropylidene- 5’-O-tert-butyldimethylsilylguanosine and 2’,3’-O-isopropylidene-5’-O-tert-butyldi- methylsilylcytidene (II) (Fig. 4) in CDQ, a 0.5 M solution of [1,3-‘5N2]5-(2’,5’,8- trioxadecyl)uracil and 5’-acetyl-2’-3’-O-isopropylideneadenosine (III) (27) in CDC&

308 BAX, GIUFFBY, AND HAWKINS
r - - - - - - - - - - - - - - - - - ______ - - - - - - - - ---4
I I
I I I
“N (36 MHZ) o--$ ’ I
I I
I
I 4 55 MHZ TRAP I
I 15N MATCHING NETWORK T
c ---- ----------------------------/
*I-i (55 MHZ) /
360 MHZ TRAP I
’ H (360 MHZ) O-y.1
SAMPLE CO I L
I / I
I L------ ----- -_-_---- ____ -- -____ --I
STANDARD PROTON PROBE
FIG. 3. The triply tuned probe circuit. A 36.5 MHz matching network to provide the 15N irradiation capability was added to a standard doubly tuned high-resolution probehead. This added circuitry consists of a 55 MHz trap for isolation, and matching and tuning capacitors (Johanson No. 5641, l-30 pF) to transform the impedance to 50 a. The 55 MHz trap consists of a I-30 pF Johanson No. 5641 capacitor in parallel with a 16 turn close-wound No. 26 wire coil, mounted on a 10 mm o.d. form. The addition of this matching network caused no noticeable degradation in proton sensitivity, and introduced no change in the proton 90’ pulse width.
and a 0.7 mA4 sample of tRNAf Met labeled with 65% “N at N3 of all the uridine- related bases (28) in a 92% H20/8% D20 solution, contained in a 200 ~1 Wilmad 508 microcell. Experiments on the tRNA and on compound II were performed at 15°C to slow the proton exchange rate; all other experiments were done at room temperature.
The “N rf field strength was measured using the calibration method described in Reference 14 on the “N labeled compound (III) and the “N 90” pulse width was determined to be 480 psec. In all experiments, the delay A was set to 4.5 msec.
Data obtained with the phases 4 = x and $I= -x (Fig. 1) were acquired on alternate scans, subtracted, and stored separately from the data obtained with 4 = y and $J = -y. Taking a proper combination of the two data sets (see Table 1) then allows the computation of both the zero and the double quantum spectra from the same sets of data. Because the noise in the zero and double quantum spectra is independent, in principle, those spectra can be co-added to give an improvement in sensitivity by a factor fi (29) over adding the data of all four steps of the experiment directly, in the fashion given in Table 1, and selecting either the zero or the double quantum component.

CORRELATION OF PROTON AND “N SHIFTS 309
BzO
FIG. 4. Structures of 2’,3’,5’ tri-U-benzoykl-thiouridine (I), a 1: 1 mixture of 2’,3’-O-isopropylidene-S-0- ter&butyldimethylsilylcytidene and 2’,3’-O-isopropylidene-S-~~~~-butyldimethyl~yl~nosine (II) and a 1:2 mixture of [ 1,315N2]5-(2’,5’,8’trioxadecyl)uracil and 5’-acetyl-2’,3’-Gsopropylideneadenosine (III).
RESULTS AND DISCUSSION
Figure 5 shows the zero and double quantum spectra obtained for compound I, using the sequence of Fig. la. Thirty-two tl increments of 1 msec each were used, giving a spectral width of +500 Hz in the F, dimension. The proton pulse width was set to 1.1 msec, corresponding to a 60” flip angle on resonance, with minimal excitation of other resonances in the spectrum. One thousand transients were recorded for each
D . 0 0 0
OHz 6
-500
D
/
F2 b ‘H
10.5 PPM
-500
FfG. 5. (a) Heteronuclear double quantum and (b) zero quantum spectrum of I with natural abundance “N concentration, obtained with the sequence of Fig. la. The proton transmitter was placed at 10.1 ppm. The total measuring time for both spectra was approximately 2.5 hr. Along the F2 axis the absolute value- mode projection of the doublequantum spectrum is shown. Along the F, axes, two phase-sensitive cross- sections parallel to the F, axes, at the F2 frequency of the lower-field doublet component, are shown.
310 BAX, GRIFFEY, AND HAWKINS
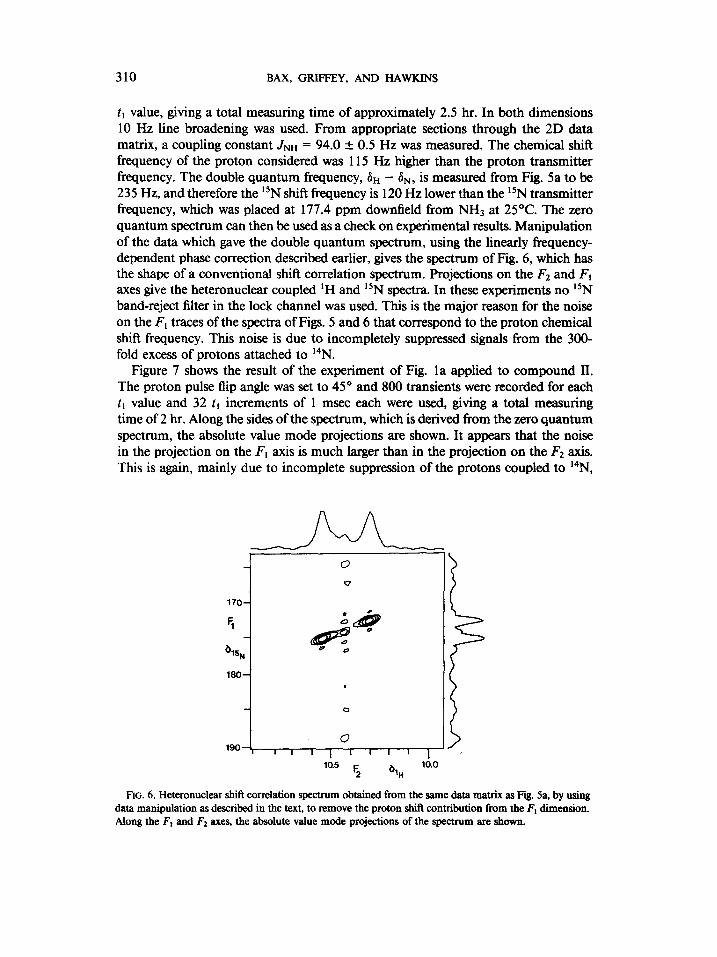
tl value, giving a total measuring time of approximately 2.5 hr. In both dimensions 10 Hz line broadening was used. From appropriate sections through the 2D data matrix, a coupling constant JNH = 94.0 & 0.5 Hz was measured. The chemical shift frequency of the proton considered was 115 Hz higher than the proton transmitter frequency. The double quantum frequency, 8~ - &, is measured from Fig. 5a to be 235 Hz, and therefore the lSN shift frequency is 120 Hz lower than the i5N transmitter frequency, which was placed at 177.4 ppm downfield from NH3 at 25’C. The zero quantum spectrum can then be used as a check on experimental results. Manipulation of the data which gave the double quantum spectrum, using the linearly frequency- dependent phase correction described earlier, gives the spectrum of Fig. 6, which has the shape of a conventional shift correlation spectrum. Projections on the F2 and FI axes give the heteronuclear coupled ‘H and 15N spectra. In these experiments no *‘N band-reject filter in the lock channel was used. This is the major reason for the noise on the F, traces of the spectra of Figs. 5 and 6 that correspond to the proton chemical shift frequency. This noise is due to incompletely suppressed signals from the 300- fold excess of protons attached to 14N.
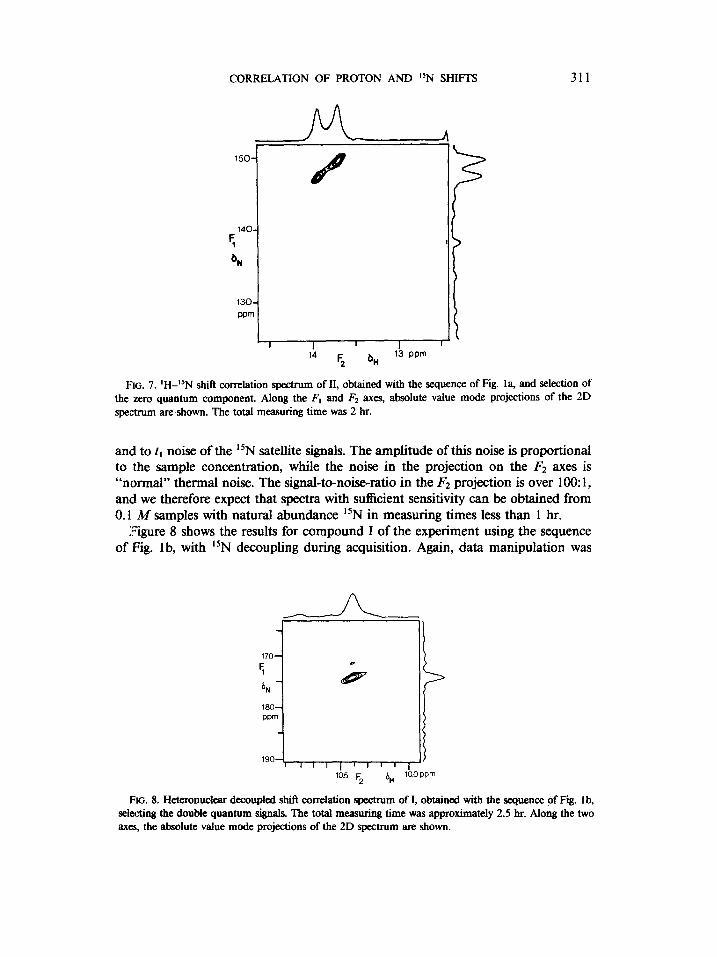
Figure 7 shows the result of the experiment of Fig. la applied to compound II. The proton pulse flip angle was set to 45” and 800 transients were recorded for each tl value and 32 tl increments of 1 msec each were used, giving a total measuring time of 2 hr. Along the sides of the spectrum, which is derived from the zero quantum spectrum, the absolute value mode projections are shown. It appears that the noise in the projection on the I;, axis is much larger than in the projection on the FZ axis. This is again, mainly due to incomplete suppression of the protons coupled to 14N,
1a5 F 10.0 2 4"
FIG. 6. Hete-ronuclear shit? correlation spectrum obtained from the same data matrix as Fig. 5a, by using data manipulation as described in the text, to remove the proton shift contribution From the F, dimension. Along the F, and F2 axes, the absolute value mode projections of the spectrum are shown.
CORRELATION OF PROTON AND ‘>N SHIFTS 311
FIG. 7. ‘H-15N shift correlation spectrum of II, obtained with the sequence of Fig. la, and selection of the zero quantum component. Along the F, and Ft axes, absolute value mode projections of the 2D spectrum are shown. The total measuring time was 2 hr.
and to t, noise of the i5N satellite signals. The amplitude of this noise is proportional to the sample concentration, while the noise in the projection on the F2 axes is “normal” thermal noise. The signal-to-noise-ratio in the F2 projection is over 100: 1, and we therefore expect that spectra with sufficient sensitivity can be obtained from 0.1 M samples with natural abundance “N in measuring times less than 1 hr.
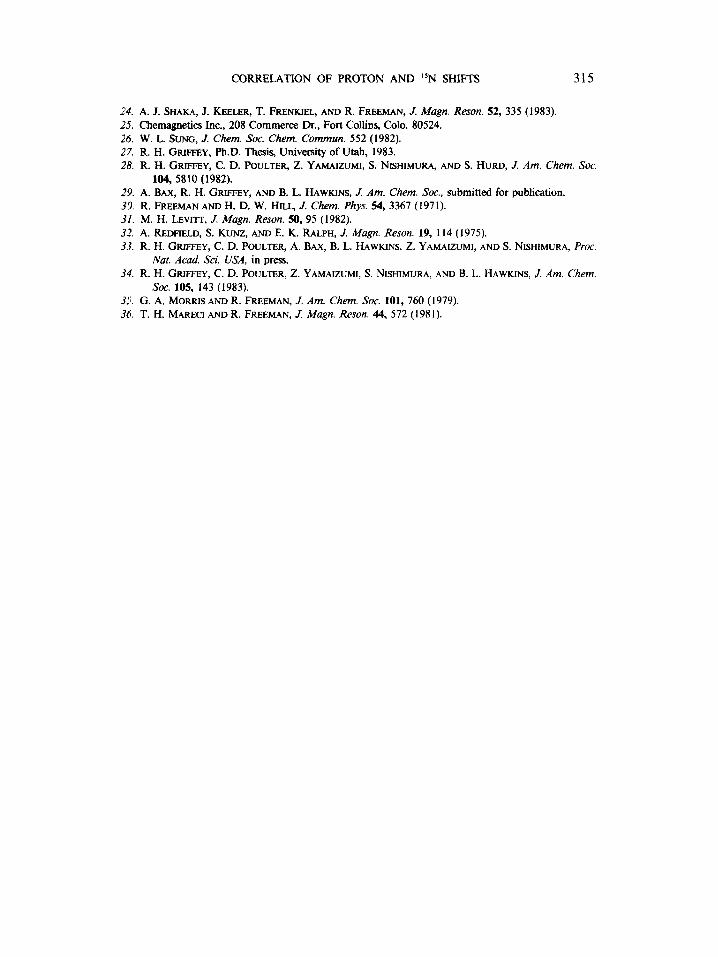
IFigure 8 shows the results for compound I of the experiment using the sequence of Fig. 1 b, with “N decoupling during acquisition. Again, data manipulation was
170-
5
44
dh
180- PPm
1907 , , , , , , ( , ,I
10.5 F2 SH 10.0 PPm
FIG. 8. Hetexonuclear decoupled shift correlation spectrum of I, obtained with the sequence of Fig. 1 b, selecting the double quantum signals. The total measuring time was approximately 2.5 hr. Along the two axes, the absolute value mode projections of the 2D spectrum are shown.

312 BAX, GRIFFEY, AND HAWKINS
used to eliminate the effect of ‘H shift in the F, dimension. The total measuring time and parameter choices were identical to those of the spectra in Figs. 5 and 6. As expected, the sensitivity of the spectra of Fig. 8 is considerably higher compared with the spectrum of Fig. 6. However, in cases where suppression of the signals from protons coupled to 14N is a problem, the sequence of Fig. la could be preferred, since the nonsuppressed signals give rise to t, noise (1) on F, traces different from where the “N satellites appear, which are displaced by +JNH/2 in the Fz dimension (Fig. 5).
Figure 9 shows the results of the scheme of Fig. Id, which gives a conventional heteronuclear shift correlation spectrum of the doubly r5N-labeled compound, III (Fig. 4). Sixty-four I, increments of 0.68 msec each were used, giving a spectral width of +735 Hz in the F, dimension. Four transients were recorded for each t, value, and the total measuring time was approximately 3 min. While the “N resonances are more than 500 Hz off resonance and the “N field strength equals only 520 Hz, the experiment works very well, with only a small loss in sensitivity (on the order of 10%) compared with on-resonance 15N irradiation. This results from the self-com- pensating effect of a 90” pulse for rf offset effects (30, 31). In this experiment, high power proton pulses (20 KHz rf field strength) were used. A large proton rf field strength is necessary in this experiment to ensure proper proton spin inversion by the proton 180” pulse, applied at the midpoint of the evolution period.
Finally, Fig. 10 shows the heteronuclear shift correlation spectrum of tRNAp, obtained with the sequence of Fig. lb, and phase cycling in such a way that the double quantum signals are selected. Sixteen t, increments of 0.8 msec each were used, giving a spectral width of +625 Hz in the F, dimension. A Redfield 2-l-4 sequence (32) was used for generating a 45” proton pulse with suppression of the
- 140
5
- 150
160
i’c ppm
FIG. 9. Heteronuclear shill correlation spectrum of III, obtained with the sequence of Fig. Id. The total measuring time was approximately 3 min. Along the F2 axis, the conventional one-dimensional proton spectrum is shown, while along the F, axis, the absolute value mode projection of the 2D spectrum on this axis is shown.

CORRELATION OF PROTON AND “N SHIFTS 313
“I-“. 160 wm
IS. 10. ‘H-15N shift correlation spectrum of a 0.7 mM 92% HrO/S% DrO solution of tRNAy*, labeled with 65% r5N at N3 of all tbe uridine related bases in a 200 pl microcell at 15°C. The spectrum was obtained with the sequence of Fig. lb, and selection of the double quantum component. Due to proton exchange and partial decomposition of the sample, peaks vary in intensity. The peak of the U27-A43 base pair (6n = 12.7 ppm) disappears at temperatures higher than 15’C. Along the F, and F2 axes, the absolute valne mode projections of the 2D spectrum are shown. The total measuring time was 6 hr.
HI0 signal. Six thousand transients were recorded for each t, value, giving a total measuring time of approximately 6 hr. The spectral width in the F2 dimension was set to k5 kHz, to prevent spurious nonsuppressed signals from folding into the spectral region of interest. The F2 region containing the imino proton signals was corrected for linear baseline distortion3 from the tail of the Hz0 line, before the frequency- dependent phase correction was applied. After transposition, the 16 complex C, data points were zero filled to 128 complex data points before Fourier transformation and magnitude calculation. Gaussian line broadening functions, corresponding to ap- proximately 30 Hz broadening in the F2 dimension and 15 Hz in the F, dimension we:re used to improve the sensitivity. All the “N chemical shifts measured from the spectrum of Fig. 10 are in good agreement (33) with values measured with double resonance difference spectroscopy (DRDS) (34). The only discrepancy is a constant shift for all “N resonances of 4.8 ppm upfield, due to a miscalibration of the NH3 reference frequency in earlier measurements (34). Intensities of the six peaks in the 2D spectrum of this sample strongly differ because of differences in the proton exchange rates, and partial decomposition of the sample.
We have demonstrated that multiple quantum NMR can be used to correlate ‘H and 15N chemical shifts in natural abundance samples, and that the sequences can be used in aqueous solutions. Using arguments given by Minoretti et al. (6), it follows
3 ‘Of course, both the real and imaginary part of the spectrum have to be corrected for baseline distortion.

314 BAX, GRIFFEY, AND HAWKINS
that the sensitivity of indirect “N detection via multiple quantum NMR is at least an order of magnitude better than INERT-enhanced (35) detection of “N signals. The exploitation of this potential gain in sensitivity depends on technical limitations of the spectrometer, such as dynamic range and suppression of unwanted signals. However, the inherent sensitivity and simplicity of the experiment promise great applicability in studies of biological and chemical systems where observation of “N chemical shifts has proven time-consuming or impossible because of the low natural abundance and low NMR sensitivity of “N. In principle, N-H2 pairs can be studied in the same experiment as N-H pairs, but the rather large difference in chemical shift of “N for the two pairs and the low 15N radiofrequency field strength made this impossible in our experimental setup. In analogy with an experiment described by Mareci and Freeman (36), ‘H-15N coupling constants can be measured from the shift correlation spectra, obtained with the sequences of Figs. la and Id. On a 360 MHz spectrometer, using 5 mm sample tubes, 2D 15N-‘H shift correlation spectra with sufficient signal-to-noise can be recorded on 0.1 A4 samples with natural abundance 15N or on 0.3 mit4 15N-labeled samples, in measuring times on the order of 1 hr.
ACKNOWLEDGMENTS
The authors acknowledge stimulating discussions with Professor Gary E. Maciel and Professor Alfred G. Redheld. Experiments were performed at the Colorndo State University Regional NMR Center, supported by NSF Grant CHE-8208821. R.H.G. was supported by NSF Grant PCM 79-16861, awarded by C.D. Poulter. A.B. acknowledges support from the Department of Energy (Laramie Energy Technology Center).
REFERENCES
1. A. A. MAUDSLEY AND R. R. ERNST, Chem. Phys. Lett. 50,368 (1977). 2. A. A. MAUDSLEY, L. MULLER, AND R. R. ERNST, J. Mugs. Reson. 28,463 (1977). 3. See, for example: A. BAX, “Two-dimensional Nuclear Magnetic Resonance in Liquids,” pp. 64-65,
Reidel, Boston, 1982. 4. G. B~DENHAUSEN AND D. J. RUBEN, Chem. Phys. Lett. 69, 185 (1980). 5. A. G. REDFIELD, Chem. Phys. Lett. %, 537 (1983). 6. A. MINORED, W. P. AUE, M. REINHOLD, AND R. R. ERNST, J. Magn. Reson. 40, 175 (1980). 7. L. MOLLER, .I. Am. Chem. Sot. 101,4481 (1979). 8. G. BODENHAUSEN, Prop. NMR Spectrosc. 14, 137 (1981). 9. P. H. BOLTON, J. Mu@. Reson. 52, 326 (1983).
10. R. FREEMAN, T. H. MARFKI, AND G. A. MORRIS, J. Magn. Reson. 42, 341 (1981). 11. M. R. BENDALL, D. T. PEGG, AND D. M. DODDRELL, J. h4agn. Reson. 45, 8 (1981). 12. M. R. BENDALL, D. T. PEGG, AND D. M. DODDRELL, J. Magn. Reson. 52, 81 (1983). 13. J. JEENER, private communication, 1981. 14. A. BAX, J. Magn. Reson. 52,76 (1983). 15. G. BODENHAUSEN, R. L. VOLD AND R. R. VOLD, J. Magn. Resort. 37, 93 (1980). 16. R. FREEMAN AND G. A. MORRIS, Bull. Magn. Reson. 1, 5 ( 1979). 17. R. FREEMAN, Proc. Roy. Sot. London Ser. A 373, 149 (1980). 18. A. BAX AND G. A. MORRIS, J. Mngn. Reson. 42, 501 (1981). 19. P. H. BOLTON, J. Mugn. Reson. 48, 336 (1982). 20. L. MOLLER, J. Magn. Resort. 36, 301 ( 1979). 21. A. BAX, Internal Report, Del& University of Technology, 1978. 22. A. G. REDFIELD, private communication. 23. R. R. ERNST AND W. A. ANDERSON, Rev. Sci. Instrum. 37, 93 (1966).
CORRELATION OF PROTON AND “N SHIFTS 315
24. A. J. SHAKA, J. KEELER, T. FRENKIEL, AND R. FREEMAN, J. Mum. Reson. 52, 335 (1983). 25. Chemagnetics Inc., 208 Commerce Dr., Fort Collins, Colo. 80524. 26. W. L. SUNG, J. Chem. Sot. Chem. Commun. 552 (1982). 27. R. H. GRIFFEY, Ph.D. Thesis, University of Utah, 1983. 28. R. H. GRIMY, C. D. POULTER, Z. YAMAIZUMI, S. NISHIMIJRA, AND S. HURD, J. Am. Chem. Sot.
104, 5810 (1982). 29. A. BAX, R. H. GRIFFEY, AND B. L. HAWKINS, J. Am. Chem. Sot.. submitted for publication. 30. R. FREEMAN AND H. D. W. HAL, J. Chem. Phys. 54, 3367 (1971). 3Z. M. H. LEVI?T, J. Mum. Reson. 50, 95 (1982). 3.?. A. REDFIELD, S. KUNZ, AND E. K. RALPH, J. Mu@. Reson. 19, 114 (1975). 3.1. R. H. GRIFFEY, C. D. POULTER, A. BAX, B. L. HAWKINS, Z. YAMAIZUMI, AND S. NISHIMURA, Proc.
Nat. Acad. Sci. USA, in press. 34. R. H. GRIF~Y, C. D. POULTER, Z. YAMAIZUMI, S. NISHIMURA, AND B. L. HAWKINS, J. Am. Chem.
Sot 105, 143(1983). 31;. G. A. MORRIS AND R. FREEMAN, J. Am. Chem. Sot. 101, 760 (1979). 36. T. H. MARECI AND R. FREEMAN, J. Mu@. Reson. 44, 572 (198 1).