the properties of proton-proton interactions
TRANSCRIPT
Nuclear Physics B43 (1972) 477-521 . North-Holland Publishing Company
T H E PROPERTIES OF PROTON-PROTON I N T E R A C T I O N S
BETWEEN 1 O0 AND 1000 GeV
FROM A COSMIC-RAY EXPERIMENT *
L.W. JONES, A.E. BUSSIAN, G.D. DEMEESTER **, B.W. LOO, D.E. LYON, Jr., P.V. RAMANA MURTHY ***,
R.F. I~OTH~: and P.R. VISHWANATH The University of Michigan, Ann Arbor, Michigan 48104,
J.G. LEARNED, D.D. RF_JEDER and R.J. WILKES University of Wisconsin, Madison, Wisconsin 53 706,
K.N. ERICKSON ~ :~ Colorado State University, Fort Collins, Colorado 80521,
F.E. MILLS Brookhaven National Laboratory, Upton, New York 11973,
B. CORK Argonne National Laboratory, Argonne, Illinois 60439
Received 28 February 1972
Abstract: Proton-proton interactions above 100 GeV have been studied in an experiment using cosmic-ray protons interacting in a liquid hydrogen target. From several hundred hydro- gen interactions, it has been learned that: (a) the total inelastic pp cross section is not changing significantly with energy above 30 GeV; (b) the multiplicity distributions of charged prongs agree with a Poisson distribution in charged-particle pairs; (c) the average charged prong multiplicity increases as in s; (d) the angular distribution of charged parti- cles agrees with a c.m. momentum distribution of charged particles that varies as exp exp [ - 8 p ~ - 8 x 2] d3p/E (where x = PL/Po) and a nucleon distribution that varies as 10x exp [ - 3 p~] d3p/E for 0.05 < x < 0.85. Further properties of the angular distribu- tions, characteristics of the ionization calorimeter, the cross section in iron, and other features of the data are reported.
* Supported by the U S National Science Foundation. ** Now at Raytheon Corporation, Waltham, Massachusetts.
*** Now at Tata Institute for Fundamental Research, Bombay, India. $ Now at Eastern Michigan University, Ypsilanti, Michigan. ~ Now at Augsburg College, St.Paul, Minnesota.
478 L.W. Jones et al., Cosmic-ray experiment
1. INTRODUCTION
An experiment has been performed using cosmic rays through a liquid hydrogen target to study the nature of proton-proton interactions over the energy range from 100 to 1000 GeV. The experiment was carried out at Echo Lake, Colorado at 3230 m elevation, or a depth in the atmosphere of 715 g. cm -2 . The experiment, employing spark chambers and an ionization calorimeter as detectors, had no mag- netic analysis and consequently was unable to study individual reaction product mo- menta. The parameters of the p-p interaction studied and reported here are the total inelastic cross section, the charged prong number distributions from inelastic inter- actions, the average charged multiplicity versus energy, and the projected angular distributions.
Preliminary results of this experiment have been reported in short letters [ 1,2 ] and at various conferences [ 3-8 ]. Some theoretical interpretations have also been published and compared with these data [ 9 - 1 2 ]. More details of some aspects of the experiment are contained in two unpublished doctoral theses [ 13,14 ]. This paper is a comprehensive description of the experiment and methods of analysis as well as results and interpretations.
The emphasis here has been on inclusive parameterization of the data; little at- tempt was made to study individual events or individual subsets of reactions. The philosophy here is that for any experiment, however complete the data collected, a meaningful interpretation of the data or comparison with theory requires pro- jecting out from the total data certain parameters or observables which are sensitive to details of the theory. In this case, the limitations of this experiment selected a particular projection prior to observation, so that the observables already represent a constrained pararneterization of the total information. The hope - and indeed the conclusion - is that these constrained observables (e.g., angular distribution with- out momenta) are sensitive to the details of various models.
Additional data were taken on the cross section in iron, as determined from atten- uation in the calorimeter. Limits to the inelastic cross section in air were found from the zenith angle distributions of incident flux. Energies were determined by totally absorbing the hadronic cascade in a large iron block (about 100 t) and sampling the energy loss with layers of plastic scintillator. A study of this device (variously refer- red to as an ionization calorimeter, total absorption spectrometer (TAS), total ab- sorption nuclear cascade (TANC), or hadrometer) is also briefly reported.
2. APPARATUS
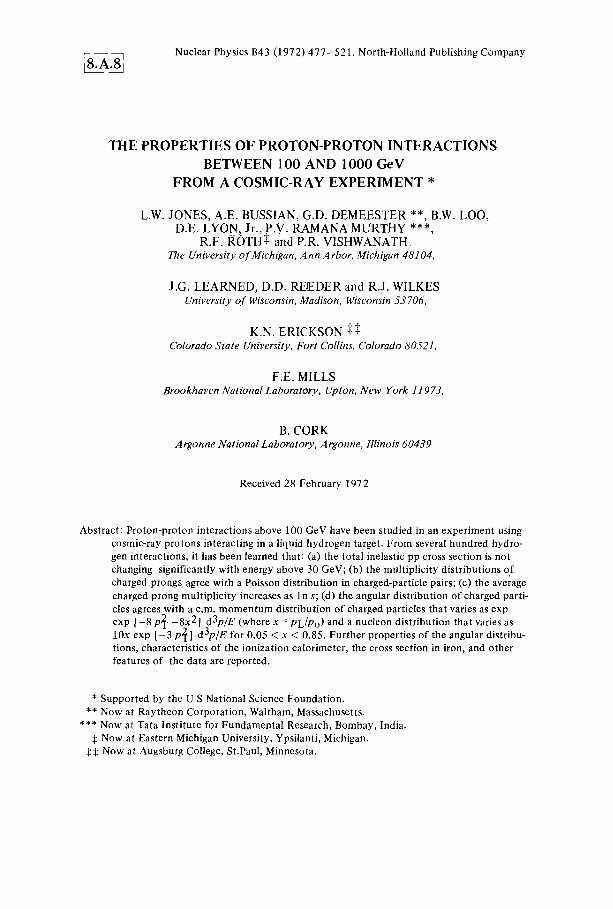
The apparatus, illustrated schematically in fig. 1, consisted of wide-gap optical spark chambers above and below a liquid hydrogen target, all placed above an ioni- zation calorimeter which contained in its upper layers narrow-gap optical spark chambers.
L. W. Jones et al., Cosmic-ray experiment 479
EXPERIMENTAL ARRANGEMENT
FRONT VIEW
/
o ~? a 9 ~ 4o / INCHES /
T o = - - I TOP COUNTER /
/ WIDE GAP y. SPARK CHAMBER
STAINLESS STEEL ~ - - ~ _ ~ _ FLASK ~ ,~ ~ SHOWER
COINCIDENCE
L ~ . . . . . ~ / W,OE GAP / /r / ~ ~ , / SPARK CHAM"E R /
= : ~ t / ~ ~ ] IRON PLATE f l - - - ~ - ; ~ - _ ~ U ~ NARROW GAP
L~MBER 'S)
]ON ".'TER S OF S IN :m !
IRON I SCINTILLATOR
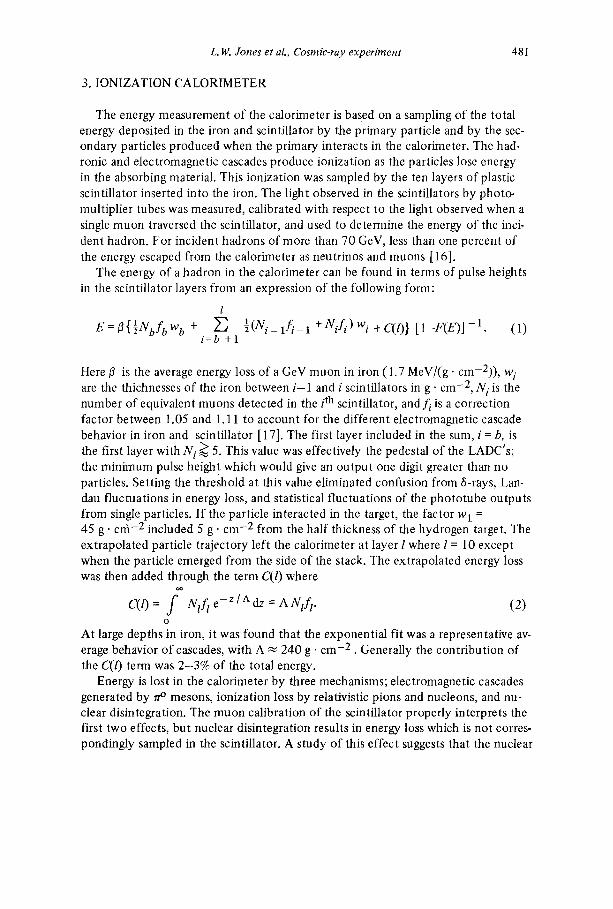
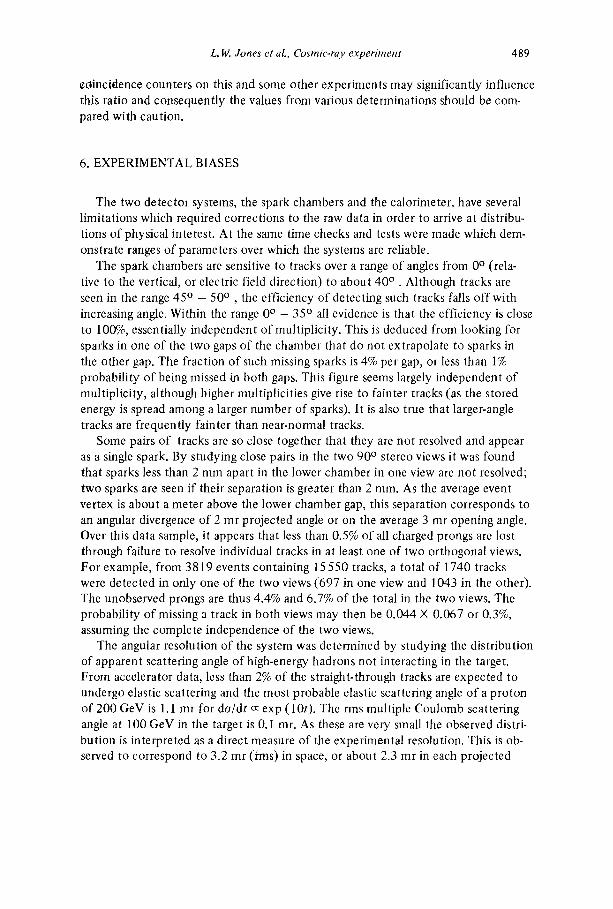
Fig. 1. Vertical section of the experimental configuration.
2 . The wide-gap chambers were 2.0 × 2.0 m m area and each consisted of two
20.3 cm gaps with electrodes of 51 pm hardened aluminiurn. The side walls were of 1.25 cm plate glass with two fiducial crosses etched onto each glass plate. Assembly was affected with Dow Corning Silastic RTV 891. Each two-gap chamber was pul- sed by an 8 stage Marx generator; each stage was a 3900 pf, 30 kV capacitor. Typi- cal operation was at 1 3 - 1 5 kV/stage.
The target, in the form of a short vertical cylinder with twin domes of spherical sections on either end, had a capacity of about 18001 of liquid hydrogen. The out- er vacuum jacket domes were of 6.6 mm 'aluminum and the inner flask domes were of 1.2 mm stainless steel. The central thickness of the target was about 80 cm, and
480 L. W. Jones et al., Cosmic-ray experiment
the average path length of an incident proton in liquid hydrogen during the 7 month data run was 55 cm. Superinsulation (25 layers of 20/lm aluminized mylar) in the evacuated space between jacket and flask helped to reduce the radiation heat leak to an ambient boiloff rate of 6 5 - 7 0 1 per d. At 7 to 10 d intervals liquid hydrogen was added to replace the lost liquid. Careful venting and extensive safety precautions were employed, and 24 hour-a-day surveillance of the system was maintained during hydrogen operation.
Below the lower wide-gap chamber were 200 g • c m - 2 of copper-clad iron plates of 2.0 × 2.5 m 2 each 12 mm thick. These were assembled as a ten-gap optical spark chamber with 1.9 cm gaps and two iron plates (20 g • cm - 2 ) between gaps. Below this was the remainder of the calorimeter, 2.5 × 2.5 m 2 in area and 930 g • cm - 2 thick of iron assembled from 12.7 mm steel plates. There was a total of 34 g • c m - 2 of scintillators in the stack.
The wide-gap and narrow-gap chambers were photographed in 90 ° stereo with 65:1 demagnification using 35 mm sprocketed Kodak Tri-X and Linograph Shell- burst film in Flight Research model 207 cameras with 125 mm objective lenses op- erated between f/8 and f/11. Each chamber was photographed through two plane mirrors.
The calorimeter employed ten layers of plastic scintillation counters; each layer was made of two equal counters side by side. The top two layers were each com- posed of two 91 X 183 cm 2 counters employing four RCA 6810A phototubes. The eight phototubes from each layer were connected in parallel, with passive addition of the pulses from each tube. The lower eight counter layers of the calorimeter were each pairs of 122 × 244 cm 2 scintillation counters each with four EMI 9618B pho- tomultipliers. The ten layers were at depths in the iron of 40, 120, 210, 330, 450, 570, 690, 810, 970 and 1130 g • cm -2. A 183 × 183 cm 2 counter above the top spark chamber, the top counter, was included in the trigger logic, and four groups of scintillation counters totalling 7.68 m 2 area were deployed around the target mid-plane to veto air shower triggers. The calorimeter-top counter system had an ef- fective admittance of 0.94 m2"sr through layer 8 of the calorimeter.
In operation, a trigger was derived from a coincidence between the top counter and a weighted sum of the top nine calorimeter layers using signals from the last dy- nodes of 72 calorimeter phototubes with the shower veto counters in anticoinci- dence. When a trigger was received the summed anode signals from each of the ten layers were recorded on magnetic tape using 7 bit (127 channel) logarithmic analog- to-digital converters (LADC). Periodically, the system was calibrated by triggering on single-particle pulses in coincidence from the top counter, layers 1, and 10 and exploring the pulse-height distributions (through amplifiers) from each layer. These muon distributions were then used to calibrate the calorimeter, and hadron ener- gies were computed as discussed below (sect. 3). Care was taken that the photomul- tiplier tubes were operated in their linear range so that pulses corresponding to over 1000 equivalent muons gave a tube output of the order of one volt. Each event was labeled with a binary number using a light code photographed with the chambers and simultaneously recorded on the magnetic tape record [ 15].
L. W. Jones et aL, Cosmic-ray experiment 481
3. IONIZATION CALORIMETER
The energy measurement of the calorimeter is based on a sampling of the total energy deposited in the iron and scintillator by the primary particle and by the sec- ondary particles produced when the prhnary interacts in the calorimeter. The had- ronic and electromagnetic cascades produce ionization as the particles lose energy in the absorbing material. This ionization was sampled by the ten layers of plastic scintillator inserted into the iron. The light observed in the scintillators by photo- multiplier tubes was measured, calibrated with respect to the light observed when a single muon traversed the scintillator, and used to determine the energy of the inci- dent hadron. For incident hadrons of more than 70 GeV, less than one percent of the energy escaped from the calorimeter as neutrinos and muons [ 16].
The energy of a hadron in the calorimeter can be found in terms of pulse heights in the scintillator layers from an expression of the following form:
l
E ~{½NbfbWb + ~ ' = i ( N i - l f i - 1 +Nif i ) wi + C(l)} [1-F(E)] 1. (1) i=b +1
Here/3 is the average energy loss of a GeV muon in iron (1.7 MeV/(g • cm-2)), w i are the thichnesses of the iron between i -1 and i scintillators in g • cm -2, N i is the number of equivalent muons detected in the i th scintillator, and f~ is a correction factor between 1.05 and 1.11 to account for the different electromagnetic cascade behavior in iron and scintillator [ 17]. The first layer included in the sum, i = b, is the first layer with N i ~ 5. This value was effectively the pedestal of the LADC's; the minimum pulse height which would give an output one digit greater than no particles. Setting the threshold at this value eliminated confusion from &rays, Lan- dau fluctuations in energy loss, and statistical fluctuations of the phototube outputs from single particles. I f the particle interacted in the target, the factor w 1 = 45 g • crfi -2 included 5 g • cm -2 from the half thickness of the hydrogen target. The extrapolated particle trajectory left the calorimeter at layer l where l = 10 except when the particle emerged from the side of the stack. The extrapolated energy loss was then added through the term C(I) where
C(l) = f N t f l e - Z / Adz = A N l f l. (2) 0
At large depths in iron, it was found that the exponential fit was a representative av- erage behavior of cascades, with A ~ 240 g • cm -2 . Generally the contribution of the C(l) term was 2 - 3 % of the total energy.
Energy is lost in the calorimeter by three mechanisms; electromagnetic cascades generated by ~r ° mesons, ionization loss by relativistic pions and nucleons, and nu- clear disintegration. The muon calibration of the scintillator properly interprets the first two effects, but nuclear disintegration results in energy loss which is not corres- pondingly sampled in the scintillator. A study of this effect suggests that the nuclear
482 L. W. Jones et al., Cosmic-ray experiment
03 Z 0
n " h i 113
Z
F-" Z LU ..J <~ >
B
IO00 r
IOC
I000
IOC
/NO/V/DUAL EVENT IONIZATION CURVES ENERGIES AROUND 500 GBV
,00 6oo 8oo 1ooo ,2~
E~r4 N u ~ r 202330 457 GoV
260 *&o ~ ~ ,obo ,~
I000
lOG
I00~
I00[
/ / ,or E~#nt N u ~ 112266 53B ~ V
~ 400 600 B00 IO~D 12001
g~nt Numb#r 002540 532 GaY
9 Ct~rged S ~ d ~ l ~ s
200 400 6()0 860 i I000 1200 DEPTH IN CALORIMETER (gm/cm 2)
I000
IO0
\ \
E~nt Numb~ 10~34 ¢6P G~F x
2C30 4;0 1 8~)0 I000 600 1200
A X~x
\
C ~ , V u , ~ t 2'e4/P7 5 ~ GeV
I000 1200
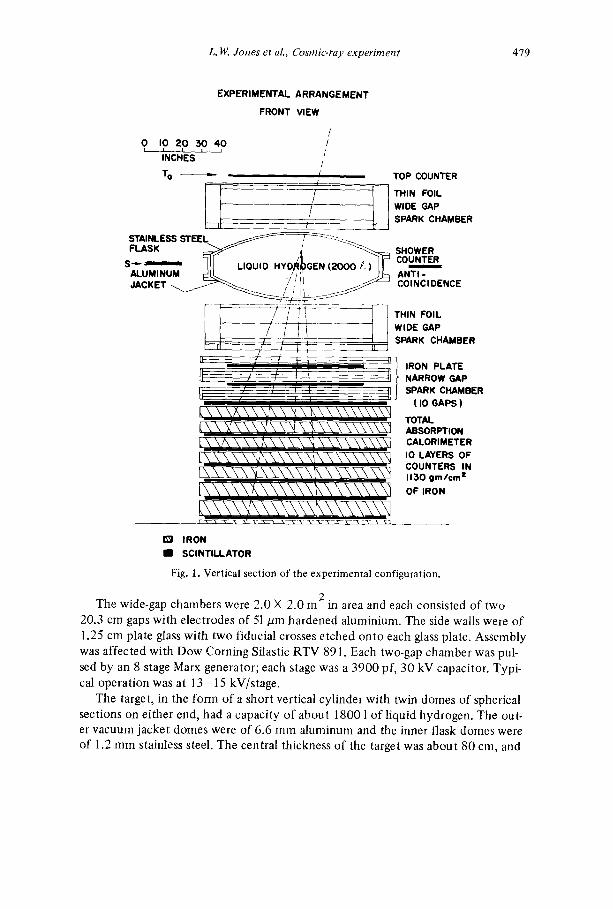
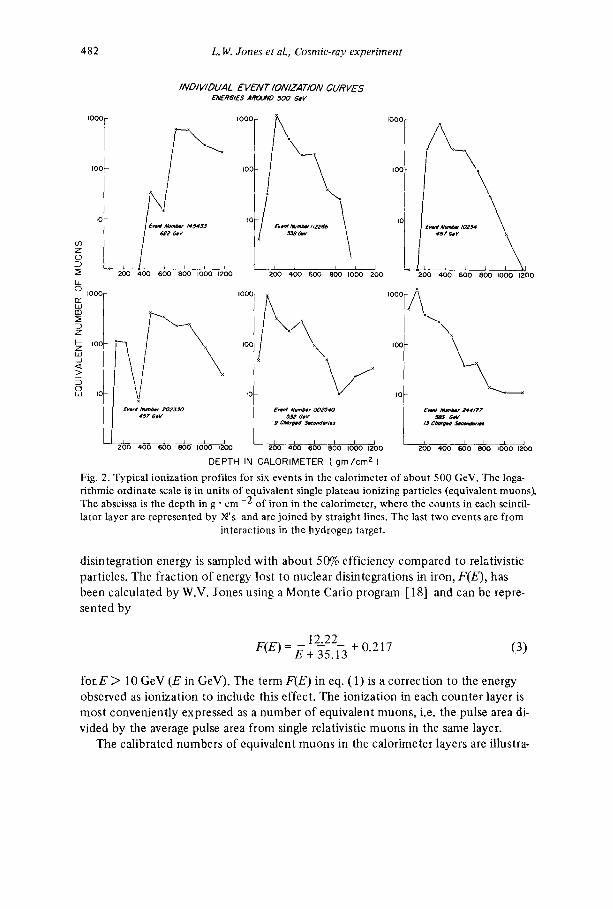
Fig. 2. Typical ionization profiles for six events in the calorimeter of about 500 GeV. The loga- rithmic ordinate scale is in units of equivalent single plateau ionizing particles (equivalent muons). The abscissa is the depth in g • cm - 2 of iron in the calorimeter, where the counts in each scintil- lator layer are represented by ~ ' s and are joined by straight lines, The last two events are from
interactions in the hydrogen target.
disintegration energy is sampled with about 50% efficiency compared to relativistic particles. The fraction of energy lost to nuclear disintegrations in iron, F(E), has been calculated by W.V. Jones using a Monte Carlo program [18] and can be repre- sented by
12.22 F(E) =E + 35.1i + 0.217 (3)
forE > 10 GeV (E in GeV). The term F(E) in eq. (1) is a correction to the energy observed as ionization to include this effect. The ionization in each counter layer is most conveniently expressed as a number of equivalent muons, i.e. the pulse area di- vided by the average pulse area from single relativistic muons in the same layer.
The calibrated numbers of equivalent muons in the calorimeter layers are illustra-
L. IV. Jones et aL, Cosmie-rav experiment 483
iooo ~..I-______L~ ,
Ill f "
;,o L~
, . o . . . . . . oo . . . . ?00 400 6 800 OEPTH m CALORiMEtER (gm/cm2 /
SHOWER CURVES
\+-...
1ooo 12oo
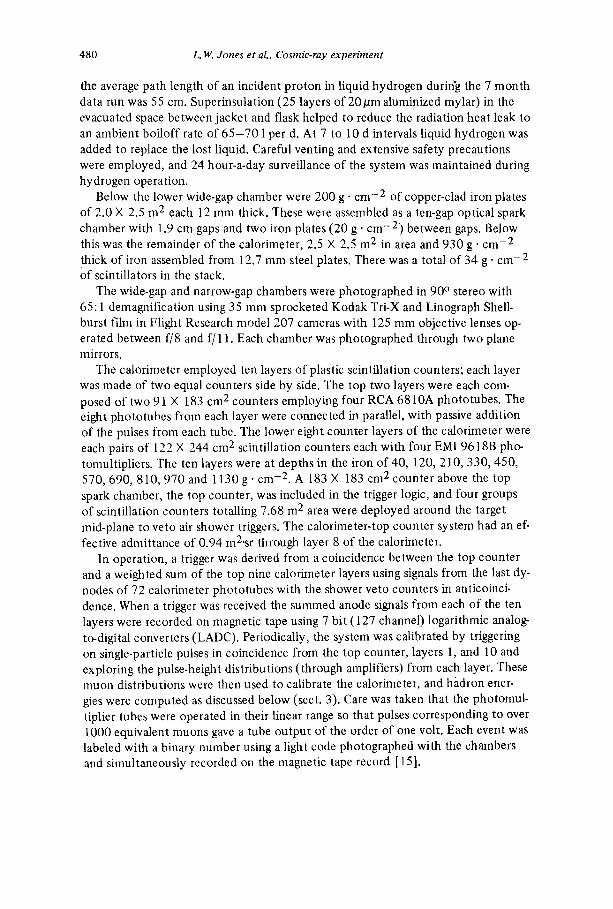
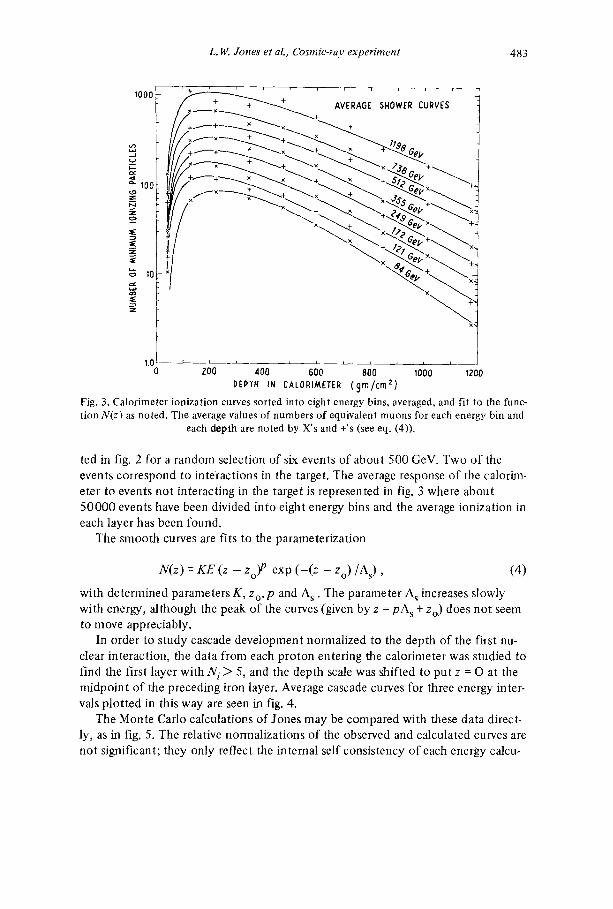
Fig. 3. Calorimeter ionization curves sorted into eight energy bins, averaged, and fit to the func- tion N(z) as noted. The average values of numbers of equivalent muons for each energy bin and
each depth are noted by X's and +'s (see eq. (4)).
ted in fig. 2 for a random selection of six events of about 500 GeV. Two of the events correspond to interactions in the target. The average response of the calorim- eter to events not interacting in the target is represented in fig. 3 where about 50000 events have been divided into eight energy bins and the average ionization in each layer has been found.
The smooth curves are fits to the parameterization
N ( z ) = K E (z - zo)P exp ( - ( z - Zo)/As) , (4)
with determined parameters K, Zo, p and A s . The parameter A s increases slowly with energy, although the peak of the curves (given by z = pA s + Zo) does not seem to move appreciably.
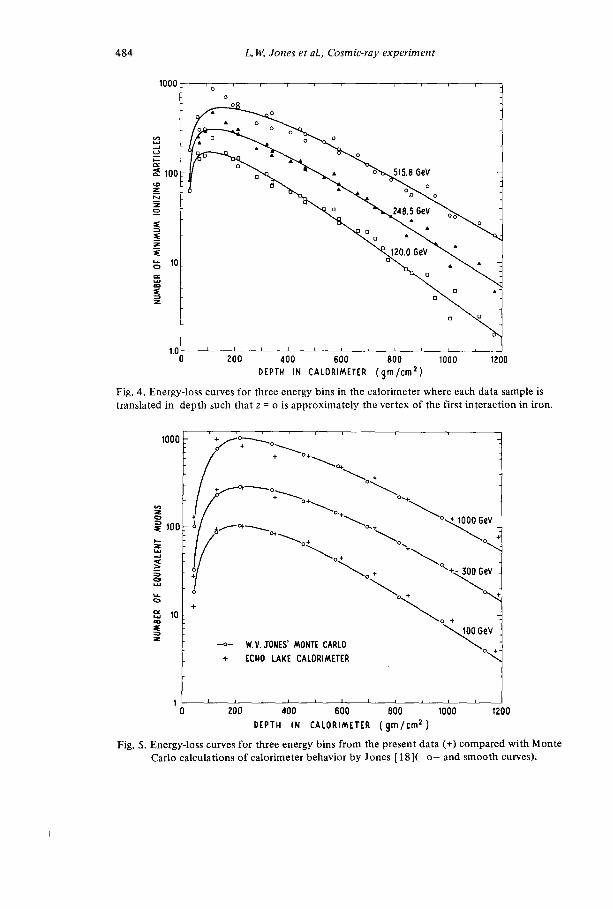
In order to study cascade development normalized to the depth of the first nu- clear interaction, the data from each proton entering the calorimeter was studied to find the first layer with N i > 5, and the depth scale was shifted to pu t z = O at the midpoint of the preceding iron layer. Average cascade curves for three energy inter- vals plotted in this way are seen in fig. 4.
The Monte Carlo calculations of Jones may be compared with these data direct- ly, as in fig. 5. The relative normalizations of the observed and calculated curves are not significant; they only reflect the internal self consistency of each energy calcu-
484 L. W. Jones et al., Cosmic-ray experiment
1000 ' o o . . . .
o o
v2, o o
100
~- 10 u °L "<. ~ [1 D •
1.0 0 ZOO 400 600 800 1000 1?00
DEPTH IN CALORIMETER (grn/cmZ)
Fig. 4. Energy-loss curves for three energy bins in the calorimeter where each data sample is translated in depth such that z = o is approximate ly the vertex of the first interaction in iron.
1000
~ 1 0 0
..J
L.u
10 e D
, , , , , , , ,
+ ° ~ o o / " + ~ . . . o , ~
/ ~---~ °*~o÷ o ÷ ~ ° ~ ' k
o.+ ~o -< 1000 Ge~,
/f°~-~O+~o+ °-*...... ° ~ o . ~o~. "+~ +
~ o + - 300 Ge~
- o - W, V. ,,TONES' MONTE CARLO o,
+ ECHO LAKE CALORIMETER
I I L I I I t ~ I t l
1 0 ZOO 400 600 8 0 1000 1200
DEPTH IN CALORIMETER ( 9 m / c m 2)
Fig. 5. Energy-loss curves for three energy bins f rom the present data (+) compared with Monte Carlo calculations of calorimeter behavior by Jones [ 1 8 ] ( - o - and smooth curves).
L. W. Jones et aL, Cosmic-ray experiment 485
lation. The shapes are significant and the good agreement suggests that the funda- mental energy loss mechanisms are correctly understood. However,no direct mea- sure of the energy calibration or energy resolution is yet available at these energies.
Lateral leakage of fast neutrons and ofpions below about 1 GeV, and residual uncertainties in the nuclear disintegration effects could lead to systematic energy uncertainties of perhaps as great as 20% and indeed there is evidence (sect. 6) that energy is detected with different efficiencies for particles interacting in the calorim- eter compared to those interacting above it in the liquid hydrogen. In addition, close inspection of figs. 3,4 and 5 suggests possible systematic fluctuations from lay- er to layer; possible evidence for an undetected bias in the calibration procedure. The Monte Carlo ~mulation gives a standard deviation of the statistical energy uncertain- ty of 15% at 100 GeV, falling to 8% at 1000 GeV. Including calibration and instru- mental uncertainties, a more conservative resolution of 20% has been assumed, and consequently data has been sorted into energy bins of width no less than -+ 20% of the central value.
4. DATA COLLECTION AND ANALYSIS
The experiment was operated October 1968 - May 1969 with hydrogen contin- uously in the target. Except for rare interruptions the system was on about 95% of the time. A total of 146 000 event triggers were collected over this period, although over 25 000 were special purpose triggers such as the neutral-charge ratio study not- ed below. Muon calibration runs are not included in these numbers. Film was devel- oped at the Argonne National Laboratory and the magnetic tapes were processed and edited at the National Center for Atmospheric Research in Boulder.
All of the film was scanned for straight tracks and for interactions, projecting both stereo views of the same event simultaneously. Interactions were digitized at the University of Wisconsin, using 1/~m least count measuring microscopes. Eight points on each spark were recorded. Non-interacting events were digitized at the Uni- versity of Michigan, using the Michigan Automatic Scanning System (MASS) pro- grammed-spot digitizer. The 4096 raster corresponded to about 10/~m least count and averaging effectively expanded this to 5/~m. For the automatically-digitized straight tracks 13 coordinates were recorded on each spark.
Both measuring systems were calibrated from digitizations of film taken with a fiducial grid placed in front of the chambers. In the case of straight-through tracks and for the incident track in the upper chamber of interacting events, the stereo in- formation gave the space angles and coordinates. In the case of interactions the sev- eral tracks in the lower chamber were separately digitized in the two views and no attempt was made to correlate tracks from the two views. The vertex of the interac- tion was located using a best fit to measurements from both views.
Data were taken under two threshold conditions; the majority of the data was collected with a 90 GeV calorimeter threshold while a smaller fraction of running
486 L. W. Jones et al., Cosmic-ray experiment
was done with a 36 GeV threshold. These two threshold values are approximate and are derived from the summed (dynode) calorimeter signal through a discriminator. As the energy derived from the summed signal is very sensitive to relative time jitter of various pulses, scintillator non-uniformity, etc., the energy values derived from applying eq. (1) to the 10 separate LADC digitized outputs was considered far more reliable. (The LADC's digitized pulse areas, not heights.) The large scintillators gave a position-dependent pulse height and so a quadratic correction was applied to the output based on the extrapolation of the incident track into that layer of scintalla- tor. As a consequence the derived energies from a run at a given nominal threshold were distributed above and below that threshold, and only fell on a seemingly un- biased spectrum for energies greater than about 1.5 times the nominal threshold. For cross section determinations, data were only used with energies above 2 times the nominal threshold, as this determination is very sensitive to threshold biases. For multiplicity and angular distributions, data were used with energies above 1.4 times the nominal threshold, as they are relatively less sensitive to energy biases.
Data were also limited by fiducial cuts to particles whose trajectories passed through the top counters, within 1.44 cm of the edge of the calorimeter layer two counter and within 11.9 cm of the edge of the calorimeter layer eight counter.
Events containing more than one entering track which, when extrapolated, pen- etrated the sensitive volume of the calorimeter were rejected, unless the additional tracks were obvious 6-ray.
Numerically, about 60% of the triggers (film frames) contained events which were useful based on scanning criteria. Of these, about 60% satisfied the fiducial geo- metry requirement and among the latter about 30% of these fell into useful energy bins (E > 2x threshold). Consequently, from over 100000 event triggers, useable cross section data were drawn from only about 10 O00 straight tracks and less than 500 hydrogen interactions.
5. BEAM
The system was triggered by incident hadrons at a rate of once every three min- utes with a 90 GeV (nominal) threshold. The flux of hadrons through the apparatus was determined to be
E(>E) = 3 X 10⁻³E -z (cm2- sr • see) -1,
where N(>E) is the flux of hadrons of energy greater than E(GeV) per (cm 2 "sr" sec) This exponent is greater than the 1.6-1.8 usually quoted because the probability
of rejection of an event by the anticoincidence shield is an increasing function of the particle energy. This in turn results from the greater probability of accompaniment of a higher-energy particle by secondaries from prior collisions in the atmosphere.
While all incident hadrons are frequently referred to as protons in this paper,
L. W. Jones et aL, Cosmic-ray experiment
Table 1 Numbers o f neutral events (iV) and charged events (C) and the ratio N/C.
487
Energy range 1 0 0 - 2 0 0 GeV 2 0 0 - 5 0 0 GeV Median energy 150 GeV 300 GeV Observed N-events 184 91 Corrected N-events 298 146 Observed C-events 466 210 N/Cratio 0.63 +- 0.07 0.70 -+ 0.11
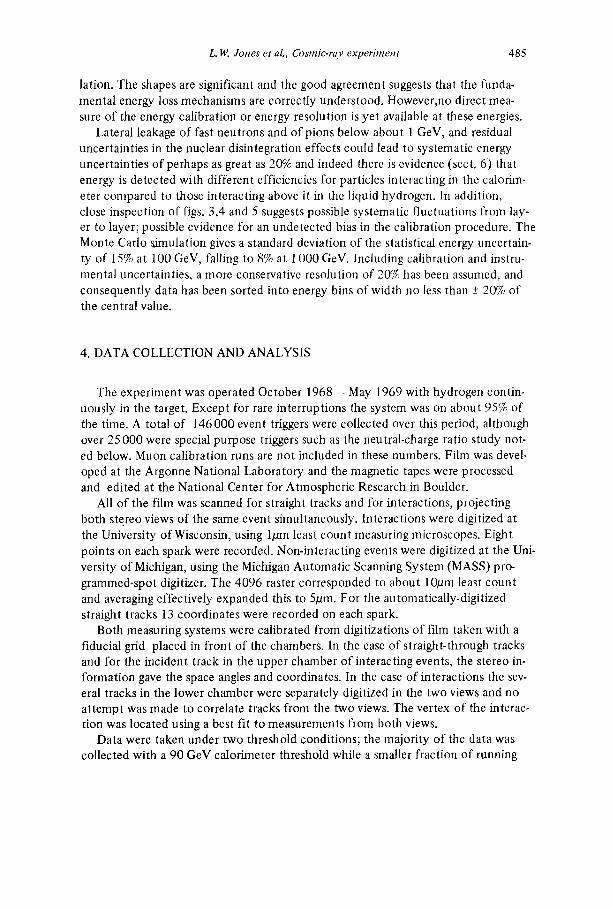
there is some admixture of pions (positive and negative). It is assumed that the flux of kaons may be neglected relative to pions; i.e., that kaons are less than 10-20% of the pion flux. An indirect measure of the pion admixture was gained from data taken for a short run with the counter T o replaced by the second calorimeter layer in the trigger logic. Neutral particles which interacted in the first 120 g • cm - 2 of the calorimeter (before the second counter) as well as charged particles were thus detected. From the cascades generated in the iron plate chamber by the neutrons, an approximate direction for them could be found and consequently the same fiducial cuts could be made for both charged and neutral hadrons. From the calo- rimeter data energies were also assigned to all events. The flux of neutral hadrons was increased by a factor of 1.58 to account for the fact that the trigger counter was located in the calorimeter under 120 g • cm - 2 of iron, and the charged hadron mean free path was found (subsect. 8.2) to be 132 g • cm -2. From 915 events which satisfied various fiducial and energy cuts the values in table 1 were determined.
1.0
o
o
g . 6
~.4
o to 400
, i , 1 , r , ,
t t × ECHO LAKE EXPERIM£HT • AVAKIAN • FARROW
• A GREISEN AND WALKER m. LAL el' al
i i 1 i L i J ~ / i
40 60 100 200 EMERGY (6ev )
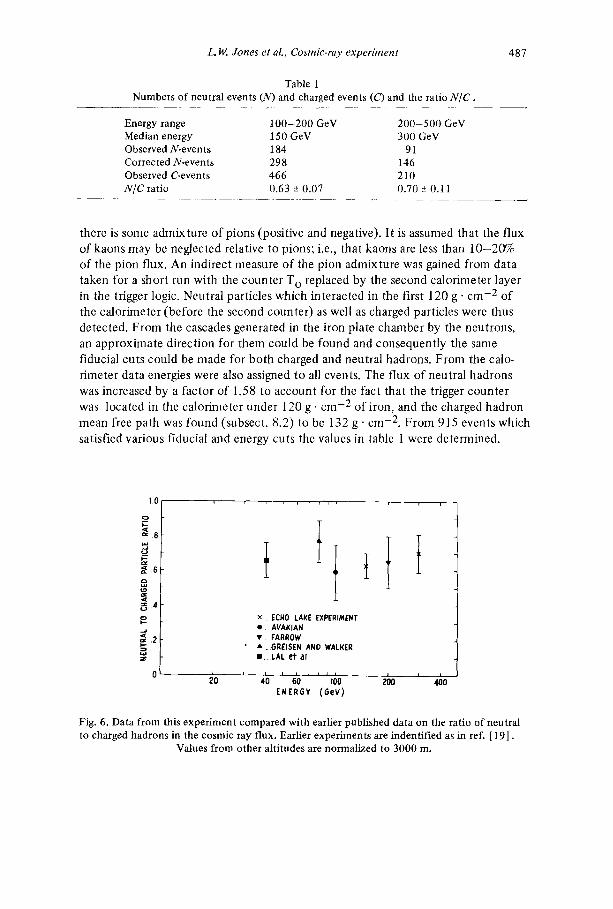
Fig. 6. Data f rom this exper iment compared with earlier published data on the ratio o f neutral to charged hadrons in the cosmic ray flux. Earlier exper iments are indentified as in ref. [ 19] .
Values f rom other al t i tudes are normalized to 3000 m.
488 L. W. Jones et al., Cosmioray experiment
1.0
c~.8
z . 6 k- o
o = ~- .2
} L
?0
x....ECHO LAKE EXPERIMENT •..,.AVAKIAN &.....BROOKES 4t'.....GRIGOROV • .....LAL et al
i b ' ' ' i h t 4 60 100
ENERGY (6ev )
i
200 400
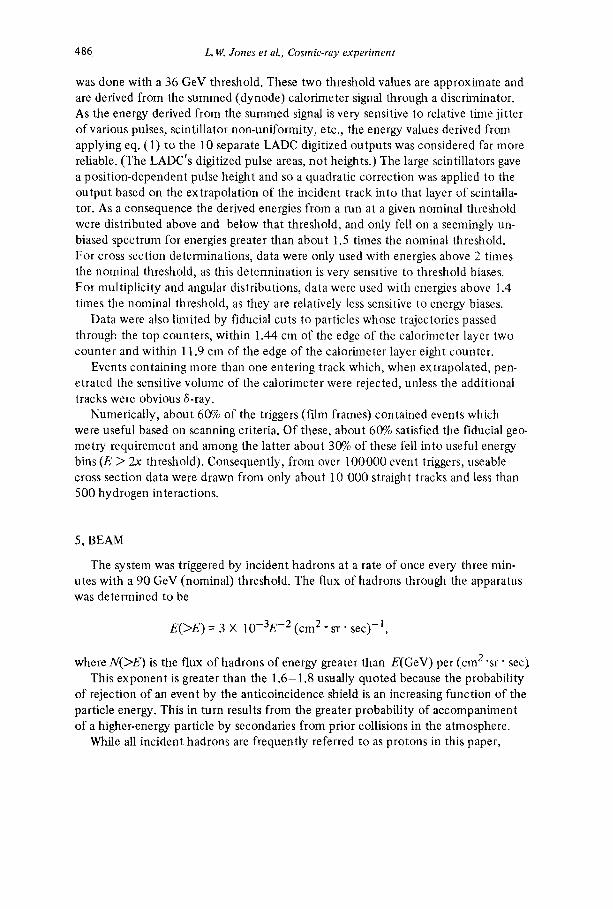
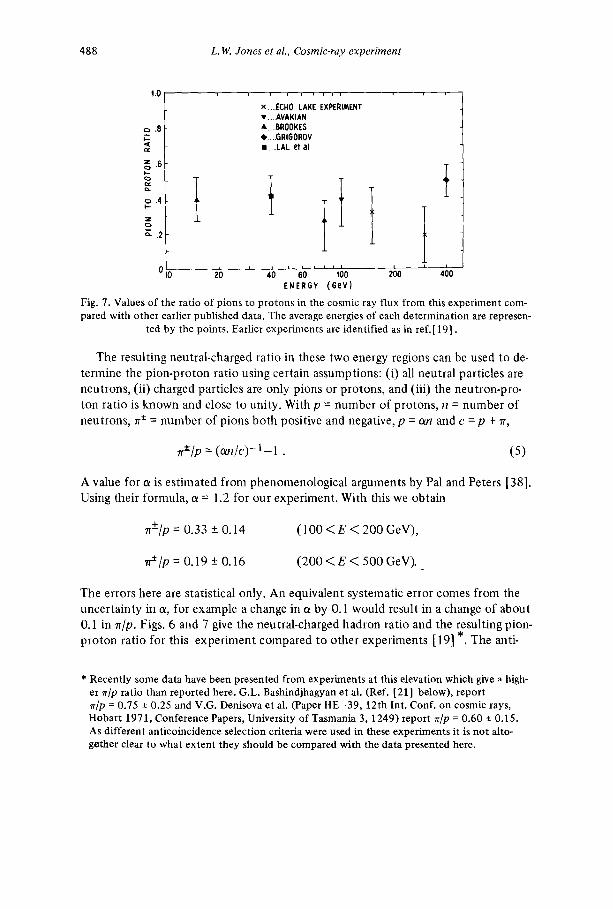
Fig. 7. Values of the ratio of pions to protons in the cosmic ray flux from this experiment com- pared with other earlier published data. The average energies of each determination are represen-
ted by the points. Earlier experiments are identified as in ref.[ 19].
The resulting neutral-charged ratio in these two energy regions can be used to de-
termine the p ion-pro ton ratio using certain assumptions: (i) all neutral part icles are
neutrons , (ii) charged part icles are only pions or protons , and (iii) the neutron-pro-
ton rat io is known and close to uni ty . With p = number o f protons, n = number of
neutrons, 7r +- = number o f pions bo th posit ive and negative, p = an and c = p + rr,
~ t / p = ( ~ n / c ) - l - 1 . (5)
A value for a is es t imated f rom phenomenolog ica l arguments by Pal and Peters [38].
Using their formula, a = 1.2 for our exper iment . With this we obtain
7r+/p = 0.33 +- 0.14 (100 < E < 200 GeV),
rre/p = 0.19 + 0.16 (200 < E < 500 GeV).
The errors here are statistical only. An equivalent systematic error comes f rom the
uncer ta in ty in a, for example a change in c~ by 0.1 would result in a change o f about
0.1 in rr/p. Figs. 6 and 7 give the neutral-charged hadron ratio and the result ing pion-
p ro ton ratio for this expe r imen t compared to o ther exper iments [ 19] *. The anti-
* Recently some data have been presented from experiments at this elevation which give, high- er rr/p ratio than reported here. G.L. Bashindjhagyan et al. (Ref. [21] below), report rr/p= 0.75 -+ 0.25 and V.G. Denisova et al. (Paper HE-39, 12th Int. Conf. on cosmic rays, Hobart 1971, Conference Papers, University of Tasmania 3, 1249) report ~r/p = 0.60 +- O. 15. As different anticoincidence selection criteria were used in these experiments it is not alto- gether clear to what extent they should be compared with the data presented here.
L, W. Jones et al., Cosmic.ray experiment 489
coincidence counters on this and some other experiments may significantly influence this ratio and consequently the values from various determinations should be com- pared with caution.
6. EXPERIMENTAL BIASES
The two detector systems, the spark chambers and the calorimeter, have several l imitations which required corrections to the raw data in order to arrive at distribu- tions of physical interest. At the same time checks and tests were made which dem- onstrate ranges of parameters over which the systems are reliable.
The spark chambers are sensitive to tracks over a range of angles from 0 ° (rela- tive to the vertical, or electric field direction) to about 40 ° . Although tracks are seen in the range 45 ° - 50 ° , the efficiency of detecting such tracks falls off with increasing angle. Within the range 0 ° - 35 ° all evidence is that the efficiency is close to 100%, essentially independent of multiplicity. This is deduced from looking for sparks in one of the two gaps of the chamber that do not extrapolate to sparks in the other gap. The fraction of such missing sparks is 4% per gap, or less than 1% probabi l i ty of being missed in both gaps. This figure seems largely independent of multiplici ty, although higher multiplicities give rise to fainter tracks (as the stored energy is spread among a larger number of sparks). It is also true that larger-angle tracks are frequently fainter than near-normal tracks.
Some pairs of tracks are so close together that they are not resolved and appear as a single spark. By studying close pairs in the two 90 ° stereo views it was found that sparks less than 2 mm apart in the lower chamber in one view are not resolved; two sparks are seen if their separation is greater than 2 ram. As the average event vertex is about a meter above the lower chamber gap, this separation corresponds to an angular divergence of 2 mr projected angle or on the average 3 mr opening angle. Over this data sample, it appears that less than 0.5% of all charged prongs are lost through failure to resolve individual tracks in at least one of two orthogonal views. For example, from 3819 events containing 15 550 tracks, a total of 1740 tracks were detected in only one of the two views (697 in one view and 1043 in the other). The unobserved prongs are thus 4.4% and 6.7% of the total in the two views. The probabi l i ty of missing a track in both views may then be 0.044 × 0.067 or 0.3%, assuming the complete independence of the two views.
The angular resolution of the system was determined by studying the distribution of apparent scattering angle of high-energy hadrons not interacting in the target. From accelerator data, less than 2% of the straight-through tracks are expected to undergo elastic scattering and the most probable elastic scattering angle of a proton of 200 GeV is 1.1 mr for d o / d t ~ exp (10t). The rms multiple Coulomb scattering angle at 100 GeV in the target is 0.1 mr. As these are very small the observed distri- bution is interpreted as a direct measure of the experimental resolution. This is ob- served to correspond to 3.2 mr (fins) in space, or about 2.3 mr in each projected
490 L. IV. Jones et aL, Cosmic-ray experiment
view. Consequently, angular distribution results plotted in terms of r/p'-- lOgl0 tan 0p are not significant in shape for values of~)p less than -2 .65 . The total numbers of prongs with r/p < -2 .65 are of course significant.
The target contained 0.19 radiation lengths of material between its center (half of the average path length in hydrogen) and the lower chamber. This hydrogen, steel and aluminum also constituted about 0.07 nuclear interaction mean 'free paths. This material led to three sources of spurious tracks; 6-rays, electron pairs from 7- conversions, and prongs from secondary interactions. The energy spectrum of 6-rays can be calculated and compared with apparent two-prong events from the target. The majority of apparent two prong events are in fact 6-rays, as the probability of an incident hadron of over 200 GeV producing a 6-ray in the target which will pene- trate at least one gap of the iron plate chamber is 1.3%.
The conversion of a 3' to electron pairs will generally result in an unresolved track if the 3' has an energy of over 2 GeV (i.e., resulting in a pair opening angle of less than 3 mr). The probability of a 7r ° resulting in a pair track is about 0.28.
Secondary interactions will produce additional particles, the multiplicity of which depends on the energy of the secondary producing them and the material in which the interaction occurs.
The thickness of the target also results in the stopping of recoil target protons of less than 75 MeV and pions of less than 30 MeV. From Monte Carlo studies, it ap- pears that few particles are lost because of their range; a more important loss of slow particles is caused by the limited angular and geometrical acceptance.
In view of the mechanisms for producing extra tracks and for not observing some genuine tracks, a correction to the observed data is necessary. In order to make cor- rections in a self-consistent way, a model was adopted which would permit a calcu- lation of secondary particle numbers, angles, momenta, etc. The secondaries from the model were observed or not observed according to the biases, and the resulting distributions of observable quantities were calculated. To the extent that these cal- culated distributions agreed with the corresponding experimentally observed distri- butions, the model was regarded as sufficiently valid to be used as a basis for correc- ting the observed data for experimental biases.
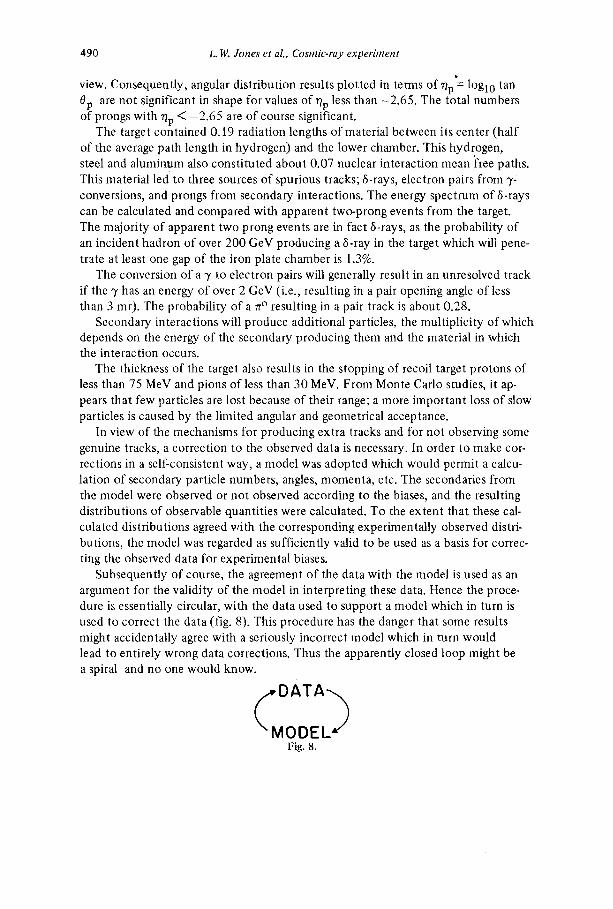
Subsequently of course, the agreement of the data with the model is used as an argument for the validity of the model in interpreting these data. Hence the proce- dure is essentially circular, with the data used to support a model which in turn is used to correct the data (fig. 8). This procedure has the danger that some results might accidentally agree with a seriously incorrect model which in turn would lead to entirely wrong data corrections. Thus the apparently closed loop might be a spiral and no one would know.
O D E L ~" Fig. 8.

L. W. Jones et al., Cosmic-ray experiment 491
In practice the corrections are small and it is hard to imagine being led far astray. It is not hnportant that the model be entirely accurate, as discrepancies will result in an error to an error. The extent to which variations in the model affect the correc- tions has been explored. Except for the correction for zero- and one-prong events, most of the corrections depend only weakly on the details of the model.
A particular experimental problem arises in the case of two-prong events. First, a majority of those events which on the scanning table appear to be two-prong hadron- ic final states are in fact g-rays. Second, it is difficult to ascertain how many straight- through tracks are one-prong inelastic events; i.e. where ~O,s, neutrons, or otherwise unobserved particles were produced and because of the experimental biases not seen.
For protons of over 100 GeV traversing a thin slab of material characterized by Z andA (atomic number and weight) andx g • cm -2 thick, the number of g-rays of energy greater than E MeV produced is given by
For energies E ~ 50 MeV, a produced g-ray Coulomb scatters in the 0.005 cm alu- minum center spark chamber electrode on the average about 0,5 ° and can be rejec- ted on the scanning table. The total probability of production of a g-ray of greater than 50 MeV in the hydrogen target (including walls) is over 2%; not small compared to the total nuclear interaction probability. In order to determine which of the two- prong events were due to hadrons, the penetration of these tracks in the iron plate spark chamber was studied. The number which penetrated to one gap (10 g • cm -2 iron), two gaps (30 g" cm -2 iron), and three gaps (50 g- cm -2 iron) agreed with calculations based on electron ranges in iron. From a sample of 65 000 straight tracks only 31 contained 6-rays reaching the third gap and not beyond.
The energy of a pion which would penetrate to the fourth gap (70 g. cm -2 iron) is only 150 MeV, so that the rather arbitrary criterion was adopted that in two-prong events, those prongs penetrating to only the third gap or less were g-rays, while those reaching the fourth or deeper gaps were hadrons. With this criterion, 18% of the ap- parent two-prong events in which no scattering was apparent in the spark chamber were retained as hadronic two-prong and the remaining 82% were counted as straight tracks accompanied by energetic g-rays. The errors placed on two-prong events (fig. 12) do not reflect the systematic errors of the correction. The correction for g-rays in the greater multiplicity events is of course much smaller and is included in the correction program described above.
An attempt was made to select one-prong events from the tail of the angular dis- tribution of the apparent scattering angle of the straight-through tracks. Unfortu- nately, the angular resolution was poor and the expected number of one-prong events was only a small fraction of all incident tracks (< 3 × 10 -3) so that they were not resolved from the tail of the experimental resolution function. Consequently, the model described below was used to determine the number of two or more prong inelastic events which, with the experimental biases, would appear in the spark cham-
492 L.W. Jones et al., Cosmie-my experiment
bet photographs as zero or one-prong events. The calculated contribution was 14% of the total inelastic cross section at 200 GeV and 12% at 600 GeV, from the model discussed below. This correction is model dependent. In this model the multiperiph- eral exchange is entirely isospin 1, producing rho mesons whereas in a model with alternating isospin 0 and 1 and pion production the correction falls to 4%.
7. MONTE CARLO MODEL
Rather than be constrained by any one model, high-energy events have been gene- rated with a Monte Carlo calculation that incorporated the general features of the models of Chew and Pignotti [20] and Feynman [21]. Specifically, it was assumed that:
(a) In addition to the original particles, the high-energy interactions tend to shed p-mesons.
(b) The c.m. momentum distribution of the 0-mesons is given by
d3N (x g(x,s) e -ap 2d3p/E, (7)
where E is the total energy of a secondary, x = 2PL s - l , PL is the longitudinal mo- mentum, PT the transverse momentum, and s is the square of the total c.m. energy. The function g (x,s) describes the effects of the kinematical constraints whose form is determined by conservation of momentum and energy.
(c) The number of O's emitted at fixed s is described by a Poisson distribution whose average value is given by a constant times In (Eo/m), where E o is total lab. energy of the incident particle and m is its mass.
(d) The charges of the final state particles (O'S and nucleons) result as if the O's were produced multiperipherally via rr-meson (I = 1) exchange.
Since the o-mesons decay essentially to two pions, the momentum distribution of the pions that result will be given by
d3U °: f(x,s) e -bp2T d3p/E , (8)
and the average number of pions emitted will also vary as k ln(Eo/rn ). The value of b was chosen to correspond to ([pT[> = 0.35 GeV, and the value of k was determined to be compatible with present multiplicity data as presented in table 8.
The generation procedure begins by selecting the number of O's from a2Poisson distribution, the transverse momenta for the O'S and nucleons from e -aPT such that EpT = 0, and the longitudinal momenta for the O'S from lIE. The equations of con- servation of momentum and energy are then used to solve for the remaining two longitudinal momenta of the final state nucleons. There is frequently no solution as the O'S have taken too much energy (g(x,s) is ignored during generation)An this case a smaller value of the longitudinal momentum for the P with the largest IPL[ is gen-
L.W. Jones et al., Cosmic-ray experiment 493
erated, again from I/E, and the process is repeated until a solution is obtained where one nucleon goes forward and one backward (in the c.m.). The p-mesons are then al- lowed to decay into two pions.
The process produces an f(x,s) (for the pion distribution)that is independent of s and that varies approximately as e -8x2 . There also results a scaling nucleon mo- mentum distribution that varies approximately as 10× for 0.05 <~x ~ 0.85. The inelasticity is also energy independent and has the value 0.54*.
Events were generated according to the above procedure throughout the fiducial volume of the liquid hydrogen of the target. The nucleons and charged pions in the final state were traced through the remaining liquid hydrogen and walls of the target, and were allowed to suffer interactions with this material (~6% probability per par- ticle), and the final state of a secondary that interacted was generated according to the model. Neutral pions in the final state decay and the resulting 7-rays were traced through the target and allowed to convert (14% probability per 7). Geometrically dependent detection efficiencies were then applied to the charged prongs. The ob- served final state particles are thus charged particles from the primary event plus the results of subsequent interactions of these particles. Table 6 lists the experimentally observed distributions of prongs in four energy intervals, and the Monte Carlo pre- dictions normalized to the corresponding data sample. The agreement is quite good, and, together with the agreement with the observed angular distributions (fig. 16) provides the basis for confidence in the corrections to the data calculated with the model.
Previous comparisons of the data of this experiment to the multiperipheral model have served as a guide to the selection of details of the Monte Carlo calculation [2]. For example, an analysis of the angular distributions indicated the need for particle correlations (p's, nucleon resonances, etc.) in order to avoid structure in the angular distributions and to improve the model predictions regarding charged multiplicity distributions at fixed s. These refinements have been incorporated in this Monte Carlo calculation resulting in general improvement in the agreement of model pre- dictions with the data; particularly with the charged multiplicity and angular dis- tributions. However, in view of the nature of the theoretical calculation and the da- ta, a cautious interpretation is in order regarding model datails.
It may be noted that the earlier comparisons with data had been made using a similar Monte Carlo calculation analagous to a multiperipheral model wherein p- and ~o-mesons were exchanged and single pions produced. This led to two impor- tant differences in the distributions as compared with the data: the number distribu- tions were narrower (corresponding to Poisson statistics for single pions rather than pion pairs), and the angular distributions had ears or peaks at extremes of log tan 0 which corresponded to the final state protons. The pure I = 1 exchange results in a
* The addition of up to 30% A-production per nucleon did not significantly change the results of this Monte Carlo calculation, nor the conclusions inferred from it.
494 L.W. Jones et al., Cosmic-ray experiment
larger probability that the final state nucleon is a neutron than the I = 0,1 mixture, and consequently suppresses the effect of the nucleons in the charged-particle dis- tributions. This also results in a difference between the magnitude of apparent one- prong contributions to the two-prong events, as noted in sect. 6.
A careful comparison between the results as presented in this paper with previ- ously reported results of the same experiment will reveal small differences. These are consequences of the progressive refinement of the model and corresponding small differences in the corrections for experimental biases. In effect, the effort has been directed towards closing the loop of fig. 8. However, because the corrections are small, the conclusions based on the earlier results all remain valid.
8. CROSS SECTIONS
8.1. Proton-proton cross sections
A primary objective of this experiment was the determination of the total inelas- tic proton-proton cross section. Two other cross sections were obtained as by-prod- ucts: the cross section in iron and a limit to the cross section in air. It must be noted that elastic scattering is not seen in these measurements: the recoil proton or nucleus is not visible in a detector, and the scattering angles are too small to be resolved, as noted above. Henceforth in this paper cross section will be understood to be the to- tal inelastic cross section unless otherwise stated.
In principle, determination of the hydrogen cross section involves only determina- tion of that fraction of the incident flux which interacts in the liquid hydrogen tar- get, with appre~priate fiducial and energy cuts. The level of the liquid in the hydro- gen target was monitored and known continuously through the run. Hence, from the incident particle trajectory the length in the liquid hydrogen was known for each event. Vertex reconstruction accurate to -+ 1 cm permitted eliminatio:, ~f interac- tions in the walls (stainless steel and aluminum) of the target. The energy of each event was determined with the calorimeter, whether it was a proton with a first in- teraction in the calorimeter or a proton interacting in the hydrogen target. In the latter case the reaction products proceed into the calorimeter and result in scintil- lation counter pulses from which the energy can be determined just as in the former case of straight-through protons. The pp cross section in a given energy bin is deter- mined from an interaction mean free path Xpp (E) (g. cm-2), where
A - ( 9 )
),pp (E) Noopp(E) ,
with A the atomic weight in a.m.u, and N o Avagadro's number. I f N 1 is the number of interactions when N particles are incident on the target, each with a path length in the target li,
L. W. Jones et aL, Cosmic-ray experiment 495
N
NI= N - ~ e-li/~'PP. i = l
Because of the shape of the target, the range of incident trajectory angles and posi- tions, and the time-varying liquid level, l i is different for each incident particle. How- ever in this experiment li/X was always small; a 30 mb cross section corresponds to a X of 55.3 g • cm - 2 while the average I i for the experiment was 3.86 g • cm-2giving
)- /X ~ 0.07. Consequently it was appropriate to average the l i so that
o ['
I f R is the number of target interactions in a given energy bin and S is the correspon- ding number of straight-through events, N I = R and N = R + S, so that
o - in (11)
In practice, the method of determining cross section was somewhat different. The number of R-events l imited the statistics of the cross section determinations and consequently every effort was made to find and completely evaluate each R-event (subtracting off the 6-ray events where appropriate). On the other hand the S-events were measured automatically and there was no difficulty obtaining great numbers of good events. Consequently, the energy spectrum and the fraction of all photo- graphs taken which were good R-events within the fiducial volume could be deter- mined with only sample rescanning and remeasurement. To the S-events were added 6-ray events and interactions in the lower dome of the target vessel. Two corrections to the cross section were made. First, muons have a small probabil i ty of initiating a nuclear or electromagnetic cascade in the 1130 g • cm -2 of iron and giving rise to a signal in the calorimeter like a hadron. From the known absolute flux of muons and the calculated inelastic interactions of muons, the contaminat ion of S-events by muons was taken to be 5% in each energy bin. Indirect qualitative evidence (subsect. 8.2) o f m u o n interactions was seen as a depth-independent component of calorime- ter signals with most of the energy loss signal coming in only two successive layers. Second, it was established that some of the incident charged hadronic flux was pions (sect.4). I f the pion-proton cross section remains z of the proton-proton cross sec- tion, as seems true at accelerator energies (and in agreement with the simplest quark model) then the proton-proton cross section Opp, is related to the observed hadronic cross section, o0, through
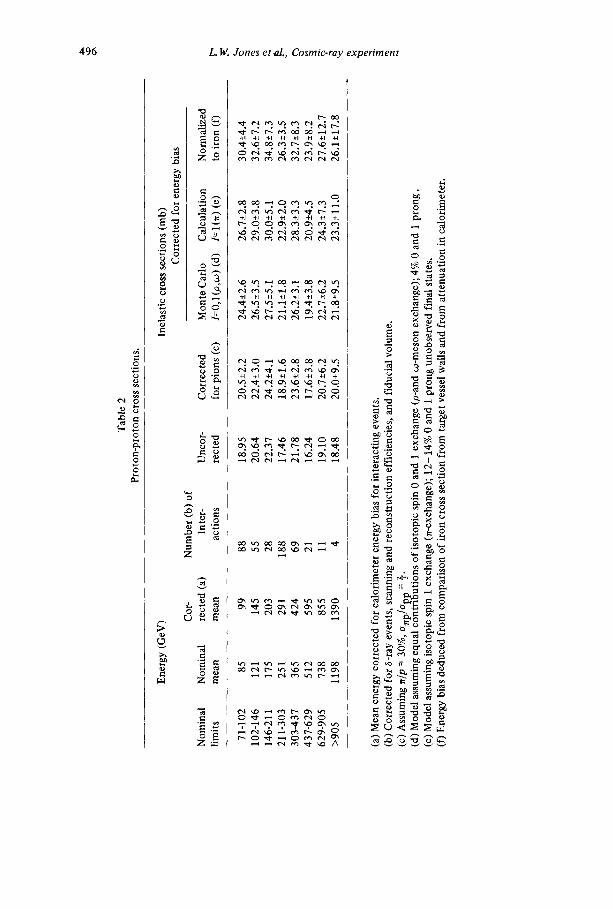
Tab
le 2
P
roto
n-p
roto
n c
ross
sec
tion
s.
~D
O
~
Ene
rgy
(GeV
) In
elas
tic
cros
s se
ctio
ns (
mb)
C
orre
cted
for
ene
rgy
bias
C
ot-
Num
ber
(b)
of
Nom
inal
N
omin
al
rect
ed (
a)
Inte
r-
Unc
or-
Cor
rect
ed
Mon
te C
arlo
C
alcu
lati
on
lim
its
mea
n m
ean
acti
ons
rect
ed
for
pion
s (c
) I=
0,1
(p,~
) (d
) l-
-l(n
) (e
) N
orm
aliz
ed
to i
ron
(f)
71-1
02
85
99
88
18.9
5 2
0.5
_+
2.2
2
4.4
-+2
.6
26
.7+
-2.8
10
2-14
6 12
1 14
5 55
20
.64
22
.4+
-3.0
2
6.5
_+
3.5
2
9.0
_+
3.8
14
6-21
1 17
5 20
3 28
22
.37
24.2
_+4.
1 27
.5_+
5.1
30.0
+-5.
1 21
1-30
3 25
1 29
1 18
8 17
.46
18
.9+
-1.6
2
1.1
_+
1.8
22
.9+
-2.0
30
3-43
7 36
5 42
4 69
21
.78
23
.6+
-2.8
26
.2_+
3.1
28
.3+
-3.3
43
7-62
9 51
2 59
5 21
16
.24
17
.6+
_3
.8
19.4
+_3
.8
20
.9_
+4
.5
629-
905
738
855
11
19.1
0 2
0.7
+_
6.2
2
2.7
+_
6.2
2
4.3
+_
7.3
>
905
1198
13
90
4 18
.48
20
.0_
+9
.5
21.8
+_9.
5 23
.3_+
11.
0
30.4
+_4.
4 32
.6+_
7.2
34.8
_+7.
3 26
.3_+
3.5
32.7
+-8.
3 23
.9-+
8.2
27.6
+_12
.7
26.1
+-1
7.8
v,
(a)
Mea
n en
ergy
cor
rect
ed f
or c
alor
imet
er e
nerg
y bi
as f
or i
nter
acti
ng e
vent
s.
(b)
Cor
rect
ed f
or b
-ray
eve
nts,
sca
nnin
g an
d re
cons
truc
tion
eff
icie
ncie
s, a
nd f
iduc
ial v
olum
e.
(c)
Ass
umin
g rr/
p =
30%
, a~
p/O
pp =
9.
(d)
Mod
el a
ssum
ing
equa
l co
ntri
buti
ons
of
isot
opic
spi
n 0
and
1 ex
chan
ge (
p-an
d ~o
-mes
on e
xcha
nge)
; 4%
0 a
nd 1
pro
ng
. (e
) M
odel
ass
umin
g is
otop
ic s
pin
1 ex
chan
ge (
n-ex
chan
ge);
12
-14
% 0
and
1 p
rong
uno
bser
ved
fina
l st
ates
. (f
) E
nerg
y bi
as d
educ
ed f
rom
com
pari
son
of
iron
cro
ss s
ecti
on f
rom
tar
get
vess
el w
ails
and
fro
m a
tten
uati
on i
n ca
lori
met
er.
L. W. Jones et aL, Cosmic-ray experiment 497
40
3O z t ~
zo
1o
-4o -5'0 -z'o -,'o ,'o 2'o 30 40 VERTICAL DISTANCE FROM TIlE CENTER OF THE TARGET (cm)
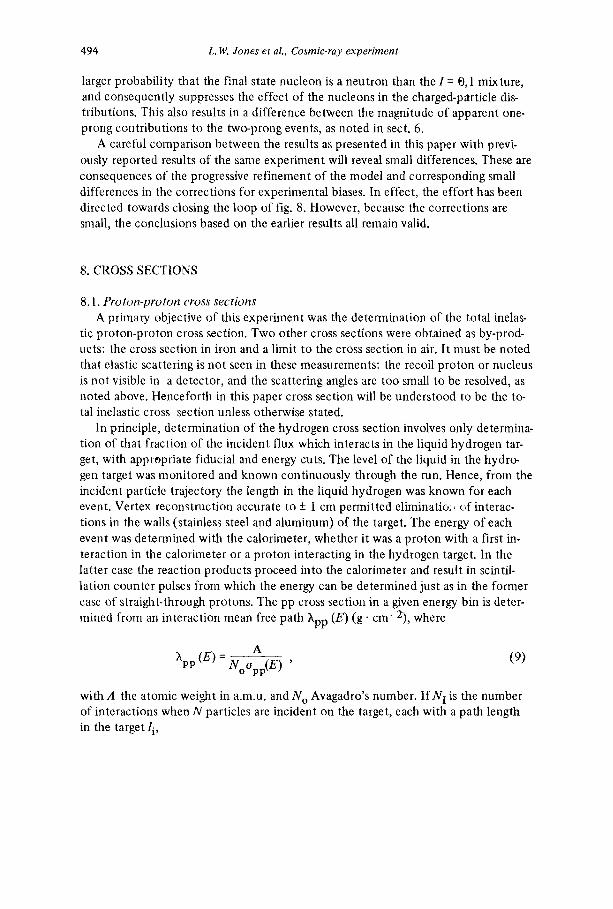
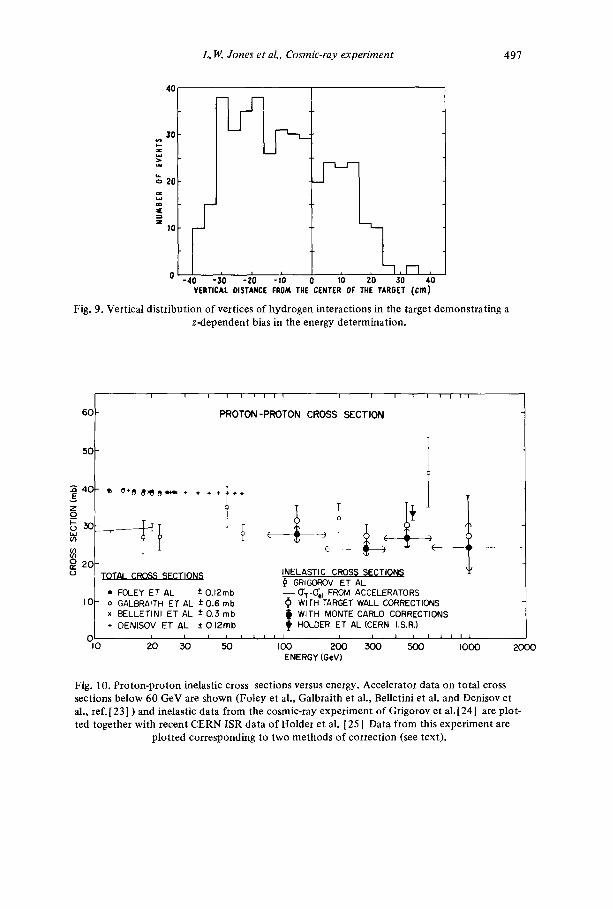
Fig. 9. Vertical dis tr ibut ion o f vertices of hydrogen interact ions in the target demonst ra t ing a z-dependent bias in the energy determinat ion.
60
501
I 4 0
Z
W
I i I i i , i i i I I I I I I 1 I I
PROTON-PROTON CROSS SECTION
c ~ c -- - - -
INELASTIC CROSS SECTIONS
o i ~ ~ GRIGOROV ET AL ! • FOLEY ET AL ± O.12mb - - O'T-CFet FROM ACCELERATORS
I0~- o GALBRAITH ET AL :I: 0.6 mb ~ WITH TARGET WALL CORRECTIONS | x BELLETINI ET AL ± 0.3 rnb i i WITH MONTE CARLO CORRECTIONS | + OENISOV ET AL ± O.12rnb ~ HOLDER ET AL (CERN I.S.R.)
01 I I I I I I I I I I I I I
I0 20 30 50 I00 200 300 500 ENERGY (GeV)
I I I
I000 2000
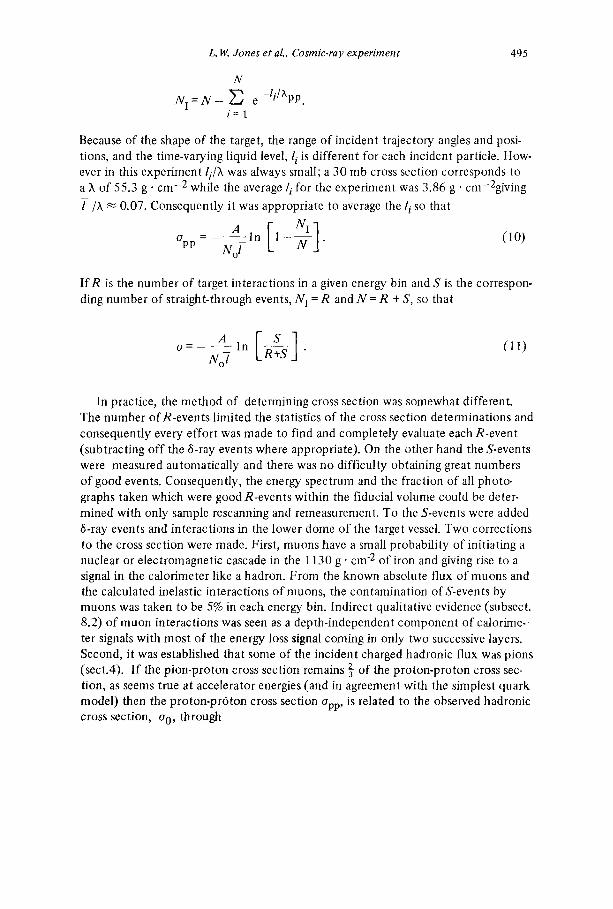
Fig. 10. Proton-proton inelastic cross sections versus energy. Accelerator data on total cross sections below 60 GeV are shown (Foley et al., Galbraith et al., Belletini et al. and Denisov et al., ref. [ 23] ) and inelastic data f rom the cosmic-ray exper iment o f Grigorov et a1.[24] are plot- ted together with recent CERN ISR data o f Holder et al. [ 25 ] Data f rom this exper iment are
plot ted corresponding to two me thods of correction (see text).
498 L. W. Jones et al., Cosmic-ray experiment
_ . / p : 1 ( 1 2 ) °o l+n/p (-5) Opp + - ~ - Opp,
where n/p is the pion-proton flux ratio. With 0.3 for n/p (considering not only the data presented in sect.4 but other experiments as indicated on fig.6),
13 Opp = i-2 °obs"
In view of the steep energy spectrum and the indirect (i.e. calorimeter) method of energy determination, an essential ingredient in the accurate measurement of cross section is the equivalence of the energy measurements for both R-and S-events. However, there is strong evidence, from three sources, that the energy determination for R-events is systematically lower than that for S-events. These are (i) the depen- dence of the number of R-events on their z-vertex, (ii) a Monte Carlo study, and (iii) the difference between the cross section for iron as determined from the target ves- sel R-events and as determined from the calorimeter attenuation mean free path. A graph of the dependence of number of events on z-vertex coordinate given a calo- rimeter-determined energy threshold is presented in fig. 9. While some of the loss of events for z > + 10 cm is caused by the fluctuation of liquid level above that point, the falloff below was not from that source. Furthermore, the number of three-prong events from the vessel are 414 from the lower dome and 209 from the upper dome. This z-vertex dependence is interpreted as an energy bias resulting from a loss of energetic particles from the calorimeter fiducial volume laterally, hence corresponding to a smaller recorded pulse height for events of a given energy with interaction vertices higher above the calorimeter. While the top layer of the calorimeter subtends a solid angle of about one steradian at the center of the target, it must be noted that events are continuously distributed across the acceptance phase space, and the lateral loss of secondaries either above or from the sides of the calorimeter is quite probable. In order to study this effect quantitatively, events were generated by a Monte Carlo program and distributed through the target as were the real events. The Monte Carlo program substantiates the qualitative nature of the lateral energy leakage but may underestimate the magnitude of the effect, as a smaller z-vertex dependence is calculated than is observed. In table 2 the increase in cross section from applying the Monte Carlo results is shown. The correction is 2 - 4 mb (10% - 2(F/~) with an energy dependence suggesting a smaller effect at higher energies.
A cross section for iron was obtained directly from attenuation in the calorime- ter as discussed below (8.2). The data on interactions in the target walls can be re- normalized to these values (assuming the p-A1 and p-Fe cross sections also behave and agree with accelerator data) and a z-vertex dependent cross section correction found, assuming (for simplicity) a linear dependence of the correction factor on z. Cross sections for proton-proton interactions developed in this way are somewhat
L. W. Jones et aL, Cosmic-ray experiment 499
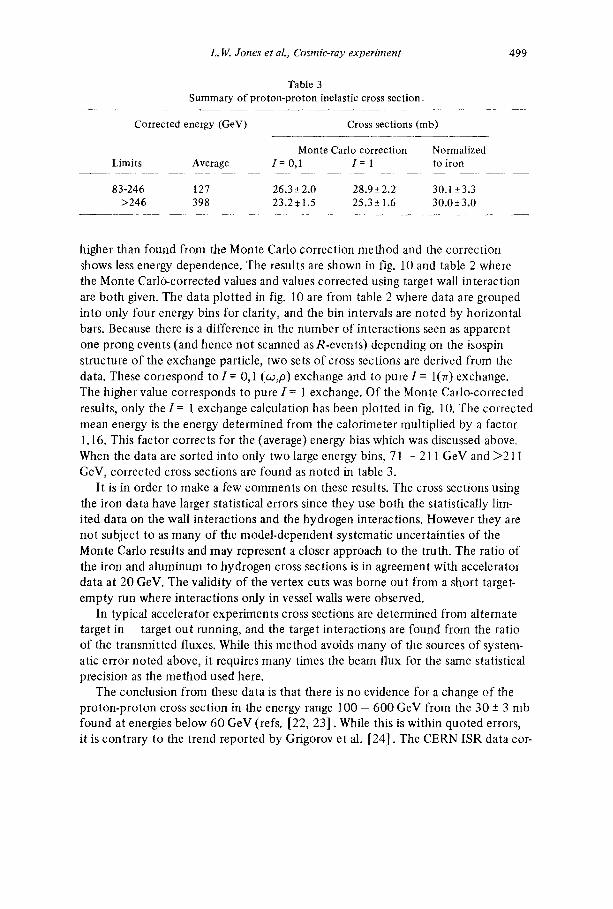
Table 3 Summary of proton-proton inelastic cross section.
Corrected energy (GeV) Cross sections (mb)
Monte Carlo correction Normalized Limits Average 1 = 0,1 I = 1 to iron
83-246 127 26.3 -+ 2.0 28.9 -+ 2.2 30.1 ± 3.3 >246 398 23.2,1.5 25.3 ± 1.6 30.0 ± 3.0
higher than found from the Monte Carlo correction method and the correction shows less energy dependence. The results are shown in fig. 10 and table 2 where the Monte Carlo-corrected values and values corrected using target wall interaction are both given. The data plot ted in fig. 10 are from table 2 where data are grouped into only four energy bins for clarity, and the bin intervals are noted by horizontal bars. Because there is a difference in the number of interactions seen as apparent one prong events (and hence not scanned as R-events) depending on the isospin structure of the exchange particle, two sets of cross sections are derived from the data. These correspond to I = 0,1 (oo,p) exchange and to pure 1 = 10r) exchange. The higher value corresponds to pure I = 1 exchange. Of the Monte Carlo-corrected results, only the I = 1 exchange calculation has been plot ted in fig. 10. The corrected mean energy is the energy determined from the calorimeter multiplied by a factor 1.16. This factor corrects for the (average) energy bias which was discussed above. When the data are sorted into only two large energy bins, 71 - 211 GeV and >211 GeV, corrected cross sections are found as noted in table 3.
I t is in order to make a few comments on these results. The cross sections using the iron data have larger statistical errors since they use both the statistically lim- ited data on the wall interactions and the hydrogen interactions. However they are not subject to as many of the model-dependent systematic uncertainties of the Monte Carlo results and may represent a closer approach to the truth. The ratio of the iron and aluminum to hydrogen cross sections is in agreement with accelerator data at 20 GeV. The validity of the vertex cuts was borne out from a short target- empty run where interactions only in vessel walls were observed.
In typical accelerator experiments cross sections are determined from alternate target in - target out running, and the target interactions are found from the ratio of the transmitted fluxes. While this method avoids many of the sources of system- atic error noted above, it requires many times the beam flux for the same statistical precision as the method used here.
The conclusion from these data is that there is no evidence for a change of the proton-proton cross section in the energy range 100 - 600 GeV from the 30 -+ 3 mb found at energies below 60 GeV (refs. [22, 23] . While this is within quoted errors, it is contrary to the trend reported by Grigorov et al. [24]. The CERN ISR data cor-
500 L. W. Jones et al., Cosmic-ray experiment
responding to 500 GeV give an inelastic proton-proton cross section of 33.5 +- 2 mb (ref. [25] ).
8.2. Pro ton- i ron cross sec t ions
Events not interacting in the target (S-events) could be followed through the cal- orimeter to determine the interaction mean free path in iron XFe, by noting the iron layer in which the particle first interacted. In principle a simple tabulation of surviv- ing particle numbers versus depth in the calorimeter could be fit to an exponential to determine this mean free path. However the procedure is more complicated for various reasons. Because of the muon contamination, the probability of energetic 6-ray production, the zenith angle distribution of the incident particles etc., errors would be introduced by simply recording the first counter layer containing an anom- alously large pulse. The actual determination of)kFe and hence OpF e involved correc~ tions for over a dozen different effects, including the three above.
The interaction vertex coordinates within the iron will affect the energy assigned to an event depending on the vertex proximity to the nearest scintillator, and as the iron layers are of different thicknesses this would cause a depth-dependent energy bias. This in turn, with the steeply falling energy spectrum, would cause a cross sec- tion bias if not corrected. This and various other geometrical effects such as non- uniformity of scintillator response, side and bot tom leakage of flux from the calo- rimeter, and energy bias on events occurring very deep within the calorimeter were studied, corrected for, and checked by making various geometrical cuts in the data.
An entering particle was considered to have interacted in the iron layer over the first counter in which the pulse height corresponded to greater than D single muons. The cross section result clearly depended on the setting of D for several reasons. Depending on the energy and D there was a finite thickness e, of iron required for the cascade to build t o D particles (e.g. fo rD = 10, e = 18 g • cm -2 for 80 GeV and e = 1.5 g. cm -2 for 1500 GeV). This effect could be largely corrected for by igno- ring data from the first layer so that at each energy the attenuation curves were sim- ply translated in z with no change in slope. The value of D also determined the min- imum inelasticity detected; larger values of D systematically biased against nearly elastic interactions and gave too low a cross section. On the other hand values of D too small admitted f-rays (e.g. the tail of the Landau ionization loss curve) for non- interacting protons and also invited electronic problems associated with the pedestal setting of the LADC units.
In order to discriminate against muon events, an energy-dependent persistence re- quirement was set. The range in iron between the first and last counters containing pulse heights greater than D was studied, and it was observed that in the high-energy bins there was a definite separation between events persisting to a depth correspon- ding to a pure electromagnetic cascade (presumably from a muon) and the more persistent hadronic cascades. At energies below about 300 GeV this separation was less clean. At lower energies a small Monte Carlo correction was made to account for
L, W. Jones et aL, Cosmic-ray experiment 501
9 0 0 1 ' I r ' ' ' ' 1 1 ' I ' ' ' ' ' 1
"B
E
CL b
8 0 0 -
7 0 0 ~ - - - - ~
6 0 0 -
5 0 0 -
I I I I I I I I 0 20 40 I O0 200 4 0 0 I000 2000
E N E R G Y ( G e V )
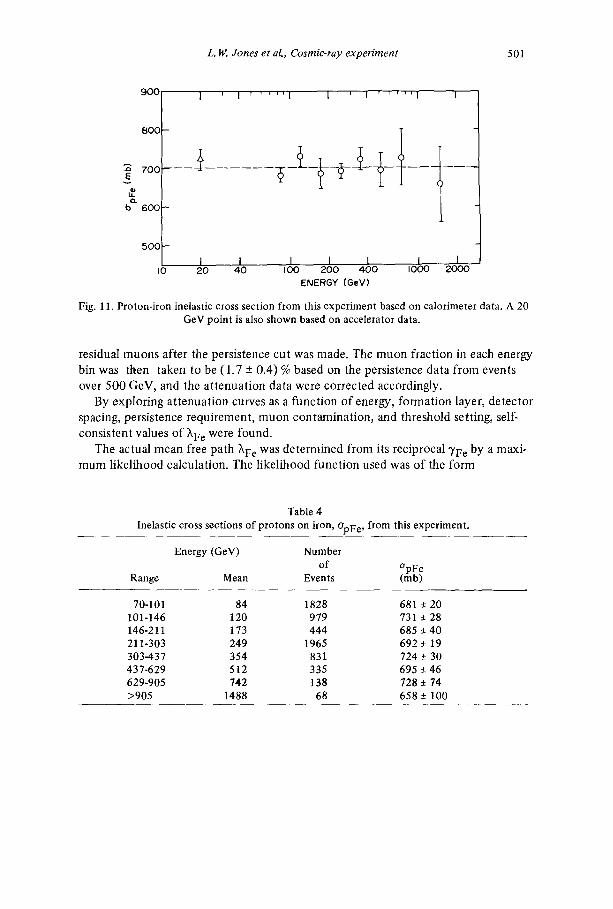
Fig. 11. Proton-iron inelastic cross section from this experiment based on calorimeter data. A 20 GeV point is also shown based on accelerator data.
residual muons after the persistence cut was made. The m u o n fract ion in each energy
bin was then taken to be (1.7 -+ 0.4) % based on the persistence data f rom events
over 500 GeV, and the a t tenua t ion data were correc ted accordingly.
By explor ing a t tenua t ion curves as a func t ion o f energy, fo rmat ion layer, de tec tor
spacing, persistence requi rement , m u o n contamina t ion , and threshold setting, self-
consis tent values o f ~'Fe were found.
The actual mean free pa th ~'Fe was de termined f rom its reciprocal 3'Fe by a maxi- m u m l ikel ihood calculat ion. The l ikel ihood func t ion used was o f the form
Table 4 Inelastic cross sections of protons on iron, GpFe, from this experiment.
Energy (GeV) Number of OpF e
Range Mean Events (mb)
70-101 84 1828 681 ± 20 101-146 120 979 731 ± 28 146-211 173 444 685 ~ 40 211-303 249 1965 692 ± 19 303-437 354 831 724 ~ 30 437-629 512 335 695 ± 46 629-905 742 138 728 • 74 >905 1488 68 658 ± 100
502 L. W. Jones et al., Cosmic-ray experiment
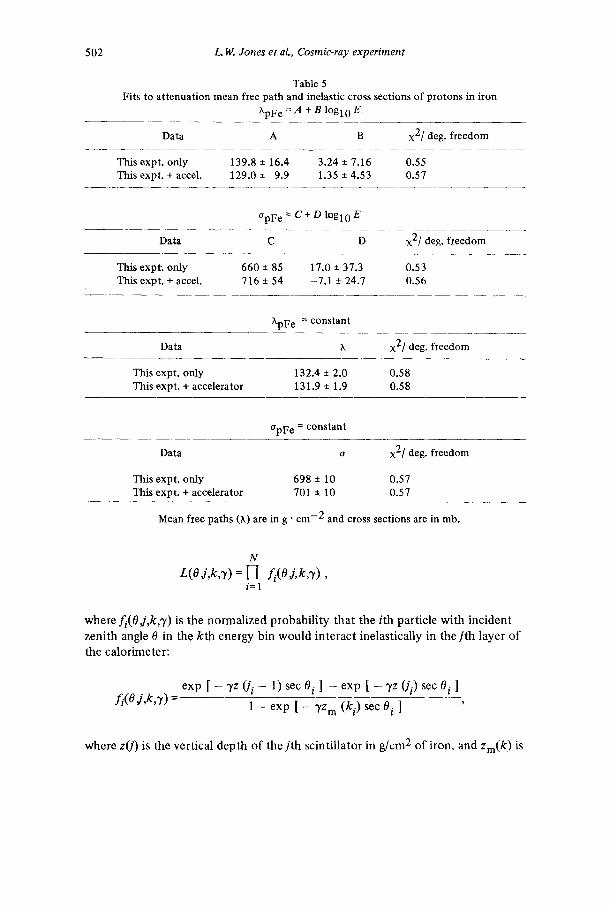
Table 5 Fits to at tenuation mean free path and inelastic cross sections of protons in iron
hpF e = A + B log10 E
Data A B X2/deg. freedom
This expt. only 139.8 + 16.4 - 3 . 2 4 ± 7.16 0.55 This expt. + accel. 129.0 ± 9.9 1.35 -+ 4.53 0.57
OpF e = C + D lOgl0 E
Data C D x2/deg , freedom
This expt . only 660 +- 85 17.0 -+ 37.3 0.53 This expt. + accel. 716 ± 54 -7 .1 -+ 24.7 0.56
hpF e = constant
Data h X2/deg. freedom
This expt. only 132.4 -+ 2.0 0.58 This expt. + accelerator 131.9 -+ 1.9 0.58
apF e = constant
Data o x2 /deg , freedom
This expt. only 698 +- 10 0.57 This expt. + accelerator 701 ± 10 0.57
Mean free paths (?,) are in g • cm - 2 and cross sections are in mb.
N
L(Oj ,k ,7 ) = [ 7 f i(Oj, k,~/) , i=1
w h e r e f / (O, j ,k ,7 ) is t he n o r m a l i z e d p r o b a b i l i t y t h a t t h e i t h pa r t i c l e w i t h i n c i d e n t
z e n i t h angle 0 in the k t h e n e r g y b i n w o u l d i n t e r a c t ine las t i ca l ly in t h e j t h l a y e r o f
t he c a l o r i m e t e r :
~ ( O j , k , v ) - e x p [ - -/z (Ji - 1) sec 0 i ] - e x p [ - ~z (Ji) sec 0 i ]
1 - e x p [ - 3,z m (ki) sec 0 i ]
w h e r e z(] ) is t he ve r t i ca l d e p t h o f t he j t h s c in t i l l a to r in g / c m 2 o f i ron , a n d z m ( k ) is
L. W. Jones et al., Cosmic-ray experiment 503
the vertical depth of the last scintillator used in the calculation for the kth energy bin . 3¢Fe was determined and calculated numerically from OW/a7 = 0 where I¢ = lnL. The uncertainty in ')'Fe was represented by A')'Fe = ( -- ~)2 I4//c3,y2)-~.
The cross sections of protons on iron, OpF e we re found after corrections were made for a pion to proton flux ratio of 0.3. The o/rFe tO OpF e ratio was deduced from accelerator data of pions [26] and neutrons [27] on copper at 20 GeV togeth- er with a ratio of absortion to total cross sections [28] at the same energy. Interpo- lations from copper to iron were based on the mass number dependence of A 0-743 and A 0.667 for the pion and proton absorption cross sections respectively. The re- sulting correction needed was then OpF e = 1.0424 Oobserved. Somewhat smaller values of OpF e w e r e obtained by Ryan and Crannell [29] from attenuation of a proton beam in a calorimeter at 20 GeV/c.
The results on the iron cross section versus energy are plotted in fig. 11 and given in tables 4 and 5. The data were fit in four ways: assuming an energy independent mean free path and assuming a mean free path varying logarithmically with energy, and both including and ignoring the 20 GeV accelerator data point. The errors in the table and figure include both statistical and a best estimate of the systematic uncer- tainties. (The cross sections presented here are all lower than computed earlier in ref. [ 14] both due to an error in the maximum likelihood procedure used previously and pointed out by Ryan [29], and due to the more complete study and under- standing of systematic effects as noted above).
From these fits it is concluded that there is no significant energy dependence to the proton-iron cross section below 1000 GeV although a very weak energy depen- dence, as noted in the table, cannot be ruled out.
The results of this experiment may be compared with other cosmic-ray experi- ments which have determined interaction mean free paths in iron by similar.methods. Andronikashvili et al. [30] report k (hadron - Fe) = 130 + 6 g . cm -2, correspon- ding to O(hadro n - - Fe) = 710 -+ 35 mb; and Bashindjhagyan et al. [31] report ~'pFe =
132 -+ 5 g • cm -2, corresponding t o OpFe = 700 -+ 35 mb. Neither group reports any significant evidence for an energy dependence.
8.3. Proton air cross sections Lower limits on the proton-air inelastic cross sections may be found from the ze-
nith angle dependence of the incident flux. The hadrons arriving at the detector are reduced in number from those incident at the top of the atmosphere by attenuation in the atmosphere above the apparatus. At one extreme, the attenuation would re- flect directly the inelastic interaction mean free path of protons in air. However many or most interactions would result in ongoing nucleons or pions containing a significant fraction of the original energy, and some of these would be admitted as good events in the Echo Lake system even with the anticoincidence guard ring coun- ters (as indeed the n/c flux ratio demonstrates). Therefore a direct measurement of attenuation with this detector will result in a lower limit to the proton air cross sec- tion.
504 L.W. Jones et al., Cosmic-ray experiment
The path length h of a hadron between the top of the atmosphere and the detec- tor is 715 sec 0 (g . cm-2) , where 0 is the zenith angle of the incident trajectory. A set of fiducial cuts was placed on detected hadrons and the same cuts were imposed on a Monte Carlo calculation of the accepted flux assuming an isotropic incident flux. The ratio of the experimental flux to the Monte Carlo flux was then computed as a function of 0 and fit to
N(O) = N(0) exp [ (1 - sec 0) h/~ , a ] , (13)
where X a is the at tenuat ion mean free path in air. These fits gave
X a = 93 g- cm - 2 (E = 108 GeV),
ha = 97 g" cm - 2 (/~= 342 GeV).
From these, a lower limit cross section in air can be found, using a = (A/No) X a and A ~ 14.5 for air. The results are
Op air ~ 269 + 30 mb (if '= 108 GeV),
Op air ~ 249 + 30 mb (/~= 342 GeV).
2
At 19.2 GeV Belletini et al., reported [28] OpC = 254 rob; assuming o = A ~- this would give Op air = 288 rob.
These values are consistent with a constant proton-air inelastic cross section al- though as lower limits they do not rule out a rising cross section as discussed by Yodh, Wayland, and Pal [32]. A detailed study of the effects of the anticoincidence counters would be necessary in order to use these data for more definitive conclu- sions.
9. CHARGED PRONG NUMBER DISTRIBUTIONS
The raw data on charged prong numbers from interactions in the liquid hydrogen target, grouped into energy bins, are tabulated in table 6. Only events wherein the reconstructed event vertex lay at least 1 cm from the target vessel wails were includ- ed. The energies of the bins are the values deduced from the calorimeter scaled up by 16% as indicated by the observations of the dependence of the observed energy on the vertical coordinate of the interaction vertex. The energy bins were selected to be +20% about a central value. Due to the steeply falling energy spectrum,
L. W. Jones et al., Cosmic-ray experiment
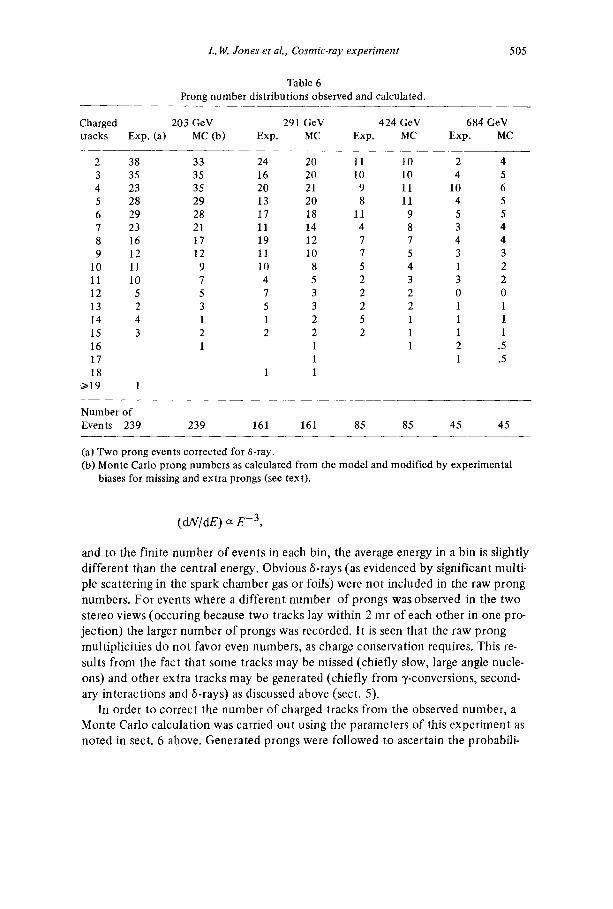
Table 6 Prong number distributions observed and calculated.
505
Charged 203 GeV 291 GeV 424 GeV 684 GeV tracks Exp. (a) MC (b) Exp. MC Exp. MC Exp. MC
2 38 33 24 20 11 10 2 4 3 35 35 16 20 10 10 4 5 4 23 35 20 21 9 11 10 6 5 28 29 13 20 8 11 4 5 6 29 28 17 18 11 9 5 5 7 23 21 11 14 4 8 3 4 8 16 17 19 12 7 7 4 4 9 12 12 11 10 7 5 3 3
10 1l 9 10 8 5 4 1 2 11 10 7 4 5 2 3 3 2 12 5 5 7 3 2 2 0 0 13 2 3 5 3 2 2 1 1 14 4 1 1 2 5 1 1 1 15 3 2 2 2 2 1 l 1 16 1 l 1 2 .5 17 1 1 .5 18 1 1
~19 1
Number of Events 239 239 161 161 85 85 45 45
(a) Two prong events corrected for 6-ray. (b) Monte Carlo prong numbers as calculated from the model and modified by experimental
biases for missing and extra prongs (see text).
( dN/dE) cc E -3 ,
and to the finite number o f events in each bin, the average energy in a bin is slightly
di f ferent than the central energy. Obvious 6-rays (as evidenced by significant multi-
ple scattering in the spark chamber gas or foils) were no t included in the raw prong
numbers . Fo r events where a d i f ferent number o f prongs was observed in the two
stereo views (occur ing because two tracks lay within 2 mr o f each o ther in one pro-
jec t ion) the larger number o f prongs was recorded. It is seen that the raw prong
mult ipl ic i t ies do no t favor even numbers , as charge conservat ion requires. This re-
sults f rom the fact that some tracks may be missed (chiefly slow, large angle nucle-
ons) and o ther extra tracks may be generated (chiefly f rom 7-conversions, second-
ary interact ions and 6-rays) as discussed above (sect. 5).
In order to correc t the number o f charged tracks from the observed number , a Monte Carlo calculat ion was carried out using the parameters o f this expe r imen t as
no ted in sect. 6 above. Genera ted prongs were fo l lowed to ascertain the probabili-
506 L. W. Jones et al., Cosmic-ray experiment
Table 7 Even prong distributions:
raw and corrected for experimental biases.
Charged 203 GeV 291 GeV 424 GeV tracks Raw a) Corrected b) Raw Corrected Raw Corrected
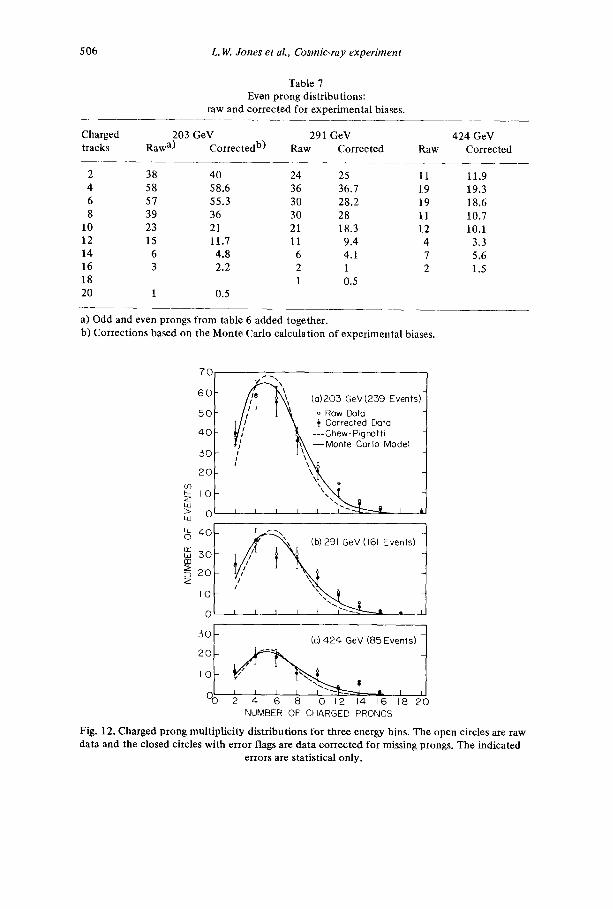
2 38 40 24 25 11 113 4 58 58.6 36 36.7 19 19.3 6 57 55.3 30 28.2 19 18.6 8 39 36 30 28 11 10.7
10 23 21 21 18.3 12 10,1 12 15 11.7 11 9.4 4 3.3 14 6 4 .8 6 4.1 7 5.6 16 3 2.2 2 1 2 1.5 18 1 0.5 20 1 0.5
a) Odd and even prongs from table 6 added together. b) Corrections based on the Monte Carlo calculation of experimental biases.
7 0
6 0
5 0
4 0
50
20 c o ~- I 0 z LLI
> 0 LLI
4° I ~ 30
~ 20
IO
0
20
10
%
• (0)203 GeV(259 Events) /1• [ "~ o ROW Data
[/,/ ~ ,} Corrected Data ~/!' ~, ---Chew-Pignotti , ; I~.X - -Monte Carlo Model
) 291GeV (161 Events)
~-. (c) 424 GeV (85Events) t
2 4 6 B I0 12 14 16 18 20 NUMBER OF CHARGED PRONGS
Fig. 12. Charged prong multiplicity distributions for three energy bins. The open circles are raw data and the closed circles with error flags are data corrected for missing prongs. The indicated
errors are statistical only.
L. W. Jones et aL, Cosmic-ray experiment 507
ties of secondary interactions and track losses, and pairs from n ° - 7's were pro- duced with appropriate probabilities. From the Monte Carlo results, the average dif- ference between the number of observed prongs and generated prongs was found for each multiplicity and energy bin. These differences could then be applied to the ex- perimentally observed prong numbers to correct for the biases. In practice, the loss of a recoil target proton due to range and angle limits is a very probable circum- stance, which is nearly independent of energy or multiplicity. From the Monte Car- lo calculations the probability of observing the recoil proton is about 50%. Because of this fact, the odd prong events were added to the next largest even prong number events. The overall Monte Carlo-computed corrections were then applied to these even-prong events in order to obtain the corrected numbers. In table 7 the uncorrec- ted even prong data and the corresponding corrected numbers are given.
The corrected prong multiplicity distributions are shown in each of three energy bins in fig. 12 where the error bars are given in terms of statistics only. The uncorrec- ted even prong numbers are also given as open circles on the same graphs. Solid curves from the Poisson statistics of charged particle pairs are given on the same graphs, corresponding to the multiperipheral model with pion exchange and/)-pro- duction. Also shown as dotted curves are the older predictions of the Chew-Pignotti model.
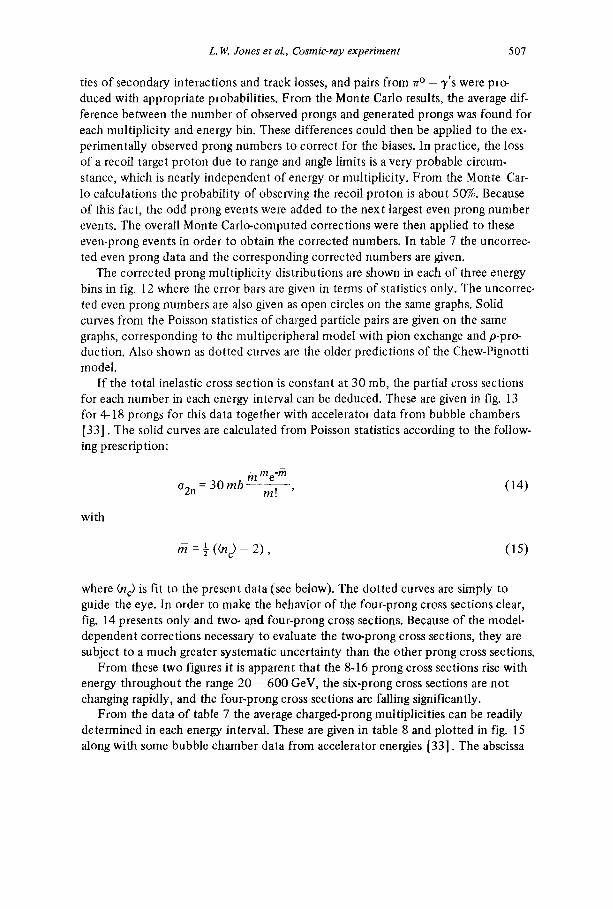
I f the total inelastic cross section is constant at 30 mb, the partial cross sections for each number in each energy interval can be deduced. These are given in fig. 13 for 4-18 prongs for this data together with accelerator data from bubble chambers [33]. The solid curves are calculated from Poisson statistics according to the follow- ing prescription:
me'ff~ a2n= 30rob ~.. , (14)
with
-- ~ (<,7> - 2 ) , ( i s )
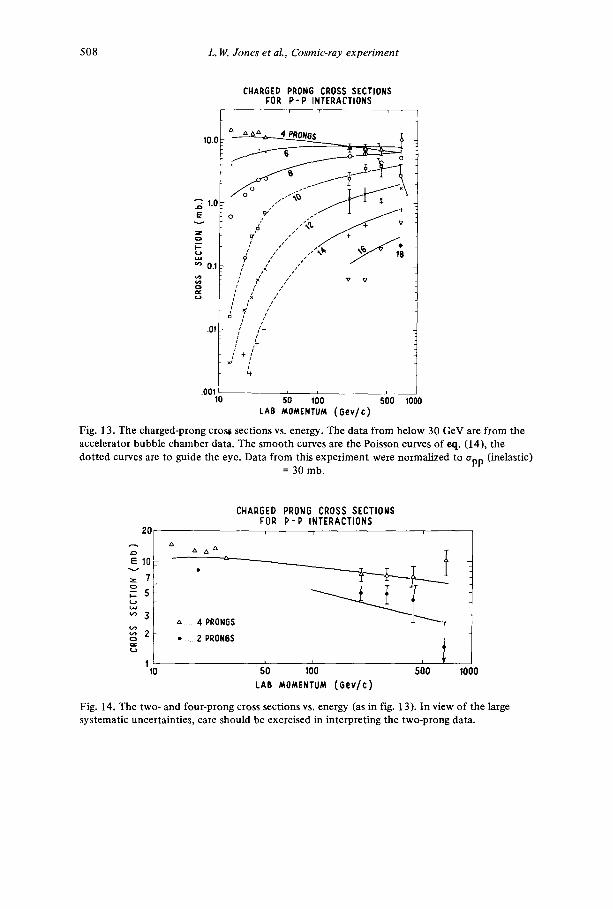
where (n c) is fit to the present data (see below). The dotted curves are simply to guide the eye. In order to make the behavior of the four-prong cross sections clear, fig. 14 presents only and two- and four-prong cross sections. Because of the model- dependent corrections necessary to evaluate the two-prong cross sections, they are subject to a much greater systematic uncertainty than the other prong cross sections.
From these two figures it is apparent that the 8-16 prong cross sections rise with energy throughout the range 20 - 600 GeV, the six-prong cross sections are not changing rapidly, and the four-prong cross sections are falling significantly.
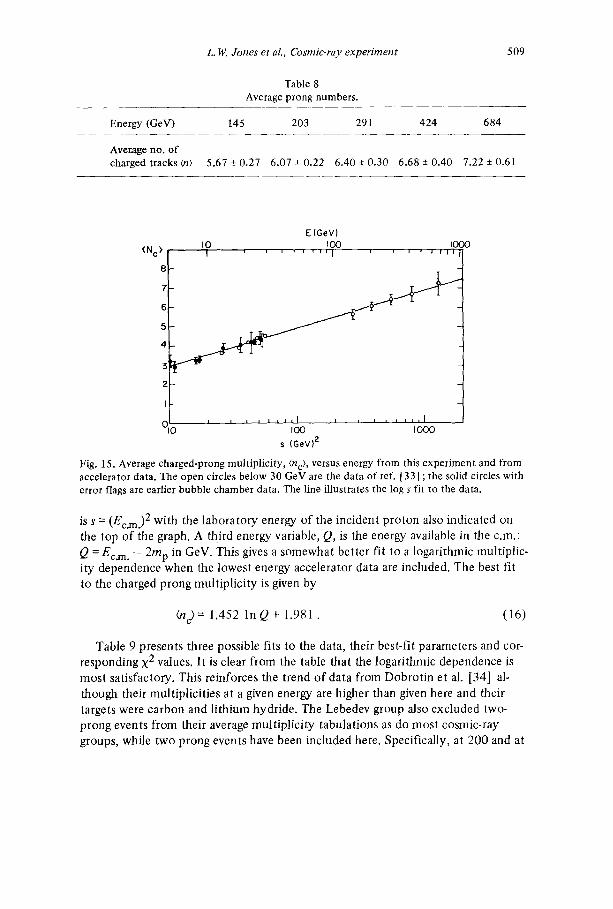
From the data of table 7 the average charged-prong multiplicities can be readily determined in each energy interval. These are given in table 8 and plotted in fig. 15 along with some bubble chamber data from accelerator energies [33]. The abscissa
508 L. W. Jones et aL, Cosmic-ray experiment
10.0
"~ 1.0 E
o ~ I--
'~ 0.1
.0!
CHARGED PRONG CROSS SECTIONS FOR P-P INTERACTIONS
~ . ~ , ~ . ~ '~ ;
o y" j / I / +
,=,, / z / ÷ _ J .
o:~ s t
/ / ,," ~ v / / ' /
/ ! / , ,,f /
/ , t i t
/ / + / ,~-
/ + / >(i /
s i%
.ooi 1 0 - - 5'0 11)0 SO0 1000
LAB MOMENTUM (Oev/c)
Fig. 13. The charged-prong cros~ sections vs. energy. The data from below 30 GeV are from the accelerator bubble chamber data. The smooth curves are the Poisson curves of ex t. (14), the dotted curves are to guide the eye. Data from this experiment were normalized to app (inelastic)
= 30 rob.
CHARGED PRONG CROSS SECTIONS FOR P-P INTERACTIONS
3 2 .. * 2 PRONGS
¢_)
S'O 110 100 500 LAB MOMENTUM (Gev/c)
1000
Fig. 14. The two- and four-prong cross sections vs. energy (as in fig. 13). In view of the large systematic uncertainties, care should be exercised in interpreting the two-prong data.
L. IV. Jones et aL, Cosmic-ray experiment
Table 8 Average prong numbers.
509
Energy (GeV) 145 203 29l 424 684
Aver.age no. of charged tracks(n) 5.67 -+ 0.27 6.07 -+ 0.22 6.40-+ 0.30 6.68 -+ 0.40 7.22-+ 0.61
E{GeV) ( N c , 8 I0 100 ~ ~ _ 0 0 0
I , I I I l ' 1 I [ I I I I I i I l l ° i 'o I OO I o o o
s (GeV} ;z
Fig. 15. Average charged-prong multiplicity, (nc), versus energy from this experiment and from accelerator data, The open circles below 30 GeV are the data of reL [33] ; the solid circles with error flags are earlier bubble chamber data. The line illustrates the log s fit to the data.
is s = (Ec.m.) 2 with the laboratory energy of the incident proton also indicated on the top of the graph. A third energy variable, Q, is the energy available in the c.m.: Q = Ecan. - 2rap in GeV. This gives a somewhat better fit to a logarithmic multiplic- ity dependence when the lowest energy accelerator data are included. The best fit to the charged prong multiplicity is given by
0tc)= 1.452 In Q + 1.981 . (16)
Table 9 presents three possible fits to the data, their best-fit parameters and cor- responding X 2 values. It is clear from the table that the logarithmic dependence is most satisfactory. This reinforces the trend of data from Dobrotin et al. [34] al- though their multiplicities at a given energy are higher than given here and their targets were carbon and lithium hydride. The Lebedev group also excluded two- prong events from their average multiplicity tabulations as do most cosmic-ray groups, while two prong events have been included here. Specifically, at 200 and at
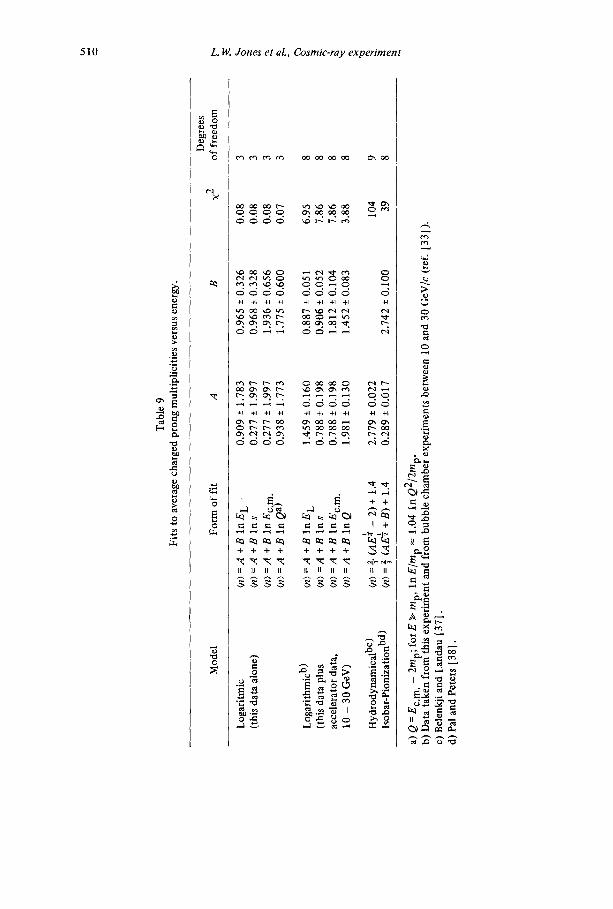
Tab
le 9
F
its
to a
vera
ge c
harg
ed p
rong
mul
tipl
icit
ies
vers
us e
nerg
y.
Deg
rees
M
odel
F
orm
of
fit
A
B
×2
of f
reed
om
Log
arit
mic
~n
) = A
+ B
In
E L
•
0.90
9 -+
1,7
83
0.96
5 +-
0.3
26
0,08
3
(thi
s da
ta a
lone
) (n
) =
A +
BIn
s
0.27
7 -+
1.9
97
0,96
8 +-
0.3
28
0.08
3
(n)
=A
+ B
in
Ec.
m.
0.27
7 -+
1.9
97
1.93
6 +-
0.6
56
0.08
3
(n>
=A
+B
In
Qa)
0.
938
+- 1
,773
1.
775
+- 0
.600
0.
07
3
Log
arit
hmic
b)
~n) =
A +
B I
n E
L
1.45
9 +-
0.1
60
0.88
7 +-
0.0
51
6.95
8
(thi
s da
ta p
lus
~n>
=A
+ B
In
s 0.
788
+- 0
.198
0.
906
+- 0
.052
7.
86
8 ac
cele
rato
r da
ta,
~n>
= A
+ B
In
Ec.
m.
0.78
8 -+
0.1
98
1.81
2 +-
0.1
04
7.86
8
10 -
30
GeV
) 6n
~ =
A +
BIn
Q
1.
981
+- 0
.130
1.
452
+- 0
.083
3.
88
8
1 H
ydro
dyna
mic
al bc
) (n
~ =
-~ (A
E~ -
2)
+ 1
.4
2.77
9 +-
0.0
22
104
9 Is
obar
-Pio
niza
tion
bd)
(n
~ =
~ (A
E~
+ B
)+ 1
.4
0.28
9 +-
0.0
17
2.74
2 -+
0.1
00
39
8
= E
c.m
. -
2mp;
for
E ~
, mp,
In
E/m
p ~-
1.0
4 In
Q2/
2rnp
. a)
a
b) D
ata
take
n fr
om-t
his
expe
rim
ent
and
from
bub
ble
cham
ber
expe
rim
ents
bet
wee
n 10
and
30
GeV
/c (
ref.
[33
] ).
c)
Bel
enkj
i an
d L
anda
u [3
7].
d) P
al a
nd P
eter
s [3
8].
L. W. Jones et al., Cosmic-ray experiment 511
450 GeV, Dobrotin quotes average multiplicities of 8.1 and 10.1 respectively. Ex- cluding two-prong events, the data of table 7 give average multiplicities of 6.93 and 7.50 at 203 and at 424 GeV. Erickson [3,13], using the same data but with an ear- lier form of the Monte Carlo correction program, has reported average multiplicities from hydrogen and carbon from which a ratio of the carbon to the hydrogen multi- plicities may be found. Using his data, the corrected average multiplicities from car- bon excluding two-prong events are 7.6 and 8.7 at these two energies. While still be- low Dobrotin's values, they are within errors and suggest reasonable agreement be- tween the two experiments. It should also be noted that the average multiplicity as measured at accelerators is greater for n - p interactions than for pp interactions. Specifically, Elbert et al. [35] find (n) = 4.85 for 25 GeV/c 7r-p interaction com- pared to (n) ~ 4.0 for pp interactions at the same momentum. As some other cosmic ray experiments find a higher lr/p ratio in their hadron flux [19], they might also find a correspondingly greater average multiplicity than reported here.
More generally, Gibbs, Lord and Goza [36] have shown how the intranuclear cascade leads to higher multiplicities as reported in cosmic-ray studies with nuclear emulsions, and they conclude from their analysis that these emulsion data are com- patible with the hydrogen multiplicities reported here. It appears that the E¼ and other steeper energy dependences accepted earlier by cosmic ray physicists [37,38] are the result of data from heavier nuclei and the intranuclear cascade processes which may occur in these nuclei together with uncertainties in energy estimates.
10. ANGULAR DISTRIBUTIONS
Because of the 90 ° stereo photography employed in the experiment and the lack of momentum analysis, the charged secondaries produced in an interaction were largely indistinguishable and this prevented an indentification of corresponding tracks between the two orthogonal views that would yield spatial angles of the sec- ondaries relative to the incident direction. The angular distributions of the charged secondaries are presented therefore in terms of the variable 0p, the laboratory angle of emission of a secondary relative to the incident direction, projected onto a plane containing the incident particle's trajectory. This was accomplished by a conical re- projection of the measurements made on an event from the film plane to a plane containing the incident trajectory, and made possible through the knowledge of the incident particle's three-space trajectory. Data from the orthogonal views of each event were considered as independent in this analysis.
Since the transverse momenta of the secondaries is expected to peak about some small value, (pT), the projected laboratory angle, 0p, of emission will be predomi- nantly small. The angular distributions are presented therefore in the variable
~p = lOgl0 Itan 0pl = - lOgl0(PL/ IPTx]), (PL > 0 only), (17)
512 L.W. Jones et al., Cosmic-ray experiment
where PTx =,PT COS ~p, the projected component of the transverse momentum. This variable has the effect of stretching the 0p scale in the interesting region of small values of 0p. It might seem more desirable to determine distributions in terms of 7, where
r~ = log tan 0 = - log (PL/PT), (18)
by making track-to-track correlations in the two views. This correlation is very dif- ficult in practice, especially in large multiplicity events. Further, it can be argued that little information is lost by using r/p rather than r~. This argument is based on the observation that PT is of course distributed, perhaps as exp ( - a p~), and no direct measurements of PT are made here. A distribution in r/p = - log (PL/ LPTxl) should then in general differ by on lya scale factor from a distribution in r~ = - log (PL/PT), to the extent that PL >~ PT. Further, if the factorization of eq. (8) is valid, the distribution in r/p should be very nearly like distributions in the vari- able r/<p> = - log (PL/<{PTxI>). The distribution in 'rl<p> is then given by
dN ~)N - 1 dN
dr/(p> 0 [ _ log PL___Z/,] loge P L d p L '
~P Tx ~ (19)
This illustrates how distributions in PL are related to distributions in rl(p> and hence (approximately) in r/p. For example a distribution of the form dN/dPL cx 1/E would give a flat distribution in r/(p>, r/p or ~.
Fig. 16 shows dN/dr/p distributions for four energy intervals. In order to avoid un- certainties brought in by two-prong events, these and subsequent distributions are limited to events with >_- 3 prongs. The model calculations likewise retain only this data subsample. The graph labels are the average energy of events contributing to each plot, corrected by the systematic underestimate of incident energy determined by the calorimeter. There are several effects that bias the distributions:
(i) Experimental angular resolution of 2.3 mr. (ii) Inability to resolve tracks from the same vertex with a projected opening
angle that is less than 2 mr. Off) Contamination from tracks resulting from the interactions of secondaries
with the remaining path of liquid hydrogen or walls of the containing vessel, or from the conversion of 7"s from n ° decay.
(iv) The detection efficiency of the spark chambers for charged tracks with angles to the vertical greater than 40 ° .
(v) 6-rays
L. 14I. Jones et al., Cosmic-ray experiment 513
The first of these is easy to calculate. However, the effects of the rest depend on the energy and angular distribution of secondaries and tertiaries, and the average number of 7r°'s produced. It is necessary therefore to consult the model, project out of it the theoretical dN/dr/p distributions, modify those with the measured physical and geo- metrical biases, and compare the results with the data.
The solid curves superposed on the dN/dr/p distributions (see fig. 16) are the mod- ified theoretical distributions. Here the effects of experimental biases are incorpora- ted into the theoretical predictions rather than being unfolded from the experimen- tal distribution, as in the prong number distributions. This is in part due to the awk- wardness of generating prongs in an angular region where none are detected. It should be noted that prongs from secondary interactions contribute to smaller val- ues of Jr/pl and consequently enhance the asymmetry of the curves*. The model predictions for the rates of the various biases at 200 GeV are:
(a) 8(F//o of tile produced charged tracks from the initial p-p interaction are within 40 ° - 55 ° of the vertical and so are observable.
(b) 70% of the charged tracks produced in secondary interactions are within these limits and are also observable.
(c) 96% of the observable tracks are resolved in a projected view (projected open- ing angle > 2 mr).
(d) 76% of the observed and resolved tracks contributing to the dN/drtp distribu- tions are the charged pions and nucleons from the initial interaction. Of the re- maining: 11% are from the conversion of 3,'s associated with decaying 7r°'s from the initial interaction, and 13% are charged particles resulting from secondary in- teractions.
(e) 5% of the secondaries will produce 6-rays which will also resemble second- aries.
The data are thus consistent with the momentum distribution for produced secondaries predicted by the Monte Carlo model of sect. 6. However, the model final state nucleons do not have the momentum distribution dPt /E; rather, they have a momentum distribution that peaks toward extreme values of PL. This dis- tribution leads to a dN/dr/p distribution for nucleons that has a double-bump struc- ture (in the lab and the c.m.). When added to the pion distribution, then, the nucle- ons populate the edges of the dN/df/p plot. To investigate this experimentally, the angular distributions as ordered dN/dr/p distributions have been plotted. That is, at a fixed charged multiplicity the observed secondary tracks have been ordered by their individual ~lp values and plotted separately. The ordered distributions for six-prong events in the 145 GeV energy bin are presented in fig. 17. Here the top distribution contains the track from each event that had the largest projected angle relative to the beam direction, and the bot tom distribution contains the track with the smallest
* If all particles were completely relativistic the np curves would be completely symmetric; in fact important fractions of the particles are not completely relativistic and the theoretical dis- tributions of Z/p are asymmetric even in the absence of experimental biases.
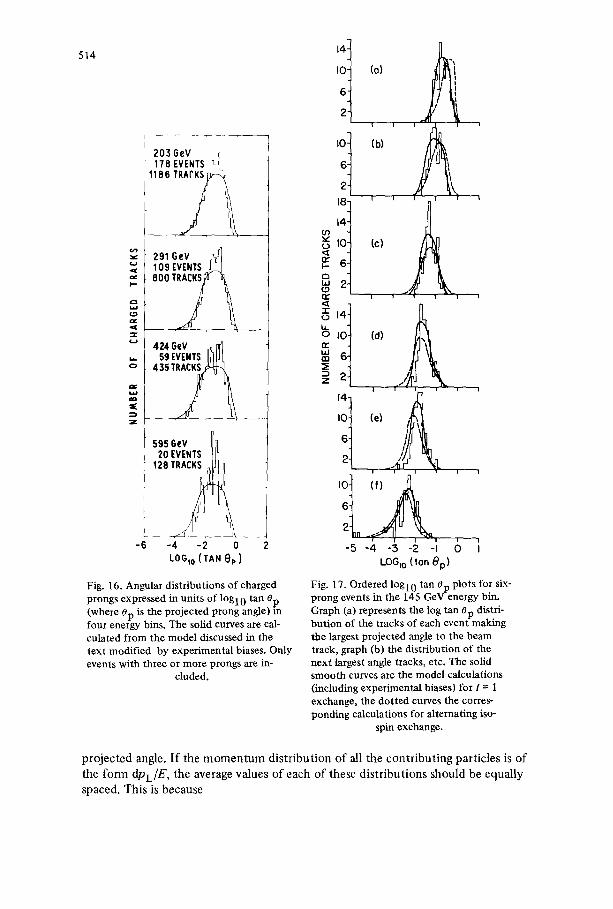
514
I 203 GeV 1186
291 G,v <~ 109 EVENTS .~.._~ <=~F- ~ 8 0 0 T 7 ~ , ,
:z 424GeV nil[/1
59 EVENTS ll) JJ}l 4 3 5 T ~
595 6ev 1~ 20 EVENTS Illl
-6 -4 -2 0 LOG,o (TAN Oe)
Fig. 16. Angular distributions of charged prongs expressed in units of log10 tan 0p (where 0p is the projected prong angle) in four energy bins. The solid curves are cal- culated from the model discussed in the text modified by experimental biases. Only events with three or more prongs are in-
cluded.
I0 (o) i
I i i ~ I , '
lO 1 (b)
14
~ to U
Q :
io (d)
.,Z I i I I i
I0 (e) ,
i i i i l
n ~
-5 -4 -3 -2 -I 0 i LOG,o (tan 0p)
Fig. 17. Ordered lOgl0 tan 0p plots for six- prong events in the 145 GeVenergy bin. Graph (a) represents the log tan 0p distri- bution of the tracks of each evenfmaking the largest projected angle to the beam track, graph (b) the distribution of the next largest angle tracks, etc. The solid smooth curves are the model calculations (including experimental biases) for I = I exchange, the dotted curves the corres- ponding calculations for alternating iso-
spin exchange.
p ro jec ted angle. I f the m o m e n t u m dis t r ibut ion o f all the contr ibut ing particles is o f
the form diaL/E , the average values o f each o f these dis tr ibut ions should be equally
spaced. This is because
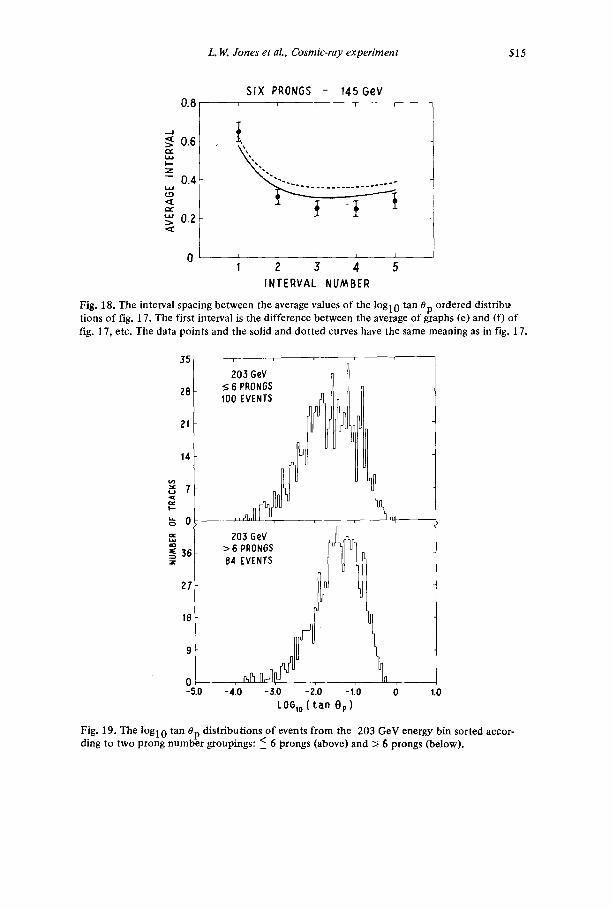
L. W. Jones et aL, Cosmic-ray experiment 515
0.8,
o.Gi t Y
I - -
Z
- 0.4
~ o.z
SIX PRONGS - 145GeV i f ~ " i q ' - -
{
I I | _ _ t
1 z 3 4 5 INTERVAL NUMBER
Fig. 18. The interval spacing between the average values of the lOgl0 tan 0p ordered distribtr tions of fig. 17. The first interval is the difference between the average of graphs (e) and (f) of fig. 17, etc. The data points and the solid and dotted curves have the same meaning as in fig. 17.
35
Z8
Z1
14
7
o
~ 36 z
Z03 GeV G PRONGS
100 EVENTS
203 GeV > 6 PRONGS 84 EVENTS
27
18
0 ~ LII _ _
-5.0 -4.0 -3.0 -2.0 -I.'0 1~ 1.0 LOGIo (tan 0p)
Fig. 19. The lOgl0 tan 0p distributions of events from the 203 GeV energy bin sorted accor- ding to two prong number groupings: < 6 prongs (above) and > 6 prongs (below).
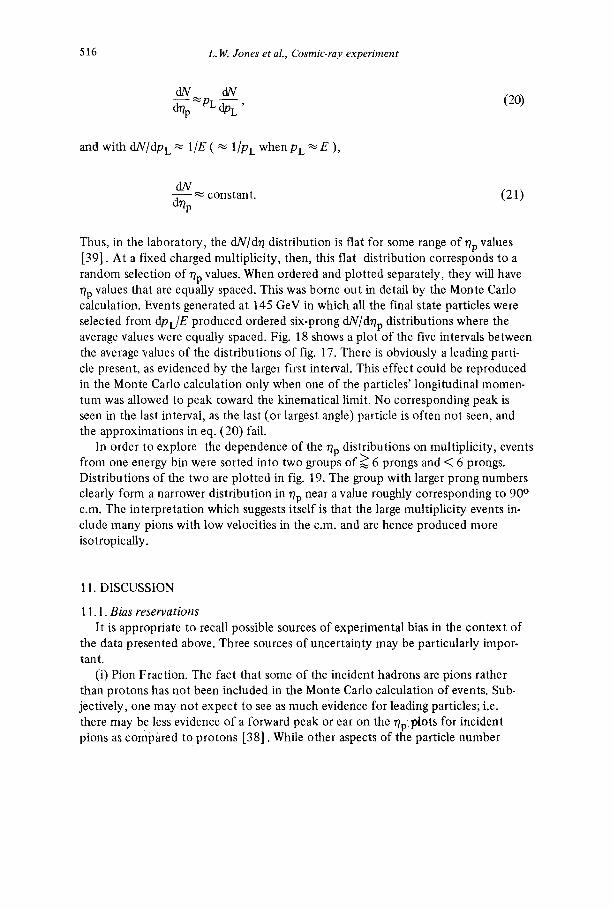
516 L. If. Jones et al., Cosmic-ray experiment
dN dN %*PL (2o)
and with dN/dPL ~ 1/E( ~ 1/PL when pL ~ E ),
dN - - -~ constant. (21) d~p
Thus, in the laboratory, the dN/dr/distribution is flat for some range of Bp values [39]. At a fixed charged multiplicity, then, this flat distribution corresponds to a random selection of r/p values. When ordered and plotted separately, they will have r/p values that are equally spaced. This was borne out in detail by the Monte Carlo calculation. Events generated at 145 GeV in which all the final state particles were selected from dPL/E produced ordered six-prong dN/dr/p distributions where the average values were equally spaced. Fig. 18 shows a plot of the five intervals between the average values of the distributions of fig. 17. There is obviously a leading parti- cle present, as evidenced by the larger first interval. This effect could be reproduced in the Monte Carlo calculation only when one of the particles' longitudinal momen- tum was allowed to peak toward the kinematical limit. No corresponding peak is seen in the last interval, as the last (or largest angle) particle is often not seen, and the approximations in eq. (20) fail.
In order to explore the dependence of the r/p distributions on multiplicity, events from one energy bin were sorted into two groups o f ~ 6 prongs and < 6 prongs. Distributions of the two are plotted in fig. 19. The group with larger prong numbers clearly form a narrower distribution in/)p near a value roughly corresponding to 90 ° c.m. The interpretation which suggests itself is that the large multiplicity events in- clude many pions with low velocities in the c.m. and are hence produced more isotropically.
11. DISCUSSION
11.1. Bias reservations It is appropriate to recall possible sources of experimental bias in the context of
the data presented above. Three sources of uncertainty may be particularly impor- tant.
(i) Pion Fraction. The fact that some of the incident hadrons are pions rather than protons has not been included in the Monte Carlo calculation of events. Sub- jectively, one may not expect to see as much evidence for leading particles; i.e. there may be less evidence of a forward peak or ear on the r/p~10tots for incident pions as compared to protons [38]. While other aspects of the particle number
L. W. Jones et aL, Cosmie-ray experiment 517
distributions, average charged multiplicities and cross sections are much less sensiti- ve to the pion contamination directly, some of these data are corrected differently for the alternating isospin model vis-a-vis the pure isospin-one exchange model. To the extent that the lack of the leading particle peak on the r/p distributions is regard- ed as strong support for the latter model, other data is indirectly (and rather weakly) influenced by the uncertainties related to the pion flux. This could be a more seri- ous bias if some recent Soviet data reporting a n:p ratio as high as 0.6 to 0,75 are borne out [ 19]. (The Soviet data are indeed quite inconsistent with the results of sect. 5 above).
(ii) Spark Chamber Efficiency. There is no proof that small angle tracks are not occasionally missed in both gaps of the lower chamber, especially in events of high multiplicity. However, air shower events have been photographed in similar cham- bers with over 90 tracks resolved, and many checks have been made to search for evidence of missed tracks. Subsequent experiments with heavier elements as targets have shown that these chambers can handle the events with multiplicities between 20 and 30 fairly well and while the data as reported represent the best appraisal of the chamber efficiencies an error here could lead to an underestimate of average multiplicities. Except for possible effects at ~7> - 1.0, there is no reason to suspect any influence on the r/p distributions.
(iii) Angular Distribution Effects. The evidence presented on the dependence of the detected energy on the vertical vertex coordinate of interactions has complex ramifications. The reason for this effect is presumed to be the increased lateral loss of secondaries and hence cascade products for those events further above the calo- rimeter. It is known that average multiplicities are greater for heavier elements than for hydrogen, and larger multiplicities are correlated with lower energies and hence larger angles. Consequently this bias effect may be greater for iron than for hydro- gen, and the magnitude of the correction to the hydrogen cross section based on data from the target vessel may be too great. For the same reason, high multiplicity events from hydrogen may be recorded with a lower energy than low-energy events. This would lead to a systematic underestimate of the number of large multiplicity events and consequently of the average multiplicity.
11.2. Comparison with models Early cosmic-ray experiments had suggested a fireball model of interaction, where
in the final state was presumed to often include an object of baryon number zero which decayed isotropically into pions [41]. The analysis of these data often invol- ved selecting events ex post facto, and seeking some coordinate system in which a fraction of the final state particles were isotropic. While the analysis of the data presented here was quite different, nevertheless it appears that there is no need to introduce the concept of fireballs in order to explain any feature of the data.
In a recent comprehensive review, Frazer et al. [42], discuss the current models of high-energy interactions. They include (a) Mueller analysis, (b) the multiperiph- eral model, (c) diffractive fragmentation, (d) the statistical-thermodynamical model
518 tg. w. Jones et al., Cosmic-ray experiment
and (e) field theoretical models. Some comments are in order on (b), and (d). The multiperipheral model of Chew and Pignotti [ 18] was the basis for the more empiri- cal Monte Carlo model discussed in sect. 7 above, with the modification that pion exchange and o-production fit the data better than vector meson exchange. This is important both in the distributions of multiplicities, wherein the Poisson statistics of pairs of produced paticles gives the best fit to the data, and in the apparent lack of the forward nucleon peak as a consequence of the isospin-one exchange proces- ses. It appears that the multiperipheral model has sufficient flexibility to fit finer details of the data than are experimentally observable here. It predicts scaling, and these data confirm scaling to the extent that they agree with the model. Two theo- retical papers have reached slightly different conclusions here. Bali, Brown and Pec- cei [43] *, have fit these data with a Monte Carlo model similar to the one of sect. 8, and have attempted to include the experimental biases of this experiment in their calculations. They also justify their calculation with the multiperipheral model, but they achieve poorer agreement with the data than reported here. This appears pri- marily to be the result of not including sufficient charge exchange probability for the nucleons, and not accurately computing the angles and numbers of tracks from secondary interactions. Michejda [44], fitting these angular distributions, concludes that they are inconsistent with scaling, in contradiction to the present conclusions. Again it appears that his comparisons did not accurately include bias effects.
The diffraction dissociation models seem to fit some features of the data less well. For example Benecke et al. [45] suggests that all partial prong number cross sections rise asymptotically to a nearly energy-independent value. While this is true within errors for large prong numbers, it seems incompatible with the data for four prong events, where a factor of two drop in four prong cross sections between 20 and 400 GeV seems to occur (fig. 14)**. While Frazer et al.[42] suggest an average multiplicity proportional to I n s may be accommodated by this model, particular calculations by Hwa and Lam [46] and Adair [47] predict different average multi- plicity distributions than are observed. Perhaps there is sufficient latitude in the dif- fractive model to accommodate parameters which fit all features of this data satis- factorily. It must be recognized however that, to date, the diffractive model calcu- lations have fit these data less well than the multiperipheral calculations.
The statistical-thermodynamical model [48] has been compared to these data directly in only one calculation in which Ranft [11] computed a distribution in r?p to compare with the data of fig. 16. Except for a dip near an ~p corresponding to PL (c.m.) = 0, the agreement was reasonable. No central dip in the experimental ~p
* This paper improves on the comparison between their calculation and the present data over an earlier report wherein experimental biases were not included.See N.F. Bali, L.S. Brown, R.D. Peccei and A. Pignotti, Phys. Letters 33B (1970) 175.
** It has been pointed out to us (T.T. Chou, private communication) that the predictions of the limiting fragmentation model might also permit charged prong cross sections to approach a constant value from above. In this case the four prong data might not be inconsistent with that model.
L. I4/. Jones et al., Cosmic-ray experiment 519
curves is seen in any energy bin. There has been no direct comparison between these data and other high-energy
models, although it may be hoped that this paper may stimulate such numerical calculations. This experiment does suggest other inclusive measurements which will further elucidate the nature of the interaction. The ratio of protons to neutrons in the final state nucleon system, the average multiplici ty of neutral pions, and the correlation between neutral pions multiplici ty and charged multiplicity are all mo- del-dependent features.
As the experimental investigation of strong interactions expands into the energy domain between 100 and 2000 GeV with the new generation of accelerators and colliding beams, it is the authors ' hope that this swan song of the cosmic ray contri- bution to that energy range may serve as a guide to the nature of physics in this challenging field.
Many physicists made important contributions to some phases of this experiment, including B. Dayton, R. Hartung, P. Kearney, S. Mikamo, D.E. Pellett, S. Schindler, S. Lal and C. Risk. It is a pleasure to thank them for their valuable assistance. The hydrogen target was engineered and built at the Lawrence Berkeley Laboratory under the direction of E. McLaughlin. The experiment would not have been technically possible without the assistance of W. Winter, J. Hicks, R. Beck and R. Brown of the University of Wisconsin Physical Sciences Laboratory. The use of the CDC 6600 at tile National Center for Atmospheric Research and the generous assistance of the Argonne National Laboratory in providing film and film processing are gratefully acknowledged. The hospital i ty of the theory group of the Lawrence Berkeley La- boratory and valuable discussions with G.F. Chew are also gratefully acknowledged. Finally, the authors wish to thank the Denver University staff, and particularly M. Iona, for making available the facilities of the High Alt i tude Laboratory and for their continuing indispensible assistance and support.
REFERENCES
[ 1 ] L.W. Jones, A.E. Bussian, G.D. DeMeester, B.Wo Loo, D.E. Lyon, P.V. Ramana Murthy, R.F. Roth, J.G.Learned, F.E. Mills, D.D. Reeder, K.N. Erickson and B. Cork, Phys. Rev. Letters 25 (1970) 1679.
[2] D.E. Lyon, A.E. Bussian, G.D. DeMeester, L.W. Jones, B.W. Loo, P.V. Ramana Murthy, R.F. Roth, F.E. Mills, J.G. Learned, D.D. Reeder, K.N. Erickson, B. Cork and C. Risk, Phys. Rev. Letters 26 (1971) 728.
[3] L.W. Jones, A.E. Bussian, G.D. DeMeester, B.W. Loo, D.E. Lyon, P.V. Ramana Murthy, R.F. Roth, J.G, Learned, F.E. Mills, D.D. Reeder, B. Cork, K.N. Erickson, P.D. Kearney and S. Lal, Acta Physica Academiae Scientiarum Hungaricae 29, Suppl. 3, 205 (1970).
[4] L.W. Jones, A.E. Bussian, G.D. DeMeester, D.E. Lyon, B.W. Loo, P.V. Ramana Murthy, R.F. Roth, D.E. PeUett, P.R. Vishwanath, D.D. Reeder, R. Hartung, J.G. Learned, F.E. Mills, S. Mikamo, R.J. Wilkes, K.N. Ericson, P.D. Kearney, B. Cork and B. Dayton,Proc. VI Interamerican Seminar on cosmic rays, La Paz, Bolivia, III (1970) 651.

520 L.W. Jones et aL, Cosmic-ray experiment
[5] L.W. Jones, Proc. Int. Conf. on expectations for particle reactions at new accelerators, University of Wisconsin, 1970.
[61 D.E. Lyon, Jr., Symp. on high energy interactions and multiparticle production, Argonne National Laboratory ANL/HEP 7107 (1970) 1.
[7] D.D. Reeder et al. 15th Int. Conf. on high energy physics, Kiev, 1970; L.W. Jones, Bull. Am. Phys. Soc. 15 (1970) 1587.
[8] A.E. Bussian, G.D. DeMeester. L.W. Jones, B.W. Loo, D.E. Lyon, P.V. Ramana Murthy, R.F. Roth, P.R. Vishwanath, K.N. Erickson, J.G. Learned, D.D. Reeder, J. Wilkes, B. Cork and F.E. Mills, Paper HE-18, 12th Int. Conf. on cosmic rays, Hobart, 1971, Conference Papers, University of Tasmania 3, 1194.
[9] L. Caneschi, D.E. Lyon and C. Risk, Phys. Rev. Letters 25 (1970) 774. [10] L. Caneschi and A. Pignotti, Phys. Rev. Letters 22 (1969) 1219. [11] J. Ranft, Phys. Letters 33B (1970) 481. [12] Y. Tomozawa, Phys. Letters 35B (1971) 331. [ 13] K.N. Erickson, Doctoral thesis, Colorado State University, 1970, University of Michigan
Report HE 70-4, unpublished. [14] G.D. DeMeester, Doctoral thesis, University of Michigan, 1971, University of Michigan
Report HE 71-5, unpublished. [15] Further details of the experiment are contained in refs. [13, 14] and will be published
separately. [16] V.S. Murzin, Progress in elemenl~xy particles and cosmic ray physics, 9 (North Holland,
Amsterdam, 1967). [ 17] C.J. Crannell, H. CranneU, C.R. Gillespie, K. Pinkau and R.R. Whitney, Phys. Rev. 182
(1969) 1435. [18] W.V. Jones, Phys. Rev. 187 (1969) 1868, and private communication. [19] K.Greisen and W.D. Walker, Phys. Rev. 90 (1953) 915 ;
L. Farrow, Phys. Rev. 107 (1957) 1687 ; V.V. Avakian and M.P. Pleshko, Can. J. Phys. 46 (1966) $709; S. Lal et al., Proc. Int. Conf. on Cosmic Rays, Jaipur, Vol. 4, p. 260 (1963); Grigorov et al., Proc. Int. Conf. on cosmic rays, London, Vol. 2, p. 920 (1965); Brooke et al., Proc. Phys. Soc. 83 (1964) 871.
[20] G.F. Chew and A. Pignotti, Phys. Rev. 176 (1968) 2112. [21] R.P. Feynman, High energy collisions - Third Int. Conf. ed. C.N. Yang (Gordon and
Breach, New York, (1969);Phys. Rev. Letters 23 (1969) 1415. [22] W. Galbraith et al., Phys. Rev. 138 (1965) B913;
K.J. Foley et al., Phys. Rev. Letters 19 (1967) 857. [23] G. Belletini et al., Phys. Letters 14 (1965) 164;
S.P. Denisov et al., Phys. Letters 36B (1971) 415. [24] V.V. Akimov et al., Acta Physica Scientiarum Hungaricae 29, Suppl. 3 (1970) 211. [25] M. Holder et al., Phys. Letters 35B (1971) 361. [26] J.C. Allaby et al., Sov. J. Nucl. Phys. 13, 3, (1971) 295-304 [27] L.W. Jones et al., Phys. Letters 36B (1971) 5,509-512 [28] G. BeUetini et al., Nucl. Phys. 79 (1966) 609. [29] M.J. Ryan and C.J. Cranell, private communications. [30] E.L. Androniakashvili et al., Can. J. Phys. 46 (1968) $689. [31] G.L. Bashindjhagyan et al., Paper HE-24, 12 Int. Conf. on cosmic rays, Hobart, 1971,
Conference Papers, University of Tasmania 6 (1971) 2211. [32] G.B. Yodh, J.R. Wayland and Y. zpal. Proc. VI Interamerican Seminar on cosmic rays,
La Paz, Bolivia, III (1970) 706. [33] R. Panvini, p. 461, Third Int. Conf. on high energy collisions, Stoney Brook, New York,
ed. C.N. Yang (Gordon and Breach, 1969); H. Boggild et al., Proc. of the Lund Int. Conf. on elementary particles, Lurid, 1969.
L. W. Jones et al., Cosmic-ray experiment 521
[34] N.A. Dobrotin et al., Can. J. Phys. 46 (1968) $675. [35] J. Elbert, A.R. Erwin, W.D. Walker and J.W. Waters, Nucl. Phys. B19 (1970) 85. [36] R.E. Gibbs, J.J. Lord and E.R. Goza, Proc. VI Interamerican Seminar on cosmic rays,
La Paz, Bolivia, III (1970) 639. [37] S.Z. Belenkji and L.D. Landau, Nuovo Cimento Suppl. 3 (1956) 15;
E. Fermi, Prog. Theor. Phys. 5 (1950) 570; Phys. Rev. 81 (1951) 683. [38] Y. Pal and B. Peters, Mat. Fys. Medd. Dan Vid. Selsk, 33, 3 (1964). [39] D.E. Lyon, Jr., C. Risk and D. Tow. Phys. Rev. D3 (1971) 104. [401 M.S. Chen et al. Phys. Rev. Letters 26, (1971) 1585. [41 ] A good review of the fireball tradition is given by M. Miesowicz, Acta PhysicaAcademiae
Scientiarum Hungaricae 29, 53 (1970) 9. [42] W.R. Frazer, L. Ingber, C.H. Mehta, C.H. Poon, D. Silverman, K. Stowe, P.D. Ting and
H.J. Yesian, University of California at San Diego Preprint UCSD 10P10-83 (1971), to be published in Rev. Mod. Phys.
[43] N.F. Bali, L.S. Brown and R.D. Peccei. Phys. Rev. D4 (1971) 2760. [44] L. Michejda, Institute of Nuclear Research, Warsaw preprint P, 1329/VI/PH (1971), Nucl.
Phys. B, to be published. [45] J. Benecke, T.T. Chou, C.N. Yang and E. Yen. Phys. Rev. 188 (1969) 2159. [46] R.C. Hwa and C.S. Lam, Phys. Rev. Letters 27 (1971) 1098. [47] R.K. Adair, Preprint, A diffraction dissociation model of high energy nucleon-nucleon
interactions (1971), unpublished; Phys.Rev. 172 (1968) 1370. [48] R. Hagedorn, Nucl. Phys. B24 (1970) 93; Astron. Astrophys. 5 (1970) 184; Nuovo Cimen-
to Suppl. 6 (1968) 169;6 (1968) 311; Nuovo Cimento 56A (1968) 1027; S. Frautschi, Phys. Rev. D3 (1971) 2821.