zn and cu via 1, 5 proton shifts and c-n bond cleavage. · 1 supporting information a benzimidazole...
TRANSCRIPT
1
Supporting InformationA Benzimidazole based chemodosimeter for the Fluorometric detection of Zn and Cu via 1, 5 proton shifts and C-N Bond Cleavage.
Sohini Basu Roya, Chandraday Prodhanb, Keya Chaudhurib, Kajal Krishna Rajaka*
aInorganic Chemistry Section, Department of Chemistry, Jadavpur University, Kolkata, 700 032, India. E-mail: [email protected], [email protected] CSIR-Indian Institute of Chemical Biology, Molecular Genetics Division, 4, Raja S. C. Mullick Road, Kolkata – 700032,India
CONTENTS
1)1H NMR spectrum (S1) of compound ligand APBHN........
2)13C NMR spectrum (S2) of compound ligand APBHN......
3) Mass spectrum (S3) of compound ligand APBHN......
4) IR Spectra of Ligand APBHN (S4).
5) Mass spectrum (S5) and (S6) of compound Cu-APBHN Complex.
6) Mass spectrum (S7) and (S8) of compound Zn-APBHN Complex.
7) IR spectra of Cu and Zn complex (S9).
8) Determination of Association constant Zinc and Copper complex (S10).
9) Determination of Detection limits Zinc and Copper complex (S11).
10)Fluorescence spectra of Amino-phenyl benzaimidazole and Hydroxy napthaldehyde(S12).
11) Job’s plot by Fluoresence method of Zinc and Copper complex (S13).
12) Determination of the fluorescence Quantum yield (Table1).
13) Photoluminescence decay of ligand APBHN (S14).
14) Computational study (Table2).
15 ) Crystal Data
16) EPR Study
Electronic Supplementary Material (ESI) for Photochemical & Photobiological Sciences.This journal is © The Royal Society of Chemistry and Owner Societies 2017

2
1H NMR spectrum of Compound APBHN
Fig S1: 1H NMR spectrum of APBHN.
N
N
NH
OH

3
13C NMR spectrum of Compound APBHN
FigS2:13C NMR spectrum of Compound APBHN.
4
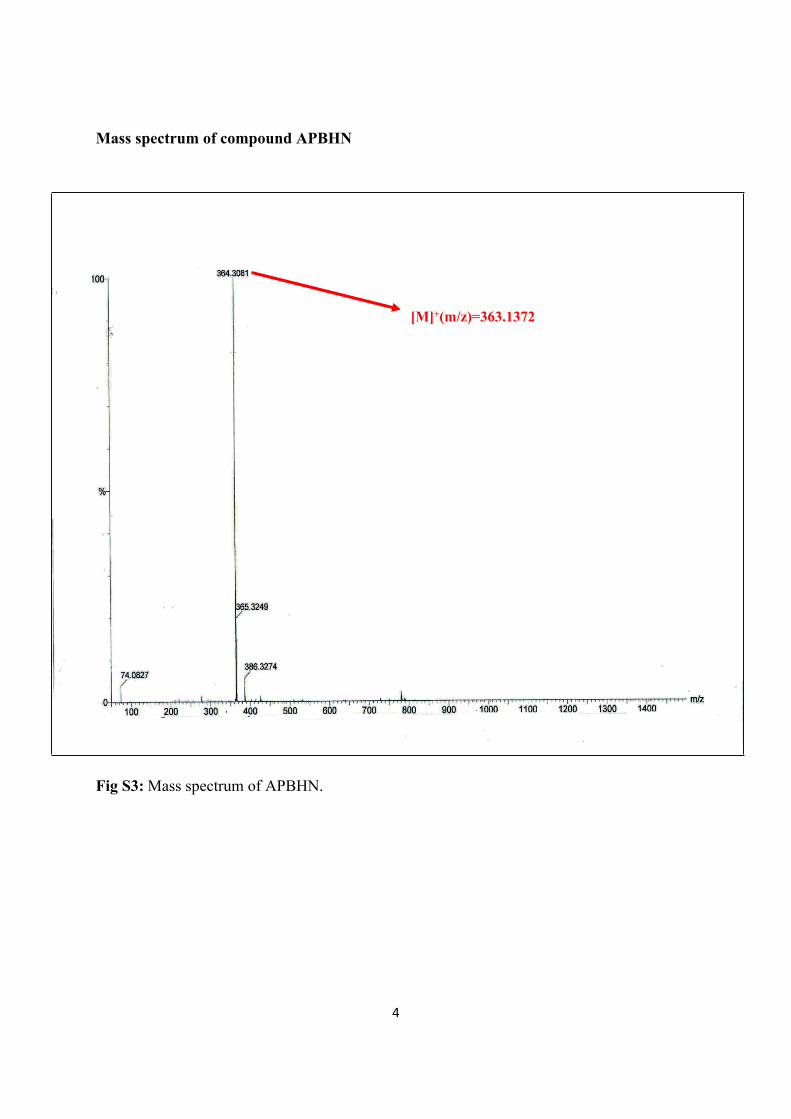
Mass spectrum of compound APBHN
Fig S3: Mass spectrum of APBHN.
[M]+(m/z)=363.1372
5
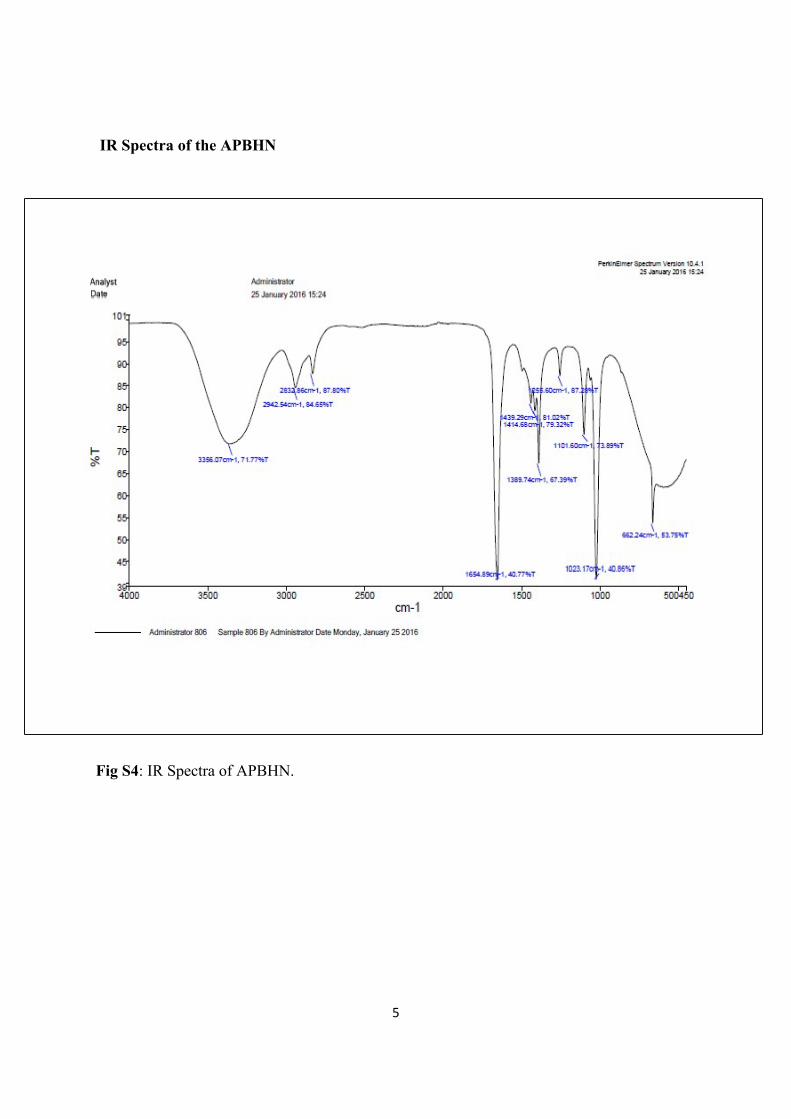
IR Spectra of the APBHN
Fig S4: IR Spectra of APBHN.
6
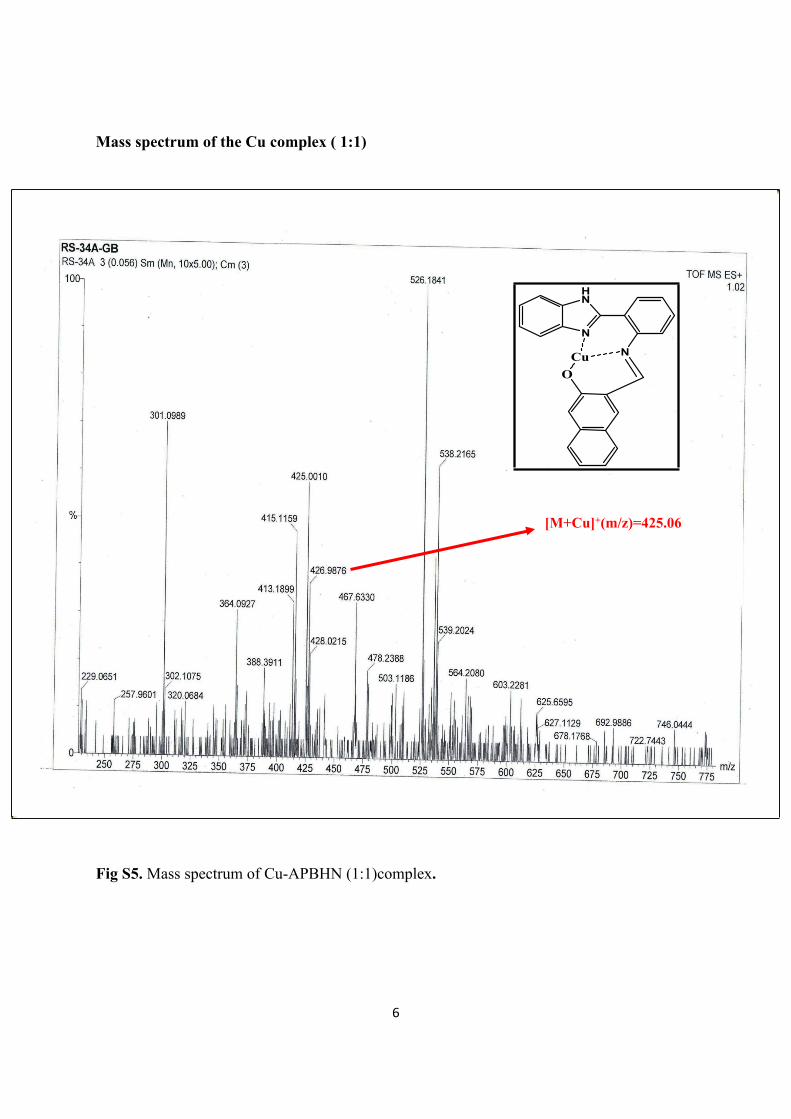
Mass spectrum of the Cu complex ( 1:1)
Fig S5. Mass spectrum of Cu-APBHN (1:1)complex.
[M+Cu]+(m/z)=425.06
N
HN
NCuO

7
Mass spectrum of the Cu complex (1:2)
Fig S6. Mass spectrum of Cu-APBHN(1:2) complex.
[M+Cu]+(m/z)=787.1872
N
N
N
O
N
N
N
OCuH
H

8
Mass spectrum of the Zinc Complex(1:1).
FigS7: Mass spectrum of Zn-APBHN(1:1) complex.
[M+Zn]+(m/z)=426.06
N
HN
NZnO
9
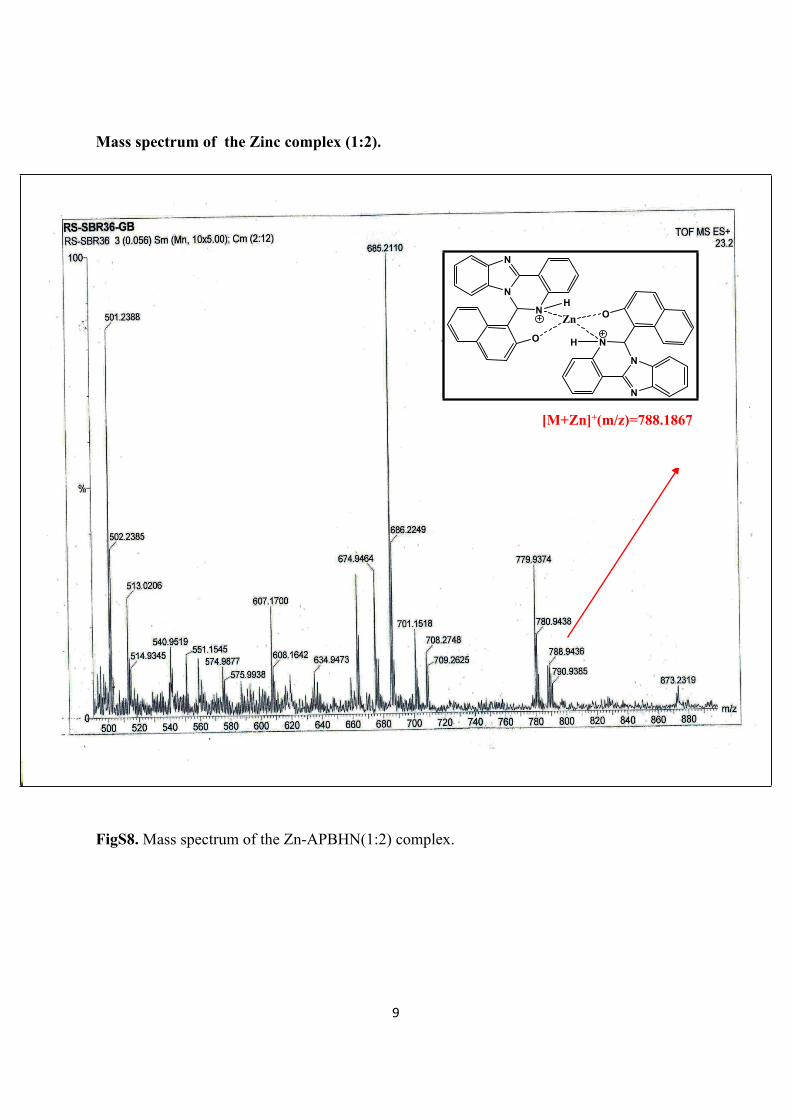
Mass spectrum of the Zinc complex (1:2).
FigS8. Mass spectrum of the Zn-APBHN(1:2) complex.
[M+Zn]+(m/z)=788.1867
N
N
N
O
N
N
N
OZnH
H
10
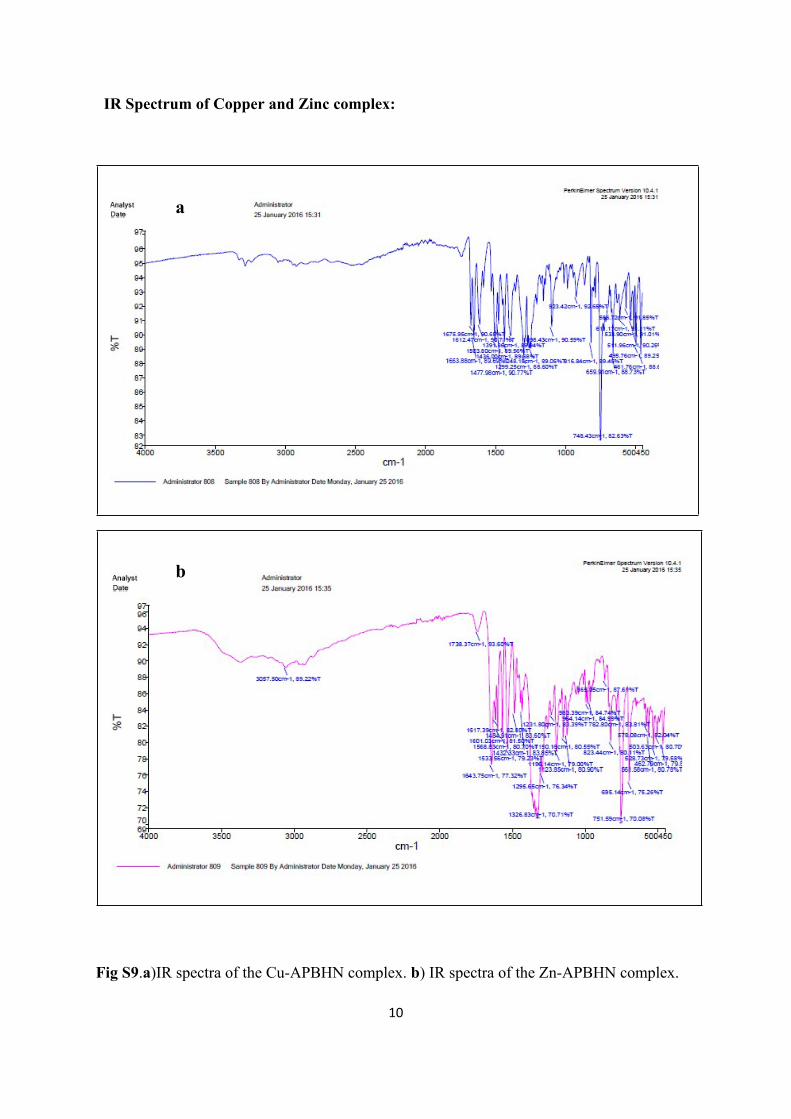
IR Spectrum of Copper and Zinc complex:
Fig S9.a)IR spectra of the Cu-APBHN complex. b) IR spectra of the Zn-APBHN complex.
a
b
11
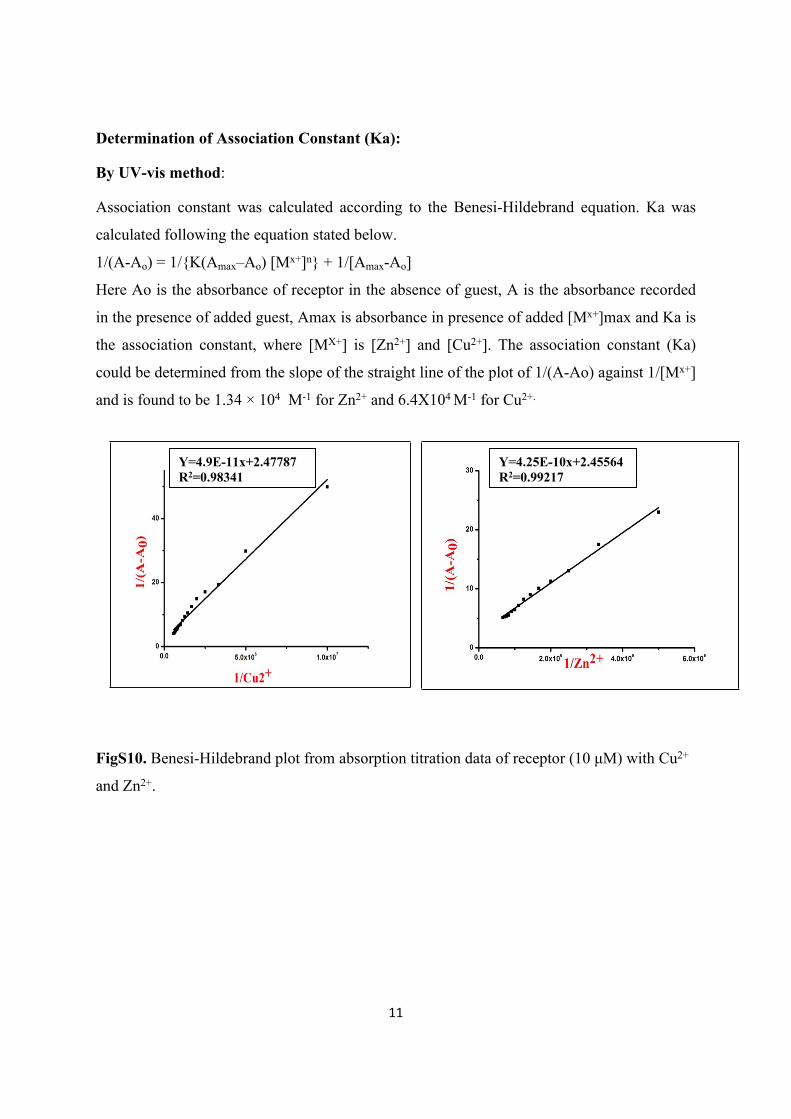
Determination of Association Constant (Ka):
By UV-vis method:
Association constant was calculated according to the Benesi-Hildebrand equation. Ka was
calculated following the equation stated below.
1/(A-Ao) = 1/{K(Amax–Ao) [Mx+]n} + 1/[Amax-Ao]
Here Ao is the absorbance of receptor in the absence of guest, A is the absorbance recorded
in the presence of added guest, Amax is absorbance in presence of added [Mx+]max and Ka is
the association constant, where [MX+] is [Zn2+] and [Cu2+]. The association constant (Ka)
could be determined from the slope of the straight line of the plot of 1/(A-Ao) against 1/[Mx+]
and is found to be 1.34 × 10⁴ M-1 for Zn2+ and 6.4X10⁴ M-1 for Cu2+.
FigS10. Benesi-Hildebrand plot from absorption titration data of receptor (10 μM) with Cu2+
and Zn2+.
Y=4.9E-11x+2.47787R2=0.98341
Y=4.25E-10x+2.45564R2=0.99217
12
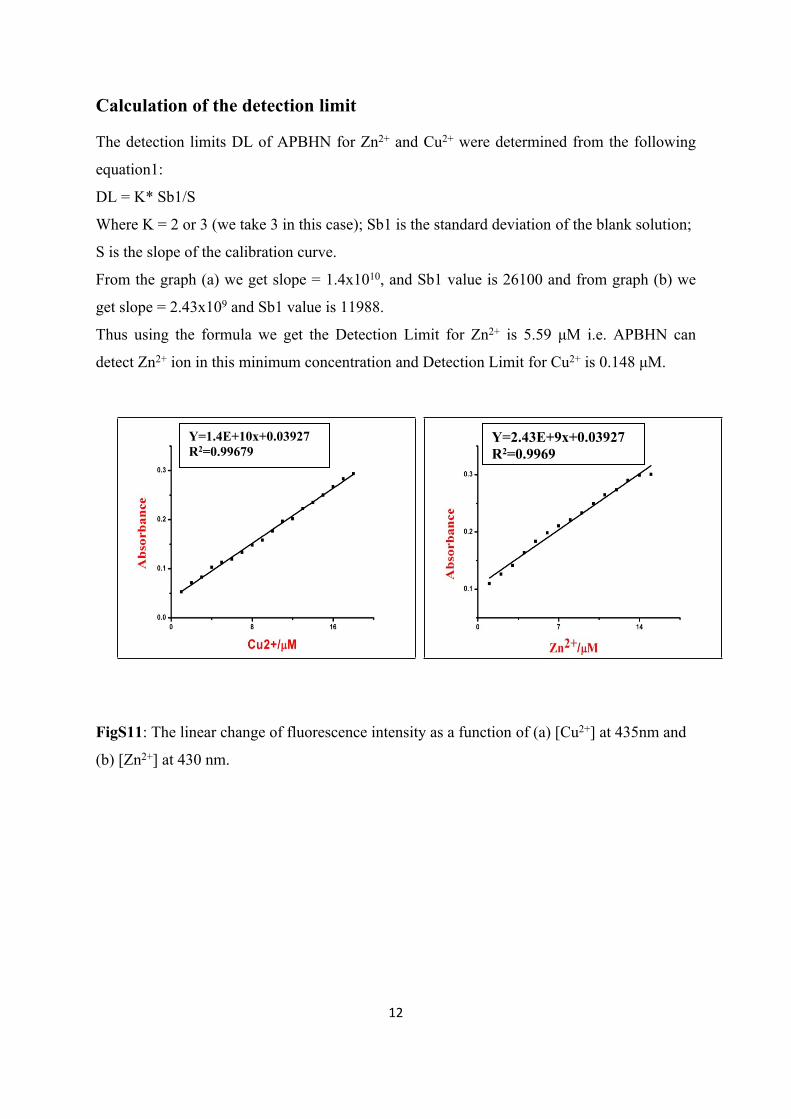
Calculation of the detection limit
The detection limits DL of APBHN for Zn2+ and Cu2+ were determined from the following
equation1:
DL = K* Sb1/S
Where K = 2 or 3 (we take 3 in this case); Sb1 is the standard deviation of the blank solution;
S is the slope of the calibration curve.
From the graph (a) we get slope = 1.4x10¹⁰, and Sb1 value is 26100 and from graph (b) we
get slope = 2.43x10⁹ and Sb1 value is 11988.
Thus using the formula we get the Detection Limit for Zn2+ is 5.59 μM i.e. APBHN can
detect Zn2+ ion in this minimum concentration and Detection Limit for Cu2+ is 0.148 μM.
FigS11: The linear change of fluorescence intensity as a function of (a) [Cu2+] at 435nm and
(b) [Zn2+] at 430 nm.
Y=1.4E+10x+0.03927R2=0.99679
Y=2.43E+9x+0.03927R2=0.9969

13
Fluorescence Spectra:
FigS12.Fluoresence Intensity plot of a) Amino-phenyl Benzaimidazole and b) hydroxy
napthaldehyde.
Job’s plot by absorbance method:
Stock solution of same concentration of sensor and Zn2+ and Cu2+ was prepared in the order
of 10 μM in (at 25 °C) at pH 7.4 in HEPES buffer. The emission spectrum in each case with
different host–guest ratio but equal in volume was recorded. Job’s plots were drawn by
plotting ΔI.Xhost vs Xhost (ΔI = change of intensity of the emission spectrum during titration
and Xhost is the mole fraction of the host in each case, respectively).

14
FigS13. Jobs plot diagram of HAFPA for a) Cu2+ and b) Zn2+(where Xh is the mole fraction
of host and ΔI indicates the change of the intensity).
The highest peak at 0.45 indicates the formation of both 1:1 and 1:2 complexes.
Determination of the fluorescence quantum yield
Here, the quantum yield φ was measured using the following equation:
X =S X (Ix/Is) X (Ax/As) X (nx/ns)2
where X and S indicate the unknown and standard solution respectively, φ = quantum yield, I
= area under the emission curve, A = absorbance at the excitation wavelength, and n =index
of refraction of the solvent. Here φ measurements were performed using quinine sulphate in
ethanol as a standard [φ =0.54] (error ∼ 10%).
Photophysical parameters of the complexes in Methanol solution at room temperature. Table (S1):
Sample max, nm(M1 cm1)
emi, nm Φ (103) kr, s-1 ( 105)
knr, s-1 ( 108)
ns
ns
Ligand 398(12612818.3), 480(12713784)
385,480 0.76 7.10(385)7.18(480)
1.77(385)1.77(480)
Cu Complex
385(1510855440)430(1298335905)480(1510855440)
385,430,480
0.64(385)0.74(430)0.64(480)
7.55(385)7.12(430)2.16(480)
2.94(385)3.19(430)8.46(480)
8.47(385)1.95(430)2.96(480)
3.39(385)7.82(430)1.18(480)
Zn Complex
385(1346850575)430(1254777430)480(1510855440
385,430,480
0.72(385)0.74(430)0.72(480)
8.15(385)6.04(430)2.80(480)
7.21(385)4.24(430)2.61(480)
9.44(385)1.29(430)2.60(480)
3.77(385)5.18(430)1.04(480)

15
Photoluminescence Decay of ligand APBHN
Fig.S14 :(a) Changes in the time-resolved photoluminescence decay of Ligand APBHN in methanol at room temperature obtained with 300 nm excitation. The emission at 385 and 480 nm was monitored. (b) Change in the absorbance as bar representation of APBHN (c = 1.0 X 10⁻⁵ M) after addition of 1.0 equiv. of each of the guest cations (c = 2.0 X 10⁻⁴ M) to CH3OH–10 mM aqueous HEPES buffer (8/2, v/v, 25 °C) at 430 nm.
Computational Method
Full geometry optimizations were carried out using the density functional theory (DFT)
method at the Becke-3-Lee-Yang-Parr(B3LYP) 24 level for the ligand APBHN and its Zn2+
and Cu2+ complexes. The 6-31+G (d,p) basis set was assigned for all the elements. All
calculations were performed with Gaussian03program with the aid of the Gauss View
visualization program.

16
Table (S2). Vertical electronic excitations of APBHN,Zn2+-APBHN and Cu2+- APBHN calculated by TDDFT/B3LYP/CPCM method.
Compoud Excitation Theoretical Wavelength(nm)
CI expt. (nm)
APBHN HOMO-1 LUMO+3HOMO LUMO+2
HOMO-2 LUMO
HOMO-1 LUMO
228229
288
339
0.60040.6325
0.6932
0.6081
Cu-APBHN (1:2)
HOMO-1 LUMO+3
HOMO-2 LUMO+1
360
436
0.8680
0.5825
Cu-APBHN (1:1)
HOMO-1 LUMO
HOMO LUMO+1HOMO-1 LUMO
433
366
0.3417
0.37690.1169
Zn-APBHN (1:2)
HOMO-3 LUMO+2
HOMO-1 LUMO
340
422
0.16673
0.23471
Zn-APBHN (1:1)
HOMO LUMO+2
HOMO LUMO+2
HOMO LUMO+3
420
333
291
0.2929
0.2209
0.2697

17
Crystal Data
Table S3: (a) Crystal data and structure refinement parameters for ligand APBHN. b) ORTEP
plot and atom labelling scheme of 1 at 50% ellipsoid probability. Hydrogen atoms are
omitted for clarity
2APBHN,2C3H7NO
Formula C54H48N8O4
Mr 872
Crystal system Monoclinic
Space group Cc
a / Å 33.1101 (12)
b / Å 8.5492 (3)
c / Å 16.6530(6)
/ 90.00 (1)
/ 99.906 (1)
/ 90.00 (1)
V /Å3 4643.6(3) (2)
Z 8
Dcalcd /mg m3 1.246
/mm1 0.081
/ 2.28-32.3
T /K 293(2)
Reflns collected 8079
R1,a wR2b [I > 2(I)] 0.0798, 0.2489
GOF on F2
CCDC no
1.029
1430234
18
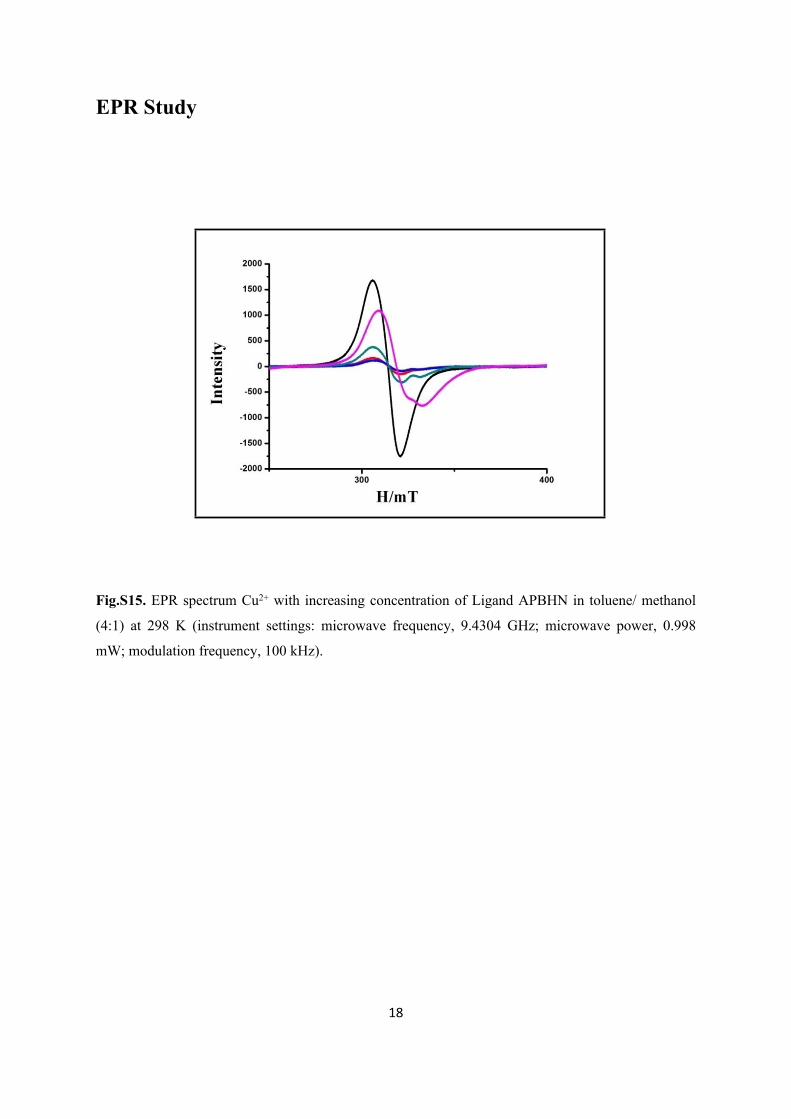
EPR Study
Fig.S15. EPR spectrum Cu2+ with increasing concentration of Ligand APBHN in toluene/ methanol
(4:1) at 298 K (instrument settings: microwave frequency, 9.4304 GHz; microwave power, 0.998
mW; modulation frequency, 100 kHz).