corpus christi, texas...corpus christi regional transportation authority corpus christi, texas...
TRANSCRIPT


Corpus Christi Regional Transportation Authority
Corpus Christi, Texas
Comprehensive Annual Financial Report For the Years Ended December 31, 2016 and 2015
Mission Statement
The Corpus Christi Regional Transportation Authority was created by the people to provide quality transportation and enhance the regional economy in a responsible manner consistent with its financial resources and the diverse needs of our community.
Prepared by the Finance Department


2016 Introductory Section
Comprehensive Annual Financial Report

i
CORPUS CHRISTI REGIONAL TRANSPORTATION AUTHORITY
COMPREHENSIVE ANNUAL FINANCIAL REPORT
TABLE OF CONTENTS INTRODUCTORY SECTION
Page
Table of Contents ............................……...........................................……………….. i Letter of Transmittal ....................…......................................……………………….. iii GFOA Certificate of Achievement …….……………………………………………. ix Board of Directors and Administration ……………..................…………………….. x Organizational Chart................................…...........................……………………….. xi
FINANCIAL SECTION
Independent Auditor's Report ...............................................…………….………….. 1 Management's Discussion and Analysis ....................................………….….……… 5 Basic Financial Statements:
Statement of Net Position .........................................………………….…………. 19 Statement of Revenues, Expenses and Changes in Net Position..……………...… 20 Statement of Cash Flows .............................................………………...………… 21 Fiduciary Funds - Statement of Net Position.....................……………………….. 23 Fiduciary Funds - Statement of Changes in Net Position........…………………… 24 Notes to Financial Statements ......................................……………………..…… 25
Required Supplementary Information: Schedule of Pension Plan ......................................……………………..…… 53 Schedule of Defined Benefits Contributions........................…………………….. 54 Schedule of Funding Progress for Other Post-Employment Benefits……………. 56
Supplemental Schedules: Schedule of Revenues and Expenses - Actual and Budget by Function ...………. 59 Fiduciary Funds - Combining Statement of Net Position............………………… 60 Fiduciary Funds - Combining Statement of Changes in Net Position………...… 61 Schedule of Long-Term Debt Amortization……………………………………… 62

ii
STATISTICAL SECTION
Statistical Section Narrative …………………………………………………………. 65 Table 1 Net Position.........................................….…………..………………………... 66 Table 2 Changes in Net Position…………………………..…………………………. 68 Table 3 Revenues by Source .........................................................…………….….…. 70 Table 4 Revenues and Operating Assistance - Comparison to Industry Trend Data.... 71 Table 5 Passenger Fee Capacity ……………………………………………………... 72 Table 6 Miscellaneous Revenue Information ………………………………………... 73 Table 7 Ratio of Outstanding Debt………………………………………………….… 74 Table 8 Revenue Bond Coverage…………………………………………………….. 75 Table 9 Demographic Statistics ….....................................................………………… 76 Table 10 Top Ten Employers ..........................................…………………………….. 77 Table 11 Budgeted Full-Time Equivalent Position......................................………….. 78 Table 12 Operating Statistics and Assets Utilized ……………………………………. 80 Table 13 Miscellaneous Statistics …………………………………………………..... 82
SINGLE AUDIT SECTION
Independent Auditor's Report on Internal Control over Financial Reporting and Compliance and Other Matters based on an Audit of Financial Statements Performed in Accordance With Government Auditing Standards ......................................…………………… 83
Independent Auditor's Report on Compliance for each Major Federal Program and on Internal Control over Compliance Required by the Uniform Guidance ………...………………………………………………….. 85
Schedule of Findings and Questioned Costs .......................................……...………… 87 Schedule of Expenditures of Federal Financial Awards ………....…………………… 89 Notes to Schedule of Expenditures of Federal Financial Awards................................... 90

iii
602 N. Staples Corpus Christi, Texas 78401 (361) 289-2712
June 28, 2017 Curtis Rock, Board Chair
and Members of the Board of Directors of the Corpus Christi Regional Transportation Authority Dear Board Chair, Board Members, and Citizens:
Management is pleased to submit to you this Comprehensive Annual Financial Report (CAFR) of the Corpus Christi Regional Transportation Authority (Authority) for its fiscal year ended December 31, 2016. This CAFR is indicative of the Authority management’s continued commitment to provide high quality, complete, concise and reliable financial information about the Authority.
Management assumes full responsibility for the completeness and reliability of this information based on a comprehensive framework of internal controls established for this purpose. Because the cost of internal controls should not outweigh the benefits, the Authority’s system of controls has been designed to provide reasonable, rather than absolute, assurance that the financial statements will be free from material misstatement.
Pursuant to Section 451.451, Subchapter J, of the Texas Transportation Code, the financial statements contained herein are required to be independently audited. The Authority is also required by f e d e r a l regulations to undergo an audit related to its federal grants. The independent firm of Collier, Johnson & Woods, P.C., Certified Public Accountants, has issued an unmodified (clean) opinion on the Authority’s financial statements. Their opinion letters are presented first in the Financial and Single Audit sections of this CAFR.
Management’s Discussion and Analysis (MD&A) immediately follows the independent auditor’s report and provides a narrative introduction, overview and analysis of the basic financial statements. The MD&A complements this letter of transmittal and should be read in conjunction with it.

Corpus Christi Regional Transportation Authority Fiscal 2016 Comprehensive Annual Financial Report Introductory Section | Letter of Transmittal
iv
PROFILE OF THE AUTHORITY
The Authority was created in 1985 by majority vote of the taxpayers and commenced operations on January 1, 1986. Note 1 in the Financial Section provides more details about the Authority as a legal entity.
Located in Corpus Christi, Texas on the coast of the Gulf of Mexico, the Authority is a regional provider of mass transportation services, primarily within Nueces County and also part of San Patricio County. Nueces County includes the cities of Agua Dulce, Bishop, Corpus Christi, Driscoll, Port Aransas, Robstown, and unincorporated areas. San Patricio County coverage includes the cities of Gregory and San Patricio. The total area is 838 square miles and has an estimated population of 359,154. A map of the Authority’s service area is presented below.
Corpus Christi Regional Transportation Authority Fiscal 2016 Comprehensive Annual Financial Report Introductory Section | Letter of Transmittal
v
Services and Service Delivery
Either directly or through contractors, the Authority provides virtually all public transportation services in this area. These services include fixed route, paratransit, vanpool, and specialized services. The Authority maintains 1,383 bus stops, five transfer stations, three park and ride lots and a fleet of 70 fixed route and 3 4 paratransit vehicles. Certain commuter and paratransit services are provided through contractors specializing in these services. Table 12 in the Statistical Section contains service delivery statistics for the past ten years.
Officials
An eleven-member Board of Directors (Board) governs the Authority. The City of Corpus Christi, Nueces County and the Committee of Small City Mayors appoint members to the Board, excluding the Chair. The Board makes decisions, designates management, significantly influences operations and maintains primary fiscal accountability.
The Board establishes policy and sets direction for the Authority. The Board is made up of a chair and ten members. Five members are appointed by the City of Corpus Christi, three members are appointed by the Nueces County Commissioners and two members are appointed by participating small cities. The Chair is appointed by the sitting Board members. The Board members serve overlapping two-year terms. A listing of Authority Board members is included on page x.
Executives
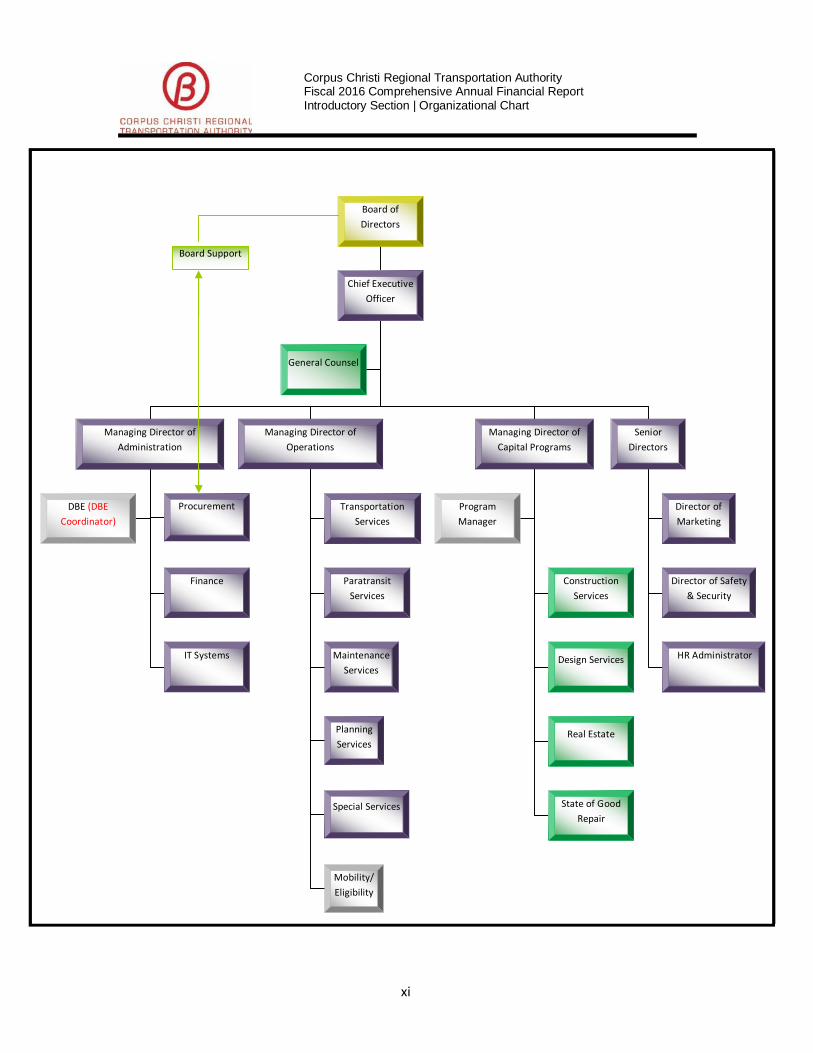
A Chief Executive Officer (CEO) is responsible for the daily operations of the Authority. The CEO supervises three major divisions including Administration, Capital Programs, and Operations. These broad divisions are organized into numerous departments for operational efficiency. The Authority has more than 268 employees in addition to about 100 staff employed by various contractors. An organizational chart is shown on page xi.
Budget and Initiatives
The Board is required to adopt an annual operating budget before the beginning of each fiscal year. The budget serves as a policy document, an operations guide, a financial plan and a communication device. The board also adopts an annual capital budget. The process for developing the Authority’s budgets typically begins with Board strategic planning in June or July and, through a series of meetings and analysis, results in an operating budget and a prioritized capital budget prior to the beginning of the fiscal year. The Authority may not spend more than the approved operating budget, and must approve increases to the budget. The CEO may permit movement of funds within the approved budget. If these reallocations are significant, Board approval is obtained.

Corpus Christi Regional Transportation Authority Fiscal 2016 Comprehensive Annual Financial Report Introductory Section | Letter of Transmittal
vi
Budgetary initiatives for the 2016 Operating Budget include a 5% step increase for bus operators and a 2% cost of living adjustment (COLA) increase for non-bus operators. $345,908 was reserved for these potential adjustments. Health care costs are budgeted to increase 20.56%, and interest payments totaling $1,064,245 for bonds issued to fund the construction of the Staples Street Center (completed May 2016), which houses Administrative and Executive staff, Customer Services, and our Mobility Management department are included in the 2016 budget.
The major focus of the 2016 Capital Budget is to complete the Staples Street Center. Additional capital projects include adding more CNG vehicles to the fleet, funding for Bus Stop Improvements, continued improvements to bus stops to benefit ADA riders, installation of a trip-end bike facility, and a software application for the tracking of State of Good Repair. Most of these projects were started in 2016 and will be completed in 2017.
LOCAL ECONOMY
The regional economy is diversified and includes naval air training, shipping, fishing, tourism, petrochemical refining, construction, agriculture, health care, government services and higher education. The region has a varied base that adds to the relative stability of employment. The estimated unemployment rate in Nueces County was 5.1% in 2016 compared to 4.2% in 2007. Per capita income rose from $33,797 in 2007 to $46,102 in 2016.
The Authority’s ability to fund its operations is heavily dependent on a ½-cent sales and use tax generated from its regional economy. Sales tax revenues have grown at an annual average of 4.91% over the past ten years compared to average growth in operating expenses, including depreciation, of 5.49% over the same period. The Authority continues to operate with its original transit tax rate of ½-cent. The current overall sales and use tax rate for the Corpus Christi area is 8.25%, which is the maximum allowed by current law. As activity in the Eagle Ford Shale and its ancillary business activities slowed down, sales tax revenue declined, with a decrease of 9% from 2015 to 2016. Sales taxes have begun to stabilize in the first half of 2017, as there is optimism in the area with renewed activity in the Eagle Ford Shale, along with the announcement of the construction of a petroleum cracker plant in the Gregory community.
In 2016, the average fuel prices for both diesel and unleaded fuel dropped $0.28 and $0.38, respectively, from 2015 prices. However, over the past ten years both diesel and unleaded prices have increased by over 70% and 60%, respectively. Over time, higher fuel costs impact the Authority’s ability to afford fuel needed to provide services. Rising fuel costs also impact the cost of maintenance materials for the Authority’s fleet and energy prices associated with the Authority’s customer amenities. In response to these
Corpus Christi Regional Transportation Authority Fiscal 2016 Comprehensive Annual Financial Report Introductory Section | Letter of Transmittal
vii
high costs, in 2012, the Authority began the conversion of its fleet to CNG, and continues replacement with CNG vehicles to maximize cost savings. At the end of 2016, nearly 69% of the Authority’s fleet was operating on CNG. The pricing for CNG at the end of 2016 was $0.76 per gallon equivalent, which compared to diesel prices, continues to create cost savings. Long-Range Financial Planning
Due to the significant capital investment in buses and bus facilities used for service delivery and the operating cost growth challenges experienced by transit systems across the country, the Authority maintains 20-year long-term financial projections. A primary goal of long term planning is to ensure that adequate resources are maintained for the replacement of capital assets and system expansion. Financial projections are maintained and updated when significant events occur that warrant changes to the underlying assumptions. In 2012 the Authority’s long range financial plan was updated as part of a long range system plan update, and is reviewed annually, making adjustments as needed.
Capital projects that were completed in 2016 include the Staples Street Center, primarily funded by a combination of taxable and non-taxable bonds issued in late 2013, in May, the installation of an interactive wall for veterans’ information for approximately $153,000, and various improvements to bus amenities such as Wi-Fi and bus stops and . In 2017, the Authority expects to continue with its improvements in bus stops in order to expand on ADA services provided to riders.
AWARDS AND ACKNOWLEDGEMENTS
The Government Finance Officers Association of the United States and Canada (GFOA) awarded a Certificate of Achievement for Excellence in Financial Reporting to the Authority for its comprehensive annual financial report for the fiscal year ended December 31, 2015. In order to be awarded a Certificate of Achievement, a government must publish an easily readable and efficiently organized comprehensive annual financial report. This report must satisfy both generally accepted accounting principles and applicable legal requirements.
A Certificate of Achievement is valid for a period of one year only. We believe that our current comprehensive annual financial report continues to meet the Certificate of Achievement Program’s requirements and we are submitting it to the GFOA to determine its eligibility for another certificate. We express appreciation to the staff of the Finance Department for the significant investment of time and effort needed to prepare this report. Thank you to executive management for their various contributions to the information contained in this report.

Corpus Christi Regional Transportation Authority Fiscal 2016 Comprehensive Annual Financial Report Introductory Section | Letter of Transmittal
viii
We also express deep appreciation for the innumerable efforts of our bus operators, street supervisors, dispatchers, trainers, security, safety personnel, mechanics, fleet service workers and facility maintenance staff who are directly involved with the daily provision of service to our customers.
Jorge Cruz-Aedo Robert M. Saldaña Chief Executive Officer Managing Director, Administration

ix
Corpus Christi Regional Transportation Authority Fiscal 2016 Comprehensive Annual Financial Report
Introductory Section | GFOA Certificate of Achievement

x
Corpus Christi Regional Transportation Authority Fiscal 2016 Comprehensive Annual Financial Report Introductory Section | Board of Directors and Administration
BOARD OF DIRECTORS AND ADMINISTRATION
BOARD OF DIRECTORS
Board Chair Curtis Rock
Board Vice-Chair Mike Reeves Members Abel Alonzo George Clower A.R. Escobedo Angie Flores-Granado Scott Harris Glenn Martin Eddie Martinez Tom Niskala Larry D. Young Sr. Advisory Board Member Vangie Chapa
ADMINISTRATION
Chief Executive Officer Jorge Cruz-Aedo Managing Director of Administration Robert Saldaña Managing Director of Capital Programs Sharon Montez Director of Human Resources Angelina Gaitan Director of Information Technology David Chapa Director of Maintenance Bryan Garner Director of Marketing Kelly Coughlin Director of Planning Gordon Robinson Director of Procurement Annie Hinojosa Director of Safety and Security Mike Rendon Director of Transportation Derrick Majchszak DBE/EEO Compliance Officer Christina Perez
xi
Corpus Christi Regional Transportation Authority Fiscal 2016 Comprehensive Annual Financial Report Introductory Section | Organizational Chart
Board of Directors
Chief Executive Officer
General Counsel
Managing Director of Administration
Managing Director of Operations
Managing Director of Capital Programs
Senior Directors
Transportation Services
Paratransit Services
Maintenance Services
Director of Marketing
Director of Safety & Security
HR Administrator
DBE (DBE Coordinator)
Finance
IT Systems
Program Manager
Construction Services
Design Services
Real Estate
State of Good Repair
Planning Services
Board Support
Procurement
Special Services
Mobility/ Eligibility

xii

2016 Financial Section
Comprehensive Annual Financial Report


1
C E R T I F I E D P U B L I C A C C O U N T A N T S 555 N. Carancahua Suite 1000Corpus Christi, Texas 78401-0839361-884-9347 · Fax 361-884-9422www.cjw-cpa.comCOLLIER, JOHNSON & WOODS, P.C.Board of Directors of the Corpus Christi Regional Transportation Authority Report on the Financial Statements
We have audited the accompanying financial statements of the Corpus Christi Regional Transportation Authority as of and for the years ended December 31, 2016 and 2015, and the related notes to the financial statements, which collectively comprise the Authority’s basic financial statements as listed in the table of contents. Management’s Responsibility for the Financial Statements
Management is responsible for the preparation and fair presentation of these financial statements in accordance with accounting principles generally accepted in the United States of America; this includes the design, implementation, and maintenance of internal control relevant to the preparation and fair presentation of financial statements that are free from material misstatement, whether due to fraud or error. Auditor’s Responsibility
Our responsibility is to express an opinion on these financial statements based on our audits. We conducted our audits in accordance with auditing standards generally accepted in the United States of America and the standards applicable to financial audits contained in Government Auditing Standards, issued by the Comptroller General of the United States. Those standards require that we plan and perform the audits to obtain reasonable assurance about whether the financial statements are free from material misstatement.
An audit involves performing procedures to obtain audit evidence about the amounts and disclosures in the financial statements. The procedures selected depend on the auditor’s judgment, including the assessment of the risks of material misstatement of the financial statements, whether due to fraud or error. In making those risk assessments, the auditor considers internal control relevant to the entity’s preparation and fair presentation of the financial statements in order to design audit procedures that are appropriate in the circumstances, but not for the purpose of expressing an opinion on the effectiveness of the entity’s internal control. Accordingly, we express no such opinion. An audit also includes evaluating the appropriateness of accounting policies used and the reasonableness of significant accounting estimates made by management, as well as evaluating the overall presentation of the financial statements.
We believe that the audit evidence we have obtained is sufficient and appropriate to provide a basis for our audit opinion.

2
Opinion
In our opinion, the financial statements referred to above present fairly, in all material respects, the financial position of the Corpus Christi Regional Transportation Authority as of December 31, 2016 and 2015, and the changes in financial position and cash flows for the years then ended in accordance with accounting principles generally accepted in the United States of America. Emphasis of Matter
As described in Note 1 to the financial statements, the Authority restated federal government receivables and net position at December 31, 2015 related to the correction of an error in the previously issued financial statements. Our opinions are not modified with respect to this matter. Other Matters Required Supplementary Information
Accounting principles generally accepted in the United States of America require that the management’s discussion and analysis on pages 5 through 18 and other required supplementary information on pages 53 through 56 be presented to supplement the basic financial statements. Such information, although not a part of the basic financial statements, is required by the Governmental Accounting Standards Board, who considers it to be an essential part of financial reporting for placing the basic financial statements in an appropriate operational, economic, or historical context. We have applied certain limited procedures to the required supplementary information in accordance with auditing standards generally accepted in the United States of America, which consisted of inquiries of management about the methods of preparing the information and comparing the information for consistency with management’s responses to our inquiries, the basic financial statements, and other knowledge we obtained during our audit of the basic financial statements. We do not express an opinion or provide any assurance on the information because the limited procedures do not provide us with sufficient evidence to express an opinion or provide any assurance. Supplementary and Other Information
Our audit was conducted for the purpose of forming an opinion on the financial statements that collectively comprise the Corpus Christi Regional Transportation Authority’s basic financial statements. The introductory section, supplemental schedules, and the statistical section listed in the table of contents are presented for purposes of additional analysis and are not a required part of the basic financial statements. The accompanying schedule of expenditures of federal financial awards, pages 89 and 90 is presented for purposes of additional analysis as required by Title 2 U.S. Code of Federal Regulations (CFR) Part 200 Uniform Administrative Requirements, Cost Principles, and Audit Requirements for Federal Awards and is also not a required part of the basic financial statements.
The supplemental schedules and the schedule of expenditures of federal financial awards are the responsibility of management and were derived from and relate directly to the underlying accounting and other records used to prepare the basic financial statements. Such information has been subjected to the auditing procedures applied in the audit of the basic financial statements and certain additional procedures, including comparing and reconciling such information directly to the underlying accounting and other records used to prepare the basic financial statements or to the basic financial statements themselves, and other additional procedures in accordance with auditing standards generally accepted in the United States of America. In our opinion, the schedules and the schedule of expenditures of federal financial awards are fairly stated in all material respects in relation to the basic financial statements as a whole.

3
The introductory and statistical sections have not been subjected to the auditing procedures applied in the audit of the basic financial statements, and accordingly, we do not express an opinion or provide any assurance on them. Other Reporting Required by Government Auditing Standards
In accordance with Government Auditing Standards, we have also issued our report dated June 28, 2017, on our consideration of the Authority’s internal control over financial reporting and our tests of its compliance with certain provisions of laws, regulations, contracts, and grant agreements and other matters. The purpose of the report is to describe the scope of our testing of internal control over financial reporting and compliance and the results of that testing, and not to provide an opinion on internal control over financial reporting or on compliance. That report is an integral part of an audit performed in accordance with Government Auditing Standards in considering the Authority’s internal control over financial reporting and compliance.

Corpus Christi Regional Transportation Authority Fiscal 2016 Comprehensive Annual Financial Report Financial Section | Management’s Discussion and Analysis
5
MANAGEMENT’S DISCUSSION AND ANALYSIS
Management of the Corpus Christi Regional Transportation Authority (Authority) offers to readers of its financial statements this narrative overview and analysis of the financial activities of the Authority for the fiscal years ended December 31, 2016 and 2015. We encourage readers to consider this information in conjunction with the information provided in our transmittal letter found in the introductory section of this report and all other information presented in the notes to the financial statements and other sections.
FINANCIAL HIGHLIGHTS
• The Authority’s net position at December 31, 2016 was $87,299,898. Of this amount, $25,605,598 (29.3%) may be used to meet the Authority’s ongoing obligations to citizens and creditors in accordance with its mission statement. The total decrease of $6,301,204 from 2015 is a result of depreciation expenses $1,954,276 higher than 2015, sales tax receipts $2,740,605 less than 2015, and additional costs related to pensions.
• As of December 31, 2016, the Authority had long term obligations of $23,761,056,
comprised of $19,820,000 in long-term debt, net of current maturities, a $3,320,409 net pension liability, a $435,418 net OPEB obligation and $185,229 in accrued compensated absences.
OVERVIEW OF THE BASIC FINANCIAL STATEMENTS
This discussion serves to introduce the Authority’s basic financial statements. These statements have two components: (1) government-wide financial statements and (2) notes to the financial statements. This report also contains other supplementary information in addition to the basic financial statements. The Authority is structured as a stand-alone proprietary fund and presents its financial information using the accrual basis of accounting similar to the way private sector businesses present their financial information. Revenues are recognized in the financial statements when both earned and measurable, not when actually received in cash. Expenses are recognized when they are incurred, not when they are paid. The historical costs of capital assets are capitalized and depreciated over the estimated useful life of the assets.
The Statement of Net Position presents information on all of the Authority’s assets and liabilities; with the difference between them being reported as net position. This is a measure of financial position, which can indicate improvement or deterioration from year to year. The presentation of net position also distinguishes between those invested in capital assets, restricted by bond covenant, and those that are unrestricted by external parties or legal requirements.

Corpus Christi Regional Transportation Authority Fiscal 2016 Comprehensive Annual Financial Report Financial Section | Management’s Discussion and Analysis
6
The Statement of Revenues, Expenses and Changes in Net Position accounts for the change in net position by showing the activities that caused the change. This statement measures the Authority’s operations and can also be used to determine whether the Authority has successfully recovered all of its costs through fares and other user charges, sales taxes received, subsidies and other sources of funding available.
The Statement of Cash Flows provides details about the Authority’s sources of, uses of and the change in cash over a fiscal year. This information is categorized into operating, non- capital financing, capital and related financing and investing activities.
The Authority also has fiduciary responsibility for two employee retirement funds and presents two financial statements related to them: (a) Fiduciary Funds - Statement of Net Position and (b) Fiduciary Funds - Statement of Changes in Net Position, which follow the government-wide financial statements. There is also information concerning these plans in Note 5 in the notes to the financial statements in this section.
The Notes to the Financial Statements provide additional information that is essential to a full understanding of the data provided in the financial statements. These notes should be read as an integral part of the financial statements.
The Authority’s basic financial statements can be found beginning on page 21. FINANCIAL ANALYSIS
Statement of Net Position:
Net Position: Increases in net position indicate an improved financial position while decreases indicate deterioration of financial position. The Statement of Net Position provides the necessary information on which to base this determination. The net position is presented in three components: (1) the net invested in capital assets, (2) the restricted by bond covenants, and (3) the unrestricted and available for operations. 68.82% of the Authority’s net position is the net invested in capital assets consisting of buses, equipment, bus stops, shelters, stations, operating facilities and related land net of related debt. The Authority uses these assets for the purpose of achieving its mission. The Authority issued $22,025,000 in debt to fund a new customer service center along with the renovation of an adjacent transit station in November of 2013. At the end of 2016, $110,863 of debt proceeds remained unspent.
Table 1 provides summary multi-year comparative information about the Authority’s net position. The change in net position can be explained by looking at the other components of the Statement of Net Position.

Corpus Christi Regional Transportation Authority Fiscal 2016 Comprehensive Annual Financial Report Financial Section | Management’s Discussion and Analysis
7
Table 1 CONDENSED SUMMARY OF NET POSITION
At December 31 At December 31 2016 2015 Change 2015 2014 Change Current Assets $ 31,558,243 32,100,544 (542,301) 32,100,544 43,399,652 (11,299,108) Restricted Assets 1,728,452 11,015,610 (9,287,158) 11,015,610 19,879,611 (8,864,001) Capital Assets 80,340,848 78,408,499 1,932,349 78,408,499 52,399,089 26,009,410 Other Assets - - - - 908,062 (908,062) Total Assets 113,627,543 121,524,653 (7,897,110) 121,524,653 116,586,414 4,938,239
Deferred Outflows of Resources 4,550,803 2,147,797 2,403,006 2,147,797 - 2,147,797
Total Assets and Deferred Outflows 118,178,346 123,672,450 (5,494,104) 123,672,451 116,586,414 7,086,037
Current Liabilities 6,922,358 8,306,096 (1,383,738) 8,306,096 11,629,434 (3,323,338) Long-Term Liabilities 23,761,056 21,765,252 1,995,804 21,765,252 20,672,083 1,093,169 Total Liabilities 30,683,414 30,071,348 612,066 30,071,348 32,301,517 (2,230,169)
Deferred Inflows of Resources 195,034 - 195,034 - - -
Total Liabilities and Deferred Inflows 30,878,448 30,071,348 807,100 30,071,348 32,301,517 (2,230,169)
Invested in Capital Assets 60,082,998 66,897,808 (6,814,810) 66,897,808 49,217,398 17,680,409
Restricted for Debt Service 1,611,302 1,611,302 - 1,611,302 1,611,302 -
Unrestricted 25,605,598 25,091,992 513,606 25,091,992 32,585,594 (7,493,602) Total Net Position $ 87,299,898 93,601,102 (6,301,204) 93,601,102 84,284,897 9,316,205
The Authority’s net position at December 31, 2016 was $87,299,898. Of this amount, $60,082,998 (68.82%) represents the Authority’s net investment in capital assets, $1,611,302 was restricted for debt service and the remaining $25,605,598 was unrestricted. Net position decreased $6,301,204 in 2016 primarily due to a decrease in sales tax receipts, and increases in depreciation expense and expenses related to employee pensions. It is the intent of the Board to assure that the Authority maintains adequate resources for operations and capital projects. The Authority’s restated net position at December 31, 2015 totaled $93,601,102. Of this amount, $66,897,807 (71.47%) represents the Authority’s net investment in capital assets, $1,611,302 was restricted for Debt Service, and the remaining $25,091,992 was unrestricted. Net position increased $9,316,205 due to an overall increase in federal grant receivables and capital assets (net of accumulated depreciation), a decrease in receivables and prepaid expenses, combined with a decrease in liabilities.
Current Assets: At the end of 2016, the Authority’s current assets had decreased by $542,301 from the end of 2015. Investments decreased by $1,926,493 with cash increasing by $3,362,823, along with a decrease in receivables of $2,113,468. Prepaid expenses were higher in 2016 by $100,689 while inventories increased by $110,242. The Authority continues a strategy to maintain adequate resources for replacement, enhancement and expansion of capital assets and withstanding economic uncertainty.

Corpus Christi Regional Transportation Authority Fiscal 2016 Comprehensive Annual Financial Report Financial Section | Management’s Discussion and Analysis
8
During 2015, the Authority’s current assets decreased by $11,299,108. Investments decreased by $6,053,952 while cash decreased by $6,039,839. Receivables and prepaid expenses were higher than 2014 by $873,181 while inventories decreased by $78,498. Restricted Assets: At the end of 2016, the Authority’s restricted assets totaled $1,728,359, which were unspent proceeds from the issuance of bonds and reserves required by bond covenants. Restricted assets decreased as the result of spending $9,287,158 in bond proceeds. Capital Assets: As of December 31, 2016, the Authority’s overall investment in capital assets (net of accumulated depreciation) totaled $80,430,848, an increase of $1,932,349 from December 31, 2015. During the year, capital assets totaling $10,479,571 were added and depreciation totaling $8,547,219 decreased the carrying value. Significant 2016 capital additions include:
♦ Completion of the Staples Street Center ♦ Completion of a bus lift ♦ Installation of an interactive wall for veterans at the Staples Street Center
As of December 31, 2015, the Authority’s overall investment in capital assets (net of accumulated depreciation) totaled $78,408,499, an increase of $26,009,410 from December 31, 2014. During the year, capital assets totaling $32,676,891 were added and depreciation totaling $6,592,946 decreased the carrying value. Significant 2015 capital additions include:
♦ Purchase of 29-40” Low Floor CNG Busses and 23 ARBOC Busses ♦ Improvements to the South Side Station Concrete ♦ Construction on the Staples Street Center ♦ Advertising Bus Bench purchase along with Lift Crane and Concrete molds ♦ TAMUCC Bus Shelter Improvements ♦ Bear Lane Employee and Bus Parking Lot Improvements
Additional details about the Authority’s capital asset activities are presented in Note 3 of the notes to the financial statements.

Corpus Christi Regional Transportation Authority Fiscal 2016 Comprehensive Annual Financial Report Financial Section | Management’s Discussion and Analysis
9
Liabilities: The Authority’s total liabilities as of December 31, 2016 are $30,683,414, of which $6,922,358 is current and customary to the Authority’s business and $ 23,761,056 are non-current liabilities. Current liabilities decreased mainly due to decreased accounts payable related to construction costs and offset by increased amounts due to other governmental entities for street improvements. Non-current liabilities, other than debt, increased by $2,883,890 related to an increase of $2,587,434 in net pension liability, an increase in compensated absences of $11,640, and a decrease in net OPEB obligation of $48,270. As of December 31, 2015 the Authority’s total liabilities were $30,071,348, of which $8,306,096 was current and $21,765,252 was non-current. Current liabilities decreased due to decreased amounts due to other governmental entities for street improvements and decreased accounts payable and non-current liabilities increased due to the inclusion of net pension liability in accordance with the implementation of GASB Statements No. 68 and 71. Long-Term Debt: On November 20, 2013, the Authority issued revenue bonds, Series 2013 (AMT) in the amount of $11,525,000, with proceeds from the sale to be used for (1) renovation of the existing Staples Street bus transfer station; (2) construct and equip a portion of a new multi-use building adjacent to the Staples Street bus transfer station; (3) construct a new parking lot to serve the Staples Street bus transfer station and the multi-use building, and (4) pay the costs of issuing the Tax-Exempt Bonds. The Authority also issued revenue bonds, Taxable Series 2013 in the amount of $10,500,000 on November 20, 2013, with the proceeds from the sale to be used to (1) construct and equip a portion of a new multiuse building adjacent to the Staples Street bus transfer station and (2) pay the costs of issuing the Taxable Bonds. Debt payment of $540,000 and $535,000 were made in December 31, 2016 and 2015 respectively. Additional information regarding the Authority’s long-term debt can be found in Note 4 to the financial statements.
Table 2 Federal and Local
Other Funding Funding Total At December 31, 2016:
Capital Assets At Cost $ 79,918,767 68,017,192 147,935,959 Less Accumulated Depreciation 50,618,261 16,976,850 67,595,111
Capital Assets, Net $ 29,300,506 51,040,342 80,340,848
At December 31, 2015: Capital Assets At Cost $ 78,629,190 58,827,196 137,456,386 Less Accumulated Depreciation 46,121,810 12,926,077 59,047,887
Capital Assets, Net $ 32,507,380 45,901,119 78,408,499
Corpus Christi Regional Transportation Authority Fiscal 2016 Comprehensive Annual Financial Report Financial Section | Management’s Discussion and Analysis
10
Statement of Revenues, Expenses and Changes in Net Position:
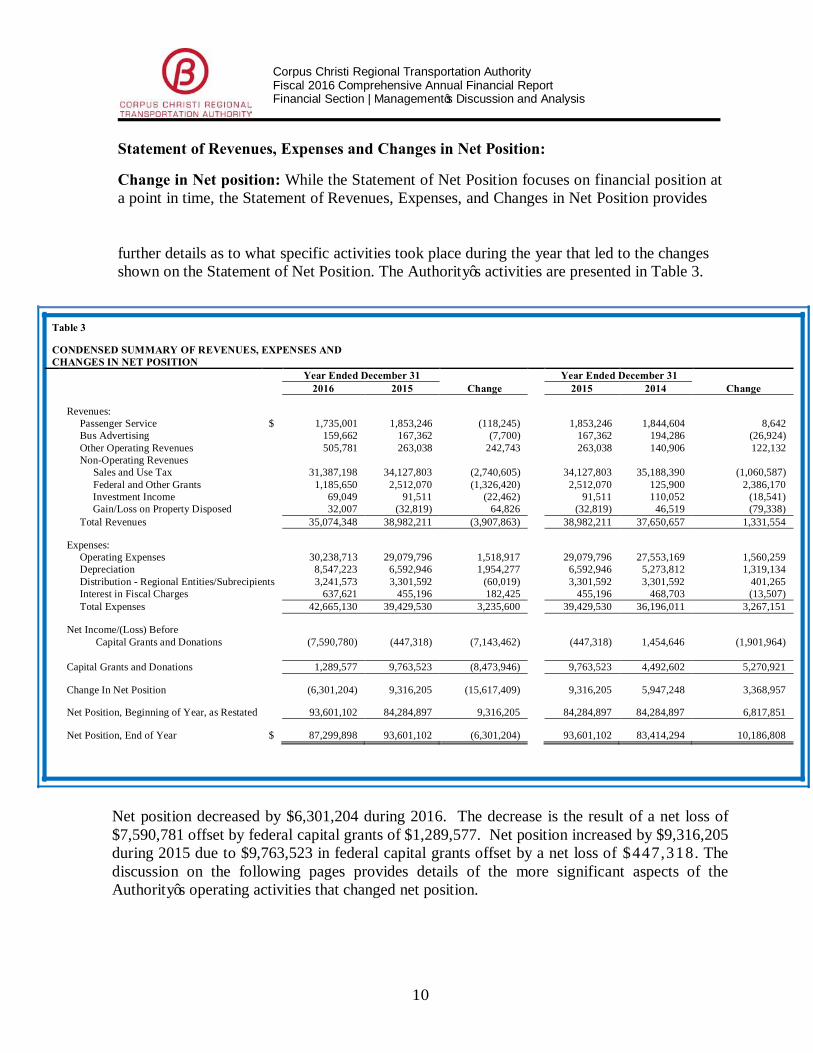
Change in Net position: While the Statement of Net Position focuses on financial position at a point in time, the Statement of Revenues, Expenses, and Changes in Net Position provides further details as to what specific activities took place during the year that led to the changes shown on the Statement of Net Position. The Authority’s activities are presented in Table 3.
Table 3
CONDENSED SUMMARY OF REVENUES, EXPENSES AND CHANGES IN NET POSITION
Year Ended December 31 Year Ended December 31 2016 2015 Change 2015 2014 Change
Revenues: Passenger Service $ 1,735,001 1,853,246 (118,245) 1,853,246 1,844,604 8,642 Bus Advertising 159,662 167,362 (7,700) 167,362 194,286 (26,924) Other Operating Revenues 505,781 263,038 242,743 263,038 140,906 122,132
Non-Operating Revenues Sales and Use Tax 31,387,198 34,127,803 (2,740,605) 34,127,803 35,188,390 (1,060,587) Federal and Other Grants 1,185,650 2,512,070 (1,326,420) 2,512,070 125,900 2,386,170 Investment Income 69,049 91,511 (22,462) 91,511 110,052 (18,541) Gain/Loss on Property Disposed 32,007 (32,819) 64,826 (32,819) 46,519 (79,338) Total Revenues 35,074,348 38,982,211 (3,907,863) 38,982,211 37,650,657 1,331,554
Expenses: Operating Expenses 30,238,713 29,079,796 1,518,917 29,079,796 27,553,169 1,560,259 Depreciation 8,547,223 6,592,946 1,954,277 6,592,946 5,273,812 1,319,134 Distribution - Regional Entities/Subrecipients 3,241,573 3,301,592 (60,019) 3,301,592 3,301,592 401,265 Interest in Fiscal Charges 637,621 455,196 182,425 455,196 468,703 (13,507) Total Expenses 42,665,130 39,429,530 3,235,600 39,429,530 36,196,011 3,267,151
Net Income/(Loss) Before Capital Grants and Donations (7,590,780) (447,318) (7,143,462) (447,318) 1,454,646 (1,901,964)
Capital Grants and Donations 1,289,577 9,763,523 (8,473,946) 9,763,523 4,492,602 5,270,921
Change In Net Position (6,301,204) 9,316,205 (15,617,409) 9,316,205 5,947,248 3,368,957
Net Position, Beginning of Year, as Restated 93,601,102 84,284,897 9,316,205 84,284,897 84,284,897 6,817,851
Net Position, End of Year $ 87,299,898 93,601,102 (6,301,204) 93,601,102 83,414,294 10,186,808
Net position decreased by $6,301,204 during 2016. The decrease is the result of a net loss of $7,590,781 offset by federal capital grants of $1,289,577. Net position increased by $9,316,205 during 2015 due to $9,763,523 in federal capital grants offset by a net loss of $447,318. The discussion on the following pages provides details of the more significant aspects of the Authority’s operating activities that changed net position.
Corpus Christi Regional Transportation Authority Fiscal 2016 Comprehensive Annual Financial Report Financial Section | Management’s Discussion and Analysis
11
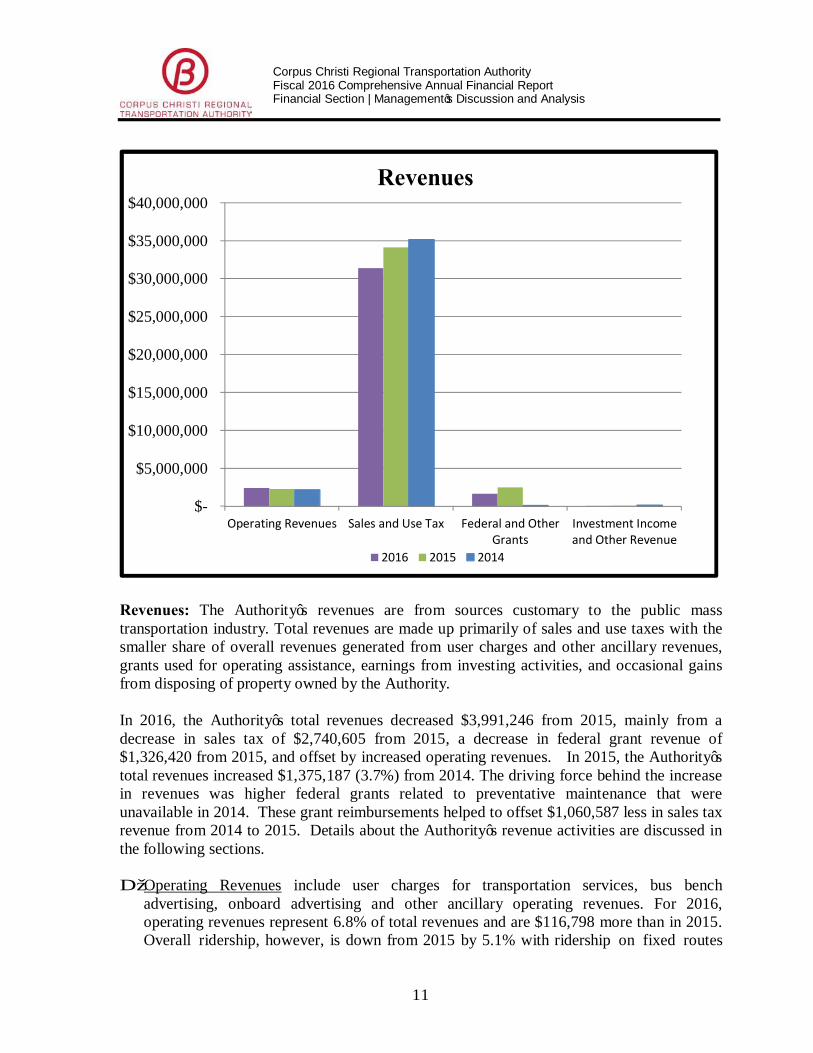
Revenues: The Authority’s revenues are from sources customary to the public mass transportation industry. Total revenues are made up primarily of sales and use taxes with the smaller share of overall revenues generated from user charges and other ancillary revenues, grants used for operating assistance, earnings from investing activities, and occasional gains from disposing of property owned by the Authority.
In 2016, the Authority’s total revenues decreased $3,991,246 from 2015, mainly from a decrease in sales tax of $2,740,605 from 2015, a decrease in federal grant revenue of $1,326,420 from 2015, and offset by increased operating revenues. In 2015, the Authority’s total revenues increased $1,375,187 (3.7%) from 2014. The driving force behind the increase in revenues was higher federal grants related to preventative maintenance that were unavailable in 2014. These grant reimbursements helped to offset $1,060,587 less in sales tax revenue from 2014 to 2015. Details about the Authority’s revenue activities are discussed in the following sections. ♦ Operating Revenues include user charges for transportation services, bus bench
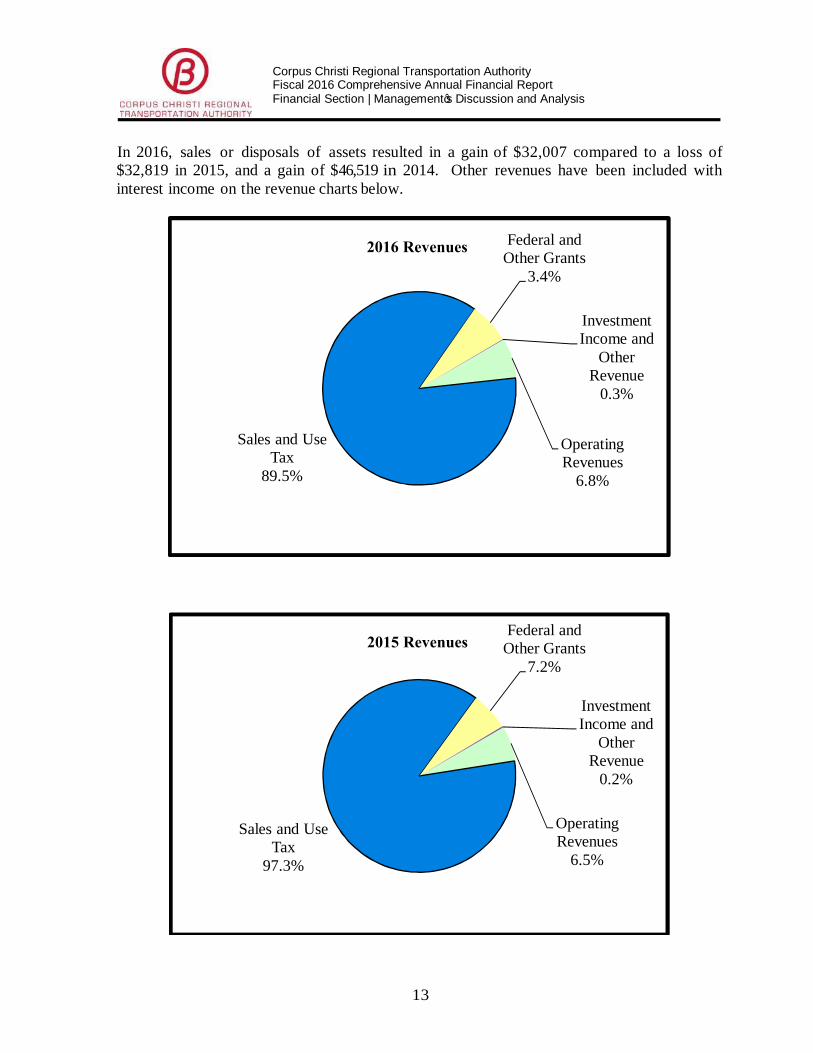
advertising, onboard advertising and other ancillary operating revenues. For 2016, operating revenues represent 6.8% of total revenues and are $116,798 more than in 2015. Overall ridership, however, is down from 2015 by 5.1% with ridership on fixed routes
$-
$5,000,000
$10,000,000
$15,000,000
$20,000,000
$25,000,000
$30,000,000
$35,000,000
$40,000,000
Operating Revenues Sales and Use Tax Federal and OtherGrants
Investment Incomeand Other Revenue
2016 2015 2014
Revenues
Corpus Christi Regional Transportation Authority Fiscal 2016 Comprehensive Annual Financial Report Financial Section | Management’s Discussion and Analysis
12
down by 4.0%, paratransit ridership increased by 2.9% and ridership on the Harbor ferry is down by 100% compared to 2015 as the service was put on hiatus. Passenger revenues were down 6.4%, or $118,245, compared to 2015, mainly due to the contractual agreements the Authority has with the local university and college. In 2015, operating revenues represented 5.9% of total revenues and were $103,851 more than in 2014. Overall rider-ship was down by 2.7%. Ridership on fixed routes was down by 3.1% while paratransit ridership decreased by 3.2%. Ridership on the Harbor Ferry was down by 8.5% from 2014.
♦ Sales and Use Tax is a dedicated ½ cent sales and use tax levied on certain goods and
services sold within the region which provides the primary funding for the Authority’s operating budget. For 2016, sales taxes represent 88.5% of total revenues and decreased 8.0% from 2015, reflecting a slight dip in the overall economy. The boom of the Eagle Ford Shale oil deposits over the past few years has been affected by the decline in oil prices. In 2015, sales taxes were 87.5% of total revenues and were 3.0% lower than in 2014, mainly related to the slowdown of Eagle Ford Shale activities.
♦ Operating Grant Assistance represents reimbursements to the Authority for preventative
maintenance activities, the cost of certain work related routes and regional mobility coordination. The Authority has the option of utilizing its annual “Formula” grants provided by the Federal Transit Administration (FTA) for operating assistance or to fund capital asset acquisitions. In 2016, these grant revenues were primarily made up of reimbursements for operating assistance for ADA paratransit services, FTA Job Access and Reverse Commute used to help pay for the cost of certain work related routes and regional mobility coordination, and a small amount from a New Freedom Grant for travel training. In 2016 the Authority provided pass through grants to nonprofit agencies which allowed for higher grant revenues. In 2016, these grants represent 4.6% of total revenues compared to 6.4% in 2015, and 0.33% in 2014. In 2015, these grant revenues are made up primarily of reimbursements for operating assistance for preventative maintenance activities. There are also revenues from FTA Job Access and Reverse Commute used to help pay for the cost of certain work related routes and regional mobility coordination, and a small amount from a New Freedom Grant for travel training.
♦ Investment Income is income earned from the Authority’s investing activities. Income
generated from the portfolio decreased $22,462 from 2015. This increase was primarily due to the use of bond proceeds during the construction of the Staples Street Center.
Corpus Christi Regional Transportation Authority Fiscal 2016 Comprehensive Annual Financial Report Financial Section | Management’s Discussion and Analysis
13
In 2016, sales or disposals of assets resulted in a gain of $32,007 compared to a loss of $32,819 in 2015, and a gain of $46,519 in 2014. Other revenues have been included with interest income on the revenue charts below.
Operating Revenues
6.8%
Sales and Use Tax
89.5%
Federal and Other Grants
3.4%
Investment Income and
Other Revenue
0.3%
2016 Revenues
Operating Revenues
6.5%
Sales and Use Tax
97.3%
Federal and Other Grants
7.2%
Investment Income and
Other Revenue
0.2%
2015 Revenues

Corpus Christi Regional Transportation Authority Fiscal 2016 Comprehensive Annual Financial Report Financial Section | Management’s Discussion and Analysis
14
Expenses: The Authority’s expenses consist of operating expenses (directly operated and purchased transportation services, maintenance, planning and program development, and general administrative costs), depreciation of capital assets, and distributions to regional entities for the Authority’s street improvement program. In 2016, total expenses increased by $3,235,600 (8.2%) over 2015. In 2015, total expenses increased by $2,879,393 (8.7%) over 2014.
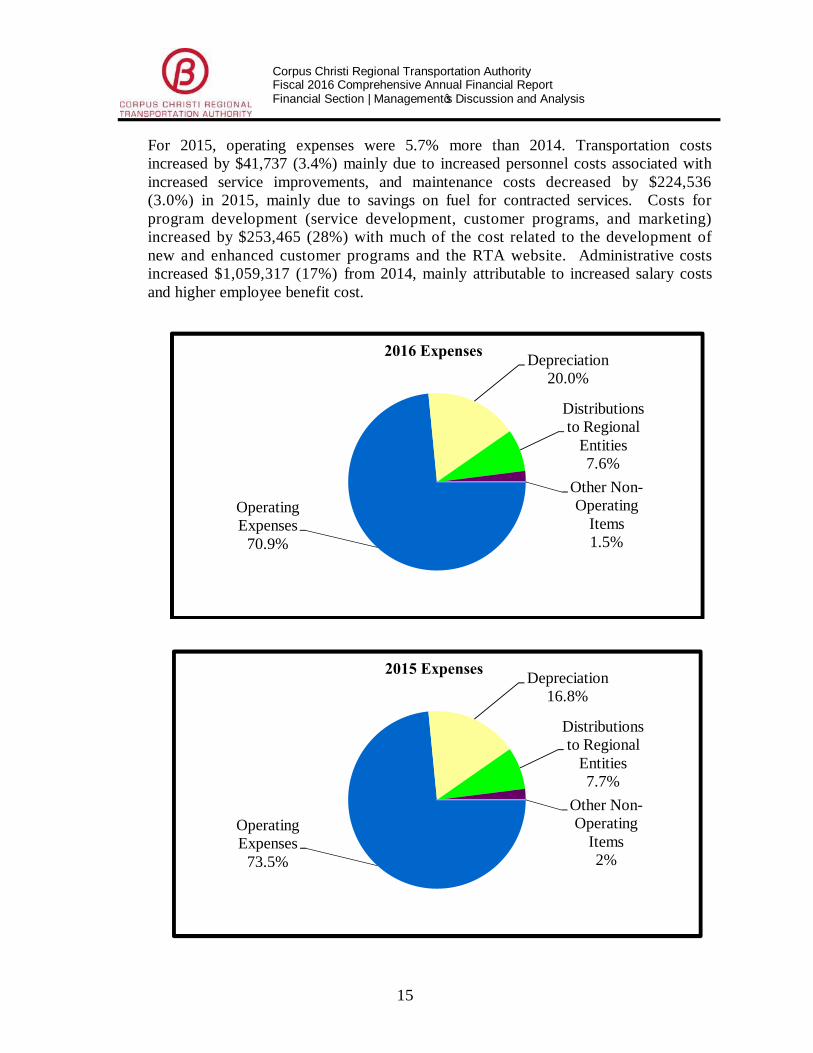
♦ Operating Expenses: The largest component of the Authority’s total expenses is operating expenses. These expenses account for 70 . 8% and 73 . 8% of total expenses in 2016 and 2015, respectively.
As shown in Table 3, operating expenses increased by $1,075,536 (3.7%) in 2016. Transportation costs which include both directly operated services and purchased transportation services decreased $422,303 (3.3%) mainly due to decreased personnel costs associated with a shortage of bus operators. Maintenance costs for facilities, directly operated revenue and support vehicles decreased by $644,441 (8.8 %) in 2016, mainly due to savings on fuel for contracted services. Costs for program development (including service development, customer programs, and marketing) increased by $458,023 (39.9%) with much of the costs related to maintaining and enhancing the RTA website, and additional customer service staff coinciding with the opening of the Staples Street Center. Administrative costs increased $1,657,913 (21.3%) from 2015 mainly attributable to costs associated with the employee pension plan and opening of the Staples Street Center.
$0
$2,000,000
$4,000,000
$6,000,000
$8,000,000
$10,000,000
$12,000,000
$14,000,000
2016
2015
2014
Corpus Christi Regional Transportation Authority Fiscal 2016 Comprehensive Annual Financial Report Financial Section | Management’s Discussion and Analysis
15
For 2015, operating expenses were 5.7% more than 2014. Transportation costs increased by $41,737 (3.4%) mainly due to increased personnel costs associated with increased service improvements, and maintenance costs decreased by $224,536 (3.0%) in 2015, mainly due to savings on fuel for contracted services. Costs for program development (service development, customer programs, and marketing) increased by $253,465 (28%) with much of the cost related to the development of new and enhanced customer programs and the RTA website. Administrative costs increased $1,059,317 (17%) from 2014, mainly attributable to increased salary costs and higher employee benefit cost.
Operating Expenses
70.9%
Depreciation20.0%
Distributions to Regional
Entities7.6%
Other Non-Operating
Items1.5%
2016 Expenses
Operating Expenses
73.5%
Depreciation16.8%
Distributions to Regional
Entities7.7%
Other Non-Operating
Items2%
2015 Expenses

Corpus Christi Regional Transportation Authority Fiscal 2016 Comprehensive Annual Financial Report Financial Section | Management’s Discussion and Analysis
16
Depreciation: Depreciation is $1,954,277 (29.6%) higher in 2016 than 2015 due to depreciation on buses acquired in 2015 as well as the completed Staples Street Center. In 2015, depreciation was $1,319,134 (25%) higher than 2014 due to an increase in newly purchased fleet vehicle additions.
Distributions to Regional Entities: The Authority, through collaborative efforts with the regional member government entities, maintains a street improvement program for the purpose of constructing, rebuilding and rehabilitating streets within its service region. These projects represent a major investment in enhancing mobility, reducing congestion and improving the overall service area. The streets are not the property of the Authority and, thus, the expenditures are reported as non-operating expenses in the Authority’s financial statements. The level of funding is determined annually based on budgeted sales tax revenues and other factors. In 2016, these costs increased $161,580 (5.4%) from 2015 due to an increase in budgeted sales tax revenue. Likewise, in 2015, the costs of the program increased $108,106 (3.7%) from 2014 due to an increase in budgeted sales tax revenue.
Fiduciary Funds:
Following the government-wide basic financial statements are similar financial statements for the Authority’s two fiduciary funds. These statements provide financial information about the Authority’s defined benefit pension and defined contribution retirement plans. During 2016, strong performance in the fixed income markets resulted in a $2,995,191 (7.87%) net increase in value of the plans’ assets since the end of 2015. During 2015, wide fluctuations in the fixed income markets resulted in a $1,850,930 (4.6%) net decrease in value of the plans’ assets since the end of 2014. Note 5 in the notes section provides a discussion of the administration of the plans and there are further details contained in required supplementary information and supplemental schedules contained in the financial section of this CAFR.
ECONOMIC FACTORS AND NEXT YEAR’S BUDGET
For 2017, operating expenses including depreciation are budgeted at $41,285,138. This represents a 6.10% decrease over the final 2016 budget. Sales tax, the Authority’s largest revenue source, was budgeted at $34,086,571, a decrease of 7.23% less than what was budgeted in 2016. Sales tax is expected to equal 82.6% of operating expenses in 2017 as opposed to 83.6% in the 2016 budget. Sales tax collections have leveled off during the first quarter of 2017 and there is optimism about the local economy thanks to new projects such as the replacement of the Harbor Bridge and the pending construction of the world’s largest ethylene cracker plant in nearby Gregory.
Similar to the 2016 budget, the 2017 budget is formulated in the expectation that Eagle Ford Shale activity will continue to rebound and result in an increase in sales tax revenue that will cover inflationary pressures on expenses. CCRTA took a conservative approach in its sales tax estimate for 2017, with a decrease of 7.23% less than budgeted in 2016. Fare revenues

Corpus Christi Regional Transportation Authority Fiscal 2016 Comprehensive Annual Financial Report Financial Section | Management’s Discussion and Analysis
17
are budgeted at a 21.3% increase, while one source of revenue, the Harbor Ferry service, was suspended for 2017 until it is determined whether to continue the service.
Due to continued flat economic growth in the first quarter of 2017, sales tax revenue is down 11% from year-to-date budget estimates and 3% down from 2016 collections, comparatively. This revenue will be monitored closely throughout 2017.
Other assumptions in the 2017 budget include the continuation of improvements to our services which experienced major service enhancements in 2016 to provide more direct service and more frequent and faster service. In 2017, enhanced passenger amenities will be a focus, and the Authority will continue the CNG conversion of the fleet. The current fare structures will be maintained, pension costs are projected to increase by 49.7% and continued growth of health care costs is expected. A 5% step increase for bus operators and a 2% COLA increase for employees not eligible for the 5% step increase will be provided to all employees. A COLA increase of up to 2% will be offered to retirees in 2017. The budget also includes funding for increased technological enhancements and preventive maintenance, which is available through federal grants.
Passenger fare revenues were 0.35% higher for the first quarter of 2017 than for the same period in 2016. With lower gas prices, some of our riders are able to utilize alternative transportation. Operating expenses for the first quarter of 2017 are 5.6% over budget due to higher estimated depreciations expenses and 13.1% higher than expenses for the first quarter of 2016 due to higher estimated depreciation and health insurance expenses.
Several significant capital projects are planned for 2017. The costs will be funded with a combination of FTA and other federal grants and local funds.
During 2017, the Authority is continuing to carefully assess factors in the local economy and ways to increase revenues or decrease costs in order to live within the means available. The Authority also continues to look for ways to partner with others to enhance the local economy and transportation options.

Corpus Christi Regional Transportation Authority Fiscal 2016 Comprehensive Annual Financial Report Financial Section | Management’s Discussion and Analysis
18
REQUEST FOR INFORMATION
This financial report is designed to provide a general overview of the Authority’s finances for those with an interest in its finances. Questions concerning any of the information in this report or requests for additional information should be addressed to Open Records Request, Attn: Victoria Reyes, Corpus Christi Regional Transportation Authority, 602 N Staples St, Corpus Christi, Texas 78401-2802, (361) 289-2712. The Comprehensive Annual Financial Report will also be posted on the Authority's website: www.ccrta.org

19
Corpus Christi Regional Transportation Authority Fiscal 2016 Comprehensive Annual Financial Report Financial Section | Basic Financial Statements
CORPUS CHRISTI REGIONAL TRANSPORTATION AUTHORITYStatement of Net PositionYears Ended December 31, 2016 and 2015
2016 2015ASSETS
Current Assets: Cash and Cash Equivalents (Note 2) $ 15,727,428 $ 12,364,605 Investments (Note 2) 9,002,510 10,929,003 Receivables: Sales and Use Taxes 5,439,760 5,761,555 Accrued Interest 54,719 53,448 Federal Government 406,078 2,009,604 Other 36,938 226,356 Inventories 610,376 576,228 Prepaid Expenses 280,434 179,745 Total Current Assets 31,558,243 32,100,544
Non-Current Assets: Restricted Cash and Cash Equivalents (Note 2) 1,728,452 11,015,610 Capital Assets (Note 3): Land 3,658,054 3,658,054 Buildings 49,958,064 18,363,541 Transit Stations, Stops and Pads 25,799,089 25,595,487 Other Improvements 4,706,675 4,656,155 Vehicles, Furniture and Equipment 63,604,886 61,205,177 Construction in Progress 209,190 23,977,972 Total Capital Assets 147,935,958 137,456,386 Less: Accumulated Depreciation (67,595,109) (59,047,887) Net Capital Assets 80,340,848 78,408,499 Total Non-Current Assets 82,069,300 89,424,109 TOTAL ASSETS 113,627,543 121,524,653
DEFERRED OUTFLOWS OF RESOURCES Deferred outflow related to pensions (Note 5) 4,550,803 2,147,797 TOTAL ASSETS AND DEFERRED OUTFLOWS OF RESOURCES 118,178,346 123,672,450
LIABILITIES AND NET POSITION
Current Liabilities: Accounts Payable 843,276 3,890,382 Contractors Retainage Payable 1,293,190 911,034 Current Portion of Long-Term Liabilities (Note 4): Long-Term Debt 555,000 540,000 Compensated Absences 275,328 234,460 Distributions to Regional Entities Payable 3,329,846 2,291,546 Other Accrued Liabilities 625,718 438,674 Total Current Liabilities 6,922,358 8,306,096
Non-Current Liabilities: Long-Term Liabilities, Net of Current Portion (Note 4): Long-Term Debt 19,820,000 20,375,000 Compensated Absences 185,229 173,589 Net Pension Liability (Note 5) 3,320,409 732,975 Net OPEB Obligation (Note 6) 435,418 483,688 Total Non-Current Liabilities 23,761,056 21,765,252
30,683,414 30,071,348
DEFERRED INFLOWS OF RESOURCES Deferred inflow related to pensions (Note 5) 195,034 - TOTAL LIABILITIES AND DEFERRED INFLOWS OF RESOURCES 30,878,448 30,071,348
Net Position: Net Invested in Capital Assets 60,082,998 66,897,808 Restricted for Debt Service 1,611,302 1,611,302 Unrestricted 25,605,598 25,091,993 TOTAL NET POSITION $ 87,299,898 $ 93,601,102
See Notes to Financial Statements
TOTAL LIABLILITES
20
Corpus Christi Regional Transportation Authority Fiscal 2016 Comprehensive Annual Financial Report Financial Section | Basic Financial Statements
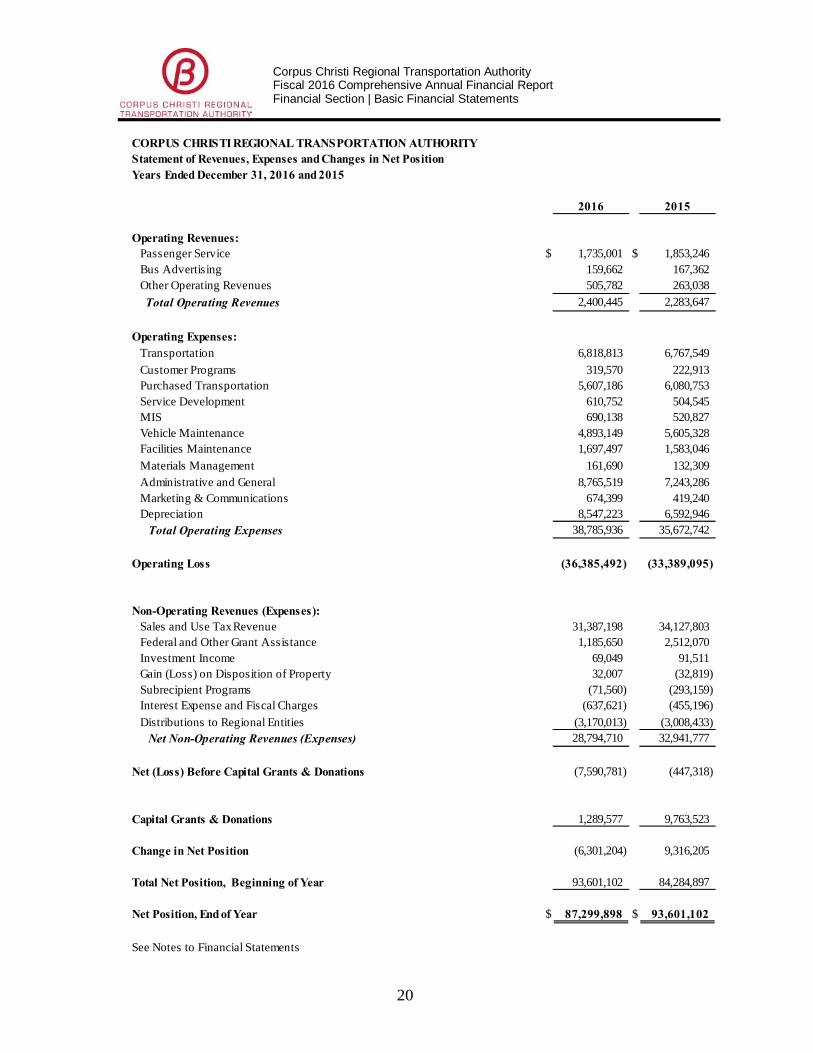
CORPUS CHRISTI REGIONAL TRANSPORTATION AUTHORITYStatement of Revenues, Expenses and Changes in Net PositionYears Ended December 31, 2016 and 2015
2016 2015
Operating Revenues: Passenger Service $ 1,735,001 $ 1,853,246 Bus Advertising 159,662 167,362 Other Operating Revenues 505,782 263,038 Total Operating Revenues 2,400,445 2,283,647
Operating Expenses: Transportation 6,818,813 6,767,549 Customer Programs 319,570 222,913 Purchased Transportation 5,607,186 6,080,753 Service Development 610,752 504,545 MIS 690,138 520,827 Vehicle Maintenance 4,893,149 5,605,328 Facilities Maintenance 1,697,497 1,583,046 Materials Management 161,690 132,309 Administrative and General 8,765,519 7,243,286 Marketing & Communications 674,399 419,240 Depreciation 8,547,223 6,592,946 Total Operating Expenses 38,785,936 35,672,742
Operating Loss (36,385,492) (33,389,095)
Non-Operating Revenues (Expenses): Sales and Use Tax Revenue 31,387,198 34,127,803 Federal and Other Grant Assistance 1,185,650 2,512,070 Investment Income 69,049 91,511 Gain (Loss) on Disposition of Property 32,007 (32,819) Subrecipient Programs (71,560) (293,159) Interest Expense and Fiscal Charges (637,621) (455,196) Distributions to Regional Entities (3,170,013) (3,008,433) Net Non-Operating Revenues (Expenses) 28,794,710 32,941,777
Net (Loss) Before Capital Grants & Donations (7,590,781) (447,318)
Capital Grants & Donations 1,289,577 9,763,523
Change in Net Position (6,301,204) 9,316,205
Total Net Position, Beginning of Year 93,601,102 84,284,897
Net Position, End of Year $ 87,299,898 $ 93,601,102
See Notes to Financial Statements
21
Corpus Christi Regional Transportation Authority Fiscal 2016 Comprehensive Annual Financial Report Financial Section | Basic Financial Statements
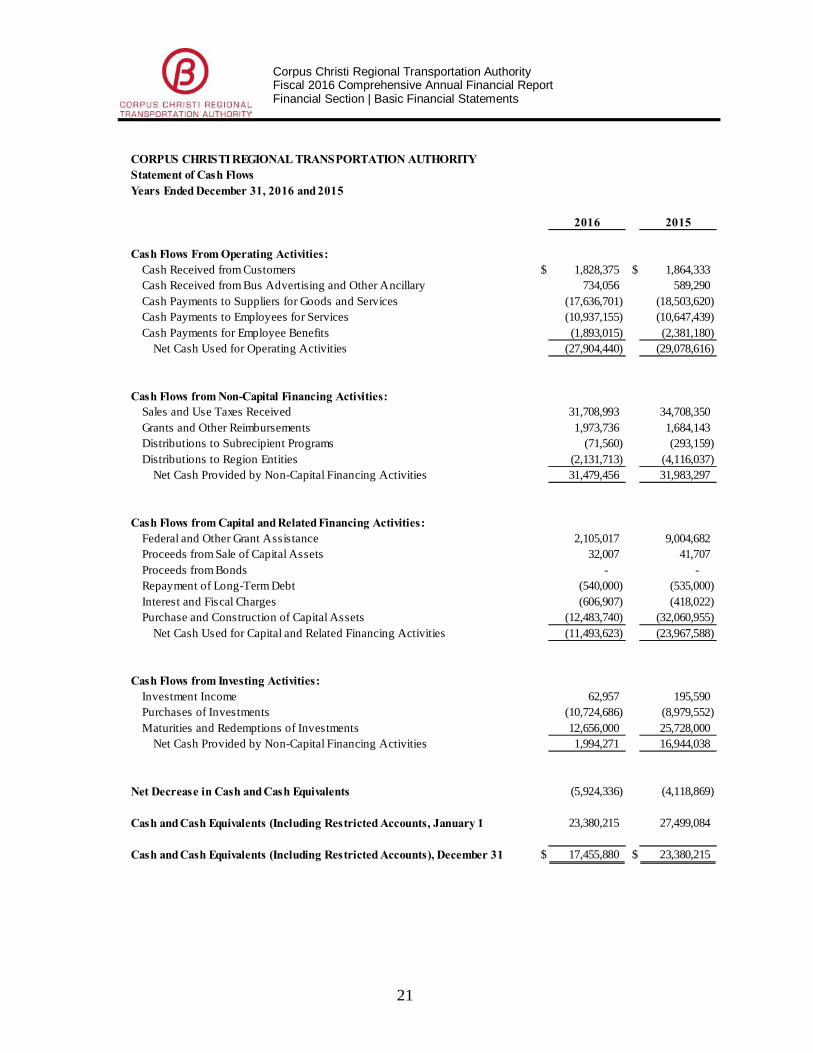
CORPUS CHRISTI REGIONAL TRANSPORTATION AUTHORITYStatement of Cash FlowsYears Ended December 31, 2016 and 2015
2016 2015
Cash Flows From Operating Activities:Cash Received from Customers $ 1,828,375 $ 1,864,333 Cash Received from Bus Advertising and Other Ancillary 734,056 589,290 Cash Payments to Suppliers for Goods and Services (17,636,701) (18,503,620) Cash Payments to Employees for Services (10,937,155) (10,647,439) Cash Payments for Employee Benefits (1,893,015) (2,381,180)
Net Cash Used for Operating Activities (27,904,440) (29,078,616)
Cash Flows from Non-Capital Financing Activities:Sales and Use Taxes Received 31,708,993 34,708,350 Grants and Other Reimbursements 1,973,736 1,684,143 Distributions to Subrecipient Programs (71,560) (293,159) Distributions to Region Entities (2,131,713) (4,116,037)
Net Cash Provided by Non-Capital Financing Activities 31,479,456 31,983,297
Cash Flows from Capital and Related Financing Activities:Federal and Other Grant Assistance 2,105,017 9,004,682 Proceeds from Sale of Capital Assets 32,007 41,707 Proceeds from Bonds - - Repayment of Long-Term Debt (540,000) (535,000) Interest and Fiscal Charges (606,907) (418,022) Purchase and Construction of Capital Assets (12,483,740) (32,060,955)
Net Cash Used for Capital and Related Financing Activities (11,493,623) (23,967,588)
Cash Flows from Investing Activities:Investment Income 62,957 195,590 Purchases of Investments (10,724,686) (8,979,552) Maturities and Redemptions of Investments 12,656,000 25,728,000
Net Cash Provided by Non-Capital Financing Activities 1,994,271 16,944,038
Net Decrease in Cash and Cash Equivalents (5,924,336) (4,118,869)
Cash and Cash Equivalents (Including Restricted Accounts, January 1 23,380,215 27,499,084
Cash and Cash Equivalents (Including Restricted Accounts), December 31 $ 17,455,880 $ 23,380,215
22
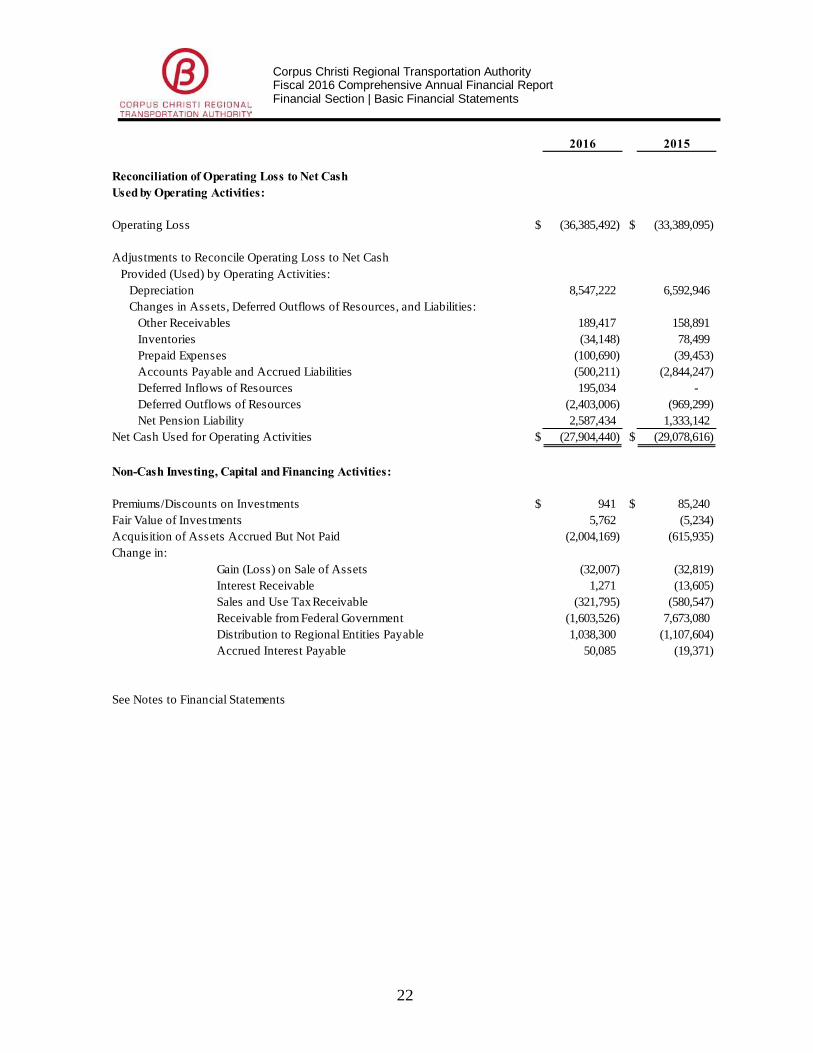
Corpus Christi Regional Transportation Authority Fiscal 2016 Comprehensive Annual Financial Report Financial Section | Basic Financial Statements
2016 2015
Reconciliation of Operating Loss to Net CashUsed by Operating Activities:
Operating Loss $ (36,385,492) $ (33,389,095)
Adjustments to Reconcile Operating Loss to Net Cash Provided (Used) by Operating Activities: Depreciation 8,547,222 6,592,946 Changes in Assets, Deferred Outflows of Resources, and Liabilities: Other Receivables 189,417 158,891 Inventories (34,148) 78,499 Prepaid Expenses (100,690) (39,453) Accounts Payable and Accrued Liabilities (500,211) (2,844,247) Deferred Inflows of Resources 195,034 - Deferred Outflows of Resources (2,403,006) (969,299) Net Pension Liability 2,587,434 1,333,142 Net Cash Used for Operating Activities $ (27,904,440) $ (29,078,616)
Non-Cash Investing, Capital and Financing Activities:
Premiums/Discounts on Investments $ 941 $ 85,240 Fair Value of Investments 5,762 (5,234) Acquisition of Assets Accrued But Not Paid (2,004,169) (615,935) Change in:
Gain (Loss) on Sale of Assets (32,007) (32,819) Interest Receivable 1,271 (13,605) Sales and Use Tax Receivable (321,795) (580,547) Receivable from Federal Government (1,603,526) 7,673,080 Distribution to Regional Entities Payable 1,038,300 (1,107,604) Accrued Interest Payable 50,085 (19,371)
See Notes to Financial Statements

23
Corpus Christi Regional Transportation Authority Fiscal 2016 Comprehensive Annual Financial Report Financial Section | Basic Financial Statements
CORPUS CHRISTI REGIONAL TRANSPORTATION AUTHORITY Fiduciary Funds - Statement of Net Position December 31, 2016 and 2015
2016 2015
ASSETS Investments (Note 2) Money Market Funds $ 1,962,206 $ 1,611,952 Debt Mutual Funds 3,039,689 2,939,915 Equity Mutual Funds 36,036,200 33,491,037 TOTAL ASSETS 41,038,095 38,042,904
LIABILITIES - -
NET POSITION Restricted For Pension Benefits $ 41,038,095 $ 38,042,904
See Notes to Financial Statements

24
Corpus Christi Regional Transportation Authority Fiscal 2016 Comprehensive Annual Financial Report Financial Section | Basic Financial Statements
CORPUS CHRISTI REGIONAL TRANSPORTATION AUTHORITY Fiduciary Funds - Statement of Changes in Net Position Years Ended December 31, 2016 and 2015
2016 2015
Additions:
Investment Income (Loss)
$ 3,165,454 $ (421,639) Employee Contributions 951,132 888,815 Employer Contributions (Note 5) 1,503,736 985,175 Total Additions 5,620,322 1,452,351
Deductions: Benefits Paid 2,515,677 3,185,750 Administrative Expenses 109,454 117,531 Total Deductions 2,625,131 3,303,281
Increase/(Decrease) in Net Position 2,995,191 (1,850,930)
Net Position, January 1 38,042,904 39,893,834
Net Position, December 31
$ 41,038,095 $ 38,042,904
See Notes to Financial Statements
25
Corpus Christi Regional Transportation Authority Fiscal 2016 Comprehensive Annual Financial Report Financial Section | Basic Financial Statements I Notes to Financial Statements
(1) Summary of Significant Accounting Policies
The significant accounting policies followed in the preparation of these financial statements are summarized below. These policies conform to the accounting principles generally accepted in the United States of America (GAAP) for local governmental units as prescribed in the statements issued by the Governmental Accounting Standards Board (GASB) and other authoritative sources.
The Corpus Christi Regional Transportation Authority (Authority) was established by referendum on August 10, 1985, as a political subdivision of the State of Texas, to develop, maintain and operate a public mass transportation system, principally within Nueces County, Texas and certain neighboring communities. The Authority commenced operations on January 1, 1986.
Under state law, the Authority is authorized to levy ½-cent sales and use tax for transit purposes, including both capital improvement and operating expenses. The Authority is not authorized to levy property taxes. The Authority may issue bonds backed by operating revenues. Subject to referendum, the Authority may also issue bonds backed by sales taxes. The Authority is not subject to federal income taxes.
Reporting Entity: “The Financial Reporting Entity,” as defined in Section 2100 of GASB Codification of Governmental Accounting and Financial Reporting Standards, is comprised of the primary government and its component units. The primary government includes all departments and operations of the Authority that are not legally separate organizations. Component units are legally separate organizations that are fiscally dependent on the Authority or for which the Authority is financially accountable. An organization is fiscally dependent if it must receive the Authority’s approval for its budget, the levying of taxes or the issuance of debt. The Authority is financially responsible for an organization if it appoints a majority of the organization’s board and either (a) has the ability to impose its will on the organization or (b) there is a potential for the organization to provide a financial benefit to or impose a financial burden on the Authority. The reporting entity of the Authority consists only of the primary government. There are no component units. The Authority is not included as part of another governmental reporting entity. Measurement Focus, Basis of Accounting and Financial Statements: The accounts of the Authority are organized as a proprietary fund. Proprietary funds account for operations that are financed and operated in a manner similar to a private business enterprise, where the intent is that costs of providing services to the general public on a continuing basis are financed or recovered through user charges. The Authority’s accounts are used for all Authority assets, liabilities, equities, revenues and expenses and are maintained on the accrual basis of accounting. Revenues from operations, investments and other sources are recorded when earned and expenses, including depreciation and amortization, of providing services to the public are accrued when incurred.
26
Corpus Christi Regional Transportation Authority Fiscal 2016 Comprehensive Annual Financial Report Financial Section | Basic Financial Statements I Notes to Financial Statements
Operating revenues include charges for transportation services and related ancillary revenues. Operating expenses include costs of operating the Authority, including fixed route, purchased services, service planning, customer service, vehicle and facilities maintenance and administrative functions. All revenues and expenses that do not meet these definitions are classified as non-operating.
Non-operating revenues are non-exchange transactions, in which the Authority receives value without directly giving something of equal value in return, including sales taxes and grants. Sales tax is recognized when the taxable sales occur. Grants are recognized on a reimbursement basis when all grant requirements have been satisfied.
Budget: State law requires that an annual operating budget be adopted prior to the commencement of a fiscal year. Before the budget is adopted, the Authority’s Board of Directors is required to conduct a public hearing and the proposed budget must be made available to the public at least 14 days prior to the hearing. The Authority may not incur operating expenses in excess of the total budgeted operating expenses unless the Board amends the budget by order after public notice and hearing. Monthly budget reports are prepared for budgetary control purposes.
Fiduciary Funds: Fiduciary funds are used to account for pension activities for which
the Authority is financially accountable. Since these assets are being held for the benefit of other parties and cannot be used to finance the activities of the Authority, they are separately presented funds. Cash and Cash Equivalents: The Authority considers all cash on hand, demand deposits and short-term investments with original maturities of less than 90 days to be cash and cash equivalents. Investments: The Authority’s investments are stated at fair value, except for money market funds and investments with a remaining maturity of one year or less when purchased and non-participating interest earning investment contracts, which are carried at cost. Fair value fluctuates with interest rates and increasing rates may cause the fair value to decline below cost. The calculation of realized gains and losses is independent of a calculation of the net change in the fair value of investments. Net change in the fair value of investments is recognized and reported as investment income in the financial statements. The Authority’s investment policy focuses on strategies that attain preservation of principal primarily and maximizing earnings secondarily. Receivables: Receivables generally consist of amounts due from customers, grantor agencies, cost-sharing agreements, employees, warranties and similar activities. Inventories and Prepaid Items: Parts inventories are stated at average cost. Fuel inventories are carried at cost using the first-in, first-out method. In accordance with industry practice, all inventories are classified as current assets regardless of whether the inventory will be utilized within one year.

27
Corpus Christi Regional Transportation Authority Fiscal 2016 Comprehensive Annual Financial Report Financial Section | Basic Financial Statements I Notes to Financial Statements
Certain payments to vendors reflect costs applicable to future accounting periods and are recorded as prepaid items.
Capital Assets: The Authority defines capital assets as items with initial cost of at least $5,000 for all items and an estimated life of at least two years. Capital assets, which include property, facilities, and equipment, are stated at historical cost. Donated assets are recorded at estimated market value as of the date of donation. Leasehold improvements are amortized over the shorter of the lease term or lives of related improvements. All costs of normal maintenance and repairs are expensed to operations as incurred. Depreciation is computed using the straight-line method over the estimated useful lives of the respective assets. Standard useful life estimates by asset types are as follows:
Asset Type Years Buildings 20-50 Transit Stations and Bus Pads 2-15 Improvements other than buildings 2-5 Building Equipment 2-12
Vehicles 3-12 Furniture & Equipment 2-12 Systems 2-5 Leasehold improvements 2-5
Upon disposal, the costs of assets, including accumulated depreciation, are removed with the resulting gain or loss being reflected as a non-operating revenue/expense in the statement of revenues, expenses, and changes in net position. A portion of the proceeds from sale of property and equipment acquired with federal grants must be remitted to the granting federal agency under certain circumstances.
Compensated Absences: Employees of the Authority are compensated for personal, holiday, and health leave and other qualifying absences. The number of days compensated for these absences is based generally on length of service. It is the Authority’s policy to permit employees to accumulate earned but unused personal leave. The amount of unused time that can be carried over to the next year is limited to 80 hours. Sick leave can be carried over indefinitely and up to 240 hours paid out if the employee retires from the Authority. Compensated absences are reflected in the financial statements when earned and available to the employee. Deferred Inflows/Outflows: Deferred inflows represent an acquisition of net position that applies to a future period(s) and so will not be recognized as an inflow of resources (revenue) until that time. Governments are permitted only to report inflows in circumstances specifically authorized by the GASB. Deferred inflows related to pensions consist of the difference between expected and actual experience. Deferred outflows of resources represent a consumption of net position that applies to future periods and so will not be recognized as an outflow of resources (expenses) until that time. Deferred outflows related to pensions consist of amounts paid into the retirement system after the prescribed measurement date, the net difference between projected and actual earnings and the difference between actual and expected experience.

28
Corpus Christi Regional Transportation Authority Fiscal 2016 Comprehensive Annual Financial Report Financial Section | Basic Financial Statements I Notes to Financial Statements
Pension Plans: It is the Authority’s policy to fund pension costs annually. For purposes of measuring the net pension asset, deferred outflows of resources related to pensions, and pension expense, information about the fiduciary net position of the Authority’s Defined Benefit and Defined Contributions Plan (Plans) and additions to/deductions from the Authority’s plans fiduciary net position have been determined on the same basis as they are reported by plans. For this purpose benefit payments (including refunds of employee contributions) are recognized when due and payable in accordance with the benefit terms. Investments are reported at fair value. For more information on the Authority’s pension plans, see Note 5 of the Notes and Financial Statements. Estimates: Management uses estimates and assumptions in preparing the financial statements. Those estimates and assumptions affect the reported amounts of assets and liabilities, the disclosure of contingent assets and liabilities, and the reported revenues and expenses.
Recent Accounting Pronouncements: GASB 72 – Fair Value Measurement and Application-addresses accounting and financial reporting issues related to fair value measurements. The definition of fair value is the price that would be received to sell an asset or paid to transfer a liability in an orderly transaction between market participants at the measurement date. The requirements of this statement will enhance comparability of financial statements among governments by requiring measurement of certain assets and liabilities at fair value using a consistent and more detailed definition of fair value and accepted valuation techniques. This Statement will also enhance the fair value application guidance and related disclosures in order to provide information to financial statement users about the impact of fair value measurements on a government’s financial position. GASB 72 is effective for financial statements for fiscal years beginning after June 15, 2015. The Authority implemented this statement in the year ended December 31, 2016. Prior Period Restatements: During the course of the review of the Authority’s financial activity, it was determined that federal capital grant funds previously recognized as revenue during the year ended December 31, 2015, however the grant application had not been submitted. As a result, a large receivable recorded at December 31, 2015 was not collected on during the year ended December 31, 2016. At the time of this report, the grant application had been completed and submitted to the FTA for approval. Once accepted, the grant awarded will be recognized as revenue for the year ended December 31, 2017. For purposes of this report, however, it was determined necessary to record a prior period adjustment in the amount of federal funds not yet collected.
Beginning net position $ 99,687,414 Adjustment made for Federal Grants Receivable
during the year ended December 31, 2015
(6,086,312) Beginning net position as restated $ 93,601,102

29
Corpus Christi Regional Transportation Authority Fiscal 2016 Comprehensive Annual Financial Report Financial Section | Basic Financial Statements I Notes to Financial Statements
Future Accounting Pronouncements: GASB 74 – Financial Reporting for Postemployment Benefit Plans Other Than Pension Plans – replaces Statements No. 43, Financial Reporting for Postemployment Benefit Plans Other than Pension Plans, as amended, and No. 57, OPEB Measurements by Agent Employers and Agent Multiple-Employer Plans. It also includes requirements for defined contribution OPEB plans that replace the requirements for those OPEB plans in Statement No. 25, Financial Reporting for Defined Benefit Pension Plans and Note Disclosures for Defined Contribution Plans, as amended, Statement 43, and Statement No. 50, Pension Disclosures. The requirements of this Statement will improve financial reporting primarily through enhanced note disclosures and schedules of required supplementary information that will be presented by OPEB plans and the decision-usefulness of the financial reports of those OPEB plans. The Authority will implement GASB No. 74 in the year ending December 31, 2017.
(2) Cash, Cash Equivalents, and Investments
As of December 31, 2016 and 2015, the Authority had the following cash, cash equivalents and investments:
The Carrying Value of the Enterprise Fund Equity in Investments was $9,002,510 and $10,929,003 at December 31, 2016 and 2015, respectively. Fair Value Measurements – During the fiscal year ending December 31, 2016, the Authority adopted GASB Statement No. 72, Fair Value Measurement and Application, which provides guidance for determining a fair value measurement for financial reporting purposes. The Authority categories its investments measured at fair value within the hierarchy established by generally accepted accounting principles. Investments valued at fair value are categorized based on inputs to valuation techniques as follows: Level 1 input – Quotes prices for identical assets or liabilities in an active market that an entity has the ability to access.
EnterpriseFund
Fiduciary Funds
Weighted Average
EnterpriseFund
Fiduciary Funds
Weighted Average
Deposits and Investmentsby Type
Fair Value Fair Value Maturity Fair Value Fair Value Maturity
Demand Deposits $ 15,696,376 - 1 $ 12,086,139 - 1Government Agencies 1,804,398 - 270 - - 0Government Treasury 2,700,529 - 39 4,999,548 - 322Municipal Obligations - - 0 1,000,000 - 74Certificates of Deposit 3,502,593 - 182 4,914,857 - 123Commercial Paper 999,958 - 2 - - 0Money Market Funds 1,759,504 1,962,206 1 11,294,076 1,611,952 1Debt Mutal Funds - 3,039,689 1 - 2,939,915 1Equity Mutual Funds - 36,036,200 1 - 33,491,037 1
Total 26,463,358 41,038,095 34,294,621 38,042,904
Included in Cash and CashEquivalents
(17,455,880) (1,962,206) (23,380,215) (1,611,952)
Equity in Investments $ 9,007,479 39,075,889 $ 10,914,406 36,430,952
2016 2015

30
Corpus Christi Regional Transportation Authority Fiscal 2016 Comprehensive Annual Financial Report Financial Section | Basic Financial Statements I Notes to Financial Statements
Level 2 input – Quoted prices for similar assets or liabilities in active markets and inputs that are observable for the asset or liability, either directly or indirectly, for substantially the full term of the asset or liability. Level 3 input – Inputs that are unobservable for the asset or liability which are typically based upon the Authority’s own assumptions as there is little, if any, related market activity. Because the investments are restricted by Board policy and state law to active secondary market, the market approach is being used for valuation. The market approach uses prices and other relevant information generated by market transactions involving identical or comparable assets, liabilities, or a group of assets and liabilities. The exit or fair market prices used for these fair market valuations of the portfolio are all Level 1 and represent unadjusted quoted prices in active markets for identical assets and liabilities that have been accessed at the measurement date. As of December 31, 2016 and 2015, the securities to be priced in the portfolio were as follows:
Enterprise Fund Fiduciary Fund Enterprise Fund Fiduciary FundUS Treasury Obligations 2,700,529$ -$ 4,999,548$ -$ US Gov't Agencies 1,804,398 - - - Municipal Notes - - 1,000,000 - Certificates of Deposit 3,502,593 - 4,914,857 - Commercial Paper 999,958 - - - Money Market Funds 1,759,505 1,962,206 11,294,076 1,611,952 Debt Mutual Funds - 3,039,689 - 2,939,915 Equity Mutual Funds - 36,036,200 - 33,491,037
Total 10,766,984$ 41,038,095$ 22,208,481$ 38,042,904$
Fair Value Measurement Using QuotedPrices in Active Markets for Identical
Assets (Level 1)December 31,
2016 2015
31
Corpus Christi Regional Transportation Authority Fiscal 2016 Comprehensive Annual Financial Report Financial Section | Basic Financial Statements I Notes to Financial Statements
Interest Rate Risk: This is the risk that changes in the interest rates will negatively impact the fair value of the Authority’s investments. As market interest rates rise, the fair value of an investment held decreases. By policy, the Authority’s strategy for managing this risk is to limit the weighted average maturity for the portfolio to one year. The maximum maturity for any one investment is three years. For the Enterprise Fund as of December 31, 2016,
• no holding in the portfolio had a maturity date beyond 343 days, • holdings maturing beyond six months represented 13.33% of
the total portfolio, • the dollar weighted average maturity of the portfolio was 49 days.
For the Enterprise Fund as of December 31, 2015,
• no holding in the portfolio had a maturity date beyond 344 days, • holdings maturing beyond six months represented 1.90% of
the total portfolio, • the dollar weighted average maturity of the portfolio was 74 days.
Credit Risk - Investments: This is the risk that an issuer or other counterparty to an investment will not fulfill its obligation to the Authority. The primary stated objective of the Authority’s adopted Investment Policy is the safety of principal and the avoidance of principal loss. Credit risk within the Authority’s portfolio among the authorized investments in the Policy is represented in time and demand deposits, repurchase agreements, state and local government obligations, local government pools, banker’s acceptances, commercial paper and non-rated SEC registered money market mutual funds. All other investments are rated AAA, or equivalent, by at least one nationally recognized rating organization (NRSRO). Certificates of deposit are limited to a stated maturity of two years and FDIC insurance is required. Brokered certificates of deposit must be FDIC insured and delivered versus payment to the Authority’s depository. Maximum maturity is two years with 102% collateralization required. FDIC insurance must be verified before purchase and monitored thereafter. All investments requiring a rating must be monitored on an ongoing basis. Concentration of Credit Risk: This is the risk of investing predominantly in any one type of investment or entity. The Authority recognizes over-concentration of assets by market sector or maturity as a risk to the portfolio. The Authority’s adopted investment policy establishes diversification as a major objective of the investment program and sets diversification limits for all authorized investment types which are monitored on a monthly basis. As of December 31, 2016 and 2015 the limits on the various types of authorized investments as a percent of the portfolio were:
32
Corpus Christi Regional Transportation Authority Fiscal 2016 Comprehensive Annual Financial Report Financial Section | Basic Financial Statements I Notes to Financial Statements
Custodial Credit Risk – Deposits and Investments: For deposits, this is the risk that if a bank fails, the Authority may not recover its deposits. The Authority contractually requires that all demand deposits held in the bank overnight and repurchase agreements be fully insured or collateralized at 102% under a written agreement. Collateral is held in safekeeping by an independent third party. At December 31, 2016 and 2015 bank funds on deposit in excess of FDIC insurance were collateralized at more than 102%. For an investment, custodial credit risk is the risk that, in the event of the failure of the counterparty, the Authority may not recover the value of its investments or collateral securities that are in the possession on an outside party. The Authority requires that all securities must be cleared on a delivery versus payment (DVP) basis and Authority ownership documented by original clearing confirmations and safekeeping receipts. At December 31, 2016 and 2015, all Authority’s securities were handled in this manner. Fiduciary Funds: Funds in the Authority’s Defined Benefit and Defined Contribution plans are invested through trust plans managed by Wells Fargo. These funds are invested under separate investment policies which allow for investments in money market accounts, mutual funds, stocks and bonds. Through adherence to the plans’ investment policies, management attempts to limit or mitigate certain risks. The Authority is responsible for the Plans’ assets.
Defined Benefit Plan: The primary investment objective is to earn a rate of return sufficient to match or exceed the long-term growth of the Plan’s liabilities through a combination of income and capital appreciation in a manner consistent with the fiduciary standards of ERISA and with sound investment practices. Assets are invested to minimize the chance of suffering market value losses. Assets are diversified into different styles with a prudent number of individual issues within each style to mitigate concentration risk.
Actual as of Actual as of Investment Type Allowable 12/31/2016 12/31/2015
US Treasury Obligations 80.00% 10.92% 16.17% US Agencies/Instrumentalities 80.00% 7.29% 0.00% State Government Obligations 35.00% 0.00% 0.00% Local Government Obligations 35.00% 0.00% 3.24% Certificates of Deposit (Depository) 50.00% 14.16% 15.90% Brokered Certificates of Deposit 30.00% 0.00% 0.00% Repurchase Agreements 50.00% 0.00% 0.00% Flex in CIP Funds 100.00% 0.00% 0.00% Local Government Investment Pools 80.00% 0.00% 0.00% Money Market Funds / Demand Deposits 100.00% 63.59% 64.69% Commercial Paper 25.00% 4.04% 0.00% Bankers Acceptances 20.00% 0.00% 0.00%
33
Corpus Christi Regional Transportation Authority Fiscal 2016 Comprehensive Annual Financial Report Financial Section | Basic Financial Statements I Notes to Financial Statements
Defined Contribution Plan: The overall objective is to enable eligible employees to save for retirement by providing a tax-deferred savings plan and offering enough funds from distinct asset classes to accommodate a broad range of individual investment goals. The Plan provides multiple investment alternatives, each with different risk and return characteristics, so that each participant can choose the potential return and risk levels as well as attain diversification among the alternatives. The Authority employs certain qualitative and quantitative measures to evaluate potential investment alternatives.
(3) Capital Assets
The Authority’s capital assets represent investments in land, buildings, transit stations, infrastructure improvements, bus stops, street pads, bus turn-ins, motor coaches, trolleys, paratransit vehicles, sedans, vans, cars and trucks, garage equipment, facilities maintenance equipment, office equipment and information technology needed to conduct the Authority’s operations.
Capital asset activities for the year ended December 31, 2016 is as follows:
Balance at Additions / Balance at 12/31/2015 Transfers Retirements 12/31/2016
Assets Not Being Depreciated: Land $ 3,658,054 - - 3,658,054 Construction in Progress 23,977,972 (23,768,782) - 209,190
27,636,026 (23,768,782) 3,867,244
Assets Being Depreciated: 18,363,541 Buildings 31,594,523 - 49,958,064
Transit Stations, Bus Stops, Street Pads & Other Improvements 25,595,487 203,602 - 25,799,089 Improvements other than Buildings 4,656,155 50,520 - 4,706,675 Vehicles, Furniture and Equipment 61,205,177 2,399,709 - 63,604,886
109,820,360 34,248,354 - 144,068,714 Total Capital Assets 137,456,386 10,479,572 - 147,935,958
Less: Accumulated Depreciation:
Buildings 10,763,809 1,091,310 - 11,855,119 Transit Stations, Bus Stops, Street Pads & Other Imp. 18,815,626 1,175,011 - 19,990,637 Improvements other
than Buildings 2,224,983 347,034 - 2,572,017 Vehicles, Furniture
and Equipment 27,243,469 5,933,867 - 33,177,336 Total Accumulated Depreciation 59,047,887 8,547,223 - 67,595,110 Total Capital Assets, Net $ 78,408,499 1,932,349 - 80,340,848

34
Corpus Christi Regional Transportation Authority Fiscal 2016 Comprehensive Annual Financial Report Financial Section | Basic Financial Statements I Notes to Financial Statements
Capital asset activities for the year ended December 31, 2015 is as follows:
Balance at Additions / Balance at 12/31/2014 Transfers Retirements 12/31/2015
Assets Not Being Depreciated: Land $ 3,658,054 - - 3,658,054 Construction in Progress 11,926,400 12,051,572 - 23,977,972
15,584,454 12,051,572 - 27,636,026
Assets Being Depreciated: 18,363,541 Buildings - - 18,363,541
Transit Stations, Bus Stops, Street Pads & Other Improvements 24,462,906 1,132,581 - 25,595,487 Improvements other than Buildings 3,957,438 698,717 - 4,656,155 Vehicles, Furniture and Equipment 46,119,307 18,794,021 (3,708,151) 61,205,177
92,903,192 20,625,319 (3,708,151) 109,820,360 Total Capital Assets 108,487,646 32,676,891 (3,708,151) 137,456,386
Less: Accumulated Depreciation: Buildings 10,157,157 606,652 - 10,763,809 Transit Stations, Bus Stops, Street Pads & Other Imp. 17,613,646 1,201,980 - 18,815,626 Improvements other
than Buildings 1,948,266 276,717 - 2,224,983 Vehicles, Furniture
and Equipment 26,369,488 4,507,597 (3,633,616) 27,243,469 Total Accumulated Depreciation 56,088,557 6,592,946 (3,633,616) 59,047,887 Total Capital Assets, Net $ 52,399,089 26,083,945 (74,535) 78,408,499

35
Corpus Christi Regional Transportation Authority Fiscal 2016 Comprehensive Annual Financial Report Financial Section | Basic Financial Statements I Notes to Financial Statements
(4) Long – Term Liabilities
Changes in Long-Term Liabilities
2016 1/1/2016 Additions Retirements 12/31/2016 Due Within One Year
Revenue Bonds $ 20,915,000 - 540,000 20,375,000 555,000 Net Pension Liability 732,975 3,765,932 1,178,498 3,320,409 - Net OPEB Obligations 483,688 118,272 166,543 435,418 - Compensated Absences 408,050 721,504 668,995 460,557 275,328 Total Long Term Liabilities $ 22,539,713 4,605,708 2,554,035 24,591,385 830,328
2015 1/1/2015 Additions Retirements 12/31/2015 Due Within One Year
Revenue Bonds $ 21,450,000 - 535,000 20,915,000 540,000 Net Pension Liability - 1,718,150 985,175 732,975 -
Net OPEB Obligations 518,327 118,504 153,143 483,688 - Compensated Absences 337,197 457,447 386,595 408,049 234,460 Total Long Term Liabilities $ 22,305,524 2,294,101 2,059,912 22,539,713 774,460
Long-Term Debt: On November 20, 2013, the Authority issued revenue bonds, Series 2013 (AMT) in the amount of $11,525,000, with proceeds from the sale to be used for (1) renovation of the existing Staples Street bus transfer station; (2) construct and equip a portion of a new multi-use building adjacent to the Staples Street bus transfer station; (3) construct a new parking lot to serve the Staples Street bus transfer station and the multi-use building, and (4) pay the costs of issuing the Tax-Exempt Bonds. The Authority also issued revenue bonds, Taxable Series 2013 in the amount of $10,500,000 on November 20, 2013, with the proceeds from the sale to be used to (1) construct and equip a portion of a new multi-use building adjacent to the Staples Street bus transfer station and (2) pay the costs of issuing the Taxable Bonds. Both issues were capital related debt. These bonds are first lien revenue bonds, and will be repaid from the pledged revenues of the Authority. Pledged revenues, as defined by the bond resolution include the net operating revenues, plus any additional revenues, income, receipts, or other revenues which are pledged by the Issuer. Unspent proceeds for the bonds at December 31, 2016 and 2015 were $110,863 and $9,404,308, respectively. Total interest cost for period ending December 31, 2016 was $1,114,330 of which $477,510 was capitalized. Total interest cost for period ending December 31, 2015 was $1,112,289 of which $657,893 was capitalized.
36
Corpus Christi Regional Transportation Authority Fiscal 2016 Comprehensive Annual Financial Report Financial Section | Basic Financial Statements I Notes to Financial Statements
Total debt service requirements as of December 31, 2016 are as follows: Compensated Absences: Authority employees are allowed to carry a maximum of 80 hours of accrued but unused personal leave as of December 31 into the next year. Unused personal leave in excess of 80 hours is forfeited. Sick leave can be carried over indefinitely and up to 240 hours can be paid to an employee retiring from the RTA.
$11,525,000 Series 2013 (AMT Bonds) Years Ending Total December 31, Principal Interest Requirements
2017 $ 295,000 $ 516,823 $ 811,823 2018 310,000 505,023 815,023 2019 320,000 492,623 812,623 2020 335,000 479,823 814,823
2021-2025 1,870,000 2,206,206 4,076,206 2026-2030 2,340,000 1,730,881 4,070,881 2031-2035 2,985,000 1,081,413 4,066,413 2036-2038 2,205,000 241,337 2,446,337
$ 10,660,000 $ 7,254,129 $ 17,914,129
$10,500,000 Series 2013, Taxable Bonds Years Ending Total December 31, Principal Interest Requirements
2017 $ 260,000 $ 531,203 $ 791,203 2018 265,000 524,885 789,885 2019 275,000 517,147 792,147 2020 285,000 507,742 792,742
2021-2025 1,620,000 2,340,244 3,960,244 2026-2030 2,105,000 1,859,805 3,964,805 2031-2035 2,790,000 1,167,446 3,957,446 2035-2038 2,115,000 262,910 2,377,910
$ 9,715,000 $ 7,711,382 $ 17,426,382

37
Corpus Christi Regional Transportation Authority Fiscal 2016 Comprehensive Annual Financial Report Financial Section | Basic Financial Statements I Notes to Financial Statements
(5) Retirement Plans Defined Benefit Plan
For the year ended December 31, 2016, the Authority’s Net Pension Liability was measured as of December 31, 2015, and the Total Pension Liability was determined by an actuarial valuation as of that date. For the year ended December 31, 2015, the Authority’s Net Pension Liability was measured as of December 31, 2014, and the Total Pension Liability was determined by an actuarial valuation as of that date. Plan Description: The RTA Employees Defined Benefit Plan and Trust (DB Plan) is a single-employer defined benefit pension plan administered by the Authority and established upon the applicable sections of the Internal Revenue Code. The Authority Board may periodically amend the DB Plan document. The current plan provisions were established by a plan and trust agreement adopted by the Board of Directors in July 1986, and amended in July 1994, February 2002, November 2010, December 2011, December 2012 and December 2014.
Benefits and refunds are recognized when due and payable in accordance with the terms of the plan. The DB Plan assets are maintained under a trust agreement with Wells Fargo Bank (Trustee). The trustee carries out an investment policy established by the Authority Board consistent with purposes of the plan and all applicable laws. Administration costs are paid by the plan.
All full time employees are included in the plan. Vesting begins at three years of service with full vesting at seven years. Employees who retire on or after age 62 are entitled to an annual retirement benefit equal to 2% of average compensation for the final three consecutive years of employment times their number of years of service for the Authority. Reduced retirement benefits are available at age 55 with ten years of service. In December 2014, the plan was amended to allow those eligible for early retirement during a specified window without incurring the normal reduction in benefits. The plan is not indexed for inflation. As of January 1, 2016 there were 538 participants in this plan as follows:
Funding Policy: The Authority is the only source of contributions which are determined annually based on actuarial studies as of the valuation date. The contributions consist of a normal annual pension cost and amortization of any unfunded actuarial accrued liability (UAAL). The actuarially determined rate for
December 31,2015
December 31,2014
Retirees or beneficiaries currently receiving benefits 140 129Inactive employees entitled to but not yet receiving benefits 175 164Active employees 223 232
Total Participants 538 525

38
Corpus Christi Regional Transportation Authority Fiscal 2016 Comprehensive Annual Financial Report Financial Section | Basic Financial Statements I Notes to Financial Statements
contributions as a percent of covered payroll for 2016 and 2015 respectively, was 16.0% and 11.2%. Actuarial Assumptions: The actuarial assumptions that determined the total net pension liability as of December 31, 2015 and December 31, 2014 are as follows:
Valuation Date December 31, 2015 & December 31, 2014
Actuarial Cost Method Entry-Age Normal Cost Amortization Method Level dollar amount over 15 years from
January 1, 2009
Asset Valuation Method Market Value Actuarial Assumptions:
Investment rate of return 7.5%
Projected Salary Increase 3.5% Mortality Rate 1984 Unisex Mortality Table Normal Retirement First of month after attaining age 62
Discount Rate: The discount rate used to determine the total pension liability was 7.5%. Pursuant to Paragraph 43 of GASB No. 67, an alternative analysis is performed to compare the plan’s net fiduciary position to projected benefit payments.
1. The Normal Cost represents the annual cost of benefit payments arising from future service increases for active employees.
2. The Unfunded Actuarial Accrued Liability represents the accumulated deficiency of the total cost of benefit payments which have already been earned over the current assets held by the plan’s trust.
3. RTA’s contribution policy is to make an annual payment equal to the Normal Cost plus the amortization payment of the Unfunded Actuarial Accrued Liability. The amortization payment is calculated as a level dollar amount over a period of 15 years from January 1, 2009.
4. A review of actual contributions over the past five years shows the RTA has made sufficient contributions to meet its funding policy.
On the basis of the above, the projected cash flows will be sufficient to provide the benefit payments to the plan participants. Thus, the Discount Rate is equal to the long-term expected rate of return of 7.5%.

39
Corpus Christi Regional Transportation Authority Fiscal 2016 Comprehensive Annual Financial Report Financial Section | Basic Financial Statements I Notes to Financial Statements
Discount Rate Sensitivity Analysis: The following presents the net pension liability, calculated using a discount rate of 7.5%, as well as what the net pension liability would be if it were calculated using a discount rate that is one percentage point lower (6.5%) or one percentage point higher (8.5%) than the current rate:
1% Decrease Current Discount Rate 1% Increase (6.5%) (7.5%) (8.5%)
December 31, 2015 Net pension liability $7,338,602 $3,320,409 ($57,330) December 31, 2014 Net pension liability $4,359,496 $732,975 ($2,566,523)
Net Pension Liability: The changes in net pension liability for the measurement date of December 31, 2015 based on the actuarial date of December 31, 2015 are reflected below:
The changes in net pension liability for the measurement date of December 31, 2014 based on the actuarial date of December 31, 2014, are reflected below:
Change in Total Pension Fiduciary Net PensionNet Pension Liability Liability Net Position Liability
Changes for the Year: Service cost 876,806 -- 876,806 Interest on total pension liability 2,396,547 -- 2,396,547 Effect of plan change (Changes of benefit terms) 115,478 -- 115,478 Difference between expected and actual experience (260,046) -- (260,046) Benefit Payments (1,493,324) (1,493,324) -- Contributions - employer -- 985,175 (985,175) Net investment income -- (348,950) 348,950 Administrative Expenses -- (94,874) 94,874 Balances as of December 31, 2015 $ 33,530,870 $ 30,210,461 $ 3,320,409
Increase (Decrease)
Change in Total Pension Fiduciary Net PensionNet Pension Liability Liability Net Position Liability
Balances as of December 31, 2013 $ 29,016,953 $ 29,617,120 $ (600,167)
Changes for the Year: Service cost 695,517 -- 695,517 Interest on total pension liability 2,254,995 -- 2,254,995 Effect of plan change (Changes of benefit terms) 391,915 -- 391,915 Difference between expected and actual experience 784,295 -- 784,295 Benefit Payments (1,248,266) (1,248,266) -- Contributions - employer -- 1,178,498 (1,178,498) Net investment income -- 1,706,547 (1,706,547) Administrative Expenses -- (91,465) 91,465 Balances as of December 31, 2014 $ 31,895,409 $ 31,162,434 $ 732,975
Increase (Decrease)

40
Corpus Christi Regional Transportation Authority Fiscal 2016 Comprehensive Annual Financial Report Financial Section | Basic Financial Statements I Notes to Financial Statements
For the year ended December 31, 2016, the Authority recognized pension expenses:
Service cost
$ 876,806 Interest on total pension liability
2,396,547
Effect of plan change (Changes of benefit terms)
115,478 Administrative
94,874
Expected investment returns net of investment expenses (7.5% per Plan) (2,431,199) Recognition of deferred inflows/outflows of resources:
Recognition of difference in investment gains or losses
699,630 Recognition of difference in change in experience
154,775
Pension expense
$ 1,906,911
For the year ended December 31, 2015, the Authority recognized pension expenses:
Service cost
$ 695,517 Interest on total pension liability
2,254,995
Effect of plan change (Changes of benefit terms)
391,915 Administrative
91,465
Expected investment returns net of investment expenses (7.5% per Plan) (2,424,548) Recognition of deferred inflows/outflows of resources:
Recognition of difference in investment gains or losses
143,600 Recognition of difference in change in experience
196,074
Pension expense
$ 1,349,018
For the year ended December 31, 2016, the Authority recorded deferred outflows of resources related to the pension as follows:
Amounts currently reported as deferred outflows of resources related to pensions, excluding contributions made subsequent to the measurement date, will be recognized in pension expenses as follows:
Deferred DeferredOutflows of Inflows ofResources Resources
Difference between expected and actual experience $ 392,147 $ 195,034 Net difference between projected and actual earningson pension plan investments 2,654,920 - Contributions made subsequent to measurement date 1,503,736 Deferred Outflows and Inflows of Resources $ 4,550,803 $ 195,034
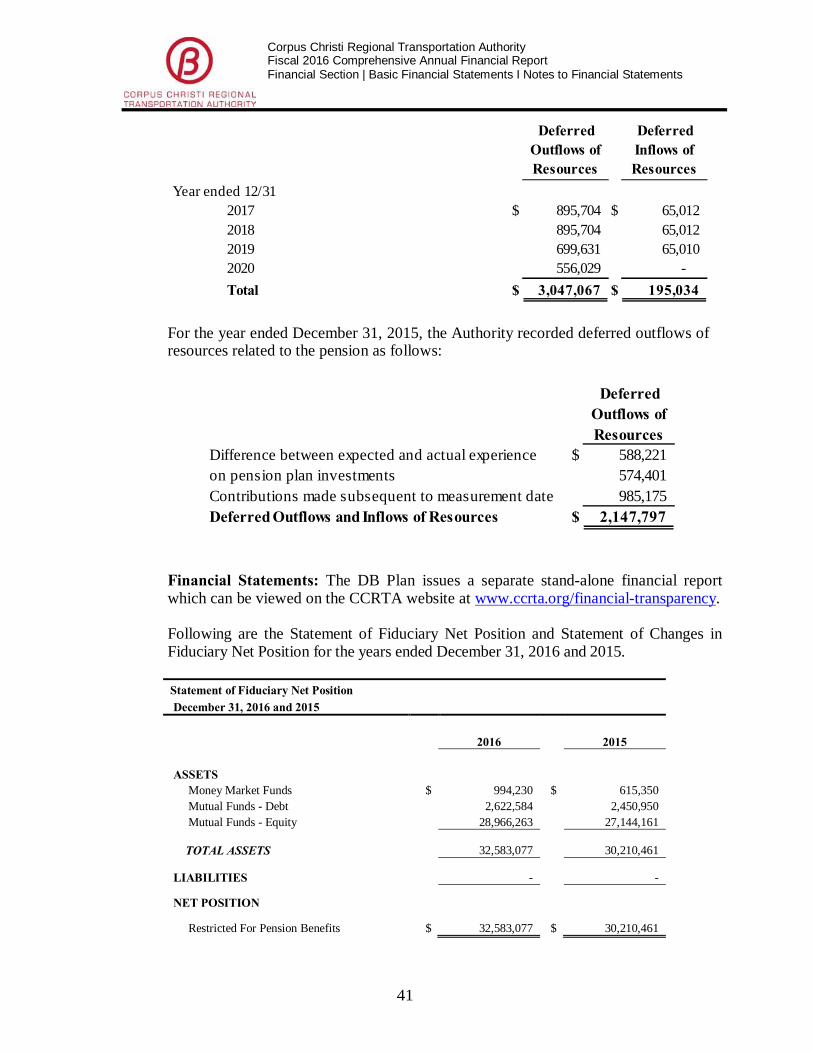
41
Corpus Christi Regional Transportation Authority Fiscal 2016 Comprehensive Annual Financial Report Financial Section | Basic Financial Statements I Notes to Financial Statements
For the year ended December 31, 2015, the Authority recorded deferred outflows of resources related to the pension as follows:
Financial Statements: The DB Plan issues a separate stand-alone financial report which can be viewed on the CCRTA website at www.ccrta.org/financial-transparency. Following are the Statement of Fiduciary Net Position and Statement of Changes in Fiduciary Net Position for the years ended December 31, 2016 and 2015. Statement of Fiduciary Net Position December 31, 2016 and 2015
2016 2015
ASSETS Money Market Funds $ 994,230 $ 615,350 Mutual Funds - Debt 2,622,584 2,450,950 Mutual Funds - Equity 28,966,263 27,144,161 TOTAL ASSETS 32,583,077 30,210,461
LIABILITIES - -
NET POSITION
Restricted For Pension Benefits $ 32,583,077 $ 30,210,461
Deferred Outflows of Resources
Deferred Inflows of Resources
Year ended 12/312017 $ 895,704 $ 65,012 2018 895,704 65,012 2019 699,631 65,010 2020 556,029 - Total $ 3,047,067 $ 195,034
DeferredOutflows ofResources
Difference between expected and actual experience $ 588,221 on pension plan investments 574,401 Contributions made subsequent to measurement date 985,175 Deferred Outflows and Inflows of Resources $ 2,147,797

42
Corpus Christi Regional Transportation Authority Fiscal 2016 Comprehensive Annual Financial Report Financial Section | Basic Financial Statements I Notes to Financial Statements
Statement of Changes in Fiduciary Net Position Years Ended December 31, 2016 and 2015
2016 2015 Additions: Investment Income/(Loss) $ 2,523,596 (348,950) Employer Contributions 1,503,736 985,175
Total Additions 4,027,332 636,225
Deductions: Benefits Paid 1,561,905 1,493,324 Administrative Expenses 92,810 94,874
Total Deductions 1,654,715 1,588,198
Increase (Decrease) in Net Position 2,372,617 (951,973)
Net Position, January 1 30,210,461 31,162,434 Net Position, December 31 $ 32,583,077 30,210,461
Defined Contribution Plan
Plan Description: The RTA Employees’ Defined Contribution Plan (DC Plan) covers all employees. This defined contribution plan has a plan document in compliance with the Internal Revenue Code and adopted by the Board, who may amend it. Benefits depend on amounts contributed to the plan plus investment earnings. Employees are fully vested in their contributions. Employees direct their investments. Funding Policy: Employees are required to contribute 7.51% of gross remuneration and may make additional contributions of up to 10%. The Authority may make contributions, but has made none to date. Total covered payrolls were $11,002,471 in 2016 and $10,699,764 in 2015. Employee contributions were $938,773 in 2016 and $888,815 in 2015. Employees may make selections from money market, debt and equity mutual funds approved by the investment committee.
Financial Statements: The DC Plan does not issue a separate stand-alone financial report. Financial statements for the years ended 2016 and 2015 are as follows:

43
Corpus Christi Regional Transportation Authority Fiscal 2016 Comprehensive Annual Financial Report Financial Section | Basic Financial Statements I Notes to Financial Statements
Statement of Changes in Fiduciary Net Position Years Ended December 31, 2016 and 2015
2016 2015 Additions: Investment Income/(Loss) $ 641,858 (72,689) Rollover Contributions 12,359 Employer Contributions 938,773 888,815
Total Additions 1,592,990 816,126
Deductions: Benefits Paid 953,771 1,692,426 Administrative Expenses 16,644 22,657
Total Deductions 970,415 1,715,083
Increase (Decrease) in Net Position 622,575 (898,957)
Net Position, January 1 7,832,443 8,731,400 Net Position, December 31 $ 8,455,018 7,832,443
Statement of Fiduciary Net Position December 31, 2016 and 2015
2016 2015
ASSETS Money Market Funds $ 967,976 996,602 Mutual Funds - Debt 417,105 488,965 Mutual Funds - Equity 7,069,937 6,346,876 TOTAL ASSETS 8,455,018 7,832,443
LIABILITIES - -
NET ASSETS Held In Trust For Pension Benefits $ 8,455,018 7,832,443

44
Corpus Christi Regional Transportation Authority Fiscal 2016 Comprehensive Annual Financial Report Financial Section | Basic Financial Statements I Notes to Financial Statements
(6) Other Post-Employment Benefits (OPEB) Plan
GASB in Section P50 of the Codification of Governmental Accounting and Financial Reporting Standards established accounting standards for postretirement benefits other than pensions. This standard does not require funding of OPEB, but does require that any difference between the annual required contribution (ARC) and the amount funded during the year be recorded in the employer’s financial statements as an increase (or decrease) to the OPEB. The most recent actuarial valuation performed in accordance with the standard was dated January 1, 2016.
The 2016 valuation included changes in actuarial assumptions since the prior 2014 valuation. These changes are as follows:
• Medical Costs and Trend – The claims cost assumption was updated using the
most recent experience available, and administrative fees and stop loss premiums were updated based on current rates. In setting the claims and stop loss premium assumption, the aging table from the prior actuary’s table was updated to the USI aging table. In addition, medical trend and stop loss premium trend was reset to 9% grading to 5.5% over 14 years. Previously, stop loss premiums were assumed to trend at 11% grading to 7.5% over 14 Years. These changes resulted in a 24% decrease in AAL.
• Mortality Rates – The mortality assumption was updated from RP-2000
Combines Health mortality table to the RP-2014 Adjusted to 2006 with Projection under scale MP-2015. This resulted in a decrease in AAL of less than 1%.
Plan Description: The Authority administers a single-employer defined benefit healthcare plan that allows access to medical benefits by eligible retirees and their families until the retiree reaches age 65. The Authority Board establishes benefit provisions. The plan is not accounted for as a fiduciary fund as an irrevocable trust has not been established to fund the plan. The plan does not issue a financial report.
Funding Policy: The Authority requires retirees to pay a portion of the monthly “blended” rates that apply to the group as a whole. Since retiree health care costs are generally higher than active employee healthcare costs, there is an implicit subsidy higher than the stated subsidy of the Authority. For 2016, $627.99 was the required monthly contribution for retiree family coverage and $246.44 for retiree single coverage. The Authority’s contributions are on a pay-as-you-go basis. As of the most recent valuation membership is as follows:
Retirees 14
Active 227
Total 241

45
Corpus Christi Regional Transportation Authority Fiscal 2016 Comprehensive Annual Financial Report Financial Section | Basic Financial Statements I Notes to Financial Statements
Annual OPEB Cost and Net OPEB Obligation: The Authority's annual other post-employment benefit (OPEB) expense is calculated based on the annual required contribution of the employer (ARC), an amount actuarially determined in accordance with the parameters of GASB. The ARC represents a level of funding that, if paid on an ongoing basis, is projected to cover normal cost each year and amortize any unfunded actuarial liabilities (or funding excess) over a period not to exceed thirty years. The Authority's annual OPEB cost, the amounts actually contributed toward the plan and changes in the net OPEB obligation are as follows:
2016 2015
Annual Required Contribution $ 126,353 $ 127,164
Interest on OPEB Liability 19,348 20,733
Adjustment to the ARC (27,428) (29,393)
Annual OPEB Cost 118,273 118,504
Employer Contributions (166,543) (153,143)
Net Change in OPEB Liability (48,270) (34,639)
OPEB Liability at January 1 483,688 518,327
OPEB Liability at December 31 $ 435,418 $ 483,688
Trend Information: The Authority's annual OPEB cost, the percentage of annual OPEB cost contributed to the plan and the net OPEB obligation are as follows:
Year Annual OPEB
Cost Percentage of Annual
OPEB Cost Contributed Net OPEB Obligation
At Year-End 2016 $ 118,273 140.8% $ 435,417 2015 $ 118,504 129.2% $ 483,688 2014 $ 121,654 74.4% $ 518,327
Funded Status and Funding Progress: The funded status of the plan as of the most recent valuation dates is as follows:
Unfunded Actuarial Accrued (Overfunded) Annual UAAL As Valuation Actuarial Value Liability (AAL) - Actuarial Accrued Covered Percentage
Date of Assets Unit Cost Liability (UAAL) Payroll of Payroll
01/01/16 $ - $ 1,427,656 $ 1,427,656 $ 8,685,563 16.4%
001/01/14 $ - $ 1,645,605 $ 1,645,605 $ 6,838,718 24.1%
01/01/12 $ - $ 377,934 $ 377,934 $ 6,436,310 5.9%
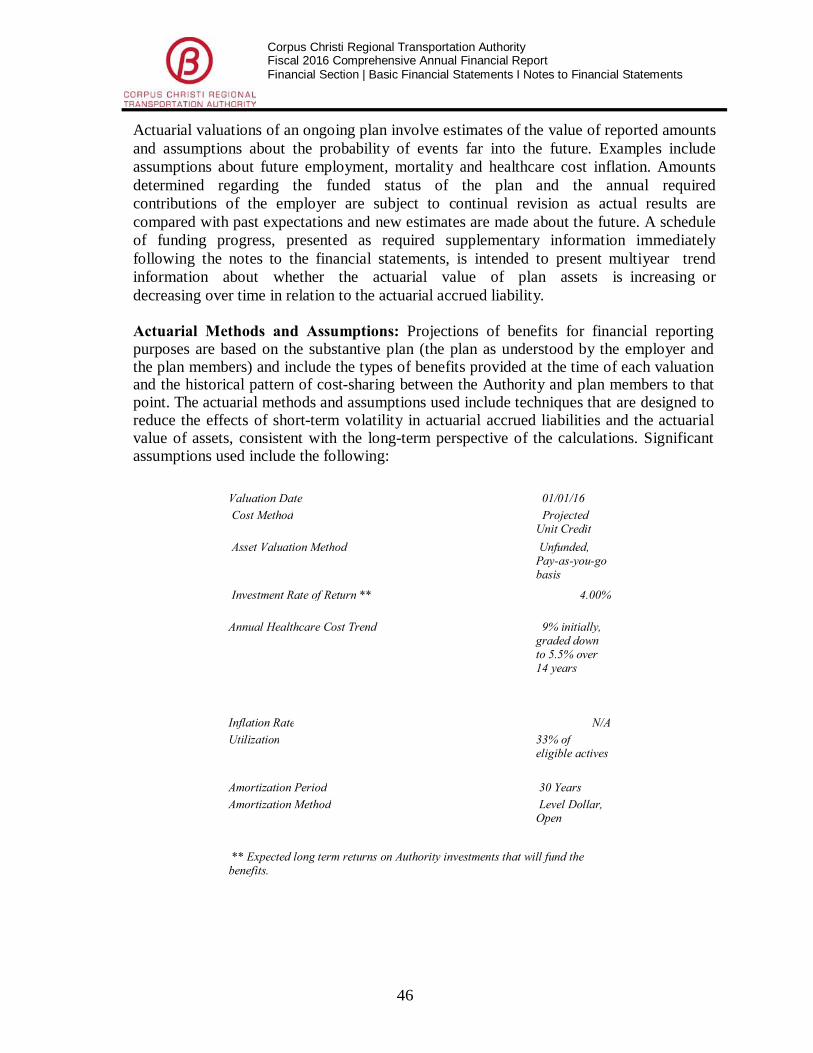
46
Corpus Christi Regional Transportation Authority Fiscal 2016 Comprehensive Annual Financial Report Financial Section | Basic Financial Statements I Notes to Financial Statements
Actuarial valuations of an ongoing plan involve estimates of the value of reported amounts and assumptions about the probability of events far into the future. Examples include assumptions about future employment, mortality and healthcare cost inflation. Amounts determined regarding the funded status of the plan and the annual required contributions of the employer are subject to continual revision as actual results are compared with past expectations and new estimates are made about the future. A schedule of funding progress, presented as required supplementary information immediately following the notes to the financial statements, is intended to present multiyear trend information about whether the actuarial value of plan assets is increasing or decreasing over time in relation to the actuarial accrued liability.
Actuarial Methods and Assumptions: Projections of benefits for financial reporting purposes are based on the substantive plan (the plan as understood by the employer and the plan members) and include the types of benefits provided at the time of each valuation and the historical pattern of cost-sharing between the Authority and plan members to that point. The actuarial methods and assumptions used include techniques that are designed to reduce the effects of short-term volatility in actuarial accrued liabilities and the actuarial value of assets, consistent with the long-term perspective of the calculations. Significant assumptions used include the following:
Valuation Date 01/01/16 Cost Method Projected
Unit Credit Asset Valuation Method Unfunded,
Pay-as-you-go basis
Investment Rate of Return ** 4.00%
Annual Healthcare Cost Trend 9% initially, graded down to 5.5% over 14 years
Inflation Rate N/A Utilization 33% of
eligible actives
Amortization Period 30 Years Amortization Method Level Dollar,
Open
** Expected long term returns on Authority investments that will fund the benefits.
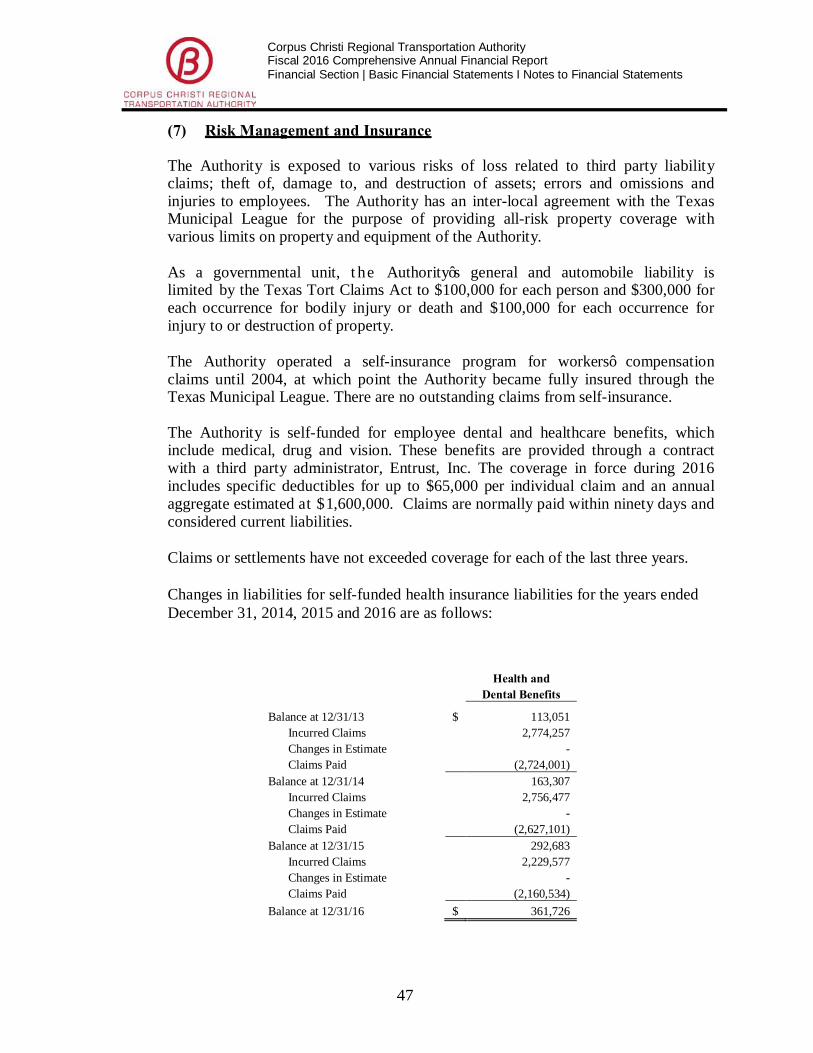
47
Corpus Christi Regional Transportation Authority Fiscal 2016 Comprehensive Annual Financial Report Financial Section | Basic Financial Statements I Notes to Financial Statements
(7) Risk Management and Insurance
The Authority is exposed to various risks of loss related to third party liability claims; theft of, damage to, and destruction of assets; errors and omissions and injuries to employees. The Authority has an inter-local agreement with the Texas Municipal League for the purpose of providing all-risk property coverage with various limits on property and equipment of the Authority.
As a governmental unit, t he Authority’s general and automobile liability is limited by the Texas Tort Claims Act to $100,000 for each person and $300,000 for each occurrence for bodily injury or death and $100,000 for each occurrence for injury to or destruction of property.
The Authority operated a self-insurance program for workers’ compensation claims until 2004, at which point the Authority became fully insured through the Texas Municipal League. There are no outstanding claims from self-insurance.
The Authority is self-funded for employee dental and healthcare benefits, which include medical, drug and vision. These benefits are provided through a contract with a third party administrator, Entrust, Inc. The coverage in force during 2016 includes specific deductibles for up to $65,000 per individual claim and an annual aggregate estimated at $1,600,000. Claims are normally paid within ninety days and considered current liabilities. Claims or settlements have not exceeded coverage for each of the last three years. Changes in liabilities for self-funded health insurance liabilities for the years ended December 31, 2014, 2015 and 2016 are as follows:
Health and Dental Benefits
Balance at 12/31/13 $ 113,051 Incurred Claims 2,774,257 Changes in Estimate - Claims Paid (2,724,001)
Balance at 12/31/14 163,307 Incurred Claims 2,756,477 Changes in Estimate - Claims Paid (2,627,101)
Balance at 12/31/15 292,683 Incurred Claims 2,229,577 Changes in Estimate - Claims Paid (2,160,534)
Balance at 12/31/16 $ 361,726
48
Corpus Christi Regional Transportation Authority Fiscal 2016 Comprehensive Annual Financial Report Financial Section | Basic Financial Statements I Notes to Financial Statements
(8) Commitments and Contingencies
Expenditures financed by Federal grants are subject to audit by the granting agencies. In the event of any such audits, management is of the opinion that no significant liability will arise. As of December 31, 2016 the Authority is under Commitments for the purchase of eleven 40’ Gillig Buses at a cost totaling $5,284,664, along with seven Arboc buses at a total cost of $1,627,850. The Authority has commitments totaling $1,070,000 in ADA Bus Stop improvements.
9) Concentrations
During 2016, the Authority received $1,185,650 for capital assistance and $1,289,577 for other projects from the Federal Transportation Administration. During 2015, the Authority received $9,763,523 for capital assistance and $2,512,070 for other projects from the Federal Transportation Administration. Changes in the Authority’s relationship with the FTA could ultimately affect the operating results of the Authority. The Single Audit Section provides further details on FTA and other federal grant funding received.
(10) Purchased Transportation Services
The Authority had an extended contract with MV Transportation, Inc. through 2013 to provide paratransit services for elderly and persons with disability and certain fixed route services. A new contract was executed January 6, 2014 establishing a term for these services from January 6 , 2014 through December 31, 2018 with an option for the Authority to extend the contract for an additional two years. Expenses under the contract amounted to $5,078,937 in 2016 and $4,733,795 in 2015. All passenger fares related to these transit services are recorded by the Authority as operating revenue.

49
Corpus Christi Regional Transportation Authority Fiscal 2016 Comprehensive Annual Financial Report Financial Section | Basic Financial Statements I Notes to Financial Statements
(11) Property Leased to Others The Authority leases office space under operating leases expiring through Fiscal Year 2026. The minimum future rental payments to be collected from tenants under signed lease agreements at the Staples Street Center are as follows:
Year ended 12/312017 $ 357,859 2018 458,013 2019 482,729 2020 490,550 2021 392,290
Thereafter 1,492,358 Total $ 3,673,799

50
Corpus Christi Regional Transportation Authority Fiscal 2016 Comprehensive Annual Financial Report Financial Section | Basic Financial Statements I Notes to Financial Statements

51
Corpus Christi Regional Transportation Authority Fiscal 2016 Comprehensive Annual Financial Report Financial Section | Required Supplementary Information
REQUIRED SUPPLEMENTARY INFORMATION

52
Corpus Christi Regional Transportation Authority Fiscal 2016 Comprehensive Annual Financial Report Financial Section | Required Supplementary Information
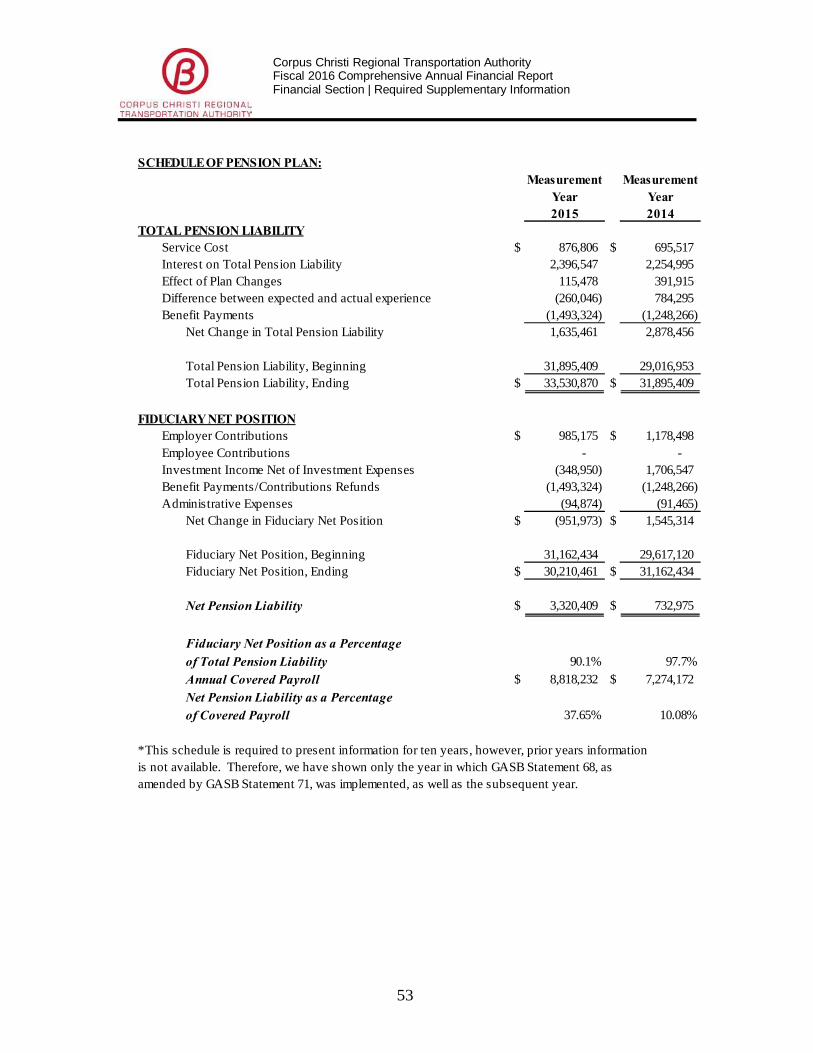
53
Corpus Christi Regional Transportation Authority Fiscal 2016 Comprehensive Annual Financial Report Financial Section | Required Supplementary Information
SCHEDULE OF PENSION PLAN:Measurement Measurement
Year Year2015 2014
TOTAL PENSION LIABILITYService Cost $ 876,806 $ 695,517 Interest on Total Pension Liability 2,396,547 2,254,995 Effect of Plan Changes 115,478 391,915 Difference between expected and actual experience (260,046) 784,295 Benefit Payments (1,493,324) (1,248,266)
Net Change in Total Pension Liability 1,635,461 2,878,456
Total Pension Liability, Beginning 31,895,409 29,016,953 Total Pension Liability, Ending $ 33,530,870 $ 31,895,409
FIDUCIARY NET POSITIONEmployer Contributions $ 985,175 $ 1,178,498 Employee Contributions - - Investment Income Net of Investment Expenses (348,950) 1,706,547 Benefit Payments/Contributions Refunds (1,493,324) (1,248,266) Administrative Expenses (94,874) (91,465)
Net Change in Fiduciary Net Position $ (951,973) $ 1,545,314
Fiduciary Net Position, Beginning 31,162,434 29,617,120 Fiduciary Net Position, Ending $ 30,210,461 $ 31,162,434
Net Pension Liability $ 3,320,409 $ 732,975
Fiduciary Net Position as a Percentageof Total Pension Liability 90.1% 97.7%Annual Covered Payroll $ 8,818,232 $ 7,274,172 Net Pension Liability as a Percentageof Covered Payroll 37.65% 10.08%
*This schedule is required to present information for ten years, however, prior years informationis not available. Therefore, we have shown only the year in which GASB Statement 68, as amended by GASB Statement 71, was implemented, as well as the subsequent year.

54
Corpus Christi Regional Transportation Authority Fiscal 2016 Comprehensive Annual Financial Report Financial Section | Required Supplementary Information
DEFINED BENEFITS PENSION PLAN SCHEDULE OF CONTRIBUTIONS LAST 10 FISCAL YEARS
2007
2008
2009
2010
Actuarially determined contribution $
529,681
576,140
1,355,811
1,168,423
Contributions in relation to the actuarially determined contribution 529,681 576,140 1,355,811 1,168,423
Contribution deficiency (excess) $
-
-
-
-
Covered-employee payroll
$
6,338,961
6,394,664
6,634,041
7,246,596
Contributions as a percentage of covered-employee payroll
8.4%
9.0%
9.0%
16.1%
Notes to Schedule
Valuation Date - Actuarially determined contribution rates are calculated as of January 1 for the respective year of contributions
Methods and Assumptions Used to Determine Contribution Rates: Actuarial Cost Method - Entry Age Normal
Amortization Method - Closed-Level dollar amount over 15 years from January 1, 2009 Remaining Amortization Period 9 Years
Asset Valuation Method - Market Value Inflation Rate -- NA
Salary Increases - 3.50% Annually Investment Rate of Return - 7.50% Annually
Retirement Age - All participants were assumed to retire at age 62 Mortality Rates - RP 2000 Mortality Table
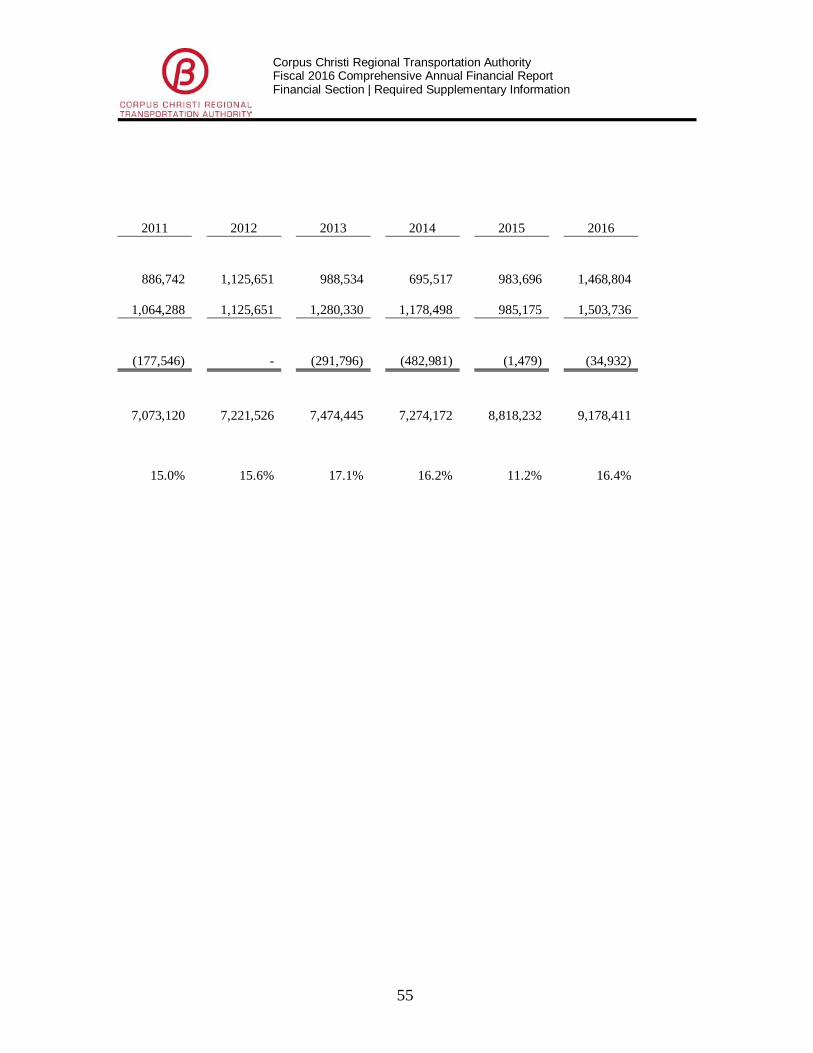
55
Corpus Christi Regional Transportation Authority Fiscal 2016 Comprehensive Annual Financial Report Financial Section | Required Supplementary Information
2011
2012
2013
2014
2015
2016
886,742
1,125,651
988,534
695,517
983,696
1,468,804
1,064,288
1,125,651
1,280,330
1,178,498
985,175
1,503,736
(177,546)
-
(291,796)
(482,981)
(1,479)
(34,932)
7,073,120
7,221,526
7,474,445
7,274,172
8,818,232
9,178,411
15.0%
15.6%
17.1%
16.2%
11.2%
16.4%
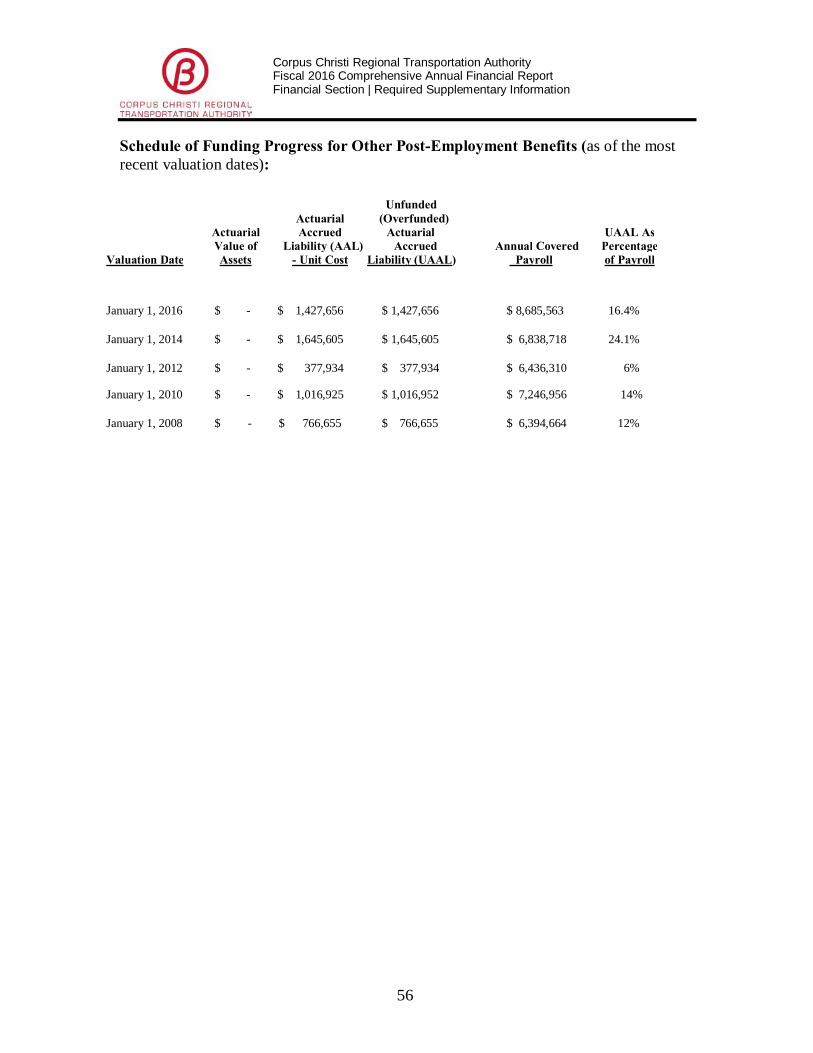
56
Corpus Christi Regional Transportation Authority Fiscal 2016 Comprehensive Annual Financial Report Financial Section | Required Supplementary Information
Schedule of Funding Progress for Other Post-Employment Benefits (as of the most recent valuation dates):
Unfunded
Actuarial (Overfunded) Actuarial Accrued Actuarial UAAL As Value of Liability (AAL) Accrued Annual Covered Percentage Valuation Date Assets - Unit Cost Liability (UAAL) Payroll of Payroll
January 1, 2016 $ - $ 1,427,656 $ 1,427,656 $ 8,685,563 16.4%
January 1, 2014 $ - $ 1,645,605 $ 1,645,605 $ 6,838,718 24.1%
January 1, 2012 $ - $ 377,934 $ 377,934 $ 6,436,310 6%
January 1, 2010 $ - $ 1,016,925 $ 1,016,952 $ 7,246,956 14%
January 1, 2008 $ - $ 766,655 $ 766,655 $ 6,394,664 12%
57
Corpus Christi Regional Transportation Authority Fiscal 2016 Comprehensive Annual Financial Report Financial Section | Supplemental Schedules
SUPPLEMENTAL SCHEDULES

58
Corpus Christi Regional Transportation Authority Fiscal 2016 Comprehensive Annual Financial Report Financial Section | Supplemental Schedules

59
Corpus Christi Regional Transportation Authority Fiscal 2016 Comprehensive Annual Financial Report Financial Section | Supplemental Schedules
CORPUS CHRISTI REGIONAL TRANSPORTATION AUTHORITY Schedule of Revenues and Expenses - Actual and Budget By Function Year Ended December 31, 2016
Variance Original Final Final Budget Budget Budget Actual Versus Actual
Operating Revenues: Passenger Service $ 1,979,354 1,979,354 1,735,001 (244,353) Bus Advertising 167,000 167,000 159,662 (7,338) Other Operating Revenues 193,986 193,986 434,860 240,874
Total Operating Revenues 2,340,340 2,340,340 2,329,524 (10,817)
Operating Expenses: Transportation 7,153,341 7,153,341 6,818,813 334,528 Customer Programs 254,498 254,498 319,570 (65,072) Purchased Transportation 5,589,214 5,589,214 5,607,186 (17,972) Program & Service Development 633,180 633,180 610,752 22,428 MIS 600,643 600,643 690,138 (89,495) Vehicle Maintenance 5,214,775 5,214,775 4,893,149 321,626 Facilities Maintenance 2,125,185 2,125,185 1,697,497 427,688 Materials Management 125,005 125,005 161,690 (36,685) Administrative and General 8,162,949 8,162,949 8,765,519 (602,570) Marketing & Communications 630,904 630,904 674,399 (43,495) Depreciation 7,964,971 7,964,971 8,547,223 (582,252) Total Operating Expenses 38,454,665 38,454,665 38,785,936 (331,271)
Operating Loss (36,114,325) (36,114,325) (36,385,492) (342,088)
Non-Operating Revenues (Expenses): Sales and Use Tax Revenue 36,741,402 36,741,402 31,387,198 (5,354,204) Federal and Other Grant Assistance 3,122,578 3,122,578 1,185,650 (1,936,928) Investment Income 120,000 120,000 69,049 (50,951) Gain (Loss) on Property Dispositions 55,000 55,000 32,007 (22,993) Subrecipient Programs - - (71,560) (71,560) Interest Expense and Fiscal Charges (1,065,045) (1,065,045) (637,621) 427,424 Transfer Out to Other Funds (528,568) (528,568) - 528,568 Staples Street Center 874,534 874,534 70,921 (803,613) Distributions to Regional Entities (3,080,190) (3,080,190) (3,170,013) (89,823)
Net Income/(Loss) Before Capital Grant Contributions $ 125,386 125,386 (7,590,781) (7,716,167)
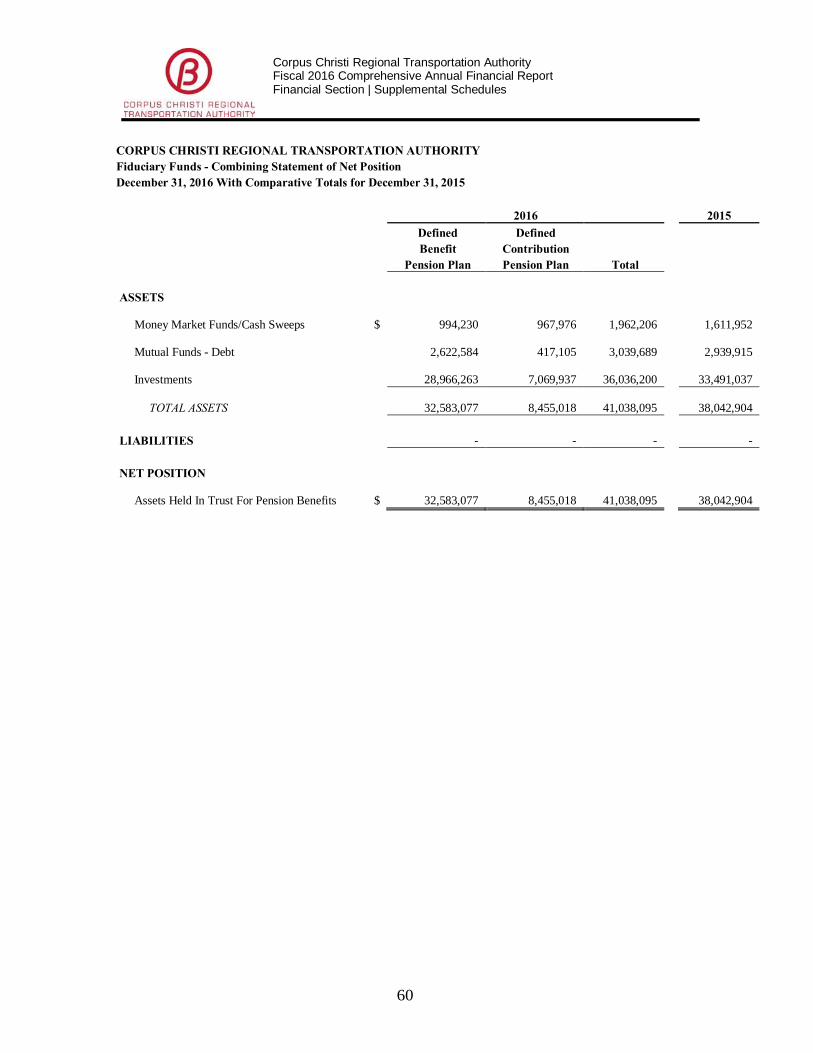
60
Corpus Christi Regional Transportation Authority Fiscal 2016 Comprehensive Annual Financial Report Financial Section | Supplemental Schedules
CORPUS CHRISTI REGIONAL TRANSPORTATION AUTHORITY Fiduciary Funds - Combining Statement of Net Position December 31, 2016 With Comparative Totals for December 31, 2015
2016 2015 Defined Defined Benefit Contribution
Pension Plan Pension Plan Total
ASSETS
Money Market Funds/Cash Sweeps
$
994,230
967,976
1,962,206
1,611,952
Mutual Funds - Debt
2,622,584
417,105
3,039,689
2,939,915
Investments
28,966,263
7,069,937
36,036,200
33,491,037
TOTAL ASSETS
32,583,077
8,455,018
41,038,095
38,042,904
LIABILITIES - - - -
NET POSITION
Assets Held In Trust For Pension Benefits
$
32,583,077
8,455,018
41,038,095
38,042,904

61
Corpus Christi Regional Transportation Authority Fiscal 2016 Comprehensive Annual Financial Report Financial Section | Supplemental Schedules
CORPUS CHRISTI REGIONAL TRANSPORTATION AUTHORITY Fiduciary Funds - Combining Statement of Changes in Net Position Year Ended December 31, 2016 With Comparative Totals for December 31, 2015
2016 2015 Defined Defined Benefit Contribution
Pension Plan Pension Plan Total
Additions:
Investment Income (Loss)
$ 2,523,596 641,857 3,165,454 (421,639) Employee Contributions - 951,132 951,132 888,815 Employer Contributions 1,503,736 - 1,503,736 985,175
Total Additions 4,027,332 1,592,989 5,620,322 1,452,351
Deductions: Benefits Paid 1,561,905 953,772 2,515,677 3,185,750 Administrative Expenses 92,810 16,643 109,454 117,531
Total Deductions 1,654,715 970,416 2,625,131 3,303,281
Increase (Decrease) in Net Assets 2,372,617 622,575 2,995,191 (1,850,930)
Net Assets, January 1 30,210,461 7,832,443 38,042,904 39,893,834
Net Assets, December 31
$ 32,583,077 8,455,018 41,038,095 38,042,904
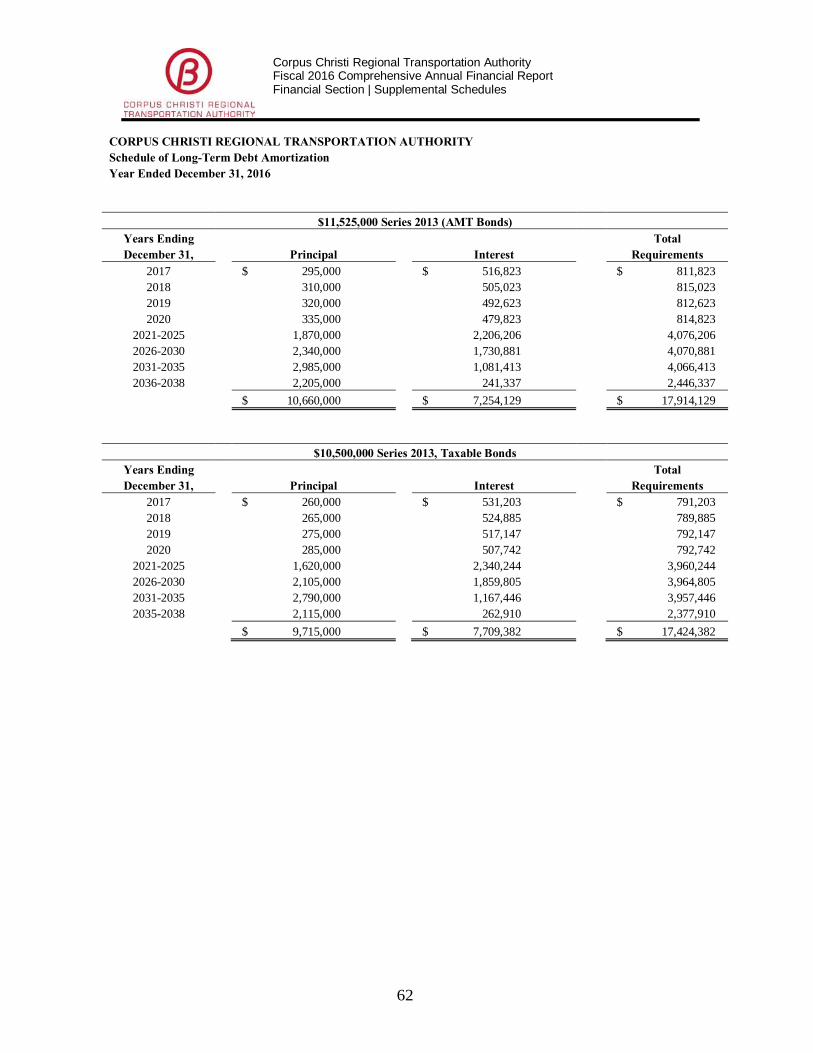
62
Corpus Christi Regional Transportation Authority Fiscal 2016 Comprehensive Annual Financial Report Financial Section | Supplemental Schedules
CORPUS CHRISTI REGIONAL TRANSPORTATION AUTHORITY Schedule of Long-Term Debt Amortization Year Ended December 31, 2016
$11,525,000 Series 2013 (AMT Bonds) Years Ending Total December 31, Principal Interest Requirements
2017 $ 295,000 $ 516,823 $ 811,823 2018 310,000 505,023 815,023 2019 320,000 492,623 812,623 2020 335,000 479,823 814,823
2021-2025 1,870,000 2,206,206 4,076,206 2026-2030 2,340,000 1,730,881 4,070,881 2031-2035 2,985,000 1,081,413 4,066,413 2036-2038 2,205,000 241,337 2,446,337
$ 10,660,000 $ 7,254,129 $ 17,914,129
$10,500,000 Series 2013, Taxable Bonds Years Ending Total December 31, Principal Interest Requirements
2017 $ 260,000 $ 531,203 $ 791,203 2018 265,000 524,885 789,885 2019 275,000 517,147 792,147 2020 285,000 507,742 792,742
2021-2025 1,620,000 2,340,244 3,960,244 2026-2030 2,105,000 1,859,805 3,964,805 2031-2035 2,790,000 1,167,446 3,957,446 2035-2038 2,115,000 262,910 2,377,910
$ 9,715,000 $ 7,709,382 $ 17,424,382

2016 Statistical Section
Comprehensive Annual Financial Report

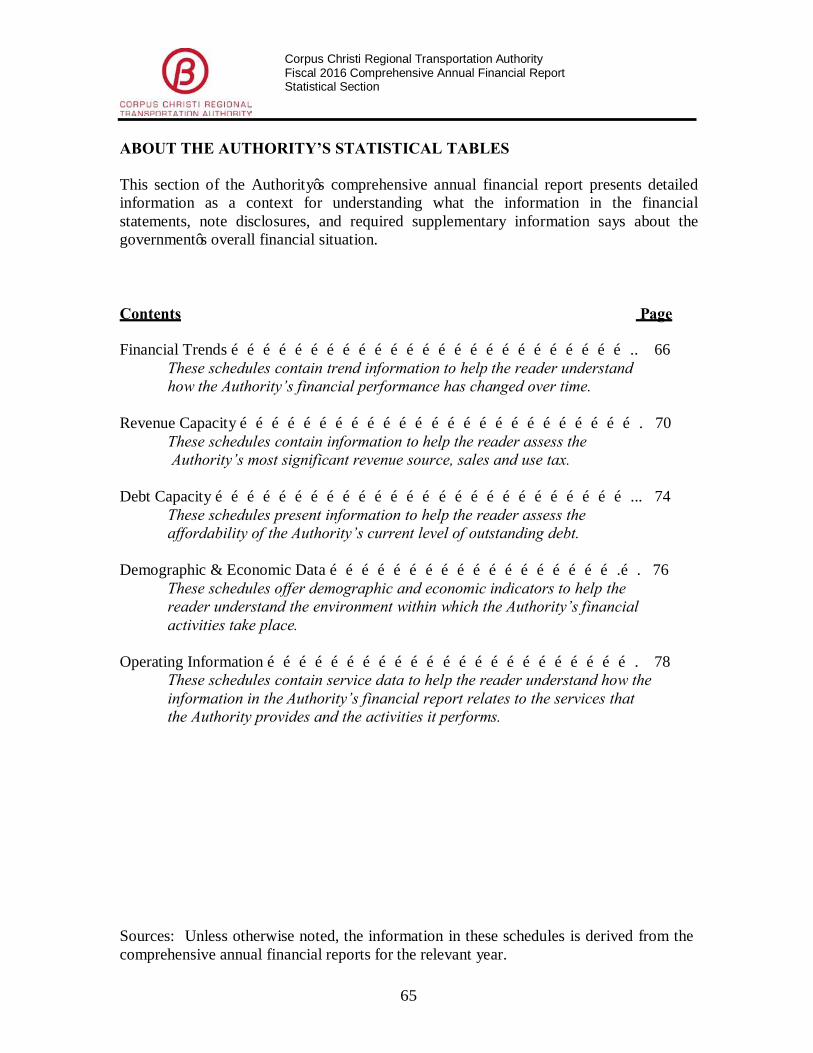
65
Corpus Christi Regional Transportation Authority Fiscal 2016 Comprehensive Annual Financial Report Statistical Section
ABOUT THE AUTHORITY’S STATISTICAL TABLES
This section of the Authority’s comprehensive annual financial report presents detailed information as a context for understanding what the information in the financial statements, note disclosures, and required supplementary information says about the government’s overall financial situation.
Contents Page
Financial Trends ………………………………………………………………….. 66 These schedules contain trend information to help the reader understand how the Authority’s financial performance has changed over time.
Revenue Capacity …………………………………………………………………. 70
These schedules contain information to help the reader assess the Authority’s most significant revenue source, sales and use tax.
Debt Capacity ……………………………………………………………………... 74
These schedules present information to help the reader assess the affordability of the Authority’s current level of outstanding debt.
Demographic & Economic Data ……………………………………………….…. 76
These schedules offer demographic and economic indicators to help the reader understand the environment within which the Authority’s financial activities take place.
Operating Information ……………………………………………………………. 78
These schedules contain service data to help the reader understand how the information in the Authority’s financial report relates to the services that the Authority provides and the activities it performs.
Sources: Unless otherwise noted, the information in these schedules is derived from the comprehensive annual financial reports for the relevant year.
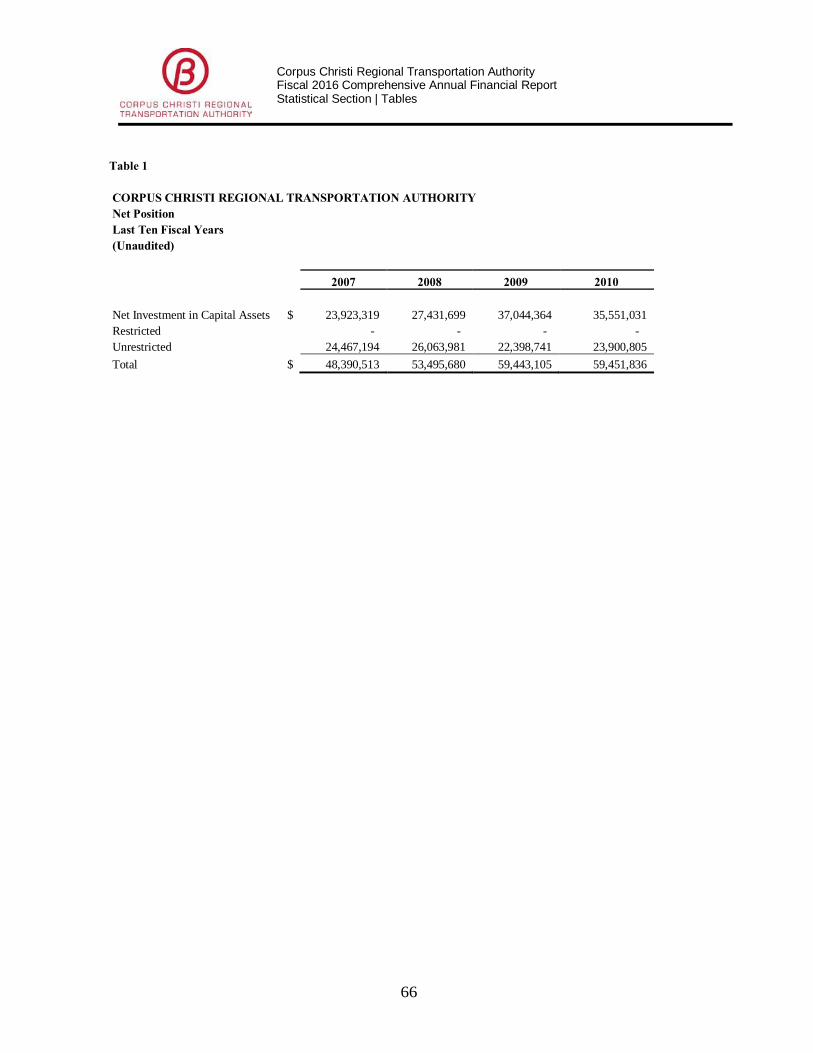
Corpus Christi Regional Transportation Authority Fiscal 2016 Comprehensive Annual Financial Report Statistical Section | Tables
66
Table 1
CORPUS CHRISTI REGIONAL TRANSPORTATION AUTHORITY Net Position Last Ten Fiscal Years (Unaudited)
2007 2008 2009 2010
Net Investment in Capital Assets $ 23,923,319 27,431,699 37,044,364 35,551,031 Restricted - - - - Unrestricted 24,467,194 26,063,981 22,398,741 23,900,805 Total $ 48,390,513 53,495,680 59,443,105 59,451,836
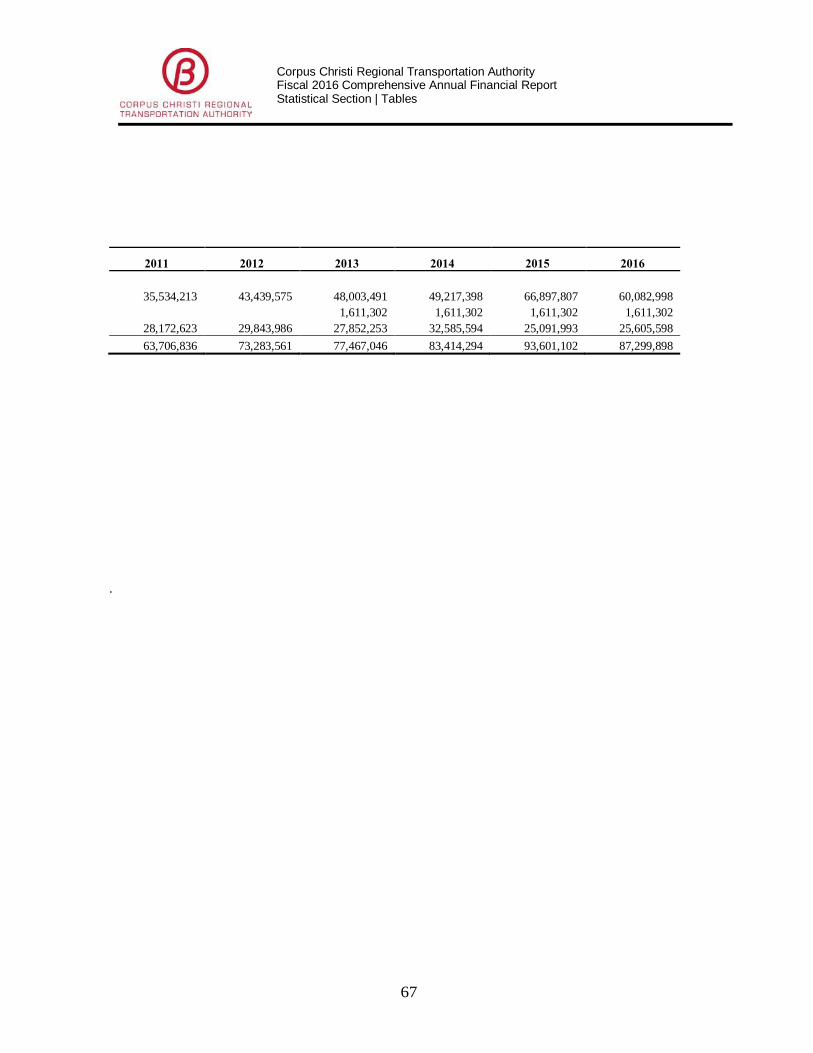
Corpus Christi Regional Transportation Authority Fiscal 2016 Comprehensive Annual Financial Report Statistical Section | Tables
67
2011 2012 2013 2014 2015 2016
35,534,213 43,439,575 48,003,491 49,217,398 66,897,807 60,082,998 1,611,302 1,611,302 1,611,302 1,611,302
28,172,623 29,843,986 27,852,253 32,585,594 25,091,993 25,605,598 63,706,836 73,283,561 77,467,046 83,414,294 93,601,102 87,299,898
.

Corpus Christi Regional Transportation Authority Fiscal 2016 Comprehensive Annual Financial Report Statistical Section | Tables
68
Table 2
CORPUS CHRISTI REGIONAL TRANSPORTATION AUTHORITY Changes in Net Position Last Ten Years (Unaudited)
2007 2008 2009 2010
Operating Revenues: Passenger Service $ 1,602,328 1,707,930 1,577,232 1,537,772 Other Operating 105,656 111,106 81,443 88,525 Total Operating Revenues 1,707,984 1,819,036 1,658,675 1,626,297
Operating Expenses: Transportation 10,130,199 10,989,280 10,743,234 10,619,566 Vehicle,/Facilities Maintenance 5,686,273 6,201,002 5,137,764 5,886,849 Program Development 937,440 936,894 702,690 701,064 Administrative and General 3,571,073 4,284,956 4,711,623 4,983,114 Depreciation 3,748,996 3,958,931 4,514,063 5,203,248 Total Operating Expenses 24,073,981 26,371,063 25,809,374 27,393,841
Operating Loss (22,365,997) (24,552,027) (24,150,699) (25,767,544)
Non-Operating Revenues (Expenses): Sales and Use Tax 21,328,966 24,254,132 20,821,573 22,891,712 Grant Assistance 276,340 496,631 805,664 995,526 Investment Income 1,121,785 723,930 81,807 100,071 Other Non-Operating Items - - (433,539) 8,012 Distributions to Region Entities (1,342,549) (1,258,613) (1,458,952) (1,325,648) Net Loss before Capital Grants (981,455) (335,947) (4,334,146) (3,097,871)
Capital Grants and Donations 2,125,887 5,441,114 10,281,571 3,106,602 Change in Accounting Principle - - - - Total Change in Net Assets $ 1,144,432 5,105,167 5,947,425 8,731

Corpus Christi Regional Transportation Authority Fiscal 2016 Comprehensive Annual Financial Report Statistical Section | Tables
69
2011 2012 2013 2014 2015 2016
1,660,782 1,706,528 1,750,624 1,844,604 1,853,246 1,735,001 152,881 144,710 124,796 335,192 430,401 665,443 1,813,663 1,851,238 1,875,420 2,179,796 2,283,647 2,400,445
11,764,029 12,718,200 13,146,112 12,430,929 12,848,302 12,425,999 6,519,067 6,523,062 6,302,512 7,545,219 7,320,683 6,752,337 1,073,506 1,075,444 764,359 893,233 1,146,698 1,604,721 4,444,485 4,923,154 4,627,406 6,683,788 7,797,745 9,455,657 5,878,720 5,523,334 5,772,221 5,273,812 6,592,946 8,547,223 29,679,807 30,763,194 30,612,610 32,826,981 35,706,374 38,785,936
(27,866,144) (28,911,956) (28,737,190) (30,647,185) (33,422,727) (36,385,492)
26,235,525 31,571,834 32,064,316 35,188,390 34,127,803 31,387,198 2,527,017 3,226,061 1,416,988 125,900 2,512,070 1,185,650 27,860 51,173 62,160 110,052 125,143 69,049 1,733 1,086 (619,579) (422,184) (488,015) (677,173) (1,918,020) (2,154,150) (2,593,634) (2,900,327) (3,301,592) (3,170,013) (992,029) 3,784,048 1,593,061 1,454,646 (447,318) (7,590,781)
5,247,029 5,792,677 2,590,424 4,492,602 9,763,523 1,289,577 - - - - 870,603 -
4,255,000 9,576,725 4,183,485 5,947,248 10,186,808 (6,301,204)

Corpus Christi Regional Transportation Authority Fiscal 2016 Comprehensive Annual Financial Report Statistical Section | Tables
70
Table 3
CORPUS CHRISTI REGIONAL TRANSPORTATION AUTHORITY Revenues By Source Last Ten Years (Unaudited)
Sales Federal Operating
Operating And Use Grants And Investment Year Revenues (1) Tax Reimbursements Income Other (2) Total
2007 $ 1,707,984 21,328,966 276,340 1,121,785 - 24,435,075 2008 $ 1,819,036 24,254,132 496,631 723,930 - 27,293,729 2009 $ 1,658,675 20,821,573 805,664 81,807 23,367,719 2010 $ 1,626,297 22,891,712 995,526 100,071 8,012 25,621,618 2011 $ 1,813,663 26,235,525 2,527,017 27,860 1,733 30,605,798 2012 $ 1,851,238 31,571,834 3,226,061 51,173 1,086 36,701,392 2013 $ 1,875,420 32,064,316 1,416,988 62,160 225 35,419,109 2014 $ 2,179,796 35,188,390 125,900 110,052 46,519 37,650,657 2015 $ 2,283,647 34,127,803 2,512,070 125,143 - 39,048,663 2016 $ 2,400,445 31,387,198 1,185,650 19,299 32,007 35,024,599
(1) Fares, bus bench advertising, on-board advertising, and other ancillary revenues. (2) Includes rental income from leasing office space at the former Six Points location and gain on sales of buses and other property.
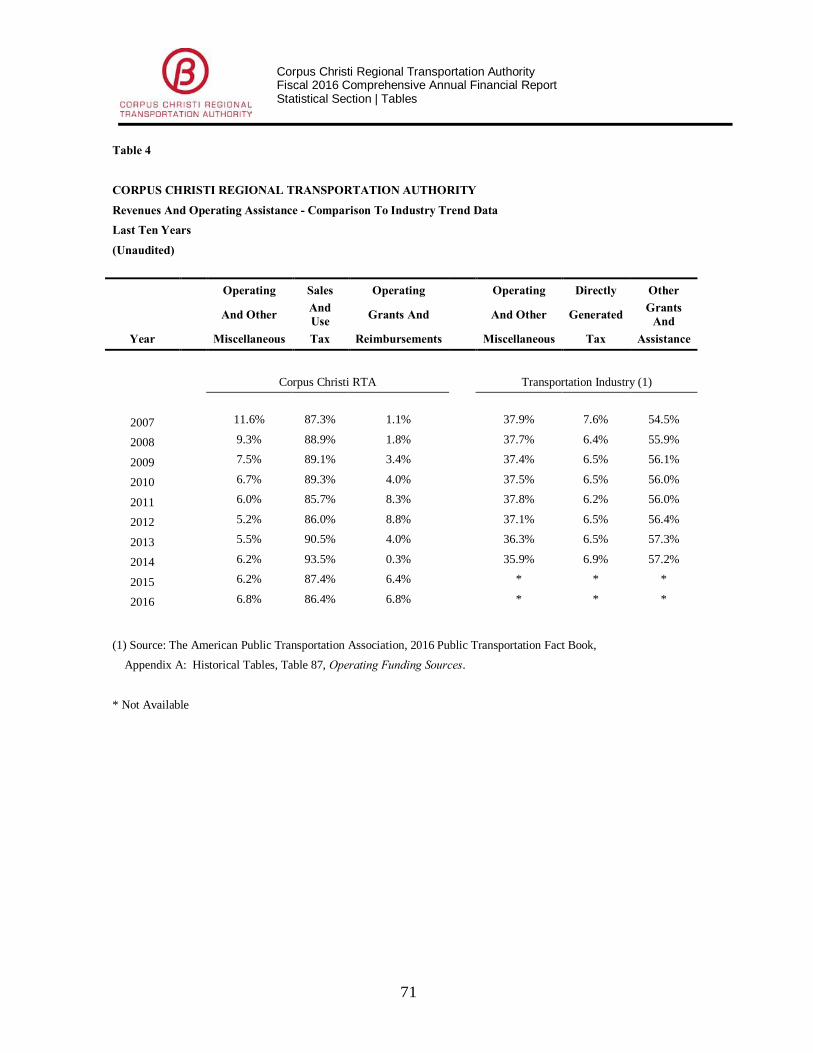
Corpus Christi Regional Transportation Authority Fiscal 2016 Comprehensive Annual Financial Report Statistical Section | Tables
71
Table 4
CORPUS CHRISTI REGIONAL TRANSPORTATION AUTHORITY
Revenues And Operating Assistance - Comparison To Industry Trend Data Last Ten Years
(Unaudited)
Operating Sales Operating Operating Directly Other
And Other And Use Grants And And Other Generated Grants
And Year Miscellaneous Tax Reimbursements Miscellaneous Tax Assistance
Corpus Christi RTA Transportation Industry (1)
2007
11.6% 87.3% 1.1%
37.9% 7.6% 54.5%
2008 9.3% 88.9% 1.8%
37.7% 6.4% 55.9%
2009 7.5% 89.1% 3.4%
37.4% 6.5% 56.1%
2010 6.7% 89.3% 4.0%
37.5% 6.5% 56.0%
2011 6.0% 85.7% 8.3%
37.8% 6.2% 56.0%
2012 5.2% 86.0% 8.8%
37.1% 6.5% 56.4%
2013 5.5% 90.5% 4.0%
36.3% 6.5% 57.3%
2014 6.2% 93.5% 0.3%
35.9% 6.9% 57.2%
2015 6.2% 87.4% 6.4%
* * *
2016 6.8% 86.4% 6.8%
* * *
(1) Source: The American Public Transportation Association, 2016 Public Transportation Fact Book, Appendix A: Historical Tables, Table 87, Operating Funding Sources.
* Not Available

Corpus Christi Regional Transportation Authority Fiscal 2016 Comprehensive Annual Financial Report Statistical Section | Tables
72
Table 5
CORPUS CHRISTI REGIONAL TRANSPORTATION AUTHORITY Passenger Fee Capacity Last Ten Years (Unaudited)
Total Passenger Year Unlinked Trips Revenues
2007 5,175,983 1,602,328 2008 5,491,376 1,707,930 2009 5,283,174 1,577,232 2010 5,434,286 1,537,772 2011 6,011,114 1,660,782 2012 6,065,174 1,706,528 2013 6,016,379 1,750,624 2014 5,927,292 1,844,604 2015 5,764,797 1,853,246 2016 5,469,160 1,735,001
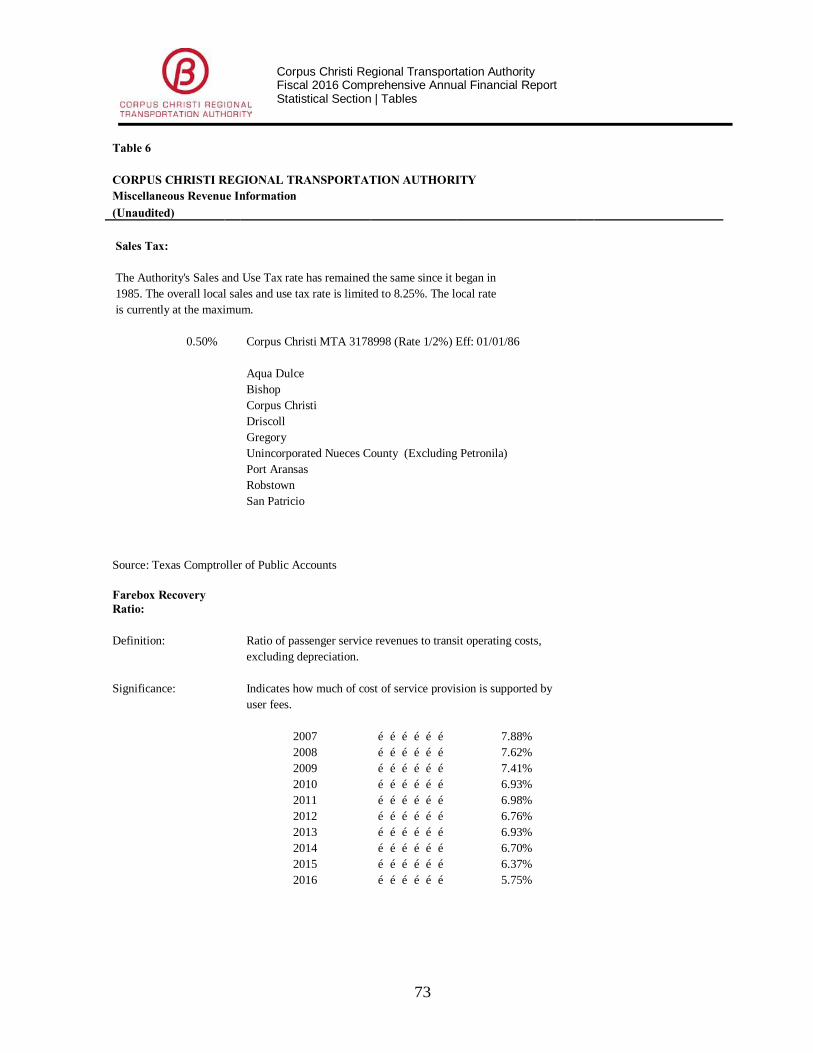
Corpus Christi Regional Transportation Authority Fiscal 2016 Comprehensive Annual Financial Report Statistical Section | Tables
73
Table 6
CORPUS CHRISTI REGIONAL TRANSPORTATION AUTHORITY Miscellaneous Revenue Information (Unaudited)
Sales Tax:
The Authority's Sales and Use Tax rate has remained the same since it began in 1985. The overall local sales and use tax rate is limited to 8.25%. The local rate is currently at the maximum.
0.50% Corpus Christi MTA 3178998 (Rate 1/2%) Eff: 01/01/86
Aqua Dulce Bishop Corpus Christi Driscoll Gregory Unincorporated Nueces County (Excluding Petronila) Port Aransas Robstown San Patricio
Source: Texas Comptroller of Public Accounts
Farebox Recovery Ratio:
Definition: Ratio of passenger service revenues to transit operating costs, excluding depreciation.
Significance: Indicates how much of cost of service provision is supported by user fees.
2007 ……………… 7.88% 2008 ……………… 7.62% 2009 ……………… 7.41% 2010 ……………… 6.93% 2011 ……………… 6.98% 2012 ……………… 6.76% 2013 ……………… 6.93% 2014 ……………… 6.70% 2015 ……………… 6.37% 2016 ……………… 5.75%
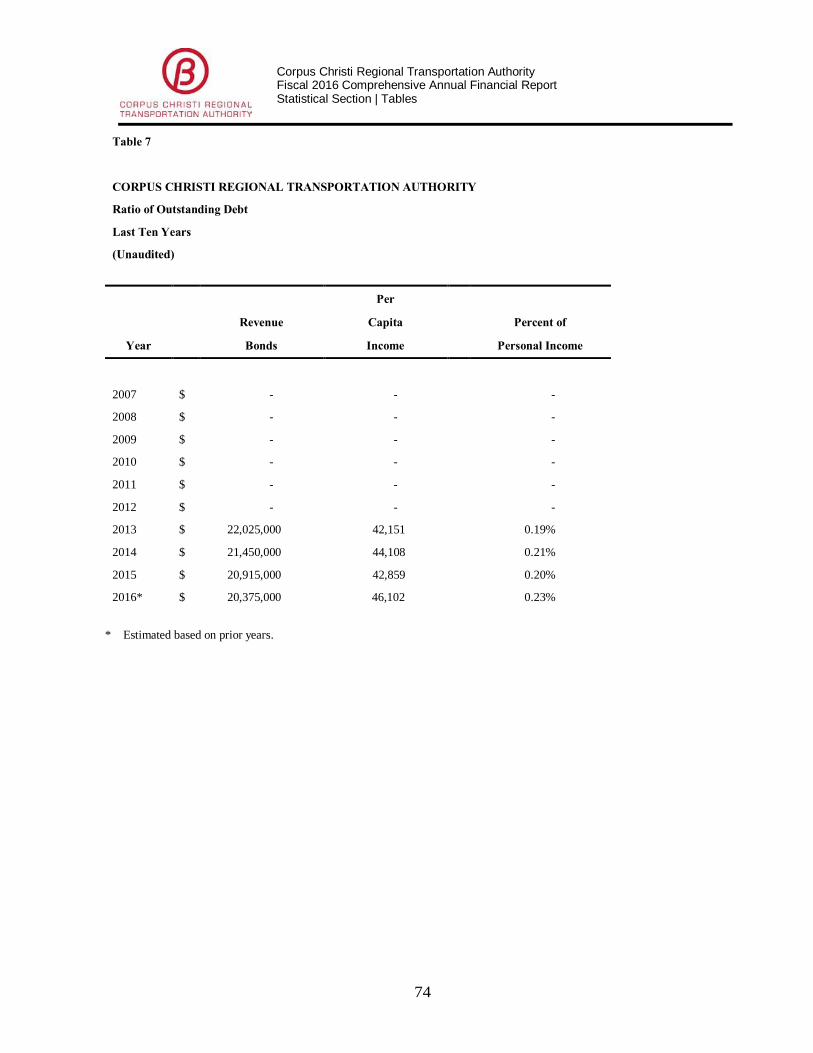
Corpus Christi Regional Transportation Authority Fiscal 2016 Comprehensive Annual Financial Report Statistical Section | Tables
74
Table 7
CORPUS CHRISTI REGIONAL TRANSPORTATION AUTHORITY
Ratio of Outstanding Debt
Last Ten Years
(Unaudited)
Per
Revenue Capita Percent of
Year Bonds Income Personal Income
2007 $ - - -
2008 $ - - -
2009 $ - - -
2010 $ - - -
2011 $ - - -
2012 $ - - -
2013 $ 22,025,000 42,151 0.19%
2014 $ 21,450,000 44,108 0.21%
2015 $ 20,915,000 42,859 0.20%
2016* $ 20,375,000 46,102 0.23%
* Estimated based on prior years.
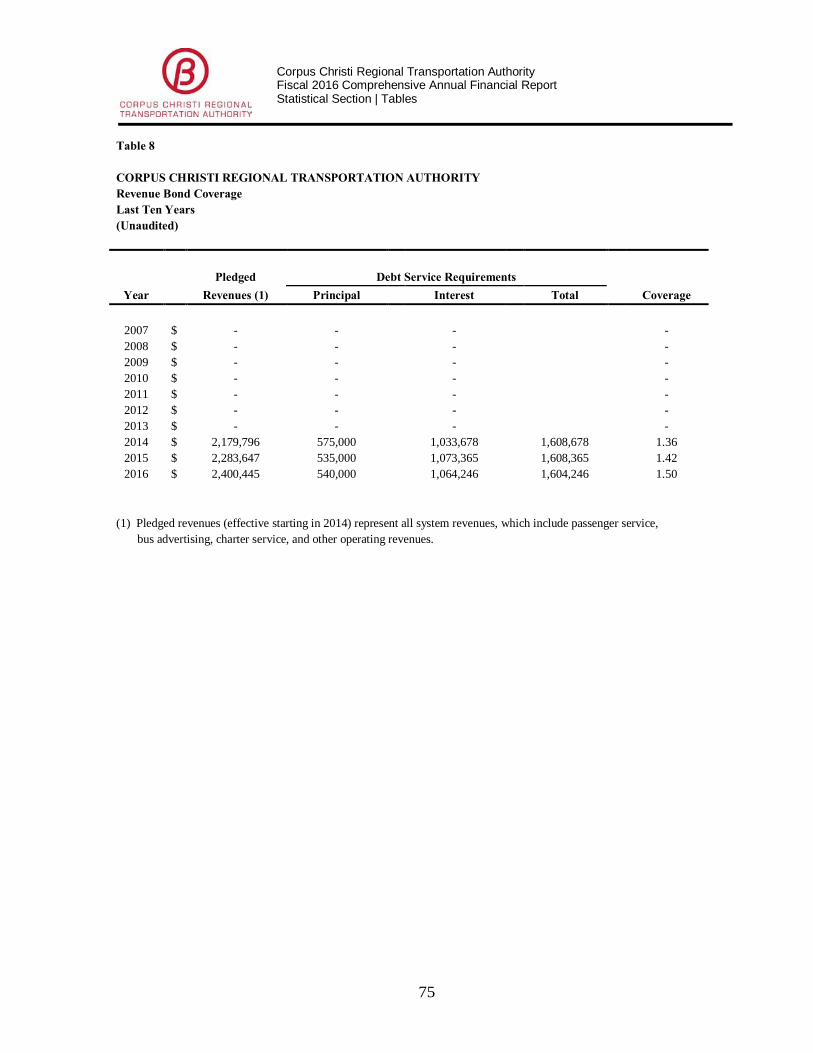
Corpus Christi Regional Transportation Authority Fiscal 2016 Comprehensive Annual Financial Report Statistical Section | Tables
75
Table 8
CORPUS CHRISTI REGIONAL TRANSPORTATION AUTHORITY Revenue Bond Coverage Last Ten Years (Unaudited)
Pledged Debt Service Requirements Year Revenues (1) Principal Interest Total Coverage
2007 $ - - - - 2008 $ - - - - 2009 $ - - - - 2010 $ - - - - 2011 $ - - - - 2012 $ - - - - 2013 $ - - - - 2014 $ 2,179,796 575,000 1,033,678 1,608,678 1.36 2015 $ 2,283,647 535,000 1,073,365 1,608,365 1.42 2016 $ 2,400,445 540,000 1,064,246 1,604,246 1.50
(1) Pledged revenues (effective starting in 2014) represent all system revenues, which include passenger service, bus advertising, charter service, and other operating revenues.

Corpus Christi Regional Transportation Authority Fiscal 2016 Comprehensive Annual Financial Report Statistical Section | Tables
76
Table 9 CORPUS CHRISTI REGIONAL TRANSPORTATION AUTHORITY Demographic Statistics Last 10 Ten Years (Unaudited)
Mean Per Public Personal Capita School Unemployment
Year Population Income (in thousands) Income Enrollment Rate (1) (1) (1) (2) (3)
2007 330,512 $11,170,436 $33,797 60,807 4.30% 2008 333,526 $12,237,536 $36,691 61,184 4.60% 2009 338,220 $11,647,857 $34,439 61,260 6.70% 2010 340,373 $12,438,913 $36,545 61,415 7.60% 2011 343,281 $13,196,232 $38,441 62,011 7.70% 2012 347,691 $14,226,934 $40,918 62,596 6.20% 2013 352,107 $14,841,683 $42,151 62,382 4.50% 2014 355,638 $15,685,304 $44,108 62,286 4.44% 2015 359,715 $15,416,870 $42,859 62,382 4.43% 2016* 361,350 $16,658,958 $46,102 58,785 5.10%
(1) Nueces County - Source: US Dept. of Commerce Bureau of Economic Analysis (2) Nueces County - Source: Nueces County/Texas Education Agency/PEIMS - 2015 and 2016 Enrollment figures include charter schools (3) Nueces County - Source: U.S. Department of Labor-Bureau of Labor Statistics
* Estimated based on prior years.

Corpus Christi Regional Transportation Authority Fiscal 2016 Comprehensive Annual Financial Report Statistical Section | Tables
77
Table 10
CORPUS CHRISTI REGIONAL TRANSPORTATION AUTHORITY Top Ten Employers By Size of Employment (Unaudited)
Rank Business Type of Product -
Service Employment
2016
% of Total Employment
2016 Employment
2007
1 Corpus Christi Army Depot Helicopter Repair 5,800 2.23% 5,404 2 Corpus Christi ISD School District 5,178 1.99% 5,500 3 CHRISTUS Spohn Health Systems Hospital 5,144 1.98% 4,500 4 HEB Grocery Co. Grocery Company 5,000 1.92% 2,200 5 City of Corpus Christi City Government 3,171 1.22% 2,007 6 Naval Air Station Corpus Christi Military 2,822 1.08% 2,654 7 Bay. Ltd. Industrial Construction 2,100 0.81% 2,200 8 Driscoll Children's Hospital Hospital 1,800 0.69% - 9 Del Mar College Junior College 1,542 0.59% 1,680
10 Corpus Christi Medical Center Insurance 1,300 0.50% - Source: Corpus Christi Regional Economic Development Corp. Corpus Christi, Employment provided by Bureau of Economic Analysis

Corpus Christi Regional Transportation Authority Fiscal 2016 Comprehensive Annual Financial Report Statistical Section | Tables
78
Table 11
CORPUS CHRISTI REGIONAL TRANSPORTATION AUTHORITY Full-Time Equivalent Positions (Unaudited)
2007 2008 2009 2010
Transportation Transportation - Directly Operated 116.50 117.00 117.00 117.00 Purchased Transportation* 2.00 2.00 1.00 1.00
118.50 119.00 118.00 118.00
Maintenance Vehicle Maintenance 35.00 35.00 38.00 38.00 Facilities Maintenance 14.00 14.00 14.00 14.00 Materials Management 5.00 5.00 4.00 4.00
54.00 54.00 56.00 56.00 Program Development Customer Programs 9.00 9.00 7.00 7.00 Service Development 4.00 4.00 3.00 3.00 Program Management 2.00 2.00 2.00 2.00 Marketing & Communications - - 2.00 2.00
15.00 15.00 14.00 14.00 General Administrative: MIS 3.00 3.00 2.00 2.00 Contracts and Grants 2.00 2.00 3.00 3.00 CEO's Office 2.00 2.00 5.00 5.00 Finance and Accounting 5.75 5.75 5.80 5.80 Human Resources 3.00 3.00 3.00 3.00 General Administration 2.00 2.00 2.00 2.00 Safety and Security - - - - Staples Street Center - - - - TCN - Regional Coordinator - - - 1.00
17.75 17.75 20.80 21.80 Totals 205.25 205.75 208.80 209.80
*The Authority has about 100 additional contracted staff under various purchased transportation contracts **Effective 2016, the Authority reported actual FTE positions as of year-end. Prior years reported budgeted positions. This change is in accordance with GASB Statement 44, Economic Condition Reporting: The Statistical Section-An Amendment of NCGA Statement 1.

Corpus Christi Regional Transportation Authority Fiscal 2016 Comprehensive Annual Financial Report Statistical Section | Tables
79
2011 2012 2013 2014 2015 2016
122.00 131.00 131.00 160.00 169.00 154.50 1.00 1.00 3.00 3.00 3.00 2.00 123.00 132.00 134.00 163.00 172.00 156.50,
38.00 36.00 36.00 38.00 41.00 36.00 14.00 14.00 15.00 15.00 15.00 12.50 4.00 4.00 4.00 3.00 3.00 4.00 56.00 54.00 55.00 56.00 59.00 52.50
6.00 8.00 4.00 4.80 4.80 5.50 4.00 4.00 4.00 3.00 3.00 4.00 2.00 2.00 2.00 2.00 2.00 3.00 2.00 2.00 3.00 3.00 3.00 2.50 14.00 16.00 13.00 12.80 12.80 15.00
1.00 1.00 2.00 3.00 3.00 6.00 2.00 3.00 3.00 5.00 5.00 1.00 3.00 3.00 1.00 1.00 1.00 2.00 5.80 5.80 5.55 5.55 5.55 6.55 2.00 2.00 3.00 3.00 3.00 3.00 2.00 3.00 8.00 5.00 5.00 5.00
- - 1.00 1.00 2.00 2.50 - - - - - 3.50
1.00 - - - - - 16.80 17.80 23.55 23.55 24.55 29.55 209.80 219.80 225.55 255.35 268.35 253.55

Corpus Christi Regional Transportation Authority Fiscal 2016 Comprehensive Annual Financial Report Statistical Section | Tables
80
Table 12 CORPUS CHRISTI REGIONAL TRANSPORTATION AUTHORITY Operating Statistics and Assets Utilized Last Ten Years (Unaudited)
2007 2008 2009 2010
System Ridership Motor Bus a
4,976,009 5,251,514 5,064,696 5,238,131 Demand Response / Para-transit b
190,774 196,991 196,617 190,745 Ferry Boat b
- 21,705 11,683 - Vanpool c/f
9,200 21,166 10,178 5,410
System Hours Motor Bus a
198,524 194,647 207,551 225,073 Demand Response / Para-transit b
67,422 68,733 68,680 71,558 Ferry Boat b
- 694 545 - Vanpool c/f
652 1,344 961 965
System Miles Motor Bus a 2,787,318 2,778,104 2,785,415 3,232,691 Demand Response / Para-transit b 1,253,448 1,320,766 1,348,943 1,599,595 Ferry Boat b
- 2,529 1,860 - Vanpool c/f 16,898 34,785 25,525 29,710
Vehicles In Service
Motor Bus a 58 59 63 58 Demand Response / Para-transit b 30 30 30 26 Ferry Boat b - 1 1 - Vanpool c/f 3 2 2 4
Uses of Capital Funds e
Vehicles $ 1,863,855 2,492,718 8,397,094 526,506 Communications & Information $ 63,707 103,658 738,184 562,545 Facilities and Stations $ 669,006 3,433,780 3,844,189 471,546 Other $ 697,679 1,437,155 1,417,030 2,189,577
Operating Expenses by Mode e
Motor Bus a $ 15,504,328 17,099,983 16,519,155 17,410,873 Demand Response / Para-transit b $ 4,630,521 4,913,357 4,425,076 4,568,425 Ferry Boat b $ - 219,212 182,925 - Vanpool c/f $ 67,501 65,878 69,857 78,084
a - Directly Operated (Transportation Department) and Purchased Transportation (oversees contractors) b - Purchased Transportation (contractors overseen by the Purchased Transportation Department) c - Directly Operated - Customer Programs Department oversees operation of vanpools (through 2011) d - Excludes miles not spent in active transportation service (i.e. deadhead, maintenance miles driven, etc.) e - May not agree with GAAP-basis financial statements due to differences in NTD accounting methodologies f - Van Pool operations did not meet FTA guidelines from 2012 - 2014 and were not reported on the NTD report , however in 2015 Van Pool operations qualified and are included Source: National Transit Database
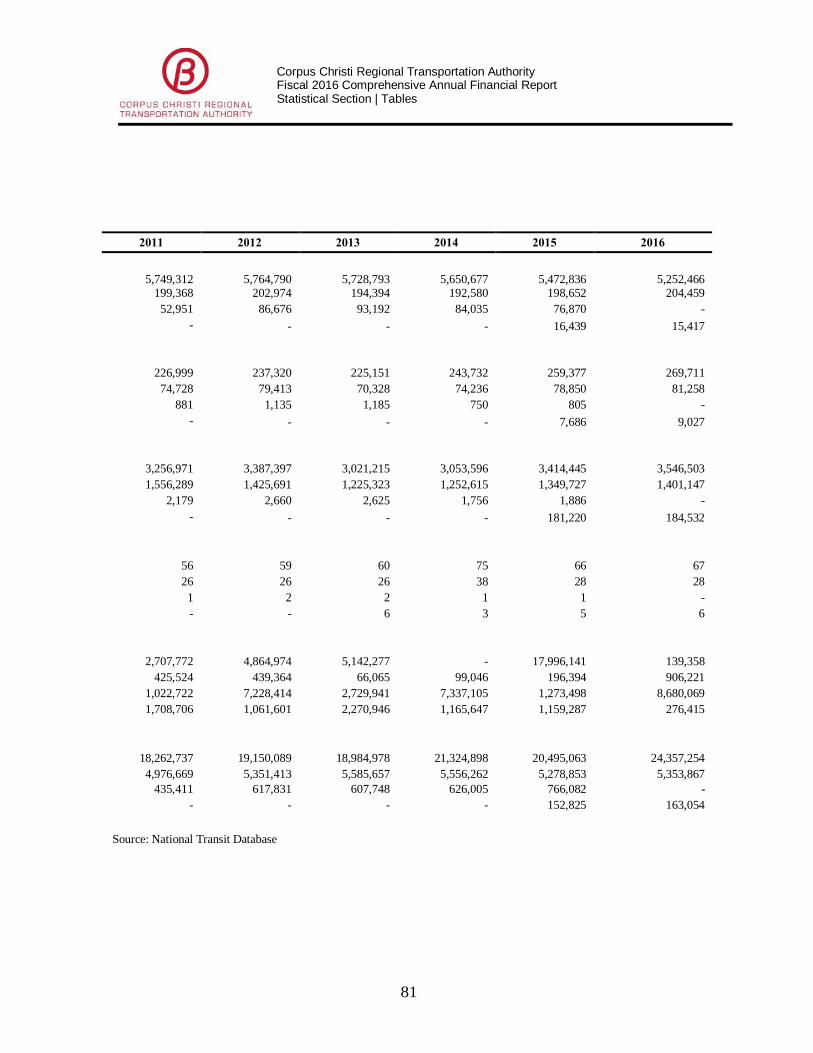
Corpus Christi Regional Transportation Authority Fiscal 2016 Comprehensive Annual Financial Report Statistical Section | Tables
81
2011 2012 2013 2014 2015 2016
5,749,312 5,764,790 5,728,793 5,650,677 5,472,836 5,252,466 199,368 202,974 194,394 192,580 198,652 204,459 52,951 86,676 93,192 84,035 76,870 -
- - - - 16,439 15,417
226,999 237,320 225,151 243,732 259,377 269,711 74,728 79,413 70,328 74,236 78,850 81,258 881 1,135 1,185 750 805 -
- - - - 7,686 9,027
3,256,971 3,387,397 3,021,215 3,053,596 3,414,445 3,546,503 1,556,289 1,425,691 1,225,323 1,252,615 1,349,727 1,401,147 2,179 2,660 2,625 1,756 1,886 -
- - - - 181,220 184,532
56 59 60 75 66 67 26 26 26 38 28 28 1 2 2 1 1 -
- - 6 3 5 6
2,707,772 4,864,974 5,142,277 - 17,996,141 139,358 425,524 439,364 66,065 99,046 196,394 906,221 1,022,722 7,228,414 2,729,941 7,337,105 1,273,498 8,680,069 1,708,706 1,061,601 2,270,946 1,165,647 1,159,287 276,415
18,262,737 19,150,089 18,984,978 21,324,898 20,495,063 24,357,254 4,976,669 5,351,413 5,585,657 5,556,262 5,278,853 5,353,867 435,411 617,831 607,748 626,005 766,082 -
- - - - 152,825 163,054
Source: National Transit Database
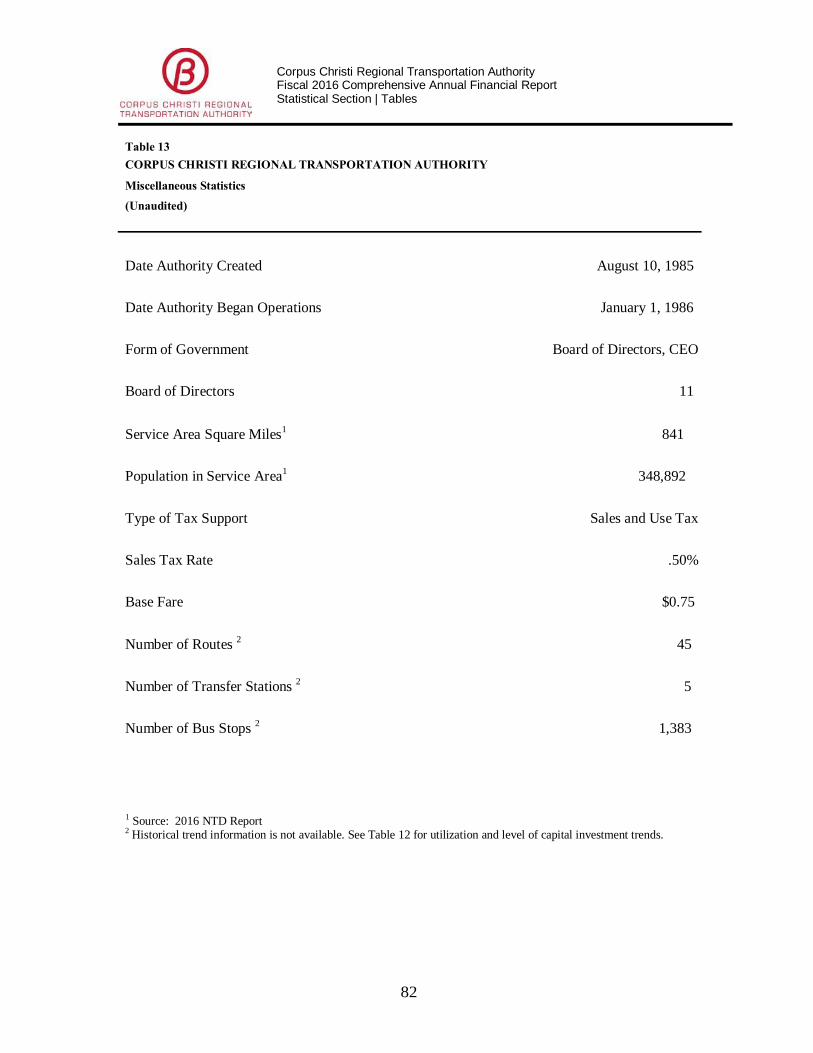
Corpus Christi Regional Transportation Authority Fiscal 2016 Comprehensive Annual Financial Report Statistical Section | Tables
82
Table 13 CORPUS CHRISTI REGIONAL TRANSPORTATION AUTHORITY
Miscellaneous Statistics
(Unaudited)
Date Authority Created August 10, 1985
Date Authority Began Operations January 1, 1986
Form of Government Board of Directors, CEO
Board of Directors 11
Service Area Square Miles1 841
Population in Service Area1 348,892
Type of Tax Support Sales and Use Tax
Sales Tax Rate .50%
Base Fare $0.75
Number of Routes 2 45
Number of Transfer Stations 2 5
Number of Bus Stops 2 1,383
1 Source: 2016 NTD Report 2 Historical trend information is not available. See Table 12 for utilization and level of capital investment trends.

2016 Single Audit Section Comprehensive Annual Financial Report

83
C E R T I F I E D P U B L I C A C C O U N T A N T S 555 N. Carancahua Suite 1000Corpus Christi, Texas 78401-0839361-884-9347 · Fax 361-884-9422www.cjw-cpa.comCOLLIER, JOHNSON & WOODS, P.C.INDEPENDENT AUDITOR'S REPORT ON INTERNAL CONTROL OVER FINANCIAL
REPORTING AND ON COMPLIANCE AND OTHER MATTERS BASED ON AN AUDIT OF FINANCIAL STATEMENTS PERFORMED IN ACCORDANCE WITH
GOVERNMENT AUDITING STANDARDS
June 28, 2017
The Board of Directors of the Corpus Christi Regional Transportation Authority
We have audited, in accordance with auditing standards generally accepted in the United States of
America and the standards applicable to financial audits contained in Government Auditing Standards, issued by the Comptroller General of the United States, the financial statements of the Corpus Christi Regional Transportation Authority as of and for the year ended December 31, 2016, and the related notes to the financial statements, which collectively comprise the Authority’s basic financial statements, and have issued our report thereon dated June 28, 2017.
Internal Control over Financial Reporting
In planning and performing our audit of the financial statements, we considered the Authority’s internal control over financial reporting (internal control) to determine our auditing procedures that are appropriate in the circumstances for the purpose of expressing our opinion on the financial statements, but not for the purpose of expressing an opinion on the effectiveness of the Authority’s internal control. Accordingly, we do not express an opinion on the effectiveness of the Authority’s internal control.
A deficiency in internal control exists when the design or operation of a control does not allow management or employees, in the normal course of performing their assigned functions, to prevent, or detect and correct, misstatements on a timely basis. A material weakness is a deficiency, or combination of deficiencies, in internal control, such that there is a reasonable possibility that a material misstatement of the entity’s financial statements will not be prevented, or detected and corrected on a timely basis. A significant deficiency is a deficiency, or a combination of deficiencies, in internal control that is less severe than a material weakness, yet important enough to merit attention by those charged with governance.
Our consideration of internal control was for the limited purpose described in the first paragraph of this section and was not designed to identify all deficiencies in internal control that might be material weaknesses or significant deficiencies and therefore, material weaknesses or significant deficiencies may exist that were not identified. We did identify a certain deficiency in internal control, described in the accompanying schedule of findings and questioned costs as finding 2016-001 that we consider to be material weaknesses.
84
Compliance and Other Matters
As part of obtaining reasonable assurance about whether the Authority’s basic financial statements are free of material misstatement, we performed tests of its compliance with certain provisions of laws, regulations, contracts and grant agreements, noncompliance with which could have a direct and material effect on the determination of financial statement amounts. However, providing an opinion on compliance with those provisions was not an objective of our audit and, accordingly, we do not express such an opinion. The results of our tests disclosed no instances of noncompliance that are required to be reported under Government Auditing Standards.
We noted certain matters that we reported to management of the Corpus Christi Regional Transportation Authority in a separate letter dated June 28, 2017.
Corpus Christi Regional Transportation Authority’s Response to Finding
Corpus Christi Regional Transportation Authority’s response to the finding identified in our audit is described in the accompanying schedule of findings and questioned costs. Corpus Christi Regional Transportation Authority’s response was not subjected to the auditing procedures applied in the audit of the financial statements and, accordingly, we express no opinion on it.
Purpose of this Report
The purpose of this report is solely to describe the scope of our testing of internal control and compliance and the results of that testing, and not to provide an opinion on the effectiveness of the Authority’s internal control or on compliance. This report is an integral part of an audit performed in accordance with Government Auditing Standards in considering the Authority’s internal control and compliance. Accordingly, this communication is not suitable for any other purpose.
85
C E R T I F I E D P U B L I C A C C O U N T A N T S 555 N. Carancahua Suite 1000Corpus Christi, Texas 78401-0839361-884-9347 · Fax 361-884-9422www.cjw-cpa.comCOLLIER, JOHNSON & WOODS, P.C.INDEPENDENT AUDITOR’S REPORT ON COMPLIANCE
FOR EACH MAJOR PROGRAM AND ON INTERNAL CONTROL OVER COMPLIANCE REQUIRED BY UNIFORM GUIDANCE
June 28, 2017 The Board of Directors of the Corpus Christi Regional Transportation Authority Report on Compliance for Each Major Federal Program
We have audited the Corpus Christi Regional Transportation Authority’s compliance with the types of compliance requirements described in the OMB Compliance Supplement that could have a direct and material effect on each of the Authority’s major federal programs for the year ended December 31, 2016. The Authority’s major federal programs are identified in the summary of auditor’s results section of the accompanying schedule of findings and questioned costs. Management’s Responsibility
Management is responsible for compliance with the requirements of laws, regulations, contracts and grants applicable to its federal programs Auditor’s Responsibility
Our responsibility is to express an opinion on compliance for each of the Authority’s major federal programs based on our audit of the types of compliance requirements referred to above. We conducted our audit of compliance in accordance with auditing standards generally accepted in the United States of America; the standards applicable to financial audits contained in Government Auditing Standards, issued by the Comptroller General of the United States; and the audit requirements of Title 2 U.S. Code of Federal Regulations Part 200, Uniform Administrative Requirements, Cost Principles, and Audit Requirements for Federal Awards (Uniform Guidance). Those standards and the Uniform Guidance require that we plan and perform the audit to obtain reasonable assurance about whether noncompliance with the types of compliance requirements referred to above that could have a direct and material effect on a major federal program occurred. An audit includes examining, on a test basis, evidence about the Authority’s compliance with those requirements and performing such other procedures as we considered necessary in the circumstances.
We believe that our audit provides a reasonable basis for our opinion on compliance for each major federal program. However, our audit does not provide a legal determination on the Authority’s compliance. Opinion on Each Major Federal Program
In our opinion, the Authority complied, in all material respects, with the requirements referred to above that could have a direct and material effect on each of its major federal programs for the year ended December 31, 2016.
86
Report on Internal Control over Compliance
Management of the Authority is responsible for establishing and maintaining effective internal control over compliance with the types of compliance requirements referred to above. In planning and performing our audit of compliance, we considered the Authority’s internal control over compliance with the types of requirements that could have a direct and material effect on each major federal program to determine the auditing procedures that are appropriate in the circumstances for the purpose of expressing an opinion on compliance for each major federal program and to test and report on internal control over compliance in accordance with Uniform Guidance, but not for the purpose of expressing an opinion on the effectiveness of internal control over compliance. Accordingly, we do not express an opinion on the effectiveness of the Authority’s internal control over compliance.
A deficiency in internal control over compliance exists when the design or operation of a control over compliance does not allow management or employees, in the normal course of performing their assigned functions, to prevent, or detect and correct, noncompliance with a type of compliance requirement of a federal program on a timely basis. A material weakness in internal control over compliance is a deficiency, or combination of deficiencies, in internal control over compliance, such that there is a reasonable possibility that material noncompliance with a type of compliance requirement of a federal program will not be prevented, or detected and corrected, on a timely basis. A significant deficiency in internal control over compliance is a deficiency, or a combination of deficiencies, in internal control over compliance with a type of compliance requirement of a federal program that is less severe than a material weakness in internal control over compliance, yet important enough to merit attention by those charged with governance.
Our consideration of internal control over compliance was for the limited purpose described in the first paragraph of this section and was not designed to identify all deficiencies in internal control over compliance that might be material weaknesses or significant deficiencies. We did not identify any deficiencies in internal control over compliance that we consider to be material weaknesses. However, material weaknesses may exist that have not been identified. Purpose of this Report
The purpose of this report on internal control over compliance is solely to describe the scope of our testing of internal control over compliance and the results of that testing based on the requirements of the Uniform Guidance. Accordingly, this report is not suitable for any other purpose.
87
CORPUS CHRISTI REGIONAL TRANSPORTATION AUTHORITY
SCHEDULE OF FINDINGS AND QUESTIONED COSTS
YEAR ENDED DECEMBER 31, 2016
I. Summary of Audit Results:
1. The auditor’s report expresses an unmodified opinion on the basic financial statements of the Corpus Christi Regional Transportation Authority.
2. One material weakness relating to the audit of the financial statements are reported in the
“Independent Auditor’s Report on Internal Control over Financial Reporting and on Compliance and Other Matters Based on an Audit of Financial Statements Performed in Accordance with Government Auditing Standards.” No significant deficiencies are reported.
3. No instances of noncompliance material to the financial statements of the Corpus Christi
Regional Transportation Authority which would be required to be reported in accordance with Government Auditing Standards were disclosed during the audit.
4. No significant deficiencies or material weaknesses relating to the audit of the major federal
award programs are reported in the “Independent Auditor’s Report on Compliance for Each Major Program and on Internal Control over Compliance in Accordance with the Uniform Guidance.”
5. The auditor’s report on compliance for major Federal award programs for the Corpus Christi
Regional Transportation Authority expresses an unmodified opinion on all major programs.
6. No audit findings that are required to be reported in accordance with Title 2 U.S. Code of Federal Regulations Part 200, Uniform Administrative Requirements, Cost Principles, and Audit Requirements for Federal Awards (Uniform Guidance) are reported in this schedule.
7. The programs tested as major programs included:
U.S. Department of Transportation, Federal Transportation Administration: Federal Transit Cluster
1. Federal Transit – Capital Investment Grants (CFDA – 20.500) 2. Federal Transit – Formula Grants (CFDA – 20.507)
8. The dollar threshold used to distinguish between Type A and Type B programs was
$750,000. 9. The Authority was determined to be a low-risk auditee.

88
II. Findings related to the financial statements: MATERIAL WEAKNESS 2016-001 Federal Grant Reimbursement Receivable
Condition: A capital contribution for the purchase of 15 buses in the amount of $6,086,312 to be funded by a federal grant was recorded as receivable at December 31, 2015. However, the criteria for recognizing the capital contribution as receivable had not been met. Criteria: For a grant receivable to be recognized, all eligibility requirements for reimbursement under the grant contract should be met. One of the eligibility requirements to receive a reimbursement is to communicate a request for reimbursement. In this case, a specific request to the Federal Transit Administration for the reimbursement of the purchase of the 15 buses had not been made by December 31, 2015. Cause: The original purchase order issued for procurement of the buses stipulated a federal grant as the source of funding. However, the grant did not have sufficient unspent funds available to fund the purchase. Thus, request for reimbursement was delayed until available funding could be identified. Effect: Since reimbursement had not been requested, grant reimbursements receivable from the federal government and capital contributions from grants were overstated by $6,086,312 at December 31, 2015. Recommendation: The Authority needs to change procedures to enhance the ability to recognize available grant funding at a point in time so that allocated funding and reimbursement requests can be timely filed. Views of Responsible Officials and Planned Corrective Actions: The Authority agrees with the finding and revised procedures will be implemented during 2017. The process for requesting reimbursement of the $6,086,312 referred to above was initiated in February 2017.
III. Findings and questioned costs for Federal awards – None IV. Prior year audit findings requiring corrective action – None

Corpus Christi Regional Transportation Authority Fiscal 2016 Comprehensive Annual Financial Report Single Audit Section | Notes to Schedule of Expenditures of Federal Financial Awards
89
Corpus Christi Regional Transportation Authority Schedule of Expenditures of Federal Financial Awards Year Ended December 31, 2016
Federal Passed Expenditures, CFDA Grant through to Indirect Costs,
GRANTOR Number Number Subrecipients And Refunds
DEPARTMENT OF TRANSPORTATION Federal Transportation Administration (FTA): Federal Transit Cluster
Capital Investment Grant 20.500 TX04-0114 $ - $ 486,340 Capital Investment Grant 20.500 TX90-0857 - 338,428 Capital Investment Grant 20.500 TX90-0978 4,424
- 829,192 Transit Formula Funds 20.507 TX90-0978 - 755,540 Transit Formula Funds 20.507 TX90-0059 - 430,110
- 1,185,650 Total Federal Transit Cluster - 2,014,842
Management Internship Program 20.514 TX26-7108 - 36,818 Seniors and Individuals with Disabilities 20.513 TX16-0018 29,193 29,573
29,193 66,391 Job Access and Reverse Commute 20.516 TX37-4038 - 113,458 Job Access and Reverse Commute 20.516 TX37-4097 - 204,208 Job Access and Reverse Commute 20.516 TX37-6058 - 7,616
- 325,282 New Freedoms 20.521 TX57-0049 42,360 56,437 New Freedoms 20.521 TX57-4007 - 12,275
42,360 68,712
Total Department of Transportation $ 71,553 $ 2,475,227
Corpus Christi Regional Transportation Authority Fiscal 2016 Comprehensive Annual Financial Report Single Audit Section | Notes to Schedule of Expenditures of Federal Financial Awards
90
Corpus Christi Regional Transportation Authority Notes to Schedule of Expenditures of Federal Financial Awards For the Year Ended December 31, 2016
(1) General
The accompanying Schedule of Expenditures of Federal Financial Awards presents the activity of all Federal financial assistance programs of the Authority. The Authority’s organization is defined in Note 1 to the Authority’s Basic Financial Statements.
(2) Basis of Accounting
The accompanying Schedule of Expenditures of Federal Financial Awards is presented using the accrual basis of accounting, which is described in Note 1 to the Authority’s Basic Financial Statements.
(3) Relationship to Basic Financial Statements
Federal financial capital and operating assistance is reported in the Authority’s basic financial statements as follows:
Federal Operating Grants $ 1,185,650
Federal Capital Grants 1,289,577
Total Federal Grants $ 2,475,227
(4) Relationship to Federal Financial Reports
Amounts reported in the Schedule of Expenditures of Federal Financial Awards may not agree with amounts reported in the related Federal financial reports filed with the grantor agency because of accruals which would be included in the next reports filed with the agencies.
(5) Indirect Costs
The Authority has not elected to use the 10 percent de minimus indirect cost rate allowed under the Uniform Guidance.


602 N. Staples Street
Corpus Christi, Texas 78401-2802
www.ccrta.org