contribution of dissolved organic matter to submicron … par-ticular, enhanced levels of wsoc and...
TRANSCRIPT

Instructions for use
Title Contribution of dissolved organic matter to submicron water-soluble organic aerosols in the marine boundary layer overthe eastern equatorial Pacific
Author(s) Miyazaki, Yuzo; Coburn, Sean; Ono, Kaori; Ho, David T.; Pierce, R. Bradley; Kawamura, Kimitaka; Volkamer, Rainer
Citation Atmospheric Chemistry and Physics, 16(12): 7695-7707
Issue Date 2016-06-23
Doc URL http://hdl.handle.net/2115/62329
Rights(URL) http://creativecommons.org/licenses/by/3.0/
Type article
File Information acp-16-7695-2016.pdf
Hokkaido University Collection of Scholarly and Academic Papers : HUSCAP
Atmos. Chem. Phys., 16, 7695–7707, 2016www.atmos-chem-phys.net/16/7695/2016/doi:10.5194/acp-16-7695-2016© Author(s) 2016. CC Attribution 3.0 License.
Contribution of dissolved organic matter to submicronwater-soluble organic aerosols in the marine boundary layerover the eastern equatorial PacificYuzo Miyazaki1, Sean Coburn2,3, Kaori Ono1, David T. Ho4, R. Bradley Pierce5, Kimitaka Kawamura1, andRainer Volkamer2,3
1Institute of Low Temperature Science, Hokkaido University, Sapporo, 060-0819, Japan2Department of Chemistry & Biochemistry, University of Colorado, Boulder, CO 80309-0215, USA3Cooperative Institute for Research in Environmental Sciences (CIRES), University of Colorado, Boulder, CO80309-0215, USA4Department of Oceanography, University of Hawaii, Honolulu, HI 96822, USA5National Oceanic and Atmospheric Administration (NOAA), The National Environmental Satellite, Data,and Information Service (NESDIS), Madison, WI 53706, USA
Correspondence to: Yuzo Miyazaki ([email protected])
Received: 23 February 2016 – Published in Atmos. Chem. Phys. Discuss.: 14 March 2016Revised: 26 May 2016 – Accepted: 5 June 2016 – Published: 23 June 2016
Abstract. Stable carbon isotopic compositions of water-soluble organic carbon (WSOC) and organic molecularmarkers were measured to investigate the relative contri-butions of the sea surface sources to the water-solublefraction of submicron organic aerosols collected over theeastern equatorial Pacific during the Tropical Ocean tRo-posphere Exchange of Reactive halogens and OxygenatedVOCs (TORERO)/KA-12-01 cruise. On average, the water-soluble organic fraction of the total carbon (TC) mass insubmicron aerosols was ∼ 30–35 % in the oceans with thelow chlorophyll a (Chl a) concentrations, whereas it was∼ 60 % in the high-Chl a regions. The average stable car-bon isotope ratio of WSOC (δ13CWSOC)was−19.8± 2.0 ‰,which was systematically higher than that of TC (δ13CTC)
(−21.8± 1.4 ‰). We found that in the oceans with bothhigh and low Chl a concentrations the δ13CWSOC was closeto the typical values of δ13C for dissolved organic car-bon (DOC), ranging from −22 to −20 ‰ in surface sea-water of the tropical Pacific Ocean. This suggests an en-richment of marine biological products in WSOC aerosolsin the study region regardless of the oceanic area. In par-ticular, enhanced levels of WSOC and biogenic organicmarker compounds together with high values of WSOC / TC(∼ 60 %) and δ13CWSOC were observed over upwelling areas
and phytoplankton blooms, which was attributed to plank-tonic tissues being more enriched in δ13C. The δ13C anal-ysis estimated that, on average, marine sources contribute∼ 90± 25 % of the aerosol carbon, indicating the predom-inance of marine-derived carbon in the submicron WSOC.This conclusion is supported by Lagrangian trajectory anal-ysis, which suggests that the majority of the sampling pointson the ship had been exposed to marine boundary layer(MBL) air for more than 80 % of the time during the previous7 days. The combined analysis of the δ13C and monosaccha-rides, such as glucose and fructose, demonstrated that DOCconcentration was closely correlated with the concentrationlevels of submicron WSOC across the study region regard-less of the oceanic area. The result implies that DOC maycharacterize background organic aerosols in the MBL overthe study region.
1 Introduction
The ocean surface is a major source of submicron aerosols inboth number and mass concentrations (e.g., Spracklen et al.,2008). These aerosols play an important controlling role inthe atmospheric radiative budget because they determine the
Published by Copernicus Publications on behalf of the European Geosciences Union.

7696 Y. Miyazaki et al.: Contribution of dissolved organic matter to submicron organic aerosols in the MBL
number of cloud condensation nuclei (CCN) and ice nuclei(IN), particularly over the remote ocean. In general, organicmatter (OM) is concentrated in the sea surface microlayerrelative to the bulk seawater. OM is further concentrated inaerosols during the bubble-bursting process, which producesprimary submicron sea spray aerosol (SSA) that is enrichedin OM (O’Dowd and de Leeuw, 2007). It has been recog-nized that marine microorganisms play a large role in marineaerosol formation and its composition. Marine-derived sub-micron organic aerosol (OA) can affect marine aerosol opti-cal depth (AOD) as well as CCN and IN concentrations. Nev-ertheless there is still uncertainty in the chemical signaturesof SSA, leading to uncertainty in determining their climateimpact.
The oceanic surface chlorophyll a (Chl a) concentrationhas been used as a proxy for marine phytoplankton biomass.However, linear source functions based on Chl a underpre-dict organic carbon (OC) enrichments for nascent SSA pro-duced from oligotrophic waters and overpredict OC enrich-ments for nascent SSA produced from highly productive wa-ters (Long et al., 2011). Recent field and laboratory stud-ies suggest that organic enrichment of SSA might be moreclosely related to the concentration of oceanic dissolved or-ganic carbon (DOC), rather than to the concentration of Chl ain surface seawater (Prather et al., 2013; Quinn et al., 2014).
To assess the impact of marine biological activity on am-bient aerosols and the subsequent formation of clouds, itis important to differentiate marine-derived natural aerosolsfrom anthropogenic aerosols over the oceanic regions. Forthis purpose, methods need to be established to discrimi-nate between ocean- and land-derived aerosols found in ma-rine atmospheres. A method using the isotopic compositionof aerosol carbon has been used successfully to determinethe contributions of marine and terrestrial sources to aerosolfound in the remote marine atmosphere (Chesselet et al.,1981; Cachier et al., 1986; Kawamura et al., 2004; Miyazakiet al., 2011; Ceburnis et al., 2011). The marine-derived OC(δ13C ∼−22 to −18 ‰) is enriched in 13C relative to ter-restrial C3 vegetation (which uses the Calvin–Benson cycleas a metabolic pathway for carbon fixation in photosynthesis)and fossil fuel OC (δ13C∼−30 to−23 ‰ for both) (e.g., Fryand Sherr, 1984). Ocean-derived submicron particles containa large fraction of water-soluble OC (WSOC), which can sig-nificantly alter the hygroscopic property of aerosols (Pratheret al., 2013) and act as CCN and IN. Only a few studies haveused the 13C of WSOC for source apportionment (Fissehaet al., 2009; Kirillova et al., 2010; Miyazaki et al., 2012).The WSOC-specific 13C analysis in combination with or-ganic molecular markers provides robust tools for the sourceapportionment of WSOC in marine aerosols.
To better characterize submicron OAs in the marineboundary layer (MBL) and differentiate them from thosewith terrestrial sources, we investigated the stable carbon iso-topic signature of WSOC in submicron aerosols collectedover the eastern equatorial Pacific. Primary productivity in
that oceanic region accounts for ∼ 23 % of the total produc-tivity of the entire Pacific Ocean (Pennington et al., 2006),and the potential of enhanced OM in the surface microlayeris present. Deng et al. (2014) found that long-chain organicmolecules and humic-like substances (HULIS) were preva-lent in the marine aerosol sampled in a latitudinal cruise overthe eastern Pacific. Here we investigated possible sources ofsubmicron WSOC over the oceanic region by the analysis ofWSOC-specific 13C combined with several organic molecu-lar markers, such as monosaccharides (glucose and fructose)and low-molecular-weight (LMW) fatty acids (FAs).
2 Experimental
2.1 Submicron aerosol samplings
Aerosol samplings were conducted in the MBL on board theNational Oceanic and Atmospheric Administration (NOAA)R/V Ka’imimoana during the Tropical Ocean tRoposphereExchange of Reactive halogens and Oxygenated VOCs(TORERO) field experiment (Coburn et al., 2014; Volkameret al., 2015). Figure 1 presents the cruise track over the east-ern equatorial Pacific between 25 January and 1 March 2012.The cruise originated in Honolulu, Hawaii, and headed toPuntarenas, Costa Rica (KA-12-01), from 157 to 83◦W lon-gitude and 21◦ N to 8◦ S latitude.
A cascade impactor (CI; Series 230, Tisch Environmen-tal, Cleves, OH, USA) attached to a high-volume air sam-pler (HVAS; Model 120SL, Kimoto Electric, Osaka, Japan)was used to collect submicron particles (Miyazaki et al.,2012). The sampler was located on the upper deck of theship. Aerosol samplings were made using quartz fiber fil-ters (25× 20 cm) set on the bottom stage of the impactor ata sampling flow rate of ∼ 1100 L min−1. The sampling timefor each sample was approximately 24 h. The samples werecollected on precombusted (450 ◦C for 3 h) quartz filters, andthe average total volume of each sample was 1318.7 m3. Thecollected samples were stored individually in glass jars witha Teflon-lined screw top cap at −20 ◦C prior to analysis. Theaerosol data taken during 1–28 February 2012 were used inthis study.
To obtain the average size distributions of the WSOCmass, size-segregated aerosol samplings were also performedwith an Andersen-type CI running in parallel to the HVAS.The size-segregated aerosol samples were collected on pre-combusted quartz filters (8 cm ID) every ∼ 3 days. The sam-pling was made according to the 50 % equivalent aerody-namic cutoff diameters, with nine stages between 0.39 and10.0 µm (Miyazaki et al., 2010). Ambient air was drawn ata flow rate of 120 L min−1 per sample without temperatureand humidity control. Other data were also obtained usingan in situ ozone (O3) monitor, sonic anemometer and Chl afluorometer along the cruise track.
Atmos. Chem. Phys., 16, 7695–7707, 2016 www.atmos-chem-phys.net/16/7695/2016/

Y. Miyazaki et al.: Contribution of dissolved organic matter to submicron organic aerosols in the MBL 7697
1
Figure 1. (Left) Cruise track of the National Oceanic and Atmospheric Administration (NOAA) ship Ka’imimoana in the eastern equatorialPacific between 25 January and 1 March 2012 in three categorized oceanic areas (see text). (Right) Typical 5-day back trajectories (red lines)that started along the cruise track, together with monthly averaged concentrations of chlorophyll a (Chl a) for February 2012. A verticalcross section of the back trajectories is shown in the right bottom panel.
2.2 Aerosol chemical analysis
To determine the WSOC concentration, a portion of each fil-ter sample (19.63 cm2) was extracted with ultrapure water(> 18 M� cm−1) using an ultrasonic bath. The ultrapure wa-ter was generated by a Sartorius Stedim Biotech arium proultrapure water system (Model 611: Sartorius AG, Goettin-gen, Germany). The extracts were then filtrated with a discfilter (Millex-GV, 0.22 µm, Millipore, Billerica, MA, USA),followed by the injection of the DOC in the extracts into atotal organic carbon analyzer (Model TOC-Vcsh, Shimadzu,Kyoto, Japan) (Miyazaki et al., 2011). The WSOC value ofa field blank corresponded to less than ∼ 13 % of the WSOCconcentration of the ambient samples. All WSOC data pre-sented here were corrected against field blanks.
For the determination of δ13CWSOC, a filter (14.13 cm2)
for each sample was acidified to pH 2 with hydrochloric acid(HCl) to remove inorganic carbon prior to extraction. Thedecarbonated filter samples were then dried under a nitrogenstream for approximately 2 h. WSOC was extracted from thefilters in 20 mL of the ultrapure water using the method as de-scribed above for measuring the WSOC concentration. Theextracted samples were concentrated by rotary evaporation,and 40 µL of each sample was transferred to be absorbedonto 10 mg of pre-combusted Chromosorb in a pre-cleanedtin cup. The δ13CWSOC was then measured using an elemen-tal analyzer (EA) (NA 1500, Carlo Erba, Milan, Italy) inter-faced to an isotope ratio mass spectrometer (IRMS) (Finni-gan MAT Delta Plus, Thermo Finnigan, San Jose, CA, USA).The δ13C data are reported relative to an established refer-ence of carbon Vienna Pee Dee Belemnite (VPDB). The ni-trogen isotope ratio (δ15N) of water-soluble total nitrogen(WSTN) (δ15NWSTN) in aerosols was also measured with
basically the same procedure as δ13CWSOC, but without anyacidification using HCl. In addition, the concentrations of to-tal carbon (TC) and the δ13C of TC (δ13CTC) (i.e., withoutwater extraction) were also measured with the EA–IRMS forthe same aerosol samples (Miyazaki et al., 2010). Further de-tails of the analytical method used for isotopic analysis aregiven by Miyazaki et al. (2012).
For the determination of inorganic ions, another filter cutwas extracted with ultrapure water. The total extract was fil-trated through a membrane disc filter, and major anions in-cluding methanesulfonic acid (MSA) and cations were deter-mined using an ion chromatograph (Model 761 compact IC;Metrohm, Herisau, Switzerland) (Miyazaki et al., 2011). TheMSA value of field blanks corresponded to less than ∼ 12 %of the concentrations of the ambient samples, whereas theblank values of Na+, Cl−, and Mg2+ were less than 1 % ofthe ambient concentrations.
For the analysis of possible tracers of marine DOC, a fil-ter portion was extracted with dichloromethane/methanol.The –COOH and –OH functional groups in the extractswere reacted with N,O-bis-(trimethylsilyl)trifluoroacetamide(BSTFA) to derive trimethylsilyl (TMS) esters and TMSethers, respectively. The TMS derivatives were then analyzedfor α-glucose, β-glucose, α-fructose, β-fructose, and a ho-mologous series of straight-chain fatty acids (C12–C19 satu-rated acids) using a capillary gas chromatograph (GC7890,Agilent, Santa Clara, CA, USA) coupled to a mass spec-trometer (5973 MSD, Agilent, Santa Clara, CA, USA) (Fu etal., 2011; Miyazaki et al., 2012). The values of a field blankwere less than ∼ 24 % of the concentration of these molecu-lar compounds in the ambient samples.
www.atmos-chem-phys.net/16/7695/2016/ Atmos. Chem. Phys., 16, 7695–7707, 2016

7698 Y. Miyazaki et al.: Contribution of dissolved organic matter to submicron organic aerosols in the MBL
0
2
4
6
0
0.2
0.4
0.6
Na+ , C
l- (µ
g m
-3) M
g2+
(µg m-3)
Day of February 2012
Na+
Mg2+
Cl -
0
2
4
6
8
Loca
l win
d sp
eed
(m s
-1)
R1 R2 R3
(a)
(b)
(c)
2 4 6 8 10 12 14 16 18 20 22 24 26 280
0.5
1
Cl- /
Na+
(Mol
ar ra
tio)
Figure 2. Time series of (a) the concentrations of Cl−, Na+, andMg2+; (b) local wind speeds measured on the ship; and (c) theCl− /Na+ molar ratios. The local wind speed data were mergedinto the time interval of each filter sampling, and the average valueswith the SD over each sampling duration are shown. R1, R2, and R3denote oceanic regions 1, 2, and 3, respectively, which are definedin the text and shown in Fig. 1.
2.3 Trajectory analysis
To investigate air mass histories along the TORERO cruisetrack, back trajectories were computed with the Real-timeAir Quality Modeling System (RAQMS) (Pierce et al.,2007), which calculated chemical and meteorological fore-casts. RAQMS has a horizontal resolution of 1◦× 1◦, with35 hybrid eta theta vertical levels. Meteorological forecastsare initialized with operational analyses from the NationalCenters for Environmental Prediction (NCEP) Global DataAssimilation System (GDAS). The RAQMS calculations inconjunction with reverse domain filling (RDF) techniques(Sutton et al., 1994) are based on an analysis of back trajec-tories initialized along the cruise track. A three-dimensional7-day back trajectory was calculated using the Langley Tra-jectory Model (LTM) (Pierce and Fairlie, 1993) and initial-ized at model hybrid levels along the TORERO cruise tracks.
3 Results and discussion
3.1 Characteristics of sea salt particles
Figure 2 presents a time series of concentrations of Na+,Cl−, and Mg2+ as tracers of sea spray, together with thedaily-averaged local wind speed measured on the ship at eachaerosol sampling location. In general, temporal variations ofNa+, Cl−, and Mg2+ in the submicron particles were corre-
lated with variation in local wind speeds with r2 of 0.41–0.60(n= 21). This is consistent with the wind-driven produc-tion of primary marine aerosol particles, whereas the mod-erate linear correlation can be explained by a power law rela-tionship between sea spray mass and local wind speed (e.g.,Ovadnevaite et al., 2012).
In this study, the aerosol sampling regions were classifiedinto three categories according to the differences in oceanicareas and patterns of backward trajectories (Fig. 1). Region 1(R1), sampled during the period of 1–7 February 2012, cor-responded to open oceans at 5–15◦ N and 112–133◦W. Mostof Region 2 (R2) covered the oceanic area in the SouthernHemisphere (8◦ S–2◦ N and 93–110◦W), where the samplingwas conducted during 9–19 February. Region 3 (R3) wasclose to the coastal region at 0–8◦ N and 84–90◦W, whereobservations were made during 20–28 February. R1 and R2are characterized by very low anthropogenic impact on ma-rine ecosystem (Halpern et al., 2008) and represent someof the most pristine ocean environments at tropical latitudeswith the low Chl a concentrations (Fig. 1). According to theback trajectories, the air masses sampled in R1 and R3 (i.e.,in the Northern Hemisphere) had been transported over theocean for at least 48 h prior to aerosol sampling on the ship.The trajectories further indicated that those air masses werenot significantly influenced by the land surface for at least5 days. The air masses sampled in R2 had been transportedover the ocean in the Southern Hemisphere for at least 5 dayswithout any significant influence from the land surface orpollution. The relative influence of ocean surface and landon the observed aerosols will be discussed in Sect. 3.3.
In R3, enhanced marine biological activity at the sea sur-face was observed, with an average Chl a concentration of0.15± 0.04 mg m−3 (Fig. 1). Because this value is substan-tially larger than the average concentration in R1 and R2,R3 is characterized as a high-Chl a region. The enhancementof the Chl a concentration in R3 (up to 0.33 mg m−3) couldbe attributed to surface mixing in the Pacific Eastern Bound-ary Upwelling System (EBUS) (Rossi et al., 2009) and thecoastal region (Pennington et al., 2006). R1 was character-ized by high concentrations of sea salt particles with the av-erage molar ratio of chloride to sodium (Cl− /Na+) close tounity. This is not necessarily expected in submicron aerosolsin the tropical oceanic regions, because rapid acidification ofsea salt particles occurs on the timescale of seconds (e.g.,Pszenny et al., 2004; Keene et al., 2009). The fact that adepletion of Cl− is apparently less pronounced in R1 indi-cates that the concentrations of gas species including organicacids (e.g., Laskin et al., 2012) responsible for the Cl− losswere substantially low in R1. The current results suggest thatthe submicron particles collected in R1 were more similar tonascent sea spray aerosols compared to those in R2 and R3.The Cl− /Na+ ratio tended to decrease from R1 (av 1.06±0.23) to R2 (av 0.60± 0.24) and R3 (av 0.32± 0.25). In fact,the Cl− /Na+ ratio tended to decrease with increasing sul-fate concentration (not shown in the figure), whereas this
Atmos. Chem. Phys., 16, 7695–7707, 2016 www.atmos-chem-phys.net/16/7695/2016/
Y. Miyazaki et al.: Contribution of dissolved organic matter to submicron organic aerosols in the MBL 7699
0.1 0.5 1 5 100
500
1000
1500
0
500
1000
1500
Aerodynamic diameterDp (µm)
WSO
CdM
(ng
m-3
) / d
logD
p (µm
)R3
R1
R2
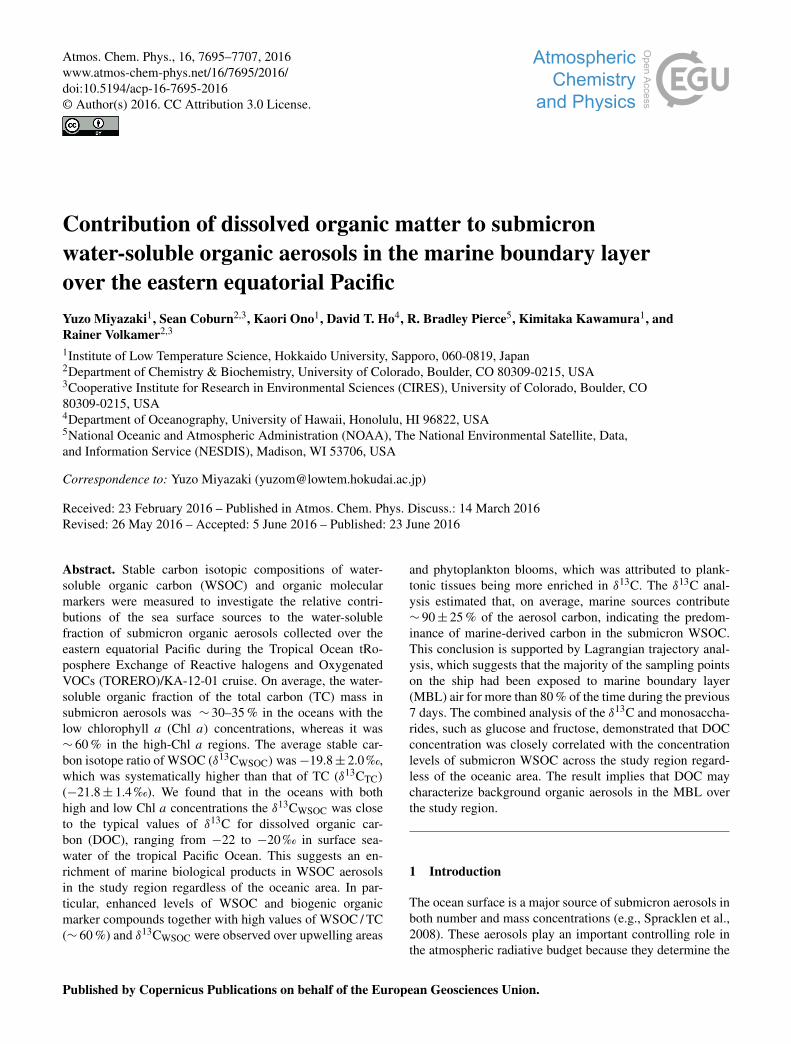
Figure 3. Typical mass size distributions of water-soluble organiccarbon (WSOC) in R1, R2, and R3.
trend is not apparent for nitrate. This result suggests the Cl−
depletion by acid substitution in seawater-derived NaCl andindicates production of more chemically aged particles in R3relative to R1 and R2.
3.2 Size distribution and time series of WSOC andrelated parameters
Figure 3 shows the typical mass size distributions of WSOCfor each regional category during the TORERO cruise. Ingeneral, WSOC displayed a bimodal size distribution, withpeaks in the submicron and supermicron particle-size ranges.Bimodal size distributions of WSOC in marine aerosols werealso observed in the western North Pacific (Miyazaki et al.,2010), whereas both unimodal and bimodal size distributionsof water-soluble organic species were also reported in parti-cles collected at a coastal site facing the eastern North Pa-cific (Maudlin et al., 2015). The bimodal size observed inthis study can be attributed to the difference in the formationprocesses of WSOC between the two size ranges. The twodistinct size modes include (i) direct co-emissions associatedwith sea salt particles in both size ranges, (ii) aqueous-phaseproducts in the submicron size range, and (iii) partitioning tothe surface of coarse particles (i.e., sea salt) and/or hetero-geneous reactions in the supermicron size range (Mochida etal., 2002). Although it is difficult to provide a clear expla-nation by this dataset alone, the observed WSOC size dis-tributions might be explained by some combination of thesepossible origins and processes. Here we focus on the submi-cron size of WSOC relevant to its isotope ratios and severalchemical tracers.
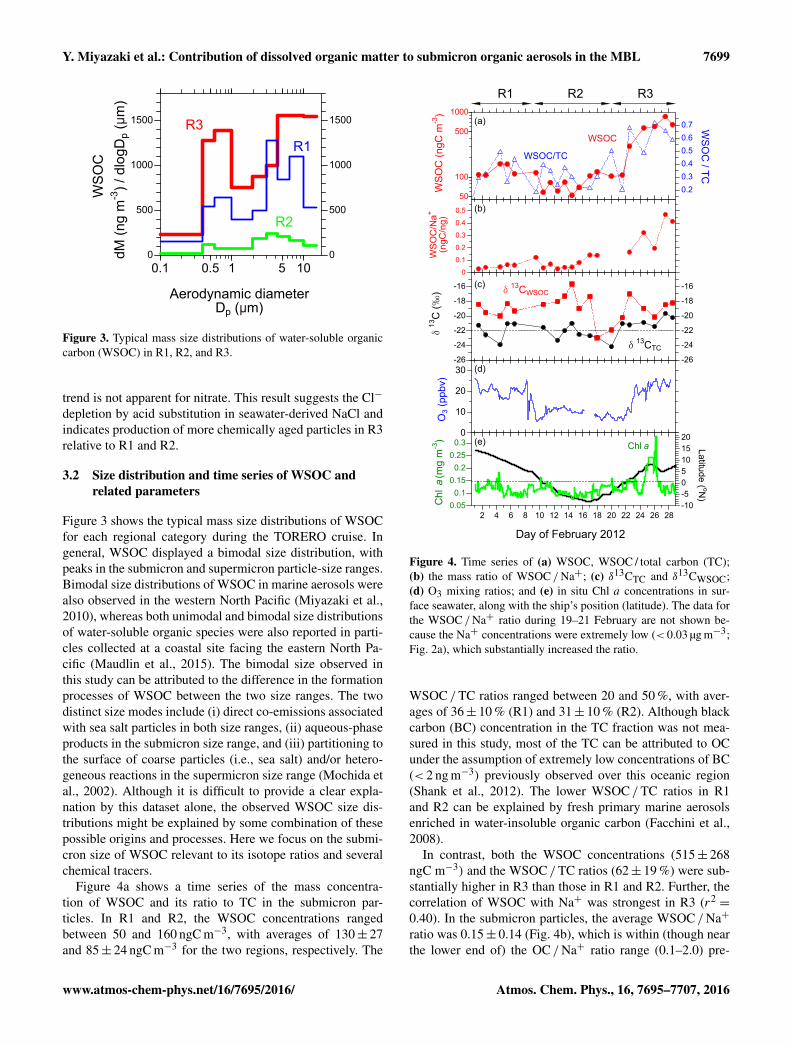
Figure 4a shows a time series of the mass concentra-tion of WSOC and its ratio to TC in the submicron par-ticles. In R1 and R2, the WSOC concentrations rangedbetween 50 and 160 ngC m−3, with averages of 130± 27and 85± 24 ngC m−3 for the two regions, respectively. The
50
100
500
1000
0.20.30.40.50.60.7
WSO
C (n
gC m
-3)
WSOC/TC
WSO
C / TC
-26
-24
-22
-20
-18
-16
-26
-24
-22
-20
-18
-16
WSOC
δ13CWSOC
δ13
C (‰
)
δ13CTC
2 4 6 8 10 12 14 16 18 20 22 24 26 280.050.1
0.150.2
0.250.3
-10-505101520
Chl
(m
g m
-3) Latitude ( oN
)
Day of February 2012
Chl aa
0
10
20
30
O3 (
ppbv
)
0
0.1
0.2
0.3
0.4
0.5
WSO
C/N
a+
(ngC
/ng)
(a)
(b)
(c)
(d)
(e)
R1 R2 R3
Figure 4. Time series of (a) WSOC, WSOC / total carbon (TC);(b) the mass ratio of WSOC /Na+; (c) δ13CTC and δ13CWSOC;(d) O3 mixing ratios; and (e) in situ Chl a concentrations in sur-face seawater, along with the ship’s position (latitude). The data forthe WSOC /Na+ ratio during 19–21 February are not shown be-cause the Na+ concentrations were extremely low (< 0.03 µg m−3;Fig. 2a), which substantially increased the ratio.
WSOC /TC ratios ranged between 20 and 50 %, with aver-ages of 36± 10 % (R1) and 31± 10 % (R2). Although blackcarbon (BC) concentration in the TC fraction was not mea-sured in this study, most of the TC can be attributed to OCunder the assumption of extremely low concentrations of BC(< 2 ng m−3) previously observed over this oceanic region(Shank et al., 2012). The lower WSOC /TC ratios in R1and R2 can be explained by fresh primary marine aerosolsenriched in water-insoluble organic carbon (Facchini et al.,2008).
In contrast, both the WSOC concentrations (515± 268ngC m−3) and the WSOC /TC ratios (62± 19 %) were sub-stantially higher in R3 than those in R1 and R2. Further, thecorrelation of WSOC with Na+ was strongest in R3 (r2
=
0.40). In the submicron particles, the average WSOC /Na+
ratio was 0.15± 0.14 (Fig. 4b), which is within (though nearthe lower end of) the OC /Na+ ratio range (0.1–2.0) pre-
www.atmos-chem-phys.net/16/7695/2016/ Atmos. Chem. Phys., 16, 7695–7707, 2016

7700 Y. Miyazaki et al.: Contribution of dissolved organic matter to submicron organic aerosols in the MBL
Table 1. Average (± standard deviation) and median concentrations and ratios in the different oceanic areas during the Tropical OceantRoposphere Exchange of Reactive halogens and Oxygenated VOCs (TORERO) cruise observation. Values in parentheses show those of the67th percentile. The precision of each measurement including the blank subtraction is also shown.
R1(1–7 Feb 2012)
R2(9–19 Feb 2012)
R3(20–28 Feb 2012)
Precision
Na+ (µg m−3) 2.78± 0.732.51 (3.46/2.49)
1.25± 0.471.19 (1.20/0.95)
2.00± 0.601.78 (1.83/1.77)
4 %
Cl− /Na+ molar ratio 1.06± 0.231.15 (1.16/0.95)
0.60± 0.240.58 (0.60/0.54)
0.32± 0.250.22 (0.25/0.19)
6 %
WSOC /Na+ (ngC ng−1) 0.05± 0.010.05 (0.06/0.04)
0.08± 0.050.07 (0.08/0.04)
0.31± 0.130.35 (0.37/0.32)
16 %
WSOC (ngC m−3) 130± 27113 (159/109)
85± 2483 (84/70)
515± 268588 (603/572)
15 %
TC (ngC m−3) 380± 132337 (377/324)
322± 160259 (323/238)
978± 345973 (1106/840)
9 %
WSOC /TC (%) 36± 1032 (43/29)
31± 1030 (30/24)
62± 1962 (66/58)
17 %
δ13CWSOC (‰) −19.1± 0.7−19.3 (−18.4/−19.5)
−19.6± 2.2−18.4 (−18.0/−19.0)
−18.8± 1.2−18.7 (−18.5/−19.0)
0.7 ‰
δ13CTC (‰) −22.0± 2.0−21.3 (−21.0/−23.9)
−22.1± 1.4−22.5 (−22.0/−22.7)
−20.7± 0.7−21.0 (−20.9/−21.2)
0.5 ‰
δ15NWSTN (‰) 10.1± 1.310.0 (10.9/9.9)
11.6± 1.311.4 (11.5/11.3)
12.8± 5.415.4 (16.5/14.3)
0.8 ‰
Glucose (ng m−3) 0.11± 0.040.11 (0.12/0.10)
0.05± 0.080.03 (0.03/0.02)
1.55± 0.661.52 (1.89/1.15)
13 %
Fructose (ng m−3) 0.02± 0.010.03 (0.03/0.02)
0.01± 0.010.01 (0.01/0.00)
0.48± 0.300.34 (0.39/0.28)
13 %
Fatty acids (C12-C19) (ng m−3) 1.38± 0.470.97 (1.40/0.69)
3.60± 2.201.49 (1.58/1.37)
5.82± 3.023.32 (3.77/2.86)
28 %
MSA (ng m−3) 92± 1399 (102/82)
141± 21144 (146/131)
123± 20118 (121/114)
18 %
Chl a (mg m−3) 0.112± 0.0160.107 (0.129/0.100)
0.106± 0.0150.101 (0.107/0.097)
0.147± 0.0370.125 (0.127/0.123)
NA
viously reported for submicron marine primary OA (Rus-sell et al., 2010; Frossard et al., 2014). This result is con-sistent with our understanding that the submicron SSA isenriched in OC relative to seawater (O’Dowd et al., 2004:Keene et al., 2007). The enrichment of water-soluble or-ganics in the submicron particles is particularly signifi-cant for R3 (Fig. 4b), where the average WSOC /Na+ ra-tio (0.31± 0.13) was substantially higher than that in R1(0.05± 0.01) and R2 (0.08± 0.05) (Table 1). The enrichmentof organics can be attributed to the phytoplankton bloomsidentified by the increased concentrations of Chl a in sea-water (up to 0.33 mg m−3) in R3 (Fig. 4e), together with thespatial distributions measured by the satellite (Fig. 1). Previ-
ous studies have shown a linkage between organics and highChl a concentrations on timescales of months (O’Dowd etal., 2004; Sciare et al., 2009). However, Quinn et al. (2014)found no well-defined relationship between instantaneousChl a in seawater and organic-mass enrichment in sea spray,suggesting no significant variability in the OC content offreshly emitted sea spray aerosol, despite significant variabil-ity in seawater Chl a levels. This point will be discussed inSect. 3.3. The higher WSOC /Na+ ratio in R3 can be alsointerpreted as an indicator of secondary contributions of pho-tochemical products of primary OA and/or marine biogenicorganic gas species to the observed aerosols during the ag-
Atmos. Chem. Phys., 16, 7695–7707, 2016 www.atmos-chem-phys.net/16/7695/2016/

Y. Miyazaki et al.: Contribution of dissolved organic matter to submicron organic aerosols in the MBL 7701
0
200
400
600
800
0.2
0.4
0.6
0.8
-24
-22
-20
-18
-24
-22
-20
-18
R1 R2 R3
WS
OC
(ngC
m-3
)
WS
OC
/ TC
δ13
C (‰
)WSOC WSOC/TC
δ13CWSOC δ
13CTC
Figure 5. Average values of the WSOC concentration, theWSOC /TC ratio, δ13CTC, and δ13CWSOC in each oceanic area.
ing, as indicated by the enhanced levels of O3 (up to 25 ppbv)(Fig. 4d) and the decreased Cl− /Na+ ratio (Fig. 2).
3.3 Isotopic characterization of aerosol WSOC and TC
As shown in Fig. 4c, the δ13CWSOC ranged from −23.0to −15.7 ‰, with an average of −19.8± 2.0 ‰ during thecruise. The δ13CWSOC values were systematically higherthan the δ13CTC ranging from −25.5 to −19.7 ‰, with anaverage of −21.8± 1.4 ‰ (Fig. 5). On average, WSOC wasenriched in 13C by ∼ 2.0 ‰ relative to TC, indicating that13C-enriched submicron carbonaceous aerosol is preferen-tially water soluble. Regardless of the oceanic area, the av-erage δ13CWSOC values of −19.6 to −18.8 ‰ (Table 1) werewithin the typical range of δ13C in the DOC pool of seawater(−22 to −18 ‰; Fontugne and Duplessy, 1981). This rangeis influenced by factors such as local ocean temperatures andphytoplankton species, whereas changes in δ13C resultingfrom trophic transfers are minimal (e.g., Guo et al., 2003).In the eastern North Pacific and in tropical oceans, the δ13Cof DOC typically ranges from −22 to −20 ‰ in surface sea-water (Bauer and Druffel, 1998). In contrast, relatively fewstudies have measured the δ13C signature in aerosol WSOC,which ranges from −25.5 to −23 ‰ at rural and urban sites,and is generally attributable to terrestrial and fossil sources(Kirillova et al., 2010; Wozniak et al., 2012). The δ13CWSOCmeasured in this study indicate an enrichment of sea-surface-derived DOC in submicron WSOC aerosols throughout thestudy region, and the 13C-enriched WSOC over TC cannotbe explained by influences of land surface. It should be notedthat this enrichment of 13C in WSOC could be partly dueto isotopic fractionation throughout the partitioning of semi-volatile organics between the gas and particle phases (Fis-seha et al., 2009). In equilibrium, partitioning between the
gas and particle phases leads to larger 13C of particle-phaseorganic compounds than the corresponding gas-phase com-pounds (Gensch et al., 2014). However, even if this effect(±2.0 ‰) is taken into account, the δ13CWSOC values werestill within the range of δ13C of DOC.
A combination of both carbon and nitrogen isotopic sig-natures can provide better information on the sources of dis-solved organic matter (DOM) in marine aerosols than car-bon isotopes alone. Figure 6 shows the ranges of the nitrogenisotope ratio of the water-soluble total nitrogen (δ15NWSTN)
and δ13CWSOC in the submicron aerosols for each oceanicregion. The δ15NWSTN ranged between 3.5 and 16.7 ‰, withan average of 11.8± 3.1 ‰. The wide range of δ15NWSTNvalues was partly due to the fact that WSTN contains inor-ganic nitrogen, such as NO−3 and NH+4 , in addition to water-soluble organic nitrogen (ON). In general, the observed val-ues were similar to the δ15N values in surface seawater (i.e.,2 m depth). Benner et al. (1997) reported a dataset of δ15Nvalues for marine high-molecular-weight DOM samples ob-tained in the Gulf of Mexico and the Pacific and Atlanticoceans, which ranged from 6.6 to 10.2 ‰. The δ15NWSTN inaerosol also provide evidence of a significant contribution ofDOC to the observed submicron aerosols.
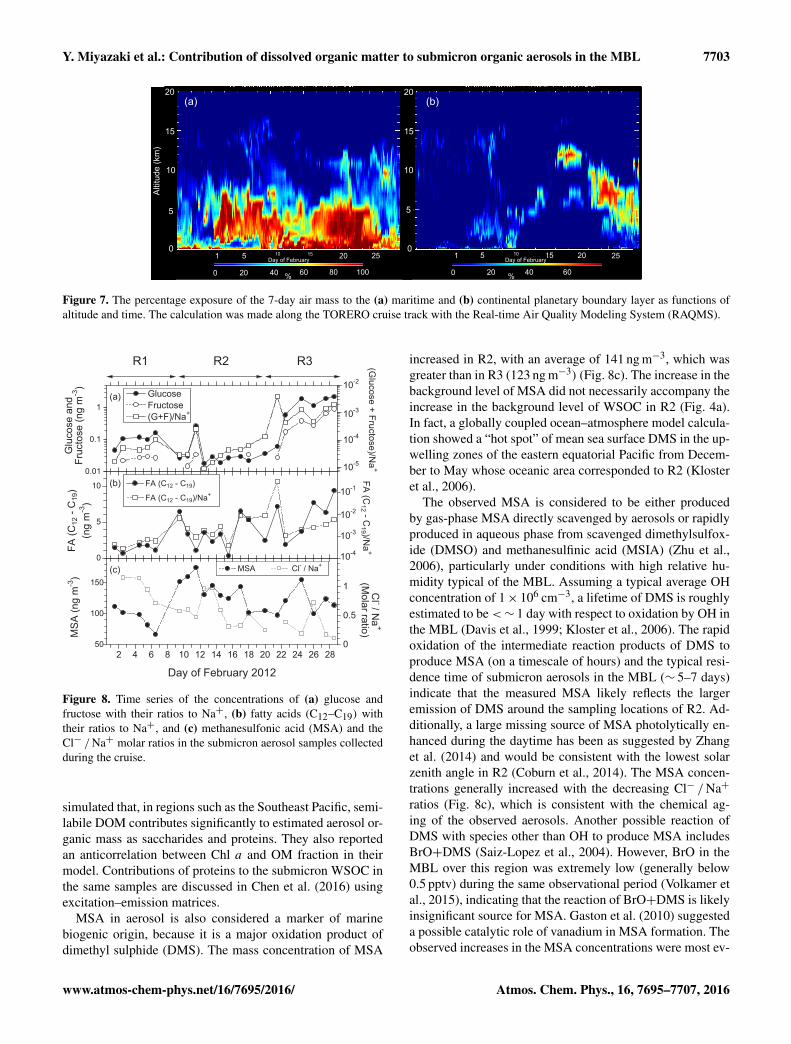
Figure 7 shows the percentage exposure (percent of timeover 7 days) of the sampled air mass to ocean and land sur-faces along the cruise track as functions of altitude and time.The calculated air parcels were initialized at each samplinglocation along the cruise track. This Lagrangian trajectoryanalysis showed very low exposure (< 20 %) of air parcelsat the sampling points on the ship to boundary layers overland, consistent with the results of the isotopic analysis, andsuggested that the majority of submicron WSOC originatedfrom the sea surface during the study period. It is noted thatthe observed aerosols in R3 had been transported by low-level air flow from the Atlantic, as indicated by the back tra-jectories (Fig. 1). In fact, the trajectories had passed over theIsthmus of Panama at higher altitudes, followed by descentto the sampling point in R3 as seen in Fig. 1, indicating lessinfluence from the land surface. This is consistent with theresults from the isotopic analysis of WSOC, which suggestthat the influence of the land surface on the observed WSOCwas insignificant.
In R3, the elevated levels of WSOC along the cruise trackwere not always accompanied by the increase of Chl a ona daily timescale. Specifically, the Chl a concentrations dis-played an insignificant increase on 22 and 27–28 February,whereas the WSOC concentrations increased, ranging from300 to 900 ngC m−3 during the same periods (Fig. 4a ande). Deng et al. (2014) also observed the lack of correla-tion between organics and Chl a over the eastern Pacific.They attributed it to the small variation in Chl a and the factthat aerosol composition is only sensitive to major changesin Chl a. Rinaldi et al. (2013) observed time lag betweenChl a and OM enrichment in aerosol, suggesting that biolog-ical processes in oceanic surface waters and their timescales
www.atmos-chem-phys.net/16/7695/2016/ Atmos. Chem. Phys., 16, 7695–7707, 2016

7702 Y. Miyazaki et al.: Contribution of dissolved organic matter to submicron organic aerosols in the MBL
-30 -25 -20 -15
0
5
10
15 R1R2R3
δ13CWSOC (‰)
δ15
NW
STN (‰
)
Figure 6. The ranges of the δ15NWSTN and δ13CWSOC in the sub-micron aerosols obtained in each oceanic area. The rectangle in thepanel indicates the typical ranges of δ15N and δ13C for dissolvedorganic matter (DOM) in the eastern equatorial Pacific (see text).
should be considered when modeling the production of pri-mary marine OA. Quinn et al. (2014) assessed the relation-ship between the OC content of seawater and freshly emittedSSA in the presence and absence of phytoplankton blooms inthe North Atlantic and the coastal waters of California. Theyconcluded that there is a large reservoir of OC in surface sea-water that results in the enrichment of OC in SSA. They alsoreported that the oceanic source of OC in the region is uncou-pled from, and overwhelms any influence of, local biologi-cal activity as measured by Chl a over large ocean regions.O’Dowd et al. (2015) showed that a correlation between OMin sea salt particles and Chl a increased as the timescale in-creased from daily to monthly intervals and suggested thatOM production is closely linked with the decay phase of thebloom and is driven by nanoscale biological processes thatrelease large quantities of transferable OM in surface seawa-ter. The results of our study support those of previous stud-ies in showing that linear source functions based on Chl amight not properly predict OC enrichments for SSA on thetimescale considered here.
3.4 Monosaccharides, fatty acids, and MSA as marinebiogenic tracers
We also used several organic molecular markers to furtherinvestigate the contribution of DOC to the submicron organ-ics in concert with the isotope tracers described previously.The analysis of sea surface waters for organics has revealeda significant carbohydrate concentration, including glucose(Aluwihare et al., 1997), whereas primary saccharides (e.g.,glucose) in aerosol have been suggested as possible tracersfor surface soil dust and/or biomass burning (Simoneit et al.,2004). Electron ionization–mass spectrometry (EI-MS) mea-surements of marine aerosol in the western Pacific revealedsubstantial contributions from carbohydrates such as glucose
and levoglucosan, and the former is partially attributed to or-ganics from the ocean surface (Crahan et al., 2004). Low-molecular-weight LMW FAs have multiple sources associ-ated with marine microbial activity, vascular plants, and mi-crobes (Mochida et al., 2002; Kawamura et al., 2003). Bur-rows et al. (2014) introduced a framework for parameterizingthe fractionation of marine OM into SSA and partitioned ma-rine OM into different classes, including a polysaccharide-like mixture associated with semilabile DOC, a lipid-likemixture associated with labile DOC, and others. In this study,we investigated the possible contributions of types of DOCto submicron organics using the molecular markers of DOC.
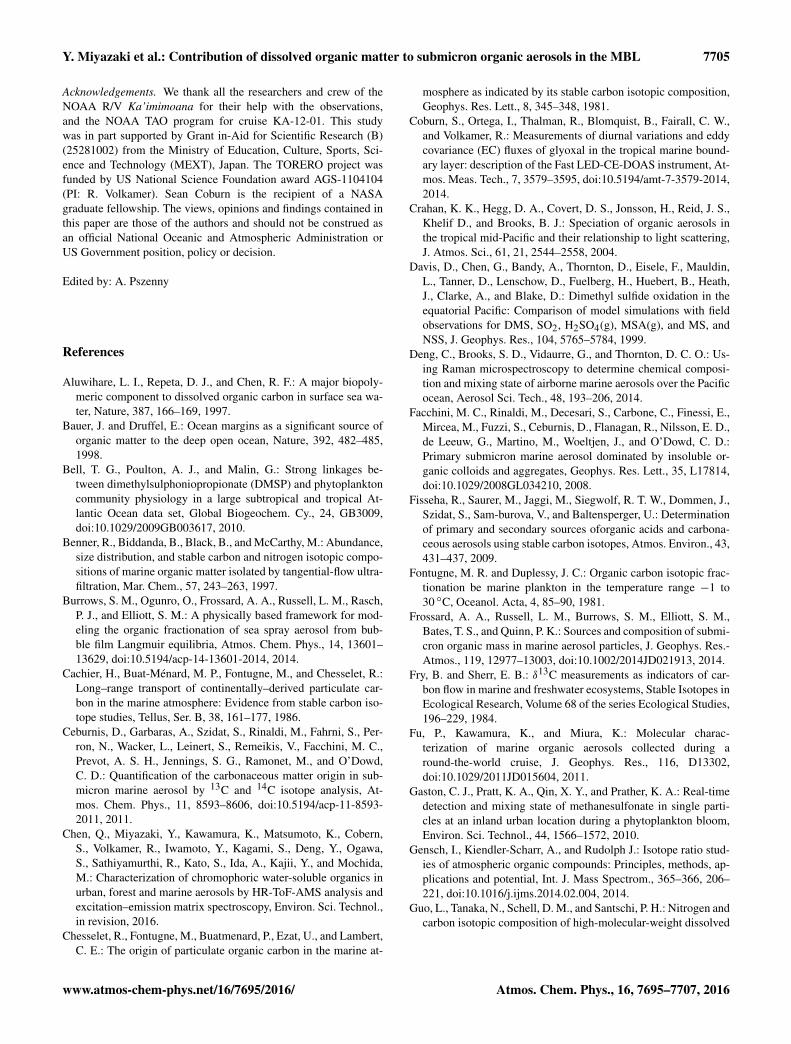
Figure 8a–b show a time series of concentrations of glu-cose, fructose, and LMW FAs (C12–C19) in the submicronparticles collected. The concentrations of both glucose andfructose were elevated in R3, with average values of 1.6± 0.7and 0.5± 0.3 ng m−3, respectively. The observed concen-trations of glucose and LMW FAs were similar to thoseobserved in total suspended particulate matter (TSP) overcoastal areas in California and western Mexico (1.0–1.4 and1.0–6.0 ng m−3 for glucose and LMW FAs, respectively) (Fuet al., 2011). The temporal trends of these saccharides weresimilar to that of WSOC, with r2 of 0.82 (n= 21). The massratio of (glucose + fructose) /Na+ was substantially higherin R3 compared to the other regions, indicating an enrich-ment of these monosaccharides in submicron sea salt parti-cles over oceanic areas with high biological activity. In con-trast, the correlation between LMW FAs and WSOC wasless significant (r2
= 0.31). The combined results of the or-ganic molecular tracers and δ13CWSOC indicate a substantialcontribution of saccharide-related DOC associated with seaspray to submicron WSOC. The results also suggest that themonosaccharides detected here might be suitable indicatorsfor the ocean-derived submicron WSOC over the study re-gion.
Russell et al. (2010) used reference Fourier transform in-frared (FTIR) spectra of 11 different saccharides, includ-ing glucose, and found that a majority of organic compo-nent in ambient marine submicron aerosol consisted of or-ganic hydroxyl groups characteristic of saccharides. Frossardet al. (2014) observed a significant amount of monosaccha-rides and disaccharides in model-generated primary marineaerosols from bubbled seawater, whereas the organic masshydroxyl group in seawater was mostly characterized bypolysaccharides. They attributed this finding to the largersaccharides preferentially remaining in the seawater duringthe primary OA production. Miyazaki et al. (2014) found lac-tic and glycolic acids, which are LMW hydroxyacids that canbe produced as the major metabolic end products of carbo-hydrate fermentation, in marine aerosols obtained from bio-logically active oceanic regions of the western North Pacific.The results of our study on glucose and fructose in the submi-cron WSOC were consistent with the chemical signatures ofmarine OA reported in those studies. Moreover, our result isin line with a modeling study by Burrows et al. (2014), who
Atmos. Chem. Phys., 16, 7695–7707, 2016 www.atmos-chem-phys.net/16/7695/2016/
Y. Miyazaki et al.: Contribution of dissolved organic matter to submicron organic aerosols in the MBL 7703
edutitlA(k
m)
5
0
10
5
0
10
Day of February Day of February
%%
1 5 10 15 20 2520151051
(b)(a)
15
20
15
20
25
0 020 40 60 80 100 20 40 60
Figure 7. The percentage exposure of the 7-day air mass to the (a) maritime and (b) continental planetary boundary layer as functions ofaltitude and time. The calculation was made along the TORERO cruise track with the Real-time Air Quality Modeling System (RAQMS).
0.01
0.1
1
Glu
cose
and
Fruc
tose
(ng
m-3
)
R1 R2 R3
Day of February 2012
Glucose Fructose
(Glucose + Fructose)/N
a+
(G+F)/Na+
2 4 6 8 10 12 14 16 18 20 22 24 26 2850
100
150
0
0.5
1
MS
A (n
g m
-3)
10-5
10-4
10-3
10-2
(b)
(c) MSA Cl- / Na+0
5
10
(a)
10-4
10-3
10-2
10-1
FA (C
12 -
C19
)(n
g m
-3)
FA (C
12 - C19 )/N
a+
FA (C12 - C19)
FA (C12 - C19)/Na+
Cl - / N
a+
(Molar ratio)
Figure 8. Time series of the concentrations of (a) glucose andfructose with their ratios to Na+, (b) fatty acids (C12–C19) withtheir ratios to Na+, and (c) methanesulfonic acid (MSA) and theCl− /Na+ molar ratios in the submicron aerosol samples collectedduring the cruise.
simulated that, in regions such as the Southeast Pacific, semi-labile DOM contributes significantly to estimated aerosol or-ganic mass as saccharides and proteins. They also reportedan anticorrelation between Chl a and OM fraction in theirmodel. Contributions of proteins to the submicron WSOC inthe same samples are discussed in Chen et al. (2016) usingexcitation–emission matrices.
MSA in aerosol is also considered a marker of marinebiogenic origin, because it is a major oxidation product ofdimethyl sulphide (DMS). The mass concentration of MSA
increased in R2, with an average of 141 ng m−3, which wasgreater than in R3 (123 ng m−3) (Fig. 8c). The increase in thebackground level of MSA did not necessarily accompany theincrease in the background level of WSOC in R2 (Fig. 4a).In fact, a globally coupled ocean–atmosphere model calcula-tion showed a “hot spot” of mean sea surface DMS in the up-welling zones of the eastern equatorial Pacific from Decem-ber to May whose oceanic area corresponded to R2 (Klosteret al., 2006).
The observed MSA is considered to be either producedby gas-phase MSA directly scavenged by aerosols or rapidlyproduced in aqueous phase from scavenged dimethylsulfox-ide (DMSO) and methanesulfinic acid (MSIA) (Zhu et al.,2006), particularly under conditions with high relative hu-midity typical of the MBL. Assuming a typical average OHconcentration of 1× 106 cm−3, a lifetime of DMS is roughlyestimated to be<∼ 1 day with respect to oxidation by OH inthe MBL (Davis et al., 1999; Kloster et al., 2006). The rapidoxidation of the intermediate reaction products of DMS toproduce MSA (on a timescale of hours) and the typical resi-dence time of submicron aerosols in the MBL (∼ 5–7 days)indicate that the measured MSA likely reflects the largeremission of DMS around the sampling locations of R2. Ad-ditionally, a large missing source of MSA photolytically en-hanced during the daytime has been as suggested by Zhanget al. (2014) and would be consistent with the lowest solarzenith angle in R2 (Coburn et al., 2014). The MSA concen-trations generally increased with the decreasing Cl− /Na+
ratios (Fig. 8c), which is consistent with the chemical ag-ing of the observed aerosols. Another possible reaction ofDMS with species other than OH to produce MSA includesBrO+DMS (Saiz-Lopez et al., 2004). However, BrO in theMBL over this region was extremely low (generally below0.5 pptv) during the same observational period (Volkamer etal., 2015), indicating that the reaction of BrO+DMS is likelyinsignificant source for MSA. Gaston et al. (2010) suggesteda possible catalytic role of vanadium in MSA formation. Theobserved increases in the MSA concentrations were most ev-
www.atmos-chem-phys.net/16/7695/2016/ Atmos. Chem. Phys., 16, 7695–7707, 2016

7704 Y. Miyazaki et al.: Contribution of dissolved organic matter to submicron organic aerosols in the MBL
ident in R2, in which the impacts of anthropogenic sourcesappeared to be very low. Therefore, the effects of such a cat-alytic reaction on the increases in MSA concentrations in R2are likely insignificant. The lack of correlation between MSAand WSOC implies that the presence of DMS in seawater andits subsequent oxidation to MSA were not necessarily linkedto the formation of submicron WSOC over this oceanic re-gion. This confirms the difficulties of connecting Chl a withDMS concentrations in seawater over subtropical and tropi-cal ocean as previously suggested (Bell et al., 2010).
3.5 Contribution of marine OC sources to the WSOCaerosol
To estimate the relative contribution from marine and terres-trial OC sources to the observed WSOC, an isotopic massbalance equation assuming a two-end-member isotopic mix-ing was used (e.g., Turekian et al., 2003; Miyazaki et al.,2010). We applied 13C values ranging from −22 to −18 ‰for marine OC and those ranging from −27 to −26 ‰ forterrestrial OC (e.g., Kirillova et al., 2010) typically foundin the Northern Hemisphere. The effect of isotopic frac-tionation by heterotrophic degradation on OM is consider-ably small (∼ 1 ‰ for 13C; Shaffer et al., 1999). Our calcu-lation indicates that, on average, marine sources contribute∼ 90± 25 % of the aerosol carbon. As discussed previously,the higher WSOC /Na+ ratio in R3 indicates some contri-bution of a secondary, ocean-derived source to WSOC, al-though it is difficult to quantify their contributions to theWSOC mass.
The results of our study contradict those of Shank etal. (2012), who suggested that there was little to no ma-rine source of submicron OA to the atmosphere in a similaroceanic region (corresponding to R1 and R2 in the currentstudy) over the eastern South Pacific. Shank et al. (2012) re-ported the average concentrations of non-refractory organicsin submicron aerosols to be as low as 70 ng m−3 with a max-imum of 170 ng m−3 at most measured with an Aerodynehigh-resolution time-of-flight mass spectrometer (HR-ToF-AMS). Assuming that most of the TC in this study can beattributed to OC in R1 and R2 and given OC-to-OM conver-sion factors of 1.8 for water-soluble OM and 1.4 for water-insoluble OM reported for the marine OA (Facchini et al.,2008), the average OA concentration in R1 and R2 is es-timated to be ∼ 490–580 ng m−3 (cf. Table 1). These val-ues are substantially larger than those reported by Shank etal. (2012). One possible explanation for the contradiction be-tween our study and Shank et al. (2012) is that the studieswere conducted in different seasons with different meteoro-logical conditions and microbial activity at the sea surface.Another possible explanation is that the AMS could not de-tect a significant fraction of refractory material (e.g., HULIS)found in primary marine OA over the study region (Deng etal., 2014). Our analysis of δ13CWSOC and organic molecularmarkers indicated that DOC in surface seawater contributed
substantially to the submicron WSOC levels regardless of theoceanic area of the study region. It is noted that the contribu-tion of anthropogenic sources cannot be negligible althoughthis is indicated by the isotopic analysis. Nevertheless, thepresent study demonstrates that DOC is closely correlatedwith the submicron WSOC aerosol concentration and impliesthat it may characterize background OA in the MBL over thestudy region.
4 Conclusions
Isotopic and organic molecular characterization of submi-cron WSOC aerosols provided an evidence of a significantcontribution of marine DOC to submicron particles in theMBL during the TORERO/KA-12-01 cruise. On average, theWSOC fraction of the TC mass in submicron aerosols was∼ 30–35 % in the low-Chl a regions, whereas it was ∼ 60 %in the high-Chl a regions over the eastern equatorial Pacific.The average δ13CWSOC (−19.8± 2.0 ‰) was systematicallyhigher than δ13CTC (−22.2± 1.9 ‰) during the entire cruise.This was attributed to greater enrichment of planktonic tis-sues in δ13C in the submicron WSOC. We found that theδ13CWSOC was close to the typical values of δ13C for DOCin surface seawater throughout the cruise, suggesting enrich-ment of marine DOC in WSOC aerosols regardless of theoceanic area of the study region.
Enhanced levels of WSOC and monosaccharides (i.e., glu-cose and fructose) together with an elevated WSOC /TC(∼ 60 %) were observed over the upwelling areas and coastalregions. The δ13C analysis indicated that marine-derived car-bon accounted for ∼ 90 % of submicron WSOC. This find-ing was supported by a Lagrangian trajectory analysis, whichsuggested little exposure of air parcels at the sampling pointsto planetary boundary layer air over 7 days prior to the sam-pling. The lack of correlation between MSA and WSOC im-plies that the presence of DMS in seawater was not necessar-ily linked to the formation of submicron WSOC, consistentwith the difficulties in connecting Chl a with DMS concen-trations in seawater over this oceanic region. The combinedresults of the organic molecular tracers and δ13CWSOC sug-gest that the monosaccharide might be a suitable indicatorfor the ocean-derived submicron WSOC associated with seasalt over this oceanic region. This study provided direct evi-dence that the contribution of DOC was significantly corre-lated with the submicron WSOC mass across the study re-gion regardless of the oceanic area.
5 Data availability
The data used in this study is available on request to Y.Miyazaki. The TORERO data is also available at http://data.eol.ucar.edu/master_list/?project=TORERO.
Atmos. Chem. Phys., 16, 7695–7707, 2016 www.atmos-chem-phys.net/16/7695/2016/
Y. Miyazaki et al.: Contribution of dissolved organic matter to submicron organic aerosols in the MBL 7705
Acknowledgements. We thank all the researchers and crew of theNOAA R/V Ka’imimoana for their help with the observations,and the NOAA TAO program for cruise KA-12-01. This studywas in part supported by Grant in-Aid for Scientific Research (B)(25281002) from the Ministry of Education, Culture, Sports, Sci-ence and Technology (MEXT), Japan. The TORERO project wasfunded by US National Science Foundation award AGS-1104104(PI: R. Volkamer). Sean Coburn is the recipient of a NASAgraduate fellowship. The views, opinions and findings contained inthis paper are those of the authors and should not be construed asan official National Oceanic and Atmospheric Administration orUS Government position, policy or decision.
Edited by: A. Pszenny
References
Aluwihare, L. I., Repeta, D. J., and Chen, R. F.: A major biopoly-meric component to dissolved organic carbon in surface sea wa-ter, Nature, 387, 166–169, 1997.
Bauer, J. and Druffel, E.: Ocean margins as a significant source oforganic matter to the deep open ocean, Nature, 392, 482–485,1998.
Bell, T. G., Poulton, A. J., and Malin, G.: Strong linkages be-tween dimethylsulphoniopropionate (DMSP) and phytoplanktoncommunity physiology in a large subtropical and tropical At-lantic Ocean data set, Global Biogeochem. Cy., 24, GB3009,doi:10.1029/2009GB003617, 2010.
Benner, R., Biddanda, B., Black, B., and McCarthy, M.: Abundance,size distribution, and stable carbon and nitrogen isotopic compo-sitions of marine organic matter isolated by tangential-flow ultra-filtration, Mar. Chem., 57, 243–263, 1997.
Burrows, S. M., Ogunro, O., Frossard, A. A., Russell, L. M., Rasch,P. J., and Elliott, S. M.: A physically based framework for mod-eling the organic fractionation of sea spray aerosol from bub-ble film Langmuir equilibria, Atmos. Chem. Phys., 14, 13601–13629, doi:10.5194/acp-14-13601-2014, 2014.
Cachier, H., Buat-Ménard, M. P., Fontugne, M., and Chesselet, R.:Long–range transport of continentally–derived particulate car-bon in the marine atmosphere: Evidence from stable carbon iso-tope studies, Tellus, Ser. B, 38, 161–177, 1986.
Ceburnis, D., Garbaras, A., Szidat, S., Rinaldi, M., Fahrni, S., Per-ron, N., Wacker, L., Leinert, S., Remeikis, V., Facchini, M. C.,Prevot, A. S. H., Jennings, S. G., Ramonet, M., and O’Dowd,C. D.: Quantification of the carbonaceous matter origin in sub-micron marine aerosol by 13C and 14C isotope analysis, At-mos. Chem. Phys., 11, 8593–8606, doi:10.5194/acp-11-8593-2011, 2011.
Chen, Q., Miyazaki, Y., Kawamura, K., Matsumoto, K., Cobern,S., Volkamer, R., Iwamoto, Y., Kagami, S., Deng, Y., Ogawa,S., Sathiyamurthi, R., Kato, S., Ida, A., Kajii, Y., and Mochida,M.: Characterization of chromophoric water-soluble organics inurban, forest and marine aerosols by HR-ToF-AMS analysis andexcitation–emission matrix spectroscopy, Environ. Sci. Technol.,in revision, 2016.
Chesselet, R., Fontugne, M., Buatmenard, P., Ezat, U., and Lambert,C. E.: The origin of particulate organic carbon in the marine at-
mosphere as indicated by its stable carbon isotopic composition,Geophys. Res. Lett., 8, 345–348, 1981.
Coburn, S., Ortega, I., Thalman, R., Blomquist, B., Fairall, C. W.,and Volkamer, R.: Measurements of diurnal variations and eddycovariance (EC) fluxes of glyoxal in the tropical marine bound-ary layer: description of the Fast LED-CE-DOAS instrument, At-mos. Meas. Tech., 7, 3579–3595, doi:10.5194/amt-7-3579-2014,2014.
Crahan, K. K., Hegg, D. A., Covert, D. S., Jonsson, H., Reid, J. S.,Khelif D., and Brooks, B. J.: Speciation of organic aerosols inthe tropical mid-Pacific and their relationship to light scattering,J. Atmos. Sci., 61, 21, 2544–2558, 2004.
Davis, D., Chen, G., Bandy, A., Thornton, D., Eisele, F., Mauldin,L., Tanner, D., Lenschow, D., Fuelberg, H., Huebert, B., Heath,J., Clarke, A., and Blake, D.: Dimethyl sulfide oxidation in theequatorial Pacific: Comparison of model simulations with fieldobservations for DMS, SO2, H2SO4(g), MSA(g), and MS, andNSS, J. Geophys. Res., 104, 5765–5784, 1999.
Deng, C., Brooks, S. D., Vidaurre, G., and Thornton, D. C. O.: Us-ing Raman microspectroscopy to determine chemical composi-tion and mixing state of airborne marine aerosols over the Pacificocean, Aerosol Sci. Tech., 48, 193–206, 2014.
Facchini, M. C., Rinaldi, M., Decesari, S., Carbone, C., Finessi, E.,Mircea, M., Fuzzi, S., Ceburnis, D., Flanagan, R., Nilsson, E. D.,de Leeuw, G., Martino, M., Woeltjen, J., and O’Dowd, C. D.:Primary submicron marine aerosol dominated by insoluble or-ganic colloids and aggregates, Geophys. Res. Lett., 35, L17814,doi:10.1029/2008GL034210, 2008.
Fisseha, R., Saurer, M., Jaggi, M., Siegwolf, R. T. W., Dommen, J.,Szidat, S., Sam-burova, V., and Baltensperger, U.: Determinationof primary and secondary sources oforganic acids and carbona-ceous aerosols using stable carbon isotopes, Atmos. Environ., 43,431–437, 2009.
Fontugne, M. R. and Duplessy, J. C.: Organic carbon isotopic frac-tionation be marine plankton in the temperature range −1 to30 ◦C, Oceanol. Acta, 4, 85–90, 1981.
Frossard, A. A., Russell, L. M., Burrows, S. M., Elliott, S. M.,Bates, T. S., and Quinn, P. K.: Sources and composition of submi-cron organic mass in marine aerosol particles, J. Geophys. Res.-Atmos., 119, 12977–13003, doi:10.1002/2014JD021913, 2014.
Fry, B. and Sherr, E. B.: δ13C measurements as indicators of car-bon flow in marine and freshwater ecosystems, Stable Isotopes inEcological Research, Volume 68 of the series Ecological Studies,196–229, 1984.
Fu, P., Kawamura, K., and Miura, K.: Molecular charac-terization of marine organic aerosols collected during around-the-world cruise, J. Geophys. Res., 116, D13302,doi:10.1029/2011JD015604, 2011.
Gaston, C. J., Pratt, K. A., Qin, X. Y., and Prather, K. A.: Real-timedetection and mixing state of methanesulfonate in single parti-cles at an inland urban location during a phytoplankton bloom,Environ. Sci. Technol., 44, 1566–1572, 2010.
Gensch, I., Kiendler-Scharr, A., and Rudolph J.: Isotope ratio stud-ies of atmospheric organic compounds: Principles, methods, ap-plications and potential, Int. J. Mass Spectrom., 365–366, 206–221, doi:10.1016/j.ijms.2014.02.004, 2014.
Guo, L., Tanaka, N., Schell, D. M., and Santschi, P. H.: Nitrogen andcarbon isotopic composition of high-molecular-weight dissolved
www.atmos-chem-phys.net/16/7695/2016/ Atmos. Chem. Phys., 16, 7695–7707, 2016

7706 Y. Miyazaki et al.: Contribution of dissolved organic matter to submicron organic aerosols in the MBL
organic matter in marine environments, Mar. Ecol. Prog. Ser.,252, 51–60, 2003.
Halpern, B. S., Walbridge, S., Selkoe, K. A., Kappel, C. V., Micheli,F., D’Agrosa, C., Bruno, J. F., Casey, K. S., Ebert, C., Fox, H. E.,Fujita, R., Heinemann, D., Lenihan, H. S., Madin, E. M. P., Perry,M. T., Selig, E. R., Spalding, M., Steneck, R., and Watson, R.: AGlobal Map of Human Impact on marine ecosystems, Science,948, 948–952, 2008.
Kawamura, K., Ishimura, Y., and Yamazaki, K.: Four years’ obser-vations of terrestrial lipid class compounds in marine aerosolsfrom the western North Pacific, Global Biogeochem. Cy., 17,1003, doi:10.1029/2001GB001810, 2003.
Kawamura, K., Kobayashi, M., Tsubonuma, N., Mochida, M.,Watanabe, T., and Lee, M.: Organic and inorganic compositionsof marine aerosols from East Asia: Seasonal variations of watersoluble dicarboxylic acids, major ions, total carbon and nitro-gen, and stable C and N isotopic composition, in: GeochemicalInvestigation in Earth and Space Science; A Tribute to Issac R.Kaplan, The Geochemical Society, 9, Elsevier, 243–265, 2004.
Keene,W. C., Maring, H., Maben, J. R., Kieber, D.J.,Pszenny, A.A. P., Dahl, E. E., Izaguirre, M. A., Davis, A. J., Long, M. S.,Zhou, X., Smoydzin, L., and Sander, R.: Chemical and physi-cal characteristics of nascent aerosols produced by bursting bub-bles at a model air-sea interface, J. Geophys. Res., 112, D21202,doi:10.1029/2007JD008464, 2007.
Keene, W. C., Long, M. S., Pszenny, A. A. P., Sander, R., Maben,J. R., Wall, A. J., O’Halloran, T. L., Kerkweg, A., Fischer, E. V.,and Schrems, O.: Latitudinal variation in the multiphase chemi-cal processing of inorganic halogens and related species over theeastern North and South Atlantic Oceans, Atmos. Chem. Phys.,9, 7361–7385, doi:10.5194/acp-9-7361-2009, 2009.
Kirillova, E. N., Sheesley, R. J., Andersson, A., and Gustafsson,Ø: Natural abundance 13C and 14C analysis of water-soluble or-ganic carbon in atmospheric aerosols, Anal. Chem., 82, 7973–7978, 2010.
Kloster, S., Feichter, J., Maier-Reimer, E., Six, K. D., Stier, P., andWetzel, P.: DMS cycle in the marine ocean-atmosphere system –a global model study, Biogeosciences, 3, 29–51, doi:10.5194/bg-3-29-2006, 2006.
Laskin, A., Moffet, R. C., Gilles, M. K., Fast, J. D., Zaveri, R. A.,Wang, B., Nigge, P., and Shutthanandan, J.: Tropospheric chem-istry of internally mixed sea salt and organic particles: Surpris-ing reactivity of NaCl with weak organic acids, J. Geophys. Res.,117, D15302, doi:10.1029/2012JD017743, 2012.
Long, M. S., Keene, W. C., Kieber, D. J., Erickson, D. J., andMaring, H.: A sea-state based source function for size- andcomposition-resolved marine aerosol production, Atmos. Chem.Phys., 11, 1203–1216, doi:10.5194/acp-11-1203-2011, 2011.
Maudlin, L. C., Wang, Z., Jonsson, H. H., and Sorooshian,A.: Impact of wildfires on size-resolved aerosol compositionat a coastal California site, Atmos. Environ., 119, 59–68,doi:10.1016/j.atmosenv.2015.08.039, 2015.
Miyazaki, Y., Kawamura, K., and Sawano, M.: Size distributionsof organic nitrogen and carbon in remote marine aerosols: Evi-dence of marine biological origin based on their isotopic ratios,Geophys. Res. Lett., 37, L06803, doi:10.1029/2010GL042483,2010.
Miyazaki, Y., Kawamura, K., Jung, J., Furutani, H., and Uematsu,M.: Latitudinal distributions of organic nitrogen and organic car-
bon in marine aerosols over the western North Pacific, Atmos.Chem. Phys., 11, 3037–3049, doi:10.5194/acp-11-3037-2011,2011.
Miyazaki, Y., Fu, P. Q., Kawamura, K., Mizoguchi, Y., and Ya-manoi, K.: Seasonal variations of stable carbon isotopic com-position and biogenic tracer compounds of water-soluble organicaerosols in a deciduous forest, Atmos. Chem. Phys., 12, 1367–1376, doi:10.5194/acp-12-1367-2012, 2012.
Miyazaki, Y., Sawano, M., and Kawamura, K.: Low-molecular-weight hydroxyacids in marine atmospheric aerosol: evidenceof a marine microbial origin, Biogeosciences, 11, 4407–4414,doi:10.5194/bg-11-4407-2014, 2014.
Mochida, M., Kitamori, Y., Kawamura, K., Nojiri, Y., and Suzuki,K.: Fatty acids in the marine atmosphere: Factors governing theirconcentrations and evaluation of organic films on sea-salt parti-cles, J. Geophys. Res., 107, 4325, doi:10.1029/2001JD001278,2002.
O’Dowd, C. and de Leeuw, G.: Marine aerosol production: a re-view of the current knowledge, Philosophical Transactions of theRoyal Society A: Mathematical, Physical and Engineering Sci-ences, 365, 1753–1774, 2007.
O’Dowd, C., Facchini, M. C., Cavalli, F., Ceburnis, D., Mircea, M.,Decesari, S., Fuzzi, S., Yoon, Y. J., and Putaud, J.-P.: Biogeni-cally driven organic contribution to marine aerosol, Nature, 431,676–680, 2004.
O’Dowd, C., Ceburnis, D., Ovadnevaite, J., Bialek, J., Stengel, D.B., Zacharias, M., Nitschke, U., Connan, S., Rinaldi, M., Fuzzi,S., Decesari, S., Facchini, M. C., Marullo, S., Santoleri, R.,Dell’Anno, A., Corinaldesi, C., Tangherlini, M., and Danovaro,R.: Connecting marine productivity to sea-spray via nanoscalebiological processes: Phytoplankton Dance or Death Disco?, Sci.Rep., 5, 14883, doi:10.1038/srep14883, 2015.
Ovadnevaite, J., Ceburnis, D., Canagaratna, M., Berresheim, H.,Bialek, J., Martucci, G., Worsnop, D. R., and O’Dowd, C.: Onthe effect of wind speed on submicron sea salt mass concentra-tions and source fluxes, J. Geophys. Res. Atmos., 117, D16201,doi:10.1029/2011jd017379, 2012.
Pennington, J. T., Mahoney, K. L., Kuwahara, V. S., Kolber, D. D.,Calienes, R., and Chavez, F. P.: Primary production in the easterntropical Pacific: A review, Progr. Oceanogr., 69, 285–317, 2006.
Pierce, R. B. and Fairlie, T. D. A.: Chaotic advection in the strato-sphere: implications for the dispersal of chemically perturbedair from the polar vortex, J. Geophys. Res.-Atmos., 98, 18589–18595, 1993.
Pierce, R. B., Schaack, T., Al-Saadi, J. A., Fairlie, T. D., Kittaka,C., Lingenfelser, G., Natarajan, M., Olson, J., Soja, A., Zapo-tocny, T., Lenzen, A., Stobie, J., Johnson, D., Avery, M. A.,Sachse1, G. W., Thompson, A., Cohen, R., Dibb, J. E., Crawford,J., Rault, D., Martin, R., Szykman, J., and Fishman, J.: Chemi-cal data assimilation estimates of continental U.S. ozone and ni-trogen budgets during the Intercontinental Chemical TransportExperiment–North America, J. Geophys. Res., 112, D12S21,doi:10.1029/2006JD007722, 2007.
Prather, K. A., Bertram, T. H., Grassian, V. H., Deane, G. B., Stokes,M. D., DeMott, P. J., Aluwihare, L. I., Palenik, B. P., Azam,F., Seinfeld, J. H., Moffet, R. C., Molina, M. J., Cappa, C. D.,Geiger, F. M., Roberts, G. C., Russell, L. M., Ault, A. P., Bal-trusaitis, J., Collins, D. B., Corrigan, C. E., Cuadra-Rodriguez,L. A., Ebben, C. J., Forestieri, S. D., Guasco, T. L., Hersey, S.
Atmos. Chem. Phys., 16, 7695–7707, 2016 www.atmos-chem-phys.net/16/7695/2016/

Y. Miyazaki et al.: Contribution of dissolved organic matter to submicron organic aerosols in the MBL 7707
P., Kim, M. J., Lambert, W. F., Modini, R. L., Mui, W., Pedler,B. E., Ruppel, M. J., Ryder, O. S., Schoepp, N. G., Sullivan, R.C., and Zhao, D.: Bringing the ocean into the laboratory to probethe chemical complexity of sea spray aerosol, P. Natl. Acad. Sci.USA, 110, 7550–7555, doi:10.1073/pnas.1300262110, 2013.
Pszenny, A. A. P., Moldanová, J., Keene, W. C., Sander, R., Maben,J. R., Martinez, M., Crutzen, P. J., Perner, D., and Prinn, R. G.:Halogen cycling and aerosol pH in the Hawaiian marine bound-ary layer, Atmos. Chem. Phys., 4, 147–168, doi:10.5194/acp-4-147-2004, 2004.
Quinn, P. K., Bates, T. S., Schulz, K. S., Coffman, D. J., Frossard, A.A., Russell, L. M., Keene, W. C., and Kieber, D. J.: Contributionof sea surface carbon pool to organic matter enrichment in seaspray aerosol, Nat. Geosci., 7, 228–232, 2014.
Rinaldi, M., Fuzzi, S., Decesari, S., Marullo, S., Santoleri, R.,Provenzale, A., Hardenberg, J., Ceburnis, D., Vaishya, A.,O’Dowd, C. D., and Facchini, M. C.: Is chlorophyll-a the bestsurrogate for organic matter enrichment in submicron primarymarine aerosol?, J. Geophys. Res.-Atmos., 118, 4964–4973,doi:10.1002/jgrd.50417, 2013.
Rossi, V., López, C., Hernández-García, E., Sudre, J., Garc˜on, V.,and Morel, Y.: Surface mixing and biological activity in the fourEastern Boundary Upwelling Systems, Nonlin. Processes Geo-phys., 16, 557–568, doi:10.5194/npg-16-557-2009, 2009.
Russell, L. M., Hawkins, L. N., Frossard, A. A., Quinn, P. K., andBates, T. S.: Carbohydrate-like composition of submicron atmo-spheric particles and their production from ocean bubble burst-ing, Proc. Natl. Acad. Sci. USA, 107, 6652–6657, 2010.
Saiz-Lopez, A., Plane, J. M. C., and Shillito, J. A.: Bromine oxidein the mid-latitude marine boundary layer, Geophys. Res. Lett,31, L03111, doi:10.1029/2003GL018956, 2004.
Sciare, J., Favez, O., Sarda-Estève, R., Oikonomou, K., Cachier,H., and Kazan, V.: Long-term observations of carbonaceousaerosols in the Austral Ocean atmosphere: Evidence of a bio-genic marine organic source, J. Geophys. Res., 114, D15302,doi:10.1029/2009JD011998, 2009.
Shaffer, G., Bendtsen, J., and Ulloa, O.: Fractionation during rem-ineralization of organic matter in the ocean, Deep-Sea Res., 46,185–204, 1999.
Shank, L. M., Howell, S., Clarke, A. D., Freitag, S., Brekhovskikh,V., Kapustin, V., McNaughton, C., Campos, T., and Wood,R.: Organic matter and non-refractory aerosol over the re-mote Southeast Pacific: oceanic and combustion sources, Atmos.Chem. Phys., 12, 557–576, doi:10.5194/acp-12-557-2012, 2012.
Simoneit, B. R. T., Kobayashi, M., Mochida, M., Kawamura, K.,Lee, M., Lim, H.-J., Turpin, B. J., and Komazaki, Y.: Composi-tion and major sources of organic compounds of aerosol particu-late matter sampled during the ACE-Asia campaign, J. Geophys.Res., 109, D19S10, doi:10.1029/2004JD004598, 2004.
Spracklen, D. V., Arnold, S. R., Carslaw, K. S., Sciare, J., and Pio,C.: Globally significant oceanic source of organic carbon aerosol,Geophys. Res. Lett., 35, L12811, doi:10.1029/2008GL033359,2008.
Sutton, R. T., Maclean, H., Swinbank, R., O’Neill, A., and Tay-lor, F. W.: High resolution stratospheric tracer fields estimatedfrom satellite observations using Lagrangian trajectory cal-culations, J. Atmos. Sci., 51, 2995–3005, doi:10.1175/1520-0469(1994)051<2995:HRSTFE>2.0.CO;2, 1994.
Turekian, V. C., Macko, S. A., and Keene, W. C.: Concen-trations, isotopic compositions, and sources of size-resolved,particulate organic carbon and oxalate in near-surface marineair at Bermuda during spring, J. Geophys. Res., 108, 4157,doi:10.1029/2002JD002053, 2003.
Volkamer, R., Baidar, S., Campos, T. L., Coburn, S., DiGangi, J.P., Dix, B., Eloranta, E. W., Koenig, T. K., Morley, B., Ortega,I., Pierce, B. R., Reeves, M., Sinreich, R., Wang, S., Zondlo,M. A., and Romashkin, P. A.: Aircraft measurements of BrO,IO, glyoxal, NO2, H2O, O2–O2 and aerosol extinction pro-files in the tropics: comparison with aircraft-/ship-based in situand lidar measurements, Atmos. Meas. Tech., 8, 2121–2148,doi:10.5194/amt-8-2121-2015, 2015.
Wozniak, A. S., Bauer, J. E., Dickhut, R. M., Xu, L., and McNichol,A. P.: Isotopic characterization of aerosol organic carbon com-ponents over the eastern United States, J. Geophys. Res., 117,D13303, doi:10.1029/2011JD017153, 2012.
Zhang, Y., Wang, Y., Gray, B. A., Gu, D., Mauldin, L., Cantrell,C., and Bandy, A.: Surface and free tropospheric sources ofmethanesulfonic acid over the tropical Pacific Ocean, Geophys.Res. Lett., 41, 5239–5245, doi:10.1002/2014GL060934, 2014.
Zhu, L., Nenes, A., Wine, P. H., and Nicovich, J. M.: Effects ofaqueous organosulfur chemistry on particulate methanesulfonateto nonsea salt sulfate ratios in the marine atmosphere, J. Geo-phys. Res., 111, D05316, doi:10.1029/2009GL038465, 2006.
www.atmos-chem-phys.net/16/7695/2016/ Atmos. Chem. Phys., 16, 7695–7707, 2016