continuing vocational training survey: cvts4 - gov.uk · continuing vocational training provision...
TRANSCRIPT

1
BIS RESEARCH PAPER NUMBER 102
Continuing Vocational Training Survey – CVTS4
FEBRUARY 2013

The views expressed in this report are the authors’ and do not necessarily reflect those of the Department for Business, Innovation and Skills.
Department for Business, Innovation and Skills
1 Victoria Street
London SW1H 0ET
www.bis.gov.uk Research paper number 102 February 2013
2

Continuing Vocational Training Survey
Contents Executive Summary........................................................................................................................ 8
Introduction ................................................................................................................................... 8
Continuing Vocational Training provision...................................................................................... 8
Participation in Continuing Vocational Training............................................................................. 9
Costs of Continuing Vocational Training ....................................................................................... 9
Training policies and management processes............................................................................ 10
Quality assurance of Continuing Vocational Training ................................................................. 11
Barriers to provision of Continuing Vocational Training .............................................................. 11
Initial Vocational Training ............................................................................................................ 11
Characteristics of enterprises in the survey ................................................................................ 12
Overview ........................................................................................................................................ 13
Key points ................................................................................................................................... 13
Size of organisations................................................................................................................... 14
Industry sector and CVT ............................................................................................................. 16
Gender and CVT......................................................................................................................... 17
Mandatory training and training towards vocationally recognised training.................................. 17
The nature and supply of training................................................................................................ 18
Barriers to training....................................................................................................................... 19
Recent trends in training ............................................................................................................. 20
Survey Background ...................................................................................................................... 22
Key points ................................................................................................................................... 22
Objectives ................................................................................................................................... 22
Survey background ..................................................................................................................... 22
3

Continuing Vocational Training Survey
Policy background....................................................................................................................... 23
The UK Context....................................................................................................................... 23
The European context............................................................................................................. 23
Methodology................................................................................................................................ 26
The universe under investigation ............................................................................................ 26
Sample completed ...................................................................................................................... 27
Data context ................................................................................................................................ 28
Response rates ....................................................................................................................... 28
Treatment of non-response..................................................................................................... 28
Impact of imputation and estimation ....................................................................................... 29
Standard error and confidence intervals ................................................................................. 29
Note on rounding..................................................................................................................... 30
Definitions ................................................................................................................................... 30
Definition of Continuing Vocational Training ........................................................................... 30
Definition of Initial Vocational Training .................................................................................... 31
Continuing Vocational Training Provision ................................................................................. 32
Key Points ................................................................................................................................... 32
Overview of provision of Continuing Vocational Training............................................................ 32
Internal Continuing Vocational Training courses......................................................................... 34
External Continuing Vocational Training courses ....................................................................... 35
Use of external Vocational Training providers ............................................................................ 37
Other forms of Continuing Vocational Training (i.e. other than CVT courses) ............................ 39
On-the-job training ...................................................................................................................... 40
Job-rotation, exchanges, secondments or study visits................................................................ 40
Attendance at conferences, workshops, trade fairs and lectures................................................ 40
4

Continuing Vocational Training Survey
Learning and quality circles......................................................................................................... 40
Self-directed learning .................................................................................................................. 41
Participant number in ‘other’ Continuing Vocational Training ..................................................... 41
Comparisons with CVTS2 and CVTS3 ....................................................................................... 42
Participation in Continuing Vocational Training........................................................................ 44
Key Points ................................................................................................................................... 44
Overview of participation in Continuing Vocational Training ....................................................... 44
Proportion of the workforce participating in Continuing Vocational Training........................... 44
Skills/competences developed.................................................................................................... 46
Time spent on Continuing Vocational Training courses by gender......................................... 52
Breakdown of time spent on internal and external Continuing Vocational Training courses .. 53
Time spent on mandatory Vocational Training courses .......................................................... 54
Time spent on courses leading to a nationally recognised qualification ................................. 55
Comparisons with CVTS2 and CVTS3 ....................................................................................... 57
Costs of Continuing Vocational Training Courses.................................................................... 58
Key Points ................................................................................................................................... 58
Total cost of Continuing Vocational Training courses in 2010 .................................................... 59
Cost breakdown .......................................................................................................................... 62
Funding of Vocational Training activities..................................................................................... 63
Contribution to funds............................................................................................................... 63
Receipt of funds ...................................................................................................................... 64
Comparisons with CVTS2 and CVTS3 ....................................................................................... 67
Training Policies and Management Processes.......................................................................... 68
Key points ................................................................................................................................... 68
Overview of strategies for the provision of Continuing Vocational Training ................................ 68
5

Continuing Vocational Training Survey
Skills/competences which are important to business development ............................................ 70
Reviewing skill and training needs .............................................................................................. 75
Responsibility for Vocational Training within the business.......................................................... 78
Training centres .......................................................................................................................... 78
Training plans.............................................................................................................................. 79
Training budgets ......................................................................................................................... 81
Regulation of Vocational Training provision................................................................................ 82
Management processes.............................................................................................................. 82
Sources of information and advice regarding Vocational Training.............................................. 83
Comparisons with CVTS3........................................................................................................... 84
Quality Assurance with regard to Continuing Vocational Training ......................................... 86
Key points ................................................................................................................................... 86
Overview of strategies to ensure the quality of Continuing Vocational Training ......................... 86
Quality assurance strategies....................................................................................................... 86
Assessment strategies ................................................................................................................ 87
Barriers to Provision of Continuing Vocational Training.......................................................... 90
Key points ................................................................................................................................... 90
Barriers for organisations that do not provide Continuing Vocational Training ........................... 90
Barriers for organisations that already provide Continuing Vocational Training ......................... 92
Initial Vocational Training ............................................................................................................ 94
Key points ................................................................................................................................... 94
Employment of Apprentices ........................................................................................................ 94
Reasons for employing Apprentices ........................................................................................... 96
Barriers to employing Apprentices .............................................................................................. 97
Characteristics of Enterprises..................................................................................................... 98
6

Continuing Vocational Training Survey
Key points ................................................................................................................................... 98
Sector.......................................................................................................................................... 98
Size of Enterprise...................................................................................................................... 100
Size of Enterprise in 2009..................................................................................................... 102
Hours worked........................................................................................................................ 103
Labour costs.............................................................................................................................. 104
Appendix...................................................................................................................................... 109
Annex A: Definitions................................................................................................................ 109
Annex B: Sample confidence intervals.................................................................................... 118
Formula for standard error at 95% level of confidence ......................................................... 119
Annex C: Questionnaire employed ......................................................................................... 123
7

Continuing Vocational Training Survey
Executive Summary
Introduction
Continuing Vocational Training (CVT) is recognised both by the European Union and European national governments as a key contribution to competitiveness and productivity, to adaptation of workforces to changing patterns of production and work organisation, and to social cohesion.
To monitor progress and change in the delivery of CVT supplied by employers across Europe, the European Union commissions a regular survey of employers to assess their CVT practices.
This survey, the Continuing Vocational Training Survey (CVTS) takes place at 5-yearly intervals. The results of the fourth edition of the survey in the UK, ‘CVTS4’, are set out in this report.
It is based on telephone interviews with 4,600 UK employers with 10 or more employees. Survey fieldwork was undertaken between September 2011 and January 2012. It mainly concerns the vocational training undertaken by those employers in the ‘reference year’ of 2010 (previous reference years of earlier editions of the survey having been 1995, 1999, and 2005).
The survey used careful sampling and a data weighting process to ensure its results are representative of the wider population of UK employers with 10 or more employees from which the sample was drawn.
Continuing Vocational Training provision
83% of employers provided their staff with some form of Continuing Vocational Training (CVT) in 2010.
64% of employers provided CVT courses, as opposed to less formal forms of CVT (such as workshops, job-rotation, on-the-job training, or self-directed learning).
The provision of all forms of CVT was more frequent in larger employers and in Service sectors rather than Production and Construction sectors.
42% of employers provided CVT courses internally to their organisation. 54% provided CVT courses delivered by an external provider. Though less likely to provide CVT courses overall, small employers, having lesser internal resource, were proportionately more reliant on external provision.
Where external provision was used, private training companies were the main source and were used significantly more often than publicly-funded colleges or universities.
8

Continuing Vocational Training Survey
Of the less formal methods of CVT, guided on-the-job training was, by a wide margin, the most significant, being provided by 62% of all employers.
CVT was provided by 87% of employers in 1999 and by 91% in 2005. Although the Survey does not directly investigate the issue, it is likely that the subsequent decline (to 83%) in 2010 reflects difficult economic circumstances from 2008 onwards.
Participation in Continuing Vocational Training
Around a third of employees (31%) participated in CVT courses in 2010. This compares with 34% in 2005.
The average number of hours on CVT courses by employers during 2010 was 1,020 (statistically similar to the 2005 average of 1,034).
In relation to hours worked, hours on CVT courses accounted for less than 1%.
The average number of hours spent on CVT courses per employee was 7.5 hours (slightly below the average of 8.7 hours in 2005).
The average number of hours spent on CVT per participant was 24 (above the average of 21 in 2005). The inference is that employers allocated a stable volume of training to a somewhat lower number of employees.
On average, male trainees spent more hours (24 hours) on CVT courses than female trainees (21 hours).
28% of all hours on CVT courses were devoted to mandatory training (such as that related to health and safety).
31% of all hours on CVT courses were on courses leading to a nationally recognised qualification.
Technical, practical and job-specific skills are the most important in terms of the focus of CVT courses.
Costs of Continuing Vocational Training
The average amount spent by employers on CVT courses in 2010 was around £29,900. This is lower than in 2005 (£34,000)1.
This amount varies from £8,600 in organisations with between 10 and 49 employees to around £580,000 in organisations with 500 or more employees.
1 It should be noted that inflation, which affects both prices and wages, is not factored into comparisons between 2010 and 2005.
9

Continuing Vocational Training Survey
The average cost per course participant was £710, which indicates little change since 2005 (when it was also £710). This cost is higher for smaller employers than for larger ones, presumably because of larger employers’ use of internal training resources and/or because of economies of scale.
The average cost of CVT courses per hour was £29 but with significant variation between sectors (being lowest at £18 in the Accommodation and Food Services sector and highest at £50 in the Public Administration sector). There has been a decline in this figure since 2005, when it was reported at £33.
The average cost of CVT courses per employee (that is, averaged across all employees in the organisation whether they participated or not) was £260. As with cost per participant, this was lower in larger organisations than in smaller ones. It compares with £290 per employee in 2005.
Indirect costs (of trainee absence from their work station and for travel and subsistence) accounted for a substantial proportion (46%) of the average cost of courses. Direct costs in the form of fees and payments accounted for 34%, labour costs of internal training staff for 17%, and training facilities for 3%.
15% of employers contributed to collective funds for vocational training. The average contribution was of £10,100.
16% of employers received payments from collective funds. The average receipt was of £8,800. Government subsidies were the most frequent source of receipts.
To sum up, the average amount organisations spent on training declined somewhat between 2005 and 2010, from £34,000 to £29,900. This was accompanied by a slight decline in terms of training costs per employee between 2005 and 2010 from £290 to £260, and in terms of training costs per training hour from £33 to £29.
Training policies and management processes
Provision of CVT in 2010 was strongly associated with having supportive infrastructure, such as a training centre or a specific person or department with responsibility for staff training, and supportive processes, such as having formal planning of training and training budgets.
Employers most frequently identified team working skills, job-specific skills, and customer handling skills as skills which would be important to the future development of their organisation.
49% of employers reviewed skill needs regularly as part of their overall planning process, 39%, reviewed needs on an ‘as and when needed’ basis. 12% did not assess their skill needs.
The most common means by which employers secured the skills they needed was by training existing staff. 93% reported this approach. However, other methods were also widely used. 87% reallocated responsibilities to other staff and 80% recruited new staff.
10

Continuing Vocational Training Survey
15% of employers reported that provision of CVT in their organisation was regulated by a written agreement involving government, local area or trade associations, and/or trade unions.
22% of employers reported that staff representation was involved in the management of their CVT provision.
Employers were most frequently informed or advised on external CVT provision by private training providers (in 71% of cases). Public information sources, such as BusinessLink or Next Step, were the source of information or advice on CVT provision for 50% of employers.
Planning of, and budgeting for, CVT was more frequent in 2010 than in 2005.
Quality assurance of Continuing Vocational Training
81% of employers supplying CVT had a strategy to quality-assure that training.
Of these, 57% used certification of external providers, 53% used national training or qualification frameworks, and 43% trained their own training staff.
64% of employers supplying CVT formally assessed its outcomes.
Barriers to provision of Continuing Vocational Training
Where employers did not supply CVT, the main barriers were that they saw no need for training – their staff were fully skilled – or they preferred to recruit to obtain the skills they needed. ‘Supply-side’ barriers were much less frequent though 25% said CVT courses were too expensive and 13% said suitable courses were not available.
When employers who supplied CVT were asked to identify barriers to providing more, many (82%) said they had no need for more, said (in 63% of cases) that they preferred to recruit, or said (in 55% of cases) that staff workloads precluded more training.
Initial Vocational Training
Initial Vocational Training (IVT) is training is training intended to prepare an individual for entry to an occupation via study or training towards to a formal qualification. To determine the extent of a particular form of IVT, organisations were asked to provide information on the number of people employed on a Government-recognised Apprenticeship leading to a qualification during 2010.
20% of employers employed Apprentices in 2010.
Most of these did so in order to secure their organisations’ future skills base.
11
Continuing Vocational Training Survey
Where employers did not do so, this was most frequently because they saw no need to do so or had no vacancies. 18% said that Apprenticeships weren’t available or suitable for their type of activity.
Characteristics of enterprises in the survey
As a result of weighting, the structure of the Survey sample reflects the sector and size breakdown of the national base of employers with 10 or more employees.
54% of the workforce of the weighted sample was male, 46% was female.
On average, surveyed organisations employed 90 people.
On average, employees in surveyed organisations worked for 40 hours per week.
The average labour cost per employee in surveyed organisations was £20,800 per year in 2010.
The average labour cost per hour for all employees in surveyed organisations was £10.90.
24% of employers innovated in 2010, in the sense that they introduced new or greatly improved goods or services or adopted new or significantly better delivery processes.
12

Continuing Vocational Training Survey
Overview
Key points
Taking an overview of report findings, it is noted first that size of organisations is a consistent predictor of the likelihood of an organisation being engaged in a range of CVT practices and behaviours. For example, larger organisations are more likely than smaller ones to offer CVT, to offer CVT in each of its different forms, and to have an ‘infrastructure’ for the support of CVT. However, it is also noted that, when smaller organisations do supply training, they supply it to proportions of staff which are similar between small and large organisations and, on average, offer the same number of training hours per employee as larger organisations. Given that the average costs of training per trainee and per training hour are higher for small organisations, it is suggested that some small employers show at least as much commitment to training as large ones.
Industry sector is also shown to be associated with the likelihood of supplying training but it is also noted that different sectors have different size profiles of organisations within them and, thus, the relative influences of organisation and sector are not always clearly separable. Service sector organisations are more likely to train their staff than those in production and construction, but the difference is largely attributable to the financial services and public sectors which more frequently supply CVT and these sectors are dominated by large businesses and organisations.
It is noted that, on average, men spent slightly more time on CVT courses than women. This difference was wholly attributable to pronounced gender imbalance in the production and construction sectors; there was no imbalance in service sectors. It is also noted that mandatory training and training towards qualifications was high in some production and construction sectors. It is hypothesised that much of this training was directed towards health and safety and environmental matters of more relevance to manual and technical occupations mainly held by men, and that it is this factor which produces the observed gender disparity.
More generally, it is observed that mandatory training was a significant component of all CVT. This finding invites reflection on the extension of a ‘licence to practice’ approach in the UK as a possible lever of an overall greater volume of training.
Examining the suppliers of training, the survey notes that private training companies are used by nearly twice as many employers as public training institutions, such as FE Colleges and Universities. It is recognised that the two sectors are in markets which are often distinct: private companies offering short, focussed provision, public providers offering longer courses aimed at nationally-accredited qualifications. However, it is also suggested that, with government pressure on FEIs and HEIs to become more commercially minded and with private training companies seeking to extend their foothold in undergraduate and professional tuition, the market is undergoing, and will continue to undergo, significant change.
The survey also notes that, whilst the development of technical and practical skills is, of course, of great importance to employers, many employers are committed to the
13

Continuing Vocational Training Survey
development of more ‘generic’ skills such as team working, problem solving, and customer handling and see such skills as important to their future development. It is also noted that around a third of employers supply training in literacy and/or numeracy, a statistic which clearly relates to the on-going debate about the adequacy of schools’ performance in developing young people’s basic skills.
Twenty per cent of organisations in the survey employed government-supported Apprentices in 2010. Where organisations had Apprentices it was mainly for positive reasons, basically to expand their organisations’ future skills bases. Where they did not have Apprentices, it was almost always because they did not need them, not because they saw defects in Apprenticeship. Broadly, these findings are reassuring for government, given the weight which is now placed on Apprenticeship as a central plank of government skills policy.
Barriers to training more generally were mainly concerned with demand factors. Employers did not perceive a need for training or were unwilling to pay its costs in time or cash outlay. Failures in the supply of courses were a relatively minor factor and it is suggested that government efforts to increase the volume of employer training in the UK mainly need to work on stimulating employer demand. It is, however, recognised that much government effort and substantial budgets have been directed to this task in recent years but its achievement still remains a substantial challenge.
Finally, some trends in CVT provision are observed, using comparisons between different editions of the survey. The main trends are such that provision of CVT rose between 1999 and 2005 but fell back towards 2010 and that the costs of training have also been constrained or reduced in the period 2005 to 2010. The obvious implication is that the intervening recession in 2008 and its aftermath have restrained employers’ willingness to invest in training and depressed prices in the training market. More positively, organisations which do train were more likely to train within a formal planned and budgeted framework in 2010 than was the case in 2005.
It should be noted that the Employer Skills Survey 20112 found that the proportion of employers in England providing training had been more consistent between 2005 and 2011 (albeit using different definitions and coverage to CVTS).
The following is a review of some of the main findings with the aim of identifying consistencies and key themes in the data and suggesting some of the underlying explanations of, and linkages between, these.
Size of organisations
A first and powerful driver of variations in data is simply the size of organisations. Of course, in almost any analysis of business behaviour, large businesses are likely to vary significantly from smaller ones. Their scale, complexity, and resource simply mean that they have a greater need and capacity to act in various ways. For example, other studies
2 http://www.ukces.org.uk/assets/ukces/docs/publications/ukces-employer-skills-survey-11.pdf
14

Continuing Vocational Training Survey
have shown that they are more likely to export, to have a research and development function, to innovate, to acquire other businesses, and so on.
This survey shows that this differentiation also applies to human resource practices. Thus, tables and figures in the main body of this report show that, for example, large organisations are more likely:
To supply CVT to their staff (Table 1)
Within this, they are more likely to supply external CVT to their staff than smaller ones, but, particularly, they are even more likely to use internal resources to train their staff (Table 3)
To supply mandatory training (Figure 10)
To contribute to collective training funds (Figure 14)
To have training facilities, processes, plans, policies, and budgets (Table 10 and Figures 21, 22 and 23)
To quality assure their training (Table 15) and to formally assess its outcomes (Figure 26)
Such findings are unexceptional. However there are survey results which, perhaps, have less predictability.
One such is that, though, as above, larger organisations are more likely to deliver CVT and to have a formal approach to doing so, larger organisations which train do not proportionally deliver more training than do small organisations which train. Figures 3 and 6 show, respectively, no great difference between larger and smaller organisations (if they train at all) in the proportions of their workforces which receive CVT or in the average number of hours which are spent on CVT courses per employee. In essence, providing an individual works for a small business which is ‘training-minded’, he or she is as likely to train and to receive as much training as his or her counterpart in a large business.
These findings can also be considered in the light of data on the cost of training. Essentially, larger organisations can train substantially more cheaply than smaller ones. Table 8 suggests that organisations with between 10 and 49 staff had to pay an average of £950 for each person they trained compared with an average of £620 for each person trained in an organisation employing 500 or more people. The respective costs per hour of CVT were £34 and £28 (see Table 8). The reason for these variations may partially lie in unknown differences in the type of training supplied at different organisational sizes, but it seems reasonable to infer that economies of scale, discounts for volume from external suppliers of training, and/or the lower average cost of internal training, more frequently supplied by large organisations, were also significant factors.
Whatever the reasons, given that cost of training was identified as a significant barrier to training at all (by businesses which don’t train) or to training more (if they do some training), it seems likely that the higher cost of training for small businesses is part of the
15

Continuing Vocational Training Survey
equation which leads, as above, to fewer small organisations than large ones offering CVT (although, of course, various other factors, such as having small, more stable workforces or having a business model which is less demanding of training, are also powerful factors). What is also evident, and perhaps more surprising, is that when smaller organisations do train, doing so places a greater proportional demand on their overall cost base than is the case with larger organisations – since they train equal proportions of their staff for as many hours, but at a higher average cost per participant and per hour. Essentially, in this sense, it could be argued that some smaller firms have a higher commitment to training than is average for larger ones.
Industry sector and CVT
It is difficult to disentangle the effects of organisations’ location in particular sectors from those of size since there are correlations between the two – with, say, construction, business services and retail sectors containing many small organisations, whilst manufacturing, utilities and the public sector tend to have above-average sizes of organisation. Hence, observed differences between sectors in their training behaviour may be more strongly related to the average sizes of constituent organisations than to sector-specific factors as such.
However, considering sector variations, these were observable at a broad sector level. For example, comparing production sectors (agriculture, mining and quarrying, construction, manufacturing) with service sectors, shows that service sector organisations are more likely to offer CVT in any form, CVT courses (see Table 1), both internal and external CVT (Table 2), and to have various ‘training infrastructure’ elements in place such as internal training facilities (Figure 21), written training plans (Figure 22), or a training budget (Figure 23).
More detailed examinations of sectors shows that these variations, usually not great in scale in any case, are largely driven by behaviours of the financial and public sectors. These sectors tend to be more likely to do each of the things listed in the paragraph above. Again this raises the ‘size of sector organisations’ question above, since many organisations in these sectors, banks, insurance companies, hospitals, educational institutions, etc., are large. Is their higher likelihood of offering training, and of having formal systems for doing so, simply because they are large? Or do they have special characteristics [related, say, to fast moving product scenarios in financial services or to (until recently) relatively generous training budgets in public sectors, or to the many other factors which, speculatively, might be involved] which make the difference?
In addition, other survey statistics (as in respect of organisational size) show that, in these cases too, doing something at all (such as training some staff) doesn’t necessarily mean that other measures of training correlate.
Thus, for example, though public sector organisations were more likely to train at least some members of staff, the proportions of their workforces which trained (Figure 3) were below average (in public administration and education though not in health and social work) and a similar pattern was found in respect of average hours in CVT courses (Figure 6). The financial services sector was somewhat of an exception, showing ‘high training’ levels on all indicators – whether of training staff per se or of training intensity (high proportions of workforce trained, high numbers of training hours per employee).
16

Continuing Vocational Training Survey
Such analyses simply suggest that modelling the training picture in particular sectors is quite complex. The model needs to include not only the size distribution of organisations in the sector and special demands on sector employers to train (such as, say, mandatory requirements or high rates of labour turnover or of innovation) but also needs to recognise different measures of training behaviour (such as whether the organisation trains at all and the intensity with which the organisation trains) which themselves may not necessarily correlate.
Gender and CVT
Further complexity arises in understanding training patterns when the gender of trainees is considered. The key fact (see Figure 8) is that, on average, men spent more hours (24 per year) on CVT courses than did women (21 per year). This was wholly due to differences in the amount of training received by men and women in the broad production and construction sector in which men received nearly twice as much training as women. In the service sectors there was no gender difference in the average amount of time spent on CVT courses.
The explanation for the difference in production and construction can only be speculative but the survey also observed that mandatory training levels (Figure 10) and training to national qualifications (Figure 11) were particularly high in the utilities and construction sectors (which make significant contributions to the broad ‘production and construction’ sector). It may be that those types of training are substantially concerned with health and safety and environmental regulations and certification which are of particular significance to technical and manual occupations in those sectors – occupations which remain much more likely to be followed by men. Hence, women in the sectors, who are more likely to be employed in administrative functions, are, on average, less likely to be trained.
Mandatory training and training towards vocationally recognised training
Considering these forms of training more widely than their possible relationship to the gender balance of trainees, survey data conforms with patterns which would be intuitively expected.
For example, mandatory training – substantially driven, it is suggested as above, by health and safety and environmental demands, is relatively high in mining and quarrying, utility, and construction sectors and is relatively low in retail, IT, financial services sectors.
Training towards national qualifications is relatively high in the utilities and construction sectors (again, perhaps because training towards health and safety and environmental certification is implicated), in the transport and storage sector (driving and fork lift certification may be important), and in the health and social work sector (where, for example, the Care Standards Act, 2000 imposes minimum numbers of qualified staff in individual care organisations and workplaces).
Overall, the figures perhaps simply reflect what has been observed in many other surveys of training in the UK: that, whilst the UK has a mainly voluntarist approach to training, where there is a statutory or quasi-statutory requirement to train, this influence inevitably
17

Continuing Vocational Training Survey
drives significant volumes of training. This observation has led some commentators to suggest that a wider ‘licence to practice’ approach might be valuable in stimulating the UK’s overall level of training investment (although other commentators have countered that the ‘licence to practice’ approach introduces unnecessary rigidities and costs).
The nature and supply of training
Given the complexity and volume of occupations and skills, a mass survey approach, as used in this study, can scarcely hope to capture the detail of what CVT actually comprises (and, even if it could, the volume of that detail would be too great to be reported). However, some broad characteristics of CVT in the UK can be observed from the survey data. Three main points are made.
Firstly, the main providers of training sourced externally to the organisation were in the private sector. Private training providers were the main external provider for 81% of employers whilst other private companies, in their role, for example, as equipment suppliers were the main source of externally-sourced training for a further 24% of employers. Public institutions, colleges, universities and others, were the main external provider for 48% of employers. This private/public balance does not, in itself, imply any value judgement. It will mainly be the case, of course, that private trainers offer shorter courses focussed on highly specific training needs while public trainers offer longer training leading to significant and nationally-accredited vocational qualifications. It is, perhaps, simply interesting to observe that, at the interface, competition is intensifying as colleges and universities are encouraged by government and government funding to become ever more commercially aware and responsive to employer demand; and as private training companies seek accreditation to offer degrees, particularly in business management and finance, but increasingly in other vocational areas, which were formerly the preserve of publicly-funded universities. Fee structures for Higher and Further Education and for Apprenticeships introduced in recent years will clearly have further impacts on this evolving market for the CVT which UK employers outsource, these impacts not yet being wholly evident or predictable.
A second point concerns the substance and purpose of training. Figure 4 shows that 86% of employers who supplied CVT courses to their staff supplied courses directed to technical, practical or job-specific skills. Other skills supplied were of a more, though not wholly, generic nature: team working skills (supplied by 60% of employers supplying CVT courses), customer handling skills (by 57%), management skills (by 53%), problem solving skills (by 50%) and so on. When asked (Figure 5) which types of CVT courses were most important as measured by the number of hours expended, then technical, practical or job skills were identified as most important by 57% of employers, with customer handling (14%), team working (9%) and management skills (8%) falling away in relative significance. However, when asked (see Figure 17) which skills were considered as important for the development of the organisation over the next few years, team working skills were mentioned by most organisations (83%), followed by technical, practical or job-specific skills (81%), customer handling skills (80%), problem solving skills (72%), management skills (71%), and so on down a list of other types of skill.
In the latter case, service sector organisations saw all the skills as more important to future development (Figure 18) than did production and construction firms, except in the case of
18

Continuing Vocational Training Survey
technical, practical and job-specific skills which were more important to production and construction businesses than to service sector organisations.
These findings are of limited value to CVT providers in the sense that they do not contain anything like enough detail to guide the provision or design of specific courses in specific locations. They do, however, confirm a view that, while the multitude of job-specific skills of course remain critical for businesses, many skills which might be characterised as cognitive or interpersonal in nature are now recognised by many employers as being important to success and training towards them is delivered in many organisations. It might be speculated that the development of skills, such as team working or problem-solving, which were generated organically in past decades, are now more likely to be the subject of more particular or formal attention.
In looking at the type of training which employers currently supply, it is further interesting that a third, 31%, of all employers supplying CVT courses supply training in literacy or numeracy skills; and 57% of all organisations say that these skills are important to their future development. These statistics clearly relate to the debate, common in recent years in the UK, as to the adequacy of adult basic skills for the demands of the modern workplace. The second of the statistics suggests, in particular, that the issue will remain salient for some years to come.
A third point (see Figure 29) is that, in 2010, 20% of employers in the UK (those with 10 or more employees) employed one or more government-recognised Apprentices, with the figure being higher in production and construction sectors (25%) than in service sectors (18%). The reasons for doing so (Figure 30) were much more frequently positive ones (basically to secure the future skill needs of the organisation) than negative ones (such as the low cost of Apprentice labour); and where organisations did not employ Apprentices it was mainly because of lack of need rather than because of any perceived negative features of Apprenticeships. In recent years and presently, skill development through the Apprenticeship programme has been and is seen by government as an important element of national policy for business competitiveness, national economic recovery, and reducing youth unemployment. In this light it is, perhaps, reassuring to observe that a significant number of employers employ Apprentices, that they mainly do so for the ‘right’ reasons, and where they do not do so, this is largely not because of perceptions of Apprenticeship’s failings.
Barriers to training
In a similar vein, when employers who did not provide CVT were asked why not (Figure 27), and when employers who did provide CVT were asked why they didn’t provide more (Figure 28), the reasons were mainly concerned with ‘demand-side’ factors – employers felt they didn’t need training or more training, that they could recruit to meet skill gaps, or that they couldn’t afford to train or to train more because of the cost of CVT in time or cash outlay. ‘Supply-side’ failures – unavailability of suitable courses – were mentioned only by 1 in 5 or fewer employers. This latter statistic may demand some attention given its implication that the training market is unable to respond to some forms of employer demand (or, perhaps, is unable to respond at the price employers are willing or able to pay).
19

Continuing Vocational Training Survey
However, if the proposition that employers, smaller ones particularly, under-invest in training is supported, it is evident that the most significant change would come from cultural change amongst employers such that training becomes more frequently a central feature of business strategy. Recent experience has shown that, given broadly static or declining indicators3 of employer training in recent years, stimulating such change has not been easy. Various approaches have been tried. These include simple exhortation of employers to train more and government subsidies to workplace training (such as the Train to Gain and Apprenticeship programmes). Extensions to training levy systems and/or to statute-driven training have been proposed by various commentators. However, subsidies have proved expensive and their ‘additionality’ (in the case of Train to Gain) has been shown to be limited. These factors have led to withdrawal of funding completely or, as in the recent case of Apprenticeship, being limited for some Apprentice age groups; and no major levy or statutory changes have occurred. In essence, inducing employers to train employees more frequently or more intensively remains a challenge.
Recent trends in training
Of course, the challenge is particularly severe when the economy is in recession or in post-recession conditions. Thus, the survey shows (Table 6) that the proportion of employers supplying CVT rose from 87% in 1999 to 91% in 2005 but then fell back to 83% in 2010. This pattern of change was, however, differential between types of CVT. The provision of CVT courses – the most formal type of training – fell consistently across the period (offered by 76% of employers in 1999, by 69% in 2005, and by 64% in 2010). It was other types of CVT – on-the-job training, self-directed learning, and learning via conferences and workshops – which, overall, generated the rise-and-fall pattern in CVT. This perhaps suggests that alongside the effects of recession – the most probable cause of the post-2005 overall decline – there was also some shift over the period to less formal means of staff development.
There also appears to have been a further change in training behaviour between 2005 and 2010 such that (see Table 7) the average number of hours spent on CVT courses per employee per year declined (from 8.7 to 7.5 hours) but the average hours per participant rose (from 21 to 24 hours). The reasons for this apparent concentration of support to participation in CVT courses on a smaller number of participants can only be speculative but it might, just as one example, reflect lower labour turnover as workers become less mobile in conditions of economic insecurity. Hypothetically, as fewer new workers entered organisations and received training, training of newer staff might have been supplanted, to a degree by more training for existing core staff in more stable workforces, thus producing the observed ‘concentration’ effect.
A further possible effect of recession, and of a lower proportion of organisations supplying CVT, appears to have been downward pressure of costs4. Thus (see Table 9), average
3 For example, the Labour Force Survey shows that 11.2% of England’s 16-64 years population received job-related training in the four weeks prior to survey in 2004/05. This figure declined to 9.4% in 2011/12.
4 It should be noted that inflation, which affects both prices and wages, is not factored into comparisons between 2010 and 2005.
20

Continuing Vocational Training Survey
training costs per trainee rose from £650 in 1999 to £710 in 2005 but then stayed stable (at £710) to 2010; whilst costs per trainee hour, after rising from £25 in 1999 to £33 in 2005, actually fell back, to £29, in 2010. The obvious inference is that slacker demand for training depressed prices in the training market.
A final trend is, however, more encouraging. Although the trend in CVT delivery between 2005 and 2010 had, as above, some negative features, the proportion of organisations that provided CVT which took a structured approach to this rose substantially over the same period. For example, the proportion which had an annual training budget rose from 32% to 41% and the proportion which had a written training plan rose from 50% to 56%. Whilst, as suggested earlier, the challenge of increasing the overall proportion of organisations which train is a considerable one, it appears that larger proportions of those organisations which do train now do so (or at least did so in 2010) within a planned and budgeted framework.
21

Continuing Vocational Training Survey
Survey Background
Key points
The results from the European Union’s Continuing Vocational Training Survey (CVTS) are reported in this document.
The survey in the UK is part of a pan-European investigation across EU nations and is the fourth in a series undertaken at half-decade intervals.
The survey is an important resource informing the skills development policies of the European Union and of European national governments. These policies are key instruments in promoting Europe’s competitiveness and adaptation to new technologies and markets.
Fieldwork, in the form of telephone interviews of 4,600 UK employers with 10 or more employees, was undertaken between September 2011 and January 2012.
The survey mainly concerns the vocational training undertaken by those employers in the ‘reference year’ of 2010 (previous reference years of earlier editions of the survey having been 1995, 1999, and 2005).
The survey used careful sampling and a data weighting process to ensure its results are representative of the wider population of UK employers with 10 or more employees from which the sample was drawn.
Objectives
The overarching aim of the research project was to conduct a survey of UK employers to explore the nature and extent of the vocational training that they provide.
Important research issues for which CVTS data were needed include: the organisation and management of CVT in enterprises; the role of social partners; assessment of skill/training needs; volume of CVT and possible interaction with IVT; incentives for enterprises to provide CVT; costs and financing of CVT in enterprises; obstacles for enterprises in providing CVT; and the costs and financing of CVT in enterprises.
The survey has been carried out so that it conforms to the requirements of the European Union’s Continuing Vocational Training Survey (CVTS4).
Survey background
This report is based upon results derived from the fourth round of the EU Continuing Vocational Training Survey (CVTS4) undertaken in the UK between September 2011 and January 2012, and covering the reference period of the 2010 calendar year. The research was administered by BMG Research on behalf of the Department for Education (DfE) and Department for Business, Innovation and Skills (BIS).
22

Continuing Vocational Training Survey
This round (CVTS4) followed previous surveys carried out in 1995, 2000 and 2005, and formed part of a wider investigation spanning around 30 European countries. The Statistical Office of the European Commission (Eurostat) undertook co-ordination of the study and will publish results in late 2013, allowing a comparison of the UK against other European countries.
The previous round of CVTS (CVTS3, 2005) indicated that investment by UK employers in training was relatively widespread but those efforts were spread thinly, whilst other countries typically saw training focussed more intensively on a smaller number of workers. Although a high proportion of UK employers provided training courses, the shorter average duration meant this translated into a relatively low level of investment per hour worked.
Policy background
The UK Context
The Continuing Vocational Training Survey, reflecting on CVT in 2010, does so in a context in which UK government policy towards post-16 learning and skills continued to change. Prior to the advent of the Coalition Government in May 2010, there had been some centralisation of the administrative arrangements for support to skills development. Local offices of the Learning and Skills Council (LSC) were closed and later the LSC itself was disbanded and its functions distributed amongst the Skills Funding Agency, the National Apprenticeship Service, and the Young People’s Learning Agency (YPLA).
With the advent of the Coalition Government, there was further administrative change with the closure of the YPLA and transfer of its functions to the Education Funding Agency. More substantively, the Government published two policy documents in late 2010: ‘Skills for Sustainable Growth’ and ‘Investing in Skills for Sustainable Growth’. These identified government objectives for national policy as including those of encouraging employers and individuals to take more responsibility for skills development, reduction of bureaucracy and abandonment of targets, and simplification of funding systems.
In practical terms, funding for Further Education has been reduced with FE Colleges being encouraged to find compensatory forms of income, whilst there has been a substantial and successful government push to expand Apprenticeship numbers. The Richard review of apprenticeships5 recently set out proposals for further changes to the funding and provision of apprenticeships.
The European context
In its efforts to promote competitiveness, the EU seeks to adapt its societies and economies to structural change by encouraging redeployment of jobs and resources to emerging economic sectors and responding to changing requirements for skills. A major impetus was given by the Lisbon Council 2000 which stressed the need to undertake major economic and social reforms as part of a strategy combining competitiveness of the EU with social cohesion (Council of the EU, 2000). The Council stressed that achieving this goal includes:
5 https://www.gov.uk/government/uploads/system/uploads/attachment_data/file/34708/richard-review-full.pdf
23

Continuing Vocational Training Survey
(a) Transition to a knowledge-based economy and society by accelerating structural reform;
(b) modernising the European social model, investing in people, and combating social exclusion.
The Lisbon agenda was renewed in 2005 (Council of the EU, 2005). The Council set three priority areas: the knowledge society, the internal market, and the climate for business. It recommended, in particular, substantial investment in R&D and in education and training. In following up the Lisbon agenda 2000, countries worked together through the open method of coordination and set up several initiatives to achieve these goals, for example:
(a) The creation of a Competitiveness Council (Council of the EU, 2002a) focusing on the internal market (free movement of persons and goods), industry (adjustment to structural change, innovation) and research;
(b) the Education and Training 2010 work programme (2002) which defined common objectives and benchmarks for modernising European education and training systems to be achieved by 2020 (Council of the EU, 2009); a follow-up to the earlier Education and Training 2010 work programme launched in 2001. These concern: reduction of early school leaving; increasing graduates in mathematics, science and technology while reducing gender imbalance amongst those who pursue degrees in these subject areas; increasing completion of upper secondary education; reducing the number of low-achieving pupils in reading literacy; increasing the participation of adults in lifelong learning; and the call to invest more in human resources;
(c) the Copenhagen process (European Commission, 2002a) calling for enhanced cooperation in vocational education and training (VET). This includes: prioritising the European dimension of VET; transparency, information and guidance; recognition of competences and qualifications; quality assurance; and VET teachers and trainers;
(d) the Integrated guidelines for growth and jobs (2008-10) (European Commission, 2007d), giving higher priority to the social dimension, flexibility policies, energy and climate change, and to education and skills as major elements in modernising European markets, promoting innovation and ensuring equal opportunities for citizens;
(e) the Council resolution on new skills for new jobs (Council of the EU, 2007) which defines education and training, in the context of lifelong learning, as ‘indispensable means for promoting adaptability and employability, active citizenship, and personal and professional fulfilment. They facilitate free mobility for European citizens and contribute to the achievement of the goals and aspirations of the EU, as it seeks to respond to the challenges posed by globalisation and an ageing population.’
Assessing whether these policy goals have already had effects on increasing the competitiveness and performance of the EU compared with its competitors is not possible overall. No single indicator is able to prove whether or not a country, or Europe as a whole,
24

Continuing Vocational Training Survey
is generally performing well. For the EU, an additional problem lies in the heterogeneity of its Member States: whereas some are performing above average or even belong to the top performers worldwide for a particular indicator, others belong to a lower level.
Essentially, progress towards competitiveness has to be measured by reference to multiple indicators, not only of ‘competitiveness outputs’ (say, those indicating productivity, employment, or innovation) but also of ‘competitiveness inputs’ – the behaviours and activities of national governments, employers and individuals which develop competitiveness at the level of the firm, of regional and national economies, and ultimately of Europe itself.
Vocational education and training (VET) is one such ‘behaviour’ which is recognised as an important and flexible element of lifelong learning, rapidly connecting changing labour-market demands with relevant education and practically-oriented learning at the workplace. The strategic statement for European policies laid down in the Bordeaux communiqué of November 2008 (European Commission, 2008) recognised this fundamental role of vocational education and training.
Thus, technological progress and structural labour-market change demand not only anticipation of new skill needs but also continuously renewing and adapting knowledge, skills and competences within an ageing labour force (Cedefop, 2008). Continuing vocational training provided by enterprises is at the heart of this process, helping to simultaneously raise productivity, modernise work practices, and facilitate innovation. Promoting training in enterprises needs in-depth insights into training policies and practices in enterprises, the role of social partners and the relevance of various public instruments.
More particularly, enhanced cooperation in vocational education and training in the European Union requires the improvement of VET statistics as a priority. Adequate statistics and indicators are the key to the review of developments in VET, and to understanding of what additional interventions and decisions are required from all parties involved in seeking to achieve the Copenhagen objectives.
The Continuing Vocational Training Survey is a particular and specific source of pan-European information for VET research: its data are indispensable to analysis of the conditions, structure and development of continuing vocational training in enterprises. Characteristics of enterprises and participants in CVT broaden the basis and enlarge the scope for detailed analysis. Analytical results test hypotheses on training behaviour of enterprises (and to a certain extent of individuals), on different forms of continuing vocational training, on organisational and human resource development, and on the impact of public measures on vocational education and training.
25

Continuing Vocational Training Survey
Methodology
The universe under investigation
For the purposes of the research, the population from which the sample was drawn was defined as follows:
Enterprise-based (that is, the whole organisation where it operates from more than one site);
Excluding organisations with fewer than 10 employees;
The UK survey encompassed the full range of industry sectors. Industry sector was defined using NACE Rev. 2 definitions in order to ensure consistency with other participating EU and non-EU nations. NACE Rev. 2 and the UK Standard Industrial Classification 2007 (SIC 2007) exactly match6. The industry sectors included in the survey are summarised in the table below:
NACE SIC 2007 NACE/SIC description7
A 1-3 Agriculture, forestry and fishing
B05-B09 5-9 Mining and quarrying and support activities
C10-C12 10-12 Manufacture of food products, beverages and tobacco
C13-C15 13-15 Manufacture of textiles and textile products Manufacture of leather and leather products
C17-C18 17-18 Manufacture of pulp, paper and paper products, Printing of newspapers
C19-C23 19-23 Manufacture of coke oven products Manufacture of flat glass
C24-C25 24-25 Manufacture of basic iron and steel and of ferro-alloys Manufacture of metal structures and parts of structures
C26-C28 and C33 26-28, 33
Manufacture of electronic components, Repair of fabricated metal products Manufacture of engines and turbines, except aircraft, vehicle and cycle engines
C29-C30 29-30 Manufacture of motor vehicles, Building of ships and floating structures
C16+C31-C32 16, 31, 32 Sawmilling and planing of wood, Manufacture of office
6 Source: UK Standard Industrial Classification of Economic Activities 2007 (SIC 2007): Structure and Explanatory Notes Office for National Statistics, December 2009
7 “The UK SIC is based exactly on NACE but, where it was thought necessary or helpful, a fifth digit has been added to form subclasses of the NACE four digit classes.” UK Standard Industrial Classification of Economic Activities 2007 (SIC 2007): Structure and Explanatory Notes. Office for National Statistics, December 2009
26

Continuing Vocational Training Survey
NACE SIC 2007 NACE/SIC description7 and shop furniture, Striking of coins
D-E 35-39 Electricity, gas, steam and air conditioning supply, Water supply; sewerage, waste management and remediation activities
F 41-43 Construction
G45 45 Sale of cars and light motor vehicles
G46 46 Agents involved in the sale of agricultural raw materials, live animals, textile raw materials and semi-finished goods
G47 47 Retail trade in non-specialised stores with food, beverages or tobacco predominating
H 49-53 Transportation and storage
I 55-56 Accommodation and food service activities
J 58-63 Information and communication
K64-K65 64-65 Financial and insurance activities, Life insurance
K66 66 Administration of financial markets
L + M + N + R + S 68-82, 90-96
Real estate, renting and business activities, Professional, scientific and technical activities, Administrative and support service activities, Arts, entertainment and recreation, Other service activities
O 84 Public administration
P 85 Education
Q 86-88 Human health and social work
The European standard questionnaire was used as the basis for the survey with additional questions added in this UK survey. This was mainly in order to maximise the opportunity to obtain key data regarding the total number of hours worked by employees and the total labour costs within an organisation. Some questions were re-worded in order that they might be clearer and more relevant to UK employers. The questionnaire employed is included in the Appendix.
Sample completed
In total, 4,604 interviews were conducted. The majority of interviews were completed using Computer-Assisted Telephone Interviewing (CATI). On average, interviews took 28 minutes to complete. However, the average interview length varied for training and non-training organisations, with interviews with non-training organisation taking considerably less time because of the greater number of questions focused towards training practices.
Interviews were conducted with the most senior person at the site in charge of training policy. This was further defined as the person who decides what training providers to use or who has the best knowledge of what vocational training is carried out across all sites within the organisation.
27

Continuing Vocational Training Survey
A small number of online surveys were completed as well as some face to face interviews with respondents in large organisations.
Data context
The sample structure was calculated to specifications designed by the Statistical Office of the European Community (Eurostat) to ensure consistency of approach across all participating countries.
The sample definition (that is, the number of responses to be achieved from each sector/size group in the total prescribed sample of 4,600 cases) was developed from data on the sector and size characteristics of the population. This information was obtained from IDBR (ONS).
The CVTS4 Manual provided detailed instructions for determining the sample structure and target numbers. This is included in the Technical Report which is available separately.
Response rates
Whilst in calculating the likely sample that will be achieved from a set of contacts, an overall estimated response rate is assumed, in reality the response rate varies between NACE/size cells. The number of achieved interviews against the targets set was monitored by NACE/size and steps taken to maximise response rates. These steps involved calling at varying times and on varying days of the week; evening and weekend interviewing was carried out where necessary; appointments were made with potential respondents; and contacts were called at least 10 times before being discarded as a non-response.
A response rate of 35% was achieved overall. This response rate does not take into account cases where repeated calls were made but interviewers were unable to speak to someone to ask them to take part in the survey. When these calls are taken into account and only the ‘contacted’ sample is used to calculate the figure, the response rate was 55% overall.
Treatment of non-response
There were two types of non-response:
Unit non-response, where no survey data were collected for a unit (i.e. a business).
Item non-response, where some data were collected for a unit but some responses to certain questions were missing.
The sampling process was based on issuing a predetermined number of contacts and these contacts being called repeatedly until they either completed an interview or opted out of the survey (i.e. refused to take part). There were other call outcomes and a full breakdown of these is available in the Technical Report which is available separately.
28
Continuing Vocational Training Survey
The consequence of unit non-response was varied response rates across sector and size categories. If not addressed, some sector and size categories would be over-represented and some under-represented in the data. This is most simply illustrated by the following example: Since large organisations are fewer in number in the population, to obtain a statistically robust sub-sample of these organisations a higher proportion of the population is interviewed than is the case for the vastly more numerous small organisations. By applying weighting factors to the data, the responses of larger organisations are scaled down so that the data is not biased in representing their views. This is of particular importance when reviewing training and business planning practices as the incidence of both tends to increase with organisation size. The employer population estimates from IDBR, which were used to determine the sample structure, were also used to provide the weighting factors. Thus, weighting factors are based on the business population and not on the distribution of employment. These factors are presented in the Technical Report.
Item non-response was dealt with through the process of imputation. Where there is a missing value, a value was imputed. This process followed guidance given in the CVTS4 Manual.
The following variables were deemed to be key to the survey findings and were those in which imputation was permitted:
A3 Total number of persons employed at end of 2009 A4 Total number of hours worked in 2010 by persons employed
A5 Total labour costs (direct and indirect) of all persons employed in 2010
C1tot Total CVT course participants C3tot Paid working time (in hours) spent on all CVT courses C7sub CVT costs sub-total C7tot Total costs CVT PAC Personal absence costs
In addition imputations were allowed and were carried out on the following variables (reference in questionnaire in Annex to this report):
A2m, A2f, A3tot, A4, A5, B2a, B2b, B2c, B2d, B2e, B5a, b5b, C1tot, C2m, C2f, C3tot, C3i, C3e, C4, C7a, C7b, C7c, C7d, C7sub, C7tot, PAC, F1tot
Impact of imputation and estimation
It should be noted that the process of imputation and the fact that some respondents could only estimate some characteristics of their training (such as its costs or the amount of time which employees spent in training) introduces a margin of error into the data (over and above normal sampling error). Some estimates in the survey should, therefore, not be read as having pinpoint accuracy but as general indications of employer behaviour.
Standard error and confidence intervals
In an ideal world when views are sought, everyone would be asked. This would involve a census. It is an expensive approach and time-consuming and impractical, as it is very difficult to get hold of everyone in a target population. Consulting a sample of a target
29

Continuing Vocational Training Survey
population is more cost-effective and achievable but does introduce a level of standard error, where the statistics gathered from a sample of the target population deviate from those that would be gathered from a census.
Standard error is calculated on the basis of two different elements; the sample size and the statistic itself. The larger the sample, the smaller the size of the standard error. The maximum standard error for a given sample is based on a statistic of 50%. The standard error is usually calculated to a confidence level of 95% (i.e. we can be confident that 95% of responses would fall within a given range of responses). Based on a reported statistic of 50%, the overall sample of 4,604 for this survey is subject to a standard sampling error of +/-1.44%. Thus, if all businesses within the population were asked, we would be 95% confident that the reported statistic would fall within a range of 49.56% to 51.44%.
A table which presents the level of standard error for a range of statistics, based on the total sample and key sub-samples, is included in the Appendix.
Unless otherwise stated, discussion with regard to trends within sample groups (i.e. by organisation size or industry sector), comparisons between sub-samples with the survey average and comparisons between the results of CVTS4 and results from previous CVT surveys is confined to where differences are statistically significant at a 95% confidence level.
Note on rounding
Throughout this report percentages have been rounded to the nearest whole integer. Furthermore average cost and cost per hour figures have been rounded to the nearest 10. The exceptions to rounding concern hourly costs and values for hours spent in training. These have been reported to two decimal points (in the case of figures that are based on £ sterling) and to one decimal point (in the case of figures that relate to parts of hours). This enables the reporting of small differences between sample groups.
Definitions
The definitions of Continuing Vocational Training and Initial Vocational Training should be noted before reading the remainder of this report. The definitions of other terms used in the survey questionnaire are included in the Appendix.
Definition of Continuing Vocational Training
Before being asked questions about training within the organisation, respondents were given the definition of Vocational Training as follows:
Vocational Training is training that would have been arranged for employees in advance, it would have been organised with a specific goal of developing new or existing competences and skills, and it would have been fully or at least partly funded by your organisation. Funding would include the paid time at work employees were involved in the training. Vocational Training would normally be delivered by a trainer or a coach and if not, a piece of equipment, such as a computer, would be used for the training.
30

Continuing Vocational Training Survey
Vocational Training does not include training for apprentices or new employees. Trainees, people working on a training contract and inductions are not included in Vocational Training.
To summarise:
The training must be planned in advance.
The training must be organised or supported with the specific goal of learning.
The training must be financed fully or at least partly by the enterprise.
Definition of Initial Vocational Training
Initial Vocational Training (IVT) is where the main activity of the person should be to study or to train leading to a formal qualification. CVTS4 did not cover IVT in as much detail as previous CVTS. Within CVTS4, the coverage was limited to information regarding the employment of individuals on a Government recognised apprenticeship leading to a formal qualification.
31

Continuing Vocational Training Survey
Continuing Vocational Training Provision
Key Points
83% of employers provided their staff with some form of Continuing Vocational Training (CVT) in 2010.
64% of employers provided CVT courses, as opposed to less formal forms of CVT (such as workshops, job-rotation, on-the-job training, or self-directed learning).
The provision of all forms of CVT was more frequent in larger employers and in Service sectors rather than Production and Construction sectors.
42% of employers provided CVT courses internally to their organisation. 54% provided CVT courses delivered by an external provider. Though less likely to provide CVT courses overall, small employers, having lesser internal resource, were proportionately more reliant on external provision.
Where external provision was used, private training companies were the main source and were used significantly more often than publicly-funded colleges or universities.
Of the less formal methods of CVT, guided on-the-job training was, by a wide margin, the most significant, being provided by 62% of all employers.
CVT was provided by 87% of employers in 1999 and by 91% in 2005. Although the Survey does not directly investigate the issue, it is likely that the subsequent decline (to 83%) in 2010 reflects difficult economic circumstances from 2008 onwards.
Overview of provision of Continuing Vocational Training
The majority of organisations (83%) participated in some form of Continuing Vocational Training (CVT), with two-thirds of all (64%) providing CVT courses. The propensity to do so increased with organisation size, as shown in Table 1.
32

Continuing Vocational Training Survey
Table 1: C1-C10 Provision of Continuing Vocational Training (CVT), including CVT courses and other forms of CVT, in 2010 overall and by organisation size and broad industry sector (all organisations)
Total
10-49 em
plo
yees
50-249 em
plo
yees
250-499 em
plo
yees
500+
emp
loyees
Pro
du
ction
(A
-F)
Services (G
-S)
Any form of CVT 83% 81% 94% 97% 99% 81% 84%
CVT courses 64% 61% 77% 85% 89% 60% 66%
Other forms of CVT
78% 75% 89% 95% 99% 76% 79%
Both 59% 56% 73% 82% 89% 55% 61%
Neither 17% 19% 6% 3% 1% 19% 16%
Unweighted sample bases
4604 2678 1043 380 503 1861 2743
CVT courses which organisations provided were more likely to have been externally than internally provided. However, as organisation size increases, provision of internal CVT courses increased until, in the largest organisation, internal provision overtakes provision of external CVT courses in frequency of occurrence.
Three in ten organisations (30%) provided both internal and external CVT courses in 2010. This increased to two-thirds (65%) of organisations with 500 or more employees (see Table 2).
33

Continuing Vocational Training Survey
Table 2: C1 Whether organisations provided internal or external CVT courses in 2010, overall and by organisation size and broad industry sector (all organisations)
Total
10-49 em
plo
yees
50-249 em
plo
yees
250-499 em
plo
yees
500+
emp
loyees
Pro
du
ction
(A
-F)
Services (G
-S)
Internal 42% 37% 59% 71% 80% 37% 43%
External 54% 51% 65% 73% 76% 49% 56%
Both 30% 25% 46% 59% 65% 26% 31%
Either 64% 61% 77% 85% 89% 60% 66%
Neither 36% 39% 23% 15% 11% 40% 34%
Unweighted sample bases
4604 2678 1043 380 503 1861 2743
Internal Continuing Vocational Training courses
Just over two-fifths of organisations (42%) provided internal CVT courses for their staff during the calendar year 2010. This proportion increases with organisation size to 80% of 500+ organisations and was higher amongst organisations in Service sectors than amongst those in Production and Construction sectors (43%, compared with 37%).
The provision of internal CVT courses was also significantly higher in Public Administration, Education and Health and Social Work sectors (see Figure 1).
34

Continuing Vocational Training Survey
Figure 1: C1a Provision of internal Continuing Vocational Training courses in 2010 by organisation size and industry sector (all organisations) Unweighted sample bases in parentheses
External Continuing Vocational Training courses
More than half of organisations (54%) provided external CVT courses for their staff in the calendar year 2010. Again, this increases with organisation size, but the gap between the smallest and largest organisations in this respect was narrower than observed for internal CVT courses.
35

Continuing Vocational Training Survey
Organisations in Service sectors were significantly more likely than those in Production and Construction sectors to have provided external CVT courses (56%, compared with 49%). As, was the case with regard to internal CVT courses, provision of external CVT courses in Public Administration, Education and Health and Social Work was far higher than in other sectors, with the majority having done so in 2010.
Figure 2: C1b Provision of external Continuing Vocational Training courses in 2010 by organisation size and industry sector (all organisations) Unweighted sample bases in parentheses
36
Continuing Vocational Training Survey
Use of external Vocational Training providers
Organisations that provided external Vocational Training courses were asked which training providers their organisation had used.
Generally, the larger the organisation, the more likely it was that a variety of types of providers was used (see Table 3).
Private training companies were mentioned by 81% of organisations, increasing to 92% in organisations with 500 or more employees.
The use of schools, colleges, universities and other higher education institutions was significantly less frequent overall, but increased in significance for larger organisations, with 75% of 250-499 employers and 79% of 500+ employers using these providers.
In terms of shares of hours provided by different types of provider (not tabulated), the same general distinction applies. Private training companies supplied a significantly higher proportion of hours (55% of the total) than schools, colleges, universities and other higher education institutions (which supplied 23% of hours). No other type of provider supplied as much as 10% of external training hours.
37

Continuing Vocational Training Survey
Table 3: D11/D12 Training providers used for external Vocational Training courses, by organisation size and broad industry sector (where employees participated in external CVT courses) - prompted *denotes less than 0.5%
All
10-49 emp
loyees
50-249 emp
loyees
250-499 em
plo
yees
500+ em
plo
yees
Pro
du
ction
(A-F
)
Services (G
-S)
Main used
Private training companies
81% 78% 88% 88% 92% 81% 81% 55%
Schools, colleges, universities and other higher education institutions
48% 44% 57% 75% 79% 48% 48% 23%
Public training institutions (financed or guided by the government; e.g. adult education centres)
31% 29% 33% 43% 41% 21% 33% 9%
Private companies whose main activity is not training (e.g. equipment suppliers, parent/ associate companies)
24% 23% 27% 32% 29% 28% 23% 5%
Employer's associations, chambers of commerce, sector bodies
19% 17% 22% 32% 26% 21% 18% 4%
Trade unions 2% 1% 3% 9% 18% 2% 2% *%
Other Training Providers *% *% *% 0% 0% 1% *% 3%
None 1% 1% 1% 1% *% 1% 1% -
Unweighted sample bases 2682 1345 671 278 388 972 1710 2652
38

Continuing Vocational Training Survey
Other forms of Continuing Vocational Training (i.e. other than CVT courses)
Around four-fifths of organisations (78%) participated in some other form of CVT during the calendar year, 2010. This proportion increased from 75% amongst 10-49 employee organisations to 95% or more of those with 250 or more staff.
Organisations in Service sectors were significantly more likely than those in Production and Construction sectors to have provided opportunities for staff to attend conferences or the like and to participate in self-directed learning.
Table 4: C2-C10 Provision of other specified forms of Continuing Vocational Training in 2010, by organisation size and broad industry sector (all organisations)
Total
10-49 em
plo
yees
50-249 em
plo
yees
250-499 em
plo
yees
500+
emp
loyees
Pro
du
ction
(A
-F)
Services (G
-S)
Guided on-the-job training
62% 59% 75% 82% 92% 64% 61%
Job rotation, exchanges, secondments or study visits
18% 15% 23% 43% 58% 19% 17%
Participation in learning and quality circles
18% 15% 25% 34% 43% 14% 19%
Self-directed learning (e.g. self directed e-learning)
30% 28% 37% 55% 68% 18% 34%
Attendance at conferences, workshops, trade fairs and lectures etc
51% 47% 64% 76% 83% 38% 55%
Any 78% 75% 89% 95% 99% 76% 79%
None of these 22% 25% 11% 5% 1% 24% 21%
Unweighted sample bases
4604 2678 1043 380 503 1861 2743
39

Continuing Vocational Training Survey
More detail of the characteristics of provision of the different forms of ‘other’ Continuing Vocational Training is set out in brief sections following.
On-the-job training
Nearly two-thirds of organisations (62%) involved their employees in guided on-the-job training during 2010. This increased to 92% of 500+ organisations, reflecting the general pattern of increasing propensity to provide training as organisation size increases.
The proportion was similar in both Production and Construction and Service sectors (64% and 61% respectively). However, the incidence of on-the-job training was particularly high in Public Administration (80%), Education (75%), Health and Social Work (77%) and Finance/Insurance (66%).
Job-rotation, exchanges, secondments or study visits
One in six organisations (18%) reported that their staff had been involved in planned training through job-rotation, exchanges, secondments or study visits in 2010. This increased to around three-fifths (58%) of 500+ organisations.
The proportion was similar in Production and Construction and Service sectors (19% and 17% respectively) when considered as very broad sector groupings but, in more detailed sector breakdowns, was higher than average in Public Administration (43%), Education (31%), Finance and Insurance (25%), Health and Social Work (24%), Utilities (23%) and Manufacturing (22%) sectors.
Very few organisations in Transport and Storage (12%) and Construction (13%) sectors took this approach to training their staff in 2010.
Attendance at conferences, workshops, trade fairs and lectures
Around half of organisations (51%) involved their employees in planned training through attendance at conferences, workshops, trade fairs and lectures in 2010. The proportion gradually increases from 47% of organisations with between 10 and 49 staff to 83% of those with 500+ staff.
The propensity to attend conferences, workshops, trade fairs and lectures was significantly higher in Service sectors than in Production and Construction sectors (55%, compared with 38%). It was particularly high in Public Administration (86%), Education (79%), Finance and Insurance (74%) and Health and Social Work (72%). Organisations in Construction (33%) and Transport and Storage (33%) sectors were much less likely than average to provide Continuing Vocational Training in this way.
Learning and quality circles
One in six organisations (18%) provided planned training through participation in learning or quality circles during 2010. The proportion increased to 42% of organisations with 500+ staff.
40

Continuing Vocational Training Survey
Participation in learning or quality circles was more prevalent in Service sectors (19%) than in Production and Construction sectors (14%). Use of this approach to planned training was significantly higher in Public Administration (38%), Education (43%) and Health and Social Work (34%). Very few Construction (9%) and Accommodation and Food Services (9%) organisations used this approach.
Self-directed learning
Three in ten organisations (30%) reported that employees took part in planned training by self-directed learning in 2010. Once again, this proportion increased with organisation size from 28% of organisations with between 10 and 49 employees to 68% of those with 500+ staff.
Organisations in Service sectors were twice as likely to report self-directed learning as those in Production and Construction sectors (34%, compared with 18%). In more detail, self-directed learning was most prevalent in the sectors of Public Administration (64%), Education (60%) and Finance and Insurance (56%) sectors. Levels of self-directed learning were low in the Construction (13%) and Utilities (16%) sectors.
Participant number in ‘other’ Continuing Vocational Training
In terms of participant numbers (rather than, as in Table 5 and the following analysis, of proportions of organisations supplying different forms of ‘other’ CVT), guided on-the-job training involved the highest proportion of trainees (53%) followed by self-directed learning (18%). While (as in Table 5) the incidence of most forms of Continuing Vocational Training increased with organisation size, personal learning from attendance at conferences and similar and participation in learning and quality circles were higher as shares of all ‘other’ Continuing Vocational Training provided in smaller organisations than of that provided by larger ones.
41

Continuing Vocational Training Survey
Table 5: C3-C11 Proportion of trainees participating in other specified forms of Continuing Vocational Training, by organisation size and broad industry sector (all trainees)
Total
10-49 em
plo
yees
50-249 em
plo
yees
250-499 em
plo
yees
500+
emp
loyees
Pro
du
ction
(A
-F)
Services (G
-S)
Guided on-the job-training
53% 43% 52% 51% 56% 56% 52%
Job-rotation, exchanges, secondments or study visits
7% 8% 7% 7% 7% 18% 5%
Attendance at conferences, workshops, trade fairs and lectures
16% 23% 20% 17% 12% 12% 16%
Participation in learning or quality circles
7% 12% 9% 8% 4% 6% 7%
Self directed learning (e.g. self-directed e-learning
18% 14% 12% 17% 21% 8% 20%
Total trainees 12005268 2167901 1724920 939519 7172928 1984230 10021038
Comparisons with CVTS2 and CVTS3
Finally, the overall trend in Continuing Vocational Training is reported. The basic pattern is one in which the proportion of organisations supplying Continuing Vocational Training in any format increased from 1999 to 2005, with most particular forms of Continuing Vocational Training (except formal courses and job rotation) increasing in frequency of use.
However, since 2005, the overall frequency of provision of Continuing Vocational Training has fallen back below the level of 1999 and all particular forms of Continuing Vocational Training were used less frequently in 2010 than in 2005.
The reasons for this were not directly addressed by the survey but the obvious (though speculative) one is that recession has reduced Continuing Vocational Training provision as
42

Continuing Vocational Training Survey
employers sought to minimise costs, or had less confidence that training investment would pay future dividends, or, with less job mobility, retained more experienced and fully qualified staff.
It should be noted that the Employer Skills Survey 20118 found that the proportion of employers in England providing training had been more consistent between 2005 and 2011 (albeit using different definitions and coverage to CVTS).
Table 6: Provision of Continuing Vocational Training (all organisations)
percentages
Unweighted sample bases
All forms
of CVT
Co
urses (in
ternal an
d
external)
Train
ing
in w
ork
situatio
n/o
n-th
e-job
Co
nferen
ces, w
orksh
op
s and
sem
inars
Job
rotatio
n etc
Self-d
irected learn
ing
Learn
ing
gro
up
s and
q
uality circles
1999 – CVTS2 941 87% 76% 63% 52% 35% 30% 24%
2005 – CVTS3 4260 91% 69% 76% 63% 29% 39% 22%
2010 – CVTS4 4604 83% 64% 62% 51% 18% 30% 18%
8 http://www.ukces.org.uk/assets/ukces/docs/publications/ukces-employer-skills-survey-11.pdf
43

Continuing Vocational Training Survey
Participation in Continuing Vocational Training
Key Points
Around a third of employees (31%) participated in CVT courses in 2010. This compares with 34% in 2005.
The average number of hours on CVT courses by employers during 2010 was 1,020 (statistically similar to the 2005 average of 1,034).
In relation to hours worked, hours on CVT courses accounted for less than 1%.
The average number of hours spent on CVT courses per employee was 7.5 hours (slightly below the average of 8.7 hours in 2005).
The average number of hours spent on CVT per participant was 24 (above the average of 21 in 2005). The inference is that employers allocated a stable volume of training to a somewhat lower number of employees.
On average, male trainees spent more hours (24 hours) on CVT courses than female trainees (21 hours).
28% of all hours on CVT courses were devoted to mandatory training (such as that related to health and safety).
31% of all hours on CVT courses were on courses leading to a nationally recognised qualification.
Technical, practical and job-specific skills are the most important in terms of the focus of CVT courses.
Overview of participation in Continuing Vocational Training
Proportion of the workforce participating in Continuing Vocational Training
A third of all employees (31%) participated in CVT courses during 2010. Participation in CVT courses increased slightly with organisation size. 29% of the workforce in organisations employing between 10 and 49 staff participated in CVT courses, compared with 33% of all employees in organisations with 250 or more staff.
The proportion was lower in Production and Construction sectors than in Service sectors (28%, compared with 32%).
44

Continuing Vocational Training Survey
Figure 3: D1 Proportion of the total workforce that participated in Continuing Vocational Training in 2010 (all employees) Weighted sample bases in parentheses
45

Continuing Vocational Training Survey
Skills/competences developed
Respondents were asked about the skills/competences that they were looking to develop through the provision of CVT courses in 2010. The most frequently mentioned (from a list of prompted responses) were technical, practical or job-specific skills (86%). Although, many of the skills/competences listed were mentioned significantly more by larger organisations, technical, practical or job-specific skills were of similar importance across all size bands (ranging from 85% of 10-49 employers to 91% of 500+ employers).
Figure 4: D7 Skills/competences that organisations were looking to develop through the provision of Vocational Training courses in 2010 – prompted, multiple response (Organisations that provided CVT courses) Unweighted sample base = 3,244 *denotes less than 0.5%
86%
60%
57%
53%
50%
38%
32%
32%
31%
14%
7%
*%
Technical, practical or job-specific skills
Customer handling skills
Team working skills
Management skills
Oral or written communication skills
General IT skills
IT professional skills
Problem solving skills
Numeracy and/or literacy skills
Office administration skills
Foreign language skills
Other
Areas of skills/competences that are particularly likely to be developed by larger organisations, compared with those with fewer employees include:
46

Continuing Vocational Training Survey
General IT skills (e.g. using a computer, word processing, electronic diary, simple spreadsheets or the internet): 29% of 10-49 employers; 60% of 500+ employers
IT professional skills (e.g. specialist knowledge or understanding such as producing web pages and writing complex programmes): 11% of 10-49 employers; 42% of 500+ employers
Management skills (e.g. leading and managing staff, planning the activities of others): 48% of 10-49 employers; 86% of 500+ employers
Office administration skills (e.g. invoicing, time-management): 28% of 10-49 employers; 58% of 500+ employers
By sector, organisations with Service sectors are significantly more likely than those in Production and Construction sectors to have been looking to develop:
Customer handling skills (e.g. dealing with customers, persuading or influencing others): 62% of Service sector organisations; 36% of Production and Construction sector organisations
Oral or written communication skills (e.g. English, including making speeches or presentations, reading long documents such as long reports, manuals, articles or books): 41% of Service sector organisations; 24% of Production and Construction sector organisations
Team working skills (e.g. dealing with colleagues, working together): 62% of Service sector organisations; 49% of Production and Construction sector organisations
Respondents specifying any of these skills or competences were asked which had been the most important to the organisation in terms of the number of all training hours on CVT courses within paid working time.
Again, technical, practical or job-specific skills are most frequently cited (57%), with customer handling skills next most common but much less frequently mentioned (14%).
47

Continuing Vocational Training Survey
Figure 5: D8 Skills/competences that were most important in relation to the number of all training hours spent on Vocational Training courses within paid working time in 2010 – prompted, multiple response (where specified) Unweighted sample base = 3,199 *denotes less than 0.5%
Time spent on Continuing Vocational Training courses
Organisations whose employees participated in CVT courses in 2010 were asked about the number of hours they spent doing so. The average number of paid working hours spent on CVT courses in 2010 (summed for all employees in the organisation who took part) was 1,020.
One in seven organisations (14%) reported that their employees (in total) spent between 1 and 35 hours on CVT courses, whilst just 4% reported that their employees (in total) spent 3,500 or more hours on courses in 2010.
48

Continuing Vocational Training Survey
The number of hours in Continuing Vocational Training by organisation was largely determined by organisation size, since the number of participants and, therefore hours spent in total in CVT, generally increases with size. The average by organisation ranged from 250 hours in organisations with between 10 and 49 employees to 1,100 hours in organisations with 50 and 249 employees to 3,000 in organisations with 250 to 499 to just over 20,000 hours in the largest organisations (500 or more employees).
Services sector organisations reported a higher average of total employee hours spent on CVT courses than those in Production and Construction sectors (1,070 hours, compared with 830 hours). The average was particularly high in Public Administration (5,200), Transport and Storage (3,100) and Education (2,100). The high averages in Public Administration and Education reflect large organisation sizes, whilst in Transport and Storage there is a high volume of training in regard to occupational health and safety.
The average was lowest in Agriculture (270 hours) and Manufacturing (790 hours).
Of the total number of hours worked during the calendar year 2010 in organisations that provided Continuing Vocational Training, the average number of hours spent on Vocational Training accounted for less than 1% (0.4%).
There was little difference by organisation size and sector in this respect.
In terms of the number of hours spent on CVT courses per employee in organisations that provided course-based vocational training, the average was 7.5 hours. (Note: This average is calculated on a base of all employees in the organisation not just those employees who undertook CVT courses).
The average number of hours spent on CVT courses per employee decreased as organisation size increases from 7.9 hours in organisations employing between 10 and 49 employees to 6.9 hours in organisations employing 500 or more people.
The average figure was similar in both Production and Construction (7.1) and Services (7.6) sectors but, in more detail, was notably higher in the Construction (12.2) and Transport and Storage (11.3) sectors and considerably lower in Mining and Quarrying (3.8) and Public Administration (4.2) and Accommodation and Food Services (4.6) sectors.
49

Continuing Vocational Training Survey
Figure 6: D4 Average number of hours spent on CVT courses per employee, by organisation size and industry sector (Organisations that provided CVT courses) Maximum unweighted sample bases in parentheses
The average number of hours spent on CVT courses per participant in CVT courses in 2010 was 24 hours.
50

Continuing Vocational Training Survey
Once again, the average number of hours per participant decreased as organisation size increases from 28 hours in organisations employing between 10 and 49 employees to 22 hours in organisations employing 500 or more people.
The average was lower in Service sectors (24 hours) than in Production and Construction organisations (26 hours). It was higher in the Construction (30) and Transport and Storage (34) sectors and lower in Mining and Quarrying (15), Accommodation and Food Services (16) and Public Administration (16) sectors.
Figure 7: D4 Average number of hours spent on CVT courses per participant, by organisation size and industry sector (Organisations that provided CVT courses) Maximum unweighted sample bases in parentheses
51

Continuing Vocational Training Survey
The average number of hours spent on CVT by participants per thousand hours worked was 4 hours. It increased to 6 hours in the Construction sector and was as low as 2 hours in Mining and Quarrying Public Administration and Accommodation and Food Services sectors.
Time spent on Continuing Vocational Training courses by gender
On average male trainees spent a higher number of hours on CVT courses (24 hours) than female trainees (21 hours).
These figures were derived from two separate questions (one asking about the total number of trainee hours and the other asking for a breakdown of the number of trainees by gender) and not the result of a direct question about the number of hours male and females each spent on CVT courses. As such it is subject to a significant degree of approximation.
Figure 8 shows the decrease in average number of hours spent on CVT courses as organisation increases which was noted earlier but also shows that this decline was steeper for female trainees. There was also a much lower average amongst female trainees in Production and Construction, compared with male trainees (11 hours for women, compared with 25 hours for men). Not only do Production and Construction sectors as a whole report a lower proportion of women in their workforce, but women in these sectors trained, on average, for much less time than males.
52

Continuing Vocational Training Survey
Figure 8: D2/D3 Average number of hours spent on CVT courses per male and female participants, by organisation size and broad industry sector (Organisations that provided CVT courses) Maximum unweighted sample bases in parentheses
24
28
29
22
21
20
25
21
24
27
17
19
11
25
Total (3244)
10-49 (1658)
50 - 249 (805)
250 - 499 (326)
500+ (455)
Production (A-F)(1210)
Services (G-S)(2034)
Male Participants
Female Participants
Breakdown of time spent on internal and external Continuing Vocational Training courses
An analysis of the number of hours spent on internal or external CVT courses gives us an approximation of the balance between the two in terms of the time spent on either. Overall, 65% of hours spent on CVT courses involve internal courses, with the remaining 35% involving external courses.
As organisation size increases the balance shifts from external to internal courses, reflecting the extent to which larger organisations are more likely to have facilities for internal training.
53

Continuing Vocational Training Survey
Figure 9: D5/D6 Proportion of training hours spent on internal and external training courses by organisation size and industry sector (Organisations that provided CVT courses) Maximum unweighted sample bases in parentheses
The greater likelihood of using external training facilities suggests an explanation as to why training costs per participant were higher in smaller organisations.
Time spent on mandatory Vocational Training courses
Organisations whose employees undertook CVT courses in 2010 were asked to provide an estimate of training hours that were spent on mandatory courses, such as those relating to occupational health and safety.
On average, 28% of all training hours were spent on these courses. This proportion increased gradually with organisation size, from 26% in organisations employing between 10 and 49 employees to 36% in organisations employing 500 or more.
54

Continuing Vocational Training Survey
The average share of training hours spent on mandatory courses was significantly higher in Production and Construction organisations than in those in the Service sectors (34%, compared with 27%).
It was higher than average in the Utilities (45%), Construction (40%) and Transport and Storage (36%) sectors. It was lowest in Finance, Insurance (13%) and Information and Communication (17%) sectors.
Figure 10: D9 Proportion of training hours spent on mandatory occupational health and safety courses by organisation size and industry sector (Organisations that provided CVT courses) Maximum unweighted sample bases in parentheses
Time spent on courses leading to a nationally recognised qualification
Organisations whose employees undertook CVT courses in 2010 were asked to provide an estimate of training hours that were spent on courses leading towards a nationally recognised qualification.
55

Continuing Vocational Training Survey
On average, 31% of all training hours were spent on these types of courses. This time, the proportion varied little by organisation size.
There was also little difference between organisations in Production and Construction and Service sectors (32% and 31% respectively).
The proportion was higher than average in the Transport and Storage (42%), Utilities (41%) and Construction (39%) sectors which suggests a relationship with mandatory courses. It was lowest in Public Administration (24%) and Information and Communication (23%) sectors.
Figure 11: D9 Proportion of training hours spent on courses leading towards a nationally recognised qualification, by organisation size and industry sector (Organisations that provided CVT courses) Maximum unweighted sample bases in parentheses
56

Continuing Vocational Training Survey
Comparisons with CVTS2 and CVTS3
The average number of hours spent on CVT courses per participant has increased since 2005 but has not met the levels reported just over ten years ago. However, a more significant figure is that of hours per employee. This has decreased since 2005, suggesting that a stable number of total training hours per organisation were shared amongst a lower proportion of the workforce. It is also observed that the average number of training hours per female participant has declined consistently since 1999.
Table 7: Average number of hours spent on CVT courses (Organisations that provided CVT courses)
Hours Hours per employee
Hours per participant
Hours per male
participant
Hours per female
participant
1999 – CVTS2 - 26 27 25
2005 – CVTS3 8.7 21 20 23
2010 – CVTS4 7.5 24 24 21
57

Continuing Vocational Training Survey
Costs of Continuing Vocational Training Courses
Key Points
The average amount spent by employers on CVT courses in 2010 was around £29,900. This is lower than in 2005 (£34,000)9.
This amount varies from £8,600 in organisations with between 10 and 49 employees to around £580,000 in organisations with 500 or more employees.
The average cost per course participant was £710, which indicates little change since 2005 (when it was also £710). This cost is higher for smaller employers than for larger ones, presumably because of larger employers’ use of internal training resources and/or because of economies of scale.
The average cost of CVT courses per hour was £29 but with significant variation between sectors (being lowest at £18 in the Accommodation and Food Services sector and highest at £50 in the Public Administration sector). There has been a decline in this figure since 2005, when it was reported at £33.
The average cost of CVT courses per employee (that is, averaged across all employees in the organisation whether they participated or not) was £260. As with cost per participant, this was lower in larger organisations than in smaller ones. It compares with £290 per employee in 2005.
Indirect costs (of trainee absence from their work station and for travel and subsistence) accounted for a substantial proportion (46%) of the average cost of courses. Direct costs in the form of fees and payments accounted for 34%, labour costs of internal training staff for 17%, and training facilities for 3%.
15% of employers contributed to collective funds for vocational training. The average contribution was of £10,100.
16% of employers received payments from collective funds. The average receipt was of £8,800. Government subsidies were the most frequent source of receipts.
To sum up, the average amount organisations spent on training declined somewhat between 2005 and 2010, from £34,000 to £29,900. This was accompanied by a slight decline in terms of training costs per employee between 2005 and 2010 from £290 to £260, and in terms of training costs per training hour from £33 to £29.
9 It should be noted that inflation, which affects both prices and wages, is not factored into comparisons between 2010 and 2005.
58

Continuing Vocational Training Survey
Total cost of Continuing Vocational Training courses in 2010
Organisations that provided CVT courses in 2010 were asked about the costs of doing so. They were asked to breakdown the costs into a number of areas, including: fees to external training organisations; travel and subsistence payments; and the cost of premises and equipment. They were also asked to identify any contributions made to, or received from, collective funding arrangements where these were in place for their sector. If they were not able to provide a breakdown they were asked to provide an estimate of total costs incurred. Data collected on labour costs was used to calculate the personal absence costs of employees involved in providing training or in receiving training so that the ‘real’ cost to the organisation could be estimated.
The average amount spent by organisations on CVT courses in 2010 was £29,900.
This average figure varies greatly between sectors. However, the main determinant is that of organisation size as one would expect, since the greater the number of staff, the greater the number of prospective trainees and the higher the potential expenditure.
59
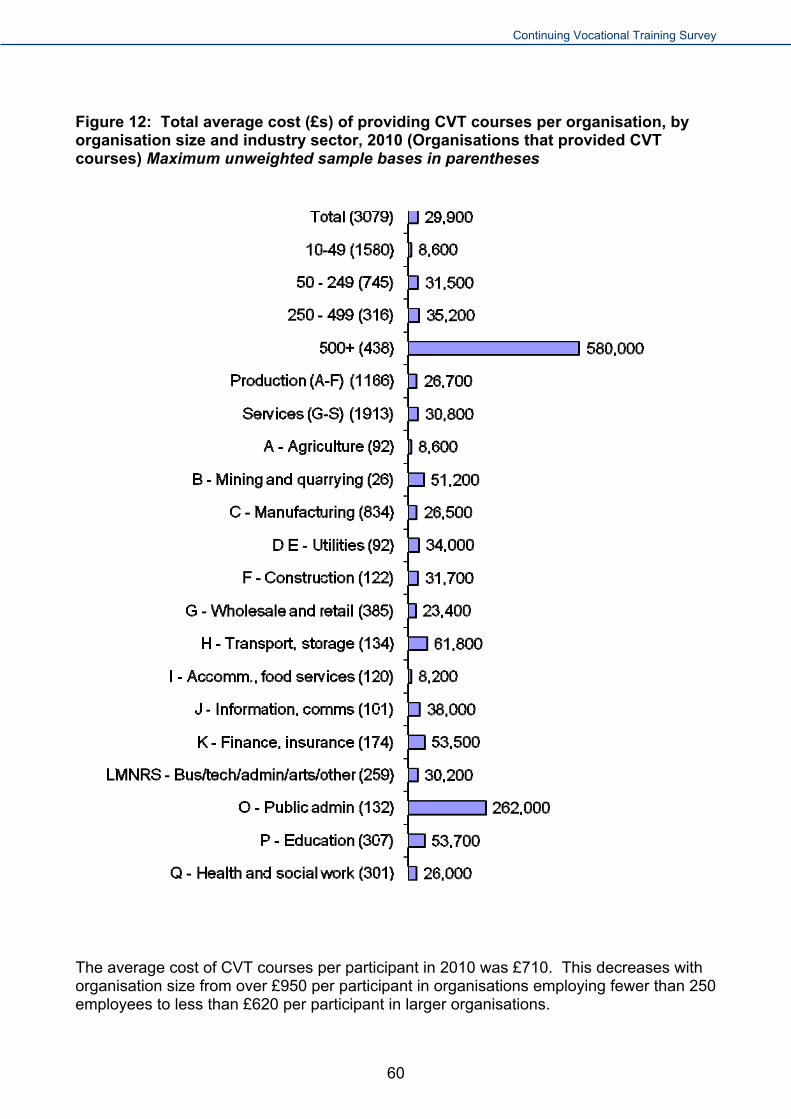
Continuing Vocational Training Survey
Figure 12: Total average cost (£s) of providing CVT courses per organisation, by organisation size and industry sector, 2010 (Organisations that provided CVT courses) Maximum unweighted sample bases in parentheses
The average cost of CVT courses per participant in 2010 was £710. This decreases with organisation size from over £950 per participant in organisations employing fewer than 250 employees to less than £620 per participant in larger organisations.
60

Continuing Vocational Training Survey
Presumably, this reflects economies of scale where the number of participants increases; resources are shared and fixed overheads, such as the costs of training centres, equipment and internal training staff are distributed over a larger number of trainees.
The average cost of CVT courses per hour in 2010 was £29. This was quite consistent by organisation size (although lower than average in organisations employing between 50 and 249 employees), but there were differences between industry sectors. Average hourly costs of training were slightly higher in Production and Construction sectors than in Service sectors. However, when broken down in more detail, the figure was highest in Public Administration (£50) and lowest in Accommodation and Food Services (£18).
The average cost of CVT courses across all employees was £260. Reflecting the pattern observed with regard to average cost of CVT courses per participant, average cost per employee declines as organisation size increases, from £420 in organisations with between 10 and 49 employees to £210 in organisations with 500 or more employees. Highest average cost per employee is to be found in the Construction sector (£490) and the lowest in Accommodation and Food Services (£110).
Average costs per CVT course participant, per hour spent on CVT courses and per employee are presented in Table 8.
Table 8: D13-D16/D1 Average cost (£s) of Continuing Vocational Training per participant, per hour and per employee (Organisations that provided CVT courses)
Per CVT course
participant
Per CVT course hour
Per employee
TOTAL 710 29 260
10-49 employees 950 34 420
50-249 employees 850 28 330
250-499 employees 640 29 250
500+ employees 620 28 210
Production and Construction (A to F) 830 32 270
Services (G to S) 690 29 250
A - Agriculture 720 32 310
B – Mining and Quarrying 580 38 150
C - Manufacturing 790 33 210
DE - Utilities 480 19 190
61

Continuing Vocational Training Survey
Per CVT Per CVT
Per course course
employee participant hour
F - Construction 1000 33 490
G – Wholesale and Retail 690 27 280
H – Transport, Storage 680 20 240
I – Accommodation, Food Services 290 18 110
J – Information, Communications 1060 43 540
K – Finance, Insurance 570 27 320
LMNRS – Business, Technical, Admin., Arts, Other Services
880 36 310
O – Public Administration 790 50 220
P - Education 520 26 170
Q – Health and Social Work 680 26 260
Cost breakdown
The following figure summarises the breakdown of total costs of Vocational Training courses in 2010. Labour costs of participants are also included in these total costs.
62

Continuing Vocational Training Survey
Figure 13: D14 CVT course cost breakdown (Based on the total amount spent by organisations that provided CVT courses) Unweighted sample base = 2,975
Fees and Payments
34%
Travel and Substinence
9%Labour costs for internal trainers
17%
Training centre, premises, rooms
and materials3%
Personal Absence cost
38%
Personal absence costs (i.e. the salaries of trainees for the time they have spent on CVT courses) accounted for more than a third (37%) of training costs.
In terms of other costs, fees and payments were the most significant (34% of training costs). The costs of training centres, premises and rooms were much less significant because not all organisations incur these. They increased to 5% of training costs in organisations with 500 or more employees.
Funding of Vocational Training activities
Contribution to funds
Respondents were asked if their organisation contributed to collective or other funds for Vocational Training activities in 2010. These were described as funds or grants managed by a trade, industry or sector association that has responsibility for arranging qualifications and training at a trade, industry or sector level.
One in seven organisations (15%) contributed to such collective or other funds for Vocational Training activities. This proportion is higher in Production and Construction sectors than in Service sectors (19%, compared with 14%). It increases with organisation size from 14% in organisations with between 10 and 49 employees to 32% of organisations with 500 or more employees.
63

Continuing Vocational Training Survey
In the majority of organisations (85%) the amount contributed did not exceed £10,000. The average amount contributed was £10,100. This average contribution ranged from £4,000 in organisations with between 10 and 49 employees to around £112,000 in those with 500 or more employees.
Although organisations in the Production and Construction sectors were more likely to contribute to collective or other funds, the average amount contributed in 2010 was lower than that of organisations in Service sectors (£8,000, compared with around £11,000).
Figure 14: C15 Average amount (£s) contributed to collective or other funds for Vocational Training in 2010, by organisation size and industry sector (Organisations that contributed) Maximum unweighted sample bases in parentheses
Receipt of funds
Respondents were asked if their organisation had received payments from collective or other funds or any other financial grants or subsidies for the provision of Vocational Training courses in 2010.
64

Continuing Vocational Training Survey
Around one in six (16%) received such payments. This proportion increases with organisation size, from 14% of organisations with between 10 and 49 employees to 31% of organisations with 500 or more employees.
It was significantly higher in Production and Construction sectors than in Service sectors (20%, compared with 15%) and particularly high in Construction (35%), Education (35%) and Health and Social Work (31%) sectors.
The majority (88%) received payments of no more than £10,000. The average payment received was £8,800. This average ranged from £2,700 in organisations with between 10 and 49 employees to £85,000 in organisations with 500 or more employees.
Average payments received did not differ significantly by broad industry sector, with organisations in Production and Construction sectors receiving, on average £8,300, and those in Service sectors receiving, on average £9,000.
Figure 15: C17 Average amount (£s) received in financial grants or subsidies for Vocational Training in 2010, by organisation size and industry sector (Organisations in receipt of funding) Maximum unweighted sample bases in parentheses
65

Continuing Vocational Training Survey
Respondents whose organisation received financial grants or subsidies for Vocational Training in 2010 were asked for the source of these grants or subsidies. Half (49%) cited government subsidies. This proportion increased to 57% of organisations employing more than 50 employees.
Fewer (41%) received training funds. This proportion increased to 44% of organisations with 250 or more employees.
EU subsidies were received by one in six (16%) of organisations that received grants or subsidies, with this source being particularly significant in Agriculture (at 38%).
Tax incentives were received by just 8% of organisations, increasing to around one in eight organisations with 250 or more staff.
Figure 16: C18 Which of the following does your organisation usually benefit from for providing Vocational Training (Organisations in receipt of funding) - prompted, multiple response Unweighted sample base = 848
66

Continuing Vocational Training Survey
Comparisons with CVTS2 and CVTS3
A comparison of costs per trainee and per trainee hour with previous surveys suggests that there has been no change in the cost of training for organisations in the last five years.
Table 9: Cost (£) of providing Continuing Vocational Training, 1999, 2005, 201010
Training costs per
trainee Training costs per
trainee hour
1999 – CVTS2 £650 £25
2005 – CVTS3 £710 £33
2010 – CVTS4 £710 £29
10 It should be noted that inflation, which affects both prices and wages, is not factored into comparisons between 2010, 2005 and 1999.
67

Continuing Vocational Training Survey
Training Policies and Management Processes
Key points
Provision of CVT in 2010 was strongly associated with having supportive infrastructure, such as a training centre or a specific person or department with responsibility for staff training, and supportive processes, such as having formal planning of training and training budgets.
Employers most frequently identified team working skills, job-specific skills, and customer handling skills as skills which would be important to the future development of their organisation.
49% of employers reviewed skill needs regularly as part of their overall planning process, 39%, reviewed needs on an ‘as and when needed’ basis. 12% did not assess their skill needs.
The most common means by which employers secured the skills they needed was by training existing staff. 93% reported this approach. However, other methods were also widely used. 87% reallocated responsibilities to other staff and 80% recruited new staff.
15% of employers reported that provision of CVT in their organisation was regulated by a written agreement involving government, local area or trade associations, and/or trade unions.
22% of employers reported that staff representation was involved in the management of their CVT provision.
Employers were most frequently informed or advised on external CVT provision by private training providers (in 71% of cases). Public information sources, such as BusinessLink or Next Step, were the source of information or advice on CVT provision for 50% of employers.
Planning of, and budgeting for, CVT was more frequent in 2010 than in 2005.
Overview of strategies for the provision of Continuing Vocational Training
There is a clear link between the propensity to have formal processes for reviewing the need for, and budgeting for, training and the actual provision of Vocational Training (see Table 10). While organisations that did not provide CVT courses in 2010 were marginally more likely than not to assess the skills and competences they need, this was on an irregular basis. Assessment of skills and competences as part of the overall planning process was significantly higher amongst those that train.
68

Continuing Vocational Training Survey
Table 10: Training processes, plans and policies by whether training is provided Figures in bold highlight higher propensity for formal planning amongst those providing both internal/external CVT courses
Row percentages
Total
An
y CV
T c
ou
rses
Bo
th in
ternal/
external C
VT
co
urses
No
CV
T co
urses
Pro
vided
oth
er fo
rms o
f CV
T
No
oth
er form
s
Train
ed A
t All in
2010
Did
no
t train
Runs a training centre or runs a shared training centre with other organisations
22% 2% 40% 4% 26% 7% 26% 2%
Has a specific person or department with responsibility for arranging Vocational Training
55% 67% 76% 33% 62% 31% 61% 24%
Assesses the skills and competences it needs, but not regularly (as and when required)
39% 36% 30% 46% 36% 51% 37% 51%
Assesses skills and competences as part of the overall planning process in the organisation
49% 58% 67% 32% 56% 23% 55% 18%
Reviews skills and competences of staff by way of structured interviews
35% 41% 52% 22% 40% 16% 39% 14%
Reviews the skills and competences of staff by way of other methods
47% 47% 43% 45% 48% 40% 48% 37%
Planning of Vocational Training within organisation leads to written training plan or programme
48% 63% 75% 20% 56% 19% 56% 10%
Has annual training budget including provision for Vocational Training
35% 46% 55% 14% 42% 9% 41% 5%
69

Continuing Vocational Training Survey
Row percentages
Total
An
y CV
T c
ou
rses
Bo
th in
ternal/
external C
VT
co
urses
No
CV
T co
urses
Pro
vided
oth
er fo
rms o
f CV
T
No
oth
er form
s
Train
ed A
t All in
Did
no
t train
2010
Written agreements between Government, local area or trade associations or trade unions regulate provision of Vocational Training
15% 20% 22% 6% 18% 6% 18% 3%
Staff representatives/committees usually involved in the Vocational Training management process
22% 29% 33% 9% 26% 6% 25% 5%
Unweighted sample bases 4604 3244 1752 1360 3889 715 4075 529
Skills/competences which are important to business development
Respondents were asked to indicate the skills/competences that were considered as important for the development of their organisation in the next few years.
70

Continuing Vocational Training Survey
Figure 17: B9 Skills/competences generally considered as important for the development of the organisation in the next few years – prompted, multiple response (all organisations) Unweighted sample base = 4,604 *denotes less than 0.5%
83%
81%
80%
72%
71%
63%
60%
57%
54%
28%
13%
2%
*%
Team working skills
Technical, practicalor job-specific skills
Customer handlingskills
Problem solvingskills
Management skills
General IT skills
Oral or writtencommunication
skills Numeracy and/or
literacy skills
Office administrationskills
IT professional skills
Foreign languageskills i.e. non-
EnglishOther
skills/competencies
None
Respondents in organisations in Service sectors were significantly more likely to identify most of the specified skills/competences as important, with the exception of technical, practical and job–specific skills which were significantly more important in Production and Construction sector organisations and office administration skills, which were important in around half of both Production and Construction and Service sector organisations (see Figure 18).
71

Continuing Vocational Training Survey
Figure 18: B9 Skills/competences generally considered as important for the development of the organisation in the next few years – prompted, multiple response, by broad industry sector (all organisations) Unweighted sample bases in parentheses *denotes less than 0.5%
The next figure shows that technical, practical and job-specific skills were considered to the most important by the highest proportion of respondents (32%), followed by customer handling skills (24%) and team working skills (14%). Only a small proportion of respondents mentioned any other skill as being of greatest importance.
72

Continuing Vocational Training Survey
Figure 19: B10 Skills/competences considered the most important for the development of the organisation in the next few years – prompted (all organisations) Unweighted sample base = 4604 *denotes less than 0.5%
Identification of skill and training needs
Respondents were asked whether their organisation regularly assessed the skills and competences it needs. Most do and for the larger proportion (49%) it is part of the overall planning process within the organisation. Two-fifths (39%) did so, but not on a regular basis; it was as and when required and mainly linked to changes in personnel.
Regular assessment becomes more likely as organisation size increases, while in organisations that did not train in 2010 only a minority assessed skills and competences as part of the planning process.
73

Continuing Vocational Training Survey
Figure 20: B3 Proportion of organisations that regularly assess the skills and competences they need (all organisations) Unweighted sample bases in parentheses
39%
41%
35%
26%
23%
37%
51%
49%
46%
58%
70%
75%
55%
18%
12%
13%
31%
8%
4%
2%
8%
Total (4604)
10 - 49 (2678)
50 - 249 (1043)
250 - 499 (380)
500+ (503)
Trained At All in 2010(4075)
Did Not Train (529)
Yes but not regularly, as and when required and mainly linked to changes in personnel
Yes, it is part of the overall planning process in the organisation
No
Organisations utilised a range of strategies to ensure they provide the skills and competences they will need in the future. Providing training to existing staff was most frequently mentioned (93%), whilst reassigning staff or responsibilities where necessary was also a commonly employed strategy (87%).
Training existing staff was mentioned even by the majority of those that did not provide training in 2010 (79%). This suggests that training was provided when needed in these organisations, not necessarily in the reference year, 2010, of the survey.
Four-fifths of organisations (80%) recruited new staff who were provided with specific training, whilst three-quarters (77%) recruited new staff who already had the skills, competences and qualifications that were needed.
74

Continuing Vocational Training Survey
Larger organisations were more likely to employ the full range of strategies and, in particular, to go down the recruitment route. Non-training organisations were less likely to cite any of the strategies.
Table 11: B4 Ways in which organisations usually ensure they provide the skills and competences they will need in the future, by organisation size and whether trained (all organisations) *denotes less than 0.5%
Total
10-49 em
plo
yees
50-249 em
plo
yees
250-499 em
plo
yees
500+
emp
loyee
s
Train
ed A
t All
in 2010
Did
No
t Train
We provide training to our existing staff
93% 93% 96% 100% 99% 96% 79%
We recruit new staff that have the skills, competences and qualifications we need
77% 75% 87% 94% 96% 80% 62%
We recruit new staff who we provide with specific training
80% 78% 87% 95% 96% 84% 60%
We look at what skills and competences we have amongst our employees and reassign staff or responsibilities where necessary
87% 86% 92% 92% 92% 90% 76%
None 1% 1% *% *% 0% *% 5%
Unweighted sample bases 4604 2678 1043 380 503 4075 529
Reviewing skill and training needs
Four-fifths of respondents (81%) reported that their organisation reviewed the skill and training needs of its employees. A third of all organisations (35%) did this by means of structured interviews, whilst nearly half (47%) used other methods.
The propensity to review the skill and training needs of employees at all increases with organisation size (see Table 12), but the proportion that used structured interviews remained at half of all organisations even in the largest organisations.
75

Continuing Vocational Training Survey
Organisations in Production and Construction sectors were significantly less likely than those in Services to use structured interviews for reviews (27%, compared with 37%), but the proportion of organisations that reviewed needs at all is the same in both Production and Construction and Service industry groups.
Half of those that did not provide training in 2010 did not review the skill and training needs of employees (49% did not). Just 14% of these organisations used structured interviews to do so, compared with 39% of those that provided training in 2010.
Table 12: B5 Proportion of organisations that usually review the skill and training needs of individual employees (all organisations)
Reviews
at all
Mainly uses
structured interviews
Mainly uses other
methods
None Unweighted
sample bases
Total 81% 35% 47% 19% 4604
10 – 49 employees 79% 33% 46% 21% 2678
50 – 249 employees 89% 42% 47% 11% 1043
250 – 499 employees 97% 54% 42% 3% 380
500+ employees 96% 48% 48% 4% 503
Production (A-F) 81% 27% 54% 19% 1861
Services (G-S) 81% 37% 45% 19% 2743
Trained At All in 2010 87% 39% 48% 13% 4075
Did not train 51% 14% 37% 49% 529
Reviews were most likely to focus on specific working tasks and activities (88%) and/or certain skills and competences (86%). Two thirds of organisations (67%) that reviewed the skill and training needs of employees focused on certain occupations or groups of occupations in their reviews. Although a smaller proportion (59%) focused on formal qualifications in their reviews of skill and training needs, this increased more steeply by organisation size to 80% of organisations with 250 or more staff.
Although there was little difference between organisations that trained and those that did not in respect of what reviews focused on (once those that did not review skill and training needs were taken out of the calculation), those that provided training were much more likely to report that they focused on qualifications in their reviews (62%, compared with 37%). This suggests that more consistent and regular training provision is more likely to be focused on qualifications-based training.
76

Continuing Vocational Training Survey
Table 13: B6 Areas that reviews focus on (where reviews are carried out) - prompted, multiple response
Certain
occupations
Certain skills/
competences
Specific working
task/ activities
Formal qualifications
Unweighted sample bases
Organisations carrying out reviews
67% 86% 88% 59% 3936
10 – 49 employees
66% 85% 88% 57% 2165
50 – 249 employees
67% 85% 87% 65% 924
250 – 499 employees
73% 87% 92% 80% 365
500+ employees 74% 88% 91% 81% 482
Production (A-F) 66% 80% 87% 53% 1548
Services (G-S) 67% 87% 88% 61% 2388
Trained At All in 2010
67% 86% 88% 62% 3639
Did not train 67% 84% 86% 37% 297
In terms of who structured interviews were conducted with, organisations were more likely to conduct them with upper and middle management staff (90% of those conducting structured interviews to review skill and training needs) than with other staff (78%), but these figures suggest wide coverage of staff at all levels.
The range of staff with whom structured interviews were conducted, increased with organisation size so that nearly all organisations with 500 or more staff that conduct structured interviews covered both upper and middle management (99%) and other grades of staff (96%) in this process.
Although there was little difference between broad industry groups in terms of staff who were included in structured interviews, a breakdown of Service sectors highlights very comprehensive coverage of staff at all levels in Public Administration (100% covering upper and middle management staff; 97% other staff categories); Education (97%; 89%); and Accommodation and Food Services (86%; 96%).
77

Continuing Vocational Training Survey
Interviews were most likely to cover the wishes of employees in respect of training (96%) and/or personal development objectives/plans (95%). Fewer respondents, although still the great majority (88%) reported that they cover information about career development and access to training, while three-quarters (75%) reported that interviews covered conditions on which training courses are carried out.
Coverage of the first three areas gradually increased with organisation size (to 97%-99% of 500+ employers) while coverage of conditions on which training courses are carried out was relatively low across all size bands.
Responsibility for Vocational Training within the business
More than half the organisations (55%) had a specific person or department within their organisation with responsibility for arranging Vocational Training.
This proportion increased with organisation size from 52% of organisations with between 10 and 49 employees to 67% of those with between 50 and 249 employees, to 79% of those with 250 and 499 employees, and to 84% of organisations with 500 employees or more.
The proportion of organisations with a specific person or department with responsibility for arranging Vocational Training was significantly higher in Service sectors than in sectors in Production and Construction sectors (56%, compared with 52%).
In more detail, the proportion was highest in Public Administration (78%), Health and Social Work (73%) and Education (70%) sectors. It was also higher than average in Mining and Quarrying (73%). Industry sectors least likely to have a dedicated person or department included Wholesale and Retail (45%), Accommodation and Food Services (46%) and Information and Communications (47%), reflecting the high proportion of small enterprises in these sectors.
Training centres
Just over a fifth of organisations (22%) ran a training centre or shared a training centre with other organisations, which had the necessary equipment to provide Vocational Training for its employees during 2010.
As with other training indicators, the propensity to run or share a training centre increased with organisation size: from 19% of organisations with between 10 and 49 employees to 31% of those with between 50 and 249 employees, to 44% of those with 250 and 499 employees, and to 56% of organisations with 500 employees or more.
The proportion was higher in the Service sector than in Production and Construction sectors (23%, compared with 19%). It was particularly high in the Education (40%), Public Administration (35%) and Transport and Storage (33%) sectors.
78
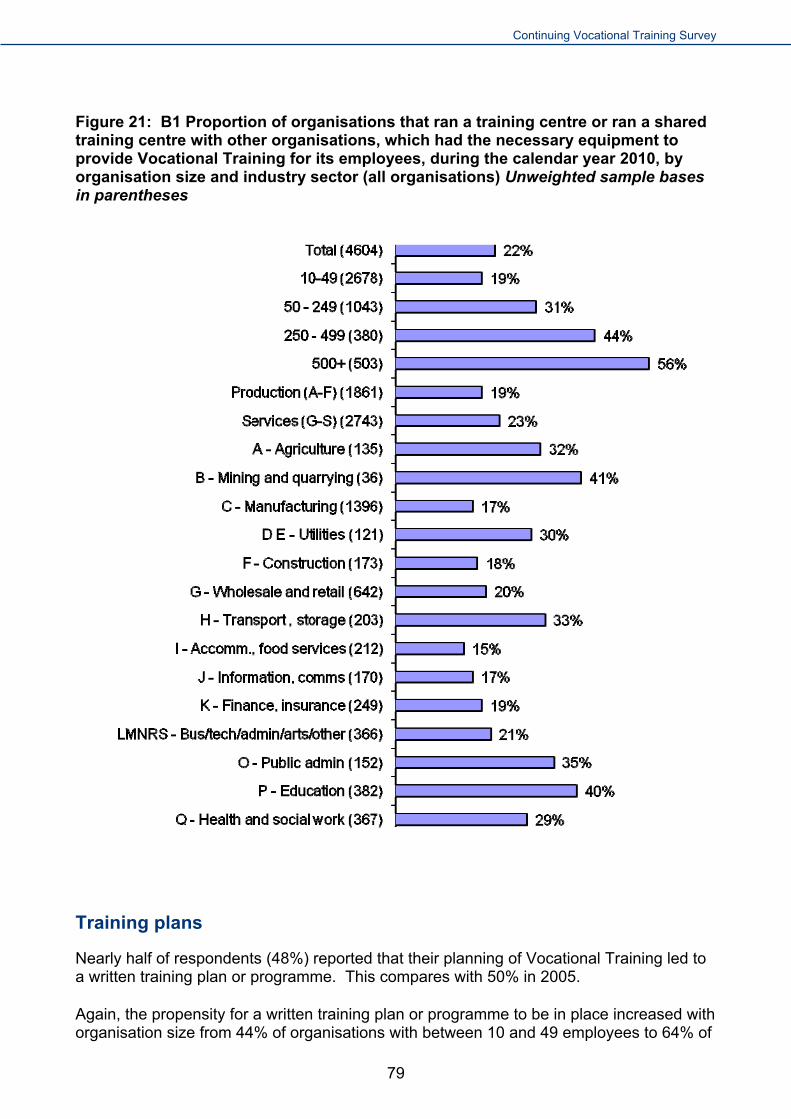
Continuing Vocational Training Survey
Figure 21: B1 Proportion of organisations that ran a training centre or ran a shared training centre with other organisations, which had the necessary equipment to provide Vocational Training for its employees, during the calendar year 2010, by organisation size and industry sector (all organisations) Unweighted sample bases in parentheses
Training plans
Nearly half of respondents (48%) reported that their planning of Vocational Training led to a written training plan or programme. This compares with 50% in 2005.
Again, the propensity for a written training plan or programme to be in place increased with organisation size from 44% of organisations with between 10 and 49 employees to 64% of
79

Continuing Vocational Training Survey
those with between 50 and 249 employees, to 78% of those with 250 and 499 employees, and to 86% of organisations with 500 employees or more.
The propensity to have a written training plan or programme of Vocational Training was higher in Service than in Production and Construction sectors (49%, compared with 45% - a significant difference) and was particularly high in the mainly public sectors of Public Administration (73%), Education (66%) and Health and Social Work (74%), reflecting the high proportion of large organisations in these latter sectors.
Figure 22: B11 Proportion of organisations for whom the planning of Vocational Training within your organisation leads to a written training plan or programme, by organisation size and industry sector (all organisations) Unweighted sample bases in parentheses
80

Continuing Vocational Training Survey
Training budgets
Around a third of organisations (35%) had an annual training budget. This increased to 46% of those that provided Vocational Training courses in 2010 and 41% of those that provided Vocational Training in general in the year.
As expected, given the relationship between planned training and organisation size, the propensity to have a budget for Vocational Training increased from 30% of organisations with between 10 and 49 employees to 50% of those with between 50 and 249 employees, to 74% of those with 250 and 499 employees, and to 84% of organisations with 500 employees or more.
Service organisations were significantly more likely to have an annual training budget than those in Production and Construction sectors (38%, compared with 25%) and the figure was particularly high amongst organisations in Public Administration (89%) and Education (64%).
Figure 23: B12 Proportion of organisations that have an annual training budget, which includes provision for Vocational Training, by organisation size and industry sector (all organisations) Unweighted sample bases in parentheses
81

Continuing Vocational Training Survey
Regulation of Vocational Training provision
One in seven respondents (15%) reported that written agreements between Government, local area or trade associations or trade unions regulated the provision of Vocational Training in their organisation.
The proportion increased to 30% in organisations with 500 or more employees. It was particularly higher in organisations in the Health and Social Work sector (35%), in Education (32%) and, to a lesser extent, in Public Administration (25%).
Management processes
Around a fifth of respondents (22%) reported that staff representatives/committees were usually involved in the Vocational Training management process. This increased to 31% of organisations with between 250 and 499 staff and 37% of organisations with 500 or more staff.
Again, the proportion was significantly higher in the Health and Social Work (38%), Public Administration (37%) and Education (35%) sectors, all of which are more likely than average to be populated by large organisations.
Of those organisations that involved staff representatives/committees in managing Vocational Training, four-fifths (80%) involved them in setting objectives for training and/or the form/type of training (81%). Significant proportions of organisations involved staff representatives/committees in determining the content of training (73%) and in the evaluation/assessment of training outcomes (73%).
82

Continuing Vocational Training Survey
Figure 24: B15 Aspects of the Vocational Training management process that staff representatives/committees are usually involved in – prompted, multiple response (where staff representatives/committees involved) Unweighted sample base = 1115
81%
80%
74%
73%
65%
56%
27%
Form/type of training
Objective setting of training
Evaluation/assessment of training outcomes
Content of training
blishing criteria for the selection of participants orspecific target groups
Selection of external training providers
Budget for training
Sources of information and advice regarding Vocational Training
All respondents were asked about the sources of information or advice on Vocational Training providers and offerings that their organisation used. All but 11% reported at least one source of information or advice. They were most likely to cite private training providers (71%).
83
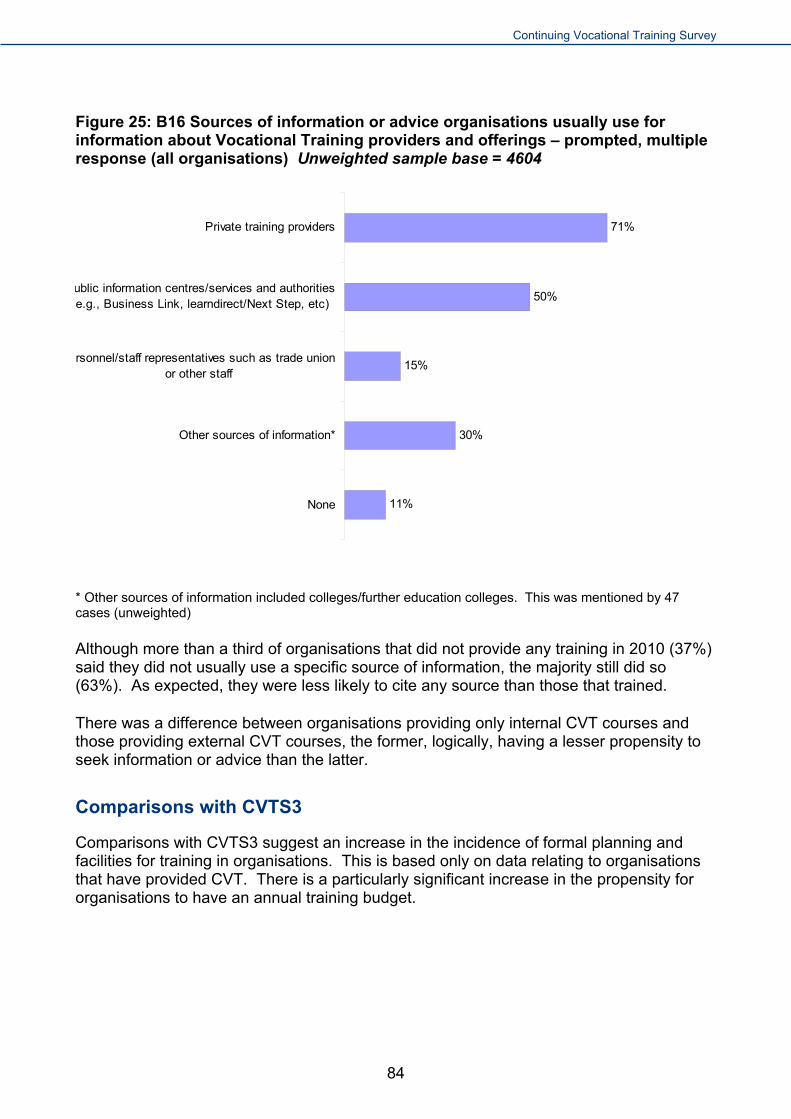
Continuing Vocational Training Survey
Figure 25: B16 Sources of information or advice organisations usually use for information about Vocational Training providers and offerings – prompted, multiple response (all organisations) Unweighted sample base = 4604
71%
50%
15%
30%
11%
Private training providers
ublic information centres/services and authoritiese.g., Business Link, learndirect/Next Step, etc)
rsonnel/staff representatives such as trade unionor other staff
Other sources of information*
None
* Other sources of information included colleges/further education colleges. This was mentioned by 47 cases (unweighted)
Although more than a third of organisations that did not provide any training in 2010 (37%) said they did not usually use a specific source of information, the majority still did so (63%). As expected, they were less likely to cite any source than those that trained.
There was a difference between organisations providing only internal CVT courses and those providing external CVT courses, the former, logically, having a lesser propensity to seek information or advice than the latter.
Comparisons with CVTS3
Comparisons with CVTS3 suggest an increase in the incidence of formal planning and facilities for training in organisations. This is based only on data relating to organisations that have provided CVT. There is a particularly significant increase in the propensity for organisations to have an annual training budget.
84

Continuing Vocational Training Survey
Table 14: Training processes, plans and policies by whether training is provided (organisations that provided CVT)
2010 2005
Runs a training centre or runs a shared training centre with other organisations
26% 18%
Has a specific person or department with responsibility for arranging Vocational Training
61% 61%
Planning of Vocational Training within organisation leads to written training plan or programme
56% 50%
Has annual training budget including provision for Vocational Training
41% 32%
Written agreements between Government, local area or trade associations or trade unions regulate provision of Vocational Training
18% 12%
Unweighted sample bases 4075 3943
85

Continuing Vocational Training Survey
Quality Assurance with regard to Continuing Vocational Training
Key points
81% of employers supplying CVT had a strategy to quality-assure that training.
Of all employers that provided training, 57% used certification of external providers, 53% used national training or qualification frameworks, and 43% trained their own training staff.
64% of employers supplying CVT formally assessed its outcomes.
Overview of strategies to ensure the quality of Continuing Vocational Training
The majority of organisations subscribe to some strategy for ensuring the quality of CVT courses. The propensity to take these steps increases with organisation size.
There is also a greater likelihood of assessing outcomes of CVT courses as organisation size increases. However, there is a more subtle relationship between organisation size and the propensity to assess the outcomes of training, as well as with regard to the methods used to do so.
Quality assurance strategies
Organisations that provided any CVT courses or other forms of CVT in 2010 were asked about their use of a number of strategies to ensure the quality of Vocational Training courses.
Four-fifths (81%) use any one of the specified strategies with more than half of those providing any training (57%) using certification of external providers and/or continuing vocational training and certification based on national or sectoral recognised standards or frameworks (53%). Fewer used continuous training of internal trainers (43%).
The use of any one of the strategies specified increased with organisation size (see Table 15). As organisations increased in size, so too did the relative importance of continuous training of internal trainers vis a vis certification of external providers. This is likely to be a reflection of the greater propensity for larger organisations to employ internal trainers, rather than to rely on external providers.
86

Continuing Vocational Training Survey
Table 15: E1 Ways in which organisations ensure the quality of Vocational Training courses, by organisation size and broad industry sector (where trained in 2010) – prompted, multiple response *denotes less than 0.5%
Total
10-49 em
plo
yees
50-249 em
plo
yees
250-499 em
plo
yees
500+
emp
loyees
Pro
du
ction
(A
-F)
Services (G
-S)
Certification of external providers (e.g., use of national registers)
57% 55% 62% 70% 71% 58% 57%
Continuing vocational training and certification based on national/sectoral recognised standards or frameworks
53% 51% 58% 75% 76% 49% 54%
Continuous training of internal trainers
43% 39% 54% 72% 81% 39% 44%
Other methods 17% 16% 21% 25% 26% 13% 18%
None 19% 20% 16% 8% 6% 19% 19%
Unweighted sample bases
4075 2226 979 372 498 1587 2488
By industry sector, the certification of external providers was particularly common in the Construction (71%) and Health and Social Work (70%) sectors. The fact that these two sectors are so dissimilar in terms of organisation profile and skill sets highlights another driver of this form of quality assurance, which is that adherence to statutory or quasi-statutory standards is frequent in both sectors.
The mainly public sectors of Public Administration, Education and Health and Social Work were particularly likely to base CVT and certification on national/sectoral recognised standards or frameworks (70%, 71% and 73% respectively).
Assessment strategies
The majority of organisations that provided any form of training in 2010 (64%) reported having assessed the outcomes of Vocational Training courses to some extent. It was more likely that they had done so for all activities (39%), rather than for just some (26%).
87

Continuing Vocational Training Survey
The propensity to have assessed outcomes at least partially increased with organisation size, but it remained the case that fewer than half the organisations with 500 or more staff (47%) assessed outcomes for all activity.
Figure 26: E2 Extent to which organisations usually assess the outcomes of Vocational Training courses, by organisation size and broad industry sector (where trained in 2010) Unweighted sample bases in parentheses
Assessment of course outcomes was most likely to be undertaken in Public Administration (85%), Education (80%) and Health and Social Work (75%) sectors. It was less likely to be undertaken in the Wholesale and Retail and Transport and Storage sectors (both 52%).
Amongst organisations that assess the outcomes of Vocational Training courses, there was no clear favourite method. Approaching three-quarters (72%) assessed participants’ behaviour or performance in relation to training objectives and a similar proportion (71%) use written or practical tests to validate certification. Slightly fewer (67%) administer satisfaction surveys amongst participants and/or assessed the impact of training on the performance of relative departments or the whole organisation (65%).
88
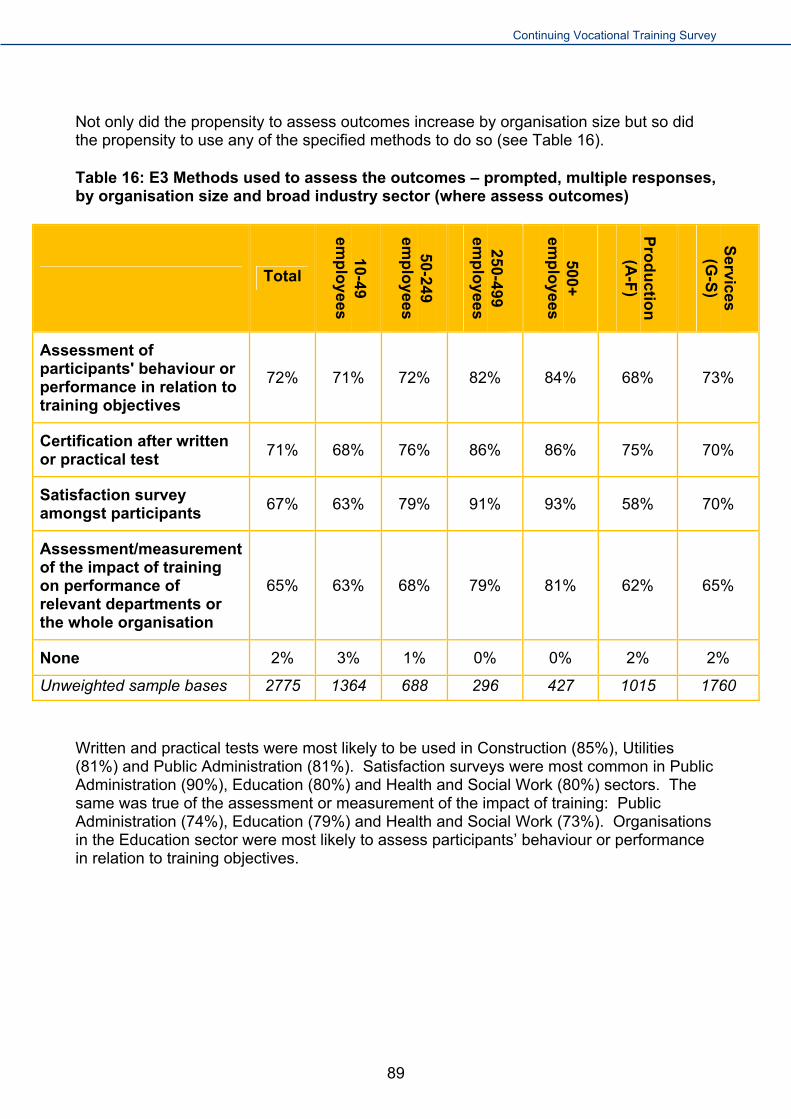
Continuing Vocational Training Survey
Not only did the propensity to assess outcomes increase by organisation size but so did the propensity to use any of the specified methods to do so (see Table 16).
Table 16: E3 Methods used to assess the outcomes – prompted, multiple responses, by organisation size and broad industry sector (where assess outcomes)
Total
10-49 em
plo
yees
50-249 em
plo
yees
250-499 em
plo
yees
500+
emp
loyees
Pro
du
ction
(A
-F)
Services (G
-S)
Assessment of participants' behaviour or performance in relation to training objectives
72% 71% 72% 82% 84% 68% 73%
Certification after written or practical test
71% 68% 76% 86% 86% 75% 70%
Satisfaction survey amongst participants
67% 63% 79% 91% 93% 58% 70%
Assessment/measurement of the impact of training on performance of relevant departments or the whole organisation
65% 63% 68% 79% 81% 62% 65%
2% 3% 1% 0% 0% 2% 2% None
Unweighted sample bases 2775 1364 688 296 427 1015 1760
Written and practical tests were most likely to be used in Construction (85%), Utilities (81%) and Public Administration (81%). Satisfaction surveys were most common in Public Administration (90%), Education (80%) and Health and Social Work (80%) sectors. The same was true of the assessment or measurement of the impact of training: Public Administration (74%), Education (79%) and Health and Social Work (73%). Organisations in the Education sector were most likely to assess participants’ behaviour or performance in relation to training objectives.
89
Continuing Vocational Training Survey
Barriers to Provision of Continuing Vocational Training
Key points
Where employers did not supply CVT, the main barriers were that they saw no need for training – their staff were fully skilled – or they preferred to recruit to obtain the skills they needed. ‘Supply-side’ barriers were much less frequent though 25% said CVT courses were too expensive and 13% said suitable courses were not available.
When employers who supplied CVT were asked to identify barriers to providing more, many (82%) said they had no need for more, said (in 63% of cases) that they preferred to recruit, or said (55% of cases) that staff workloads precluded more training.
Barriers for organisations that do not provide Continuing Vocational Training
The main reasons given for not providing any Vocational Training were lack of need, expressed in terms of employees having qualifications, skills and competences that already meet the needs of the organisation (82% of those who had not provided CVT) and also a result of organisations preferring to recruit individuals already with the required qualifications, skills and competences (64%).
That employees have limited time available to participate in Vocational Training was a reason given by two-fifths (42%) of non-training organisations. This limitation was a more significant factor amongst organisations that provided Vocational Training in the previous year (67% of those that trained in 2009). These organisations were also significantly more likely to say that there was no need given the current skills and qualifications of their workforce (96%) and that there had been a greater focus on Vocational Training in their organisation in previous years (41% of those that trained in 2009, compared with 12% of all those that did not train). This suggests (quite logically) that training delivered previously impacts on the need and priority for training in the period that follows.
90

Continuing Vocational Training Survey
Figure 27: F1 Reasons why organisations did not provide any Vocational Training courses or any other forms of Vocational training for employees in 2010 – prompted, multiple response (where did not train in 2010) Unweighted sample base = 529
82%
64%
42%
25%
20%
17%
13%
12%
17%
4%
The existing qualifications, skills andcompetences of employees met the current
needs of the organisation
The organisation preferred to recruitindividuals with the required qualifications,
skills and competences
Employees had a high workload and therewas limited time available for staff to
participate in Vocational Training
The costs of Vocational Training courses wastoo high
It was difficult to assess the VocationalTraining needs of the organisation
The organisation had a greater focus ontraining apprentices and new employees than
on training existing employees
There was a lack of suitable VocationalTraining courses on the market
There had been a greater focus on VocationalTraining in the organisation in previous years
Other reasons
None
91

Continuing Vocational Training Survey
Barriers for organisations that already provide Continuing Vocational Training
When organisations that provided training in 2010 were asked why they did not provide more training, the most frequently given reason was that the level of training was sufficient for the organisation’s needs (82%) i.e. that there were no limiting factors as such.
However, while the majority of organisations cited this as a reason for not providing more training many (63%) also acknowledged that more could have been provided if there was a need to (i.e. it had been difficult to recruit individuals with the required skills and competences) and that time (55%) and cost (44%) were constraints.
Figure 28: E4 Reasons why organisations did not provide more vocational training courses or other forms of vocational training in 2010 – prompted, multiple response (where trained in 2010) Unweighted sample base = 4075
82%
63%
55%
44%
25%
21%
20%
19%
7%
1%
The level of training provided was sufficientfor the organisation's needs (no limiting
factors)
The organisation prefers to recruit individualswith the required skills and competences
Employees had a high workload and therewas limited time available for staff to
participate in Vocational Training
The costs of Vocational Training courseswas too high
There had been a greater focus onVocational Training in the organisation in
previous years
There was a lack of suitable VocationalTraining courses on the market
Organisation had a greater focus on trainingapprentices and new employees than on
training existing employees
It was difficult to assess the VocationalTraining needs of the organisation
Other limiting factors
None
92

Continuing Vocational Training Survey
Amongst both organisations that train and those that do not, lack of demand outweighed supply issues limiting the provision of training. The lack of suitable vocational training courses was more likely to be cited as a limiting factor by organisations that had trained than by those that had not (21%, compared with 13%). This is likely to reflect the extent to which those that are actively involved in training have researched the courses available, while those that have not trained may not have gone as far as looking into it.
93

Continuing Vocational Training Survey
Initial Vocational Training
Key points
Initial Vocational Training (IVT) is training intended to prepare an individual for entry to an occupation via study or training towards to a formal qualification. To determine the extent of a particular form of IVT, organisations were asked to provide information on the number of people employed on a Government-recognised Apprenticeship leading to a qualification during 2010.
20% of employers employed Apprentices in 2010.
Most of these did so in order to secure their organisations’ future skills base.
Where employers did not do so, this was most frequently because they saw no need to do so or had no vacancies. 18% said that Apprenticeships weren’t available or suitable for their type of activity.
Employment of Apprentices
One in five organisations (20%) reported employing Apprentices during 2010. This proportion increased to more than two in five organisations with 250 or more employees (42% of 250-499 employers and 46% of 500+ employers).
One in four organisations in Production and Construction sectors (25%) employed Apprentices during 2010, compared with one in six organisations in Service sectors (18%). However, while the proportion of organisations that employed Apprentices was highest in the Construction sector (35%), the proportion was also above-average in Public Administration (32%), Education (28%) and Health and Social Care (28%) sectors (see Figure 29).
The majority of organisations employing Apprentices employed just one during 2010 (79%). This proportion fell to below half amongst organisations employing 250 or more staff across all sites (43% of 250-499 employers and 16% of 500+ employers that had employed Apprentices).
94

Continuing Vocational Training Survey
Figure 29: G1 Proportion of organisations that employed anyone on a Government recognised apprenticeship leading to a formal qualification in 2010, by organisation size and broad industry sector (all organisations) Unweighted sample bases in parentheses
On average, organisations that employed apprentices in 2010 employed 6 during that calendar year. This figure ranged from 2 in organisations employing between 10 and 49 employees to 52 in organisations employing more than 500 employees.
95

Continuing Vocational Training Survey
On average, the number of apprentices employed represented around 1% of the total workforce, although this increased to 2% of organisations employing fewer than 50 staff.
The average number of apprentices employed during 2010 was slightly higher in Service than in Production and Construction sectors (6.8, compared with 4.5). However, in more detail, it was highest in Utilities (21.0) and Public Administration (13.8) and lowest in Agriculture (1.4) and Construction (3.6). Clearly, employment of apprentices was more widespread in the Construction sector than in other sectors but the numbers taken on at any time tend to be lower than average, reflecting the relatively small size of most Construction businesses.
When asked about the number of apprentices employed at the end of the calendar year, 2010, the mean number overall was 1. This highlights the fact that most organisations employ one apprentice at a time. The mean number employed at the end of 2010 increases to 4 in organisations with between 250 and 499 employees and 21 in organisations with 500 or more employees.
Reasons for employing Apprentices
The most frequent reason for offering apprenticeships was to train future employees in line with the skill needs of the organisation (93% of those with apprentices giving this reason). Relatively few organisations employed apprentices to take advantage of the cheaper labour costs involved in taking on these individuals as employees.
Figure 30: G4 Reasons for offering apprenticeships (organisations that offered apprenticeships in 2010) – prompted, multiple response Unweighted sample base = 1,100
96

Continuing Vocational Training Survey
Barriers to employing Apprentices
The reasons for not offering apprentices were wide ranging but the most frequently-mentioned were lack of need and unavailability of relevant apprenticeship frameworks and lack of resources to provide the training and supervision required.
Only small minorities of organisations gave other reasons such as lack of knowledge or the perceived amount of bureaucracy involved.
Figure 31: G2 Reasons why organisations did not employ anyone on a Government recognised apprenticeship in 2010 (organisations that did not offer apprenticeships in 2010) – unprompted, multiple response Unweighted sample base = 3,504
97

Continuing Vocational Training Survey
Characteristics of Enterprises
Key points
As a result of weighting, the structure of the survey sample reflects the sector and size breakdown of the national base of employers with 10 or more employees.
54% of the workforce of the weighted sample was male, 46% was female.
On average, surveyed organisations employed 90 people.
On average, employees in surveyed organisations worked for 40 hours per week.
The average labour cost per employee in surveyed organisations was £20,800 per year in 2010.
The average labour cost per hour for all employees in surveyed organisations was £10.90.
24% of employers innovated in 2010, in the sense that they introduced new or greatly improved goods or services or adopted new or significantly better delivery processes.
Sector
More than three-quarters of organisations in the weighted sample (78%) operated in Service sectors (78%) with the remainder in Production and Construction sectors (22%). The sectors in which organisations mainly operated are summarised in Table 17 and differences by organisation size are highlighted. Because of weighting the sector profile reflects that of the population of enterprises with 10 or more employees across the UK.
98

Continuing Vocational Training Survey
Table 17: Proportion of employers operating within each industry sector – overall and by company size (all organisations) *denotes less than 0.5%
Company Size
Total10-49
employees50-249
employees250-499
employees 500+
employees
A: Agriculture, forestry and fishing 2% 2% 1% 1% 0%
B: Mining and quarrying and support activities *% *% *% 1% *%
12% 12% 17% 17% 11% C: Manufacturing
1% 1% 1% 1% 1% D-E: Utilities
7% 8% 5% 3% 3% F: Construction
16% 17% 12% 11% 11% G: Wholesale and retail
3% 3% 4% 4% 4% H: Transportation and storage
I: Accommodation and food service activities 10% 10% 7% 5% 4%
J: Information and communication 3% 3% 4% 3% 3%
K: Financial and insurance activities, 2% 1% 2% 3% 4%
L + M + N + R + S: Real estate, renting and business activities, Professional, scientific and technical activities, Administrative and support service activities, Arts, entertainment and recreation, Other service activities
24% 24% 24% 25% 20%
*% *% *% 4% 7% O: Public administration
4% 3% 9% 11% 16% P: Education
Q: Human health and social work 16% 16% 15% 10% 17%
Unweighted sample bases 4604 2678 1043 380 503
99

Continuing Vocational Training Survey
Size of Enterprise
The majority of organisations with 10 or more employees employed fewer than 50 (82%) and more than half of all organisations (53%) employed between 10 and 19 employees.
Again, as the data is weighted, this reflects the structure of the population of UK organisations with 10 or more staff across all their sites.
On average, organisations employed 96 staff. The impact on the average from organisations with more than 500 staff is significant. There is a significant difference between Production and Construction and Services organisations in this respect, with the average number employed in Production and Construction organisations being just 69, compared with 96 in Services organisations.
Table 18: Size of organisations (number of staff employed across all sites) – overall and by industry sector (all organisations)
Total Production (A-F) Services (G-O)
53% 52% 53% 10-19 employees
29% 29% 29% 20 – 49 employees
15% 16% 14% 50 – 249 employees
2% 2% 2% 250 – 499 employees
1% 1% 1% 500 – 999 employees
1% 1% 1% 1000+ employees
Mean number of employees in 2010
90 69 96
Unweighted sample bases
4604 1861 2743
Just over half (54%) of the workforce on average is male. This proportion varied little by organisation size (see Figure 32). However, there were very significant imbalances between sectors. In Production and Construction organisations, the workforce profile was heavily biased towards male employees (75%:25%), compared with an even distribution of male and female employees overall in Service sector organisations.
In the overall Service sector, however, there was strong male bias in the Transport and Storage sector workforce (82%:18%) while Education and Health and Social Work both employed a significantly higher proportion of females than males (65% and 77% of the workforce were female respectively).
100

Continuing Vocational Training Survey
Figure 32: A4/A5 How many of these people, employed at the end of the calendar year 2010 were male/female, by organisation size and broad industry sector (all organisations) Weighted number of employees on which data is based in parentheses
2010 figures show a lessening of a male bias in the overall workforce in organisations of 10 or more employees compared with five years previously. In 2005, 57% of the workforce was male, compared with 54% in 2010.
101

Continuing Vocational Training Survey
Size of Enterprise in 2009
The average number of employees within organisations at the end of the calendar year 2009 was 89. This was a very similar figure to the average for 2010 (90), suggesting little change year on year.
The summary of changes in workforce size in Table 19 suggests that there was more likely to have been workforce growth than shrinkage between 2009 and 2010.
Table 19: A7 Change in the size of organisations’ workforces since 2009 – overall and by size and industry sector (all organisations) *denotes less than 0.5%
Total
10-49 em
plo
yees
50-249 em
plo
yees
250-499 em
plo
yees
500+
emp
loyees
Pro
du
ction
(A
-F)
Services (G
-O)
*% 1% 0% *% 0% *% *% Didn’t exist in 2009
3% 3% 3% 1% 1% 3% 3% -26%+
8% 9% 6% 6% 8% 11% 8% -10-25%
8% 7% 10% 12% 13% 9% 7% -0-9%
57% 60% 45% 43% 49% 54% 58% No change
6% 5% 11% 16% 14% 7% 6% 1-10%
11% 10% 16% 15% 11% 10% 11% 11-25%
5% 5% 5% 5% 2% 3% 5% 26-50%
1% 1% 1% *% 1% 1% 1% 51-75%
1% 1% 1% 1% 1% 1% 1% 76-100%
*% *% 1% *% *% *% *% 100%+
19% 19% 19% 19% 21% 23% 18% Any decrease
23% 21% 36% 37% 30% 23% 24% Any increase
Mean number of employees in 2009
89 19 90 330 2643 68 94
Mean number of employees in 2010
90 19 92 341 2676 69 96
Unweighted bases 4604 2678 1043 380 503 1861 2743
102

Continuing Vocational Training Survey
Hours worked
All organisations were asked to indicate the total number of paid hours worked by people employed by their organisation in the calendar year 2010. Respondents were asked to exclude Apprentices and young people aged below 21 in their first job and involved in an initial training programme.
On average, around 170,000 paid hours were worked by employees in surveyed organisations in 2010. This equates to around 3,500 working hours per week (assuming a standard 4 weeks of holiday i.e. 48 working weeks in a year).
Figure 33 summarises the average number of paid working hours per organisation by organisation size and sector, organisation size being the predominant factor.
Figure 33: A8 Average number of paid working hours per organisation in 2010 Maximum unweighted sample bases in parentheses
103

Continuing Vocational Training Survey
The average number of paid working hours per employee in 2010 was around 1,900. This compares with around 2,100 in 2005.
The 2010 figure equates to around 40 hours per employee per week on average (again, assuming a standard 4 weeks of holiday i.e. 48 working weeks in a year). This is lower than that reported in 2005 (44.5) and is likely to reflect shorter working hours as a result of difficult economic conditions and increased levels of part time and flexible working.
Average paid working hours per employee in 2010 were higher in Production and Construction sectors than in Service sectors (2,050, compared with 1,870). The average was particularly high in Manufacturing and Mining and Quarrying (both around 2,100).
Labour costs
All organisations were asked to provide the total labour costs for all their employees for the calendar year 2010. These costs were to exclude Apprentices and young people below the age of 21 in their first job involved in an initial training programme. They were to include all direct and indirect costs and the cost of overtime and additional payments such as bonuses and commission.
The average total labour cost per organisation in 2010 was around £1,900,000.
Organisation size was the predominant factor in determining average labour costs of course. The average ranged from around £400,000 in organisations with between 10 and 49 employees to £56 million in organisations with 500 or more employees.
Average labour costs were slightly higher in Service industries (£1,900,000) than in Production and Construction firms (£1,800,000). The average was particularly high in the Public Administration (£22 million) and Education (£5.8 million) sectors.
104

Continuing Vocational Training Survey
Figure 34: A14 Average labour costs per organisation in 2010 Maximum unweighted sample bases in parentheses
1,900,000
390,000
2,000,000
7,000,000
56,000,000
1,800,000
1,900,000
500,000
7,000,000
2,400,000
2,300,000
1,000,000
1,250,000
3,900,000
950,000
1,500,000
2,400,000
1,500,000
22,000,000
5,800,000
1,800,000
Total (4604)
10-49 (2678)
50 - 249 (1043)
250 - 499 (380)
500+ (503)
Production (A-F) (1861)
Services (G-O) (2743)
A - Agriculture (135)
B - Mining and quarrying(36)
C - Manufacturing (1396)
D E - Utilities (121)
F - Construction (173)
G - Wholesale and retail(642)
H - Transport , storage(203)
I - Accomm., food services(212)
J - Information, comms(170)
K - Finance, insurance(249)
LMNRS -Bus/tech/admin/arts/other
O - Public admin (152)
P - Education (382)
Q - Health and social work(367)
These labour costs are best understood averaged by employee and by working hour.
The average labour cost per employee for all organisations in 2010 was £20,800. This compares with £20,100 in 200511.
The average cost increases slightly with the size of the organisation from £20,200 in organisations employing between 10 and 49 employees up to £21,100 in organisations employing between 250 and 499 employees and £21,000 amongst 500+ employers.
11 It should be noted that inflation, which affects both prices and wages, is not factored into comparisons between 2010 and 2005
105

Continuing Vocational Training Survey
Average labour costs per employee were higher in Production and Construction organisations than in Service sector organisations. This was largely due high average figures in Manufacturing and Mining and Quarrying.
Figure 35: A14 Average labour costs per employee in 2010 Maximum unweighted sample bases in parentheses
The average labour cost per hour in 2010 was £10.90. This compares with £9.40 in 2005.
Average hourly labour costs varied little by organisation size. Reflecting higher average costs per employee, the rate was higher in Production and Construction organisations than
106

Continuing Vocational Training Survey
in Service sector (£12.50, compared with £10.60). It was highest in Manufacturing (£13.20) and lowest in Accommodation and Food Services (£9.30).
Figure 36: A14 Average labour costs per hour in 2010 Maximum unweighted sample bases in parentheses
107

Continuing Vocational Training Survey
Propensity to innovate
One in four organisations (24%) introduced new or significantly improved goods, services or methods of producing or delivering goods or services during 2010.
This proportion increased with organisation size, from 23% of those with 10-49 employees to 51% of those with 500+ employees.
There was no difference in the propensity to have innovated between broadly grouped Production and Construction, and Service sectors, but organisations in Manufacturing (33%), Information and Communication (40%), Public Administration (32%) and Education (31%) sectors were all significantly more likely than average to have innovated.
Just over half (52%) of all organisations introduced new business practices, including new practices for organising procedures (41%), new methods of organising work responsibilities and decision making (40%) and/or new methods of organising external relations with other firms or public institutions (27%) in the year 2010.
Again, the propensity to have done any of these things increased with organisation size (see Figure 37).
Figure 37: A19/A20 Innovation in 2010: Proportion of organisations that report any specified innovative activities, by organisation size (all organisations) Unweighted sample bases in parentheses
108
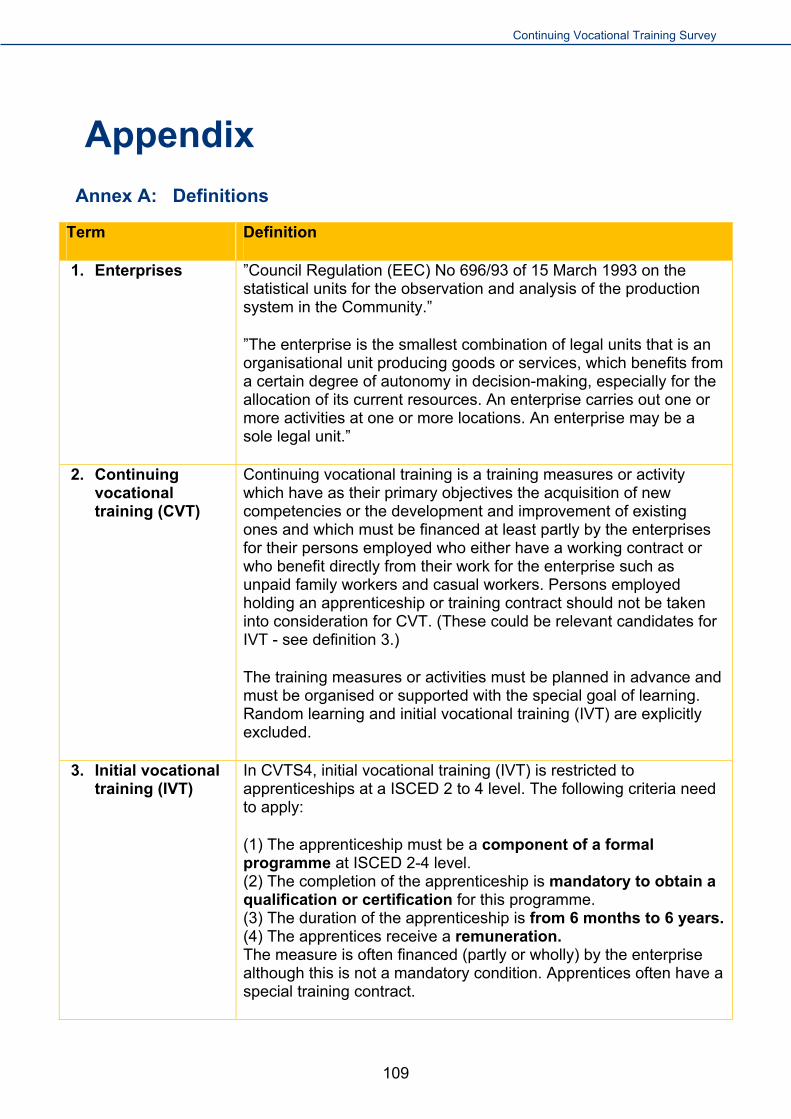
Continuing Vocational Training Survey
Appendix
Annex A: Definitions
Term Definition
”Council Regulation (EEC) No 696/93 of 15 March 1993 on the statistical units for the observation and analysis of the production system in the Community.”
”The enterprise is the smallest combination of legal units that is an organisational unit producing goods or services, which benefits from a certain degree of autonomy in decision-making, especially for the allocation of its current resources. An enterprise carries out one or more activities at one or more locations. An enterprise may be a sole legal unit.”
1. Enterprises
Continuing vocational training is a training measures or activity which have as their primary objectives the acquisition of new competencies or the development and improvement of existing ones and which must be financed at least partly by the enterprises for their persons employed who either have a working contract or who benefit directly from their work for the enterprise such as unpaid family workers and casual workers. Persons employed holding an apprenticeship or training contract should not be taken into consideration for CVT. (These could be relevant candidates for IVT - see definition 3.)
The training measures or activities must be planned in advance and must be organised or supported with the special goal of learning. Random learning and initial vocational training (IVT) are explicitly excluded.
2. Continuing vocational training (CVT)
3. Initial vocational training (IVT)
In CVTS4, initial vocational training (IVT) is restricted to apprenticeships at a ISCED 2 to 4 level. The following criteria need to apply:
(1) The apprenticeship must be a component of a formal programme at ISCED 2-4 level. (2) The completion of the apprenticeship is mandatory to obtain a qualification or certification for this programme. (3) The duration of the apprenticeship is from 6 months to 6 years.(4) The apprentices receive a remuneration. The measure is often financed (partly or wholly) by the enterprise although this is not a mandatory condition. Apprentices often have a special training contract.
109

Continuing Vocational Training Survey
Term Definition
Continuing vocational training measures and activities includes CVT courses and “Other” forms of CVT
4. Continuing vocational training measures and activities:
CVT courses are typically clearly separated from the active work place (learning takes place in locations specially assigned for learning like a class room or training centre).
They exhibit a high degree of organisation (time, space and content) by a trainer or a training institution.
The content is designed for a group of learners (e.g. a curriculum exists).
Two distinct types of CVT courses are identified internal CVT courses (def. 14) external CVT courses (def. 15).
5. CVT courses
“Other” forms of continuing vocational training are typically connected to the active work and the active work place, but they can also include attendances (instruction) at conferences, trade fairs etc. for the purpose of learning. They are often characterised by a degree of self-organisation (time, space and content) by the individual learner or by a group of learners. The content is often tailored according to the learners’ individual needs in the workplace.
In the context of CVTS4 the following types of Other forms of CVT are identified:
Planned training through guided on-the job-training (def. 16).
Planned training through job-rotation, exchanges, secondments or study visits (def. 17).
Planned training through participation in learning or quality circles (def. 18).
Planned training through self directed learning (def. 19).
Planned training through attendance (instruction received) at conferences, workshops, trade fairs and lectures (def. 20).
6. Other” forms of CVT
7. Principal economic activity of the enterprise
According to the NACE Rev 2 classification, the principal economic activity of the organisation is the activity that contributes most to the
110

Continuing Vocational Training Survey
Term Definition
gross value added at factor cost.
working proprietors
partners working regularly in the enterprise
unpaid family workers
persons from the enterprise and paid by it who work away from the enterprise
(e.g. sales representatives, delivery personnel, repair and maintenance teams)
part-time workers and seasonal workers
people absent for a short period (e.g. sick leave, paid leave or special leave) those on strike but not absent for an indefinite period
It excludes anyone who is working at the enterprise but whose salary is paid by another company, e.g. persons employed of firms under contract or seconded staff. Also not included are persons absent and not being paid during the whole reference period (e.g. for parental leave or long time compulsory military service).
8. Persons employed
The total number of persons employed includes all full-time and part-time persons employed.
9. Total number of persons employed
The total number of hours worked refers to the total number of hours actually worked by all persons employed, excluding persons employed holding an apprentice or training contract, in 2010.
It includes time worked during normal periods of work (in the enterprise or telecommuting), time worked in addition to normal periods of work and generally paid at a higher rate (overtime), time spent at the place of work standing by or during which no work is done (but for which payment is made) and time corresponding to short rest periods, including tea and coffee breaks.
It excludes time spent on paid leave, paid public holidays, paid sick leave, paid meal breaks.
10. Total number of hours worked
11. Total labour costs of persons employed
Total labour costs of persons employed (excluding persons employed holding an apprentice or training contract) is defined as the sum of the direct and indirect labour costs. The estimate of total labour costs represents all expenditure borne by employers in order
111

Continuing Vocational Training Survey
Term Definition
to employ workers.
It should include:
- direct labour costs, direct pay, other bonuses and gratuities, payments for days not worked, benefits in kind,
- and indirect labour costs, statutory social security contributions and family allowances, non-statutory payments, other social expenditure, vocational training costs (gross), taxes, less subsidies on labour.
A new or significantly improved good or service is one whose characteristics or intended uses differs significantly from those of previously produced products or has been significantly enhanced or upgraded.
A significantly new method of production or delivery of goods and services should represent a significant difference from those of previously utilised.
12. New or significantly improved goods, services or methods of producing or delivering these goods or services
Internal CVT courses are principally designed and managed by the enterprise itself. (It is important that the responsibility for the content of the course lies within the enterprise. Courses are for example designed and managed by the internal training department of the enterprise, however the course can physically take place either within or outside the enterprise i.e. the geographic location relative to the enterprise is not the important issue).
13. Internal CVT courses
External CVT courses are principally designed and managed by organisations which are not part of the enterprise itself (e.g. 3rd party organisations). (These courses are designed and managed by a training organisation which is not part of the enterprise or by a training organisation which belongs to the parent company of the enterprise. It is important that the responsibility for the content of the course lies outside the enterprise; the course is then selected and ordered/ purchased by the enterprise. The course can physically take place either within or outside the enterprise i.e. the geographic location relative to the enterprise is not the important issue).
14. External CVT courses
Guided on-the job-training is characterised by planned periods of training, instruction or practical experience in the work place using the normal tools of work, either at the immediate place of work or in the work situation.
15. Guided on-the job-training
16. Job-rotation, exchanges, secondments or
Job-rotation within the enterprise and exchanges with other enterprises are “other” forms of CVT only if these measures are planned in advance with the primary intention of developing the
112

Continuing Vocational Training Survey
Term Definition
skills of the workers involved. Transfers of workers from one job to another which are not part of a planned developmental programme should be excluded.
study visits
Learning circles are groups of persons employed who come together on a regular basis with the primary aim of learning more about the requirements of the work organisation, work procedures and work places.
Quality circles are working groups, having the objective of solving production and work place based problems, through discussion. They are counted as “other” forms of CVT only if the primary aim of the persons employed attending them, is learning.
17. Learning or quality circles
Self directed learning occurs when an individual engages in a planned learning initiative where he or she manages the training time and the place at which the training takes place.
Self directed learning means planned individual learning activities using one or more learning media. Learning can take place in private, public or job-related settings.
Self directed learning might be arranged using open and distance learning methods, video/audio tapes, correspondence, computer based methods (including internet, e-learning) or by means of a Learning Resources Centre.
It has to be part of a planned initiative. Simply surfing the internet in an unstructured way should be excluded. Self directed learning in connection with CVT courses should not be included here.
18. Self directed learning
Attendance (instruction received) at conferences, workshops, trade fairs and lectures are considered as training actions, only when they are planned in advance and where the primary intention of a person employed attending them is training/learning.
19. Attendance at conferences, workshops, trade fairs and lectures
A participant is a person who has taken part in one or more CVT courses during the reference year. Each person should be counted only once, irrespective of the number of CVT courses he or she has participated in. E.g. if an person employed has attended two externally managed courses and one internally managed course, he or she should be counted as one participant.
20. Total number of participants
21. Participant events
Participant events are the number of times participants participated in CVT courses. E.g. if a person employed has attended two externally managed courses and one internally managed course, this will be counted as three participant events. Typically the number of participants will be lower than the number of participant
113

Continuing Vocational Training Survey
Term Definition
events for an enterprise.
Paid working time (in hours) spent on CVT courses is the total time that all participants have spent in total in CVT courses during 2010.
Where courses fell only partly within 2010, only the time spent during 2010 should be included. The number of hours spent in CVT courses should cover only the actual training time and only the time spent in persons employed’ paid working time should be included (i.e. any time where participants are training when they would normally be working or in time being paid for by the enterprise).
It should exclude any periods of normal working between training and any time spent travelling to the course. For example, if a training course lasts for one week, only the time spent actually in the training course or working on training material should be included. If a person attends a course, one day a week, for several weeks, the one day a week should be included and summated, but the days spent working between the training days should be excluded.
22. Paid working-time (in hours) spent on CVT courses
Question B9 focuses on skills and competences important in the next few years.
Question D7 however collects data on the basis of the most important volume of courses related to them. In that context, it should be noted that a particular course may cover more than one category. The volume of training hours related to it can be assigned based on the most important factor it covered.
23. Skills and competences
24. External CVT courses providers
Provider of external training courses means the person or organisation, which delivers the training (see annex 16 for a more detailed description):
Schools, colleges, universities and other higher education institutions.
Public training institutions (financed or guided by the government; e.g. adult education centres).
Private training companies.
Private companies whose main activity is not training (e.g. equipment suppliers; parent/associate companies).
Employer’s associations, chambers of commerce, sector bodies.
114

Continuing Vocational Training Survey
Term Definition
Trade unions.
Other training providers.
These are the costs of external courses, made to external organisations for the provision of CVT courses and services. They include course fees, the cost of assessors and examiners and the cost of external trainers used to support internal courses. VAT should be excluded from the expenses.
25. Fees and payments
These are costs made to participants for travelling to training courses and the payments or subsistence allowances. VAT should be excluded from the expenses.
26. Travel and subsistence payments
These are the direct and indirect labour costs of staff, of training centres and other staff exclusively or partly involved in providing, designing and managing CVT courses. If those trainers are only partly involved in CVT courses, only the time spent on CVT courses should be taken into account.
If total labour costs of internal trainers for CVT courses are not available from enterprise records, then the labour costs may be estimated by using data on the total number of internal trainers for CVT courses and average remuneration plus indirect labour costs.
27. Labour costs of internal trainers for CVT courses
These costs include the costs of running the training rooms and annual depreciation for these rooms and equipment. It also includes the costs of materials bought specifically to support the provision of CVT courses.
VAT should be excluded from the expenses.
28. Costs for training centre, training premises or specific training rooms of the enterprise, in which CVT courses take place Costs for teaching materials for CVT courses
The costs of contributions made by the enterprise to collective funding arrangements through Government and intermediary organisations.
29. Contributions
The receipts from collective funding arrangements, subsidies and financial assistance from Government and other sources.
30. Receipts
31. Assessment of skills and competences
This assessment concerns the need for skills and competences relevant to the overall training or development of the enterprise. The method has usually been used for the assessment of skill needs
115

Continuing Vocational Training Survey
Term Definition
over the recent years and/or will be used for the assessment of skill needs for the year to come or for the next few years.
needs of the enterprise
This category refers to the methods generally used to assess individual skills and related training needs. The methods have usually been used for the review of skill needs in the recent years and/or will be used for the reviews of skills for the year to come or the next few years.
32. Review of skill and training needs of the individual employees
The activities referred to under points 1 and 2 below should be considered as obligatory from the perspective of the Community legislation in the sense that the employer has to make sure that a worker received a proper training tailored to the needs and conditions of the workplace.
1. Obligatory CVT activities by law for some tasks, such as driving a fork lift, training for preventive services – for example occupational physicians may be required by law to do some training regularly -, training for safety representatives who deal with Occupational Safety and Health questions at the enterprise level – also mandatory by law in some Member States - and training for first aid measures (by law, a certain number of people have to be able to offer first aid)
2. CVT activities for workers to enable them to do their work adequately and to protect themselves and others. They have to be tailored to the needs and conditions of the respective workplaces and the knowledge of the worker(s). This is for example to train doctors how to use and discard needles to avoid needle stick injuries, or to train a laboratory worker how to work safely, or to train an apprentice how to use the protective guards when using a circular saw. This kind of training is normally included in the category “guided on the job” training and cannot always be separated out. That training has to be refreshed and updated regularly. Another simple example would be fire exercises.
33. Obligatory occupational health and safety courses
The Recommendation of the European Parliament and of The Council of 18 June 2009 establishes a European Quality Assurance Reference Framework for Vocational Education and Training which should guide the implementation of this question, see:
http://eurlex.europa.eu/LexUriServ/LexUriServ.do?uri=OJ:C:2009:155:0001:0010:EN:PDF
34. Quality of CVT courses
35. Training centre A training centre is a training unit with training personnel, training premises and training equipment. The training centre can be located with or out with the enterprise or it can be shared with other enterprises. The ownership of the training centre is not the
116

Continuing Vocational Training Survey
Term Definition
important issue, as some enterprises may run a training centre jointly with other enterprises, although they do not in fact own it.
Structured interviews are a regular (typically annual) communication between an enterprise management and its persons employed.
An individual and a superior discuss the past work experiences of the person employed. Often both sides agree on goals for the future and evaluate the past goal achievement of the person employed. Problems and difficulties at the work place are analysed and it is looked for possibilities of improving the working conditions. The collaboration between the superior and the person employed is also discussed. The main aims of these interviews are the guidance of the person careers, the screening of individual employment situations, possible training needs and suitable training offers.
36. Structured interviews
The social partners are representative organisations of the employers and the persons employed (employer associations and trade unions). The social partners negotiate on a regular basis at the national and sectoral level and conclude collective agreements (collective bargaining). Collective agreements normally regulate wages and working conditions. Collective agreements can also regulate vocational training provisions, such as national or sectoral training funds, employability measures, vocational training measures for older persons employed. Agreements between the employer and works councils at the enterprise level are excluded from this definition.
37. Agreements between the social partners
Formal structures involving employee representatives are often committees or works councils. They are "shop-floor" organisations representing workers, which function as local/firm-level complements to national labour negotiations. Works councils exist in a variety of related forms in a number of European countries. A special form of works councils are the European works councils. On 22 September 1994, the European Council of Ministers decided on a Directive (94/45/EC) on the establishment of a European Works Council or similar procedure for the purposes of informing and consulting persons employed in companies which operate at EU level (amended by Council Directive 97/74/EC of
15 December 1997). The directive applies to companies with at least 1.000 persons employed within the EU and at least 150 persons employed in each of at least two Member States.
38. Formal structure involving employee representatives
39. Labour costs of individuals registered on an IVT activity
Labour costs of individuals registered on an IVT activity (apprenticeship in ISCED 2-4 programmes) in consist of the direct remuneration and indirect labour costs. If total labour costs of individuals registered on an IVT activity are not available from the
117

Continuing Vocational Training Survey
Term Definition
(OPTIONAL variable)
enterprise records, then the labour costs may be estimated by using data on the total number of individuals registered on an IVT activity and average remuneration plus indirect labour costs (see annex 4 for a more detailed description). The labour costs for all persons that participated in IVT (apprentices in ISCED 2-4 programmes) during the year 2010 must be provided.
40. Labour costs of IVT trainers or mentors
(OPTIONAL variable)
These costs are the direct and indirect labour costs of IVT trainers or mentors (for apprenticeship in ISCED 2-4 programmes). If those trainers or mentors are only partly involved in IVT training, only the proportion of their time spent on IVT training should be taken into account.
If total labour costs of IVT trainers or mentors are not available from the enterprise records, then the labour costs may be estimated by using data on the total number of IVT trainers and mentors and average remuneration plus indirect labour costs (see annex 4 for a more detailed description).
41. IVT trainers and mentors
(OPTIONAL variable)
IVT trainers and mentors are persons employed of the enterprises and fully or partly involved in the initial vocational training activities of the enterprises (especially for on-the-job-training). It should include:
internal trainers and staff of training centres directors and other top managers concerned with training policy instructors and training managers or officers clerical/administrative and other personnel supporting these activities
Annex B: Sample confidence intervals
In an ideal world when views are sought, everyone would be asked. This would involve a census. It is an expensive approach and time-consuming as well as impractical, as it is very difficult to get hold of everyone in a target population. Consulting a sample of a target population is more cost-effective and achievable. A sampling approach, however, does involve compromise with regard to the extent to which the views sought accurately reflect those of everyone in the target population. The degree to which the statistics gathered from a sample of the target population deviate from those that would be gathered from a census is known as the standard error.
Standard error is calculated on the basis of two different elements; the sample size and the statistic itself. The larger the sample. the smaller the size of the standard error. This is shown in the table below. The maximum standard error for a given sample is based on a statistic of 50%. Thus, survey samples are subject to standard sampling error, based on the number of interviews undertaken. This means that the sample reports a result which
118

Continuing Vocational Training Survey
falls within a range of what could be expected if the whole population was asked. This is calculated to a confidence level, most commonly at 95%. For example, based on an overall sample size of 4,604, a reported statistic of 50% would be subject to a standard sampling error of +/-1.44%. Thus, if all respondents were asked, we would be 95% confident that the reported statistic would fall within a range of 49.56% to 51.44%.
Formula for standard error at 95% level of confidence
The formula for calculating the standard error associated with a percentage based on a given sample is as follows:
- confidence interval = 1.96 * �( x * (1 – x)/y )
- where x = percentage and y = sample base.
Size of standard error at a 95% level of confidence based on a statistic of….
Base description No. of
interviews50% 35% 25% 10% 1%
TOTAL - ALL 4604 1.44% 1.38% 1.25% 0.87% 0.29% 10-49 employees 2678 1.89% 1.81% 1.64% 1.14% 0.38% 50-249 employees 1043 3.03% 2.89% 2.63% 1.82% 0.60% 250-499 employees 380 5.03% 4.80% 4.35% 3.02% 1.00% 500+ employees 503 4.37% 4.17% 3.78% 2.62% 0.87%
Organisations in which employees were provided with any CVT
4075 1.54% 1.46% 1.33% 0.92% 0.31%
Organisations in which employees participated in CVT courses
3244 1.72% 1.64% 1.49% 1.03% 0.34%
Organisations in which employees participated in external CVT courses
2682 1.89% 1.81% 1.64% 1.14% 0.38%
Organisations carrying out reviews of training needs
3936 1.56% 1.49% 1.35% 0.94% 0.31%
Organisations in which staff representatives are involved in training decisions
1115 2.93% 2.80% 2.54% 1.76% 0.58%
Organisations that assess the outcome of training
2775 1.86% 1.77% 1.61% 1.12% 0.37%
Organisations that have not provided any CVT
529 4.26% 4.06% 3.69% 2.56% 0.85%
Organisations that offered
1100 2.95% 2.82% 2.56% 1.77% 0.59%
119

Continuing Vocational Training Survey
Size of standard error at a 95% level of confidence based on a statistic of….
Base description No. of
50% 35% 25% 10% 1% interviews
apprenticeships
Organisations that have not offered apprenticeships
3504 1.66% 1.58% 1.43% 0.99% 0.33%
SIC 2007
NACE/SIC description12 NACE
1-11 Production and Construction
1861 2.27% 2.17% 1.97% 1.36% 0.45%B-F
12-24 Services 2743 1.87% 1.78% 1.62% 1.12% 0.37%G-S
1-3 Agriculture, forestry and fishing
139 8.31% 7.93% 7.20% 4.99% 1.65%A
5-9 Mining and quarrying and support activities
34 16.81% 16.03% 14.56% 10.08% 3.34%B05-B09
10-12 Manufacture of food products, beverages and tobacco
171 7.49% 7.15% 6.49% 4.50% 1.49%C10-C12
13-15
Manufacture of textiles and textile products Manufacture of leather and leather products
132 8.53% 8.14% 7.39% 5.12% 1.70%C13-C15
17-18
Manufacture of pulp, paper and paper products, Printing of newspapers
177 7.37% 7.03% 6.38% 4.42% 1.47%C17-C18
19-23
Manufacture of coke oven products Manufacture of flat glass
231 6.45% 6.15% 5.58% 3.87% 1.28%C19-C23
24-25
Manufacture of basic iron and steel and of ferro-alloys Manufacture of metal structures and parts of structures
196 7.00% 6.68% 6.06% 4.20% 1.39%C24-C25
26-28,
Manufacture of electronic
199 6.95% 6.63% 6.02% 4.17% 1.38%C26-C28
12 “The UK SIC is based exactly on NACE but, where it was thought necessary or helpful, a fifth digit has been added to form subclasses of the NACE four digit classes.” UK Standard Industrial Classification of Economic Activities 2007 (SIC 2007): Structure and Explanatory Notes. Office for National Statistics, December 2009
120

Continuing Vocational Training Survey
Size of standard error at a 95% level of confidence based on a statistic of….
Base description No. of
50% 35% 25% 10% 1% interviews
33 components, Repair of fabricated metal products Manufacture of engines and turbines, except aircraft, vehicle and cycle engines
and C33
29-30
Manufacture of motor vehicles, Building of ships and floating structures
107 9.47% 9.04% 8.20% 5.68% 1.89%C29-C30
16, 31, 32
Sawmilling and planing of wood, Manufacture of office and shop furniture, Striking of coins
205 6.84% 6.53% 5.93% 4.11% 1.36%C16+C31-C32
35-39
Electricity, gas, steam and air conditioning supply, Water supply; sewerage, waste management and remediation activities
121 8.91% 8.50% 7.72% 5.35% 1.77%D-E
41-43 Construction 168 7.56% 7.21% 6.55% 4.54% 1.50%F
45 Sale of cars and light motor vehicles
162 7.70% 7.34% 6.67% 4.62% 1.53%G45
46
Agents involved in the sale of agricultural raw materials, live animals, textile raw materials and semi-finished goods
234 6.41% 6.11% 5.55% 3.84% 1.27%G46
47
Retail trade in non-specialised stores with food, beverages or tobacco predominating
248 6.22% 5.94% 5.39% 3.73% 1.24%G47
49-53 Transportation and storage
203 6.88% 6.56% 5.96% 4.13% 1.37%H
55-56 Accommodation and food service activities
213 6.71% 6.41% 5.82% 4.03% 1.34%I
J 58-63 Information and communication
176 7.39% 7.05% 6.40% 4.43% 1.47%
121

Continuing Vocational Training Survey
Size of standard error at a 95% level of confidence based on a statistic of….
Base description No. of
50% 35% 25% 10% 1% interviews
64-65 Financial and insurance activities, Life insurance
99 9.85% 9.40% 8.53% 5.91% 1.96%K64-K65
66 Administration of financial markets
150 8.00% 7.63% 6.93% 4.80% 1.59%K66
68-82,
90-96
Real estate, renting and business activities, Professional, scientific and technical activities, Administrative and support service activities, Arts, entertainment and recreation, Other service activities
335 5.35% 5.11% 4.64% 3.21% 1.07%L + M + N + R + S
84 Public administration 151 7.98% 7.61% 6.91% 4.79% 1.59%O 85 Education 389 4.97% 4.74% 4.30% 2.98% 0.99%P
86-88 Human health and social work
372 5.08% 4.85% 4.40% 3.05% 1.01%Q
122

Continuing Vocational Training Survey
Annex C: Questionnaire employed
Pro 8505 – Version 1.1 (02/09/11)
Continuing Vocational Training Survey 4 (CVTS4)
Good morning/afternoon, my name is ___ and I am calling from BMG Research, an independent research agency on behalf of the Department for Business, Innovation and Skills or BIS, previously known as the DTI. BIS is carrying out a survey to find out about vocational training provided by employers as part of a major European piece of research.
IF NECESSARY: The research is part of a study by the European Union, carried out every 5 years.
S0 ALL BASE: ALL Could I speak to the most senior person in charge of training policy please? This will be the person who decides what training providers to use or who has the best knowledge of what vocational training is carried out across all sites within your organisation.
PROBE AND WRITE IN Name:
Job title IF NECESSARY: Transfer and re-introduce
Good morning/afternoon, my name is ___ and I am calling from BMG Research, an independent research agency on behalf of the Department for Business, Innovation and Skills or BIS, previously known as the DTI. BIS is carrying out a survey to find out about training provided by employers as part of a major European Union piece of research. The survey should take 20 – 25 minutes depending on the answers you provide.
RE-ASSURANCES TO USE IF NECESSARY
This organisation has been specifically selected in order to produce a representative cross section of British organisations.
All information collected will be treated in the strictest confidence. Responses will not be attributed to any individual or company. Results will be reported in the form of aggregated statistics.
The contact at the Department is Tony Clarke on 0114 274 2138.
The Research Managers at BMG are Ceri Matthias and Emma Parry on 0121 333 6006.
We work strictly within the Market Research Society Code of Conduct and you can verify the survey by calling 0500 396 999.
123
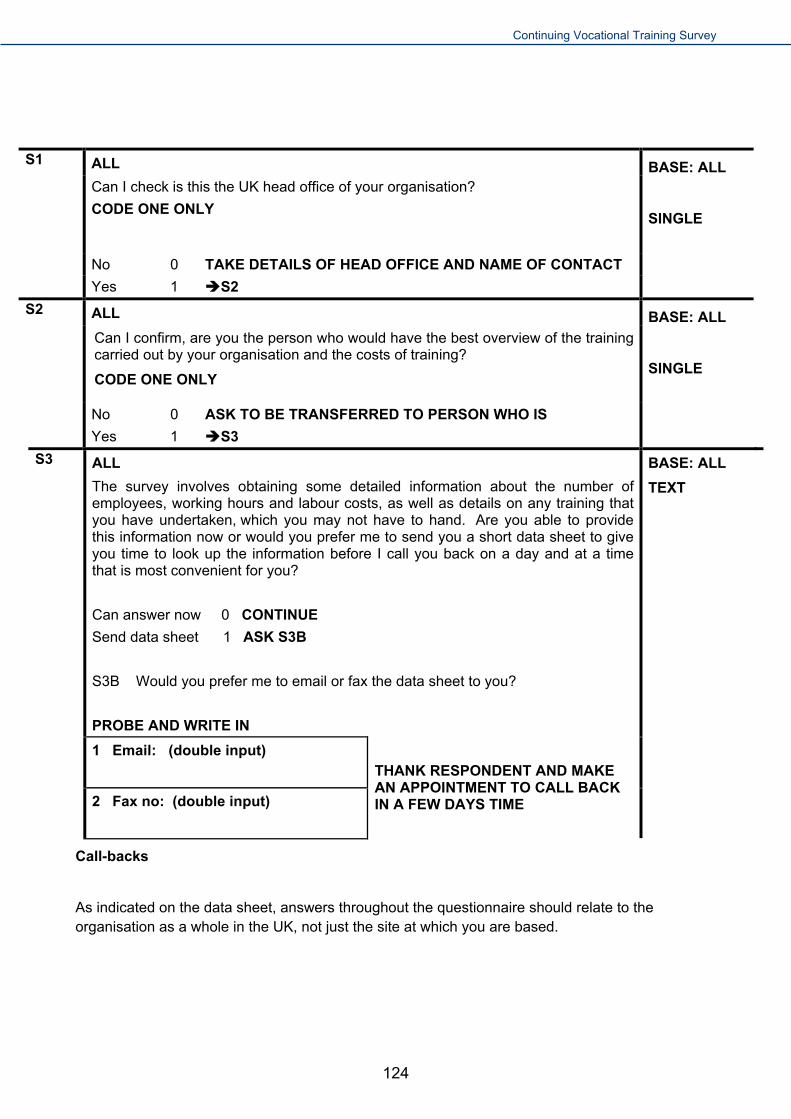
Continuing Vocational Training Survey
S1 ALL
Can I check is this the UK head office of your organisation?
CODE ONE ONLY
BASE: ALL
SINGLE
No 0 TAKE DETAILS OF HEAD OFFICE AND NAME OF CONTACT
Yes 1 S2
S2 ALL
Can I confirm, are you the person who would have the best overview of the training carried out by your organisation and the costs of training?
CODE ONE ONLY
BASE: ALL
SINGLE
No 0 ASK TO BE TRANSFERRED TO PERSON WHO IS
Yes 1 S3
S3 ALL
The survey involves obtaining some detailed information about the number of employees, working hours and labour costs, as well as details on any training that you have undertaken, which you may not have to hand. Are you able to provide this information now or would you prefer me to send you a short data sheet to give you time to look up the information before I call you back on a day and at a time that is most convenient for you?
Can answer now 0 CONTINUE
Send data sheet 1 ASK S3B
S3B Would you prefer me to email or fax the data sheet to you?
PROBE AND WRITE IN
BASE: ALL
TEXT
1 Email: (double input)
2 Fax no: (double input)
THANK RESPONDENT AND MAKE AN APPOINTMENT TO CALL BACK IN A FEW DAYS TIME
Call-backs
As indicated on the data sheet, answers throughout the questionnaire should relate to the organisation as a whole in the UK, not just the site at which you are based.
124

Continuing Vocational Training Survey
SECTION A: BACKGROUND DATA ON THE ORGANISATION
A1 ALL BASE: ALL I have (READ OUT SECTOR DESCRIPTION FROM SAMPLE) as a general classification for your organisation. Does this sound about right?
NACE Rev 2 A1
Yes 1
No 0
A2 Q1/0 BASE: ALL What is the main business activity of your organisation? Nace Rev 2 A1bis
PROBE AND WRITE IN
ALL A3 Approximately how many people were employed by your organisation across all sites in the UK at the end of the calendar year 2010? WRITE IN
A2tot
PROMPT: Include full and part time employees Include temporary and casual staff, but not agency staff Include people absent for a short period (e.g. sick leave)
BASE: ALL NUMERIC 6 digits: 10 to 999996
ALL A4 And how many of these people, employed at the end of the calendar year 2010 were male? WRITE IN
A2m
BASE: ALL NUMERIC 6 digits: 0 to 999996
No answer (NOT ON SCRIPT) 999999
ALL A5 And approximately how many were female? WRITE IN A2f
BASE: ALL NUMERIC 6 digits: 0 to 999996
No answer (NOT ON SCRIPT) 999999
CATI CHECK
ALL A6 And how many of these people, employed at the end of the calendar year 2010, were training on a Government recognised apprenticeship leading to a formal qualification? WRITE IN
BASE: ALL NUMERIC 6 digits: 1 to 999996
No answer (NOT ON SCRIPT) 999999
125

Continuing Vocational Training Survey
ALL A7
Approximately how many people were employed by your organisation across all sites in the UK at the end of the calendar year 2009? WRITE IN
BASE: ALL NUMERIC 6 digits: 1 to 999996
PROMPT: Include full and part time employees Include temporary and casual staff, but not agency staff Include people absent for a short period (e.g. sick leave)
No answer (NOT ON SCRIPT) 999999
Not trading in 2009 999998
A8 ALL In the calendar year 2010, what was the total number of paid hours worked by people employed by your organisation? Please EXCLUDE apprentices and young people, aged below 21, in their first job involved in an initial training programme.
BASE: ALL NUMERIC 12 digits: 1 to 999999999996
A4
IF RESPONDENT CANNOT GIVE PRECISE FIGURE ASK FOR BEST ESTIMATE IF RESPONDENT CANNOT GIVE BEST ESTIMATE GO TO A9 IF RESPONDENT ANSWERS GO TO A14
No answer (NOT ON SCRIPT) 999999999999
A9 ALL UNABLE TO PROVIDE ANSWER AT A8
What was the average number of hours worked per day by an average member of staff in your organisation (including any paid overtime hours)? By average member of staff we are excluding apprentices and young people, aged below 21, in their first job involved in an initial training programme.
No answer (NOT ON SCRIPT) 99
BASE: A8 (A4)/NA NUMERIC: 1 to 24 TO 1 DP
A10 ALL UNABLE TO PROVIDE ANSWER AT A8
What was the average number of days of annual leave that an average employee would take in your organisation?
No answer (NOT ON SCRIPT) 999
BASE: A8 (A4)/NA NUMERIC 3 digits: 1 to 996
A11 ALL UNABLE TO PROVIDE ANSWER AT A8 (A4)
ENGLAND AND WALES: In England and Wales there are typically 8 bank holidays. What is the average number of days of public or bank holidays that an average employee would take in your organisation?
IF NECESSARY: 4 of these fall on a Monday (Easter Monday, Early May Bank holiday, Spring bank holiday (late May) and August Summer bank holiday) and then there’s New Year’s Day, Good Friday, Christmas Day and Boxing Day.
BASE: A8 (A4)/NA NUMERIC 3 digits: 0 to 996
126

Continuing Vocational Training Survey
SCOTLAND: In Scotland there are typically 9 bank holidays. What is the average number of days of public or bank holidays that an average employee would take in your organisation?
IF NECESSARY: 3 of these fall on a Monday (Early May Bank holiday, Spring bank holiday (late May) and August Summer bank holiday) and then there’s 2 days for New Year, Good Friday, St Andrew’s Day, Christmas Day and Boxing Day.
NORTHERN IRELAND: In Northern Ireland there are typically 10 bank holidays. What is the average number of days of public or bank holidays that an average employee would take in your organisation?
IF NECESSARY: 4 of these fall on a Monday (Easter Monday, Early May Bank holiday, Spring bank holiday (late May) and August Summer bank holiday) and then there’s New Year’s Day, St Patrick’s Day, Good Friday, Orangemen’s Day, Christmas Day and Boxing Day.
No answer (NOT ON SCRIPT) 999
A12 ALL UNABLE TO PROVIDE ANSWER AT A8 (A4) Are there any other days off work that your staff are entitled to? IF NECESSARY: These could include industry shutdowns, including between Christmas and New Year, and the day off for the Queen’s birthday for instance.
CODE ONE ONLY
BASE: A8 (A4)/NA
SINGLE
No 0 A14
Yes 1
A13 ALL WHERE OTHER DAYS OFF AT A12 How many other days off work on average would your average staff member be entitled to?
BASE: A12>0 NUMERIC 3 digits: 1 to 996
No answer (NOT ON SCRIPT) 999
Not applicable 998
A4 ALL UNABLE TO PROVIDE ANSWER AT A8 (A4)
=(Total number of persons employed in 2010 (A2tot/A3)
*average hours per day (A9))*261
-((number of days leave at A10+A11+A13)*average hours per day (A9)
BASE: A8 (A4)/NA NUMERIC
12 digits: 1 to 999999999996
127

Continuing Vocational Training Survey
A14
ALL
BASE: ALL NUMERIC 12 digits: 1 to 999999999996
A5 In the calendar year 2010, what were the total labour costs for all of these employees?
Again, please EXCLUDE apprentices and young people in their first job involved in an initial training programme.
These would be all direct and indirect costs and would also include the cost of overtime and additional payments such as bonuses or commission.
IF NECESSARY: We can estimate the total labour costs using a few quick questions.
IF RESPONDENT CANNOT GIVE PRECISE FIGURE ASK FOR BEST ESTIMATE IF RESPONDENT CANNOT GIVE BEST ESTIMATE GO TO A15
IF RESPONDENT ANSWERS GO TO A19
PLEASE SPECIFY RESPONSE IN £ POUNDS STERLING
No answer (NOT ON SCRIPT) 999999999999 A15 ALL UNABLE TO PROVIDE ANSWER AT A14 (A5)
What would you say is the average salary of employees in your company, taking into account the lowest salary, the highest salary, and the salary that the largest number of employees is on?
Please exclude additional payments such as bonuses from this figure.
BASE: A14 (A5)/NA NUMERIC 12 digits: 1 to 999999999996
PLEASE SPECIFY RESPONSE IN £ POUNDS STERLING
No answer (NOT ON SCRIPT) 999999999999 A16 ALL UNABLE TO PROVIDE ANSWER AT A14 (A5) What is the average annual additional payment such as bonus or commission
that an average employee would earn in your company?
PLEASE SPECIFY RESPONSE IN £ POUNDS STERLING
BASE: A14 (A5)/NA NUMERIC 12 digits: 0 to 999999999996
No answer (NOT ON SCRIPT) 999999999999
A17 ALL UNABLE TO PROVIDE ANSWER AT A14 (A5) How many hours of overtime would you say has been worked by all employees in
total in the calendar year 2010?
BASE: A14 (A5)/NA NUMERIC 12 digits: 0 to 999999999996
No answer (NOT ON SCRIPT) 999999999999
128
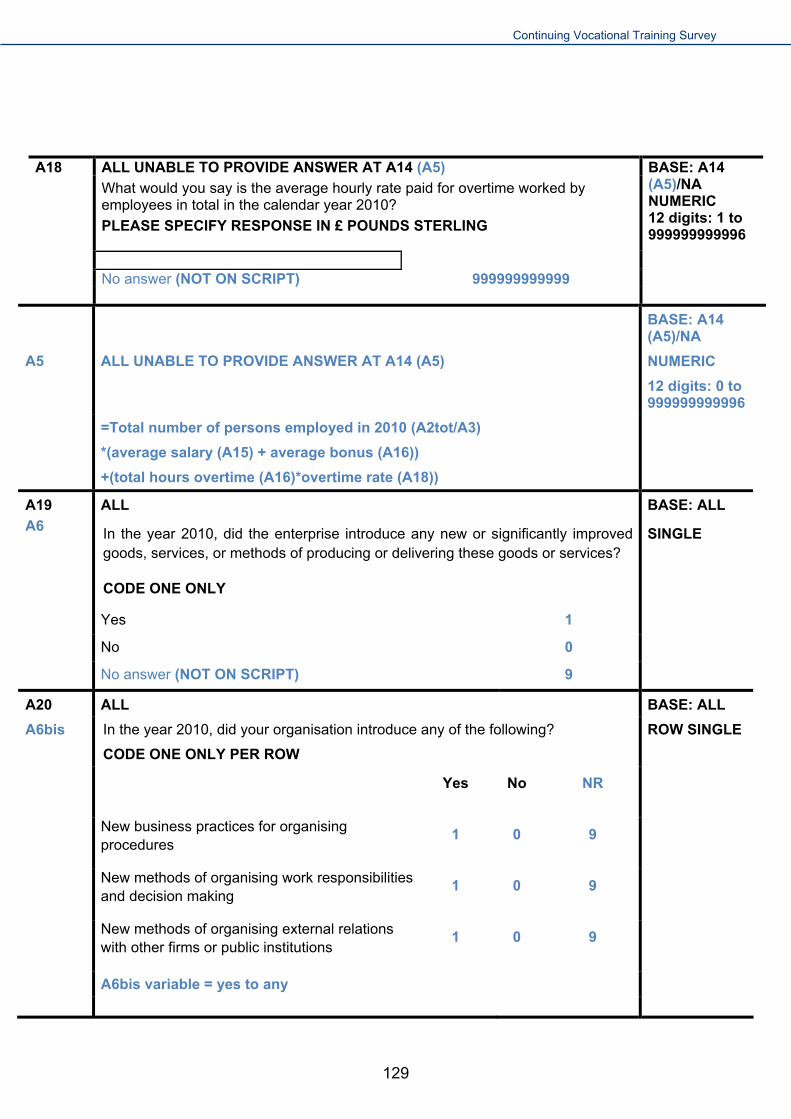
Continuing Vocational Training Survey
A18 ALL UNABLE TO PROVIDE ANSWER AT A14 (A5)
What would you say is the average hourly rate paid for overtime worked by employees in total in the calendar year 2010?
PLEASE SPECIFY RESPONSE IN £ POUNDS STERLING
BASE: A14 (A5)/NA NUMERIC 12 digits: 1 to 999999999996
No answer (NOT ON SCRIPT) 999999999999
ALL UNABLE TO PROVIDE ANSWER AT A14 (A5)
BASE: A14 (A5)/NA
NUMERIC
12 digits: 0 to 999999999996
A5
=Total number of persons employed in 2010 (A2tot/A3)
*(average salary (A15) + average bonus (A16))
+(total hours overtime (A16)*overtime rate (A18))
A19 ALL BASE: ALL
A6 In the year 2010, did the enterprise introduce any new or significantly improved goods, services, or methods of producing or delivering these goods or services?
CODE ONE ONLY
SINGLE
Yes 1
No 0
No answer (NOT ON SCRIPT) 9
A20 ALL BASE: ALL
In the year 2010, did your organisation introduce any of the following?
CODE ONE ONLY PER ROW
ROW SINGLE A6bis
Yes No NR
New business practices for organising procedures
1 0 9
New methods of organising work responsibilities and decision making
1 0 9
New methods of organising external relations with other firms or public institutions
1 0 9
A6bis variable = yes to any
129

Continuing Vocational Training Survey
SECTION B: CVT STRATEGIES
This section of the questionnaire addresses Continuing Vocational Training (CVT) strategies of the organisation
READ: I am now going to ask you some questions about Vocational Training. Vocational Training is training that would have been arranged for employees in advance, it would have been organised with a specific goal of developing new or existing competences and skills, and it would have been fully or at least partly funded by your organisation. Funding would include the paid time at work employees were involved in the training. Vocational Training would normally be delivered by a trainer or a coach and if not, a piece of equipment, such as a computer, would be used for the training. Vocational Training does not include training for apprentices or new employees. Trainees, people working on a training contract and inductions are not included in Vocational Training. KEY POINTS TO REPEAT IF NECESSARY: The training must be planned in advance. The training must be organised or supported with the specific goal of learning. The training must be financed fully or at least partly by the enterprise. B1 ALL
During the calendar year 2010, did your organisation run a training centre or run a shared training centre with other organisations, which had the necessary equipment to provide Vocational Training for its employees? CODE ONE ONLY
BASE: ALL
SINGLE
A7
Yes 1
No 0
No answer (NOT ON SCRIPT) 9
B2 ALL Is there a specific person or department within your organisation that has responsibility for arranging Vocational Training? CODE ONE ONLY
BASE: ALL
SINGLE
A8
Yes 1
No 0
No answer (NOT ON SCRIPT) 9
B3 ALL Does your organisation regularly assess the skills and competences it needs? IF NECESSARY: ‘Regularly’ covers the recent past years and the next few years. READ OUT AND CODE ONE ONLY
BASE: ALL
SINGLE
A9
Yes but not regularly, as and when required and mainly linked to changes in personnel
1
Yes, it is part of the overall planning process in the organisation
2
No 0
No answer (NOT ON SCRIPT) 9
130

Continuing Vocational Training Survey
B4 ALL
How does your organisation usually ensure it provides the skills and competences it will need in the future?
READ OUT AND CODE ONE ONLY PER ROW
BASE: ALL
ROW SINGLE A10
Yes No NR
a) We provide training to our existing staff 1 0 9 A10a
b) We recruit new staff that have the skills, competencies and qualifications we need
1 0 9 A10b
c) We recruit new staff who we provide with specific training
1 0 9 A10 c
d) We look at what skills and competencies we have amongst our employees and reassign staff or responsibilities where necessary
1 0 9 A10d
B5 ALL Does your organisation usually review the skill and training needs of individual employees? READ OUT AND CODE ONE ONLY
BASE: ALL
SINGLE
A11a
Yes, mainly by way of structured interviews 1 Yes, but mainly by way of other methods 2 No 0
No answer (NOT ON SCRIPT) 9 B9/A12
B6 ALL YES AT B5 (A11)
Do these reviews focus on.....?
READ OUT AND CODE ONE ONLY PER ROW
Yes No NA NR
BASE: B5 (A11)/1,2
ROW SINGLE
A11b
a) Certain occupations or groups of occupations (e.g. managers or senior officials, sales and customer service staff, skilled trades staff?)
1 0 8 9 A11ba
b) Certain skills and competences (e.g. management skills, team working skills, IT skills, customer handling skills?)
1 0 8 9
A11bb
c) Specific working tasks and activities
1 0 8 9 A11bc
d) Formal qualifications 1 0 8 9 A11bd
131

Continuing Vocational Training Survey
B7 ALL YES BY STRUCTURED INTERVIEWS AT B5 (A11)
Are structured interviews conducted with........?
READ OUT AND CODE ONE ONLY PER ROW
Yes No NA NR
BASE: B5 (A11)/1
ROW SINGLE A11abis
Upper and middle management staff 1 0 8 9
Other staff categories 1 0 8 9
B8 ALL YES BY STRUCTURED INTERVIEWS AT B5 (A11)
Do these interviews concern........?
READ OUT AND CODE ONE ONLY PER ROW
A11ater
Yes No NA NR
Personal development objectives/plans
1 0 8 9
BASE: B5 (A11)/1
ROW SINGLE
Wishes of the employees in terms of training
1 0 8 9
Information about career development and access to training
1 0 8 9
Conditions on which training courses are carried out (outside working hours)
1 0 8 9
B9 ALL BASE: ALL
In your organisation, which skills/competencies are generally considered as important for the development of your organisation in the next few years? Please think about any skills/competencies that may be important in the future, not just those that you currently have or that may be currently lacking and not just those amongst your directly employed staff.
READ OUT AND CODE ALL THAT APPLY
ROW SINGLE A12
Yes No NR
a) General IT skills 1 0 9 A12a
b) IT professional skills 1 0 9 A12b
c) Management skills 1 0 9 A12 c
d) Team working skills 1 0 9 A12d
e) Customer handling skills 1 0 9 A12e
f) Problem solving skills 1 0 9 A12f
g) Office administration skills 1 0 9 A12g
h) Foreign language skills i.e. non-English 1 0 9 A12h
i) Technical, practical or job-specific skills 1 0 9 A12i
j) Oral or written communication skills i.e. English
1 0 9 A12j
k) Numeracy and/or literacy skills 1 0 9 A12k
l) Other (none of these) Please specify 1 0 9 A12l
A12o o) Do not know 1 0 9
132

Continuing Vocational Training Survey
None of the listed categories (A12l=1) 0 A12flag At least one (A12a to k = 1 to any) 1 No needs or do not know (A12o=1) 2 No answer (A12a to o = 9 to all) 9
B10 ALL MENTIONING MORE THAN ONE AT B9 (A12)
And which skills/competencies are considered the most important for the development of your organisation in the next few years?
READ OUT AND CODE ONE ONLY
A12main
a) General IT skills a
BASE: B9 (A12)/MORE THAN ONE MENTIONED
SINGLE
b) IT professional skills b
c) Management skills c
d) Team working s kills d
e) Customer handling skills e
f) Problem solving skills f
g) Office administration skills g
h) Foreign language skills h
i) Technical, practical or job-specific skills i
j) Oral or written communication skills j
k) Numeracy and/or literacy skills k
Not applicable (A12flag = 2 or 9) (NOT ON SCRIPT) 8
No answer (NOT ON SCRIPT) 9
B11 ALL
Does the planning of Vocational Training within your organisation lead to a written training plan or programme?
CODE ONE ONLY
BASE: ALL
SINGLE
A13
Yes 1
No 0
Not applicable 8
No answer (NOT ON SCRIPT) 9
B12 ALL
Does your organisation have an annual training budget, which includes provision for Vocational Training?
CODE ONE ONLY
BASE: ALL
SINGLE A14
Yes 1
No 0
Not applicable 8
No answer (NOT ON SCRIPT) 9
133

Continuing Vocational Training Survey
B13 ALL BASE: ALL
In your organisation, do written agreements between Government, local area or trade associations or trade unions regulate the provision of Vocational Training?
(This can cover type and frequency of training by branch and occupation as well as financial aspects.)
CODE ONE ONLY
SINGLE A15
Yes 1
No 0
Do not know 7
Not applicable 8
No answer (NOT ON SCRIPT) 9
B14 ALL BASE: ALL
In your organisation, are staff representatives/committees usually involved in the Vocational Training management process?
CODE ONE ONLY
SINGLE A16a
Yes 1 B15/A17
No 0
Not applicable 8 B16/ A17
No answer (NOT ON SCRIPT) 9 B16/ A17
B15 ALL YES AT B14 (A16)
Which aspects of the Vocational Training management process are they usually involved in?
READ OUT AND CODE ONE ONLY PER ROW
Yes No NA NR
BASE: B14 (A16)/1
ROW SINGLE A16b
a) Objective setting of training 1 0 8 9 A16ba
b) Establishing criteria for the selection of participants or specific target groups
1 0 8 9 A16bb
c) Form/type of training (internal/external courses; other forms, such as guided on-the-job training etc)
1 0 8 9 A16bc
d) Content of training 1 0 8 9 A16bd
e) Budget for training 1 0 8 9 A16be
f) Selection of external training providers
1 0 8 9 A16bf
g) Evaluation/assessment of training outcomes
1 0 8 9 A16bg
134

Continuing Vocational Training Survey
B16 ALL
Which sources of information or advice does your organisation usually use for information about Vocational Training providers and offerings?
READ OUT AND CODE ONE ONLY PER ROW
BASE: ALL
ROW SINGLE A17
Yes No NR
a) Public information centres/services and authorities (e.g., Business Link, learndirect/Next Step, etc)
1 0 9 A17a
b) Private training providers 1 0 9 A17b
c) Personnel/staff representatives such as trade union or other staff
1 0 9 A17c
d) Others Please specify 1 0 9 A17d
e) Do not use any specific source of information 1 0 9 A17e
SECTION C: CVT CHARACTERISTICS
This section of the questionnaire addresses Continuing Vocational Training (CVT) activities for persons employed in the organisation
READ: I am now going to ask you some more questions about the Vocational Training provided by your organisation and the nature of this provision. To recap, Vocational Training is training that would have been arranged for employees in advance, it would have been organised with a specific goal of developing new or existing competences and skills, and it would have been fully or at least partly funded by your organisation. Funding would include the paid time at work employees were involved in the training. Vocational Training would normally be delivered by a trainer or a coach and if not, a piece of equipment, such as a computer, would be used for the training. Vocational Training does not include training for apprentices or new employees. Trainees, people working on a training contract and inductions are not included in Vocational Training. KEY POINTS TO NOTE/REMIND RESPONDENT OF IF NECESSARY: The training must be planned in advance. The training must be organised or supported with the specific goal of learning. The training must be financed fully or at least partly by the enterprise. 'Just to remind you, I need you to talk to me about vocational training, which is training that is planned in advance, that is organised or supported with the specific goal of learning and is financed fully or at least partly by the enterprise. It does not include training for apprentices or new employees and trainees, people working on a training contract and inductions are not included in vocational training'
135

Continuing Vocational Training Survey
C1 ALL
In the calendar year 2010, did any employees within your organisation take part in?
READ OUT AND CODE ONE ONLY PER ROW
BASE: ALL
ROW SINGLE
B1
Yes No
a) Internal Vocational Training courses
(IF NECESSARY: These are courses which are principally designed and managed by the organisation itself)
1 0 B1a
b) External Vocational Training courses
(IF NECESSARY: These are courses which are principally designed and managed by a third party organisation)
1 0
B1b
C2 ALL READ: I am now going to ask you a few questions about other forms of Vocational Training. In the calendar year 2010, did any employees within your organisation take part in planned training through guided on-the job-training?
(IF NECESSARY: Planned periods of training, instruction or practical experience undertaken in the work place using normal tools of work, either at the immediate place of work or in the work situation)
CODE ONE ONLY
BASE: ALL
SINGLE
B2aflag
Yes 1
No 0
C3 ALL YES AT C2 (B2aflag) B2a How many people employed participated in planned training through guided on-
the job-training?
BASE: C2 (B2aflag)/1 NUMERIC 6 digits: 0 to 999996
Not applicable (NOT ON SCRIPT) 999998 No answer (NOT ON SCRIPT) 999999
C4 ALL
In 2010, did any employees within your organisation take part in planned training through job-rotation, exchanges, secondments or study visits?
(IF NECESSARY: Transfers of workers from one job to another, which are not part of a planned developmental programme, should not be included)
CODE ONE ONLY
BASE: ALL
SINGLE
B2bflag
Yes 1
No 0
136

Continuing Vocational Training Survey
C5 ALL YES AT C4 (B2bflag) B2b How many people employed participated in planned training through job-rotation,
exchanges, secondments or study visits?
Not applicable (NOT ON SCRIPT) 999998 No answer (NOT ON SCRIPT) 999999
BASE: C4 (B2bflag)/1 NUMERIC 6 digits: 0 to 999996
C6 ALL
In 2010, did any employees within your organisation take part in planned training through attendance at conferences, workshops, trade fairs and lectures?
(IF NECESSARY: Attendance (instruction received) at these events is counted as training, only when they are planned in advance and the primary intention of a person employed attending them is training/learning)
CODE ONE ONLY
BASE: ALL
SINGLE
B2cflag
Yes 1
No 0
C7 ALL YES AT C6 (B2cflag) B2c How many people employed participated in planned training through attendance
at conferences, workshops, trade fairs and lectures?
Not applicable 999998
BASE: C6 (B2cflag)/1 NUMERIC 6 digits: 0 to 999996
No answer 999999
C8 ALL
In 2010, did any employees within your organisation take part in planned training through participation in learning or quality circles?
READ OUT: Learning circles are groups of persons employed who come together on a regular basis with the primary aim of learning more about the requirements of the work organisation, work procedures and work places. Quality circles are working groups with the objective of solving production and work place problems through discussion
CODE ONE ONLY
BASE: ALL
SINGLE
B2dflag
Yes 1
No 0
C9 ALL YES AT C8 (B2dflag)
B2d How many people employed participated in planned training through participation in learning or quality circles?
BASE: C8 (B2dflag)/1 NUMERIC 6 digits: 0 to 999996
Not applicable (NOT ON SCRIPT) 999998 No answer (NOT ON SCRIPT) 999999
137

Continuing Vocational Training Survey
C10 ALL
In 2010, did any employees within your organisation take part in planned training by self directed learning (e.g. self-directed e-learning)?
(IF NECESSARY: Self directed learning occurs when an individual engages in a planned learning initiative where he or she manages the training time and the place at which the learning takes place. This covers e-learning when it is self-directed)
CODE ONE ONLY
BASE: ALL
SINGLE
B2eflag
Yes 1
No 0
C11 ALL YES AT C10 (B2eflag) How many people employed participated in planned training by self directed learning?
B2e
Not applicable (NOT ON SCRIPT) 999998
BASE: C10 (B2eflag)/1 NUMERIC 6 digits: 0 to 999996
No answer (NOT ON SCRIPT) 999999
C12 ALL
Did your organisation provide Vocational Training courses for its employees in the previous year, 2009? I am referring here to internal or external courses either managed by the organisation itself or a third party.
CODE ONE ONLY
BASE: ALL
SINGLE
B3a
Yes 1
No 0
Not applicable 8
No answer (NOT ON SCRIPT) 9
C13 ALL
During 2009, did your organisation provide any of these other forms of Vocational Training for its employees? I am referring here to guided on the job training, secondments, quality circles, self directed learning and conferences.
CODE ONE ONLY
BASE: ALL
SINGLE
B4a
Yes 1
No 0
Not applicable 8
No answer (NOT ON SCRIPT) 9
138

Continuing Vocational Training Survey
C14 ALL
In 2010, Did your organisation contribute to collective or other funds for Vocational Training activities? By collective funds I mean funds or grants managed by a trade, industry or sector association that may have responsibility for arranging qualifications and training at a trade, industry or sectoral level.
CODE ONE ONLY
BASE: ALL
SINGLE
B5aflag
Yes 1 C16/B5bflag
No 0
No answer (NOT ON SCRIPT) 9 C16/B5bflag
C15 ALL YES AT C14 (B5aflag) B5a And how much did your organisation contribute to such funds?
TOTAL CONTRIBUTION (£)
Not applicable (B5aflag≠1) (NOT ON SCRIPT) 999998
BASE: C14 (B5aflag)/1 NUMERIC 6 digits: 0 to 999996
No answer (NOT ON SCRIPT) 999999
C16 ALL
Did your organisation receive payments from such funds or any other financial grants or subsidies for the provision of Vocational Training courses?
CODE ONE ONLY
BASE: ALL
SINGLE
B5bflag
Yes 1
No 0
No answer 9
C17 ALL YES AT C16 (B5bflag) And how much did you receive in financial grants or subsidies for Vocational Training activities?
B5b
TOTAL RECEIVED PAYMENTS (£)
Not applicable (B5bflag≠1) (NOT ON SCRIPT) 999998
BASE: C16 (B5bflag)/1 NUMERIC 6 digits: 0 to 999996
No answer (NOT ON SCRIPT) 999999
139

Continuing Vocational Training Survey
C18 ALL YES AT C16 (B5bflag)
Which of the following does your organisation usually benefit from for providing Vocational Training?
READ OUT AND CODE ONE ONLY PER ROW
Yes No NA
NR
BASE: C16 (B5bflag)/1
ROW SINGLE
B6
Tax incentives (Tax allowances, tax exemptions, tax credits, tax relief, tax deferrals)
1 0 8 9 B6a
Receipts from training funds (national, regional, sectoral)
1 0 8 9 B6b
EU subsidies (e.g., European Social Fund)
1 0 8 9 B6c
Government subsidies 1 0 8 9 B6d
Other sources (e.g., receipts from private foundations, receipts from external bodies/persons for the use of the enterprise's own training centre, receipts for training provision to external bodies/persons that are not part of the enterprise)
1 0 8 9 B6e
None of these 1 0 8 9 B6f
FILTERS If persons employed by enterprise participated in CVT courses during 2010
If C1a=yes or C1b=yes
(B1a=yes or B1b=yes)
SECTIONS D, E, G
If persons employed by enterprise did not participate in CVT courses but did participate in other forms of CVT during 2010
If (C1a=no and C1b=no) and (C2 or C4 or C6 or C8 or C10=yes)
(B1a=no and B1b=no) and (B2aflag or B2bflag or B2cflag or B2dflag or B2eflag=yes)
SECTIONS E, G
If persons employed by enterprise did not participate in CVT courses during 2010
If (C1a=no and C1b=no) and (C2 and C4 and C6 and C8 and C10=no)
(B1a=no and B1b=no) and (B2aflag and B2bflag and B2cflag and B2dflag and B2eflag=no)
SECTIONS F, G
140

Continuing Vocational Training Survey
SECTION D: CVT PARTICIPANTS, SUBJECTS, PROVIDERS AND COST (CVT COURSES)
This section of relates to the organisation’s provision of CVT courses for their employees.
I am now going to ask you some questions about employee participation in Vocational Training courses. To recap, Vocational Training is training that would have been arranged for employees in advance, it would have been organised with a specific goal of developing new or existing competences and skills, and it would have been fully or at least partly funded by your organisation. Funding would include the paid time at work employees were involved in the training. Vocational Training would normally be delivered by a trainer or a coach and if not, a piece of equipment, such as a computer, would be used for the training. Vocational Training does not include training for apprentices or new employees. Trainees, people working on a training contract and inductions are not included in Vocational Training. KEY POINTS TO NOTE/REMIND RESPONDENT OF IF NECESSARY: The training must be planned in advance. The training must be organised or supported with the specific goal of learning. The training must be financed fully or at least partly by the enterprise. 'Just to remind you, I need you to talk to me about vocational training, which is training that is planned in advance, that is organised or supported with the specific goal of learning and is financed fully or at least partly by the enterprise. It does not include training for apprentices or new employees and trainees, people working on a training contract and inductions are not included in vocational training' D1 ALL WHERE PERSONS EMPLOYED BY ORGANISATION PARTICIPATED IN
CVT COURSES DURING 2010 In 2010, how many employees in your organisation participated in one or more Vocational Training courses, either internal or external? Each person should only be counted once irrespective of the number of Vocational Training courses they have participated in.
BASE: C1a (B1a)/1 OR C1b (B1b)/1 NUMERIC 6 digits: 1 to 999996
C1tot
Not applicable (B1a or B1b ≠1) (NOT ON SCRIPT) 999998 No answer (NOT ON SCRIPT) 999999
D2 ALL WHERE PERSONS EMPLOYED BY ORGANISATION PARTICIPATED IN
CVT COURSES DURING 2010 And how many of these employees were male? C2m
Not applicable (B1a or B1b ≠1) (NOT ON SCRIPT) 999998
No answer (NOT ON SCRIPT) 999999
BASE: C1a (B1a)/1 OR C1b (B1b)/1 NUMERIC 6 digits: 0 to 999996
141

Continuing Vocational Training Survey
D3 ALL WHERE PERSONS EMPLOYED BY ORGANISATION PARTICIPATED IN CVT COURSES DURING 2010
And how many of these employees were female? C2f
BASE: C1a (B1a)/1 OR C1b (B1b)/1
NUMERIC
6 digits: 0 to 999996
Not applicable (B1a or B1b ≠1) (NOT ON SCRIPT) 999998
No answer (NOT ON SCRIPT) 999999 CATI CHECK
D4 ALL WHERE PERSONS EMPLOYED BY ORGANISATION PARTICIPATED IN CVT COURSES DURING 2010 In 2010, how many paid working hours in total were spent on Vocational Training courses by all employees?
C3tot
Not applicable (B1a or B1b ≠1) (NOT ON SCRIPT) 9999999998
BASE: C1a (B1a)/1 OR C1b (B1b)/1 NUMERIC 10 digits: 1 to 999996
No answer (NOT ON SCRIPT) 9999999999
D5 ALL WHERE PERSONS EMPLOYED BY ORGANISATION PARTICIPATED IN INTERNAL CVT COURSES DURING 2010
And how many of these paid working hours were spent on internally managed Vocational Training courses, as opposed to externally managed courses?
BASE: C1a (B1a)/1 NUMERIC 10 digits: 0 to 9999999996
C3i
Not applicable (B1a or B1b ≠1) (NOT ON SCRIPT) 9999999998 No answer (NOT ON SCRIPT) 9999999999 CATI CHECK
D6 ALL WHERE PERSONS EMPLOYED BY ORGANISATION PARTICIPATED IN
EXTERNAL CVT COURSES DURING 2010
And how many of these paid working hours were spent on externally managed courses?
BASE: C1b (B1b)/1 NUMERIC 10 digits: 0 to 9999999996
C3e
Not applicable (B1a or B1b ≠1) (NOT ON SCRIPT) 9999999998 No answer (NOT ON SCRIPT) 9999999999 CATI CHECK
142

Continuing Vocational Training Survey
D7 ALL WHERE PERSONS EMPLOYED BY ORGANISATION PARTICIPATED IN CVT COURSES DURING 2010
In 2010, which of the following skills/competencies were you looking to develop through the provision of Vocational Training courses?
IF NECESSARY: If a course does not fit exactly with one skill/competence please select the nearest one.
READ OUT AND CODE ALL THAT APPLY
Yes No NA
BASE: C1a (B1a)/1 OR C1b (B1b)/1
ROW SINGLE
C5
a) General IT skills 1 0 8 C5a
b) IT professional skills 1 0 8 C5b
c) Management skills 1 0 8 C5c
d) Team working skills 1 0 8 C5d
e) Customer handling skills 1 0 8 C5e
f) Problem solving skills 1 0 8 C5f
g) Office administration skills 1 0 8 C5g
h) Foreign language skills i.e. non-English 1 0 8 C5h
i) Technical, practical or job-specific skills 1 0 8 C5i
j) Oral or written communication skills i.e. English 1 0 8 C5j
k) Numeracy and/or literacy skills 1 0 8 C5k
l) Other Please specify 1 0 8 C5l
Other only (C5l only =1) 0 C5flag
At least one (C5a to k = 1 to any) 1
Not applicable (B1a or B1b ≠1) 8
No answer (No answer to C5) 9
143

Continuing Vocational Training Survey
D8 ALL MENTIONING OTHER OR SOME AT D7 And which is the most important in relation to the number of all training hours spent on Vocational Training courses within paid working time? CODE ONE ONLY
C5main
a) General IT skills 1
b) IT professional skills 2
c) Management skills 3
BASE: D7 (C5flag)/ OTHER (0) OR SOME (1) MENTIONED
SINGLE
d) Team working skills 4
e) Customer handling skills 5
f) Problem solving skills 6
g) Office administration skills 7
h) Foreign language skills 8
i) Technical, practical or job-specific skills 9
j) Oral or written communication skills 10
k) Numeracy and/or literacy skills 11
Not applicable (C5flag = 8 or 9) (NOT ON SCRIPT) 12
No answer (NOT ON SCRIPT) 13
D9 ALL WHERE TIME SPENT ON CVT COURSES AT D4 (C3tot) Some Vocational Training courses on occupational health and safety are a mandatory requirement and have to be organised regularly. What share of all training hours in Vocational Training courses in 2010 was spent on such mandatory courses (for Vocational Training courses during paid working time)? Please give your response as a percentage. PROBE FOR NEAREST %
C4
BASE: D4 (C3tot)>0 NUMERIC 3 digits:0 to 100
Not applicable (NOT ON SCRIPT) 998
No answer (NOT ON SCRIPT) 999 D10 ALL WHERE TIME SPENT ON CVT COURSES AT D4 (C3tot)
Thinking now about qualifications, what share of all training hours in Vocational Training courses in 2010 were spent on courses leading towards a nationally recognised qualification?
PROBE FOR NEAREST %
C5UK
BASE: D4 (C3tot)>0 NUMERIC 3 digits:0 to 100
Not applicable (NOT ON SCRIPT) 998
No answer (NOT ON SCRIPT) 999
144

Continuing Vocational Training Survey
D11 ALL WHERE PERSONS EMPLOYED BY ORGANISATION PARTICIPATED IN EXTERNAL CVT COURSES DURING 2010 In 2010, which training providers did your organisation use for external Vocational Training courses?
IF NECESSARY: If a course provider does not fit exactly to one type please select the nearest one.
READ OUT AND CODE ALL THAT APPLY
Yes No NA
BASE: C1a (B1a)/1
ROW SINGLE C6
a) Schools, colleges, universities and other higher education institutions
1 0 8 C6a
b) Public training institutions (financed or guided by the government; e.g. adult education centres)
1 0 8 C6b
c) Private training companies 1 0 8 C6c
d) Private companies whose main activity is not training. (e.g. equipment or software suppliers, parent/associate companies)
1 0 8 C6d
e) Employer’s associations, chambers of commerce, sector bodies
1 0 8 C6e
f) Trade unions 1 0 8 C6f
g) Other training providers 1 0 8 C6g
Other only (C6g=1) 0 C6flag
At least one (C6a to f = 1 to any) 1
Not applicable (B1b ≠ 1) 8
No answer (No answer to C6) 9
D12 ALL MENTIONING OTHER OR SOME AT D11 (C6)
And which has involved the largest number of all training hours within paid working time with regard to external Vocational Training courses?
CODE ONE ONLY
C6main
a) Schools, colleges, universities and other higher education institutions 1
BASE: D11 (C6flag)/ OTHER (0) OR SOME (1) MENTIONED
SINGLE
b) Public training institutions (financed or guided by the government; e.g. adult education centres)
2
c) Private training companies 3
d) Private companies whose main activity is not training. (e.g. equipment suppliers, parent/associate companies)
4
e) Employer’s associations, chambers of commerce, sector bodies
5
f) Trade unions 6
g) Other training providers 7
Not applicable (C6flag = 8 or 9) (NOT ON SCRIPT) 8
No answer (NOT ON SCRIPT) 9
145

Continuing Vocational Training Survey
D13 ALL WHERE PERSONS EMPLOYED BY ORGANISATION PARTICIPATED IN CVT COURSES DURING 2010 I would now like to ask you to outline the costs involved in providing Vocational Training courses in 2010. Did you incur costs in any of the following areas when providing Vocational Training courses?
READ OUT AND CODE ONE ONLY PER ROW
Yes No NA NR
BASE: C1a (B1a)/1 OR C1b (B1b)/1
SINGLE
C7
D13a
C7aflag
Fees and payments for Vocational Training courses in 2010? These costs may include course fees, the cost of assessors and examiners and the cost of external trainers used to support internal courses.
1 0 8 9 D14a/C7a
D13b
C7bflag
Travel and subsistence payments IF NECESSARY: Payments made in relation to the travel and subsistence of participants engaged in Vocational Training courses.
1 0 8 9 D14b/C7b
D13c
C7cflag
Labour costs for internal trainers for Vocational Training courses? IF NECESSARY: Labour costs of staff of own training centre and other staff exclusively or partly involved in designing and managing Vocational Training courses.
1 0 8 9 D14c/C7c
D13d
C7dflag
Training centre, training premises or specific training rooms of the organisation and costs for teaching materials? IF NECESSARY: Annual depreciation for rooms and equipment, running costs for training centre or other premises and costs of materials bought specifically for Vocational Training courses.
1 0 8 9 D14d/C7d
D14a ALL WHERE INCURRED COSTS FOR FEES AND PAYMENTS AT D13a (C7aflag) What was the cost to your organisation for fees and payments for Vocational Training courses?
IF RESPONDENT CANNOT GIVE PRECISE FIGURE ASK FOR BEST ESTIMATE
BASE:D13a (C7aflag)/1
NUMERIC
10 digits: 0 to 9999999996
C7a
Not applicable (C7aflag ≠1) (NOT ON SCRIPT) 9999999998
No answer (NOT ON SCRIPT) 9999999999
146

Continuing Vocational Training Survey
D14b ALL WHERE INCURRED COSTS FOR TRAVEL AND SUBSISTENCE AT D14b (C7bflag)
What was the cost to your organisation for travel and subsistence payments for Vocational Training courses?
IF RESPONDENT CANNOT GIVE PRECISE FIGURE ASK FOR BEST ESTIMATE
BASE: D13b (C7bflag)/1
NUMERIC
10 digits: 0 to 9999999996
C7b
Not applicable (C7bflag ≠1) (NOT ON SCRIPT) 9999999998
No answer (NOT ON SCRIPT) 9999999999
D14c ALL WHERE INCURRED COSTS FOR LABOUR COSTS FOR INTERNAL TRAINERS AT D13c (C7cflag)
What was the cost for your organisation for labour costs for internal trainers for Vocational Training courses?
IF RESPONDENT CANNOT GIVE PRECISE FIGURE ASK FOR BEST ESTIMATE
BASE: D13c (C7cflag)/1
NUMERIC
10 digits: 0 to 9999999996
C7c
Not applicable (C7cflag ≠1) (NOT ON SCRIPT) 9999999998
No answer (NOT ON SCRIPT) 9999999999
D14d ALL WHERE INCURRED COSTS FOR TRAINING PREMISES AT D13d (C7dflag)
What was the cost to your organisation for the training centre, training premises or specific training rooms and teaching materials?
IF RESPONDENT CANNOT GIVE PRECISE FIGURE ASK FOR BEST ESTIMATE
BASE: D13d (C7dflag)/1
NUMERIC
10 digits: 0 to 9999999996
C7d
Not applicable (C7dflag ≠1) (NOT ON SCRIPT) 9999999998
No answer (NOT ON SCRIPT) 9999999999
D15 ONLY ASK WHERE RESPONDENT IS UNABLE TO PROVIDE BREAKDOWN ABOVE
Did your organisation incur any of the costs I have mentioned through the provision of Vocational Training courses?
CODE ONE ONLY
BASE: D14a (C7a), D14b (C7b), D14c (C7c), D14d (C7d)/NO ANSWER
SINGLE
C7sflag
Yes 1 E1/D1
No 0
Not applicable (NOT ON SCRIPT) 8 E1/D1
No answer (NOT ON SCRIPT) 9 E1/D1
147

Continuing Vocational Training Survey
D16 ALL WHERE INCURRED COSTS AT ALL AT D15 (C7sflag)
What was the total cost to your organisation in the calendar year 2010 of providing Vocational Training courses?
IF RESPONDENT CANNOT GIVE PRECISE FIGURE ASK FOR BEST ESTIMATE
BASE: D15 (C7sflag)/1
NUMERIC
10 digits: 1 to 9999999996
C7sub
PAC ALL WHERE PERSONS EMPLOYED BY ORGANISATION PARTICIPATED IN CVT COURSES DURING 2010
Personal Absence Cost =C3tot*A5/A4
Not applicable 9999999998
No answer 9999999999
BASE: C1a (B1a)/1 OR C1b (B1b)/1
NUMERIC
10 digits: 1 to 9999999996
C7tot ALL WHERE PERSONS EMPLOYED BY ORGANISATION PARTICIPATED IN CVT COURSES DURING 2010
TOTAL COST CVT =C7sub+B5a-B5b
Not applicable 9999999998
No answer 9999999999
BASE: C1a (B1a)/1 OR C1b (B1b)/1
NUMERIC
10 digits: 1 to 9999999996
SECTION E: CVT PARTICIPANTS, SUBJECTS, PROVIDERS AND COST (CVT COURSES)
E1 PROVIDE CVT COURSES OR OTHER FORMS OF CVT
In 2010, which of the following did your organisation use to ensure the quality of Vocational Training courses?
READ OUT AND CODE ALL THAT APPLY
D1
Yes No NA
NR
a) Certification of external providers (e.g., use of national registers)
1 0 8 9 D1a
b) Continuous training of internal trainers
1 0 8 9 D1b
c) Continuing vocational training and certification based on national/sectoral recognised standards or frameworks
1 0 8 9
d) Other Please specify 1 0 8 9
BASE: C1a (B1a)/1 OR C1b (B1b)/1OR C2 (B2aflag)/1 or C4 (B2bflag)/1 or C6 (B2cflag)/1 or C8/1 (B2dflag) or C10 (B2eflag)/1
ROW SINGLE
D1c
D1d
e) No particular aspect considered 1 0 8 9 D1e
Note*: Not applicable = (B1a and B1b=0) AND (B2aflag AND B2bflag AND B2cflag AND B2dflag AND B2eflag=0)
148

Continuing Vocational Training Survey
E2 PROVIDE CVT COURSES OR OTHER FORMS OF CVT Does your organisation usually assess the outcomes of Vocational Training courses?
READ OUT AND CODE ONE ONLY
D2a
Yes, for all activities 1
Yes, for some activities 2
No, confirmation of participation is sufficient 0
Not applicable (B1a and B1b=0) AND (B2aflag AND B2bflag AND B2cflag AND B2dflag AND B2eflag=0)
8
No answer (NOT ON SCRIPT) 9
BASE: C1a (B1a)/1 OR C1b (B1b)/1OR C2 (B2aflag)/1 or C4 (B2bflag)/1 or C6 (B2cflag)/1 or C8/1 (B2dflag) or C10 (B2eflag)/1
SINGLE
E3 ASSESS OUTCOMES OF CVT COURSES AT E2 (D2a)
Which of the following methods are used to assess the outcomes?
READ OUT AND CODE ONE ONLY PER ROW
D2b
Yes No NA
NR
a) Certification after written or practical test
1 0 8 9
BASE: E2 (D2a)/1, 2
ROW SINGLE
D2ba
b) Satisfaction survey amongst participants
1 0 8 9 D2bb
c) Assessment of participants’ behaviour or performance in relation to training objectives
1 0 8 9 D2bc
d) Assessment/measurement of the impact of training on performance of relevant departments or the whole organisation
1 0 8 9 D2bd
149

Continuing Vocational Training Survey
E4
PROVIDE CVT COURSES OR OTHER FORMS OF CVT
In 2010, which of the following reasons describe why your organisation did not provide more vocational training courses or other forms of vocational training?
READ OUT AND CODE ONE ONLY PER ROW. ROTATE
D3
Yes No NA
NR
a) The level of training provided was sufficient for your organisation’s needs (no limiting factors)
1 0 8 9
b) Your organisation prefers to recruit individuals with the required skills and competences
1 0 8 9
BASE: C1a (B1a)/1 OR C1b (B1b)/1OR C2 (B2aflag)/1 or C4 (B2bflag)/1 or C6 (B2cflag)/1 or C8/1 (B2dflag) or C10 (B2eflag)/1
ROW SINGLE D3a
D3b
c) It was difficult to assess the Vocational Training needs of your organisation
1 0 8 9 D3c
d) There was a lack of suitable Vocational Training courses on the market
1 0 8 9 D3d
e) The costs of Vocational Training courses was too high
1 0 8 9 D3e
f) Your organisation had a greater focus on training apprentices and new employees than on training existing employees
1 0 8 9 D3f
g) There had been a greater focus on Vocational Training in your organisation in previous years
1 0 8 9 D3g
h) Employees had a high workload and there was limited time available for staff to participate in Vocational Training
1 0 8 9 D3h
i) Other reasons Please specify 1 0 8 9 D3i
Note*: Not applicable = (B1a and B1b=0) AND (B2aflag AND B2bflag AND B2cflag AND B2dflag AND B2eflag=0)
150

Continuing Vocational Training Survey
SECTION F: REASONS FOR NON-PROVISION OF CVT ACTIVITIES
F1 DO NOT PROVIDE CVT COURSES OR OTHER FORMS OF CVT
Which of the following are reasons why your organisation did not provide any Vocational Training courses or any other forms of Vocational Training for employees during the calendar year 2010?
READ OUT AND CODE ONE ONLY PER ROW. ROTATE
E1
Yes No NA
NR
a) The existing qualifications, skills and competences of employees met the current needs of your organisation
1 0 8 9 E1a
b) The organisation preferred to recruit individuals with the required qualifications, skills and competences
1 0 8 9
c) It was difficult to assess The Vocational Training needs of your organisation
1 0 8 9
BASE: C1a (B1a)/2 AND C1b (B1b)/2 AND C2 (B2aflag)/2 AND C4 (B2bflag)/2 AND C6 (B2cflag)/2 AND C8 (B2dflag)/2 AND C10(B2eflag)/2
ROW SINGLE
E1b
E1c
d) There was a lack of suitable Vocational Training courses on the market
1 0 8 9 E1d
e) The costs of Vocational Training courses was too high
1 0 8 9 E1e
f) Your organisation had a greater focus on training apprentices and new employees than on training existing employees
1 0 8 9 E1f
g) There had been a greater focus on Vocational Training in your organisation in previous years
1 0 8 9 E1g
h) Employees had a high workload and there was limited time available for staff to participate in Vocational Training
1 0 8 9 E1h
i) Other reasons Please specify 1 0 8 9 E1i
Note*: Not applicable = (B1a or B1b=1) OR (B2aflag OR B2bflag OR B2cflag OR B2dflag OR B2eflag=0)
151

Continuing Vocational Training Survey
SECTION G: IVT – INITIAL VOCATIONAL TRAINING
G1 ALL Did your organisation employ anyone on a Government recognised apprenticeship leading to a formal qualification in 2010?
CODE ONE ONLY
BASE: ALL
F0
Yes 1
No 0 G3
Not applicable (NOT ON SCRIPT) 8 G3/F1tot
No answer (NOT ON SCRIPT) 9 G3/F1tot
G2 ALL WHERE NO APPRENTICES AT G1 (F0)
What are the reasons why your organisation didn’t employ anyone on a Government recognised apprenticeship in 2010?
DO NOT READ OUT. PROBE FULLY AND CODE ALL THAT APPLY
All staff are fully trained 1
BASE: G1 (F0)/0
TEXT
Not relevant/applicable to your business/don’t need them
2
You don’t (the jobs don’t) require staff to be that highly skilled
3
You prefer to recruit fully trained/fully qualified recruits
4
You don’t take on young people 5
No apprenticeships available for your industry/sector/specialism
6
Don’t know enough about them/what you’d have to do
7
Financial constraints/training is too expensive/can’t afford it
8
Not worth your time for the money we’d get 9
Prefer to train in-house 10
No vacancies/not taking on new staff 11
Other reasons (PLEASE SPECIFY) 95
What was the total number of apprentices employed by your organisation during 2010? (Government recognised apprentices leading to a formal qualification). This is all apprentices employed across the whole of 2010 and not just those employed at the end of 2010. IF RESPONDENT CANNOT GIVE PRECISE FIGURE ASK FOR BEST ESTIMATE
F1tot
No answer (NOT ON SCRIPT) 999999
152

Continuing Vocational Training Survey
153
G4 ALL OFFERING APPRENTICESHIPS AT G1 (F0)
For which of the following reasons does your organisation offer apprenticeships?
READ OUT AND CODE ONE ONLY PER ROW
F2
Yes No NA
NR
F2a To train future employees according to the skill needs of your organisation
1 0 8 9
BASE: G1(F0)/1
ROW SINGLE
F2b To have the choice of selecting the best apprentices for future employment
1 0 8 9
F2c To avoid the risk of recruiting employees that do not fit the needs of your organisation
1 0 8 9
F2d To make use of the relatively cheaper labour costs of apprentices during their apprenticeship
1 0 8 9
F2e Other reasons Please specify 1 0 8 9
LINKQ ALL BASE: ALL Finally, it is sometimes possible to link the data we have collected with other
government surveys or datasets to enable further statistical analysis. Would you be happy for this to be done?
IF NECESSARY: Your confidentiality will be maintained, and linked data will be anonymised and only used for statistical purposes by researchers authorised by the Office for National Statistics.
CODE ONE ONLY
SINGLE
Yes 1
No 0
READ: That completes our interview with you today. Thank you very much for your time; your help is much appreciated by the Department for Business, Innovation and Skills and BMG Research. As a market research agency, BMG Research complies with the Market Research Society's Code of Conduct. If you want to check that BMG Research is a genuine market research agency please call the Market Research Society's free phone number on 0500 396 999.

© Crown copyright 2013
You may re-use this information (not including logos) free of charge in any format or medium, under the terms of the Open Government Licence. Visit www.nationalarchives.gov.uk/doc/open-government-licence, write to the Information Policy Team, The National Archives, Kew, London TW9 4DU, or email: [email protected].
This publication available from https://www.gov.uk/government/organisations/department-for-business-innovation-skills
Any enquiries regarding this publication should be sent to:
Department for Business, Innovation and Skills 1 Victoria Street London SW1H 0ET Tel: 020 7215 5000 If you require this publication in an alternative format, email [email protected], or call 020 7215 5000. URN BIS/13/587