content interpreting naplan results 2016 - acara · results in bands student achievement is...
TRANSCRIPT

Interpreting NAPLAN results The National Assessment Program – literacy and numeracy (NAPLAN) assesses students using common national tests in reading, writing, language conventions (spelling, grammar and punctuation) and numeracy. For the 2016 NAPLAN tests, schools received a report with their test data in August/September 2016, with school-level NAPLAN data published on the My School website in March 2017. NAPLAN results for a selected school can be compared to the averaged results of a group of schools with statistically similar students, and to the averaged results of all Australian schools. The common scale Results for each of the five NAPLAN assessment domains of reading, writing, spelling, grammar and punctuation, and numeracy, covering Years 3, 5, 7 and 9, are reported on a common scale. Rather than a separate scale for each year, a single common scale makes it easier for parents and teachers to identify improvement over time. The midpoint of each domain scale is set at 500 NAPLAN score points. The mean score will vary depending on the year level and test domain, and from test year to test year. The common scale for each domain is also divided into 10 achievement bands (Band 1 – Band 10) with six bands reported for each year level. This is because each year group cohort is specifically tested for the range of six proficiency bands appropriate to the year level. For Year 3, the proportions of students in each of bands 1–6 are reported. For Year 5 students, bands 3–8 are reported; for Year 7, bands 4–9; and for Year 9, bands 5–10. For more information on the common scale, watch the NAPLAN: understanding scale 1:45 minute video. Interpreting results NAPLAN results provide an indication of students’ achievements, but they provide only one snapshot of selected aspects of what students know and can do. In interpreting a school’s results, there are three important considerations:
• Differences in student cohorts must be considered when comparing the performance of schools. The My School website uses a number of variables to identify schools that are statistically similar in terms of student backgrounds (including schools’ geographical location and parents’ education/occupation). Comparisons of schools that do not have statistically similar student populations can lead to misleading conclusions about their performance.
• NAPLAN tests assess only a part of what students learn during the year. It is important to find out more about the whole curriculum of a school and a
Fact sheet
school’s performance across a range of areas. One of the best ways of doing this is to visit the school’s website or contact school leaders and teachers directly.
• No test is able to perfectly measure a student’s level of achievement; all tests are subject to a certain amount of measurement error. This means that there will always be a margin of error surrounding a school’s average score. In general, the smaller the number of students tested, the larger the margin of error. Further explanation of statistical terms can be found on the ‘Glossary’ page of the My School website.
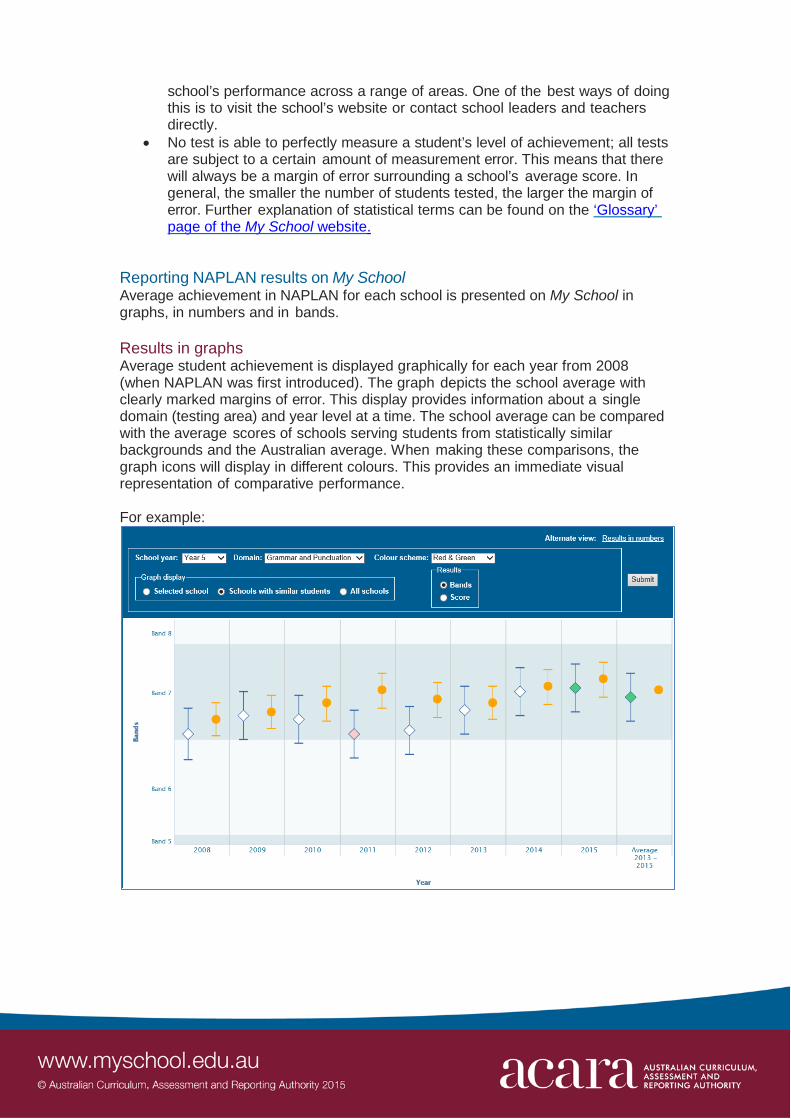
Reporting NAPLAN results on My School Average achievement in NAPLAN for each school is presented on My School in graphs, in numbers and in bands. Results in graphs Average student achievement is displayed graphically for each year from 2008 (when NAPLAN was first introduced). The graph depicts the school average with clearly marked margins of error. This display provides information about a single domain (testing area) and year level at a time. The school average can be compared with the average scores of schools serving students from statistically similar backgrounds and the Australian average. When making these comparisons, the graph icons will display in different colours. This provides an immediate visual representation of comparative performance. For example:

Results in numbers Average student achievement is displayed numerically for each year from 2008. A numeric range that shows the margin of error is also provided. This display shows results for all test domains and all year levels at the same time. As in the graphic display, colours are used to compare the achievement at a selected school with the achievement at schools with statistically similar students and with all Australian schools.
For example:
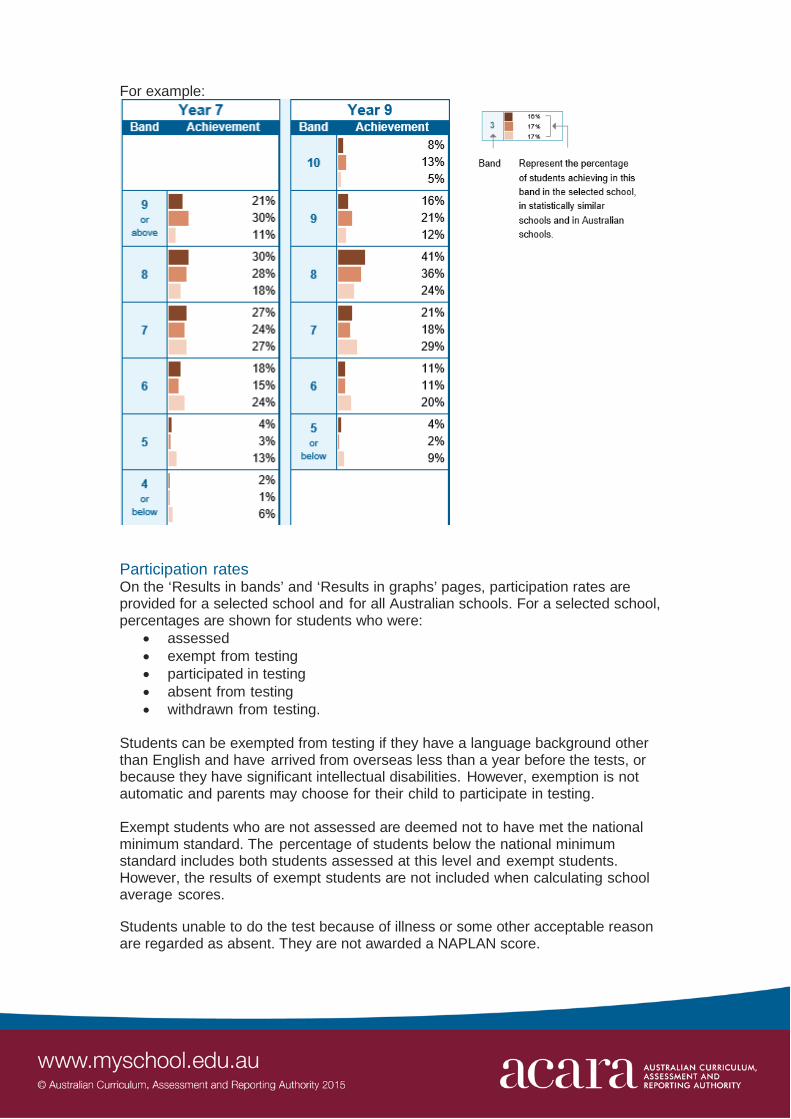
Results in bands Student achievement is displayed across the bands of the NAPLAN scale. Each year level at the school is shown on the same page so that the spread of achievement within any one year level can be compared with that of the school’s other year levels. Proportions of students achieving in the same bands at schools with statistically similar students and all Australian schools are also shown.
For example:
Participation rates On the ‘Results in bands’ and ‘Results in graphs’ pages, participation rates are provided for a selected school and for all Australian schools. For a selected school, percentages are shown for students who were:
• assessed • exempt from testing • participated in testing • absent from testing • withdrawn from testing.
Students can be exempted from testing if they have a language background other than English and have arrived from overseas less than a year before the tests, or because they have significant intellectual disabilities. However, exemption is not automatic and parents may choose for their child to participate in testing. Exempt students who are not assessed are deemed not to have met the national minimum standard. The percentage of students below the national minimum standard includes both students assessed at this level and exempt students. However, the results of exempt students are not included when calculating school average scores. Students unable to do the test because of illness or some other acceptable reason are regarded as absent. They are not awarded a NAPLAN score.

Students whose parents withdraw them from participating in NAPLAN for their own personal reasons are counted as withdrawn. Written consent for a student to be withdrawn is required. Withdrawn students are not awarded a NAPLAN score. Depicting student progress The ‘Student gain’ page presents the change in results for students who have taken consecutive NAPLAN tests at the same school. This is measured by identifying those students who undertook NAPLAN tests either in both years (for example in year 3 in 2014 and again in year 5 in 2016) at the same school. No other students are included in this calculation. For this reason, the NAPLAN result shown on this graph may be different to the result for the whole school population shown on the other NAPLAN results pages. The percentage of the school’s students in this group is clearly shown on the page. It is important to note that for some schools, such as high schools that start in Year 8, it is not possible to represent student gain. Student gain is a way to measure the influence of the school on student progress. That is, when the background of students is similar across schools, it is more likely that the differences in gain made by schools are related to the teaching and learning capabilities of the school. It is important to consider that students generally show greater gains in literacy and numeracy in the earlier years than in the later years of schooling, and that students who start with lower NAPLAN scores tend to make greater gains over time than those who start with higher NAPLAN scores. For example:
Writing In 2011 a persuasive writing task was introduced to the NAPLAN writing test, replacing the narrative task. The change to the persuasive genre was approved by education ministers in 2010 following extensive piloting.
Because there is a difference in the way the narrative and persuasive tasks function across year levels, a new and additional NAPLAN scale, specifically for persuasive writing, has been developed. As this is a different scale, persuasive writing scores cannot be compared with narrative writing scores from previous years. This means that no student gain comparisons between 2008 and 2010, 2009 and 2011, and 2010 and 2012 are available for the writing test. However, the student gain comparison is available for writing between 2011 and 2013, 2012 and 2014, 2013 and 2015, and 2014 and 2016. Support for interpreting graphs Legends and notes are provided at the bottom of each page depicting NAPLAN results, to aid interpretation of the graphs and tables presented.