naplan data analysis school leadership module - ais...
TRANSCRIPT
NAPLAN Data Analysis
School Leadership Module
August 2015
NAPLAN 2015 Analysis – School Leadership Module 1
NAPLAN Analysis: School Leadership Module
PURPOSE
This module is designed for Principals and school Leadership Teams to lead the school-level analysis of NAPLAN data. It is intended to help school leaders to:
understand the state/territory, Archdiocesan and school results
confidently lead the analysis of data on the cohort and skills development at the whole-school level
develop strategies to promote staff engagement with the data throughout the school, not just the testing-year teachers
identify issues for further exploration
contribute to the development of the school’s Annual Improvement and Strategic plans, and
inform the school’s planning for ongoing Internal School Review
The Teacher Module concentrates on Value-added Student Growth, Item Analysis, Teaching Strategies, and the identification of individual students needing support. This is centred on supporting the teacher in the classroom to align testing results with pedagogy in a diagnostic sense.
CONTEXT
ACCESSING THE SMART 2015 WEB-BASED APPLICATION
The SMART application is accessed via the web and requires authentication via a username and password. Users then agree to the terms and conditions of use according to the relevant Education Act. In schools, Principals and one delegate have the authority and responsibility, as Executive users, to provision staff to access and use the application.
It is expected that all teaching staff are given access to the SMART web application to promote a school-wide understanding of the data, its implications for teaching and learning, and development of priorities for using the results for literacy and numeracy planning.
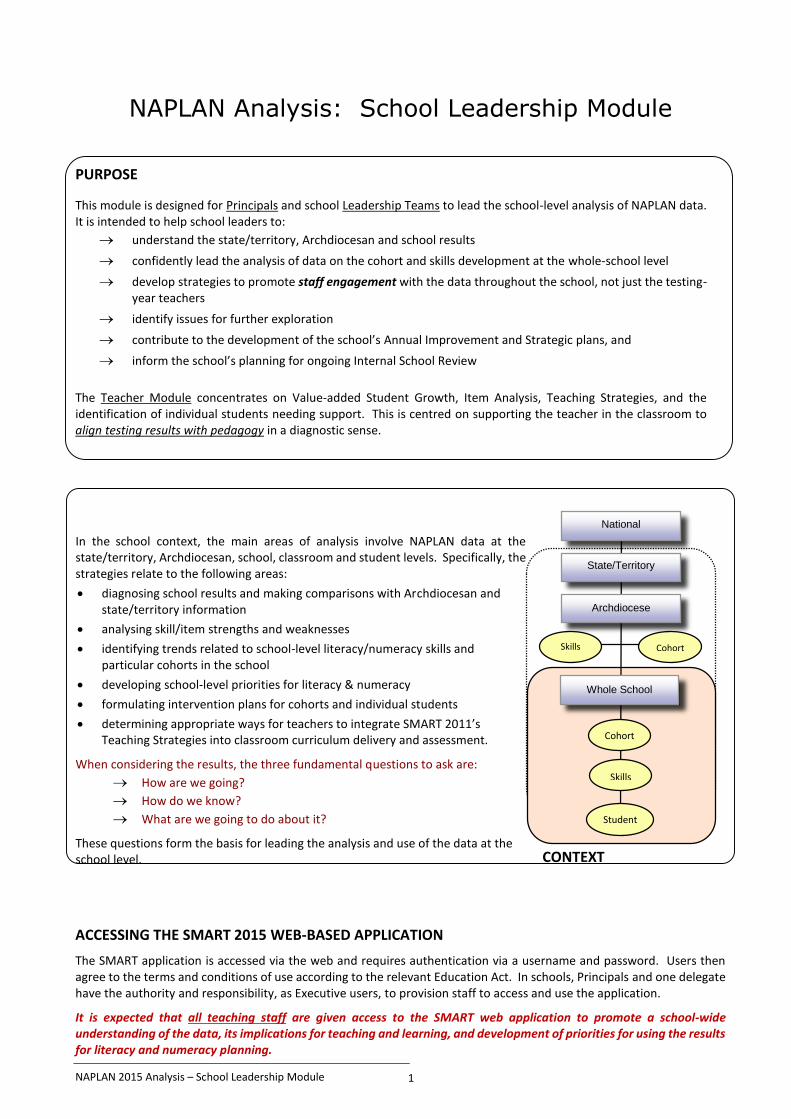
In the school context, the main areas of analysis involve NAPLAN data at the state/territory, Archdiocesan, school, classroom and student levels. Specifically, the strategies relate to the following areas:
diagnosing school results and making comparisons with Archdiocesan and state/territory information
analysing skill/item strengths and weaknesses
identifying trends related to school-level literacy/numeracy skills and particular cohorts in the school
developing school-level priorities for literacy & numeracy
formulating intervention plans for cohorts and individual students
determining appropriate ways for teachers to integrate SMART 2011’s Teaching Strategies into classroom curriculum delivery and assessment.
When considering the results, the three fundamental questions to ask are:
How are we going?
How do we know?
What are we going to do about it?
These questions form the basis for leading the analysis and use of the data at the school level.
National
State/Territory
Archdiocese
Cohort Skills
Cohort
Skills
Student
Whole School

NAPLAN 2015 Analysis – School Leadership Module 2
ANALYSING THE DATA
For school leaders, the focus is on the school results, identification of issues from the data, and strategies for effective leadership in analysis and use of the information across the whole school. This involves three types of analyses:
point-in-time analysis (to identify concerns for this testing period),
trends over time (to identify longer term issues), and
value-added growth of cohorts and individual students (from one testing period to the next).
PROCESS In analysing NAPLAN results at the school level, the following process outlines the phases undertaken to firstly identify the specific issues from the data, then to develop a literacy/numeracy plan and implement the appropriate and targeted strategies. The final phase involves crucial reflection on the measurable changes in student achievement and, importantly, the impact of these on teaching practices within the school.
This process is important in developing, implementing and evaluating the school’s literacy/numeracy plan. A key element is to lead the integration of such information across curriculum areas and classroom-based pedagogy.
It is strongly recommended that the following process be undertaken:
Initial analyses undertaken before the end of Term 3 by the school Leadership Team using the School Leadership Module to ascertain the main points of interest, and possible focus areas to be included in the Annual Improvement Plan.
Members of the Leadership Team then lead the subsequent analysis early in Term 4 with groups of teachers using the Teachers Module as a guide. This promotes staff engagement with the process and helps to promote the essential linkages between NAPLAN results and classroom curriculum delivery and pedagogy related to the skills of literacy and numeracy.
The staff, as a whole, agree on the main issues and challenges presented by the results. This helps to promote the likelihood of a whole-school understanding of the results and coordinated response to any issues ascertained.
Term 3 (Aug/ Sept)
Analyse testing results
Identify issues for follow-up
Term 4
Formulate whole-school response involving critical mass of staff
Develop specific strategies to implement Literacy/Numeracy Plan
Relate action plan to Internal School Review process
Include in the Annual School Improvement Plan
Determine adjustments to pedagogy to meet learning needs of students
Next year
Implement Literacy/Literacy Plan
Explore links between NAPLAN and classroom pedagogy
Integrate SMART2 teaching strategies with curriculum delivery
Monitor and evaluate improvements in student achievement: evidence of change
Critique impact on teaching practices
Plan
Act
Reflect
Identify
NAPLAN 2015 Analysis – School Leadership Module 3
It is important that the school’s Leadership Team:
- is familiar with, and competent in, analysing and understanding the NAPLAN data; and
- takes an active role in leading the analysis and use of the data with the staff to effect measurable improvements in student learning.
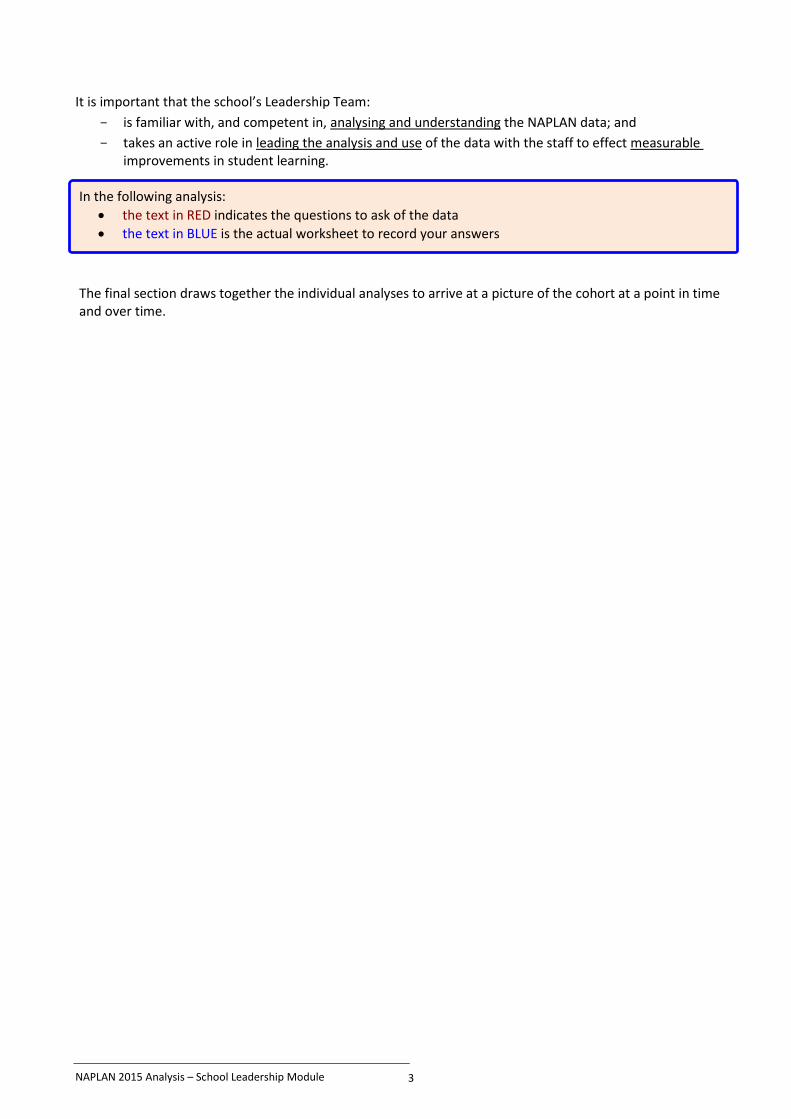
In the following analysis:
the text in RED indicates the questions to ask of the data
the text in BLUE is the actual worksheet to record your answers
The final section draws together the individual analyses to arrive at a picture of the cohort at a point in time and over time.

NAPLAN 2015 Analysis – School Leadership Module 4
SMART 2015 Application
Landing Screen
When you open the application this screen shows the main features of the SMART 2015 application. The key elements are:
1. Scope of Analysis (Region, School or Student) and available Reports
2. Test, year, cohort group and test Domain
3. Subgroups (by gender, school/system-created groups, etc)
4. Data analysis tools and displays
5. Summary of the key features from the NAPLAN data
6. Key data in relation to the National Minimum Standards.
‘% below NMS’ is the bottom band ‘% at or below NMS’ is the bottom two bands ‘% at proficiency’ is the top two bands
7. Groups of schools (at least 5 schools containing a minimum of 30 students) and students within schools can be created for closer comparison
8. elearning Modules: self-paced tutorials for navigating SMART2 and analyzing the data.
1
2
3
4 5 6
7
8
This is a screen shot for System analysis.
The school’s landing page and subsequent screens are similar,
and are GREEN.
NAPLAN 2015 Analysis – School Leadership Module 5
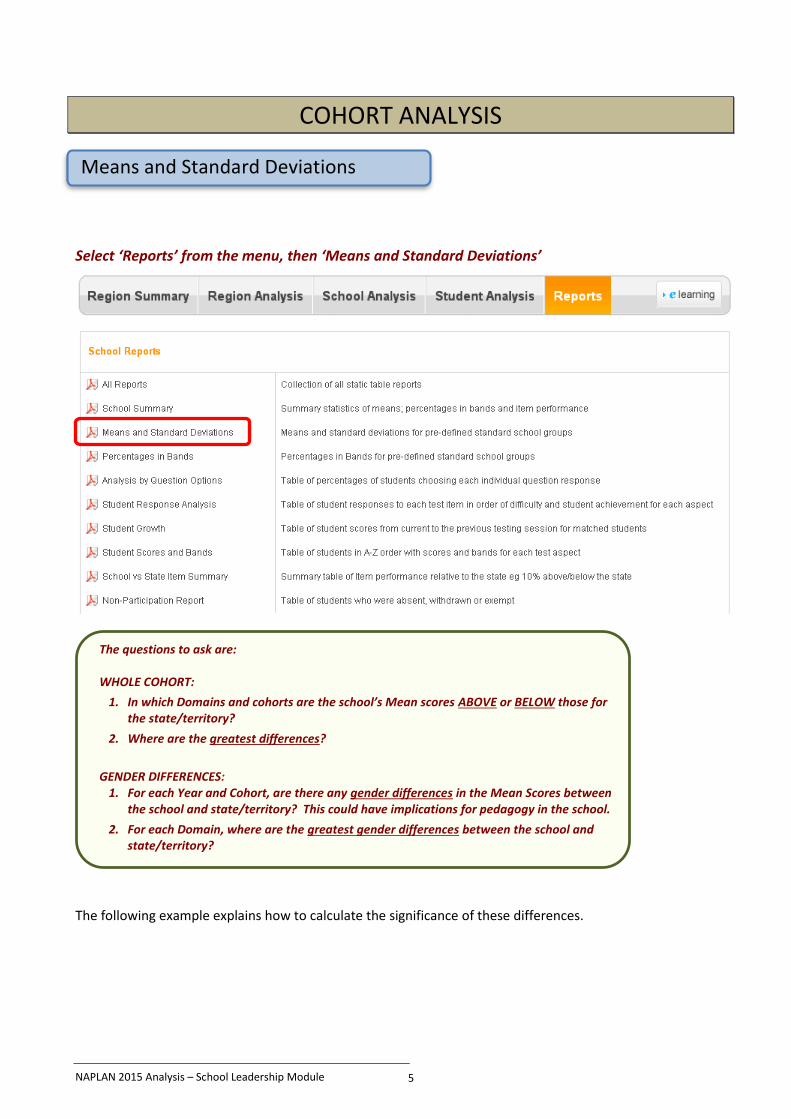
The questions to ask are: WHOLE COHORT:
1. In which Domains and cohorts are the school’s Mean scores ABOVE or BELOW those for the state/territory?
2. Where are the greatest differences?
GENDER DIFFERENCES: 1. For each Year and Cohort, are there any gender differences in the Mean Scores between
the school and state/territory? This could have implications for pedagogy in the school.
2. For each Domain, where are the greatest gender differences between the school and state/territory?
COHORT ANALYSIS
Select ‘Reports’ from the menu, then ‘Means and Standard Deviations’
The following example explains how to calculate the significance of these differences.
Means and Standard Deviations
NAPLAN 2015 Analysis – School Leadership Module 6
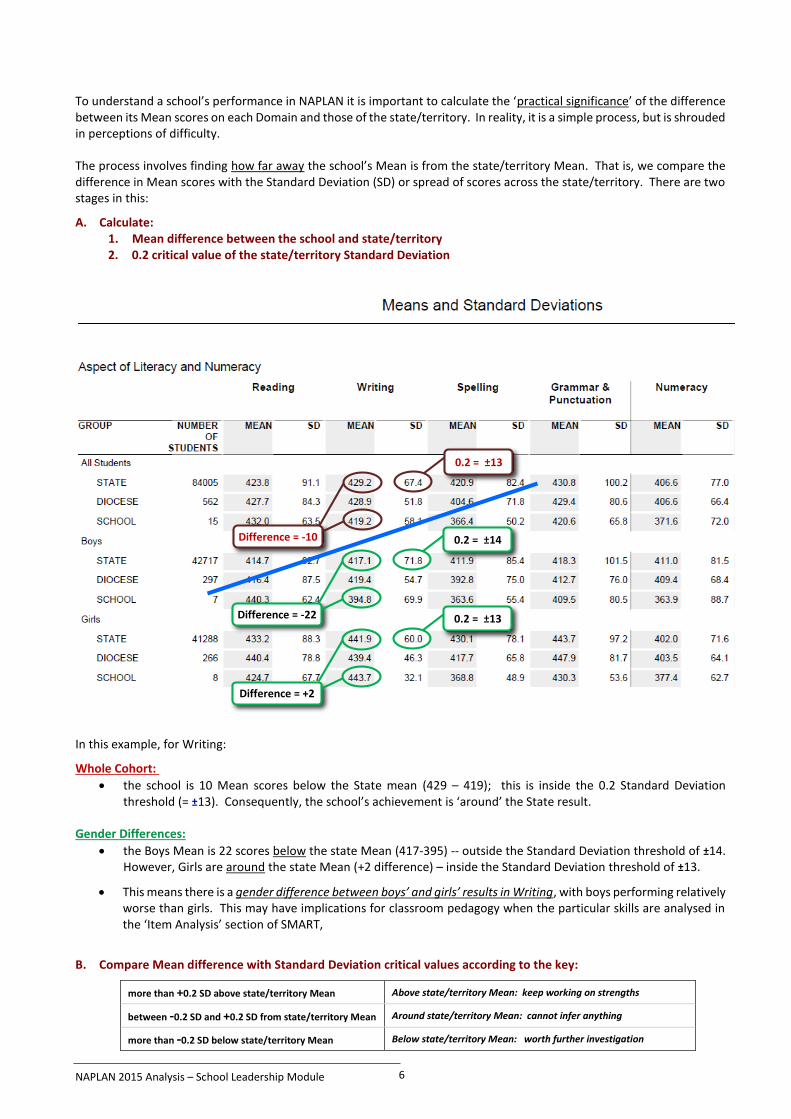
To understand a school’s performance in NAPLAN it is important to calculate the ‘practical significance’ of the difference between its Mean scores on each Domain and those of the state/territory. In reality, it is a simple process, but is shrouded in perceptions of difficulty.
The process involves finding how far away the school’s Mean is from the state/territory Mean. That is, we compare the difference in Mean scores with the Standard Deviation (SD) or spread of scores across the state/territory. There are two stages in this:
A. Calculate: 1. Mean difference between the school and state/territory 2. 0.2 critical value of the state/territory Standard Deviation
In this example, for Writing:
Whole Cohort:
the school is 10 Mean scores below the State mean (429 – 419); this is inside the 0.2 Standard Deviation threshold (= ±13). Consequently, the school’s achievement is ‘around’ the State result.
Gender Differences:
the Boys Mean is 22 scores below the state Mean (417-395) -- outside the Standard Deviation threshold of ±14. However, Girls are around the state Mean (+2 difference) – inside the Standard Deviation threshold of ±13.
This means there is a gender difference between boys’ and girls’ results in Writing, with boys performing relatively worse than girls. This may have implications for classroom pedagogy when the particular skills are analysed in the ‘Item Analysis’ section of SMART,
B. Compare Mean difference with Standard Deviation critical values according to the key:
more than +0.2 SD above state/territory Mean Above state/territory Mean: keep working on strengths
between -0.2 SD and +0.2 SD from state/territory Mean Around state/territory Mean: cannot infer anything
more than -0.2 SD below state/territory Mean Below state/territory Mean: worth further investigation
Difference = -10
0.2 = ±13
Difference = -22
0.2 = ±14
Difference = +2
0.2 = ±13
NAPLAN 2015 Analysis – School Leadership Module 7
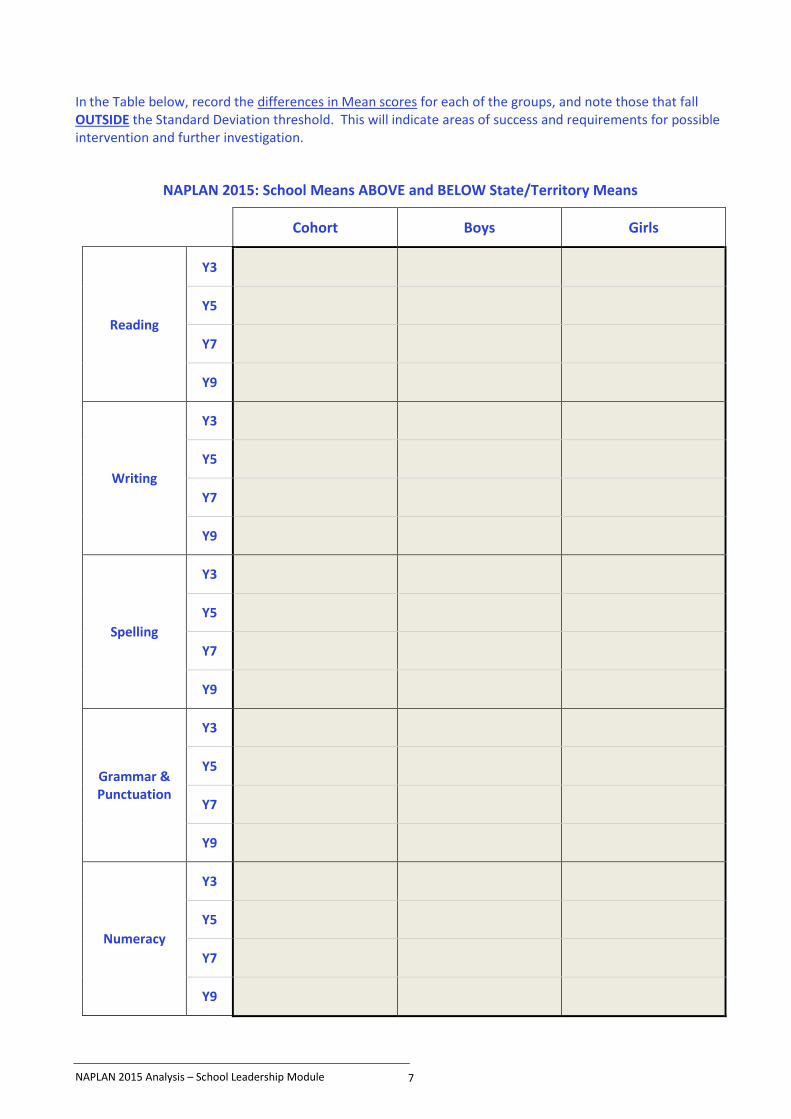
In the Table below, record the differences in Mean scores for each of the groups, and note those that fall OUTSIDE the Standard Deviation threshold. This will indicate areas of success and requirements for possible intervention and further investigation.
NAPLAN 2015: School Means ABOVE and BELOW State/Territory Means
Cohort Boys Girls
Reading
Y3
Y5
Y7
Y9
Writing
Y3
Y5
Y7
Y9
Spelling
Y3
Y5
Y7
Y9
Grammar & Punctuation
Y3
Y5
Y7
Y9
Numeracy
Y3
Y5
Y7
Y9
NAPLAN 2015 Analysis – School Leadership Module 8
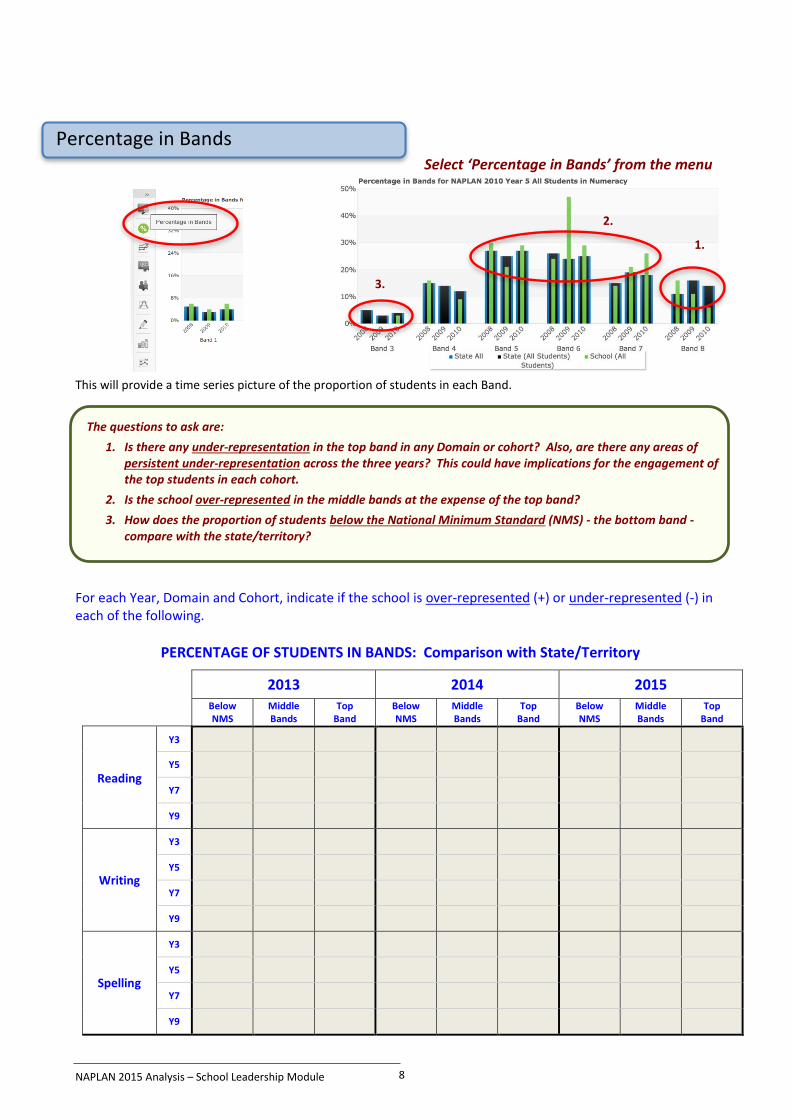
The questions to ask are:
1. Is there any under-representation in the top band in any Domain or cohort? Also, are there any areas of persistent under-representation across the three years? This could have implications for the engagement of the top students in each cohort.
2. Is the school over-represented in the middle bands at the expense of the top band?
3. How does the proportion of students below the National Minimum Standard (NMS) - the bottom band - compare with the state/territory?
Select ‘Percentage in Bands’ from the menu
This will provide a time series picture of the proportion of students in each Band.
For each Year, Domain and Cohort, indicate if the school is over-represented (+) or under-represented (-) in each of the following.
PERCENTAGE OF STUDENTS IN BANDS: Comparison with State/Territory
2013 2014 2015
Below NMS
Middle Bands
Top Band
Below NMS
Middle Bands
Top Band
Below NMS
Middle Bands
Top Band
Reading
Y3
Y5
Y7
Y9
Writing
Y3
Y5
Y7
Y9
Spelling
Y3
Y5
Y7
Y9
Percentage in Bands
1.
2.
3.
NAPLAN 2015 Analysis – School Leadership Module 9
PERCENTAGE OF STUDENTS IN BANDS: Comparison with State/Territory
2013 2014 2015
Below NMS
Middle Bands
Top Band
Below NMS
Middle Bands
Top Band
Below NMS
Middle Bands
Top Band
Grammar & Punctuation
Y3
Y5
Y7
Y9
Numeracy
Y3
Y5
Y7
Y9
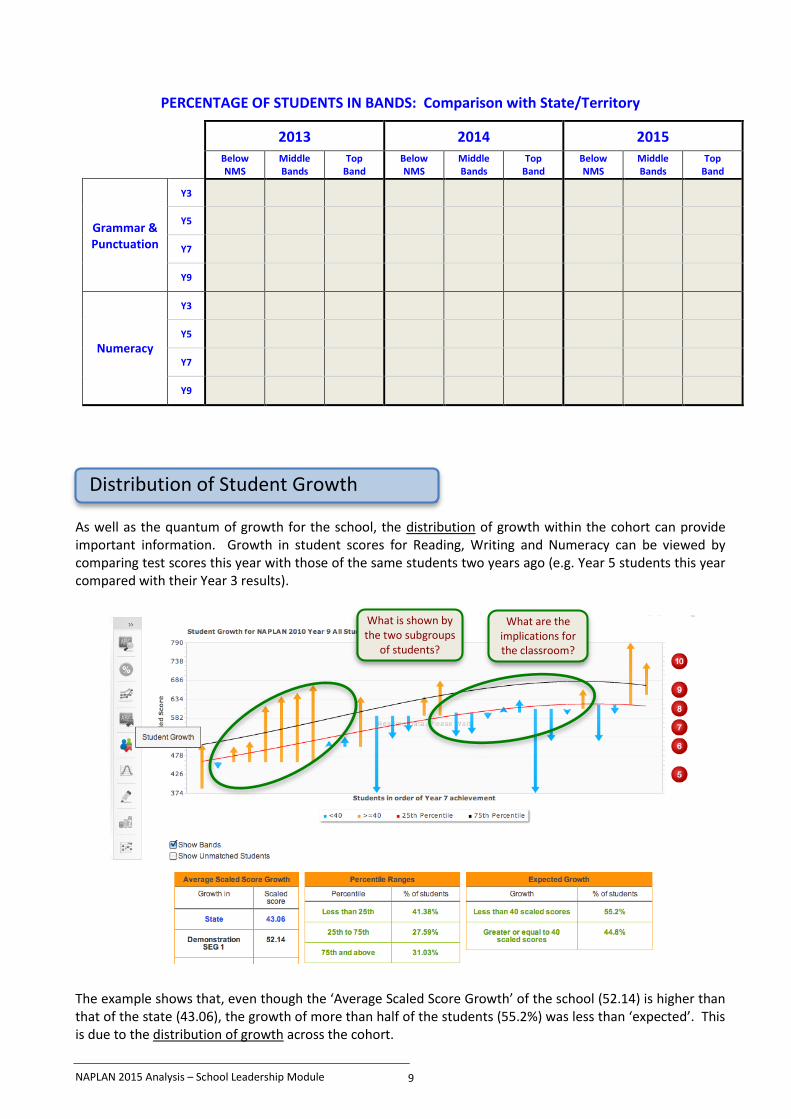
As well as the quantum of growth for the school, the distribution of growth within the cohort can provide important information. Growth in student scores for Reading, Writing and Numeracy can be viewed by comparing test scores this year with those of the same students two years ago (e.g. Year 5 students this year compared with their Year 3 results).
The example shows that, even though the ‘Average Scaled Score Growth’ of the school (52.14) is higher than that of the state (43.06), the growth of more than half of the students (55.2%) was less than ‘expected’. This is due to the distribution of growth across the cohort.
Distribution of Student Growth
What is shown by the two subgroups
of students?
What are the implications for the classroom?
NAPLAN 2015 Analysis – School Leadership Module 10
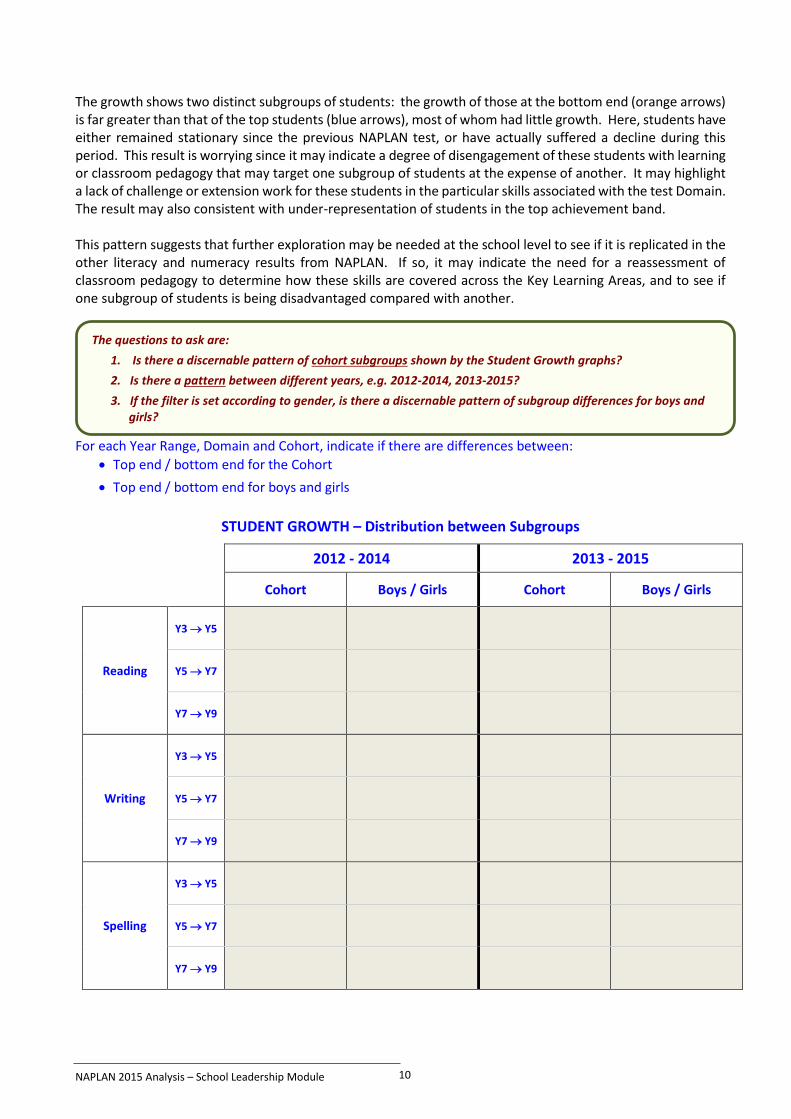
The questions to ask are:
1. Is there a discernable pattern of cohort subgroups shown by the Student Growth graphs?
2. Is there a pattern between different years, e.g. 2012-2014, 2013-2015?
3. If the filter is set according to gender, is there a discernable pattern of subgroup differences for boys and girls?
The growth shows two distinct subgroups of students: the growth of those at the bottom end (orange arrows) is far greater than that of the top students (blue arrows), most of whom had little growth. Here, students have either remained stationary since the previous NAPLAN test, or have actually suffered a decline during this period. This result is worrying since it may indicate a degree of disengagement of these students with learning or classroom pedagogy that may target one subgroup of students at the expense of another. It may highlight a lack of challenge or extension work for these students in the particular skills associated with the test Domain. The result may also consistent with under-representation of students in the top achievement band. This pattern suggests that further exploration may be needed at the school level to see if it is replicated in the other literacy and numeracy results from NAPLAN. If so, it may indicate the need for a reassessment of classroom pedagogy to determine how these skills are covered across the Key Learning Areas, and to see if one subgroup of students is being disadvantaged compared with another.
For each Year Range, Domain and Cohort, indicate if there are differences between:
Top end / bottom end for the Cohort
Top end / bottom end for boys and girls
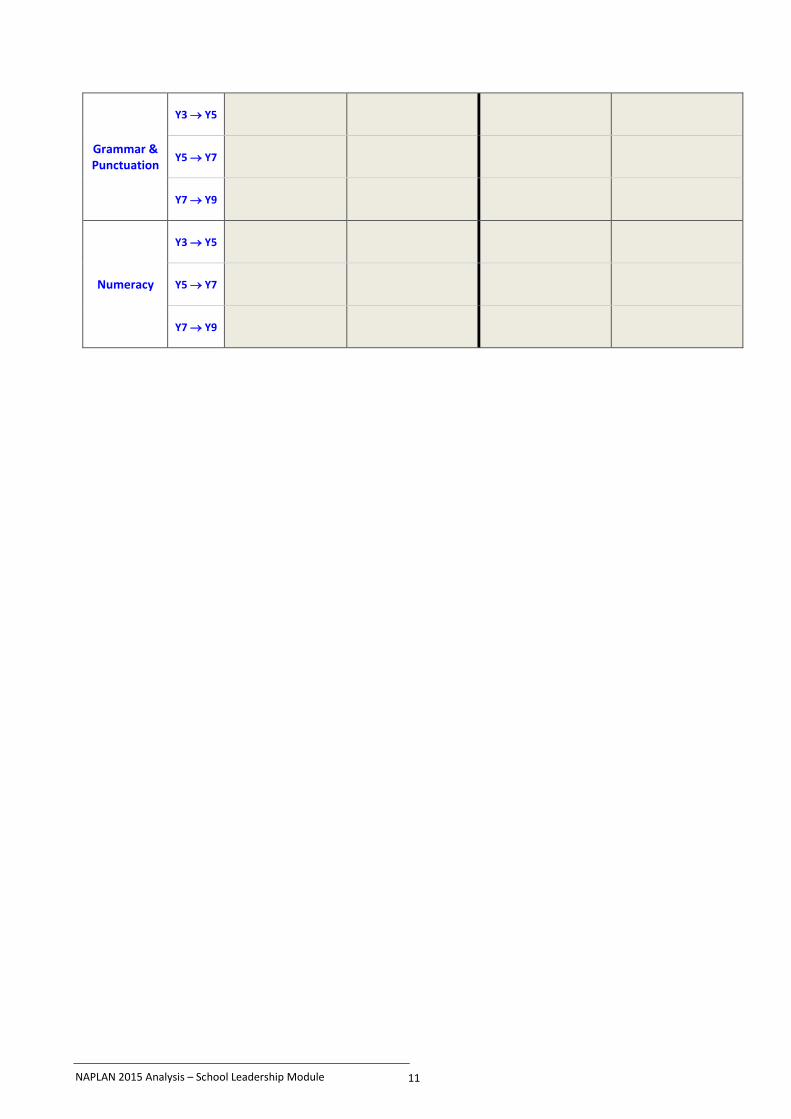
STUDENT GROWTH – Distribution between Subgroups
2012 - 2014 2013 - 2015
Cohort Boys / Girls Cohort Boys / Girls
Reading
Y3 Y5
Y5 Y7
Y7 Y9
Writing
Y3 Y5
Y5 Y7
Y7 Y9
Spelling
Y3 Y5
Y5 Y7
Y7 Y9
NAPLAN 2015 Analysis – School Leadership Module 11
Grammar & Punctuation
Y3 Y5
Y5 Y7
Y7 Y9
Numeracy
Y3 Y5
Y5 Y7
Y7 Y9
NAPLAN 2015 Analysis – School Leadership Module 12
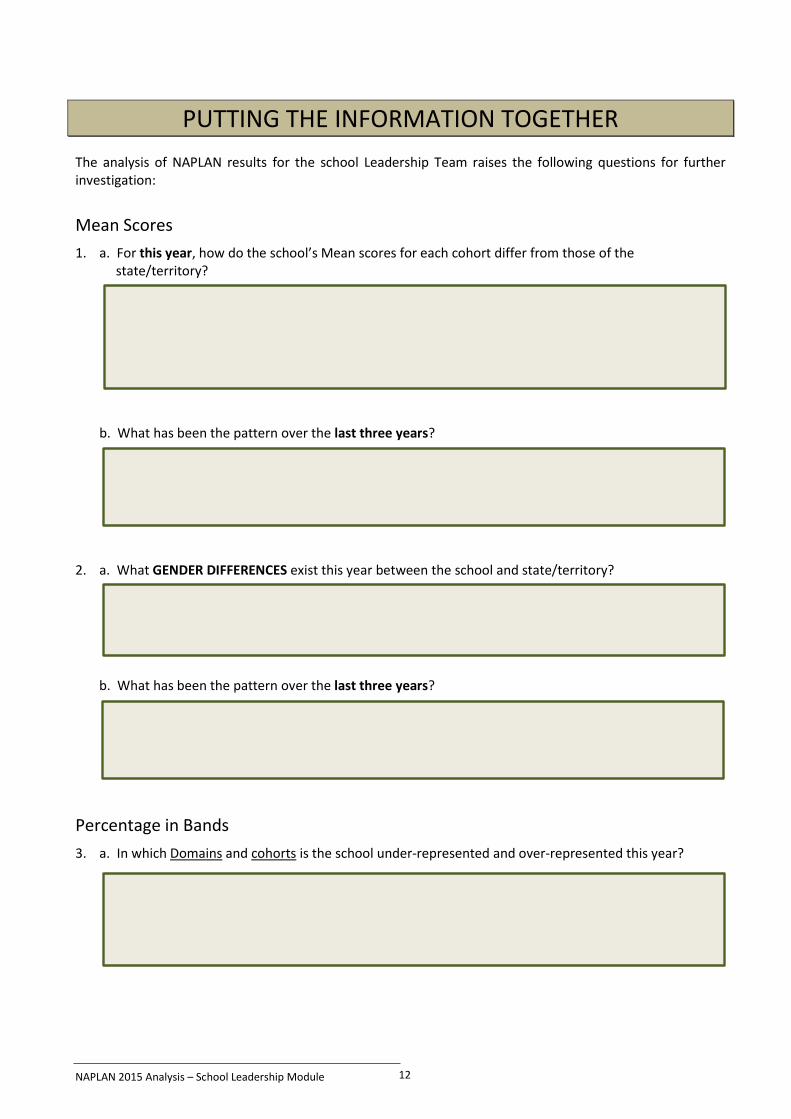
PUTTING THE INFORMATION TOGETHER
The analysis of NAPLAN results for the school Leadership Team raises the following questions for further investigation:
Mean Scores
1. a. For this year, how do the school’s Mean scores for each cohort differ from those of the state/territory?
b. What has been the pattern over the last three years?
2. a. What GENDER DIFFERENCES exist this year between the school and state/territory?
b. What has been the pattern over the last three years?
Percentage in Bands
3. a. In which Domains and cohorts is the school under-represented and over-represented this year?

NAPLAN 2015 Analysis – School Leadership Module 13
b. What has been the pattern over the last three years?
School Cohort Growth
4. How has the school’s growth for each cohort compared with the state/territory between 2012-2014 and 2013-2015? Are any issues indicated by this?
Distribution of Student Growth
5. Is there any discernable pattern of the distribution of student growth between 2012-2014 and 2013-2015 in relation to two sets of subgroups?
Top and Bottom students
Boys and Girls
NAPLAN 2015 Analysis – School Leadership Module 14
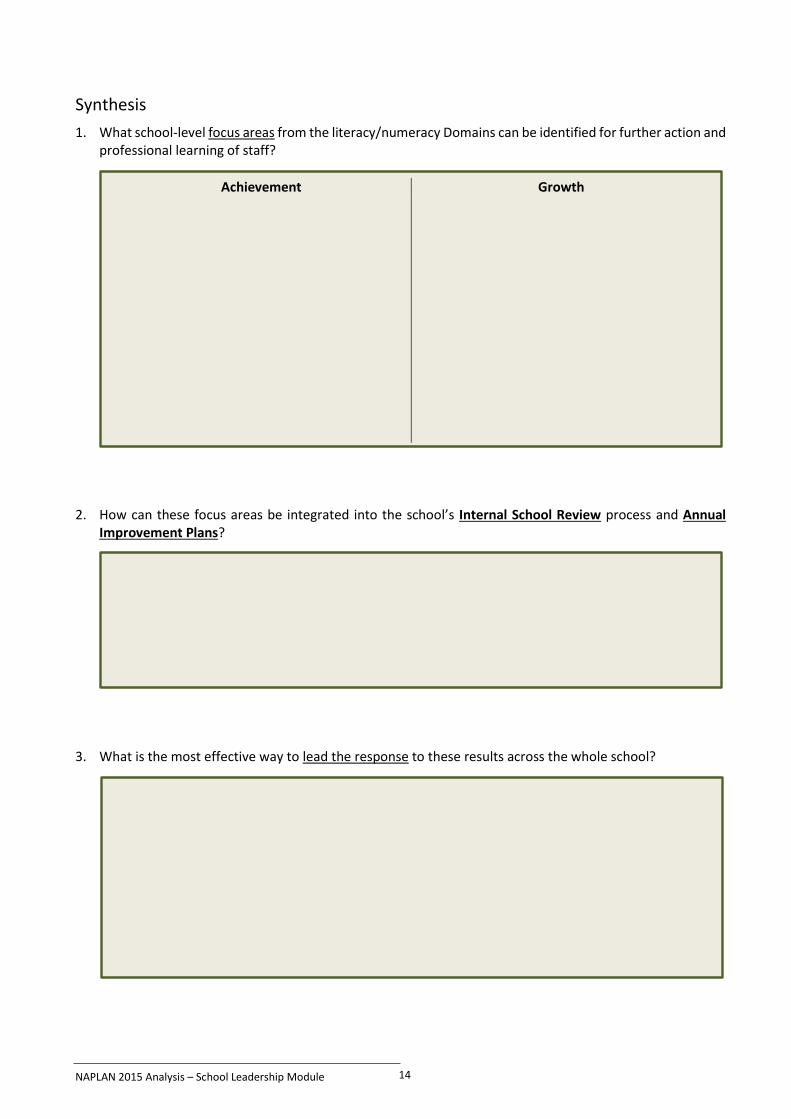
Synthesis
1. What school-level focus areas from the literacy/numeracy Domains can be identified for further action and professional learning of staff?
2. How can these focus areas be integrated into the school’s Internal School Review process and Annual Improvement Plans?
3. What is the most effective way to lead the response to these results across the whole school?
Achievement Growth
NAPLAN 2015 Analysis – School Leadership Module 15
4. How is staff engagement with the NAPLAN data to be facilitated across the school? What strategies and resources are appropriate for such intervention (e.g. time, group/stage/faculty meetings, role of school Leadership Team, etc)?
NAPLAN 2015 Analysis – School Leadership Module 16
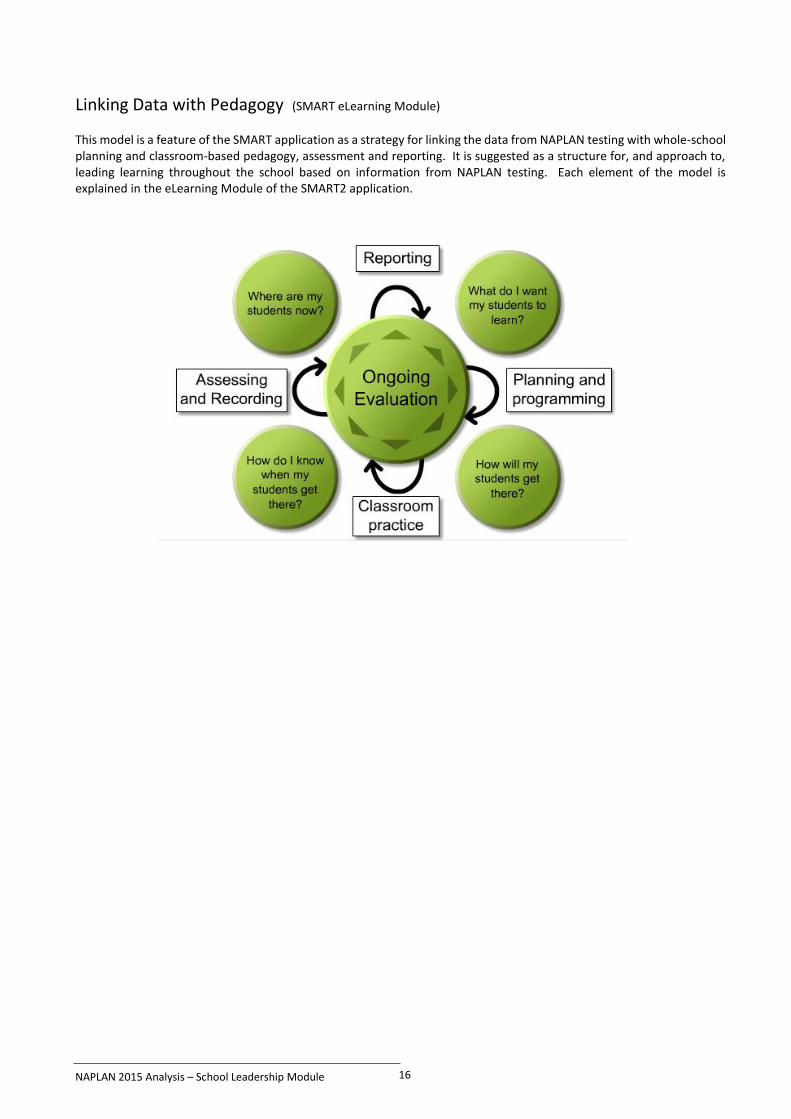
Linking Data with Pedagogy (SMART eLearning Module)
This model is a feature of the SMART application as a strategy for linking the data from NAPLAN testing with whole-school planning and classroom-based pedagogy, assessment and reporting. It is suggested as a structure for, and approach to, leading learning throughout the school based on information from NAPLAN testing. Each element of the model is explained in the eLearning Module of the SMART2 application.
NAPLAN 2015 Analysis – School Leadership Module 17
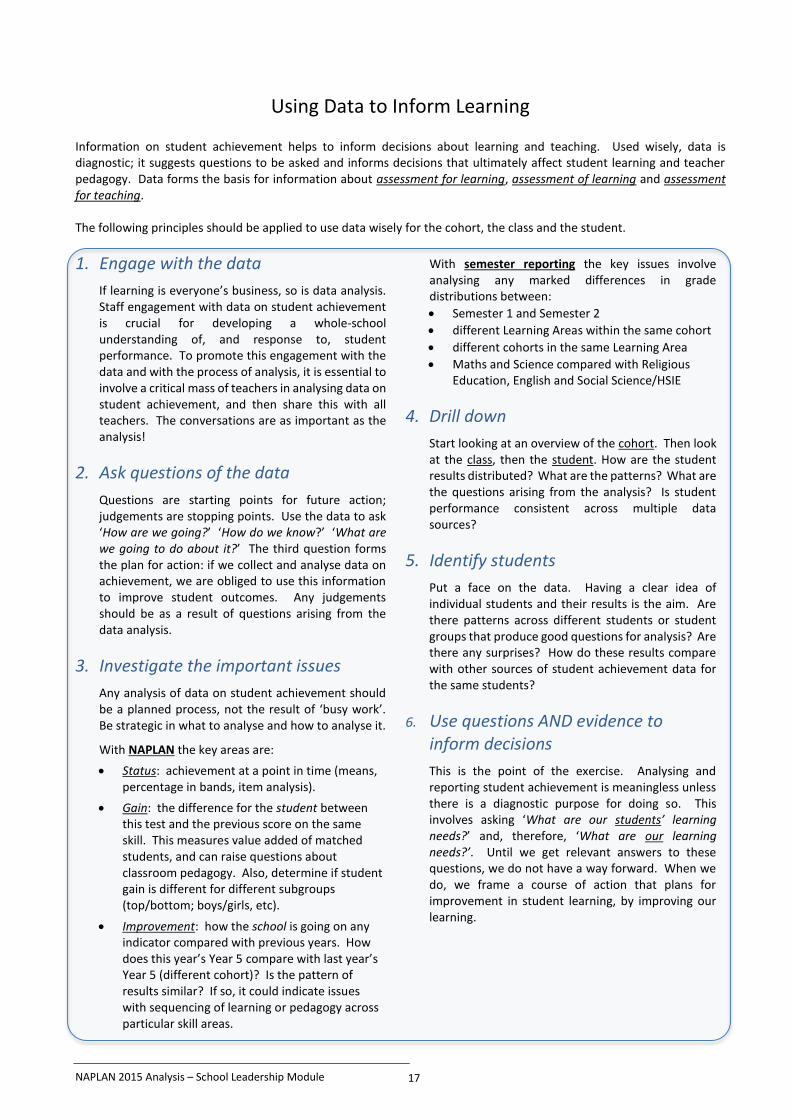
Using Data to Inform Learning Information on student achievement helps to inform decisions about learning and teaching. Used wisely, data is diagnostic; it suggests questions to be asked and informs decisions that ultimately affect student learning and teacher pedagogy. Data forms the basis for information about assessment for learning, assessment of learning and assessment for teaching. The following principles should be applied to use data wisely for the cohort, the class and the student.
1. Engage with the data
If learning is everyone’s business, so is data analysis. Staff engagement with data on student achievement is crucial for developing a whole-school understanding of, and response to, student performance. To promote this engagement with the data and with the process of analysis, it is essential to involve a critical mass of teachers in analysing data on student achievement, and then share this with all teachers. The conversations are as important as the analysis!
2. Ask questions of the data
Questions are starting points for future action; judgements are stopping points. Use the data to ask ‘How are we going?’ ‘How do we know?’ ‘What are we going to do about it?’ The third question forms the plan for action: if we collect and analyse data on achievement, we are obliged to use this information to improve student outcomes. Any judgements should be as a result of questions arising from the data analysis.
3. Investigate the important issues
Any analysis of data on student achievement should be a planned process, not the result of ‘busy work’. Be strategic in what to analyse and how to analyse it.
With NAPLAN the key areas are:
Status: achievement at a point in time (means, percentage in bands, item analysis).
Gain: the difference for the student between this test and the previous score on the same skill. This measures value added of matched students, and can raise questions about classroom pedagogy. Also, determine if student gain is different for different subgroups (top/bottom; boys/girls, etc).
Improvement: how the school is going on any indicator compared with previous years. How does this year’s Year 5 compare with last year’s Year 5 (different cohort)? Is the pattern of results similar? If so, it could indicate issues with sequencing of learning or pedagogy across particular skill areas.
With semester reporting the key issues involve analysing any marked differences in grade distributions between:
Semester 1 and Semester 2
different Learning Areas within the same cohort
different cohorts in the same Learning Area
Maths and Science compared with Religious Education, English and Social Science/HSIE
4. Drill down
Start looking at an overview of the cohort. Then look at the class, then the student. How are the student results distributed? What are the patterns? What are the questions arising from the analysis? Is student performance consistent across multiple data sources?
5. Identify students
Put a face on the data. Having a clear idea of individual students and their results is the aim. Are there patterns across different students or student groups that produce good questions for analysis? Are there any surprises? How do these results compare with other sources of student achievement data for the same students?
6. Use questions AND evidence to inform decisions
This is the point of the exercise. Analysing and reporting student achievement is meaningless unless there is a diagnostic purpose for doing so. This involves asking ‘What are our students’ learning needs?’ and, therefore, ‘What are our learning needs?’. Until we get relevant answers to these questions, we do not have a way forward. When we do, we frame a course of action that plans for improvement in student learning, by improving our learning.
