consumption of counterfeit alcohol in contemporary russia ... · zoya kotelnikova consumption of...
TRANSCRIPT

Zoya Kotelnikova
CONSUMPTION OF COUNTERFEIT ALCOHOL IN CONTEMPORARY
RUSSIA: THE ROLE OF CULTURAL AND STRUCTURAL
FACTORS
BASIC RESEARCH PROGRAM
WORKING PAPERS
SERIES: SOCIOLOGY WP BRP 47/SOC/2014
This Working Paper is an output of a research project implemented as part of the Basic Research
Program at the National Research University Higher School of Economics (HSE). Any opinions or claims
contained in this Working Paper do not necessarily reflect the views of HSE.

Zoya Kotelnikova1
CONSUMPTION OF COUNTERFEIT ALCOHOL IN
CONTEMPORARY RUSSIA: THE ROLE OF CULTURAL AND
STRUCTURAL FACTORS2
The majority of Russians believe that counterfeit alcohol may cause death. Nevertheless, alcohol
is a common target of counterfeiting in contemporary Russia as are branded clothes, accessories
and audio products. This paper aims to reveal whether counterfeit alcohol consumers are
distinctive in terms of structure and culture. It investigates the prevalence and structure of
counterfeit alcohol purchasing and consumption; attitudes and beliefs about counterfeit alcohol;
and predictors of counterfeit alcohol consumption. The research is based on the Russia
Longitudinal Monitoring Survey (RLMS-HSE), an annual nationwide panel survey designed to
monitor the health and economic welfare of households and individuals in the Russian
Federation. The research findings demonstrate that cultural and structural factors contribute a lot
to the consumption of counterfeit alcohol. Counterfeit alcohol consumption is associated with
hazardous alcohol drinkers and homemade alcohol drinkers who tend to ignore trademarks and
the taste of alcoholic beverages. Blur counterfeiting is a characteristic of hazardous alcohol
drinkers and vodka-lovers who are inclined to be price sensitive and to ignore brands. Social
networks play a significant role in consumption of counterfeit alcohol. Counterfeit alcohol
consumers are highly likely to represent lower classes.
Key words: counterfeiting; blur counterfeiting; illicit alcohol; unrecorded consumption;
compulsory consumption; emerging markets.
JEL Classification: Z.
1 Associate Professor, Department of Economic Sociology, National Research University Higher
School of Economics [email protected] 2 This research project was supported by The International Center for Alcohol Policies (ICAP) and the Program for Basic
Research of the National Research University Higher School of Economics (funding of the RLMS-HSE survey). I would like
thank Prof. Dr. Vadim Radaev and Prof. Dr. Katharina Bluhm for helpful comments on the first draft of the paper. I also
appreciate Irina Kratko, Elena Nazarbaeva, and Yana Roshchina who participated in the research project.

3
1. Introduction
Russia is generally accepted to be affected by counterfeiting. The goods counterfeited
range from clothes, cigarettes, medicines, and food to automobile parts, computer software,
mobile phones and wristwatches. Alcohol is a frequent and common target of counterfeiting.
According to expert evaluations, counterfeits make up 30 to 40% of alcoholic beverages trade in
Russia [Radaev et al. 2008]. The large majority of Russians (94%) believe that consumption of
counterfeit alcohol may cause serious harm to health and even death. These beliefs are supported
by daily news and official statistics which report that acute alcohol poisoning resulted in the
deaths of 17,302 people in 20123. This paper looks at who consumes counterfeit alcohol in
Russia and, more generally the reasons why people consume illicit goods.
In general, counterfeiting means “a range of illicit activities linked with the trademark
infringement” [OECD 2007: 8]. There are several similar types of activities commonly grouped
together under one heading, including piracy, direct copies, imitations, introduction of original
products with a registered trademark into the commercial turnover without a permission from the
owner, etc. [Cheung & Prendergast 2004; Jennings 1989; Lay & Zaichkowsky 1999;
Kotelnikova 2011]. It is important to stress that counterfeiting is primarily concerned with
registered trademarks and the exclusive rights of owners rather than with product falsification,
deceptive information about product’s features, tax evasion, unlicensed production, usage of
forged excise stamps, etc. In practice, however, counterfeiting, product falsification and tax
evasion overlap. Counterfeit alcohol may include toxic elements and implies low quality
products produced and distributed on an illegal basis. For example, it is known that
counterfeiting in alcohol drinks can take three forms: 1) “tipping” implying “a practice whereby
genuine containers are in some way supplemented with alcohol from a non-genuine source”; 2)
“collection of empties on a commercial basis for refilling, selling counterfeit labels and
capsules”; 3) “producing whole product: bottle, capsule and liquid [Counting counterfeits 2002:
85]. Forms of counterfeiting also embrace imitations of the registered trademarks including
copies, which are similar but not identical to the original; and grey goods “which are illegally
sold as overruns produced by factories contracted by the brand manufactures” [Phau et al. 2000:
46–47].
Economic factors involved in the production and distribution of counterfeits always
infringe the rights of the brand holder but do not always infringe those of the consumer. The
expansion of counterfeiting is often explained by a fact that production and provision of fakes is
a profitable and low-risk business, which is to a significant extent supported by a steady
consumer demand for counterfeit branded goods. However, it is not only consumers that
contribute to the proliferation of counterfeits but also owners of registered trademarks—victims
of counterfeiting—may pursue a contradictory policy.4 For a better understanding how markets
for counterfeited goods work, the entire process and all counterparts should be studied,
nevertheless, this paper deals only with consumer behavior.
The market for fakes can be mainly divided into two sectors—fakes bought by consumers
unknowingly (deceptive counterfeiting) and fakes bought by consumers deliberately (non-
deceptive counterfeiting) [Grossman & Shapiro 1988]. Previous research findings demonstrate
that “about one-third of consumers would knowingly purchase counterfeit goods” [Bian &
Moutinho 2009: 368; see also Rutter & Bryce 2008]. However, research has revealed that
perceived risks have a direct impact on purchase intentions [Clow, Tripp & Kenny 1996].
Consumers buy counterfeits only in those product categories where risks (social, financial,
physical, etc.) are perceived to be low [Bloch et al 1993; Chapa, Minor & Maldonado 2006: 83].
Demand-side research shows that the purchase of counterfeits varies across income, education,
3 See official statistics: URL: http://www.gks.ru/wps/wcm/connect/rosstat_main/rosstat/ru/statistics/population/healthcare/#
(accessed on 2 August 2014). 4 They are not always active in the protection of their intellectual property rights and sometimes even try to take advantage of the
market expansion of counterfeits [Kotelnikova 2011].

4
age and gender [Lee & Yoo 2009: 12]. However, research findings are contradictory in
explaining the role of culture and social structure in counterfeit consumption.
Additionally, Rutter and Bryce [2008] argue counterfeit consumption should be
considered from the perspective of everyday activities and not be associated with specific
subcultures, for instance social deviants or the technological elite. They found that counterfeit
consumption is linked to modern leisure consumption. This is consistent with the bulk of the
literature on counterfeiting, showing consumer commitment to famous trademarks stimulate their
purchase of counterfeited products, especially in the context of non-deceptive counterfeiting
[Bian & Moutinho 2009]. Additionally, a price advantage is believed to be the most influential
factor in explaining why people buy counterfeit goods. Besides price and status, Cheung and
Prendergast [2004] show that the system of distribution can condition the expansion of
counterfeit consumption.
Given the mass expansion of counterfeited goods and the high physical risks associated
with counterfeit alcohol consumption, the paper looks at whether counterfeit alcohol
consumption is localized culturally and structurally. To carry out this aim, the following
questions are addressed. First, how common is counterfeit alcohol consumption in Russia?
Second, what kind of consumer attitudes to counterfeit alcohol are predominant in Russia? Third,
are consumers of counterfeit alcohol with a specific social class position? Fourth, do consumers
of counterfeit alcohol differ from other alcohol consumers in relation to patterns of alcohol
consumption? Finally, what are predictors of risks to being a consumer of counterfeit alcohol in
Russia?
Counterfeit alcohol markets seem to be the main subject of interests to three well-
recognized perspectives including sociology of markets, studies in unrecorded alcohol, and
marketing science. However, each of these perspectives gives little attention to counterfeit
alcohol markets per se. The economic sociological tradition has overlooked illegal markets,
mainly because of a lack of discussion on the issues of the legality of the market [Beckert &
Wehinger 2011]. Studies in unrecorded alcohol5 consumption, focusing mostly on home and
small-scale artisanal alcohol, and public health effects of unrecorded consumption in general,
correlations between unrecorded alcohol consumption and alcohol policy measures and
interventions, and international comparisons, tend to ignore consumption of manufactured
counterfeit alcohol. The bulk of marketing literature on counterfeiting, which is primarily
devoted to understanding incentives of the consumer demand for counterfeit goods, has passed
over deceptive counterfeiting and blur counterfeiting.
This paper is divided into 7 sections. Section 2 describes the major trends in markets for
counterfeited goods in contemporary Russia. Section 3 is devoted to the findings of previous
research concerning counterfeit alcohol consumption in Russia. Section 4 presents assumptions
and hypotheses supported by a short literature review on determinants of the purchase of
counterfeits. Section 5 discusses the research method and data collection. Section 6 analyzes the
results obtained in the study. Section 7 concludes.
2. Major trends in counterfeit alcohol expansion in Russia
The scope of counterfeited goods in present day Russian markets is considered to be
shocking; international experts state that Russia is among the countries with the largest amount
of counterfeited goods, including China, Turkey, and Ukraine [Devigne 2008]. However, the
evaluations of the volume of counterfeits are based on speculations rather than reliable statistics.
The scope of counterfeiting significantly varies depending on the sector. Russian markets can
knowingly be divided into four types: markets where counterfeits predominate 70–80% (CD and
DVD recordings); mass expansion of counterfeits 30–40% (clothes, shoes, and alcoholic
5 The term “unrecorded alcohol” usually covers “(1) illegally produced or smuggled alcohol, (2) surrogate alcohol, i.e. non-
beverage alcohol not officially intended for human consumption, such as perfume, (3) alcohol not registered in the country where
it is consumed, and (4) legal unregistered alcohol (e.g. homemade alcohol in countries where it is legal)” [Lachenmeier, Taylor &
Rehm 2011].

5
beverages); moderate expansion 15% (fragrances and medicines); and limited expansion of
counterfeits up to 1% (tea, coffee, and cigarettes) [Radaev et al. 2008]. In Russia alcohol is
counterfeited as frequently as branded clothes, shoes, and watches, that is, goods targeted by
counterfeiting traditionally.
Counterfeiting is one of constitutive elements of illegal alcohol markets. Unrecorded
alcohol is a longstanding problem for Russia partially provoked by the radical anti-alcohol
reforms conducted by Michael Gorbachev in the mid-1980s. Initially aimed to reduce total
alcohol consumption6, the anti-alcohol reforms generated some unexpected consequences. The
significant decrease of state-produced alcohol immediately caused a sharp increase in
moonshining and underground alcohol production [Nemtsov 2009]. Illegal alcohol production
and distribution networks developed across the country and contributed a lot to the accumulation
of private capital during the anti-alcohol reforms. By the early 1990s, the state completely had
lost its alcohol monopoly, which were under control of private capital and embedded into
organized criminal networks. Further economic liberalization opened up a legal way for illicit
alcoholic beverages to emerging consumer markets. Official statistics indicate that illegal
commercial alcohol products amounted to 56% in 2002. Given surrogate alcohol consumed, this
figure could reach 65% [Nemtsov 2009: 139]. The abundance of low quality alcoholic
beverages, locally produced and imported, in consumer markets resulted in Russian consumers
steadily switching from moonshining to consuming low-priced commercial alcohol. For
instance, in 1999 the average price for a bottle of vodka (1L) was 64.84 RUB equaling the cost
of six loaves of bread7.
However, regardless of the ongoing increase in total alcohol consumption, the early
2000s saw the beginning of the next fluctuations: volumes of unrecorded alcohol in Russian
markets decreased gradually [Kratko 2013]. This dynamic can partially be explained by
structural changes in alcohol consumption caused by global producers entering Russian markets.
The 2000s observed the formation of new alcohol consumption culture: hard drinks, the
consumption of which accounted for 70% of total consumption in the 1980s [Nemtsov 2009],
were replaced with light drinks, primarily beer [Martynenko & Roshchina 2014]. A steady
decrease in the consumption of spirits was accompanied by a significant decline in volumes of
unrecorded alcohol. The overall percentage of samogon drinkers came down to 3.6% by 2012
[Roshchina 2013]. Meanwhile, volumes of illegal alcohol seized in the course of inspections in
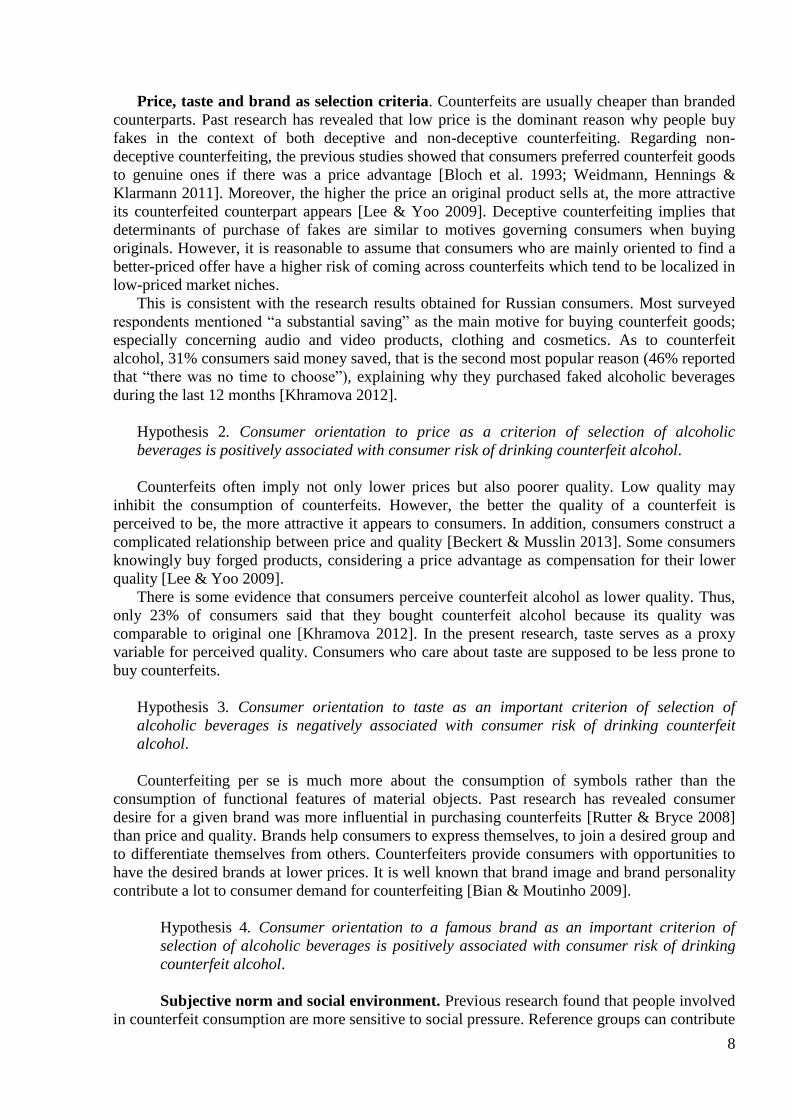
2012 were one third of 1999 (see Fig 1). This tendency was supported by toughening state
control over alcohol markets in the mid-2000s.
6 After the Second World War the total alcohol consumption increased substantially. According to official statistics, in 1984 per
capita consumption was 10.5L., UK (6.9L.), US and Canada (8.0L.) and Australia (8,9L.) behind. In addition, in those years
alcohol markets were characterized by higher share of unrecorded and low quality alcohol equaled to 35% [Nemtsov 2009]. 7 See official statistics: URL: http://www.gks.ru/wps/wcm/connect/rosstat_main/rosstat/ru/statistics/tariffs/ (accessed on 2
August 2014).

6
Source: Federal State Statistics Service
Fig. 1. Illegal alcoholic beverages seized in the course of inspections, 1999–2012
Although the volume of illicitly manufactured alcohol has decreased since the early
2000s, the problem of counterfeiting remains. 246 underground factory shops involved in the
production of alcoholic beverages and 78,053 persons having committed violations related to
illegal production and distribution of ethyl alcohol and alcohol products were discovered in 2011
[Key Indicators… 2011]. The number of organizations involved in the production and
distribution of alcoholic beverages, using forged federal, special and excise stamps was 978; the
number of organizations using counterfeited trademarks was 146; two organizations involved in
illegal importation were revealed.
The next trend concerns the key sources of counterfeiting. There is some evidence that
the volumes of imported counterfeited alcohol are much less than those of locally produced ones.
Local counterfeit alcohol production is located in the Southern regions, especially in North-
Caucasian region [Nemtsov 2009]. Counterfeiting also can be found in areas which are close to
the capitals – in Moscovskaya and Leningradskaya oblasts [Radaev et al 2008]. Some experts
point to the border regions, which are thought to be glutted with counterfeits. Especially areas
bordering Kazakhstan and Far Eastern regions.
In the 1990s, key counterfeiting trade channels were open markets and peddling (kiosks,
booths and so on). Under stronger state control of retailing, counterfeit goods circulating in open
markets and peddling began to decrease. Today, the major channels for counterfeit goods are
thought to be small traditional shops located in remote city districts and the internet. However,
counterfeits can be found anywhere, even in chain stores. For example, consignments of
counterfeit goods which are mixed with originals and sold to consumers. Another method is high
quality counterfeited goods being sold using forged documents, as an examination to determine
the originality of these goods is a task out of the reach of both shops and the owners of a
registered trademark [Kotelnikova 2011].
Illicit commercial alcohol started its mass expansion in the mid-1980s, driven by
economic liberalization, it peaked in the late 1990s, and then, in the early 2000s it began to
decrease. A number of contingent and fundamental reasons caused these fluctuations, two key
tendencies had a significant impact on counterfeit alcohol markets. First is the turn from
moonshining to the consumption of low-priced and low-quality manufactured alcohol. It resulted
in some favorable conditions for consumer demand for counterfeits. Second is the sources of
counterfeiting: from importation toward local production of counterfeit alcohol.
All these trends are important, especially as Russia is going through a new long-term
anti-alcoholic campaign initiated by the government in 2006. A number of restrictions has been
introduced to reduce market availability of alcohol. As to restrictions imposed on legal alcohol, it
3,791,160
2,379,343 2,094,550
1,469,009
824,259 982,724
728,819 850,081 875,700 546,889 667,089
508,399
1,210,125 2,173,435
1,451,939 1,325,452 903,749
501,748 675,245 513,439
293,634 231,867 320,306 336,755 766,111
0
500,000
1,000,000
1,500,000
2,000,000
2,500,000
3,000,000
3,500,000
4,000,000
1999 2000 2001 2002 2003 2004 2005 2006 2007 2008 2009 2010 2012
Alcoholic products seized in the course of examinations (decalitre) Vodka seized in the course of examinations (decalitre)

7
is necessary to investigate counterfeit consumption more thoroughly to predict whether they give
rise to counterfeiting.
3. Determinants of counterfeit alcohol consumption. Conceptualization and hypotheses
The literature singles out two different views on counterfeit consumption [Rutter & Bryce
2008]. The first investigates counterfeiting from the perspective of subcultures implying that
people engaged in the consumption of illicit goods represent subgroups of social deviants or
innovative consumers having common values, attitudes, and practices. The second considers
counterfeit consumption as everyday activities because nowadays the counterfeiting of status
goods has been replaced by counterfeiting of mass products [OECD 2007]; and an increasing
number of people consume counterfeits. For instance, in 2006, Fund of Public Opinion
conducted a survey devoted to falsified goods in Russian markets (n = 1500) and found that 53%
of respondents purchased faked goods during the previous year [Falsified goods… 2006].
Meanwhile, in 2012, 30% of respondents stated that they had bought counterfeits during the
previous year [Khramova 2012]8. The most popular product was clothing (42%), followed by
audio and video products (35%), alcoholic beverages (32%) and cosmetics (26%).
As mentioned above, there are several forms of counterfeiting. They include a) non-deceptive
counterfeiting implying the situation when consumers purposely purchase fakes; b) deceptive
counterfeiting meaning that consumers unknowingly buy forged branded goods [Grossman &
Shapiro 1988]; and c) blur counterfeiting which is “the scenario where consumers are not quite
sure whether what they purchase is counterfeit or a genuine branded product” [Bian 2006: 4].
Moreover, some researchers suggest considering deception not as two distinct forms but as a
spectrum generated from “super-deceptive” (no one can tell apart a counterfeited product from
its genuine counterpart) to “completely non-deceptive” (each buyer can distinct a counterfeited
product from its genuine counterpart) [Bosworth 2006]. The degree of deceptiveness of
counterfeiting varies with consumer experience, awareness, and knowledge [Eisend &
Schuchert-Güler 2006].
Supposedly, due to the fear of possible death caused by acute alcohol poisoning, counterfeit
alcohol is less likely to be purchased deliberately by consumers compared with such products as
branded clothes, watches, glasses, and cosmetics, which were reported to be knowingly bought
by about one-third of consumers [Rutter & Bryce 2008]. Previous research findings support this
proposition: only 13% of Russian alcohol drinkers stated that they bought counterfeit alcoholic
beverages knowingly during the last year [Khramova 2012]. Additionally, most consumers
(46%) mentioned “no time to choose” as a reason for purchasing counterfeit alcohol. This
evidence assumes that one of the main factors in why Russian consumers purchase counterfeit
alcoholic beverages is the system of distribution. They are highly likely to come across
counterfeit alcohol under conditions of its mass expansion. As alcohol refers to experience goods
[Nelson 1970], that is, consumers cannot easily determine the quality and originality of alcoholic
beverages at a place of purchasing, it is reasonable to take into account not only deceptive and
non-deceptive counterfeiting, but also “blur counterfeiting”.
This suggests that counterfeit alcohol consumption is not associated with a specific
subculture. Given the mass expansion of counterfeit alcohol in Russian markets and a lower
degree of consumer awareness in the context of counterfeit alcohol, consumers of counterfeit
alcohol do not significantly differ from other alcohol consumers in relation to patterns of alcohol
consumption.
Hypothesis 1. Counterfeit alcohol consumers do not follow distinctive alcohol consumption
patterns concerning frequency and volume of alcohol drinking, types of alcoholic beverages
consumed, or places of alcohol consumption.
8 In 2012, the research on the consumption of counterfeits was conducted on a representative sample of hard alcohol drinkers in
Russia (n = 2222) [Khramova 2012].
8
Price, taste and brand as selection criteria. Counterfeits are usually cheaper than branded
counterparts. Past research has revealed that low price is the dominant reason why people buy
fakes in the context of both deceptive and non-deceptive counterfeiting. Regarding non-
deceptive counterfeiting, the previous studies showed that consumers preferred counterfeit goods
to genuine ones if there was a price advantage [Bloch et al. 1993; Weidmann, Hennings &
Klarmann 2011]. Moreover, the higher the price an original product sells at, the more attractive
its counterfeited counterpart appears [Lee & Yoo 2009]. Deceptive counterfeiting implies that
determinants of purchase of fakes are similar to motives governing consumers when buying
originals. However, it is reasonable to assume that consumers who are mainly oriented to find a
better-priced offer have a higher risk of coming across counterfeits which tend to be localized in
low-priced market niches.
This is consistent with the research results obtained for Russian consumers. Most surveyed
respondents mentioned “a substantial saving” as the main motive for buying counterfeit goods;
especially concerning audio and video products, clothing and cosmetics. As to counterfeit
alcohol, 31% consumers said money saved, that is the second most popular reason (46% reported
that “there was no time to choose”), explaining why they purchased faked alcoholic beverages
during the last 12 months [Khramova 2012].
Hypothesis 2. Consumer orientation to price as a criterion of selection of alcoholic
beverages is positively associated with consumer risk of drinking counterfeit alcohol.
Counterfeits often imply not only lower prices but also poorer quality. Low quality may
inhibit the consumption of counterfeits. However, the better the quality of a counterfeit is
perceived to be, the more attractive it appears to consumers. In addition, consumers construct a
complicated relationship between price and quality [Beckert & Musslin 2013]. Some consumers
knowingly buy forged products, considering a price advantage as compensation for their lower
quality [Lee & Yoo 2009].
There is some evidence that consumers perceive counterfeit alcohol as lower quality. Thus,
only 23% of consumers said that they bought counterfeit alcohol because its quality was
comparable to original one [Khramova 2012]. In the present research, taste serves as a proxy
variable for perceived quality. Consumers who care about taste are supposed to be less prone to
buy counterfeits.
Hypothesis 3. Consumer orientation to taste as an important criterion of selection of
alcoholic beverages is negatively associated with consumer risk of drinking counterfeit
alcohol.
Counterfeiting per se is much more about the consumption of symbols rather than the
consumption of functional features of material objects. Past research has revealed consumer
desire for a given brand was more influential in purchasing counterfeits [Rutter & Bryce 2008]
than price and quality. Brands help consumers to express themselves, to join a desired group and
to differentiate themselves from others. Counterfeiters provide consumers with opportunities to
have the desired brands at lower prices. It is well known that brand image and brand personality
contribute a lot to consumer demand for counterfeiting [Bian & Moutinho 2009].
Hypothesis 4. Consumer orientation to a famous brand as an important criterion of
selection of alcoholic beverages is positively associated with consumer risk of drinking
counterfeit alcohol.
Subjective norm and social environment. Previous research found that people involved
in counterfeit consumption are more sensitive to social pressure. Reference groups can contribute

9
to the consumption of counterfeits in different ways. First, relatives and friends may act as
opinion makers sharing information regarding rational purchase decisions and product features
[Beckert & Wehinger 2011]. Second, consumers are likely to select counterfeits over genuine
goods, depending on how much their family members and friends approve or disapprove. To
impress others is more important than receiving expert opinions. Finally, Albers-Miller [1999]
demonstrated that people are more prone to engage in illicit behavior under peer pressure. The
surveyed students are high likely to purchase counterfeits if they were with friends who also
bought counterfeit goods.
Alcohol consumption is often associated with collective practices implying that a degree
of susceptibility to social pressure and subjective norms appears to be very high. It is reasonable
therefore to assume that relatives and friends dealing with counterfeit alcohol positively
influence considerations to consume counterfeits.
Hypothesis 5. Consumers who have acquaintances consuming counterfeit alcohol and
producing homemade alcohol have higher risks of drinking counterfeit alcohol.
Consumer characteristics. Previous research demonstrates contradictory results
concerning social characteristics. Some studies show that consumer inclination to purchase
counterfeits varies due to income, education, age and gender; some studies show that the these
characteristics have no significant influence at all.
Social position. There are few papers focusing on the association between social position
and the purchase of counterfeits. Scholars usually research how education, occupation and
income separately determine consumer inclination to purchase counterfeits.
Gail et al. [1998] show that consumers who stated a preference for counterfeit goods tend
to earn less income than consumers who stated a preference for genuine goods. Other scholars
found no influence of income on intentions to buy counterfeits [Bian & Moutinho 2009]. On the
contrary, there is some evidence that buyers of counterfeits are not necessarily from low-income
groups. Khramova found that consumers with higher income more often purchased counterfeit
alcohol compared with the other groups [Khramova 2012].
The impact of education on the purchase of counterfeits appears to be the most
inconsistent. Research shows that people with higher education have a higher degree of
awareness and more easily determine the originality of goods. Nevertheless, people who have
better education may induce consumer demand for counterfeits. Regarding alcohol consumption,
it was shown that people who have no university degree more often purchase counterfeit alcohol
than people with higher education (38 vs 27%) [Khramova 2012].
The present research focuses on how individual social position as an integrated variable
of income, occupation and education determines the risk of consuming counterfeits. However,
given the mass expansion of counterfeit alcohol, inconsistent research findings on the association
between social structure and counterfeit consumption, it is reasonable to assume the following.
Hypothesis 6. Counterfeit alcohol consumers have no association with a specific social
position.
Age. Research shows a significant relationship between age and counterfeit consumption.
Age appears to have a negative association with counterfeit consumption: young people are more
prone to buy counterfeits. One of possible arguments runs from a fact that older people are less
likely to take risks and more inclined to follow business ethical norms. However, the previous
studies demonstrate that counterfeited product categories purchased vary with age. Younger
consumers tend to buy pirated audio and video products [Chiou, Huang & Lee 2005] while older
people tend to buy medicines [Khramova 2012].
Hypothesis 6. Counterfeit alcohol consumers tend to be younger.

10
Gender. Research also reveals that male respondents more often purchase counterfeits
[Rutter & Bryce 2008]. It is also supported by data gathered from a survey of Russian
consumers, among respondents who purchased counterfeits during the last 12 months, the
percentage of male respondents (32%) was higher than the those of females (27%) [Khramova
2012]. This fact supposedly reflects that women are more inclined to follow ethical norms and
less disposed to involve themselves in illicit activities. Nevertheless, a large amount of evidence
indicates gender differences in counterfeited product categories purchased. Research
demonstrates that women were inclined to purchase counterfeited clothes, cosmetics, and
pharmaceutical products and medicines while men tended to buy counterfeit alcohol, tobacco,
and audio and video products [Khramova 2012]. Thus, it is reasonable to assume the following.
Hypothesis 7. Counterfeit alcohol consumers tend to be male.
4. Measures and methods
The paper presents a memory-based approach, relying on consumer self-reports on
alcohol drinking gathered with help of a nationwide Russian survey of households and
individuals carried out in 2012. It employs several methods, including correspondence analysis,
factor analysis, k-means cluster analysis, and multinomial logistic regression to test the
hypotheses described above. Factor analysis and k-means cluster analysis were applied in order
to classify consumers into groups showing different alcohol consumption patterns while a
method of multinomial logistic regression was used in order to reveal predictors of risks for
alcohol drinkers to consume counterfeit alcohol in Russia.
Dependent variable
A dependent variable “Counterfeit alcohol consumers” was constructed from three
questions: 1) “Do you consume alcoholic beverages, including beer, at least sometimes?”; 2)
“Have you consumed alcoholic beverages, including beer, during the last 30 days?” and 3)
“Have you consumed alcoholic beverages during the last 30 days which, in your opinion, were
counterfeit?”. The variable is “1” when a given consumer states that (s)he “never consumes
alcoholic beverages or has not consumed alcoholic beverages during the last 30 days”. It is “2”
when a given consumer states that (s)he has not consumed counterfeit alcohol during the last 30
days. It is “3” when a given consumer states that (s)he has consumed counterfeit alcohol during
the last 30 days; and “4” when a given consumer states that (s)he does not know whether
consumed alcohol was counterfeit or not (blur counterfeiting). People who have not consumed
counterfeit alcoholic beverages during the last 30 days serve as a reference group.
Table 1. Dependent variable “Have you consumed alcoholic beverages during the last 30 days
which, in your opinion, were counterfeit?”
Dependent variable
People who do not consume alcohol 51.2%
People who have not consumed counterfeit alcohol during the last 30 days 41.7%
People who are not sure whether the consumed alcoholic beverages were counterfeit 4.4%
People who consumed counterfeit alcohol during the last 30 days 2.7%
Number of respondents 18,303
Independent variables
Independent variables are divided into five groups: 1) clusters of consumers with
different patterns of alcohol consumption; 2) criteria taken account by consumers when selecting
alcoholic beverages; 3) characteristics of consumer’s social environment; 4) consumer

11
characteristics; and 5) control variables. Table A1 summarizes all independent variables (see
Attachment 1).
Alcohol consumption patterns. Six clusters representing consumers with different patterns
of alcohol consumption were computed with help of factor and k-means analysis. The factor
analysis was applied in order to find the structural relations among the 18 dichotomous variables
describing different patterns of alcohol consumption: frequency of alcohol consumption; places
where alcohol is consumed; types of alcoholic beverages consumed during the last 30 days;
association between mealtime and alcohol drinking; belonging to a group of alcohol drinkers
who have problems generated from alcohol consumption; belonging to a group of households
producing homemade alcohol.
Six factors were revealed, applying the method of main components with Varimax
rotation (the explained dispersion is 50.6 %). The factor loadings are presented in Table A2 (see
the Attachment 2). The first factor is associated with beer consumption patterns implying
frequent alcohol drinking before and without meals in public places. The second factor describes
socially oriented alcohol drinking covering consumption of cognac, whiskey, wine and
champagne consumed at restaurants and bars or at the workplace or visiting friends at mealtimes.
The third factor refers to problem alcohol drinking patterns implying consumption of samogon
and fortified wine which happens frequently in public places and at the workplace. The fourth
factor embraces vodka consumption patterns. The fifth is related to homemade alcohol
consumption and production. The last includes alcohol drinking at home (mainly beer).
Then, a k-means cluster analysis was applied in order to find the groups of consumers
with different alcohol consumption patterns. Six groups are presented in the table 2.
Table 2. Clusters of consumers with different alcohol consumption patterns
Clusters % Short description
Vodka lovers 27.5 Consumers of vodka (and beer) who tend drink alcohol at home and
visiting friends having meals from 23 times per month to 23 times
per week. They tend to be heavy drinkers and report problems
associated with drinking alcohol.
Light and
expensive
alcohol
consumers
39.8 Consumers of beer, wine and champagne, cognac and whiskey who
tend to drink alcohol at restaurants and bars from 23 times per
month to 23 times per week.
Eclectic alcohol
drinkers
7.2 Consumers of beer, homemade wine, vodka, and wine, who tend to
drink alcohol at home from 23 times per month to once per week.
They are high likely to belong to households producing homemade
alcohol.
Occasional
alcohol drinkers
12.7 Consumers of beer, vodka, wine and champagne, cognac and
whiskey who tend to drink alcohol once per month in public places,
visiting friends and at the workplace.
Hazardous
alcohol drinkers
10.0 Consumers of beer, vodka, fortified wine and samogon who tend to
drink alcohol at home, in public places, at work, and visiting friends
before mealtime and without meal from 23 times per week to every
day. They tend to be heavy drinkers and report problems associated
with drinking alcohol.
Homemade
alcohol
consumers
2.8 Consumers of homemade wine and samogon who tend to drink
alcohol at home 23 times per week. They tend to refer to heavy
drinkers. They belong to households producing homemade alcohol.
Total 100
Number of
respondents
8,778

12
Criteria taken account by consumers when selecting alcoholic beverages include three
dimensions: the degree of consumer orientation to price when selecting alcoholic beverages, the
degree of consumer orientation to taste, (s)he likes, the degree of consumer orientation to a
famous brand. A five grading scale variable represents each of them. In the regression analysis,
they were used as separate continuous variables.
Consumer’s social environment. This group covers two dichotomous variables indicating
characteristics of social networks those alcohol drinkers are involved in. The first indicates
whether a given respondent has acquaintances, neighbors or relatives who drink surrogate
alcohol. The second reflects whether there are homemade alcohol producers among a given
respondent’ acquaintances, neighbors or relatives. Both variables indicate social risks for alcohol
drinkers to consume counterfeit alcohol.
Consumer characteristics. In addition, there are several variables embracing social and
demographic characteristics such as individual social class position, gender, age, number of
household members, and type of residence.
Individual social class position is a categorical variable constructed with help of
ESOMAR methodology and techniques9 (1 = upper-upper class; 2 = lower upper class; 3 = upper
middle class; 4 = lower middle class; 5 = upper lower class; 6 = lower-lower class). It reflects an
individual social status generated from positions at three social dimensions, including completed
education level, occupational status and household well-being.
Gender is represented by a dummy variable (1 = male). Age is measured as a number of
years computed as 2012 minus year of birth (continuous variable). The number of household
members is a categorical variable (1 = alone, 2 = from two to four, 3 = more than five)
constructed from the continuous variable “How many people do you live with?” The type of
residence reflects town type and size where a given respondent lives. The variable is “1” for a
regional central city, “2” for city or town, “3” for township, and “4” for rural areas.
Control variables. Finally, two control variables (gross regional product per capita and
individual level of hesitation) are included into the model. Rosstat official statistics was
employed to construct a variable “gross regional product per capita” for the surveyed regions.
Additionally, I measure the individual level of hesitation in order to control for the fact that blur
counterfeiting is not generated from people who tend to have no certain answer to most
questions. This variable is computed as counting a total number of “Difficult to say” chosen by a
given respondent during the whole survey (except questions related to alcohol consumption).
A method of multinomial logistic regression was employed to find the predictors of risks
for the consumption of counterfeit alcohol in Russia. Several models of multinomial regression
were computed in order to understand the impact of cultural and structural factors on counterfeit
alcohol consumption. I include sequentially variables relating to drinking patterns in the
multinomial regressions (see the table 7). Consumers of original alcohol represented a reference
group. In addition, reference groups included female representatives of the lower-lower social
class living with five and more household members in rural area, having acquaintances
consuming alcoholic surrogates, having acquaintances producing homemade alcoholic
beverages, and belonging to a cluster of homemade alcohol drinkers. All regression models turn
out to be statistically significant (p < 0.001).
5. Data sources
The paper is based on the 21st RLMS-HSE
10 round of the nationwide Russian survey of
8,440 households and 18,687 individuals aged 14 or older, residing those households, conducted
9 http://www.esomar.org/ (accessed on 2 August 2014). 10 Source: “Russia Longitudinal Monitoring survey, RLMS-HSE”, conducted by Higher School of Economics and ZAO
“Demoscope” together with Carolina Population Center, University of North Carolina at Chapel Hill and the Institute of
Sociology RAS. (RLMS-HSE sites: http://www.cpc.unc.edu/projects/rlms-hse, http://www.hse.ru/org/hse/rlms) (accessed on 2
August 2014). RLMS-HSE presents a series of nationally representative panel surveys conducted since 1992. Data are gathered
with help of face-to-face interviews.

13
in November 2012. RLMS-HSE, a multi-stage probability sample constructed on dwelling units,
provides data on 3,000 variables. All calculations presented in the paper were done on a basis of
the merged dataset, including variables generated from surveys of individuals aged 15 or older11
and their households. The main parameters of the sample are summarized in the Table A2 (see
the Attachment). Additionally, all percentages concerning the scope of counterfeit alcohol
consumption were computed on the weighted sample.
It is well known that studies in counterfeiting based on consumer surveys have some
limitations. They are less informative when research aims to count the scope of market
proliferation of counterfeits as their results significantly depend on the degree of consumer
counterfeit awareness. Consumer surveys appear to be more informative when studying direct
effects of counterfeiting on consumer behavior [Olsen 2005]. Additionally, the respondent
sensitivity to questions related to consumption of illicit goods should be taken into account.
Consumers tend to hide facts concerning fakes consumed, especially in those societies where the
majority demonstrate negative attitudes toward counterfeiting.
It is necessary to note that data of RLMS-HSE surveys used also implies some
restrictions related to measurement of alcohol consumption as the main subject of the presented
paper. The survey does not cover the richest and the poorest representatives of the Russian social
structure. More importantly, it fails to achieve heavily alcohol addicted and homeless people.
Thus, the calculated estimates of scales of counterfeit alcohol consumption may be undervalued.
6. Research Findings
6.1. Attitudes to counterfeiting and the scope of counterfeit alcohol consumption
The research findings demonstrate that the majority (90.3%) believe that counterfeit
alcohol is widespread in contemporary Russia. Nearly half of the surveyed respondents say that
the scope of counterfeit alcohol has expanded in the Russian markets over the last 2–3 years.
Meanwhile, 42% say that the situation has not changed. Only 9.7% say that there was less
counterfeit alcohol than there was several years ago.
The observed level of counterfeit alcohol consumption is much lower than one could
expect. Among people who consumed alcohol during the last 30 days (n = 6,989), 85.1% say that
they definitely did not drink counterfeit alcoholic beverages during the last 30 days; 9.2% cannot
give a certain answer to this question and only 5.8% say that they consumed counterfeits. In
addition, half of counterfeit alcohol consumers (54.1%) said that they did it more than once
during the last 30 days (median value = 2; n = 403).
As to purchasing counterfeit alcohol, among the people who bought alcohol during the
last 30 days (n = 3,517), 6.8% say that they bought counterfeit and 10.8% does not know, while
82.4% say that they did not purchase counterfeit alcohol during the last 30 days. Among
counterfeit alcohol buyers, 55.8% did it unknowingly (deceptive counterfeiting) while 31.5%
were aware of purchasing counterfeit alcoholic beverages (non-deceptive counterfeiting) and
12.6% stated that sometimes they bought counterfeit alcoholic beverages deliberately, sometimes
they did it unknowingly. The observed results contradict past research findings indicating that
about one-third of consumers buy counterfeits purposely [Bian & Moutinho 2009: 368; see also
Rutter & Bryce 2008]. Vodka (mostly 0,5l) seems to refer to the key target for counterfeiting in
Russia compared to the other alcoholic beverages. Among respondents who have purchased
counterfeit alcohol during the last 30 days, 51.2% mentioned vodka (n = 106) followed by beer,
wine, alcoholic cocktails, cognac, and champagne.
Physical risks are the main argument against the consumption of counterfeit alcohol. The
absolute majority of Russians (94%) completely agree that counterfeit alcohol may cause death.
Consumers of original alcoholic beverages and non-consumers tend to evaluate possible risks for
health higher (94.8% and 93.9% respectively) than people who consumed counterfeit alcohol
11 According to the literature on alcohol consumption, comparable parameters indicating volumes of alcohol consumption are
calculated for people aged 15 years or older [Nemtsov 2009; WTO 2006].

14
(86.2%). This indicates that counterfeit alcohol buyers perceive risks lower than others do, and
justify their behavior like compulsory consumers, i.e. addicts, are prone to do [Hirschman 1992].
As to how people evaluate the availability of counterfeit alcohol, 74.4% affirms that
counterfeit alcohol is less expensive than original. This result is consistent with previous
findings: approximately 70% of respondents considered legitimate goods as overpriced [Rutter &
Bryce 2009: 1156]. More than 50% of respondents say that there is more counterfeit alcohol on
the market than non-counterfeit and say that local alcohol is more frequently counterfeited than
imported.
Table 3. Consumer attitudes to counterfeiting
Do you agree or
disagree with the
statement that
counterfeit
alcohol may cause
death?
Do you agree or
disagree with the
statement that
counterfeit
alcohol is
cheaper?
Do you agree or
disagree with that
counterfeit
alcoholic
beverages are
prevalent in
retailing?
Do you agree or
disagree with that
locally produced
alcohol is more
frequently
counterfeited?
Agree
(%)
94.0 74.9 53.4 53.1
Disagree
(%)
2.8 12.2 18.2 19.3
Neutral
(%)
3.2 12.9 28.4 27.6
Total
(%)
100 100 100 100
N 14,098 12,823 11,130 10,184
Russians, including alcohol drinkers and those who never consume it, believe that
counterfeit alcohol is highly risky for health, cheaper than the original, locally produced and
prevalent in Russian markets.
6.2. Alcohol consumption patterns and counterfeit alcohol consumption
As obtained, counterfeiting and blur counterfeiting imply distinct alcohol consumption
practices strongly associated with patterns of hazardous drinking. Counterfeit alcohol consumers
are inclined to drink alcoholic beverages frequently and a lot in public places and at work, to
have problems generated from alcohol consumption, to have acquaintances consuming surrogate
alcohol and producing homemade alcohol, and to belong to households producing homemade
alcohol.
The highest percentage of consumers who reported that they drank alcohol every day or
4–6 days per week during the last 30 days is observed among consumers of counterfeit alcohol
(13.2%). Only 3.5% of consumers of genuine alcoholic beverages and 7.6% of hesitating
respondents drank alcohol during the last 30 days as frequently as counterfeit alcohol consumers
did. 63% of consumers of original alcohol drank alcoholic beverages up to three times per
month. The largest share of excessive drinkers, 51.6%, was also revealed among consumers of
counterfeit alcohol if compared with 32.4% of hesitating respondents and 15.3% of consumers of
original beverages. In addition, 31.6% of respondents who consumed counterfeit alcohol during
the last 30 days confirmed that they had problems (related to family, work, health, etc.) resulted
from drinking alcohol. Only 20.3% of hesitating respondents and 9.7% of consumers of original
alcohol reported the same problems.
The most popular place where Russians drink alcohol is at home followed by at friends’
homes, in restaurants and bars. Consumers of original alcohol tend to drink spirits at restaurants

15
and bars and tend not to drink them in public places (streets, parks, etc.) or at work as counterfeit
alcohol consumers are inclined to do. In addition, percentages of people consuming alcohol
before mealtime or without meal are significantly greater among counterfeit alcohol consumers
(42.9 and 39.9%) and hesitating respondents (40.2 and 34.2%) than among original alcohol
consumers (25.3 and 22.3%).
As to types of alcoholic beverages consumed, the most popular alcoholic beverages are
beer followed by vodka and wine. However, counterfeit alcohol consumers demonstrate the
greatest percentages of all types of alcoholic beverages consumed during the last 30 days,
confirming the fact that they are involved in excessive drinking. One important thing is that
counterfeit alcohol consumption is obviously associated with unrecorded alcohol consumption.
Counterfeit alcohol consumers are distinguished by significantly higher share of samogon
drinkers. Additionally, counterfeit alcohol consumers tend to be involved in the production of
homemade alcoholic beverages while hesitating consumers are definitely not inclined to
producing alcoholic beverages at home.
Table 4. Associations of counterfeit consumer behavior and patterns of alcohol consumption
Consumers of
counterfeit
alcohol
Blur
Counterfeiting
Consumers
of original
alcohol
Frequency of alcohol consumption
Often 13.2% 7.6% 3.5%
Sometimes 48.0% 40.2% 33.5%
Seldom 38.8% 52.2% 63.0%
Total 100% 100% 100%
N 485 803 7,617
Heavy drinkers
Heavy drinkers12
51.6% 32.4% 15.3%
Moderate drinkers 48.4% 67.6% 84.7%
Total 100% 100% 100%
N 256 447 4,273
Problem drinkers
Consumers reporting that they have
problems (with health, family, at
work, etc.) generated from alcohol
consumption
31.6% 20.3% 9.7%
N 487 813 7,636
Place of alcohol consumption
At home 91.7% 89.8% 86.1%
Restaurants and bars 21.0% 22.2% 25.3%
Public places (parks, streets, etc.) 16.5% 10.5% 4.6%
Visiting friends 70.1% 71.3% 70.4%
At work 10.9% 6.6% 6.0%
N 482 808 7,619
Mealtime and alcohol consumption
Before mealtime 42.9% 40.2% 25.3%
While mealtime 89.0% 90.3% 88.8%
Without meal 39.9% 34.2% 22.3%
12 Heavy drinkers cover men who consume over 800 g of pure ethanol monthly and women who consume 400 g pure ethanol
monthly.

16
N 481 800 7,590
Consumed alcoholic beverages
Beer 62.6% 56.2% 51.7%
Homemade wine 8.4% 3.0% 5..3%
Fortified wine 11.1% 10.8% 7..8%
Samogon 13.6% 9.6% 3..6%
Vodka 58.9% 56.8% 39.2%
Cognac, whiskey 14.4% 9.6% 14.6%
Wine 22.2% 22.5% 26.8%
N 487 813 7,636
Producers of homemade alcohol
Your family produced any
homemade alcoholic beverages
11.9% 5.5% 8.2%
N 486 813 7,617
The findings revealed with help of correspondence analysis are consistent with the
research results described above (Fig. 2). Counterfeit alcohol consumers are associated with two
clusters of alcohol consumers, namely hazardous drinkers and homemade alcohol drinkers. Blur
counterfeiting is related to hazardous drinkers as well as vodka lovers. Finally, eclectic alcohol
drinkers, light and expensive alcohol consumers and occasionally alcohol drinkers can be found
mainly among original alcohol consumers.
Fig. 2. Association between counterfeit alcohol consumption and clusters of consumers with
different alcohol consumption patterns
Counterfeit alcohol consumers are indifferent to taste and famous trademarks when
selecting alcoholic beverages. This finding contradicts previous research results according to
those brand image and brand personality serve as a main driver for counterfeiting.
Meanwhile, respondents who are not sure whether alcoholic beverages consumed during
the last 30 days were counterfeit or not demonstrate higher price sensitivity if compared to other

17
groups of alcohol consumers. They consider affordable price as a very important criterion when
selecting alcoholic beverages.
Table 5. Associations of counterfeit consumer behavior and patterns of alcohol consumption
Counterfeiting Blur
Counterfeiting
Consumers
of original
alcohol
Frequency of alcohol consumption
Alcohol selection criteria
Available price
Unimportant 15.2% 8.1% 12.6%
Neutral 14.0% 12.7% 17.0%
Important 70.8% 79.2% 71.2%
Total 100% 100% 100%
N 486 794 7522
Taste
Unimportant 14.5% 6.8% 4.6%
Neutral 9.8% 12.4% 7.8%
Important 75.7% 80.7% 86.3%
Total 100% 100% 100%
N 482 774 7,475
Famous trademark
Unimportant 30.0% 20.9% 15.5%
Neutral 18.8% 23.0% 21.0%
Important 51.3% 56.1% 63.4%
Total 100% 100% 100%
N 480 766 7,470
Social environment
People reporting that they have
acquaintances consuming surrogate
alcohol
30.7% 25.1% 12.7%
N 460 698 7,124
People reporting that they have
acquaintances producing homemade
alcohol
23.9% 23.7% 15.9%
N 473 754 7,350
Social embeddedness [Granovetter 1985] should be taken into account when analyzing
counterfeiting and blur counterfeiting. Counterfeit alcohol consumers (30.7%) and hesitating
consumers (25.1%) significantly more often than original alcohol consumers (12.7%) indicate
that they have acquaintances, neighbors or relatives consuming surrogate alcohol. In addition,
the percentage of people reporting that they have acquaintances, neighbors or relatives producing
homemade alcohol is higher among counterfeit alcohol consumers (23.9%) and hesitating
respondents (23.7%) compared to original alcohol consumers (15.9%).
The research findings demonstrate that the alcohol consumption practices of respondents,
who assert that they consumed alcohol, which, in their opinion, was counterfeit, are significantly
different from those showed by consumers who did not consume counterfeit alcoholic beverages.
Blur counterfeiting implies intermediate estimates. Counterfeit alcohol consumers are associated
with hazardous drinkers and homemade alcohol drinkers who tend to be indifferent to quality
and trademarks while blur counterfeiting is related to hazardous drinkers and vodka lovers who
are more sensitive to price when selecting alcohol. One important thing is that people consuming

18
counterfeit alcohol are involved in social networks supporting unrecorded alcohol production
and consumption.
6.3. Social and demographic characteristics of counterfeit alcohol consumers
Analyzing the relationship between social and demographic characteristics, and
counterfeit consumption, it is suggested that the percentage of respondents who definitely
consumed counterfeit alcoholic beverages varied according to gender and age. The share of male
respondents is significantly higher among consumers of counterfeit alcohol (67.8%) and
consumers who could not give a certain answer concerning the originality of consumed drinks
(58.6%) than among consumers of original alcohol (49.9%). Consumers of counterfeit alcohol
tend to be slightly younger (average age is 41.1) than consumers of original alcohol (average age
is 42.6) and consumers who did not know the answer (average age is 44.3).
The percentage of people with professional secondary education is greater among
consumers of counterfeit alcohol (34.8%) if compared with consumers of genuine alcohol
(27.5%) and hesitating respondents (27.2%). The share of people with primary education is the
highest among consumers who could not define the originality of consumed alcohol (32.9%)
compared with counterfeit consumers (26.9%) and consumers of original alcohol (18.7%). The
main difference between consumers of original beverages and the other observed groups is that
the former are likely to be higher educated (29.4%), employed (68.1%) and well-off (family
income per capita is 15 537 rubles). The significant distinction of hesitating consumers is that
among them there is the highest percentage of people (22.4%) who live with more than five
family members.
The correspondence analysis findings (Fig. 3) suggest that the lower-lower social class
mainly represents counterfeit alcohol consumers and respondents who could not give a certain
answer concerning the originality of alcoholic beverages consumed. Original alcohol consumers
tend to belong to upper class and upper-middle class.

19
Fig. 3. Association between counterfeit alcohol consumption and social classes
The percentage of respondents who consumed counterfeit alcohol is significantly higher
among people living in Siberia (18.9%) and North-Caucasian (9.0%) regions compared to other
groups. Respondents who did not know the answer tend to live in Povolzhie (27.2%) and Far-
East regions (7.0%). The percentage of respondents who consumed original alcohol is
significantly higher among people living in regional central cities (49.1%) while hesitating
respondents tend to live in rural areas (32.6%).
Table 6. Relationship between demographic variable and counterfeit alcohol consumption
Counterfeiting Blur
counterfeiting
Original alcohol
consumption
Gender
Female 32.2% 41.4% 50.1%
Male 67.8% 58.6% 49.9%
Total 100% 100% 100%
N 487 813 7,630
Average age 41.1 44.3 42.6
SE 14.5 15.5 15.6
Number of respondents 487 813 7,636
Education
Primary and uncompleted
secondary
26.9% 32.9% 18.7%
Professional and technical 34.8% 27.2% 27.5%
Special secondary 23.6% 24.0% 24.4%
Higher 14.7% 16.0% 29.4%
Total 100% 100% 100%
N 483 805 7,590
Employment
Employed 64.5 64.5 68.1
Unemployed 35.5 35.5 31.9
Total
N 487 812 7,626
Household income per capita 13,593.3 13,273.9 15,537.7
N 464 778 7,257
Number of household members
One 7.0% 6.2% 7.0%
From two to four 74.5% 71.5% 76.5%
More than five 18.5% 22.4% 16.5%
Total 100% 100% 100%
N 487 813 7,637
Type of residence
Central city of a region 37.2% 33.5% 49.1%
City 32.0% 29.2% 25.5%
Township 2.9% 4.8% 5.7%
Rural area 27.9% 32.6% 19.7%
Total 100% 100% 100%
N 487 813 7,636
Regions

20
North-West 8.4% 11.1% 9.5%
Central 27.1% 24.9% 29.6%
South 6.6% 6.9% 8.7%
Povolzhie 19.9% 27.2% 22.0%
Ural 6.6% 4.6% 7.3%
Siberia 18.9 14.0% 15.6%
Far-East 3.5% 7.0% 4.1%
North-Caucasian 9.0% 4.1% 3.2%
Total 100% 100% 100%
N 487 813 7,637
Counterfeit alcohol consumers tend to be male, younger, less educated, unemployed and
poorer compared with consumers of original alcohol who are likely to be more educated,
employed and well-off, living in regional centers. It is also important to note that respondents
who drank during the last 30 days have a lot in common with people who are not sure whether
the consumed alcohol was counterfeit or genuine. Blur counterfeiting is associated with people
who tend to be male, older, less educated, unemployed, poorer, and living with more than five
family members in rural areas.
6.4. Predictors of counterfeit alcohol consumption
This section presents predictors of the existing risks for alcohol drinkers consuming
counterfeit alcohol in Russia. Factors which are significantly associated with the dependent
variable include patterns of drinking alcohol, alcohol selection criteria, social environment,
social class position, gender, age, town type and size, number of household members, and
regional differences (see Table 7). Predictors of risks for alcohol drinkers consuming counterfeit
alcohol are slightly different for consumers who state that they consumed counterfeits and for
consumers who do not know whether alcoholic beverages they consumed were counterfeit.
However, cultural factors represented by clusters of consumers with different patterns of alcohol
consumption seem to play an important role in explaining risks for alcohol drinkers to consume
counterfeits in both contexts of counterfeiting and blur counterfeiting.
<Table 7. Multinomial logistic regression coefficients >
Counterfeiting relative to drinking original alcohol. The risks existing for alcohol
drinkers consuming counterfeit alcohol are strongly related to patterns of alcohol consumption,
alcohol selection criteria, social environment, social class, gender, age, town type and size, and
gross regional product per capita. Contrary to expectations, patterns of alcohol consumption
contribute significantly to risks for alcohol drinkers to consume counterfeit alcohol (H1 was
rejected). The multinomial logit for vodka lovers relative to homemade alcohol drinkers is 0.674
unit lower for counterfeit alcohol consumers compared to original alcohol consumers given all
predictors in the model are held constant. The multinomial logit for eclectic alcohol consumers
relative to homemade alcohol drinkers is 1.013 unit lower for counterfeit alcohol consumers
relative to original alcohol consumers given all predictors in the model are held constant. The
multinomial logit for light and expensive alcohol consumers relative to homemade alcohol
drinkers is 1.302 unit lower for counterfeit alcohol consumers compared to original alcohol
consumers given all predictors in the model are held constant. The multinomial logit for
occasional alcohol drinkers relative to homemade alcohol drinkers is 1.372 unit lower for
counterfeit alcohol consumers compared to original alcohol consumers given all predictors in the
model are held constant. Additionally, for counterfeit alcohol consumers relative to original
alcohol consumers the regression coefficient was not found for hazardous alcohol consumers to
be statistically significant. In other words, vodka lovers, light and expensive alcohol consumers,

21
eclectic alcohol consumers and occasional alcohol drinkers are less likely to consume counterfeit
alcoholic beverages compared to hazardous alcohol drinkers and homemade alcohol ones.
Contrary to expectations, affordable price as a criterion of selecting alcoholic beverages
has no significant relation with risks to consuming counterfeit alcohol (H2 was rejected).
Meanwhile, indifference to quality of alcohol expressed by taste and famous brands contributes a
lot into counterfeit consumption (H3 and H4 were partially supported). If perceived importance
of famous brands when selecting alcoholic beverages went up by one point, the multinomial logit
for consuming counterfeit alcohol relative to drinking original alcohol would go down by 0.670
unit while holding all other variables in the model constant. If perceived importance of taste
when selecting alcoholic beverages increased by one point, the multinomial logit for consuming
counterfeit alcohol relative to drinking original alcohol would decrease by 0.871 unit while
holding all other variables in the model constant. Thus, consumers who are less oriented toward
taste and famous brands when choosing alcohol tend to drink counterfeits.
The social environment is one of the influential factors determining counterfeit alcohol
consumption (H4 was supported). For people who have no neighbors and acquaintances
consuming surrogate alcohol compared to people who have such neighbors and acquaintances
the chances of consuming counterfeit alcohol relative to those of drinking original alcohol are
0.666 unit lower when holding all other variables constant. Respondents who have acquaintances
and relatives producing homemade alcohol relative to individuals who have no such
acquaintances and relatives have risks equaled to 0.315 unit lower if all other predictors are
constant. So, consumers tied with people drinking low-quality alcohol tend to drink counterfeits.
As to social characteristics, the two upper class representatives have significantly lower
risks than those of the lower-lower class do compared to original alcohol consumers (H5 was
rejected). The multinomial logits for upper-upper class and lower upper class relative to lower-
lower one are correspondingly 0.845 and 0.610 unit lower for counterfeit alcohol consumers
compared to original alcohol consumers given all predictors in the model are held constant.
Older people have lower risks of encountering counterfeiting (H6 was supported). If a subject
were to increase the age of a given respondent by one year, the multinomial logit for consuming
counterfeit alcohol relative to original one would be expected to decrease by 0.013. Men are
more likely to consume counterfeit alcohol if compared to women (H7 was supported). The
multinomial logit for males relative to females is 0.332 unit higher for counterfeit alcohol
consumers relative to original alcohol consumers given all predictors in the model are held
constant. Risks of consuming counterfeit alcohol are lower for people living in towns than for a
person living in other areas. The multinomial logit for consumers living in towns relative to
alcohol drinkers dwelling in rural areas is 0.966 unit lower for counterfeit alcohol consumers
compared to original alcohol consumers given all predictors in the model are held constant. The
regression coefficients were not found for people living in regional centers and cities to be
statistically significant in comparison of counterfeit alcohol consumers and original alcohol ones.
The risk of consuming counterfeit alcohol goes down with an increase in the gross regional
product per capita. If a subject were to increase the natural logarithm of gross regional product
per capita by one point the multinomial logit for consuming counterfeit alcohol relative to
original one would be expected to decrease by 0.248. This fact means that people leaving in
poorer regions have higher risks of consuming counterfeit alcohol.
Blur counterfeiting relative to drinking original alcohol. It was obtained that risks of
blur counterfeiting are explained by such factors as patterns of alcohol consumption, alcohol
selection criteria, social environment, social class, number of family members, town type and
size, gross regional product per capita, and overall level of hesitation.
Vodka lovers, hazardous drinkers and light and expensive alcohol consumers are inclined
to hesitate about the originality of alcoholic beverages consumed. They have higher risks than
other groups if compared to original alcohol consumers. Hazardous drinkers have the highest
risks. The multinomial logit for hazardous alcohol drinkers relative to homemade alcohol
drinkers is 1.912 unit higher for hesitating consumers compared to original alcohol consumers

22
given all predictors in the model are held constant. The multinomial logit for vodka lovers
relative to homemade alcohol drinkers is 1.403 unit higher for consumers hesitating about the
originality of consumed alcohol compared to original alcohol consumers given all predictors in
the model are held constant. The multinomial logit for light and expensive alcohol consumers
relative to homemade alcohol drinkers is 0.975 unit higher for blur counterfeiting relative to
drinking original alcohol given all predictors in the model are held constant.
Affordable price and taste as important criteria when choosing alcoholic beverages are
significant factors explaining consumer risks in the context of blur counterfeiting. Consumers
taking into account price as an important criterion when purchasing alcoholic beverages are high
likely to show blur counterfeiting. If a subject were to increase the importance of affordable
price by one point the multinomial logit for blur counterfeiting relative to drinking original one
would be expected to increase by 0.995 unit while holding all other variables constant. The
consumer indifference to taste also increases the risk of blur counterfeiting. If a subject were to
increase the perceived importance of taste by one point the multinomial logit for blur
counterfeiting relative to drinking original one would be expected to decrease by 0.552 unit
while holding all other variables constant.
For people who have neighbors and acquaintances consuming surrogate alcohol and
producing homemade alcohol, the risks of blur counterfeiting are significantly greater than they
are for people who have no such acquaintances. The multinomial logit estimates are
correspondingly 0.392 and 0.368 unit lower for hesitating consumers compared to original
alcohol consumers given all predictors in the model are held constant.
Representatives of all social classes (except upper middle class) have lower risks than
those of the lower-lower class compared with people who did not consume counterfeit alcohol
during the last 30 days. The multinomial logit for upper-upper class relative to lower-lower one
is 0.912 unit lower for hesitating consumers compared to original alcohol consumers given all
predictors in the model are held constant. The multinomial logit for lower upper class relative to
lower-lower class is 0.400 unit lower for hesitating consumers compared to original alcohol
consumers given all predictors in the model are held constant. The multinomial logit for lower
middle class relative to lower-lower one is 0.547 unit lower for hesitating consumers compared
to original alcohol consumers given all predictors in the model are held constant. The
multinomial logit for upper lower class relative to lower-lower class is 0.371 unit lower for
hesitating consumers compared to original alcohol consumers given all predictors in the model
are held constant. People living with up to four family members have lower risks than people
living with more than five household members. For the former chances of blur counterfeiting
relative to those of drinking original alcohol are 0.414 unit lower when holding all other
variables constant. People dwelling in central cities have lower risks that people living in other
areas. The multinomial logit for consumers living in regional centers relative to alcohol drinkers
dwelling in rural areas is 0.654 unit lower for hesitating consumers compared to original alcohol
consumers given all predictors in the model are held constant.
A significant relation between the individual level of hesitation and blur counterfeiting
was found. If a subject were to increase the level of hesitation by one point the multinomial logit
for blur counterfeiting relative to drinking original one would be expected to increase by 0.124
unit while holding all other predictors constant. In other words, the more often people chose the
answer “Do not know” during the survey, the higher the probability to have no answer to the
question concerning the originality of consumed beverages. It seems that a given consumer does
not know whether consumed alcohol was counterfeit or not only due to high quality of
counterfeits but also due to consumer’s lower level of education.
7. Discussion and conclusions
This paper focuses on counterfeit alcohol consumption in contemporary Russia. It is
aimed at understanding whether counterfeit alcohol consumption refers to the phenomenon

23
culturally and structurally localized and to reveal predictors of risks for alcohol drinkers of
consuming counterfeit alcohol.
Most Russians believe that counterfeit alcohol is prevalent in national markets and
that there has been a negative trend in its expansion during the last 23 years. The public
opinion is consistent with expert speculations indicating that Russian markets for alcoholic
beverages are much affected by counterfeiting. Moreover, estimations collected from alcohol
consumers are significantly higher than those given by respondents who never drink alcohol,
implying that they may rely on some empirical evidence. In this light, it is important to
understand what is going on in alcohol markets more thoroughly, especially because of the anti-
alcohol reforms started in 2006. Public opinion probably should be considered as a signal of how
informal alcohol markets have been reacting to the implemented restrictions, including fiscal
policies.
The observed counterfeit alcohol consumption was revealed to be lower than one
would expect. The findings demonstrate that among people who have consumed alcohol drinks
during the last 30 days, 5.4% state that they have drunk counterfeit alcohol and 9.1% cannot give
a certain answer to this question. Among people who bought alcohol during the last 30 days,
6.8% affirm that they bought counterfeits and 10.8% do not know the answer to this question. It
is important to note that the observed scope of counterfeit alcohol consumption may be
underestimated as to alcohol refers to experience goods, quality and authenticity of which cannot
be easily determined by consumers. Therefore, it is necessary to take into account blur
counterfeiting as a separate form of counterfeiting. In addition, RLMS-HSE as any nationwide
survey does not reach marginal groups, including homeless and heavy drinkers who are
supposedly involved in the consumption of illicit products more actively.
The percentage of counterfeit alcohol buyers who consumed and purchased it
deliberately is higher than predicted. Half of counterfeit alcohol consumers (54.1%) did it
more than once during the last 30 days. In addition, only 55.0% of buyers of counterfeit
alcoholic beverages purchased them unknowingly. These figures do not support the previous
research findings [Kharmova 2012] and imply that counterfeit alcohol consumption is
significantly associated with non-deceptive counterfeiting. There is a steady consumer demand
for counterfeit alcohol supported by the system of distribution that makes counterfeit alcohol
available in Russia.
Vodka is subject to counterfeiting more often than other types of alcoholic
beverages. Vodka refers to the second type of alcoholic beverages (after beer) mostly demanded
by alcohol drinkers in Russia. Thus, counterfeiting tends to be concentrated in the market niches
where there is an extensive consumer demand supported by local production capacities and
provision networks.
Most Russians associate counterfeit alcohol with high physical risks. The majority of
respondents (94%) believe that counterfeit alcohol may cause death. However, consumers of
original alcoholic beverages tend to evaluate physical risks higher than counterfeit alcohol
drinkers. This fact indicates that counterfeit alcohol consumption can be associated with
compulsory consumption, implying that consumers tend to justify their hazardous behavior.
Alcohol consumption practices of the respondents who consumed counterfeit alcohol
are significantly different from ones reported by consumers who did not consume
counterfeit alcoholic beverages. Compared to consumers of original, counterfeit alcohol
consumers are strongly associated with hazardous alcohol drinkers and homemade alcohol
drinkers. Hazardous drinkers imply consumers of beer, vodka, fortified wine and samogon who
tend to drink alcohol everywhere before mealtime and without meal from 23 times per week to
every day. They tend to be heavy drinkers and to report problems coming from drinking alcohol.
Meanwhile, consumers of homemade wine and samogon are prone to drink alcohol at home 23
times per week. They tend to be heavy drinkers and to belong to households producing
homemade alcohol.

24
Blur counterfeiting implies the intermediate position between counterfeiting and original
alcohol consumption. Hazardous alcohol drinkers, vodka lovers and light and expensive alcohol
drinkers are associated with blur counterfeiting. Vodka lovers prefer to drink alcohol at home
with meals and do it from 23 times per month to 23 times per week. They tend to report
problems caused by drinking alcohol. The fact that vodka is the most popular target of
counterfeiting causes them to hesitate concerning the originality of the alcohol consumed. As to
light and expensive consumers, they tend to drink beer, wine and champagne, cognac and
whiskey at restaurants and bars from 23 times per month to 23 times per week. They are
unsure whether the alcoholic beverages consumed were counterfeit or original because of
mistrust in the drinking-houses they visited.
Russian consumers tend to associate not only price but also famous brands with
high quality alcoholic beverages and their protection from counterfeiting. Counterfeit
alcohol consumers appear to be more indifferent to the quality of alcoholic beverages expressed
by taste when choosing alcoholic beverages. Moreover, they are less involved in sign
consumption, showing some ignorance of famous brands. As to blur counterfeiting, these
consumers tend to be more price sensitive and less interested in taste as a signal of quality of the
alcoholic beverages consumed. The research findings demonstrate that consumers involved in
the consumption of counterfeit alcohol create a demand for low-quality products. Their
ignorance of trademarks and taste indicates that they are prone to evaluate the quality, giving
attention to other criteria, which are distinct from criteria taken account by consumers of legal
alcohol, and relying on specific social mechanisms, which help them to make risks lower.
Social networks appear to be one of the most important factors affecting counterfeit
alcohol consumption. Social networks can support and reinforce practices of counterfeit alcohol
consumption. The results demonstrate that people who have acquaintances consuming surrogate
alcohol and producing homemade alcohol tend to be more involved in counterfeit consumption.
These findings are consistent with ideas according to which personalized networks play an
extremely important role in illegal markets [Granovetter 1985; Beckert & Wehinger 2012].
Social networks may reduce uncertainty derived from the ignorance to trademarks and serve as
warranties of harmless consumption of low quality alcohol. In addition, the high importance of
social networks supports the idea that consumers of counterfeit alcohol can be studied in terms of
subcultures.
Counterfeit alcohol consumers tend to be localized within lower social classes.
Counterfeit alcohol consumers are less educated, unemployed and poorer compared with
consumers of original alcohol who are likely to be higher educated, employed and well-off,
living in regional centers. This is supported by the fact that counterfeit consumers tend to be
from poorer regions by GDP per capita. As to demographic characteristics, men are more likely
to consume counterfeit alcohol compared to women. Counterfeit alcohol consumers tend to be
younger while hesitating consumers tend to be older. These findings support the assumption that
male and younger consumers are prone to take risks and to break the rules of business ethic.
***
It was revealed that counterfeiting was associated with lower social classes characterized
by lower volumes of economic and cultural capital. It is important to understand that the specific
class culture creates a great demand not only for low-priced goods but also for low quality ones
[Bourdieu 1994]. This is supported by counterfeit alcohol consumers tending to be indifferent to
taste and trademarks as a part of the world of symbols, forms and signs shared by representatives
of higher classes. Additionally, counterfeit alcohol consumers have social networks supporting
their hazardous behavior and serving as safety mechanisms. Moreover, the hazardous behavioral
patterns, including binge drinking and counterfeit alcohol consumption, are the part of the
masculine culture of lower social classes associated with the necessity to prove masculinity.
Russian folklore contains many anecdotes and stories concerning what the real Russian male
character means. Fearlessness and binge drinking are inalienable components. As usually
described, the Russian drinking culture “is characterized by the predominance of liquors on one

25
occasion, a disinclination to consume food when drinking, an initial determination to get heavily
drunk, and the existence of many drinking traditions that have turned alcohol consumption into
an inalienable element of the Russian lifestyle” [Zaigraev 2004: 31].
However, there are some questions without answers. Why counterfeit alcohol consumers
tend to follow hazardous behavioral patterns. Does that result from compulsory consumption
(alcoholism) or a desire to experience adventures (some kind of gambling) [Perez, Castano &
Quintanilla 2010]? How do counterfeit alcohol consumers make the possible physical risks
lower? How do they determine the value of counterfeit alcohol if they tend not to rely on price,
taste and famous brands as traditional market signals?
Finally, the existing literature on counterfeiting has ignored some important issues so far.
Different forms of counterfeiting should be moved to the center of studies. Previous research
mainly focuses on non-deceptive counterfeiting, ignoring deceptive counterfeiting, and blur
counterfeiting. However, the findings demonstrate that factors affecting distinct forms of
counterfeiting are slightly different. Consumers who are not sure about the originality of
consumed alcohol have a lot in common with consumers of counterfeit alcohol. The main
differences of the former group of consumers is that they are inclined to have higher level of
hesitation, to be price sensitive (probably due to lower income), less-educated and older, and to
live in households with five and more members.
References
Albers-Miller N. D. 1999. Consumer Misbehaviour: Why People Buy Illicit Goods. Journal of
Consumer Marketing. 16 (3): 27–28.
Bamossy G., Scammon D. 1985. Product Counterfeiting: Consumers and Manufacturers Beware.
Advances in Consumer Research. 12 (1): 334–340.
Beckert J., Musselin C. (eds.) Constructing Quality: The Classification of Goods in Markets. Oxford:
Oxford University Press.
Beckert J., Wehinger F. 2011. In the Shadow Illegal Markets and Economic Sociology. MPIfG
Discussion Paper 11/9. URL: http://www.mpifg.de/pu/mpifg_dp/dp11-9.pdf (accessed on 2
August 2014).
Bosworth D. 2006. Counterfeiting and Piracy: The. State of the Art. Working Paper, Oxford.
Bourdieu P. 1994. Distinction: A Social Critique of the Judgement of Taste. In: Grusky D. (ed.) Social
Stratification: Class, Race, and Gender in Sociological Perspective. Boulder: Westview Press;
404–429.
Bian X. 2006. An Examination of Factors Influencing the Formation of the Consideration Set and
Consumer Purchase Intention in the Context of Nondeceptive Counterfeiting, University of
Glasgow, Glasgow, unpublished PhD thesis.
Bian X., Moutinho L. 2009. An Investigation of Determinants of Counterfeit Purchase Consideration.
Journal of Business Research. 62: 368–378.
Bloch P.H., Bush R.F., Campbell L. 1993. Consumer “Accomplices” in Product Counterfeiting: A
Demand Side investigation. Journal of Consumer Marketing. 10 (4): 27–36.
Chapa S., Minor M. S., Maldonado C. 2006. Product Category and Original Effects on Consumer
Responses to Counterfeits: Comparing Mexico and the US. Journal of International Consumer
Marketing. 18 (4): 79–99.
Cheung,W.-L., Prendergast G. 2004. Profiling Buyers of Pirated Products in China: The Case of Wuhan.
BRC Working papers, Hong Kong Baptist University.
Chiou J.-S., Huang C., Lee H. 2005. The Antecedents of Music Piracy Attitudes and Intentions. Journal
of Business Ethics. 57: 161–174.
Counting Counterfeits: Defining a Method to Collect, Analyse and Compare Data on Counterfeiting and
Piracy in the Single Market. 2002. Final report for the European Commission Directorate -
General Single Market.

26
Devigne L. 2008. An Urgent Need to Better Respond to the Global Problem of Counterfeiting and
Piracy: The EU Answer. 4th Global Congress: Combating Counterfeiting and Piracy
Dubai, 3 February 2008.
Eisend M., Schuchert-Güler P. 2006. Explaining Counterfeit Purchases: A Review and Preview.
Academy of Marketing Science Review. 12. URL: http://www.amsreview.org/articles/eisend12-
2006.pdf (accessed on 2 August 2014)
Falsified Goods in the Present Russian Market. 2006. Fund of Public Opinion. URL:
http://bd.fom.ru/report/cat/ec_trade/dd064226 (in Russian) (accessed on 2 August 2014)
Gail T., Garibaldi B., Zeng Y., Pilcher J. 1998. Consumer Demand for Counterfeit Goods. Psychology
and Marketing. 15 (5): 405–421.
Granovetter M. 1985. Economic Action and Social Structure: the Problem of Embeddedness. American
Journal of Sociology. 91: 481–493
Grossman G.M., Shapiro C. 1988. Foreign Counterfeiting of Status Goods. The Quarterly Journal of
Economics. 103 (1): 79–100.
Hanzaee K. H., Jalalian S. 2012. Impact of Non-Price Factors on Purchase Intention Counterfeits.
Research Journal of Applied Sciences, Engineering and Technology. 4 (18): 3313 – 3322.
Hirschman E. 1992. The Consciousness of Addiction: Toward a General Theory of Compulsive
Consumption. The Journal of Consumer Research. 19 (2): 155–179.
Hoe L., Hogg G., Hart S. 2003. Fakin’ It: Counterfeiting And Consumer Contradictions. In European
Advances in Consumer Research. 6. Edited by Darach Turley and Stephen Brown. Provo, UT:
Association for Consumer Research; 60–67.
Jennings J. S. 1989. Trademark Counterfeiting: An Unpunished Crime. The Journal of Criminal Law
and Criminology. 80 (3): 805–841.
Key Indicators Characterizing Markets for Alcoholic Beverages in 2011. The Federal Service for
Alcohol Market Regulation. URL: http://fsrar.ru/industry/1261678438828/statisticheskii-
sbornik-osnovnye-pokazateli--harak (in Russian) (accessed on 2 August 2014).
Khramova Ye. 2012. Ambivalence of Consumer Attitudes to Counterfeiting. Economic Sociology. 13
(4): 116–154 (in Russian).
Kotelnikova Z. 2011. Goods with Fake Faces: Why Owners of Trademarks Contribute to
Counterfeiting. In Nawojczyk M. (ed.) Economy in Changing Society. In: Consumption,
Markets, Organizations and Social Policies. Cambridge: Cambridge Publishing; 91-113.
Kratko I. 2013. Results of Retrospective Research Based on National-Level Secondary Data. Final
Report on Examining the Informal Alcohol Market in Russia. Part I. Manuscript. National
Research University Higher School of Economics. Moscow.
Lai K.K., Zaichkowsky J.L. 1999. Brand imitation: Do the Chinese have different views? Asia Pacific
Journal of Management. 16 (2): 179–192.
Lachenmeier D.W., Taylor B. J., Rehm J. 2011. Alcohol under the Radar: Do We Have Policy Options
Regarding Unrecorded Alcohol? International Journal of Drug Policy. 22: 153–160.
Lee S.-H., Yoo B. 2009. A Review of the Determinants of Counterfeiting and Piracy and the Proposition
for Future Research. The Korean Journal of Policy Studies, 24 (1): 1–38.
Martynenko P., Roshchina Ya. 2014. Patterns of Alcohol Consumption as a Social Group Indicator in
Modern Russian Cities. Economic Sociology. 15 (1): 134–152. URL: http://ecsoc.hse.ru/en/2014-
15-1.html (accessed on 2 August 2014).
Nelson Ph. 1970. Information and Consumer Behavior. Journal of Political Economy. 78 (2): 311–329.
Nemtsov A. 2009. Alcohol History of Russia. M.: Knizny dom “LIBROKOM” (in Russian).
OECD. 2007. The Economic Impact of Counterfeiting and Piracy: The Executive Summary.
Olsen K. 2005. Counterfeiting and Piracy: Measurement Issues. Background report for the
WIPO/OECD Expert Meeting on Measurement and Statistical Issues. Geneva, 17–18 October.
Perez M.E., Castano R., Quintanilla C. 2010. Constructing Identity through the Consumption of
Counterfeit Luxury Goods. Qualitative Market Research: An International Journal. 13 (3): 219–
235.

27
Phau I., Prendergast, G., Leung Hing Ch. 2001. Profiling brand-piracy-prone consumers: An exploratory
study in Hong Kong's clothing industry. Journal of Fashion Marketing and Management. 5 (1):
45–55
Radaev V. et al. 2008. Markets for Counterfeit Goods in Russia. Analytics of Laboratory for Studies in
Economic Sociology. 2. Moscow: Higher School of Economics Publishing (in Russian).
Roshchina Y. 2013. Commercial and Noncommercial Alcohol Use in Modern Russia: Factors of
Demand, Consumption Patterns And Consequences. Final Report on Examining the Informal
Alcohol Market in Russia. Part II. Manuscript. National Research University Higher School of
Economics. Moscow, 2013.
Rutter J., Bryce J. 2008. The Consumption of Counterfeit Goods: 'Here be Pirates?. Sociology. 42 (6):
1146-1164
The International Anticounterfeting Coalition. 2008. About Counterfeiting: Get Real – The Truth About
Counterfeiting. URL: http://www.iacc.org/counterfeiting/counterfeiting.php (accessed 25 April
2008).
Wehinger F. 2013. Fake Qualities: Assessing the Value of Counterfeit Goods. In: Beckert J., Musselin
C. (eds.) Constructing Quality: The Classification of Goods in Markets. Oxford: Oxford
University Press; 268–287.
WTO. 2006. Global Status Report on Alcohol and Health. URL:
http://www.who.int/substance_abuse/publications/global_alcohol_report/msbgsruprofiles.pdf
(accessed on 2 August 2014).
Zaigrev G. 2006. The Russian Model of Noncommercial Alcohol Consumption. In: Haworth A.,
Simpson R. (eds.), Moonshine Markets: Issues in Unrecorded Alcohol Beverage Production and
Consumption. New York: Brunner Routledge; 31–40.
Attachments
Table A1. Concepts and measurement for independent variables
Dimension Variable Measurement
Clusters of alcohol consumers
Six clusters classified on the basis of 6
factors generated from 18
dichotomous variables, including
frequency of alcohol consumption;
places where alcohol is consumed;
types of alcoholic beverages
consumed during the last 30 days;
association between alcohol drinking
and meal-time; belonging to a group
of alcohol drinkers who have
problems generated from alcohol
consumption; belonging to households
which produce homemade alcohol
Nominal
1 = vodka-oriented consumers;
2 = light and expensive alcohol
consumers;
3 = eclectic alcohol consumers;
4 = occasional alcohol drinkers;
5 = hazardous drinkers;
6 = homemade alcohol
consumers)
Criteria taken account by consumers when selecting
alcoholic beverages
Affordable
price
Evaluate how important is affordable
price for you when selecting alcoholic
beverages?
Continuous (1 = not important at
all, 2… 4 , 5 = very important)
Taste Evaluate how important is affordable
price for you when selecting alcoholic
beverages?
Continuous (1 = not important at
all, 2… 4 , 5 = very important)
Famous brand Evaluate how important is famous
brand for you when selecting alcoholic
Continuous (1 = not important at
all, 2… 4 , 5 = very important)

28
beverages?
Social environment
Producers of
homemade alcohol
Do any of your neighbors,
acquaintances or relatives make home-
produced alcoholic beverages?
Dichotomous (1 = yes, 0 = no)
Consumers of
alcohol surrogates
Do any of your neighbors,
acquaintances or relatives consume
surrogate alcohol?
Dichotomous (1 = yes, 0 = no)
Demographic and social characteristics
Social class Individual social class position
constructed with help of ESOMAR
methodology and techniques13
. It
reflects individual social status
generated from occupied positions at
three social dimensions, including
completed education level,
occupational status and household
well-being.
Categorical (1 = upper-upper
class; 2 = lower upper class; 3 =
upper middle class; 4 = lower
middle class; 5 = upper lower
class; 6 = lower-lower class)
Gender Gender Nominal (1 = man, 0 = woman)
Age Number of years computed as 2012
minus a given year of birth
Continuous
Number of
household members
Number of household members Categorical (1 = one, 2 = from
two to four, 3 = more than five)
Type of residence Town type and size Categorical (1 = Central city of a
given region, 2 = city or town, 3
= township, 4 = rural area)
Control variables
Gross regional
product per capita in
a given region
Natural log of gross regional product
per capita in a given region Continuous
Individual level of
hesitation
A total number of “Difficult to
answer” chosen by a given respondent
during the survey (except questions
related to alcohol consumption)
Continuous
Table A2. Factor loadings computed with help of the method of main components with Varimax
rotation (n = 8,779)
Variables 1 2 3 4 5 6
Frequency of alcohol consumption 0.406 0.174 0.350 0.246 0.055 0.413
Consumers reporting that they have problems
generated from alcohol consumption
0.165 -
0.007 0.569 0.226 -
0.065
-
0.008
Place of alcohol consumption
At home 0.010 -.081 0.009 0.013 0.044 0.842
Restaurants and bars 0.169 0.698
-
0.116
-
0.181
-
0.018 0.059
Public places (parks, streets, etc.) 0.376 0.163 0.415 0.047
-
0.030
-
0.220
At work 0.007 0.378 0.275
-
0.021
-
0.026
-
0.072
Visiting friends -.027 0.623 0.129 0.130 - -
13 URL: http://www.esomar.org/ (accessed on 2 August 2014).

29
0.025 0.187
Meal-time and alcohol drinking
Before meal-time 0.468 0.097 0.343 0.010
-
0.019 0.167
While having meals -
0.658 0.296 0.114 0.133
-
0.021 0.266
Without meal 0.779 0.040 0.212
-
0.011
-
0.012
-
0.021
Alcoholic beverages consumed
Beer 0.616 0.102
-
0.131 0.168
-
0.119 0.309
Homemade wine -
0.043 0.021
-
0.010
-
0.034 0.781 0.000
Fortified wine -
0.215
-
0.098 0.410
-
0.513
-
0.227 0.130
Samogon -
0.004
-
0.098 0.573
-
0.016 0.183 0.069
Vodka -
0.170 0.015 0.215 0.782
-
0.134 0.023
Cognac, whiskey -
0.025 0.470
-
0.207
-
0.060 0.041 0.162
Wine, champagne, light alcohol
cocktails
-
0.148 0.328
-
0.084
-
0.534 0.010
-
0.135
Households producing homemade alcohol -
0.028
-
0.038 0.078
-
0.009 0.774 0.047
Table A2. Main parameters of the sample (%)
Main survey (n=18,462)
Gender
Male 42.0
Female 58.0
Age
1519 6.5
2029 19.5
3039 18.9
4049 15.4
5064 23.8
65+ 15.9
Education
Primary and uncompleted secondary 25.0
Secondary and technical education 27.6
Secondary special and professional education 23.4
Higher education 24.0
Employment
Employed 54.3
Unemployed 45.6
Marital status
Single 17.7
Married (live together) 62.0

30
Divorced (live separately) 8.7
Widowed 11.6
Social class
Upper-upper 5.4
Lower upper 14.1
Upper middle 14.5
Lower middle 14.8
Upper lower 23.5
Lower-lower 27.7
Type of residence
Regional center 42.9
City 25.6
Township 6.6
Rural area 24.9
Regions of Russia
North-West 9.3
Central 28.2
South 10.5
Povolzhie 22.2
Ural 6.3
Siberia 13.4
Far-East 4.3
North-Caucasian 5.8

31
Table 7. Regression coefficients. Dependent variable - Have you consumed alcoholic beverages during the last 30 days which, in your opinion, were counterfeit?
Reference – Original alcohol
consumers
Model 2 Model 3
Counterfeiting Blur counterfeiting Non-consumers Counterfeiting Blur counterfeiting
D SE Exp(B) D SE Exp(B) D SE Exp(B) D SE Exp(B) D SE Exp(B)
Clusters (base – homemade
alcohol consumers)
Vodka lovers -.674** .248 .510 1.403** .467 4.066
Light and expensive alcohol
consumers
-1.302*** .256 .272 .957* .469 2.603
Eclectic alcohol consumers -1.013** .307 .363 .921 .495 2.512
Occasional alcohol drinkers -1.375****
.296 .253 .856 .484 2.353
Hazardous drinkers .191 .255 1.211 1.912*** .473 6.764
Affordable price .231 .219 1.260 1.183*** .218 3.264 -.554*** .095 .575 -.059 .224 .943 .995*** .223 2.706
Likes the taste -1.199***
.235 .302 -.759** .225 .468 -.298** .125 .743 -.871*** .248 .418 -.552* .237 .576
Famous brand -.797*** .205 .451 -.357* .182 .700 -.052 .098 .950 -.670** .211 .512 -.283 .186 .754
Any of your neighbors,
acquaintances or relatives make
home-produced alcoholic
beverages (base – yes)
-.475*** .121 .622 -.339** .111 .712 .291*** .067 1.337 -.315** .131 .730 -.368** .118 .692
Any of your neighbors,
acquaintances or relatives
consume alcohol surrogates (base
– yes)
-.784*** .117 .457 -.505*** .108 .604 .151* .071 1.163 -.666*** .123 .514 -.392*** .113 .676
Gender (base – female)
Male .588*** .110 1.800 .121 .092 1.129 -.762*** .049 .467 .322** .116 1.380 -.053 .098 .949
Age -.008* .003 .992 .005 .003 1.005 .009*** .001 1.009 -.013*** .004 .987 .003 .003 1.003
Number of household members
(base – more than 5)
One .227 .226 1.255 -.352 .207 .704 -.078 .097 .925 .287 .231 1.332 -.311 .209 .733
From 2 to 4 -.042 .135 .959 -.334** .108 .716 -.366*** .059 .693 -.074 .141 .929 -.414*** .111 .661

32
Continuation. Table 7. Regression coefficients. Dependent variable - Have you consumed alcoholic beverages during the last 30 days which, in your opinion, were counterfeit?
Model 1
Reference – Original alcohol consumers Counterfeiting Blur counterfeiting Non-consumers
D SE Exp(B) D SE Exp(B) D SE Exp(B)
Clusters (base – homemade alcohol drinkers)
Vodka lovers
Light and expensive alcohol consumers
Eclectic alcohol consumers
Occasional alcohol drinkers
Hazardous drinkers
Affordable price
Likes the taste
Famous brand
Type of residence (base – rural
area)
Regional center -.100 .140 .904 -.737*** .123 .478 -.222** .064 .801 -.040 .145 .960 -.654*** .125 .520
City .132 .135 1.142 -.215 .115 .806 -.095 .066 .910 .169 .141 1.185 -.205 .119 .815
Township -.648* .294 .523 -.383 .202 .682 .016 .103 1.016 -.966** .320 .381 -.395 .206 .674
Social class (base - lower-lower)
Upper-upper -.989** .313 .372 -1.052***
.265 .349 -.469*** .107 .626 -.845** .318 .429 -.912** .268 .402
Lower upper -.777*** .205 .460 -.545*** .155 .580 -.361*** .077 .697 -.610** .210 .543 -.400* .158 .670
Upper middle -.265 .168 .767 -.288* .140 .750 -.266*** .076 .767 -.126 .173 .882 -.198 .144 .820
Lower middle -.132 .154 .876 -.621*** .147 .537 -.295*** .076 .744 -.019 .160 .981 -.547*** .150 .579
Upper lower -.176 .136 .839 -.406** .121 .666 -.147* .068 .863 -.101 .143 .904 -.371** .125 .690
Control variables
Ln (Gross regional product per
capita)
-.250* .123 .778 .301** .102 1.351 -.303*** .052 .739 -.248* .125 .780 .205 .106 1.227
Level of hesitation -.024 .020 .977 .120*** .013 1.127 .017 .009 1.017 -.034 .022 .967 .124*** .014 1.132
Constanta 3.187* 1.533 -5.138***
1.290 2.951*** .653 3.894* 1.560 -5.144***
1.387
Nagelkerke's R2 0.120 0.143
Sign 0.000 0.000
N 10,591 7,532

33
Any of your neighbors, acquaintances or relatives make home-produced alcoholic
beverages (base – yes)
-.914*** .113 .401 -.539*** .103 .583 .243*** .054 1.275
Any of your neighbors, acquaintances or relatives consume alcohol surrogates (base – yes) -.476*** .118 .621 -.409*** .104 .665 .390*** .051 1.477
Gender (base – female)
Male .614*** .108 1.848 .168 .087 1.183 -.731*** .036 .482
Age -.004 .003 .996 .008** .002 1.008 .009*** .001 1.009
Number of household members (base – more than 5)
One .187 .224 1.205 -.462* .194 .630 -.135 .074 .874
From 2 to 4 -.074 .132 .928 -.437*** .103 .646 -.427*** .044 .652
Type of residence (base – rural area)
Regional center -.154 .137 .858 -.800*** .119 .449 -.388*** .048 .678
City .078 .132 1.082 -.199 .110 .820 -.255*** .050 .775
Township -.698* .290 .498 -.454* .198 .635 -.062 .077 .940
Social class (base - lower-lower)
Upper-upper -1.158*** .310 .314 -1.212*** .256 .298 -.788*** .081 .455
Lower upper -.919*** .198 .399 -.690*** .148 .502 -.716*** .058 .488
Upper middle -.412* .164 .662 -.395** .134 .674 -.515*** .057 .597
Lower middle -.237 .151 .789 -.661*** .140 .516 -.500*** .056 .607
Upper lower -.254 .133 .776 -.434*** .115 .648 -.245*** .050 .783
Control variables
Ln (Gross regional product per capita) -.304* .118 .738 .287** .096 1.332 -.144** .038 .866
Level of hesitation -.011 .019 .989 .112*** .012 1.119 -.001 .007 .999
Constanta 2.474 1.460 -4.784*** 1.190 2.272*** .468
Nagelkerke's R2 0.125
Sign 0.000
N 15,981

34
Zoya Kotelnikova
Associate Professor, Department of Economic Sociology, National Research University Higher
School of Economics [email protected]
Any opinions or claims contained in this Working Paper do not necessarily
reflect the views of HSE.
© Kotelnikova, 2014