construction and use of api single- quadrupole ms spectral...
TRANSCRIPT

Paul ZavitsanosProduct Marketing Manager September 11, 2003
Construction and Use of API Single-Quadrupole MS Spectral Libraries.
Time: 11:00 a.m. EDTTelephone Number: 888-840-7687International Number: 703-871-3885Chairperson: Rita Willis
Slide 4For audio, dial 888-840-7687 or International 01-703-871-3885Chairperson: Rita Willis
Acknowledgements and Partners
Dr. Robert Voyksner and Ms. Jennifer Townsend LC/MS Limited
Mme Isabelle Vecchioli CARSO France
AccuStandard Inc.
Dr. Stuart Huckin Riverview Hospital, Vancouver, British Colombia, Canada
Mme. Isabelle Chanel, M. Jean Paul Chauve, Mr. Monty Benefiel, Dr. Jerry Zweigenbaum, Dr. Chin-Kai Meng.
Agilent Technologies Worldwide

Slide 5For audio, dial 888-840-7687 or International 01-703-871-3885Chairperson: Rita Willis
I graduated from Concordia University in 1979 with a B.Sc. Specialization in Chemistry. In the past twenty-five years, I have worked for the chemical industry in positions from bench technician to senior method development scientist tobioanalytical lab director in both the USA and Canada. In the instrument industry, I have served as a technical salesperson for both Waters and for HP/Agilent, as well as a technical specialist for HPLC and LC/MS/MS for HP/Agilent. I have extensive hands-on and training expertise in HPLC, GC, GC/MS, LC/MS, and LC/MS/MS with both trap and linearquadrupole instruments. Presently, I am working at Agilent’sLittle Falls Site in Wilmington, Delaware and am responsible for the development and implementation of LC/MS and LC/MS/MS marketing strategies in the Chemical Analysis markets.
Slide 6For audio, dial 888-840-7687 or International 01-703-871-3885Chairperson: Rita Willis
Introduction•Reliable API libraries are possible and useful but there are distinct performance differences when compared to traditional EI GC/MS libraries.
•API is not as universal an ionization mode as is EI.
•Ionization efficiency, and as a consequence, are variable even within a compound class.
•API with up-front Collision Induced Dissociation has more variable ion ratios does than EI.
API and EI are COMPLIMENTARY Techniques•EI generally trades-off the presence of a molecular ion for a complex spectrum that is highly specific to the compound.
•API supplies excellent molecular ion information but has limited fragment information and hence less specificity in the spectrum. The CID fragmentation process is instrument dependent and not as reproducible as fragmentation that is a consequence of EI.
•Large universal libraries are more likely with EI. API at the present time lends itself more to smaller dedicated targeted libraries specific to narrow applications and most likely associated with specific chromatographic mobile phase chemistries.
Slide 7For audio, dial 888-840-7687 or International 01-703-871-3885Chairperson: Rita Willis
Introduction…cont’dAgilent, in conjunction with our partners in the API Libraries Project, has established a set of procedures that makes the best (to date) of the limitations inherent to API and CID with respect to API libraries.
By following these procedures, any Agilent 1100 LC/MSD SL can produce API libraries that will give good results on searches for unknowns.
At this point the best results are with small libraries (ca. 1000 compounds). Our experience indicates that CID libraries based on ESI can be dependent on the Mobile Phase system, specifically the buffers and modifiers employed, because the formation of specific adducts is often mobile phase related.
At this time, we suggest that ESI libraries be kept specific to a given mobile phase. We will detail the use and development of a POSITIVE IONESI/AMMONIUM ACETATE-ACETONITRILE MOBILE PHASE library for PESTICIDES in the last half of this presentation. The NIST PESTICIDES database can be downloaded from the Agilent CAS web-site free of charge. Updates will occur about every 6 weeks.
We at Agilent sincerely hope that these efforts will provide some assistance to many of your questions about MS spectral library construction in API.

Slide 8For audio, dial 888-840-7687 or International 01-703-871-3885Chairperson: Rita Willis
PRINCIPLES

Slide 9For audio, dial 888-840-7687 or International 01-703-871-3885Chairperson: Rita Willis
Guiding Principles in the Agilent Approach to API Single Quadrupole MS
Spectral LibrariesMultiple Collisional Energy Approach
The Agilent approach in the construction of single quadrupole API MS spectral libraries is based on the fact that the MS spectra change as a function of increasing collision energy. The following slides illustrate this first principle.
At low energy the protonated molecular ion and other adduct ions (first order ions) are typically the dominant ions in the spectrum. At higher ion energies fragmentation of the protonated molecular ion and other adducts occurs, adding the product ions (second order ions) to the spectrum. The product ions themselves can also be fragmented(third and higher order ions). Eventually, at a sufficiently high voltage, the spectrum is typically populated by simple ions.
The Agilent approach holds that an API single quadrupole MS spectral library should not be based solely on a single spectrum but on a group of spectra that define the progression of the spectrum from low to high energy. The Agilent approach holds that there is definitive information in these spectral changes. The approach uses four (4) different ion energies defined by the “fragmentor voltage” spaced through a “minimum” and “maximum” setting for the compounds expected in the library. These four ion energies define the four “fragmentation endpoints”. A complete library is defined by four individual libraries, one for each endpoint.

Slide 10For audio, dial 888-840-7687 or International 01-703-871-3885Chairperson: Rita Willis
2 Performance (Fragmentation) Based Tune
Guiding Principles in the Agilent Approach to API Single Quadrupole MS Spectral Libraries
API spectra were believed to be inconsistent between the instruments of different suppliers and even between different units of the same model. With traditional tuning procedures, spectra taken at the same settings on different instruments produced different spectra. Performance (Fragmentation) based tuning can normalize the variability between units of the same instrument model and possibly between different models. It is not known if it can normalize the differences in instruments from different manufacturers. Performance (fragmentation) based tuning holds that one does not rely on a voltage value to set the ion energy. Instead performance based tune relies on tuning to a fixed performance variable, fragmentation in this case, using predefined chemical compounds.
The library is acquired at four fragmentation endpoints. The chemical standards have well defined spectra at these endpoints and specific ion ratios are defined for each fragmentation endpoint. The Agilent approach involves the use of one compound per fragmentation endpoint. When a quadrupole is tuned to give the ideal ion ratios at each endpoint, the resultant spectra will match the library. As tuning is based on specific ion ratios the actual fragmentation voltages for each endpoint may be different than those used to acquire the library.

Slide 11For audio, dial 888-840-7687 or International 01-703-871-3885Chairperson: Rita Willis
ION BREAKDOWN PROFILES

Slide 12For audio, dial 888-840-7687 or International 01-703-871-3885Chairperson: Rita Willis
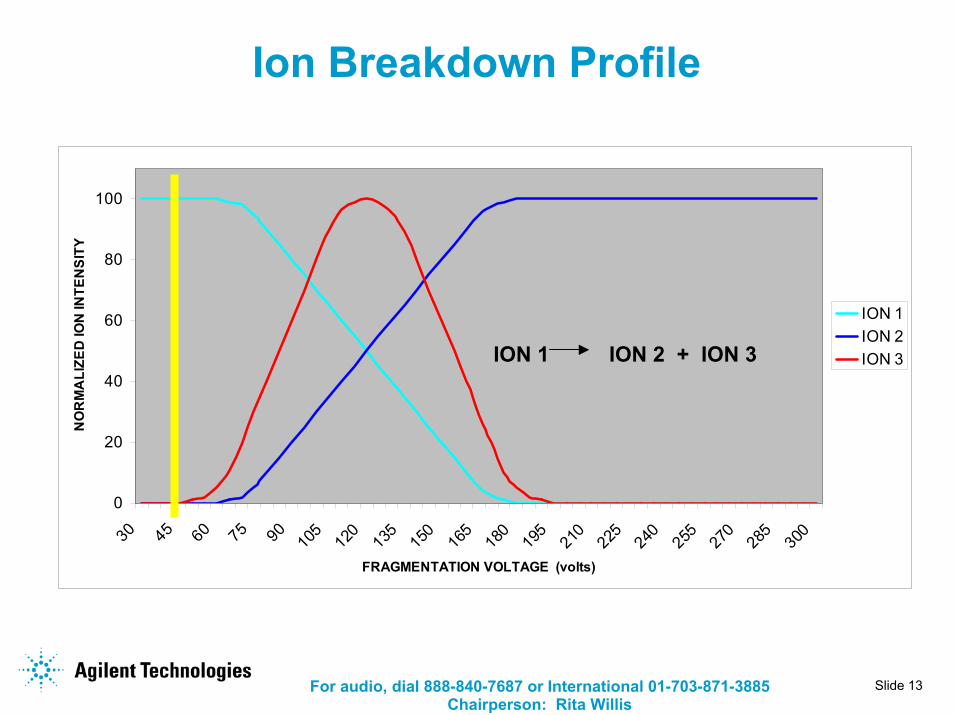
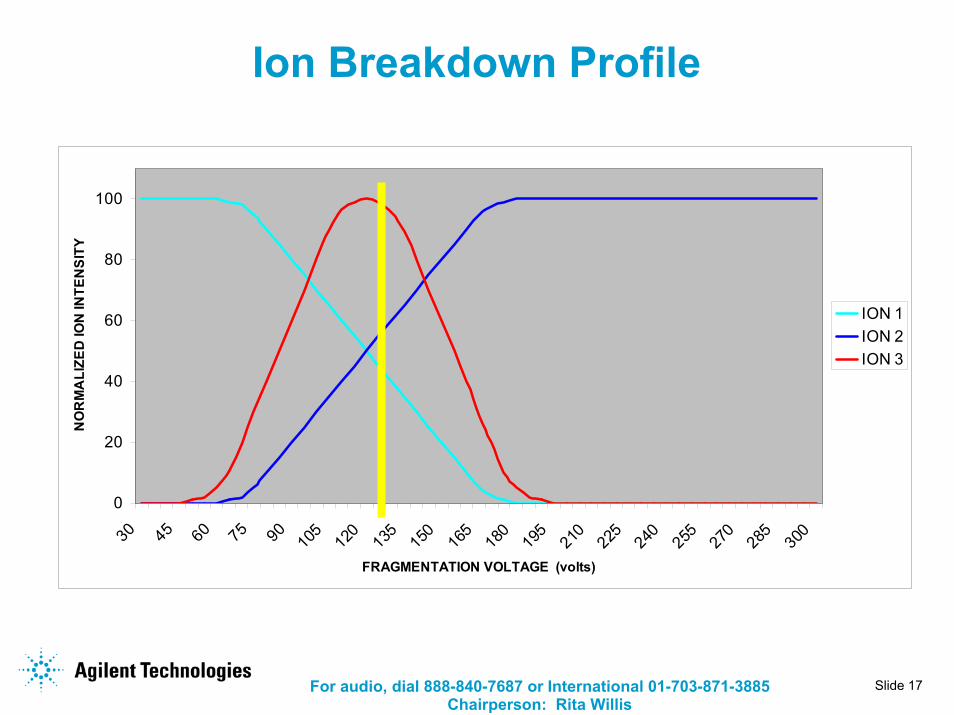
Ion Breakdown Profile
The following slides show the change in the appearance of the spectrum from low energy to higher energies.
As one moves from left to right along the X-axis, the ion breakdown profile shows the ions that will begin to appear and fragmentation voltage at which they begin to appear. Ideally, at the very left only the protonated molecular ion is expected (ION 1). As more energy is applied to this ion by an increase in the fragmentation voltage, the parent ion “breaks down” into product ions (ION 3 and ION 2). These product ions are specific fragments of the parent ion. As even more energy is applied to the ions, some product ion species will themselves be fragmented. As a consequence some product ions areapparent only over a narrow range of fragmentation voltages (ION 3).
At the highest voltages available on the instrument, the ions produced are typically simple, low m/z ions that offer little qualitativeinformation.
Slide 13For audio, dial 888-840-7687 or International 01-703-871-3885Chairperson: Rita Willis
Ion Breakdown Profile
0
20
40
60
80
100
30 45 60 75 90 105
120
135
150
165
180
195
210
225
240
255
270
285
300
FRAGMENTATION VOLTAGE (volts)
NO
RM
ALI
ZED
ION
INTE
NS
ITY
ION 1ION 2ION 3ION 1 ION 2 + ION 3

Slide 14For audio, dial 888-840-7687 or International 01-703-871-3885Chairperson: Rita Willis
Mass Spectrum at 45 Volts Fragmentation Voltage
MASS SPECTRUM AT 45 VOLTS FRAGMENTATION VOLTAGE
0
20
40
60
80
100
120
10 22 34 46 58 70 82 94 106
118
130
141
150
162
174
186
198
210
222
234
246
258
270
281
290
302
314
326
338
350
362
374
383
394
m/z
NO
RM
ALI
ZED
ION
AB
UN
DA
NC
E
45 VOLTS
ION 1

Slide 15For audio, dial 888-840-7687 or International 01-703-871-3885Chairperson: Rita Willis
Ion Breakdown Profile
0
20
40
60
80
100
30 45 60 75 90 105
120
135
150
165
180
195
210
225
240
255
270
285
300
FRAGMENTATION VOLTAGE (volts)
NO
RM
ALI
ZED
ION
INTE
NS
ITY
ION 1ION 2ION 3
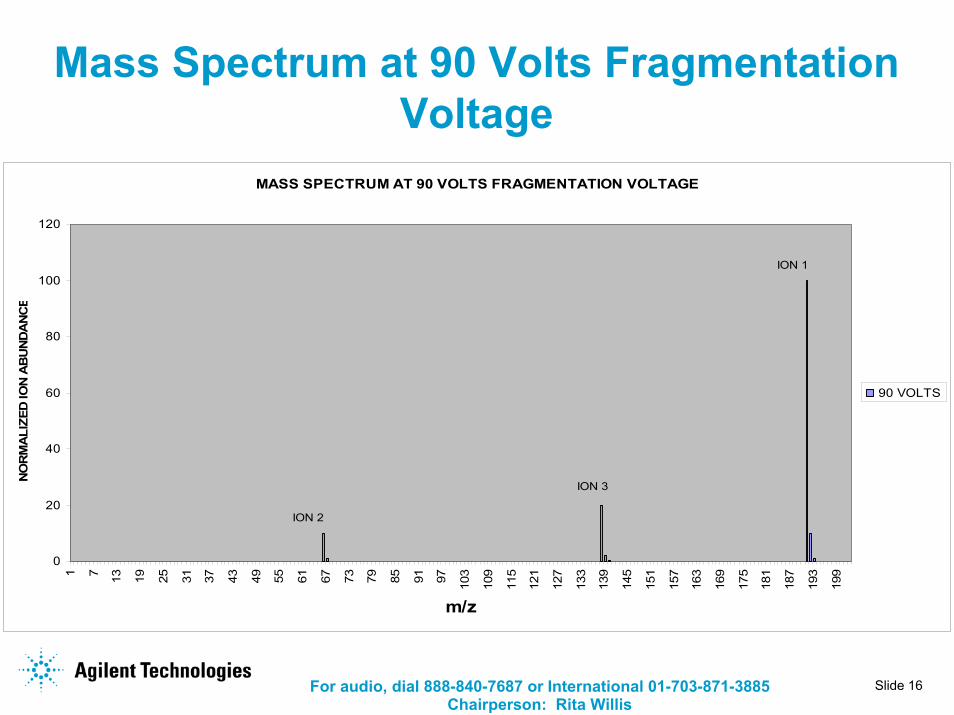
Slide 16For audio, dial 888-840-7687 or International 01-703-871-3885Chairperson: Rita Willis
Mass Spectrum at 90 Volts Fragmentation Voltage
MASS SPECTRUM AT 90 VOLTS FRAGMENTATION VOLTAGE
0
20
40
60
80
100
120
1 7 13 19 25 31 37 43 49 55 61 67 73 79 85 91 97 103
109
115
121
127
133
139
145
151
157
163
169
175
181
187
193
199
m/z
NO
RM
ALI
ZED
ION
AB
UN
DA
NC
E
90 VOLTS
ION 1
ION 2
ION 3
Slide 17For audio, dial 888-840-7687 or International 01-703-871-3885Chairperson: Rita Willis
Ion Breakdown Profile
0
20
40
60
80
100
30 45 60 75 90 105
120
135
150
165
180
195
210
225
240
255
270
285
300
FRAGMENTATION VOLTAGE (volts)
NO
RM
ALI
ZED
ION
INTE
NS
ITY
ION 1ION 2ION 3

Slide 18For audio, dial 888-840-7687 or International 01-703-871-3885Chairperson: Rita Willis
Mass Spectrum at 130 Volts Fragmentation Voltage
MASS SPECTRUM AT 130 VOLTS FRAGMENTATION VOLTAGE
0
20
40
60
80
100
120
1 7 13 19 25 31 37 43 49 55 61 67 73 79 85 91 97 103
109
115
121
127
133
139
145
151
157
163
169
175
181
187
193
199
m/z
NO
RM
ALI
ZED
ION
AB
UN
DA
NC
130 VOLTS
ION 1
ION 3
ION 2

Slide 19For audio, dial 888-840-7687 or International 01-703-871-3885Chairperson: Rita Willis
Ion Breakdown Profile
0
20
40
60
80
100
30 45 60 75 90 105
120
135
150
165
180
195
210
225
240
255
270
285
300
FRAGMENTATION VOLTAGE (volts)
NO
RM
ALI
ZED
ION
INTE
NS
ITY
ION 1ION 2ION 3
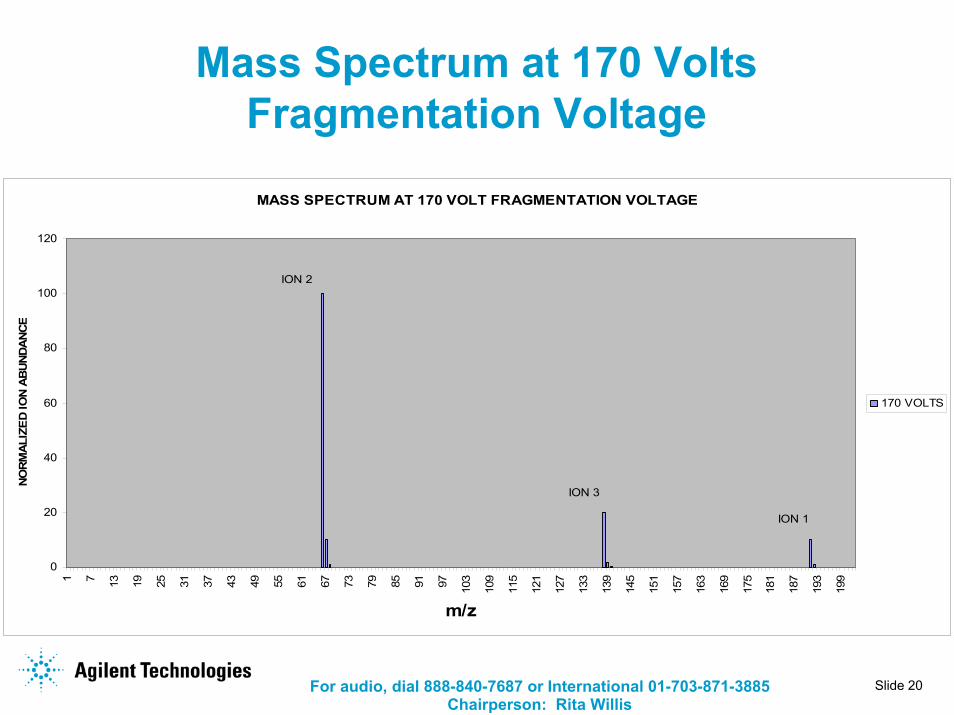
Slide 20For audio, dial 888-840-7687 or International 01-703-871-3885Chairperson: Rita Willis
Mass Spectrum at 170 Volts Fragmentation Voltage
MASS SPECTRUM AT 170 VOLT FRAGMENTATION VOLTAGE
0
20
40
60
80
100
120
1 7 13 19 25 31 37 43 49 55 61 67 73 79 85 91 97 103
109
115
121
127
133
139
145
151
157
163
169
175
181
187
193
199
m/z
NORM
ALIZ
ED
ION
ABUN
DANC
E
170 VOLTS
ION 1
ION 3
ION 2

Slide 21For audio, dial 888-840-7687 or International 01-703-871-3885Chairperson: Rita Willis
Ion Breakdown Profile
0
20
40
60
80
100
30 45 60 75 90 105
120
135
150
165
180
195
210
225
240
255
270
285
300
FRAGMENTATION VOLTAGE (volts)
NO
RM
ALI
ZED
ION
INTE
NS
ITY
ION 1ION 2ION 3

Slide 22For audio, dial 888-840-7687 or International 01-703-871-3885Chairperson: Rita Willis
Mass Spectrum at 220 Volts Fragmentation Voltage
MASS SPECTRUM AT 220 VOLTS FRAGMENTATION VOLTAGE
0
20
40
60
80
100
120
1 7 13 19 25 31 37 43 49 55 61 67 73 79 85 91 97 103
109
115
121
127
133
139
145
151
157
163
169
175
181
187
193
199
m/z
NORM
ALIZ
ED IO
N AB
UNDA
NCE
220 VOLTS
ION 2

Slide 23For audio, dial 888-840-7687 or International 01-703-871-3885Chairperson: Rita Willis
Library Construction-Getting Started
Slide 24For audio, dial 888-840-7687 or International 01-703-871-3885Chairperson: Rita Willis
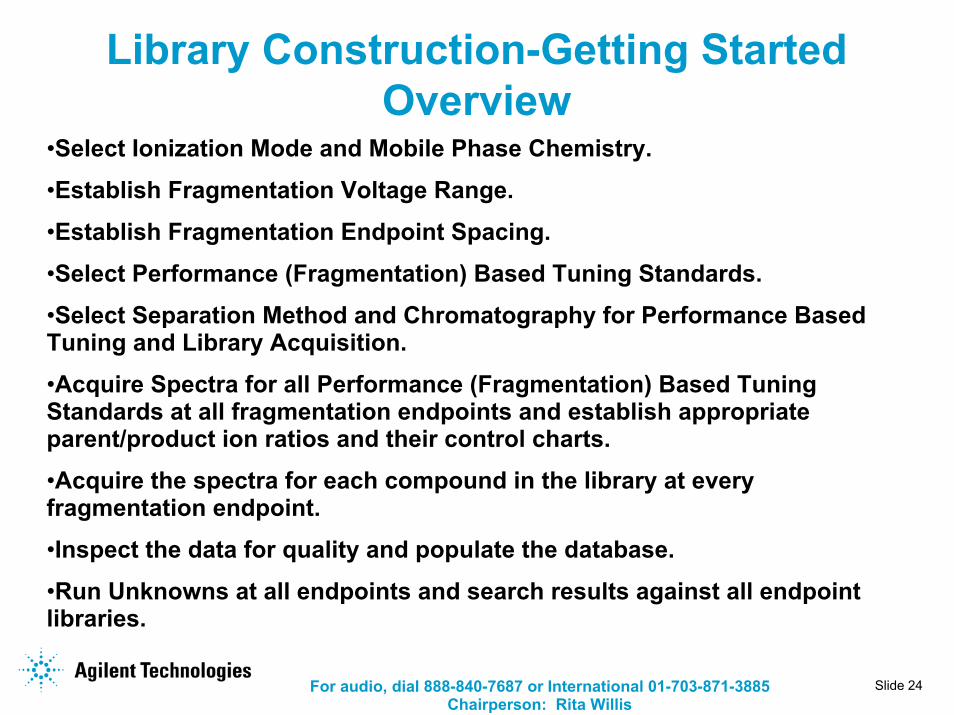
Library Construction-Getting StartedOverview
•Select Ionization Mode and Mobile Phase Chemistry.
•Establish Fragmentation Voltage Range.
•Establish Fragmentation Endpoint Spacing.
•Select Performance (Fragmentation) Based Tuning Standards.
•Select Separation Method and Chromatography for Performance Based Tuning and Library Acquisition.
•Acquire Spectra for all Performance (Fragmentation) Based TuningStandards at all fragmentation endpoints and establish appropriate parent/product ion ratios and their control charts.
•Acquire the spectra for each compound in the library at every fragmentation endpoint.
•Inspect the data for quality and populate the database.
•Run Unknowns at all endpoints and search results against all endpoint libraries.
Slide 25For audio, dial 888-840-7687 or International 01-703-871-3885Chairperson: Rita Willis
Selecting the Ionization Mode and Mobile Phase Chemistry
Both ESI and APCI produce artifacts that will complicate the effective use of spectral libraries. Artifact formation is mediated by both mobile phase and source conditions.
ESIESI is complicated by the formation of adducts. Mobile phase composition will strongly affect the types of adducts formed and the extent of their formation. ESI Library reference spectra that have been acquired under adduct free conditions will not match spectra of the same compound acquired under conditions that display extensive adduct formation.
In addition some adducts do not show the same breakdown profiles as the protonated molecular ion does. Consequently all spectra across the entire fragmentation voltage range are affected, not simply the low energy spectra.
For these reasons, ESI based libraries should be specific to a given chemistry as well as compound class for best match performance.

Slide 26For audio, dial 888-840-7687 or International 01-703-871-3885Chairperson: Rita Willis
Selecting the Ionization Mode and Mobile Phase Chemistry…cont’d
APCI
APCI does not suffer from adduct formation as extensively as does ESI. APCI however does display ions that originate from thermal decomposition. Such ions can be variable in their relative intensities and are just as destructive to library matches as are ESI adduct formations. Moreover the sensitivity to thermal decomposition is more dependent on source cleanliness and maintenance than is ESI.
On balance however the occurrence of thermal decomposition in APCI is much less frequent than adduct formation in ESI. If the compound classes under study do not undergo thermal decomposition them APCI, especially positive ion APCI, will offer exceptional reliability with this approach.

Slide 27For audio, dial 888-840-7687 or International 01-703-871-3885Chairperson: Rita Willis
Selecting the Ionization Mode and Mobile Phase Chemistry…cont’dRecommended Mobile Phase Systems--ESI
•10mM Ammonium Formate in H2O versus Acetonitrile
This mobile phase is useful in both positive and negative ion work for compounds that are moderate to strong bases or acids. Can enhance Ammonium and sodium ion adduct formation.
•0.1% Formic Acid in H2O versus 0.1% Formic Acid in AcetonitrileThis mobile phase is useful in positive ion work for compound classes that are weak to strong solution-phase bases. If the compounds in the class can form HCl salts, this mobile phase will like be satisfactory in positive ion mode.
•0.05% TFA in H2O versus 0.05% TFA in AcetonitrileThis mobile phase is useful in positive ion work for compound classes that are very weak bases. TFA can cause Ion Suppression and difficulty due to ion persistence in negative ion mode.

Slide 28For audio, dial 888-840-7687 or International 01-703-871-3885Chairperson: Rita Willis
Selecting the Ionization Mode and Mobile Phase Chemistry…cont’d
Recommended Mobile Phase Systems--APCI
•10mM Ammonium Formate in H2O versus Methanol
May enhance the formation of Ammonium adducts in positive ion and may generate Formate adducts in negative ion.
•H2O versus Methanol
Simple, clean and general mobile phase for non-polar compounds such as steroids. Useful in positive ion.

Slide 29For audio, dial 888-840-7687 or International 01-703-871-3885Chairperson: Rita Willis
Fragmentation Voltage Range
The fragmentation range must be decided. The more diverse the library the wider the range will most likely be.
MINIMUM FRAGMENTATION ENDPOINT
The minimum fragmentation voltage is that which will give a protonated molecular ion with little fragmentation, for the most fragile of the expected compounds.
MAXIMUM FRAGMENTATION ENDPOINT
The maximum fragmentation voltage is that which will give an informative spectrum with the most difficult to fragment compound expected, but which will still allow 20-30% of the molecular ion to be measured.

Slide 30For audio, dial 888-840-7687 or International 01-703-871-3885Chairperson: Rita Willis
Fragmentation Endpoint SpacingThe Agilent 1100 LCMSD SL can acquire spectra at up to 4 different fragmentation voltages simultaneously.
The Agilent approach uses four equally spaced fragmentation endpoints over the fragmentation range. The following endpoint were found to be useful for the indicted compound classes using Ammonum Acetate buffers in Positive Ion Mode. Pesticides as a class seem to be more fragile under these conditions than does the drug class. As such the pesticide library is acquired with a shorter voltage range and with shorter endpoint spacing than is the drug library.
PESTICIDES
60V Level LOW1; 120V Level LOW2; 180V Level MID; 240V Level HIGH
DRUGS
75V Level LOW1; 150V Level LOW2; 225V Level MID; 300V Level HIGH

Slide 31For audio, dial 888-840-7687 or International 01-703-871-3885Chairperson: Rita Willis
Selecting Tuning Compounds for the Performance (Fragmentation) Based Tuning
Procedure
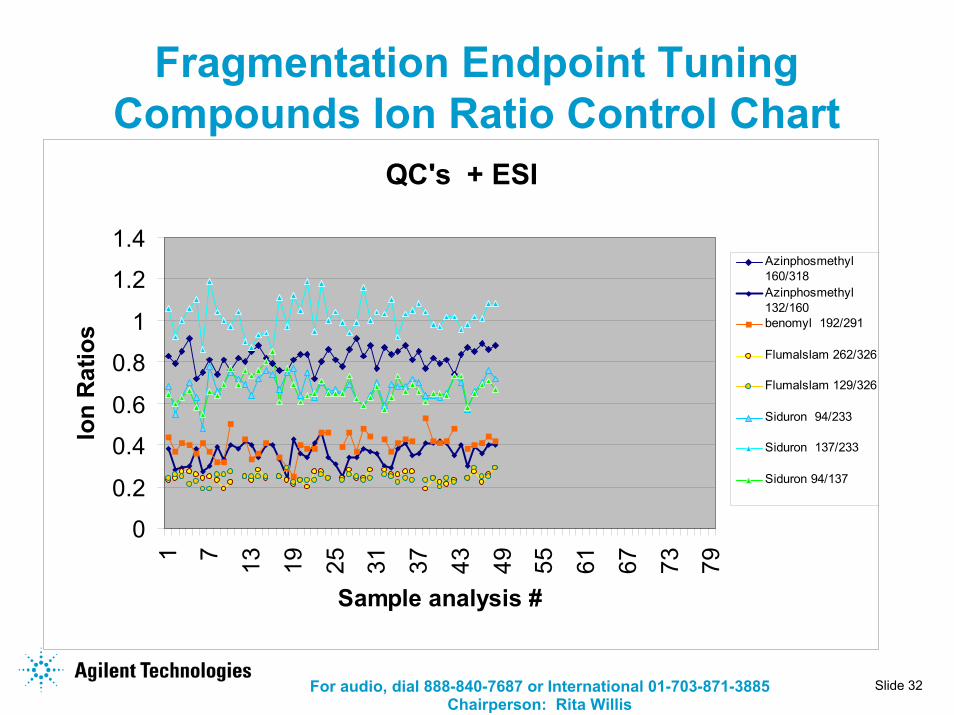
Each fragmentation endpoint will be represented by a library acquired at that endpoint voltage. Each fragmentation endpoint is represented by a tuning standard that gives an informative spectrum with reproducible parent/product ion ratios at that specific fragmentation voltage. A control chart for these ratios is maintained. As long as the ion ratios for each of the four performance based tuning are within limits, acquired spectra from “unknowns” at all four endpoints will match those in the respective libraries for the same compound.
An example of such a control chart is shown in the following slide.
Slide 32For audio, dial 888-840-7687 or International 01-703-871-3885Chairperson: Rita Willis
Fragmentation Endpoint Tuning Compounds Ion Ratio Control Chart
QC's + ESI
0
0.2
0.4
0.6
0.8
1
1.2
1.4
1 7 13 19 25 31 37 43 49 55 61 67 73 79
Sample analysis #
Ion
Rat
ios
Azinphosmethyl 160/318Azinphosmethyl 132/160benomyl 192/291
Flumalslam 262/326
Flumalslam 129/326
Siduron 94/233
Siduron 137/233
Siduron 94/137
Slide 33For audio, dial 888-840-7687 or International 01-703-871-3885Chairperson: Rita Willis
Selecting Tuning Compounds for the Performance (Fragmentation) Based Tuning
Procedure..cont’dTuning compounds could be a compound in the library or it may besomething completely removed from the compound classes in the library. As long as the following characteristics are present…at the fragmentation endpoint voltage for which the compound is selected….. the fragmentation tuning compound will serve well.
At the fragmentation endpoint…….
•The spectrum must display the parent ion and at least one product ion
•A change in the fragmentation voltage should produce a significant change in the spectrum. An example of this magnitude of the expected change is shown in the following slide.By following the procedures in these slides, it is possible to specify and locate fragmentation performance both one the instrument that generated the library and on other instruments of the same model. The fragmentation setpoints can be located with great precision.

Slide 34For audio, dial 888-840-7687 or International 01-703-871-3885Chairperson: Rita Willis
Flumetsulam + ESI
0
0.2
0.4
0.6
0.8
1
-10 0 10 20
Frag volt change
ion
ratio
s
262/326
129/326

Slide 35For audio, dial 888-840-7687 or International 01-703-871-3885Chairperson: Rita Willis
Chromatography for API LC/MS Spectral Library Acquisition---
Performance (Fragmentation) Based Tuning
A gradient method is established for running the fragmentation based tuning standards and the library. Ideally the same method will be used for the fragmentation based tune and the library. The chromatography should start at a low enough organic composition to assure retention of the least retentive compound expected in the library. The gradient should extend to a sufficiently high organic composition to insure elution of the most retentive compounds. The library compounds will be run one at a time but the fragmentation based tuning standards would be run as a mixture.

Slide 36For audio, dial 888-840-7687 or International 01-703-871-3885Chairperson: Rita Willis
Acquisition of Performance (Fragmentation) Based Tune Data and the Library
The mixture of fragmentation based tune standards is run at each of the expected endpoints. On the Agilent 1100 LCMSD this is done in one injection by setting up the MS acquisition parameters to include 4 signals each at a unique fragmentation endpoint.
The ion ratios between the parent and selected product ions of the CID process are calculated and a control chart is set up as previously indicated. At this time adjustments cold be made to the endpoints to optimize the ion ratios that will guide the performance base tune.
Each compound in the library is run at each of the four fragmentation endpoints. Every 10-20 library compounds, the fragmentation tune compounds mixture is run and the ion ratios are plotted on the control chart. Ion ratios should be constant about a mean without an upward or a downward trend.

Slide 37For audio, dial 888-840-7687 or International 01-703-871-3885Chairperson: Rita Willis
Inspection of Spectral Data
At each fragmentation endpoint the spectrum of the compound is examined for data consistent with the compound…namely it is important to note if the protonated molecular ion is consistent with the molecular weight of the compound.
The spectrum should be background subtracted.
The S/N ratio of the spectrum is also noted. If the signal is weak the noise may overpower the useful data. The top ten ions in the spectrum should all be from the compound and not from noise. Typically if the S/N of the TIC was greater than 20-30:1 at the fragmentation endpoint, the data will be useful.
The UV data can often help locate the correct peak in cases of weak ionization and/or complex chromatograms due to impure standards.

Slide 38For audio, dial 888-840-7687 or International 01-703-871-3885Chairperson: Rita Willis
Population of the NIST API Spectral Database
Agilent Application Note 5988-5445E was an earlier version of Agilent’s approach to performance based Tuning for API spectral library creation. It differs by only two significant points.
1) the newer technique described in this presentation uses four (4) fragmentation endpoint to establish the library. The application note 5988-5445E used three fragmentation endpoints. The addition of another fragmentation endpoint increases the likelihood that at least two endpoints will be of sufficient quality to establish a unique ID
2)The fragmentation endpoints in the newer technique described in this presentation use specific fragmentation localizing compounds for each fragmentation endpoint. The older technique described in Agilent Application Note 5988-5445E used the mass axis calibration tune mixture as the fragmentation endpoint locating standard. The new procedure described in this presentation can localize the endpoints (especially the low fragmentation energy points) with better accuracy between instruments and with better precision.

Slide 39For audio, dial 888-840-7687 or International 01-703-871-3885Chairperson: Rita Willis
Population of the NIST API Spectral Database
Consult the Agilent Application Note 5988-5445E starting on page 4 “Procedure for adding LC/MSD spectra into the NIST Mass Spectral search Program[2,3]”
All instructions in Agilent Application Note 5988-5445E are identical to those required to populate the NIST database for the newer approach detailed in this presentation.
The only exception is that there are four fragmentation library entries in the new approach compared with three in the older approach detailed in Agilent Application Note 5988-5445E
When all entries are completed the database is ready to use for compound spectra acquired under the same conditions.
Slide 40For audio, dial 888-840-7687 or International 01-703-871-3885Chairperson: Rita Willis
Pesticide LibraryUser Contributed using the Agilent Approach to API Spectral Libraries

Slide 41For audio, dial 888-840-7687 or International 01-703-871-3885Chairperson: Rita Willis
Pesticide Library Protocol OverviewThis protocol describes the procedure and acceptance criteria for adding new compounds for use in a CID library on the Agilent 1100 LCMSD SL.
In general compounds are analyzed at about 1 mg/ml by LC using a C18 50x2.1 mm column with 3 um particles using a gradient of 5 to 95 % Acetonitrile in 25 mM Ammonium Acetate at 0.3 ml/min. The UV spectrum and mass spectrum at four different fragmentor voltages are collected for both positive electrospray ionization. The four-fragmentor voltages correspond roughly to 60V (L1), 120V (L2), 180V (MID), and 240V (HIGH). The exact fragmentor voltages are bases on achieving historical ion ratios for the QC compounds at each energy (L1, L2, MID, and HIGH) for positive detection.
Once the QC ion rations show agreement with the historical values new library spectra can be acquired and stored.

Slide 42For audio, dial 888-840-7687 or International 01-703-871-3885Chairperson: Rita Willis
Pesticide LibraryIonization Mode and Fragmentation Endpoints
This is a library of pesticides acquired under
POSITIVE ION-ESI/25mM AMMONIUM ACETATE-ACETONITRILE
conditions. Gradient elution from 5% to 95% Acetonitrile on a C18 column was employed. The four fragmentation endpoints used in the pesticide database are:
60 VOLTS FRAGMENTOR NOMINAL… LOW 1” FRAGMENTOR ENDPOINT LIBRARY
120 VOLTS FRAGMENTOR NOMINAL……”LOW 2” FRAGMENTORENDPOINT LIBRARY
180 VOLTS FRAGMENTOR NOMINAL….. …”MID” FRAGMENTOR ENDPOINT LIBRARY
240 VOLTS FRAGMENTOR NOMINAL…… ”HIGH” FRAGMENTOR ENDPOINT LIBRARY

Slide 43For audio, dial 888-840-7687 or International 01-703-871-3885Chairperson: Rita Willis
Pesticide LibraryFragmentation Endpoint Standards
60 VOLTS FRAGMENTOR NOMINAL… “LOW 1” FRAGMENTOR ENDPOINT LIBRARY
Azinphos-methyl
N
NN
PS
S O
O
O
CH3
CH3
MW=317 [M+H]+= 318

Slide 44For audio, dial 888-840-7687 or International 01-703-871-3885Chairperson: Rita Willis
Pesticide LibraryFragmentation Endpoint Standards
120 VOLTS FRAGMENTOR NOMINAL……”LOW 2” FRAGMENTOR ENDPOINT LIBRARY
Benomyl
N
N
NH
O
O
NH
O
CH3
CH3
MW=290 [M+H]+= 291

Slide 45For audio, dial 888-840-7687 or International 01-703-871-3885Chairperson: Rita Willis
Pesticide LibraryFragmentation Endpoint Standards
180 VOLTS FRAGMENTOR NOMINAL……”MID” FRAGMENTOR ENDPOINT LIBRARY
Flumetsulam
N
NN
N
S
CH3
NH
O
O
F
F
MW=325 [M+H]+= 326

Slide 46For audio, dial 888-840-7687 or International 01-703-871-3885Chairperson: Rita Willis
Pesticide LibraryFragmentation Endpoint Standards
240 VOLTS FRAGMENTOR NOMINAL……”HIGH” FRAGMENTOR ENDPOINT LIBRARY
Siduron
NH NH
O
CH3
MW=232 [M+H]+= 233

Slide 47For audio, dial 888-840-7687 or International 01-703-871-3885Chairperson: Rita Willis
Pesticide LibraryIon Ratios and QC Limits
Positive ion detection
Fragmentation Endpoint Standard Energy m/z values for ion ratiosAcceptable intensity ion ratios
Azinphosmethyl L1 160/318 0.74 - 0.95132/160 0.22 – 0.41
Benomyl L2 192/291 0.34 – 0.46
Flumetsulam M 262/326 0.2 – 0.3129/326 0.19 – 0.29
Siduron H 94/233 0.5 – 0.78137/233 0.87 – 1.1594/137 0.57 – 0.69

Slide 48For audio, dial 888-840-7687 or International 01-703-871-3885Chairperson: Rita Willis
Fragmentation Standard Solutions
A mixed solution of all four fragmentation endpoint standards ismade up in acetonitrile. The final concentration is 1mg/ml of each component. Benomyl may show some instability on storage so the solutions should be made fresh.
One (1) microliter injections are made into the LC/MS system resulting in 1 microgram on column.

Slide 49For audio, dial 888-840-7687 or International 01-703-871-3885Chairperson: Rita Willis
Fragmentation Based Tune -Suggested Procedure
Construct a sequence of methods where the fragmentor voltage varies from -10 to +10 volts about the nominal fragmentation endpoints of 60, 120, 180 and 240Volts.
Eg: Method 1 will have voltages of 50, 110, 170, 230 Volts. Method 2 will have voltages of 51, 111, 171, and 231 Volts. ……Method 20 will have voltages of 70 130, 190, and 250 Volts.
Determine and record which voltages produce the closest match to the ion ratios specified for each fragmentation endpoint. At these measured voltages the reference instrument on which the library was acquired and the Users instrument will give API spectra that will generate good matches with the NIST search engine for each fragmentation endpoint.
Each compound will generate FOUR spectra one at each endpoint. Each spectrum will be searched against the spectral library corresponding to its endpoint. Thus each injection will have four sets of search results, one at each endpoint. An deal match shows a positive identification for the same compound on each of the four libraries.

Slide 50For audio, dial 888-840-7687 or International 01-703-871-3885Chairperson: Rita Willis
Conclusions
The theories and experimental procedures described in this presentation will allow chemists to make their own API libraries within the limits of the technique.
Very good search hits can be had with careful implementation.
The Pesticide Library serves as one example of such an implementation.
Careful interpretation of search results is important in reaching supportable identifications.