restek corporation - quimica.udea.edu.coquimica.udea.edu.co/~carlopez/cromatohplc/lc... · solvents...
TRANSCRIPT

1
Becky Wittrig, Ph.D.RESTEK CORPORATION
HPLC Method Development
2
HPLC Method Development
I. Method Development Strategy
II. Selecting a Detector
III. Selecting the Separation Mode
IV. Mobile Phase and pH
V. Optimization Based on the Resolution Equation

3
Overview of Method Development Strategy
� Define method goals� Establish sample prep procedure� Select detector� Select mode of separation
– Column and mobile phase
� Perform preliminary separations � Optimize conditions� Calibrate and validate

4
Define Method Goals
� What is known about the sample?
� What level of detection is required?
� Are standards available?
� How fast does the analysis need to be?
� How much resolution is required?

5
What is Known About the Sample?
� Chemical structure(s)� Acidic/Basic, pKa� Molecular weight� Stability (light and solvents)� Solubility� Concentration� Matrix
6
Sample Prep Options
� Filtration� Centrifugation� Solvent extraction� Solid Phase Extraction (SPE)� Supercritical Fluid Extraction (SFE)� Preparative Chromatography� Column Switching� Derivatization
7
Sample Prep Guidelines
� Minimum sample purity required:– Free of particulates– Completely soluble in mobile phase
� Start with minimal sample prep – Filtration is often sufficient
� Additional sample prep needs may be identified during preliminary separations

8
Sample Prep: HMF Standard by HPLC
HMF
Column: Ultra C18 (Restek Corp.), 250 mm x 4.6 mm, 5 µm Mobile Phase A: 90:10 water:methanol, 10 mM ammonium formateMobile Phase B: 10:90 water:methanol, 10 mM ammonium formateGradient: 0-5 min at 100% A, to 100% B at 10 min, 10 min. holdFlow: 0.5 mL/min.Temperature: ambientDetector: UV @ 280 nmInjection Volume: 10 µL

9
HMF + interferences
Sample Prep: HMF in Grape Juice by HPLC
No SPE Treatment
HMF
C18 SPE Treatment

10
Detector Selection: Types
� Ultraviolet/Visible Absorbance (UV/Vis)� Mass Spectrometer (MS)� Refractive Index (RI)� Evaporative Light Scattering (ELS)� Fluorescence (FL)
� Electrochemical (EC)
11
Detector Selection
�Selection is Based on:– Chemical nature of analytes and
potential interferences– Limit of detection required– Availability and/or cost of detector

12
Detector Selection: UV/Vis
� Requirement: analyte must absorb more light than sample matrix at some wavelength
� Most widely used
� Most compounds absorb at low UV
� Diode Array Detector (DAD) can monitor multiple wavelengths simultaneously
13
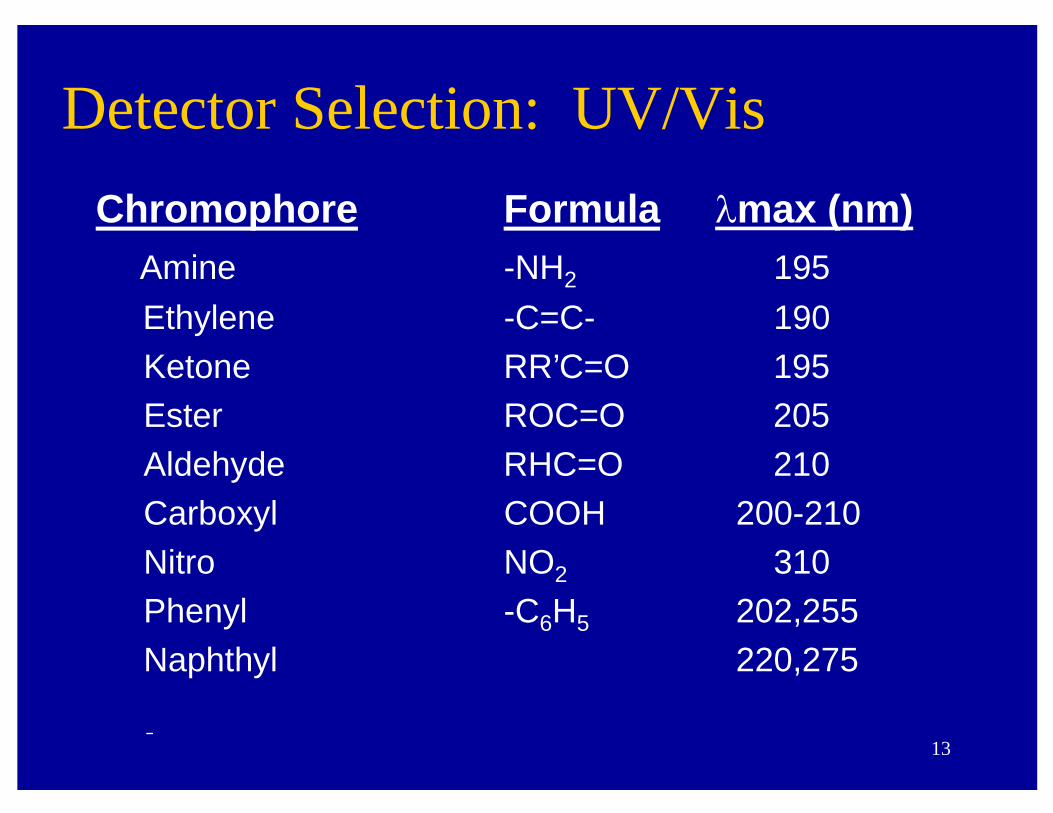
Chromophore Formula Omax (nm)Amine -NH2 195
Ethylene -C=C- 190 Ketone RR’C=O 195Ester ROC=O 205Aldehyde RHC=O 210Carboxyl COOH 200-210Nitro NO2 310Phenyl -C6H5 202,255Naphthyl 220,275
Detector Selection: UV/Vis

14
� Choose detection wavelength that maximizes sensitivity and specificity
� Solvents used may cause slight shifts in UVmax from published values (2-5 nm)
– Check absorbance of analyte in mobile phase
� Mobile phase solvents have UV cutoff points
– Operating below cutoff point will:
• Reduce sensitivity
• Add to baseline noise
Detector Selection: UV/Vis

15
� Requirement: analyte must be ionizable� Rapidly growing in popularity� Positive identification of analyte � Can discriminate between co-eluting peaks in
selected ion mode– Reduces resolution required
� For best sensitivity, work at pH where analytesare ionized– Neutral to basic pH (7-9) for acids– Acidic pH (3-4) for bases
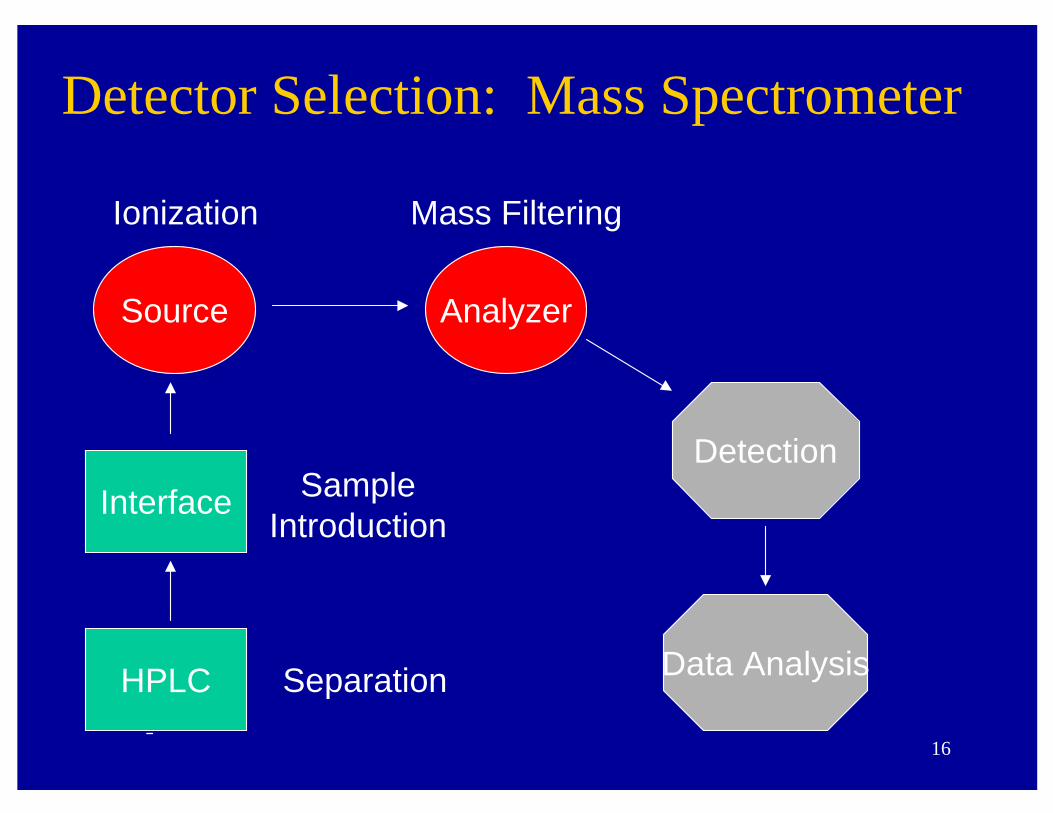
Detector Selection: Mass Spectrometer
16
Source Analyzer
HPLC
Interface
Detection
Data AnalysisSeparation
SampleIntroduction
Ionization Mass Filtering
Detector Selection: Mass Spectrometer

17
� Monitors difference in the refractive index of the sample cell vs. the reference cell
� Non-selective
� Concentration dependent
� Sensitivity is typically 100x-1000x less than a UV/Vis detector
� Cannot be used with gradients (without special modifications)
Detector Selection: Refractive Index
18
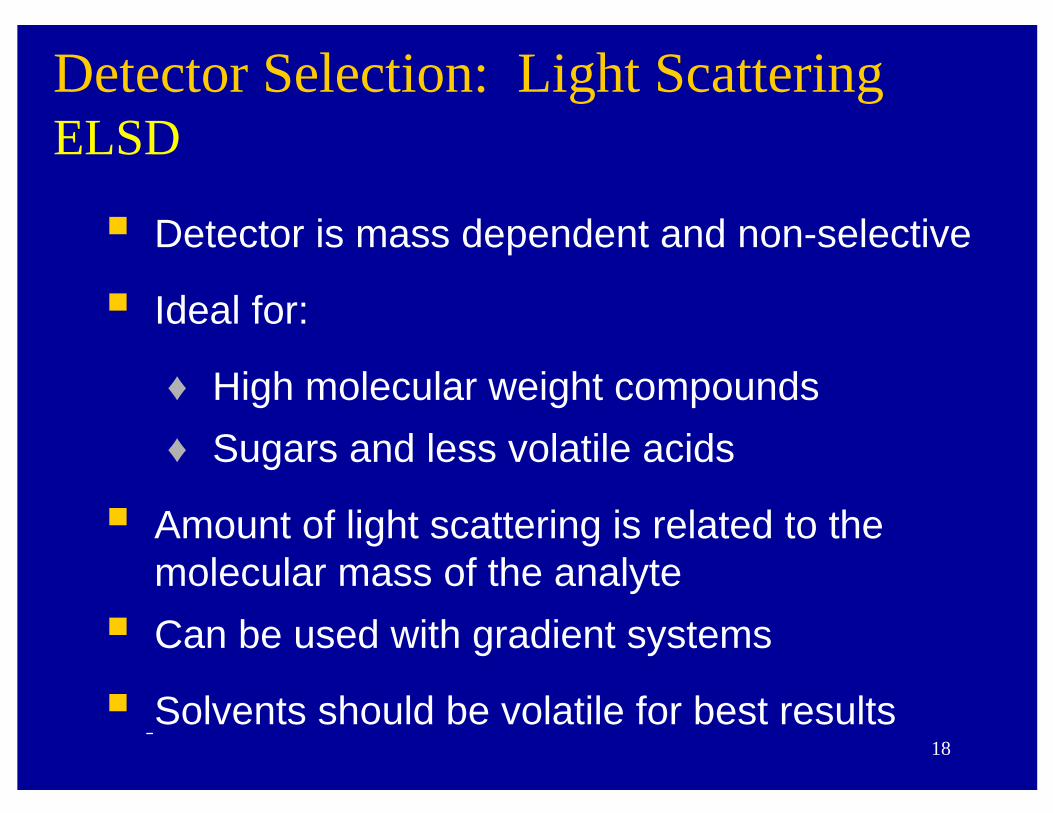
� Detector is mass dependent and non-selective
� Ideal for:
♦ High molecular weight compounds
♦ Sugars and less volatile acids
� Amount of light scattering is related to the molecular mass of the analyte
� Can be used with gradient systems
� Solvents should be volatile for best results
Detector Selection: Light ScatteringELSD
19
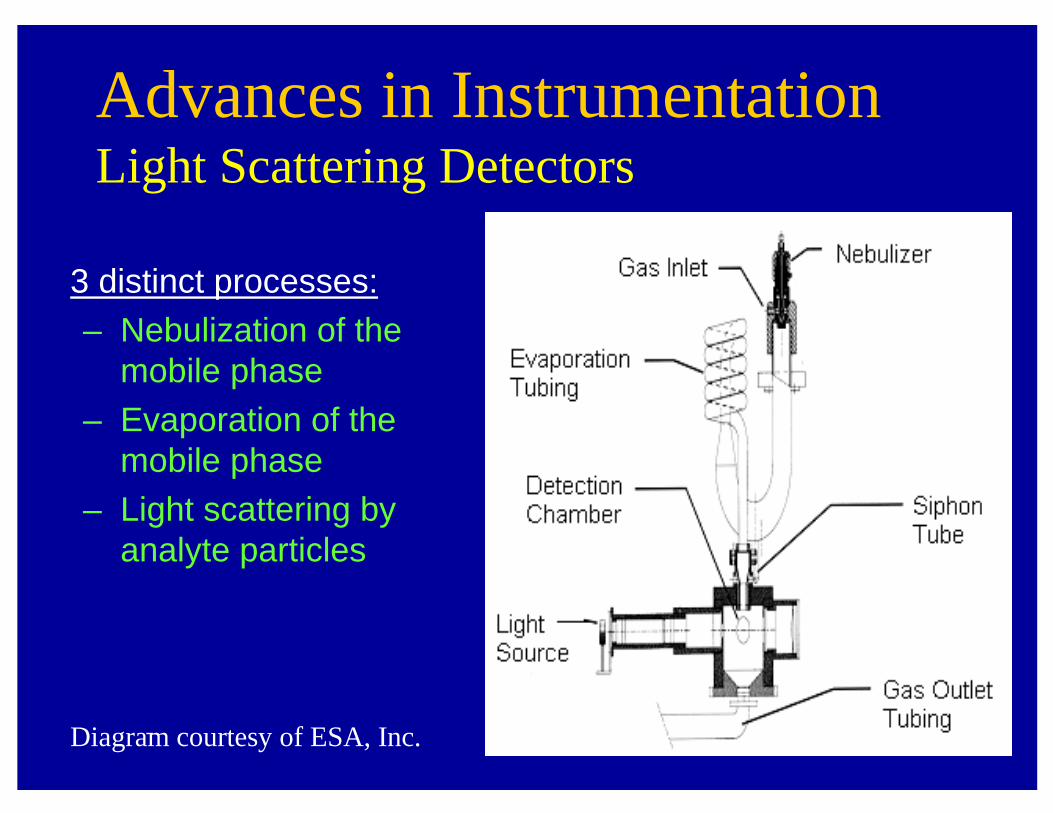
Advances in InstrumentationLight Scattering Detectors
3 distinct processes:– Nebulization of the
mobile phase– Evaporation of the
mobile phase– Light scattering by
analyte particles
Diagram courtesy of ESA, Inc.

20
� Analyte must fluoresce
� Excite at one wavelength, measure the emission at a longer wavelength
� Up to 1000x more sensitive than UV/Vis
� High specificity
� Concentration dependent
� Operation similar to a UV/Vis detector
Detector Selection: Fluorescence
21
� Requirement: Analytes can be oxidized or reduced by an electrical current
� More sensitive than fluorescence
� Not as selective as fluorescence (typically)
� Not compatible with gradient elution
Detector Selection: Electrochemical

22
� EC 10-12
� MS 10-11
� FL 10-11
� UV 10-10
� RI 10-7
� ELS 10-7
Detector Selection: Approximate LODs
23
� Sample solubility
� How do analytes of interest differ from other compounds in sample?
� Reversed phase is the most frequently used mode
Selecting the Mode of Separation

24
� Mobile phase is polar � Stationary phase is less polar� Major distinction between analytes is their
hydrophobicity� The sample should be soluble in water or
a polar organic solvent (i.e. methanol)� Examples are C18 (ODS), C8 (Octyl),
Phenyl, Butyl, and Methyl
Mode Selection : Reversed Phase

25
min0 1 2 3 4
mAU
0
100
200
300
400
500
600
700
800
DAD1 B, Sig=254,16 Ref=360,100 (1998_05\98052804.D)
1
2
3
HydrophobicHydrophilic
Limited interaction
Interacts some
Interacts more
Mode Selection : Reversed PhaseNonionic Compounds
26
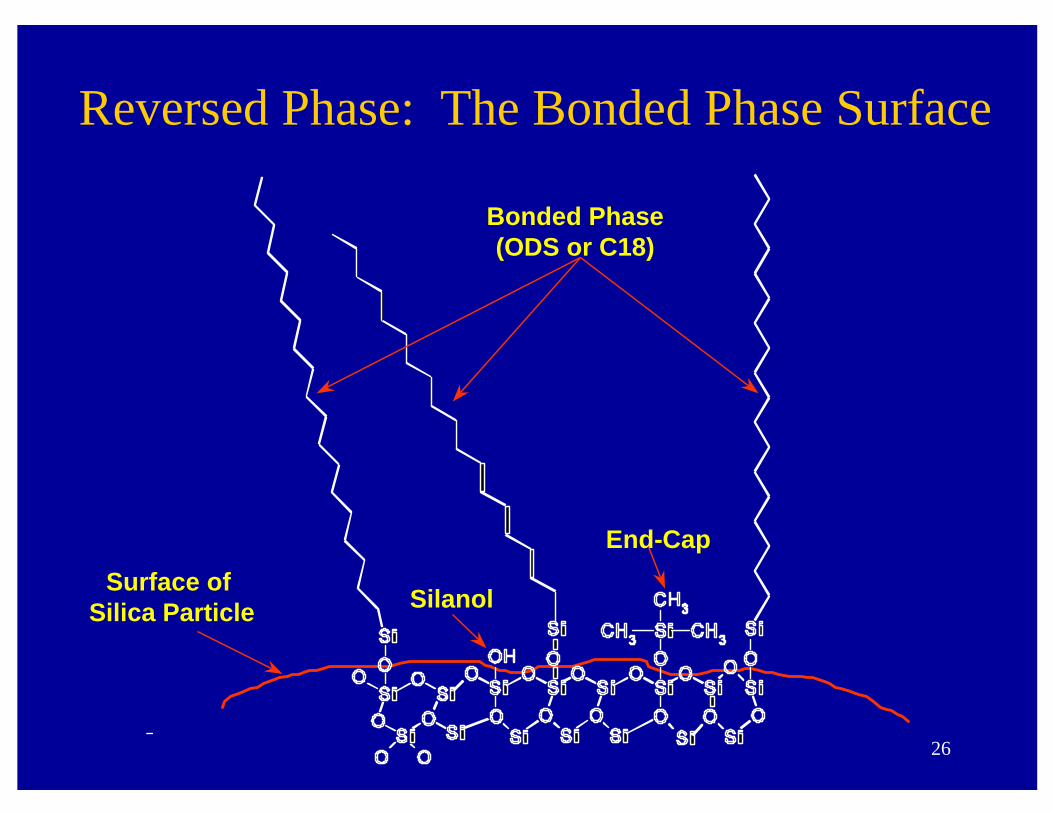
End-Cap
SilanolSurface of
Silica Particle
Bonded Phase(ODS or C18)
Reversed Phase: The Bonded Phase Surface

27
Mode Selection : Normal Phase
� Mobile phase is non-polar while stationary phase is more polar
� When a major distinction between analytes is NOT their hydrophobicity
� Sample should be soluble in a hydrophobic solvent such as hexane
� Mobile phase is a weak to moderate solvent for the sample
� Examples are Silica, Cyano, Amino and Diol

28
stationaryphase
mobile phase
Polar analytesLess polar analytes
Normal Phase Mode of Separation
“adsorption” mechanism
29
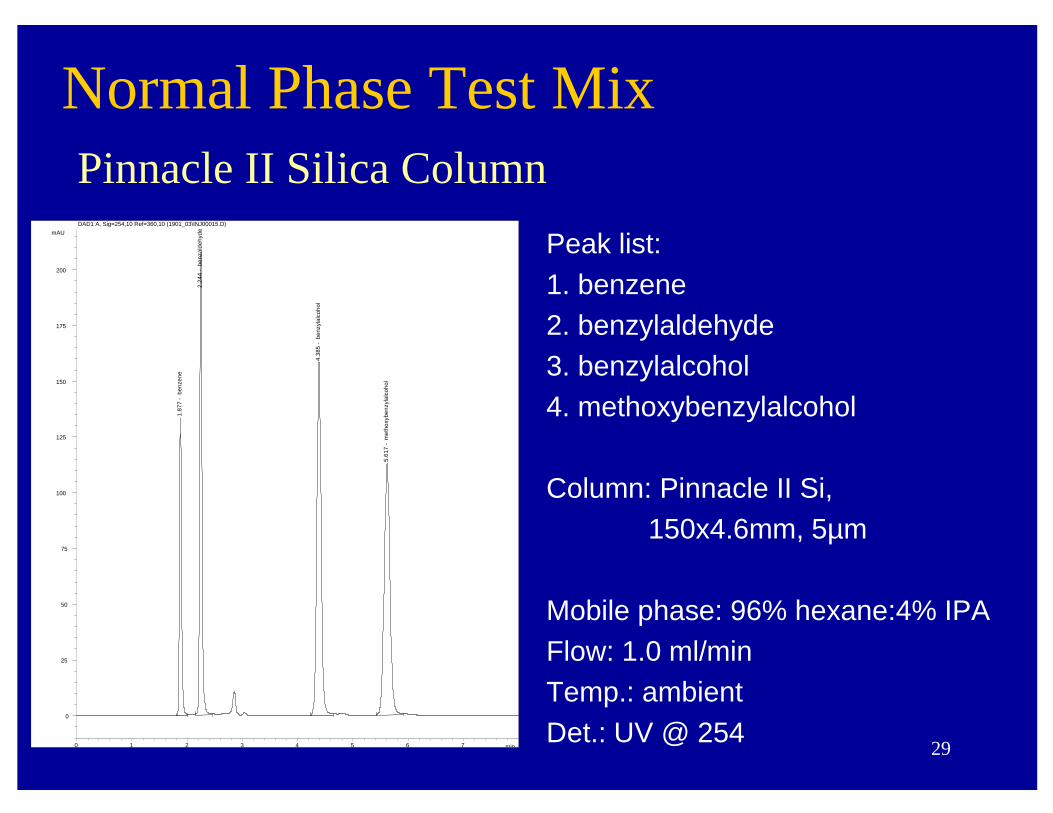
Normal Phase Test MixPinnacle II Silica Column
Peak list:1. benzene2. benzylaldehyde3. benzylalcohol4. methoxybenzylalcohol
Column: Pinnacle II Si, 150x4.6mm, 5µm
Mobile phase: 96% hexane:4% IPAFlow: 1.0 ml/minTemp.: ambientDet.: UV @ 254
min0 1 2 3 4 5 6 7
mAU
0
25
50
75
100
125
150
175
200
DAD1 A, Sig=254,10 Ref=360,10 (1901_03\INJ00015.D)
1.8
77 -
ben
zene
2.2
44 -
ben
zald
ehyd
e
4.3
85 -
ben
zyla
lcoh
ol
5.6
17 -
met
hoxy
benz
ylal
coho
l

30
Mode Selection : Ion Exchange� When analytes are ionic or potentially ionic� Mobile phase is typically an aqueous buffer� Mobile phase strength is a function of ionic
strength� pH is critical� SAX is Strong Anion Exchange (WAX = Weak)� SCX is Strong Cation Exchange (WCX = Weak)� Examples
– Inorganic Cations and Anions, Organic Acids and Bases, Amino Acids, Nucleotides, Catecholamines, Peptides, Antibiotics

31
Uncharged species
Anionic species
stationaryphase
mobile phase
Mode Selection : Ion Exchange

32
Mode Selection: Reversed Phase Ion-Pair
� When analytes are ionic or potentially ionic
� Mobile phase is composed of a buffer, an ion-pair reagent and a polar organic solvent
� Typical ion-pair reagents include
– Alkyl sulfonates (heptane sulfonic acid, octane sulfonic acid) for bases
– Quaternary amines (tetrabutylammoniumchloride) for acids
33
Mode Selection: Size Exclusion� Major distinction between the analytes in the
mixture is their hydrodynamic volume� Generally for molecular weights > 2000� Want to avoid partitioning � The mobile phase should be a strong solvent for
the sample� Aqueous SEC is called Gel Filtration
– Proteins and other biomolecules
� Organic SEC is called Gel Permeation (GPC)– Polymers

34
Why Is Reversed Phase the Most Popular Mode?
� Large proportion of analytes are water soluble
� Wide range of stable stationary phases available
– used to alter retention and selectivity
� Simple mobile phases work for many applications (i.e. water:acetonitrile)
� Selectivity can be altered by changing the mobile phase

35
� In partition chromatography, the mobile phase should be a moderate to poor solvent for the samples– Produce a capacity factor of 1 to 10 (2 to 5)
� For ion exchange and size exclusion the mobile phase should be a strong solvent for the sample
� The use of additives or modifiers can enhance a separation – Improving peak shape – Altering selectivity
General Rules for Mobile Phase Selection

36
Mobile Phase Selection: Organic Solvent
� Water miscible� Low viscosity� Low UV cut-off� Unreactive� Most commonly used:
– Acetonitrile– Methanol– Tetrahydrofuran (THF)
37
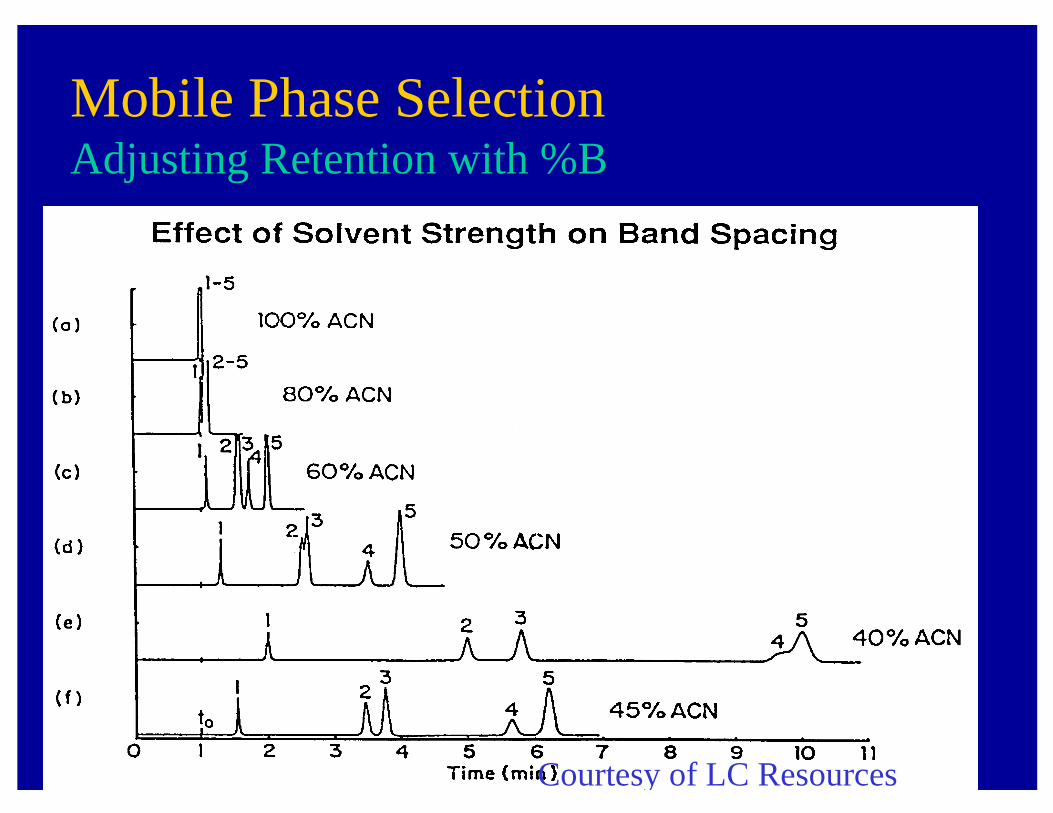
Courtesy of LC Resources
Mobile Phase SelectionAdjusting Retention with %B
38
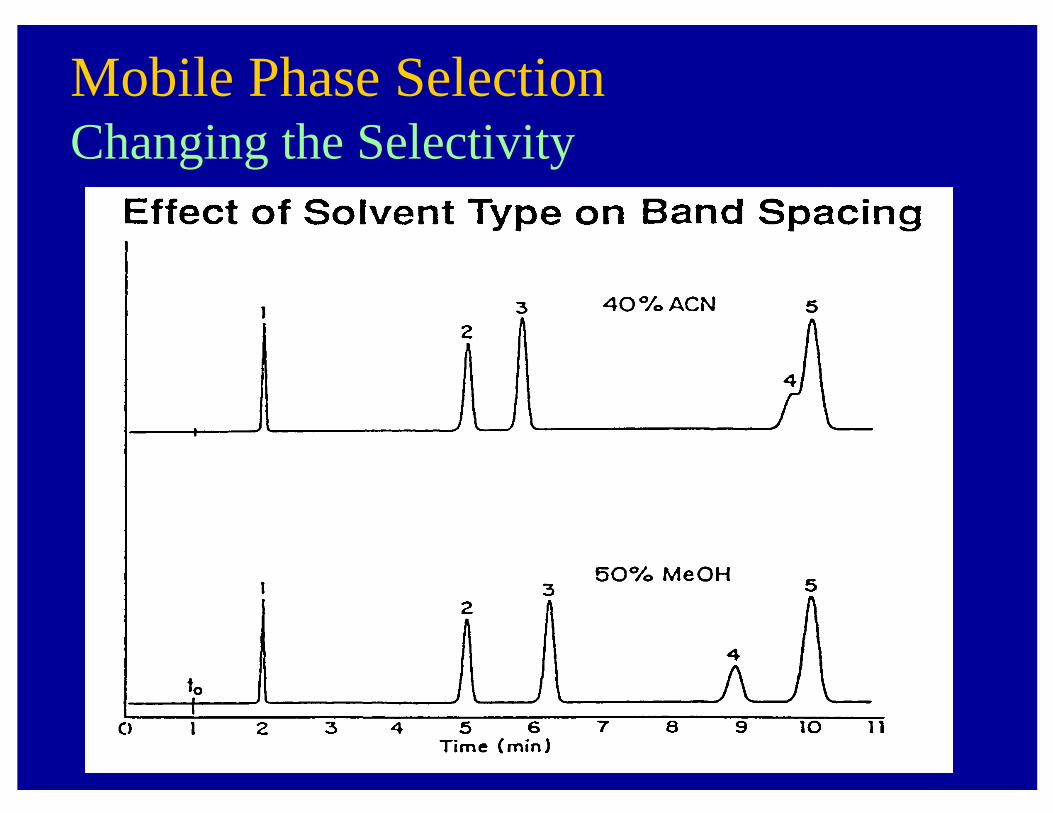
Mobile Phase SelectionChanging the Selectivity
39
What if a single mobile phase (isocratic) will not elute all analytes in the desired k’ range?
� Use gradient elution
� Mobile phase strength changes over time
� Weak mobile phase early in the gradient
– k’>2 for weakly retained analytes
� Strong mobile phase later in the gradient
– k’<10 for strongly retained analytes
� Initial scouting run
– Use to estimate %organic for an appropriate elution
– Elutes all strongly-retained compounds

40
Disadvantages Of Gradient Elution
� Column re-equilibration required after every analysis
� Requires a pump with at least two-solvent capability
� Not compatible with some forms of detection (RI, EC)
� More variables to control for reproducibility� Delay volume becomes important
– Volume of mobile phase contained in the HPLC system between pump(s) and column

41
High Pressure Gradient System
ProgrammerSolvent A Solvent B
Pump A Pump B
Mixing Chamber
Injector
Column
Delay Volume

42
Low Pressure Gradient SystemQuaternary
Solvent A Solvent C
Mixing Chamber
Injector
Column
Solvent B Solvent D
Delay Volume
PUMP
ProportioningValve
Programmer

43
Gradient ProfileElectronic Profile
Actual Profile atColumn Inlet
Profile at Detector
Delay Volume or Time
GradientStart
Measure using (A) methanol or water, (B) A + 1% acetoneStep gradient from 100%A to 100%B, UV @ 265nm
44
� Solvent selection and mobile phase composition
� Gradient shape� Gradient steepness� Duration and position of isocratic
conditions� Pressure and flow
Gradient Variables
45
� Keep it as simple as possible
� Be aware that delay volumes will vary from instrument to instrument
� Make sure post run equilibration time is adequate to return column to initial conditions
� Pre-mix mobile phase modifiers
� Pre-mix solvents with poor miscibility
� Avoid ion-pair gradients
Tips for a Successful Gradient Run
46
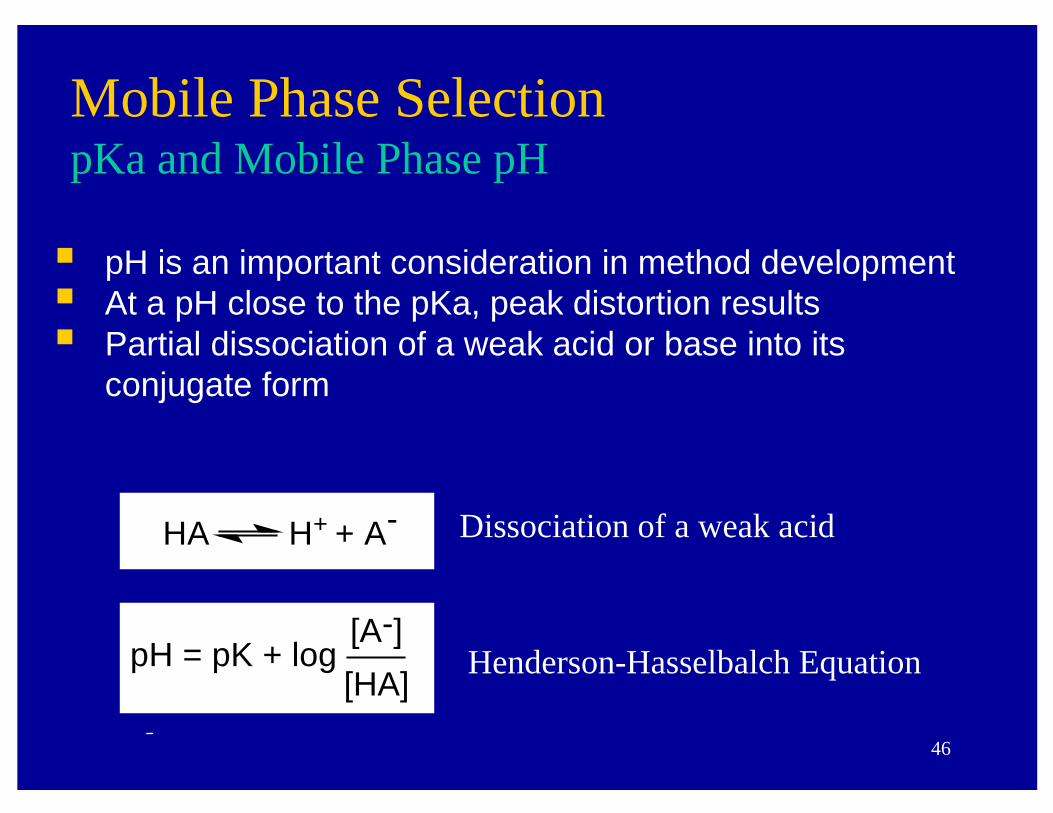
HA H+ + A-
pH = pK + log[A-]
[HA]
Dissociation of a weak acid
Henderson-Hasselbalch Equation
� pH is an important consideration in method development � At a pH close to the pKa, peak distortion results� Partial dissociation of a weak acid or base into its
conjugate form
Mobile Phase SelectionpKa and Mobile Phase pH

47
Buffers for Reverse Phase HPLC
pH Range Buffer UVcutoff(nm)
1.1 - 3.16.2 - 8.2
11.3 - 13.3
phosphate 210
2.1 - 4.13.7 - 5.74.4 - 6.4
citrate 250
3.8 - 5.8 acetate 2307.3 - 9.3 tris(hydroxymethyl)
aminomethane220
8.2 - 10.2 borate 210
48
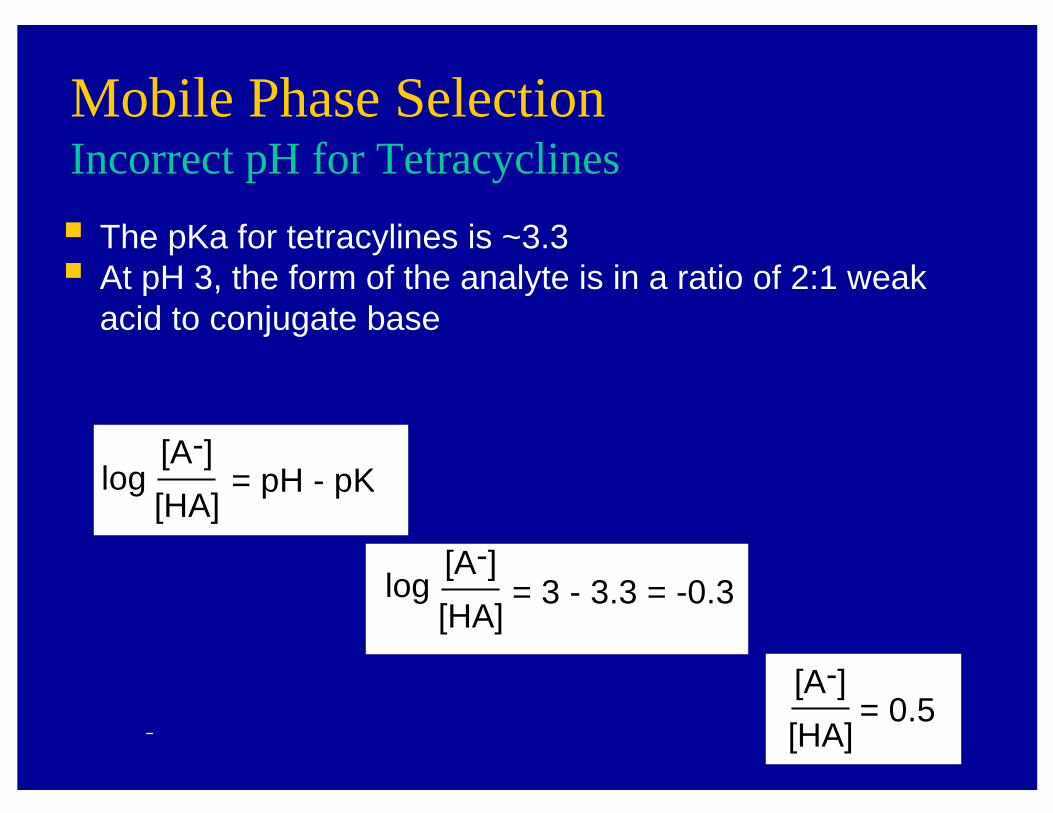
log [A-]
[HA]= pH - pK
log[A-]
[HA]= 3 - 3.3 = -0.3
� The pKa for tetracylines is ~3.3� At pH 3, the form of the analyte is in a ratio of 2:1 weak
acid to conjugate base
[A-]
[HA]= 0.5
Mobile Phase SelectionIncorrect pH for Tetracyclines

49
Tetracyclines at pH 3Conditions:Column: Pinnacle ODS AmineDimensions: 150 x 4.6 mmParticle Size: 5 umPore Size: 120A
Solvent A: 80 % 0.05M KH2PO4 pH 3.0Solvent B: 20 % AcetonitrileMode : IsocraticFlow Rate: 1.0 ml/minWavelength: 265 nm
Peak List:1. Oxytetracycline2. Tetracycline3. Demeclocycline4. Chlortetracycline5. Doxycycline 1
2
3
45
2.5 5 7.5 10 12.5

50
Tetracyclines at pH 2Conditions:Column: Pinnacle ODS AmineDimensions: 150 x 4.6 mmParticle Size: 5 umPore Size: 120A
Solvent A: 80 % 0.05M KH2PO4 pH 2.0Solvent B: 20 % AcetonitrileMode : IsocraticFlow Rate: 1.0 ml/minWavelength: 265 nm
Peak List:1. Oxytetracycline2. Tetracycline3. Demeclocycline4. Chlortetracycline5. Doxycycline
1
2
3
45

51
The Resolution Equation
� The ultimate goal of chromatography is to resolve two or more compounds into separate peaks.
� Resolution (Rs) is defined by the distance between two peaks relative to the widths of the peaks
R = ∆ tr/W

52
Selectivity
Efficiency
Capacity
The Resolution Equation
53
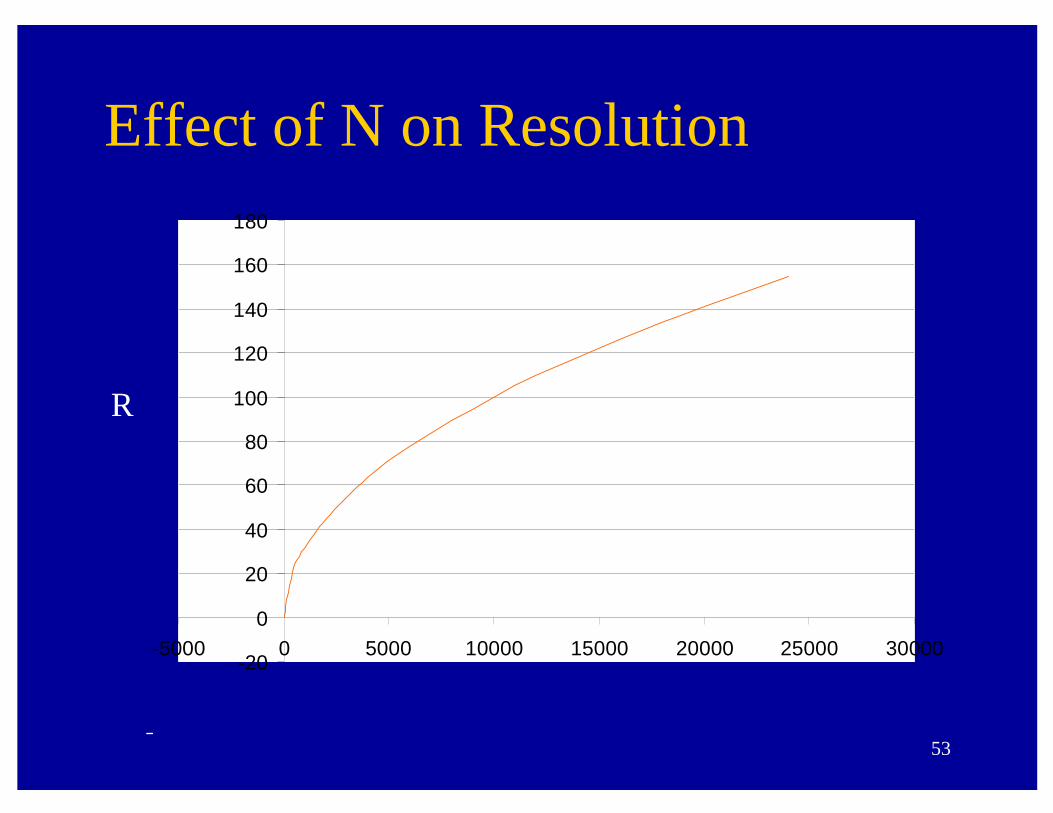
Effect of N on Resolution
-20
0
20
40
60
80
100
120
140
160
180
-5000 0 5000 10000 15000 20000 25000 30000
N
R

54
Effect of N on Resolution
� Resolution is proportional to square root of N
– To double resolution, N would have to increase by a factor of 4
� N can be increased with longer column or smaller particle size
– R ∝ √N– N ∝ column length– N ∝ 1/particle diameter
– Limited by column pressure

55
0
0.1
0.2
0.3
0.4
0.5
0.6
0.7
0.8
0.9
1
0 2 4 6 8 10 12 14 16
Effect of k’ on Resolution
k’
R

56
Effect of k’ on Resolution
� Practical limitation on how much R can be increased by changing k’
� Increasing k’ has increasingly smaller benefit to R, especially at k’ > 5
� Increasing k’ comes at cost of greater analysis time
� k’ is changed by altering mobile phase strength
57
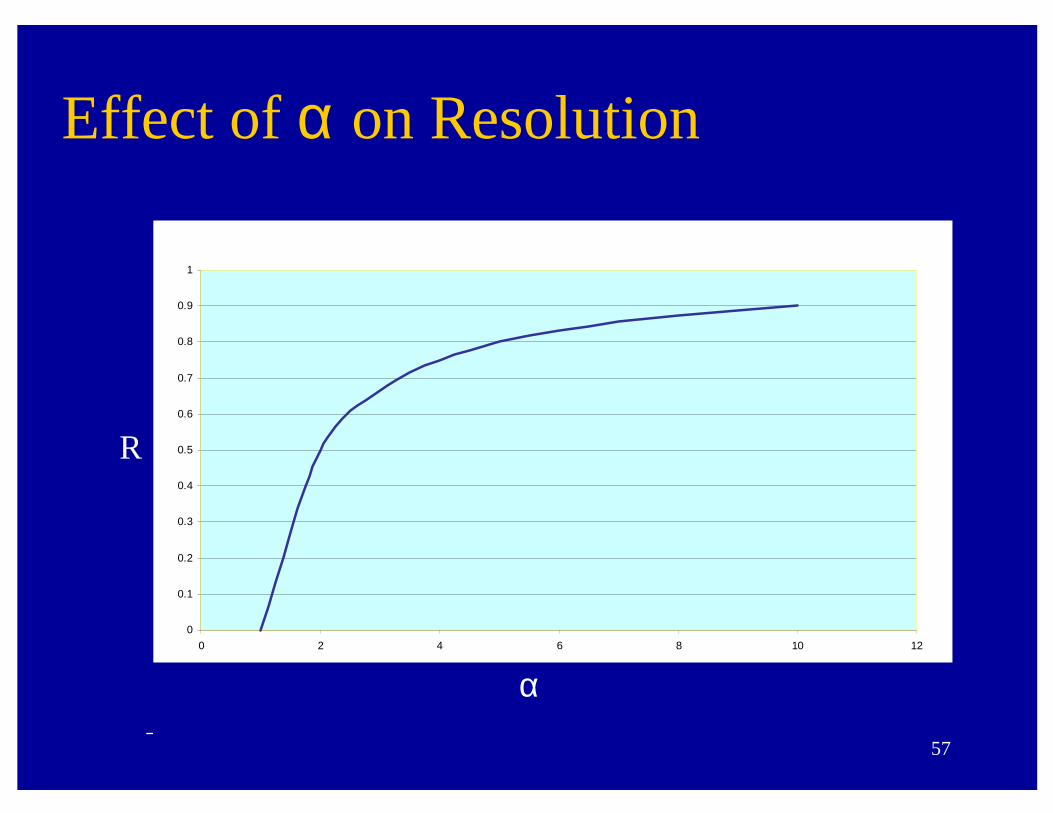
Effect of α on Resolution
0
0.1
0.2
0.3
0.4
0.5
0.6
0.7
0.8
0.9
1
0 2 4 6 8 10 12
R
α

58
Effect of α on Resolution
� Changing α is the most effective way to increase resolution
� α can be altered over wide range without sacrificing time or higher pressure
� Adjust α by changing stationary phase or mobile phase solvents

59
Method Development Based on the Resolution Equation
1. Adjust k’ to optimum range (~2-5)2. If not close to desired resolution, adjust
selectivity by changing either mobile phase or stationary phase¾ Return to step 1
3. If close to desired resolution, increase N by increasing column length or decreasing particle size

60
Methyl
Octyl
ODS
2 4 6 8 10
Stationary Phase Type (α)
Butyl
61
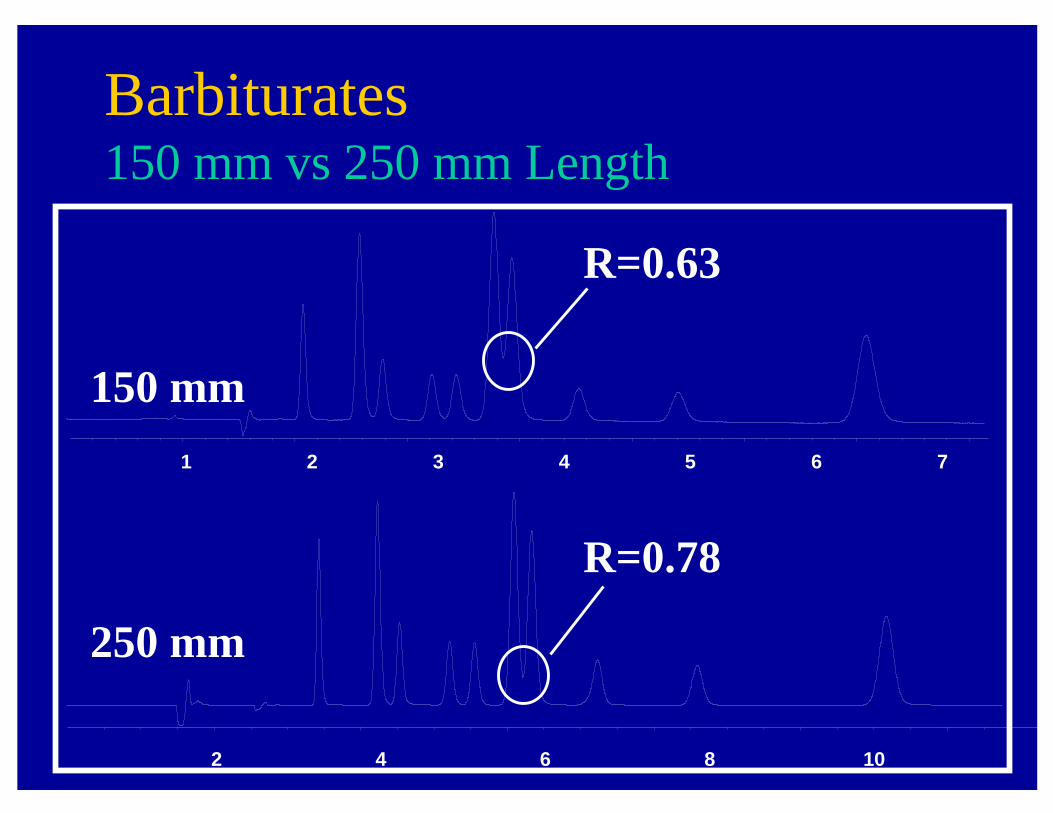
150 mm
250 mm
R=0.63
R=0.78
1 2 3 4 5 6 7
2 4 6 8 10
Barbiturates150 mm vs 250 mm Length

62
5 10 15 20
5 10 15 20
3 um
5 um
R= 1.2
R= 0.9
Triazines3 um vs 5 um dp
63
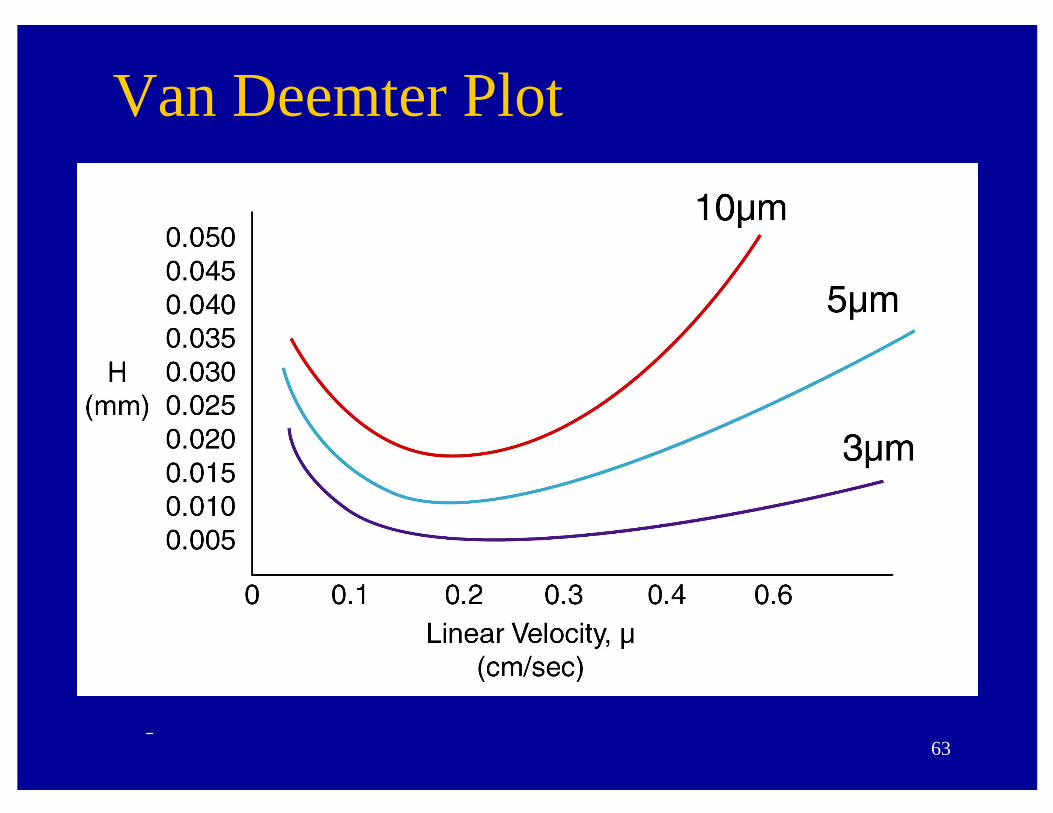
Van Deemter Plot

64
Approximate Optimum Flow Rate
Flow Rate (mL/min)Column Particle SizeID (mm) 3µm 5µm1.0 0.075 0.0502.1 0.300 0.2003.2 0.750 0.5004.6 1.5 1.0

65
Temperature Control
� Slightly above ambient temperature (i.e. 30°C) to maximize temperature stability
� Temperature affects retention and in some cases selectivity
� Increasing temperature can decrease pressure by reducing mobile phase viscosity
� Maximum recommended temperature for most columns is 80°C

66
HPLC Method Validation
� Ensure that the method will provide similar results over a long period of time in other labs
� Challenge the method to determine the limits of allowed variability for each method parameter
� International Council on Harmonization (ICH) – Guidelines for the validation of analytical methods
– Applied universally by all agencies and all analytical methods

67
ICH Method Development Parameters
� Precision� Accuracy� Limit of Detection� Limit of Quantitation� Specificity
� Linearity� Range� Robustness� System Suitability

68
Summary of Method Development
� Define goals� Gather information� Select mode� Adjust k’
� Adjust α� Optimize N if needed� Know when to quit