consolidated financial statements december 31, 2018 virgin ... · our residential broadband...
TRANSCRIPT

Consolidated Financial Statements
December 31, 2018
VIRGIN MEDIA INC.
1550 Wewatta Street, Suite 1000
Denver, Colorado 80202
United States

VIRGIN MEDIA INC.
TABLE OF CONTENTS
Page
Number
Part I:
Forward-looking Statements......................................................................................................................................
Business .....................................................................................................................................................................
Management...............................................................................................................................................................
Principal Shareholder.................................................................................................................................................
Risk Factors ...............................................................................................................................................................
Part II:
Independent Auditors’ Report ....................................................................................................................................
Consolidated Balance Sheets as of December 31, 2018 and 2017 ............................................................................
Consolidated Statements of Operations for the Years Ended December 31, 2018, 2017 and 2016 ..........................
Consolidated Statements of Comprehensive Loss for the Years Ended December 31, 2018, 2017 and 2016 ..........
Consolidated Statements of Owner's Equity for the Years Ended December 31, 2018, 2017 and 2016...................
Consolidated Statements of Cash Flows for the Years Ended December 31, 2018, 2017 and 2016 .........................
Notes to Consolidated Financial Statements..............................................................................................................
Management’s Discussion and Analysis of Financial Condition and Results of Operations ....................................
Quantitative and Qualitative Disclosures about Market Risk....................................................................................
I - 1
I - 3
I - 21
I - 23
I - 24
II - 1
II - 3
II - 5
II - 6
II - 7
II - 10
II - 12
II - 63
II - 86

I - 1
FORWARD-LOOKING STATEMENTS
Certain statements in this annual report constitute forward-looking statements. To the extent that statements in this annual
report are not recitations of historical fact, such statements constitute forward-looking statements, which, by definition, involve
risks and uncertainties that could cause actual results to differ materially from those expressed or implied by such statements. In
particular, statements under Item 1. Business, Item 1A. Risk Factors, Item 7. Management’s Discussion and Analysis of Financial
Condition and Results of Operations and Item 7A. Quantitative and Qualitative Disclosures About Market Risk may contain
forward-looking statements, including statements regarding our business, product, foreign currency and finance strategies in 2019,
subscriber growth and retention rates, competitive, regulatory and economic factors, the timing and impacts of proposed
transactions, the maturity of our markets, the anticipated impacts of new legislation (or changes to existing rules and regulations),
anticipated changes in our revenue, costs or growth rates, our liquidity, credit risks, foreign currency risks, target leverage levels,
our future projected contractual commitments and cash flows and other information and statements that are not historical fact.
Where, in any forward-looking statement, we express an expectation or belief as to future results or events, such expectation
or belief is expressed in good faith and believed to have a reasonable basis, but there can be no assurance that the expectation or
belief will result or be achieved or accomplished.
In evaluating these statements, you should consider the risks and uncertainties discussed under Item 1A. Risk Factors and
Item 7A. Quantitative and Qualitative Disclosures About Market Risk, as well as the following list of some but not all of the factors
that could cause actual results or events to differ materially from anticipated results or events:
• economic and business conditions and industry trends in the countries in which we operate;
• the competitive environment in the cable television, broadband and telecommunications industries in the United Kingdom
(U.K.) and Ireland, including competitor responses to our products and services;
• fluctuations in currency exchange rates and interest rates;
• instability in global financial markets, including sovereign debt issues in the European Union (E.U.) and related fiscal
reforms;
• consumer disposable income and spending levels, including the availability and amount of individual consumer debt;
• changes in consumer television viewing preferences and habits;
• consumer acceptance of our existing service offerings, including our cable television, broadband internet, fixed-line
telephony, mobile and business service offerings, and of new technology, programming alternatives and other products
and services that we may offer in the future;
• our ability to manage rapid technological changes;
• our ability to maintain or increase the number of subscriptions to our cable television, broadband internet, fixed-line
telephony and mobile service offerings and our average revenue per household;
• our ability to provide satisfactory customer service, including support for new and evolving products and services;
• our ability to maintain or increase rates to our subscribers or to pass through increased costs to our subscribers;
• the impact of our future financial performance, or market conditions generally, on the availability, terms and deployment
of capital;
• changes in, or failure or inability to comply with, government regulations in the countries in which we operate and adverse
outcomes from regulatory proceedings;
I - 2
• government intervention that impairs our competitive position, including any intervention that would open our broadband
distribution networks to competitors and any adverse change in our accreditations or licenses;
• our ability to obtain regulatory approval and satisfy other conditions necessary to close acquisitions and dispositions, and
the impact of conditions imposed by competition and other regulatory authorities in connection with acquisitions;
• our ability to successfully acquire new businesses and, if acquired, to integrate, realize anticipated efficiencies from, and
implement our business plan with respect to, the businesses we have acquired or that we expect to acquire;
• changes in laws or treaties relating to taxation, or the interpretation thereof, in the countries in which we operate;
• changes in laws and government regulations that may impact the availability and cost of capital and the derivative
instruments that hedge certain of our financial risks;
• the ability of suppliers and vendors (including our third-party wireless network providers under our mobile virtual network
operator (MVNO) arrangements) to timely deliver quality products, equipment, software, services and access;
• the availability of attractive programming for our video services and the costs associated with such programming;
• uncertainties inherent in the development and integration of new business lines and business strategies;
• our ability to adequately forecast and plan future network requirements, including the costs and benefits associated with
the network extension program in the U.K. and Ireland (the Network Extension);
• the availability of capital for the acquisition and/or development of telecommunications networks and services;
• problems we may discover post-closing with the operations, including the internal controls and financial reporting process,
of businesses we acquire;
• the leakage of sensitive customer data;
• the outcome of any pending or threatened litigation;
• the loss of key employees and the availability of qualified personnel;
• changes in the nature of key strategic relationships with partners and joint venturers;
• adverse changes in public perception of the “Virgin” brand, which we and others license from Virgin Enterprises Limited,
and any resulting impacts on the goodwill of customers toward us; and
• events that are outside of our control, such as political unrest in international markets, terrorist attacks, malicious human
acts, natural disasters, pandemics and other similar events.
The broadband distribution and mobile service industries are changing rapidly and, therefore, the forward-looking statements
of expectations, plans and intent in this annual report are subject to a significant degree of risk. These forward-looking statements
and the above-described risks, uncertainties and other factors speak only as of the date of this annual report, and we expressly
disclaim any obligation or undertaking to disseminate any updates or revisions to any forward-looking statement contained herein,
to reflect any change in our expectations with regard thereto, or any other change in events, conditions or circumstances on which
any such statement is based. Readers are cautioned not to place undue reliance on any forward-looking statement.

I - 3
BUSINESS
In this annual report, unless the context otherwise requires, the terms “we,” “our,” “our company,” “us” and “Virgin Media”
refer, as the context requires, to Virgin Media Inc. or collectively to Virgin Media and its consolidated subsidiaries. Unless otherwise
indicated, operational and statistical data, including subscriber statistics and product offerings, are as of December 31, 2018.
Introduction
We are a subsidiary of Liberty Global plc (Liberty Global) that provides video, broadband internet, fixed-line telephony,
mobile and broadcasting services in the U.K. and Ireland. We are one of the U.K.’s and Ireland’s largest providers of residential
video, broadband internet and fixed-line telephony services in terms of the number of customers. We believe our advanced, deep-
fiber cable access network enables us to offer faster and higher quality broadband services than our digital subscriber line (DSL)
market participants. As a result, we provide our customers with a leading next generation broadband service and one of the most
advanced interactive television services available in the U.K. and Irish markets.
Our residential broadband subscribers generally access the internet at various download speeds ranging up to 350 Mbps in
the U.K. and up to 360 Mbps in Ireland, depending on the tier of service selected. We determine pricing for each different tier of
broadband internet service through analysis of speed, market conditions and other factors.
Our digital cable service offerings include basic and premium programming and incremental product and service offerings
such as enhanced pay-per-view (PPV) programming (including digital cable-on-demand), digital cable recorders, high definition
(HD) and 3D programming and access to over-the-top (OTT) content.
We provide mobile services to our customers in the U.K. and Ireland using third-party networks through MVNO arrangements.
In addition, we provide broadband internet, fixed-line and mobile telephony and other connectivity services to businesses,
public sector organizations and service providers in the U.K. and Ireland.
Liberty Global is an international TV and broadband company operating under the consumer brands Virgin Media, Unitymedia,
Telenet and UPC. Liberty Global invests in the infrastructure and digital platforms that empower its customers to make the most
of the video, internet and communications revolution. Its substantial scale and commitment to innovation enables it to develop
market-leading products delivered through next-generation networks that, as of December 31, 2018, connected over 21 million
customers subscribing to 45 million television, broadband internet and telephony services. As of December 31, 2018, Liberty
Global also served over six million mobile subscribers. In addition, Liberty Global owns 50% of VodafoneZiggo, a joint venture
in the Netherlands.

I - 4
Operating Statistics
The following table shows our operating statistics as of December 31, 2018:
CABLE U.K. Ireland Combined
Footprint
Homes Passed1....................................................................................................... 14,417,300 923,000 15,340,300
Two-way Homes Passed2....................................................................................... 14,410,300 890,500 15,300,800
Subscribers (RGUs)3
Basic Video4 .......................................................................................................... — 4,500 4,500
Enhanced Video5.................................................................................................... 3,872,000 266,600 4,138,600
Total Video......................................................................................................... 3,872,000 271,100 4,143,100
Internet6 ................................................................................................................. 5,224,600 375,700 5,600,300
Telephony7 ............................................................................................................. 4,571,200 352,300 4,923,500
Total RGUs ........................................................................................................ 13,667,800 999,100 14,666,900
Cable Customer Relationships
Cable Customer Relationships8 ............................................................................. 5,509,400 437,200 5,946,600
RGUs per Customer Relationship ......................................................................... 2.48 2.29 2.47
Customer Bundling
Single-Play ............................................................................................................ 16.2% 18.1% 16.4%
Double-Play........................................................................................................... 19.4% 35.2% 20.6%
Triple-Play ............................................................................................................. 64.4% 46.7% 63.0%
Fixed-mobile Convergence9 .................................................................................. 20.1% 11.4% 19.5%
MOBILE
Mobile Subscribers10
Postpaid ................................................................................................................. 2,662,800 81,500 2,744,300
Prepaid................................................................................................................... 376,700 — 376,700
Total Mobile subscribers.................................................................................... 3,039,500 81,500 3,121,000
_______________
(1) Homes Passed are homes, residential multiple dwelling units or commercial units that can be connected to our networks
without materially extending the distribution plant. Our Homes Passed counts are based on census data that can change based
on either revisions to the data or from new census results.
(2) Two-way Homes Passed are Homes Passed by those sections of our networks that are technologically capable of providing
two-way services, including video, internet and telephony services. At December 31, 2018, the U.K.'s 14,410,300 Two-way
Homes Passed included 14,125,400 residential premises and 284,900 commercial premises.
(3) Revenue Generating Unit (RGU) is separately a Basic Video Subscriber, Enhanced Video Subscriber, Internet Subscriber or
Telephony Subscriber (each as defined and described below). A home, residential multiple dwelling unit or commercial unit
may contain one or more RGUs. For example, if a residential customer subscribed to our enhanced video service, fixed-line
telephony service and broadband internet service, the customer would constitute three RGUs. Total RGUs is the sum of Basic
Video, Enhanced Video, Internet and Telephony Subscribers. RGUs generally are counted on a unique premises basis such
that a given premises does not count as more than one RGU for any given service. On the other hand, if an individual receives
one of our services in two premises (e.g., a primary home and a vacation home), that individual will count as two RGUs for
that service. Each bundled cable, internet or telephony service is counted as a separate RGU regardless of the nature of any
bundling discount or promotion. Non-paying subscribers are counted as subscribers during their free promotional service

I - 5
period. Some of these subscribers may choose to disconnect after their free service period. Services offered without charge
on a long-term basis (e.g., VIP subscribers or free service to employees) generally are not counted as RGUs. We do not include
subscriptions to mobile services in our externally reported RGU counts. In this regard, our December 31, 2018 RGU counts
exclude our separately reported postpaid and prepaid mobile subscribers.
(4) Basic Video Subscriber is a home, residential multiple dwelling unit or commercial unit that receives our video service over
our broadband network either via an analog video signal or via a digital video signal without subscribing to any recurring
monthly service that requires the use of encryption-enabling technology. Encryption-enabling technology includes smart cards,
or other integrated or virtual technologies that we use to provide our enhanced service offerings. We count RGUs on a unique
premises basis. In other words, a subscriber with multiple outlets in one premises is counted as one RGU and a subscriber
with two homes and a subscription to our video service at each home is counted as two RGUs.
(5) Enhanced Video Subscriber is a home, residential multiple dwelling unit or commercial unit that receives our video service
over our broadband network or through a partner network via a digital video signal while subscribing to any recurring monthly
service that requires the use of encryption-enabling technology. Enhanced Video Subscribers are counted on a unique premises
basis. For example, a subscriber with one or more set-top boxes that receives our video service in one premises is generally
counted as just one subscriber. An Enhanced Video Subscriber is not counted as a Basic Video Subscriber. As we migrate
customers from basic to enhanced video services, we report a decrease in our Basic Video Subscribers equal to the increase
in our Enhanced Video Subscribers.
(6) Internet Subscriber is a home, residential multiple dwelling unit or commercial unit that receives internet services over our
networks.
(7) Telephony Subscriber is a home, residential multiple dwelling unit or commercial unit that receives voice services over our
networks. Telephony Subscribers exclude mobile telephony subscribers.
(8) Cable Customer Relationships are the number of customers who receive at least one of our video, internet or telephony services
that we count as RGUs, without regard to which or to how many services they subscribe. To the extent that RGU counts
include EBU adjustments, we reflect corresponding adjustments to our Cable Customer Relationship counts. Cable Customer
Relationships generally are counted on a unique premises basis. Accordingly, if an individual receives our services in two
premises (e.g., a primary home and a vacation home), that individual generally will count as two Cable Customer Relationships.
We exclude mobile-only customers from Cable Customer Relationships.
(9) Fixed-mobile Convergence penetration represents the number of customers who subscribe to both our internet service and
postpaid mobile telephony service, divided by the number of customers who subscribe to our internet service.
(10) Our Mobile Subscriber count represents the number of active subscriber identification module (SIM) cards in service rather
than services provided. For example, if a Mobile Subscriber has both a data and voice plan on a smartphone this would equate
to one Mobile Subscriber. Alternatively, a subscriber who has a voice and data plan for a mobile handset and a data plan for
a laptop (via a dongle) would be counted as two Mobile Subscribers. Customers who do not pay a recurring monthly fee are
excluded from our Mobile Subscriber counts after a 30 day period of inactivity.

I - 6
Products and Services in the U.K.
Cable
We offer our customers a choice of packages and tariffs within each of our cable product categories. Our bundled packaging
and pricing are designed to encourage our customers to purchase multiple services across our product portfolio by offering incentives
to customers who subscribe to two or more of our products. The types and number of services that each customer uses, and the
prices we charge for these services, drive our revenue. For example, broadband internet is more profitable than our television
services and, on average, our “triple-play” customers are more profitable than “double-play” or “single-play” customers. As of
December 31, 2018, 84% of our cable customers received multiple services from us and 64% were “triple-play” customers, receiving
broadband internet, video and fixed-line telephony services.
We offer our consumer products and services through a broad range of sales channels, including inbound and outbound
telesales, customer care centers and online. We also engage in direct face-to-face marketing initiatives through a dedicated national
sales force of approximately 500 representatives, as well as comprehensive national and regional mass media advertising initiatives.
We have a national retail store base with approximately 90 retail locations that consist of traditional high street stores and mall
based kiosks. This is complemented by approximately 75 sales representatives that work in transportable kiosk-type retail outlets
that offer a complete range of our consumer products and services. Our stores not only provide sales services, but also showcase
our products, allowing demonstrations and customer interaction, and help resolve customer queries. In addition, as of December 31,
2018, we employed approximately 1,500 staff members in our call centers. We also use outsourced call centers in the U.K.,
Philippines and India.
Broadband Internet
We deliver ultrafast broadband internet services to customers on our cable network. As of December 31, 2018, we provided
cable broadband services to approximately 5.2 million subscribers. We are one of the leading providers of broadband internet
access in the U.K.
We currently offer four tiers of cable broadband services to new subscribers with unlimited downloads at speeds of up to 50
Mbps, 100 Mbps, 200 Mbps and 350 Mbps.
Television
Our digital cable platform includes access to over 300 linear television channels, advanced interactive features and a range
of premium subscription-based and PPV services. As of December 31, 2018, we provided digital cable services to approximately
3.9 million residential subscribers.
In addition to our linear television services, which allow our customers to view television programming at a scheduled time,
our digital cable customers also have access to a broad range of digital interactive services, including Virgin TV On Demand, one
of the most comprehensive digital cable-on-demand services in the U.K., and Virgin TV Go, one of the most comprehensive cloud-
based entertainment services in the U.K., which are described below.
We also offer interactive “red button” applications from the British Broadcasting Corporation (BBC) and other commercial
broadcasters, such as Sky plc (Sky) and BT Group plc (BT). Red button functionality in the U.K. permits television viewers to
press a red button on their remote control handset to receive additional interactive services, including multiple alternative broadcasts.
TiVo and Digital Set-Top Boxes
We offer three advanced digital set-top boxes, which include multiple tuners enabling recording of multiple programs at the
same time. Set-top boxes equipped with digital cable recorders digitally record television programming to a hard disk in real-time,
which also allows customers to play back, pause, fast forward or rewind the program at any point during or for a period after the
broadcast.
Under a strategic partnership agreement, we are the exclusive distributor of the TiVo user interface software for set-top boxes
(subject to certain conditions), which provide converged television and broadband internet capabilities in the U.K. The Virgin
Media TiVo set-top box is available in both 1TB and 500GB sizes, with the 1TB version recording up to 500 hours of television.

I - 7
It brings together television, digital cable-on-demand and OTT services through a single user experience and features unique
content discovery and personalization tools. In late 2016, we launched a new set-top box called the Virgin Media V6 box. This
device combines ultra-high definition 4K video with improved streaming functionalities and more processing power. The Virgin
Media V6 box has eight tuners, allowing viewers to record six programs while watching a seventh they previously recorded. The
TiVo service, combined with the existing digital cable-on-demand service, makes available television shows, movies and children's
programs in addition to supporting web video services such as Netflix, BBC iPlayer and YouTube. As of December 31, 2018, we
had approximately 3.7 million TiVo customers, of which more than 2.1 million are using our latest box.
Virgin TV On Demand
Our digital cable-on-demand service provides our customers with instant access to a wide selection of premium movies,
television programs, music videos and other digital cable-on-demand content including live PPV events. Content is available in
broadcast standard definition (SD), HD and some Ultra-HD/4K. Our HD content is available to all of our digital cable customers
who have an HD box, at no additional charge, however the exact channels available depend on the particular customer's package.
Viewers can watch programs instantly, without the need for buffering, and can freeze-frame, fast-forward and rewind the content
at will. This gives our customers increased control over the content and timing of their television viewing. Additionally, our cable
network enables us to provide digital cable-on-demand content to our customers separately from their high-speed data services,
thereby maintaining their broadband speed.
The primary categories of content available within Virgin TV On Demand are "catch-up" television programming, boxsets,
children's programming and movies (on a PPV and premium subscription basis). A selection of content, including our “catch-up”
television service, is available free of charge to all of our television customers. The BBC iPlayer is the largest catch-up television
service we offer, enabling viewers to view more than 700 hours of BBC programs. Our catch-up television also includes content
from All 4, My5, ITV Hub and other pay TV linear channels.
Subscription Video On Demand
We offer our television customers basic subscription digital cable-on-demand (SVOD) with a selection of content that increases
in number in line with the customer’s digital cable subscription tier.
The offering includes 'Virgin TV Exclusives' which is a selection of TV series that are exclusively available to Virgin TV
customers. The Sky On Demand service allows our customers to access approximately 1,000 hours of television content from
across Sky's range of basic channels, and around 1,000 movie titles being made available to Virgin Media subscribers of Sky
Cinema. Other content providers include ABC Studios, Sony, Viacom, NBCU and A&E Networks. Tailored advertising is also
inserted across many providers within the basic television SVOD and free catch-up services.
Virgin Movies
Our PPV movie service, Virgin Movies, offers hundreds of titles from all the major studios and the majority of independent
distributors, most of which are available for rent on the same day as their DVD release and some the same day as their cinema
release. All our digital cable customers have access to Virgin Movies, which, after purchase, may be viewed multiple times within
a 48-hour window.
Virgin Media Store
Our Electronic Sell-Through (EST) offers television customers and non-customers the opportunity to buy and own movies
(usually available before the DVD release or rental) and TV box sets (including series from HBO and Showtime which were
previously unavailable to Virgin TV customers). After registering online for a Virgin Media Store Account, content can be purchased
and viewed via the Virgin Media Store website. In addition, Virgin TV customers can buy and watch content on their TV via a
Virgin TV box powered by TiVo and can also download to watch offline on a compatible mobile device with our Virgin TV
applications (apps). When purchasing movies, customers are also sent a DVD in the post.

I - 8
Virgin TV Go & Virgin TV Control
In November 2012, we launched Virgin TV Anywhere, one of the U.K.’s most comprehensive internet streaming television
services. The service was relaunched as Virgin TV Go on the Liberty Global-wide Horizon Go platform on December 7, 2017.
Virgin TV Go allows our television customers to stream more than 110 live television channels and watch Virgin TV On Demand
through their web browser or via mobile apps for compatible iOS, Android and Windows devices, anywhere in the U.K., or while
traveling in the E.U. with an internet connection. Since August 2018, Full House TV customers can also download select On
Demand programs to their Android or iOS devices for offline viewing via the Virgin TV Go app.
Our TiVo customers with iOS or Android mobile devices can manage their box remotely with the Virgin TV Control app.
When in the home, these mobile devices can act as a remote control for their boxes. Customers with compatible iOS or Android
devices and a V6 box can also watch selected recordings from their V6 box within the home or download them to their devices
for offline viewing using the Virgin TV Control app.
Virgin TV Go and Virgin TV Control are available at no extra cost to our digital cable customers. Virgin Media subscribers
of Sky Sports or Sky Cinema are able to stream these premium channels online or on iOS and Android mobile devices through
Sky-provided services.
Fixed-line Telephony
We provide local, national and international telephony services to our residential customers over our twisted copper, hybrid
fiber coaxial cable and fiber-to-the-premise (fiber-to-the-home/-cabinet/-building/-node is referred to herein as FTTx) networks.
We also provide telephony services through voice over internet protocol (VoIP) technology, which was launched in late 2016, and
fiber network. We offer a basic line rental service to our cable customers for a fixed monthly fee. In addition, we also offer tiered
bundles of call tariffs, features and services, including calling plans that enable customers to make unlimited national landline
calls and calls to mobile telephones either during specified periods or anytime, for an incremental fixed monthly fee. Our fixed-
line customers can also make calls to mobile customers free of charge and may also subscribe to additional services such as call
waiting, call blocking, call forwarding, three-way calling, advanced voicemail and caller line identification services for an additional
fee. As of December 31, 2018, we provided fixed-line telephony services to approximately 4.6 million residential subscribers.
Mobile
Our mobile communication services are provided using the mobile network owned by EE Limited (EE) through an MVNO
arrangement. In 2017, we moved from a light MVNO to a full MVNO arrangement due to a revised agreement with EE, with this
arrangement expected to be fully implemented by the end of 2020. We offer a broad range of mobile communications products
and services available on 4G and 3G, including mobile data services, voice and short message service (SMS). We also offer a
broad range of handsets, including Android and Apple iOS-based smartphones, and mobile broadband services, which complement
our fixed broadband offering.
Our customers have free access to our Virgin Media WiFi app (available to download from the App Store and Google Play)
which connects them to a footprint of over 3.5 million WiFi hotspots across the U.K., and a further 2.4 million in Europe and the
United States (U.S.).
Our customer base comprises both postpaid customers, who subscribe to our services for periods ranging from a minimum
of 30 days for an airtime contract to up to 36 months for a 'Freestyle' handset purchase agreement, and prepaid customers, who
top up their accounts prior to using the services and have no minimum contracted term. 'Freestyle' mobile contracts provide
customers with the flexibility to purchase a handset independently of an airtime contract.
As of December 31, 2018, we had approximately 3.0 million mobile services customers, of which approximately 2.7 million
were postpaid customers.
We continue to focus on increasing our proportion of higher-value postpaid customers, expanding our range of higher-value
mobile handsets and cross-selling into homes already connected to our cable network.

I - 9
Business
Through the Virgin Media Business brand, we offer a broad portfolio of business-to-business (B2B) voice, data and internet
solutions to small businesses, medium and large enterprises and public sector organizations in the U.K., ranging from analog
telephony to managed data networks and managed communication services. We also provide services to small businesses and
medium enterprise customers using our cable network. B2B peak usage generally occurs at different times of the day from that of
our residential customers, which allows for more efficient use of our network. We provide B2B services to approximately 42,000
U.K. businesses and over 3,000 public sector organizations. We have security accreditations across a range of B2B products and
services in order to increase our offerings to public sector organizations in the U.K. These accreditations are granted subject to
periodic reviews of our policies and procedures by the U.K. governmental authorities. If we were to fail to maintain an accreditation
or to obtain a new one when required, it could impact our ability to provide certain offerings to the public sector.
We offer contractual service levels to all B2B customers and these are supported by U.K.-based regional teams. In addition
to our standard B2B service levels, a tiered B2B service level is available to tailor service requirements based on size of organization,
sector and importance.
Converged Solutions
Converged solutions use a single network to transport voice, data and video, allowing our B2B customers to benefit from cost
synergies. Additionally, we offer services such as internet protocol (IP) virtual private networks, which enable our customers to
prioritize bandwidth for different types of traffic so that more time sensitive data or critical application data is transported with
priority, providing increased flexibility and control over data management. Our extensive network reach also enables us to offer
large or dispersed organizations the ability to effectively link sites across the U.K. using a wide range of access technologies,
supporting services such as voice and video conferencing, instant messaging and file transfers.
Ethernet
Our Ethernet network has approximately 300 Ethernet nodes and is capable of carrying a variety of services and high bandwidth
applications simultaneously. We have been delivering Ethernet services for over 10 years and have achieved both Metro Ethernet
Forum (MEF) 9 and MEF 14 accreditation (becoming the first service provider in the world to renew this accreditation), ensuring
our Ethernet product portfolio can support stringent real-time communications applications, including VoIP and HD-quality
videoconferencing. We offer a range of products from local area network extensions to managed wide area Ethernet networks,
providing our B2B customers with high bandwidth and flexible solutions, including market-leading point to multi-point services.
Applications and Services
As an overlay to network products, we also offer applications, such as video conferencing, and managed services, such as
information security services, designed to increase flexibility and reduce costs for our customers.
Voice and Mobile Services
We offer a comprehensive range of B2B voice products, from analog and digital services to converged IP telephony solutions.
Our B2B voice solutions include basic features such as call divert and voicemail, as well as products such as Centrex, which
provides switchboard-like capability that is managed from our telephone exchange, offering our customers a cost-effective, scalable
alternative to a premises-based system. We also provide similar Centrex features through a number of hosted unified IP-based
solutions, which add additional features such as integrated messaging and video. This combination of mature services being offered
in parallel with a next-generation of converged services allows our customers to carry out phased migrations to new technologies.
In addition, we provide a mobile service to public and private sector B2B customers, providing voice and 3G and 4G data
services as a reseller of EE’s business services. As a result, we now offer our B2B customers a one-supplier solution for both their
fixed-line and mobile telephony needs.

I - 10
Bundled offers for small and medium enterprises (SME) and small office and home office (SOHO) customers
We offer SME and SOHO customers a range of solutions to help them realize their digital potential underpinned by our ultrafast
network. In addition to a range of connectivity products to suit their level of digital requirement, customers can also work with us
to meet their voice communications needs (fixed, mobile and IP) and a range of other needs including security and hardware.
Virgin Media Business offers the U.K.’s fastest, widely available broadband speed for small businesses, a service offering up to
350 Mbps download speed over Virgin Media's own ultrafast network.
Our Network in the U.K.
We deliver voice, video and high-speed data services over our cable access network, which covers parts of many metropolitan
areas in the U.K. The deep-fiber design of our access network enables us to transmit data by means of fiber optic cable from
equipment in technical properties known as “headends” and “hubsites” to widely deployed distribution cabinets. The data is then
transmitted to distribution points via coaxial cable for digital broadband signals and digital television and via twisted copper cables
for fixed-line telephony. The final connection into each home from the fiber access network comprises two components combined
into a single drop cable (twisted copper and coaxial cable). For video and high-speed data services we only use high capacity
coaxial cable, which has considerable spectrum and associated bandwidth capabilities and which concurrently supports a full
portfolio of linear and digital cable-on-demand services as well as high-speed broadband services for both consumers and business
customers. Using DOCSIS 3.0, we currently offer download speeds of up to 350 Mbps for consumers and B2B customers on our
hybrid-fiber-coaxial network. We have also conducted trials of 1 Gbps and 1.5 Gbps downstream speeds. For fixed-line telephony
services, historically we have used the twisted copper pair access network. However, we more recently started to deliver voice
services into the home over the coaxial cable. As a result of the extensive use of fiber in our access networks, we are also able to
provide high-speed data network services to business customers delivering nationwide connectivity.
We believe that our deep-fiber access network has enabled us to take a leading position in the roll-out of next-generation
broadband access technologies in the U.K. In recent years, we completed the upgrade from analog to digital across virtually all of
our hybrid fiber coaxial access network footprint. As of December 31, 2018, virtually all of the homes served by our cable network
could receive all of our broadband, digital television and fixed-line telephony services. We expect to leverage the next generation
of cable technology (DOCSIS 3.1) to increase the data rates that can be transmitted over the coaxial cable that, in turn, allows our
existing infrastructure to support customer download speeds of 1 Gbps and beyond.
During 2015, we initiated the Network Extension. For more information regarding the Network Extension, see “Strategy
and Management Focus - Management’s Discussion and Analysis of Financial Condition and Results of Operations - Overview”.
Competition
We face intense competition from a variety of entertainment and communications service providers, which offer television,
broadband internet, fixed-line telephony and mobile services. In addition, technological advances and product innovations have
increased, and are likely to continue to increase, the number of alternative providers available to our customers and intensify the
competitive environment.
We believe that our deep-fiber access provides us with several competitive advantages in the areas served by our network.
For instance, our cable network allows us to concurrently deliver internet access, together with real-time television and digital
cable-on-demand content at higher speeds. Our competitors are typically reliant on the access infrastructure of the U.K.’s incumbent
telecommunications provider, BT, which typically relies on copper-pair technology from the local exchange to the customer’s
home. BT is upgrading its infrastructure to provide data services capable of higher speeds, using FTTC technology, but service
providers using BT’s existing network are subject to performance constraints as a result of copper based services degrading over
distance which affect data download. Our cable network also offers benefits over the infrastructure of satellite service providers,
which are unable to offer a full array of interactive services in the absence of a fixed-line telephony or broadband connection using
third-party access infrastructure. By contrast, our cable infrastructure allows us to provide “triple-play” bundled services of
broadband internet, television and fixed-line telephony services without relying on a third-party service provider or network. In
serving B2B customers, many aspects of the network can be leveraged at very low incremental cost given that B2B demand peaks
at a time when residential consumer demand is low, and peaks at lower levels than residential consumer demand. As such, we
believe we have an advantage over other providers who serve either residential or B2B customers but not both.

I - 11
We also face intense competition in the mobile retail sector, which is primarily driven by increased pricing pressure from both
established and new service providers, evolving customer needs and technological developments.
We offer most of our products on a stand-alone basis or as part of bundled packages designed to encourage customers to
subscribe to multiple services. We offer television services, broadband internet and fixed-line telephony services to residential
users exclusively in areas served by our cable network. We also offer broadband internet, data services, fixed-line telephony and
mobile telephony and data services to business users throughout the U.K., using both our own network and wholesale inputs from
other providers. Our primary competitors are BT (which now owns and operates mobile operator, EE), Sky (which is now owned
by Comcast), TalkTalk Telecom Group plc (TalkTalk), Vodafone Limited (Vodafone), Hutchison 3G UK Limited (which operates
in the U.K. as "3 UK") and Telefónica UK Limited (which operates in the U.K. as "O2").
Broadband Internet
We have a number of significant competitors in the sector for broadband internet services. Of those competitors, BT Group
(including EE) is the largest retail provider, serving approximately 35% of the total number of broadband internet customers in
the U.K. We serve approximately 20% of the total broadband sector in the U.K.
BT provides broadband internet access services to both its own retail arm and third party retail providers over its own DSL
network. BT has announced its intention to rollout ultrafast speeds of up to 300 Mbps+ by the end of 2020 to up to 5.7 million
premises using G fast technology, a DSL standard applied over the copper local loops. BT has also set out its intention to rollout
an FTTP service supporting 1 Gbps to three million homes and businesses by 2020, with a target to cover 10 million homes by
2025. In pursuit of those objectives, BT has launched a range of ultrafast packages offering speeds of up to 152 Mbps and 314
Mbps, using a combination of G fast and FTTP technology, which are currently available to nearly two million U.K. homes.
Operators such as Sky, TalkTalk and EE deploy their own network access equipment in BT exchanges via a process known
as local loop unbundling (LLU). This allows an operator to reduce the recurring operating costs charged by BT by reducing the
proportion of traffic that must travel directly over BT’s network. LLU deployment requires a substantial capital investment to
implement and requires a large customer base to deliver a return on investment.
In addition to the competition and pricing pressure in the broadband market arising from LLU, we may be subject to increased
competition in the provision of broadband services from mobile broadband and technological developments (such as long-term
evolution, or LTE, and 5G mobile technology) and other wireless technologies, such as WiFi and Worldwide Interoperability for
Microwave Access (Wi-Max). For example, EE and Vodafone's 4G mobile coverage has reached over 99% and 97% of the U.K.
population, respectively.
Television
We are the largest cable television provider in the U.K. in terms of the number of video customers and the sole provider of
video cable services in all of our network area. Our digital television services are available to approximately 50% of U.K. television
households. Our digital television services compete primarily with those of Sky and BT. Sky is the primary pay satellite television
platform in the U.K. and Ireland with approximately 11.7 million subscribers. Sky owns the U.K. rights to SD, HD and 3D versions,
as the case may be, of various sports and movie programming content. Sky is both our principal competitor in the pay-TV market
and an important supplier of basic and premium television content to us.
In August 2013, BT launched its own premium BT Sport channels, providing a range of sports content including football from
the English Premier League and exclusive rights to the UEFA Champions League and the UEFA Europa League. The BT Sport
channels are available over BT’s internet protocol television platform or "IPTV", Sky’s satellite system and our cable network.
BT has also launched a BT Sport Ultra HD channel.
In February 2016, Sky launched its next generation set-top box called Sky-Q, offering greater storage and recording capability,
with access to increased content (including applications) rolled out to over 2.7 million U.K. homes by the end 2018.
Content owners, online aggregators and television channel owners are increasingly using broadband as a new digital distribution
channel direct to consumers. In 2012, a free-to-air internet-connected television service to U.K. homes was launched by YouView,
a joint venture which includes Arqiva, BBC, BT, Channel 4, Channel 5, ITV plc (ITV) and TalkTalk. Consumers are able to

I - 12
purchase a box from retailers or get a free subsidized box as part of a bundled package (television, broadband and telephony) with
providers BT and TalkTalk.
Residential customers may also receive digital terrestrial television (DTT), which is delivered to customer homes through a
conventional television aerial and a separately purchased set-top box or an integrated digital television set. The free-to-air DTT
service in the U.K. is called "Freeview". This service is provided by a consortium of operators, including the BBC.
The BBC and ITV also offer a free-to-air digital satellite alternative to Freeview service, known as "Freesat". Freesat offers
approximately 150 subscription-free television channels, including selected HD channels such as BBC 1 HD, ITV HD and Channel
4 HD. Freesat also offers a range of satellite boxes offering access to catch-up television services under the brand Freetime and a
range of digital video recorders (DVR) under the brand Freesat+.
Residential customers may also access television content by means of IPTV. BT TV, a combined DTT and video on demand
service offered by BT over a DSL broadband connection, is available throughout the U.K. Sky also offers live streamed television
and services over a broadband connection, through its Sky On Demand, Sky Go and NowTV services. In addition, Netflix, Amazon,
Google, Apple and others have launched IPTV products.
The communications industry is constantly evolving and there are a number of new and emerging technologies which can be
used to provide video services that are likely to compete with our digital cable and digital cable-on-demand services. These include
the DSL services mentioned above and next-generation LTE services. We expect continued advances in communications technology
and in content, such as an increasing adoption of ultra-HD.
Fixed-line Telephony
We compete primarily with BT in providing telephony services to residential customers in the U.K. BT occupies an established
position as the former state provider. We also compete with other telecommunications companies that provide telephony services
directly, through LLU, or indirectly. These include TalkTalk and Sky, and mobile telephone operators such as EE, Vodafone and
3 U.K. Our share of the fixed-line telephony market in the U.K. is approximately 14%.
We compete with mobile telephone businesses that offer consumers an alternative to fixed-line telephony services. Mobile
telephony services also contribute to the competitive price pressure on fixed-line telephony services.
In addition, we face competition from companies offering VoIP, services using the customer’s existing broadband, mobile
data and WiFi connections. These services are offered by independent providers, such as WhatsApp and Skype, as well as those
affiliated with established competitors, such as BT. These services generally offer free calls between users of the same service,
but charge for calls made to fixed-line or mobile numbers either on a flat monthly rate for unlimited calls (typically restricted to
geographic areas) or based on usage.
Mobile
In the mobile telephony sector, we face direct competition from mobile network operators (MNOs), such as BT (through its
wholly owned subsidiary, EE), O2, Vodafone and 3 U.K., and other MVNOs, such as Tesco Mobile, Lebara, TalkTalk, Sky and
ASDA. We also compete with fixed-line telephony operators, with companies offering VoIP services, and from the growth in online
communication, as described in “Fixed-line Telephony” above.
EE became the first U.K. MNO to launch 4G in October 2012, following approval from the U.K. Office of Communications
(Ofcom) to use its existing 1800 MHz spectrum. Vodafone, O2 and 3 U.K. launched their 4G services during 2013. We launched
4G services in November 2016. Ofcom completed the auction of additional 2.3 and 3.4 GHz spectrum with all MNOs acquiring
additional spectrum.
Business
The U.K. B2B telecommunications industry is characterized by strong competition and ongoing consolidation. Competition
in the U.K. B2B telecommunications market continues to be value driven, with the key components being quality, reliability and
price.

I - 13
We compete primarily with traditional network operators such as Vodafone UK, which acquired C&W Worldwide in July
2012, and BT. BT represents the main competition nationally due to its network reach and product portfolio. We also compete
with regional providers, such as COLT Telecom Group plc, which have a strong network presence within limited geographic areas.
Recently, we have faced increasing competition from services provided by MNOs which target small B2B customers.
In the retail sector we continue to focus on small, medium and large nationally oriented businesses and public sector
organizations.
Virgin Media Ireland
On February 12, 2015, we acquired a 65% controlling interest in Virgin Media Ireland Ltd. (VM Ireland) and its subsidiaries
from a subsidiary of Liberty Global outside of the Virgin Media borrowing group (the VM Ireland Acquisition). On November
2, 2017, we acquired the remaining 35% non-controlling interest in VM Ireland through the acquisition of VM Ireland Group
Limited (VMIGL), formerly known as LG Ireland Group Limited, from Liberty Global Europe 2 Limited, our immediate parent
(the VM Ireland NCI Acquisition).
VM Ireland is the largest cable television operator in Ireland by number of customers. VM Ireland provides video, broadband
internet and fixed and mobile telephony services in five regional clusters in Ireland, including the cities of Dublin, Cork, Galway
and Limerick to both residential and B2B customers. As of December 31, 2018, VM Ireland provided services to an aggregate of
437,200 customers, comprising one million RGUs (including 271,100 video subscribers, 375,700 broadband internet subscribers
and 352,300 fixed-telephony subscribers) across a footprint of 923,000 Homes Passed. In addition, VM Ireland provided services
to 81,500 mobile subscribers. VM Ireland provides digital and analog cable video services via cable. Its cable network is 96%
upgraded to two-way capability, with 96% of its cable homes served by a network with a bandwidth of at least 750 Mhz. VM
Ireland makes its digital video, broadband internet and fixed-line telephony services available to 99%, 96% and 96%, respectively,
of its Homes Passed. Highlights of VM Ireland include:
• For enhanced video subscribers, different packages ranging to a top tier with 112 video channels and several radio channels,
along with a variety of premium channels, HD programming, a PPV service, an electronic program guide, remote booking
and a DVR service;
• Virgin TV service is offered on Liberty Global’s "Horizon" next-generation set-top box platform, which is a family of
media products that allows customers to view and share content across their television, computer, tablet and smartphone,
and includes the Anywhere TV app and online service;
• Download speeds of up to 360 Mbps for residential customers and up to 500 Mbps for business customers utilizing Euro
DOCSIS 3.0 technology;
• Community WiFi networks have been launched in a number of urban centers with plans to activate this network throughout
our Ireland footprint;
• Digital telephony, via VoIP, with multiple value-added features; and
• A mobile telephony SIM-only service via an MVNO arrangement with Three Ireland (Hutchison) Limited. This service
was launched in October 2015 and is available to all consumers in the Republic of Ireland.
On November 30, 2016, we acquired UTV Ireland, a commercial broadcaster based in Dublin for a purchase price of €12.2
million (£10.3 million at the transaction date). UTV Ireland has been integrated with our existing broadcasting business VMTV
Ireland (formerly known as TV3), and the combined business operates from VMTV Ireland's existing base in Ballymount, Dublin.

I - 14
Regulatory Matters
Overview
Legislative Framework
Our business activities are subject to the laws and regulations of the E.U., the U.K. and Ireland. At an E.U. level, we are
regulated by a variety of legal instruments and policies, collectively referred to as the “Regulatory Framework,” regulating the
establishment and operation of electronic communications networks, including cable television and traditional telephony networks,
and the offer of electronic communications services, such as telephony, internet and, to some degree, television services. The
Regulatory Framework does not generally address issues of content. The Regulatory Framework primarily seeks to open European
markets for communications services and comprises:
• Directive 2002/21 on a common regulatory framework for electronic communications networks and services;
• Directive 2002/20 on the authorization of electronic communications networks and services;
• Directive 2002/19 on access to, and interconnection of, electronic communications networks and associated facilities;
and
• Directive 2002/22 on universal service and users rights relating to electronic communications networks and services.
These Directives are supplemented by E.U. Directive 2002/58, regulating the processing of personal data and the protection
of privacy in the electronic communications sector.
In December 2018, the European Commission adopted a revised version of the Regulatory Framework which includes updates
to reflect changes in the sector and technology (renamed the European Electronic Communications Code, or the “EECC”). This
must be transposed into Member States' national legislation by December 2020. The U.K. government has confirmed that it will
transpose the EECC in full in the event of a Brexit deal. In the event of a 'no deal' Brexit, the U.K. government has indicated that
it will implement parts of the EECC that support the U.K.'s policy objectives. It remains to be seen what implications Brexit, see
Risk Factors - Risks Relating to Our Industry and Our Business, may have on the applicability of these changes, and the Regulatory
Framework in general, to the U.K.
In the U.K., the Regulatory Framework is implemented through (i) the Communications Act 2003 (as amended), which
regulates all forms of communications technology, whether used for telecommunications or broadcasting, and (ii) the Wireless
Telegraphy Act 2006, which regulates radio communications in the U.K. (including spectrum licensing arrangements, usage
conditions and charges, license bidding and trading and enforcement and penalties). In addition, the Privacy and Electronic
Communications Regulations 2003 (as amended) implemented E.U. Directive 2002/58, which regulates the processing of personal
data and the protection of privacy in the electronic communications sector.
We are also subject to regulation under the U.K. Broadcasting Acts 1990 and 1996 and other U.K. statutes and subordinate
legislation, including the Competition Act 1998, the Enterprise Act 2002 and the Enterprise and Regulatory Reform Act 2013.
Ofcom regulates both linear and on-demand programming, with regulatory requirements derived from the Audiovisual Media
Services Directive.
In Ireland, the Regulatory Framework is implemented through (i) the Communications Regulation Act 2002 (as amended)
which regulates electronic communications networks, including cable networks and traditional telephony networks and electronic
communications service providers and (ii) the Wireless Telegraphy Act 1926 (as amended), which regulates radio communications
in Ireland (including with respect to the spectrum, licensing arrangements, usage conditions and charges enforcement and penalties).
The Privacy and Electronic Communications Regulations 2003 (as amended) implemented E.U. Directive 2002/58, regulating the
processing of personal data and the protection of privacy in the electronic communications sector.
We are also subject to regulation under the Broadcasting Act 2009 and other Irish Acts and Statutory Instruments, including
the Competition Acts 2002-2014.

I - 15
U.K. Regulatory Authorities
Ofcom is the key regulatory authority for the communications sector in which we operate in the U.K. It is responsible for
furthering the interests of citizens in relation to communications matters and furthering the interests of consumers by promoting
competition. In particular, Ofcom is responsible for regulating the behavior of providers of electronic communications networks
or services that have "Significant Market Power" in identified markets which may have a harmful influence on competition and
consumers. A provider is deemed to have Significant Market Power if it has a position of economic strength affording it the power
to act independently of competitors and customers within a given market. From April 1, 2017, Ofcom also assumed the
responsibilities of regulating the BBC, a role previously undertaken by the BBC Trust. Ofcom has concurrent powers on competition
matters with the U.K. Competition and Markets Authority (CMA). The CMA was formed in 2014 with its primary duty being the
promotion of competition, both within and outside the U.K. for the benefit of consumers across all sectors.
Irish Regulatory Authorities
The Commission for Communications Regulation (ComReg) is the key regulatory authority for the communications sector
in which we operate in Ireland. It is responsible for furthering the interests of consumers by promoting competition. In particular,
ComReg is responsible for regulating the behavior of providers of electronic communications networks or services that have
Significant Market Power in identified markets which may have a harmful influence on competition and consumers. A provider
is deemed to have Significant Market Power if it has a position of economic strength affording it the power to act independently
of competitors and customers within a given market. In November 2015, ComReg signed a cooperation agreement with the
Competition and Consumer Protection Commission in relation to consumer protection functions of both bodies. The purpose of
the agreement being to ensure greater coordination between these two bodies on consumer related matters, with ComReg now, as
a result, playing a more active role in consumer protection matters in the electronic communications sector. The Broadcasting
Authority of Ireland (BAI) is the key regulatory authority for broadcasting services licensed in Ireland. Further, it has a number
of statutory duties that include oversight of public service broadcasters and the allocation of public funding; stimulating the
provision of high quality, diverse and innovative programming and promoting diversity of control in the commercial and community
sectors. VMTV Ireland, the wholly owned subsidiary of Virgin Media Limited, has broadcasting licenses from the BAI for its
television channels: Virgin Media One, Virgin Media Two and Virgin Media Three.
Broadband Expansion
At the end of 2018, super-fast broadband was available to approximately 95% of the U.K. population. The U.K. government
plans to reach 98% of the population by 2020. To stimulate private investment in this endeavor, the U.K. government is using
money from the publicly funded BBC license fee, under-spend from the Analogue TV Switch-Off Project and other sources of
public investment to subsidize deployment in areas that industry participants would otherwise not reach. The state aid measure
permitting this subsidy was renewed (and amended) in 2016 and is expected, through amendments to its “underspend” provisions,
to result in up to an additional 1% to 2% super-fast coverage.
The U.K. government supports the market rollout of full fiber and 5G services. Such support includes public funding for the
creation of a match-funded “full fiber deployment” fund, business rate relief for the deployment of new full fiber networks and
public funding for a strategic program of full fiber and 5G trials. As a result, the U.K. government's November 2017 budget included
£190.0 million for the first and second phases of its local full fiber deployment fund and £160.0 million for the first phase of the
5G trials. The Telecommunications Infrastructure (Relief from Non-Domestic Rates) Act 2018, which came into force in February
2018, gave effect to the U.K. government's plans to provide full business rate relief for new fiber infrastructure built for the
2017-2022 rating period.
The U.K. government published the outcome of its Future Telecoms Infrastructure Review in July 2018. This explored whether
the conditions for investment in fiber are optimal in the U.K. and what policy changes should be considered to encourage greater
investment in new digital infrastructure. It concluded that, with the right policy support, infrastructure based competition will
deliver FTTP/Gbit capable networks to ~90% of premises. To facilitate this, the government intends to introduce a notification
regime for multi-dwelling unit wayleaves, require new housing developments to have FTTP access and increase consistency in
street work rules. Consultations on the former two were issued in December 2018, with conclusions expected to be published in
the first half of 2019. The government also confirmed its intention to issue a Statement of Strategic Priorities to Ofcom, emphasizing
the importance of promoting investment as the key to achieving the U.K.'s connectivity ambitions.

I - 16
In November 2015, the U.K. government announced that everyone will, by 2020, have a legal right to request a broadband
connection of at least 10 Mbps regardless of where they live. The government intends to achieve this by introducing a broadband
Universal Service Obligation (USO). The USO is aimed, in particular, at addressing the final 5% of the population in the U.K.
without access to a broadband connection of a reasonable speed. The U.K. government introduced legislation in July 2017 via the
Digital Economy Act 2017 to facilitate the introduction of a broadband USO. At the same time, BT made an alternative offer to
invest approximately £600.0 million to provide ubiquitous minimum broadband speeds of 10 Mbps by 2022. The U.K. government
formally rejected BT's proposal in December 2017 favoring the imposition of a regulated USO. On December 5, 2018, Ofcom
published a consultation on its proposed designation of BT and KCOM Group Plc as USO providers and the conditions that should
apply to them. Responses to Ofcom's consultation were due in February 2019 with Ofcom expecting consumers to be able to make
requests for connections from the designated USO providers by the end of 2019. Ofcom also expects to consult on funding
regulations by mid-2019.
The Irish government is investing in a national broadband network which will guarantee the universal availability of high-
speed broadband, with download speeds of up to 30 Mbps and upload speeds of 6 Mbps by 2022.
In line with E.U. State Aid rules, the coverage of the state-funded network will be limited to areas where there is unlikely to
be an overlap between public and private sector investment and therefore is not likely to overlap with our network footprint.
Regulation of Television and Video-on-Demand Services
In the U.K., we are required to hold individual licenses under the Broadcasting Acts 1990 and 1996 for any television channels
(including barker channels) which we own or operate and for the provision of certain other services on our cable television platform,
such as electronic program guides. These television licensable content service (TLCS) licenses are granted and administered by
Ofcom. Under these licenses, each covered service must comply with a number of Ofcom codes, including the Broadcasting Code,
and with all directions issued by Ofcom. Breach of any of the terms of a TLCS license may result in the imposition of fines on the
license holder and, ultimately, the license being revoked.
As a provider of an on-demand program service (ODPS), we must comply with a number of statutory obligations in relation
to “editorial content” and notify Ofcom of our intention to provide an ODPS. Failure to notify Ofcom or comply with the relevant
statutory obligations may result in the imposition of fines or, ultimately, the prohibition on providing an ODPS.
U.K. Government Communications White Paper
In July 2013, the U.K. government published a white paper reviewing U.K. communications legislation. This included a number
of elements such as plans to review the payment arrangements in place between public service broadcasters and pay-television
providers and the prominence of various services in platform providers’ electronic program guides. A resulting consultation seeking
evidence on the balance of payments between television platforms and public service broadcasters was published in March 2015.
That consultation closed in May 2015, with the government publishing its conclusions on July 5, 2016 that there should continue
to be no net payments between all platform operators and the public service broadcasters (with the U.K. government stating that
it may seek to legislate to achieve that outcome, if necessary). Legislative changes were introduced on July 31, 2017 with the
relevant sections of the Digital Economy Act 2017 taking effect, including the repeal of section 73 of the Copyright, Designs and
Patent Act 1988, which had previously provided for a copyright exemption for cable.
Regulation of Electronic Communication Services
In order to operate in the telecommunications sector in the U.K. and Ireland, a provider must comply with general conditions
imposed by each country’s respective national regulator, those being Ofcom and ComReg. These general conditions cover a broad
range of issues including interconnection standards, number portability, deployment of telephone numbers, access to emergency
services and sales and marketing standards. Any breach of these general conditions could lead to the imposition of fines by the
national regulator and, ultimately, to the suspension or revocation of a company’s right to provide electronic communications
networks and services. In 2017, Ofcom commenced an own-initiative investigation into whether our early termination charges on
residential customers who leave before the end of their minimum contract period breach General Condition 9.3 (by disincentivizing
switching) and/or the Consumer Rights Act 2015. On November 16, 2018, Ofcom issued its confirmation decision finding that
Virgin Media had breached General Conditions 9.3 and 9.2(j) and imposed a fine of £7.0 million. Virgin Media appealed Ofcom's
confirmation decision to the Competition Appeal Tribunal.

I - 17
Ofcom and ComReg also undertake triennial reviews of the various economic markets within the telecommunications sector
to establish whether any provider has Significant Market Power warranting the imposition of remedies.
Broadband Services
Ofcom finalized its most recent triennial review of the fixed access markets in 2014 (including wholesale local access
incorporating physical or passive network access via methods such as LLU and duct access) and wholesale broadband access
market (virtual or active network access via methods such as provision of wholesale managed service products). BT was found to
continue to hold Significant Market Power in the wholesale local access market and one sub-national area of the wholesale
broadband access market and is therefore required to provide certain products and services on regulated terms, including providing
access to its ducts and poles infrastructure.
Ofcom imposed a price control on "virtual" access to BT's lower speed (40/10 Mbps) wholesale FTTC product, and maintained
access requirements and pricing controls on its wholesale copper products. Ofcom also required BT to make improvements to the
existing physical infrastructure access product (allowing third parties access to BT's duct and pole estate) to make it more effective.
In Ireland, Eircom Limited (Eir) has been designated as having Significant Market Power in the wholesale broadband access
market (virtual access and bitstream) and the wholesale physical network access market. In November 2018, ComReg published
a decision which has led to a reduction in FTTC-based virtual unbundled access and bitstream prices. Separately, in November
2018, ComReg published an information notice requiring Eir to reduce charges that apply to new FTTH connections and increase
charges that apply to migrating customers. These charges took effect from January 1, 2019, but are currently the subject of a High
Court action by Sky Ireland.
Ofcom Strategic Review of Digital Communications
In March 2015, Ofcom launched a strategic review of U.K. digital communications, with focus areas including investment,
innovation, availability of services and empowering consumers. A key area of consideration was the future regulatory treatment
of BT, in particular whether BT should be fully (structurally) separated, with the Openreach network division becoming a separate,
independent company. Openreach is the operator of the backbone of Britain's formerly State-controlled incumbent broadband
internet network.
Following a statement of intent from Ofcom that it intended to proceed with a formal notification to the European Commission
to require the legal separation of Openreach from BT, it announced in March 2017 that it had reached a voluntary agreement with
BT for the legal separation of Openreach. This meant that Openreach would become a distinct company with its own staff and
management, together with its own strategy and budget and a legal purpose to serve all of its customers equally. Assets would be
controlled by Openreach alone including the physical access network. Under the terms of the voluntary agreement, Openreach
would be obliged to consult formally with customers such as Sky, TalkTalk and Vodafone on large-scale investments. As a result
of reaching a voluntary agreement, Ofcom no longer needed to impose these changes through regulation or seek the approval of
the European Commission. To reach the agreement, the existing Crown Guarantee was maintained in respect of the BT pension
scheme. In addition, Ofcom will release BT from its previous undertakings once its new commitments are fully in place and set
out how compliance with the new arrangements will be measured.
In July 2018, Ofcom published a Strategic Policy Position setting out its intended future approach to regulation from April
2021 (aimed at creating regulatory certainty to support investment in full fiber broadband). It includes an intention to take a more
holistic approach to business and residential markets (ultimately combining previously separate markets) and to consider different
regulatory approaches in different parts of the country, reflecting the varying levels of network competition. In December 2018,
Ofcom published a consultation on its future approach to assessing geographic markets (to apply to the business and broadband
market reviews from April 2021). It proposes to categorize areas of the country as follows: competitive areas, potentially competitive
areas and non-competitive areas. In competitive areas, Ofcom will de-regulate; in potentially competitive areas, Ofcom will apply
an investment friendly approach to regulation; and in non-competitive areas, Ofcom will regulate to protect consumers, while
encouraging investment by Openreach. Ofcom will consult on the suite of potential regulatory remedies that it will apply to the
new holistic approach to market assessment in the spring of 2019.

I - 18
Ofcom Review of Business Connectivity Services
Ofcom concluded its latest review of the U.K. business connectivity markets (leased lines and dedicated business connections,
among others) in the spring of 2016. Ofcom found BT held Significant Market Power in certain markets and proposed consequential
regulatory remedies. These remedies included an obligation on BT to provide access to its dark fiber.
This requirement was overturned on appeal. Ofcom commenced its latest review of these markets in November 2018. This is
a shorter, bridging review, to align the market review cycle with that of the broadband markets (with Ofcom intending to review
the markets holistically from 2021). Ofcom has provisionally found that BT holds Significant Market Power in certain markets
and geographies and has proposed remedies including price caps and a narrower dark fiber obligation (in areas where there is no
infrastructure competition). Ofcom is also proposing to remove restrictions that apply to the existing duct and pole access remedy
related to BT so that it can be used for business circuits exclusively, without needing to be part of a wider (residential grade)
broadband deployment. Ofcom is expected to publish its final conclusions in March 2019.
In Ireland, ComReg’s review of the business connectivity services is ongoing. In a previous leased line market analysis decision
(now called business connectivity market), Eir was found to have Significant Market Power in the market for wholesale terminating
segments of leased lines. Eir remains subject to regulatory obligations in this market, pending the outcome of ComReg’s business
connectivity market review, which is expected in 2019.
Call Origination and Call Transit Services
ComReg completed its review of the wholesale call transit and call origination markets in June 2015. Eir was considered to
have Significant Market Power in the market for call origination and wholesale line rental. However, ComReg deemed that Eir
no longer had Significant Market Power in the market for call transit. On that basis, Eir remains subject to regulatory obligations
in its provision of wholesale call origination and wholesale line rental, but not with respect to its provision of call transit services.
In the U.K., BT is subject to partial regulation of its call origination services. ComReg is in the early stages of a review of these
markets.
Mobile Telephony Services
As an MVNO in Ireland and the U.K., we are subject to E.U. regulations relating to retail prices for roaming services. These
regulations: set limits on certain wholesale and retail tariffs for international mobile voice roaming, SMS tariffs and data roaming
within the E.U.; provide for greater levels of transparency of retail pricing information; impose measures to guard against bill
shock in respect of data roaming; and set maximum roaming rates within the E.U. Effective June 2017, the E.U. abolished roaming
tariffs.
Mobile termination charges applied by MNOs are regulated by Ofcom in the U.K. and ComReg in Ireland under a Significant
Market Power charge control condition. In the U.K., under our MVNO agreement with EE these changes in mobile termination
charges are passed on to us. Ofcom has set mobile termination charges for the period of 2018-2021, with rates reducing slightly
by the end of this period, following a rate reduction by approximately half as compared to the previous period. As a result we have
experienced a reduction in revenue from such charges, with offsetting reductions in cost.
As Virgin Media offers loan financing to certain customers who purchase a mobile handset, we are also regulated by the
Financial Conduct Authority (FCA), which regulates and supervises financial market conduct matters. The FCA has focused
strongly on conduct risk and on customer outcomes and will continue to do so. This has included a focus on the design and operation
of products, the behavior of customers and the operation of markets.
Fixed Telephony Services
Virgin Media has been designated as a provider with Significant Market Power on fixed voice termination. As a result, the
rates it charges other providers for termination on its network are subject to regulation. This requires, among other things, the
provision of termination on fair and reasonable terms, conditions and charges, which must be no higher than BT’s regulated charges,
unless certain conditions are met.
I - 19
Regulation Requiring Co-Operation With Law Enforcement
Telecommunications operators are subject to various laws that can require them to store and disclose customer data to law
enforcement and the security services. In the U.K., these laws are in the process of being updated. A new Investigatory Powers
Act, or “the Act,” came into effect at the end of 2016 with transitional provisions covering most of 2018. In 2018, the Act was
amended to limit the acquisition of data by law enforcement to serious crime, and require data requests to be authorized by an
independent body (the Office of Communications Data Authorization), which is currently being established. In Ireland, there is a
requirement to disclose customer data to law enforcement and the security services under various laws which will be updated in
the near future, although draft bills and/or bills proposing amendments have yet to be published.
Non-Industry Specific Regulation
Our business activities are subject to certain environmental and health and safety laws and regulations. Failure to comply with
these laws and regulations may result in us incurring fines or other penalties and we may incur expenditures to account for these
fines or penalties, maintain compliance and/or undertake any necessary remediation. In addition, any breach of the aforementioned
laws and/or regulations by our affiliates, vendors and/or contractors could result in liability for us.
Legal Proceedings
From time to time, we have become involved in litigation relating to claims arising out of our operations in the normal course
of business. For additional information, see note 16 to our consolidated financial statements included in Part II of this annual
report.
VAT Matters
Our application of value-added taxes (VAT) with respect to certain revenue generating activities has been challenged by the
U.K. tax authorities. We have estimated our maximum exposure in the event of an unfavorable outcome to be £47 million as of
December 31, 2018. No portion of this exposure has been accrued by our company as the likelihood of loss is not considered to
be probable. A court hearing was held at the end of September 2014 in relation to the U.K. tax authorities’ challenge and a decision
is expected in 2019.
On March 19, 2014, the U.K. government announced a change in legislation with respect to the charging of VAT in connection
with prompt payment discounts such as those that we offer to our fixed-line telephony customers. This change, which took effect
on May 1, 2014, impacted our company and some of our competitors. The U.K. tax authority issued a decision in the fourth quarter
of 2015 challenging our application of the prompt payment discount rules prior to the May 1, 2014 change in legislation. We
appealed this decision. As part of the appeal process, we were required to make aggregate payments of £67.0 million, comprising
(i) the challenged amount of £63.7 million (which we paid during the fourth quarter of 2015) and (ii) related interest of £3.3 million
(which we paid during the first quarter of 2016). No provision was recorded by our company at that time as the likelihood of loss
was not considered to be probable. The aggregate amount paid does not include penalties, which could be significant in the event
that penalties were to be assessed. In September 2018, the court rejected our appeal and ruled in favor of the U.K. tax authority.
Accordingly, during the third quarter of 2018, we recorded a provision for litigation of £63.7 million and related interest expense
of £3.3 million in our consolidated statement of operations. During the first quarter of 2019, permission to appeal has been granted
and our grounds for appeal have been submitted to the Upper Tribunal; however, no assurance can be given as to the ultimate
outcome of this matter.
Regulatory Developments
For a description of current regulatory developments in the E.U., the U.K. and Ireland that affect our business, see “Regulatory
Matters” section of this annual report.
Other
Effective April 1, 2017, the rateable value of our existing network and other assets in the U.K. increased significantly. This
increase affects the amount we pay for network infrastructure charges as the annual amount payable to the U.K. government is
calculated by applying a percentage multiplier to the rateable value of assets. This change has and will continue to significantly
increase our network infrastructure charges. As compared to 2018, we expect the aggregate amount of this increase will be £28

I - 20
million in 2019. Beyond 2019, we expect further but declining increases to these charges through the first quarter of 2022. We
continue to believe that these increases are excessive, and retain the right of appeal should more favorable agreements be reached
with other operators. The rateable value of network and other assets constructed under our Network Extension program in the U.K.
remains subject to review by the U.K. government.
In addition to the foregoing items, we have contingent liabilities related to matters arising in the ordinary course of business
including (i) legal proceedings, (ii) issues involving VAT and wage, property, withholding and other tax issues and (iii) disputes
over interconnection, programming and copyright fees. We do not believe any of these litigation matters alone or in the aggregate
will have a material adverse impact on our financial position or results of operations.
Patents, Trademarks, Copyrights and Licenses
We own or have the right to use patents or copyrights which in some cases are, and in other cases may be, of material importance
to our business. We own or have the right to use registered trademarks, which in some cases are, and in others may be, of material
importance to our business. This includes the exclusive right to use the “Virgin” name and logo under licenses from Virgin
Enterprises Limited in connection with our corporate activities and the activities of our consumer and business operations. These
licenses, which expire in April 2036, are exclusive to us within the U.K., Republic of Ireland, the Isle of Man and Channel Islands,
and are subject to renewal on terms to be agreed. They entitle us to use the “Virgin” name for the television, broadband internet,
fixed-line telephony and mobile telephony services we provide to our consumer and business customers, and in connection with
the sale of certain communications equipment, such as set-top boxes and cable modems. That exclusivity includes the use of
“Virgin Media” for the provision of consumer communication services and “Virgin Media Business” for the provision of business
communication services.
Our license agreements provide for an annual royalty of 0.25% of certain consumer, business and content revenues, subject
to a minimum annual royalty. The minimum annual royalty for the license applicable to our consumer operations is £8.5 million.
The minimum annual royalty for the license applicable to our business operations was £1.5 million at the date of the license.
However, an adjustment for inflation has been applied to the minimum annual royalty for our business operations each year on
the anniversary of the commencement date of the license. For the period of 12 months from December 16, 2018, the minimum
annual royalty will be £2.0 million.
Under the license agreements we have worldwide exclusivity in the U.K., Republic of Ireland, the Isle of Man and the Channel
Islands over the name “Virgin Media.” We are also licensed to use the name “Virgin Media Business” for the provision of business
communications services.
Properties
We own and lease administrative facilities, operational network facilities and retail facilities throughout the U.K. and Ireland.
We lease our U.K. headquarters in Hook, Hampshire.
We own or lease the fixed assets necessary for the operation of our businesses, including office space, transponder space,
headend facilities, rights of way, cable television and telecommunications distribution equipment, telecommunications switches
and customer premises equipment (CPE) and other property necessary for our operations. The physical components of our
broadband network require maintenance and periodic upgrades to support the new services and products we introduce. Subject to
these maintenance and upgrade activities, our management believes that our current facilities are suitable and adequate for our
business operations for the foreseeable future.
Employees
As of December 31, 2018, we had approximately 11,600 employees in the U.K. and approximately 1,050 employees in Ireland
including 300 within VMTV Ireland. We also had approximately 650 temporary employees in the U.K. and approximately 110
temporary employees in Ireland including one within VMTV Ireland. There are no employees in the U.K. covered by collective
bargaining or recognition agreements, however, there is collective bargaining in Ireland. For employee consultation purposes, we
work with and recognize our National and Divisional Employee Voice Forums.

I - 21
MANAGEMENT
Tom Mockridge, 62, became our Chief Executive Officer in June 2013. Prior to joining Virgin Media, Mr. Mockridge held
a variety of senior roles at various News Corporation group companies over the span of 22 years. Most recently, Mr. Mockridge
was the CEO of News International from July 2011 until the end of 2012. Prior to his role at News International, Mr. Mockridge
was the Managing Director of News Corporation’s European television operations from 2008 and was subsequently appointed
Deputy Chairman of Sky Deutschland AG’s Supervisory Board and Deputy Chairman of Sky. Prior to this, Mr. Mockridge served
as the first CEO of Sky Italia following its creation through a merger. In his earlier career, Mr. Mockridge held senior roles at
News Corporation companies in Australia and Hong Kong, and began his career as a journalist in his native New Zealand.
Lutz Schüler, 51, was appointed our Chief Operating Officer (COO) in September 2018. Mr. Schüler was Chief Executive
Officer of Unitymedia from January 2011 to August 2018. Mr. Schüler has significant experience in the telecommunications market,
with many years of strategic and operational experience and extensive experience in marketing, sales and operations across a wide
range of products. He has served in several senior management roles with Telefónica Germany since 1998. From 2006 to 2010,
he was Managing Director, Marketing & Sales for Telefónica Germany. Before joining Telefónica Germany in 1998, he worked
as product manager with VIAG Interkom GmbH and T-Mobile. Mr. Schüler studied business administration at the University of
Augsburg and holds a masters degree in business administration.
Robert Dunn, 51, was appointed Chief Financial Officer in June 2013. Mr. Dunn was Managing Director of UPC Netherlands
B.V. from January 2011 to May 2013. Mr. Dunn joined United Pan-Europe Communications NV in May 2000 where he was
Managing Director of Finance and Accounting. In January 2001, he became Chief Financial Officer of UPC Distribution, the cable
television and triple-play division of UPC. Later he became managing director of Finance and Accounting of UPC Polska Sp Zoo
and then served as Managing Director of UPC Ireland B.V. from 2006 to 2010. He earlier served as Group Controller of Impress
Packaging Group B.V. from May 1997 to May 2000. He also worked with Price Waterhouse, London for nine years from October
1988.
Rob Evans, 52, became our Managing Director for Lightning in April 2017. Prior to this, Mr. Evans was Managing Director
of Core Networks & Operations within the Liberty Global T&I organization from January 2016 to February 2017 and Chief
Information, Network and Technology Officer with us from April 2015 to December 2015. Before this, Mr. Evans served as our
Executive Director of Engineering and Supply Chain beginning in 2009. From 2006 to 2009, Mr. Evans was the Vice President
of Network, Data Centres and Global Operations with BP International. Prior to this, he was Vice President of Network Engineering
at Cable & Wireless from 2000 to 2006. Mr. Evans has previously held senior management roles with Schlumberger in the United
States and with Hong Kong Telecom in Hong Kong and Macau.
Tony Hanway, 50, became the Chief Executive Officer of Virgin Media Ireland in October 2015. Prior to joining the Virgin
Media Group, Mr. Hanway held a number of senior roles at O2 Telefonica, including CEO of O2 Ireland from 2011 to 2014. He
also served as Chief Commercial Officer of Telefonica O2 Deutschland and Consumer Director of O2 Czech Republic where he
was responsible for the Consumer team in Fixed and Mobile telephony. Prior to this, Mr. Hanway held senior roles with AOL UK
from 1998 to 2005 where he served as Vice President of Customer Care and Managing Director of AOL Europe Time Warner
Operations Ltd. In his early career Mr. Hanway held positions with AIB Bank (UK) and Gateway Computers.
Jeff Dodds, 44, re-joined Virgin Media as Managing Director-Mobile in May 2017, and is now Chief Customer Officer and
Managing Director. Previously, Mr. Dodds spent almost five years with the company, most recently as Chief Marketing Officer.
Prior to re-joining, Mr. Dodds worked for TalkTalk as Managing Director responsible for Mobile. Before that, he spent two years
living and working in the Netherlands as the CEO of telecoms business Tele2, where he oversaw the build and launch of its 4G
mobile network. Prior to this, Mr. Dodds was the Group Marketing Director for Callaway Golf Europe, and prior to that he worked
at Honda UK.
Mine Hifzi, 51, became our General Counsel in February 2014. Prior to joining us, Ms. Hifzi was Senior Vice President,
Commercial and Legal Affairs, International at Scripps Networks Interactive Inc., which she joined in July 2012. Previously,
Ms. Hifzi served as Senior Vice President and General Counsel, International, of Discovery Communication Inc., where she held
roles for over 13 years. Ms. Hifzi is qualified as a solicitor in England and Wales.

I - 22
Peter Kelly, 54, became the Managing Director for our B2B division in September 2013. Prior to joining Virgin Media,
Mr. Kelly was Enterprise Director at Vodafone UK, where he served from 2008 and was responsible for managing a team of over
1,500 people. Prior to that, Mr. Kelly was President, Enterprise, EMEA at Nortel.
Catherine Lynch, 49, became our Chief People Officer in January 2017. Prior to joining us, Ms. Lynch was the Group Human
Resources Director of financial services company Towergate. Previously, Ms. Lynch was Group Human Resources &
Communications Director at BGL Group, where she served from January 2013 to July 2015. Before this Ms. Lynch served as
Head of Human Resources, Barclaycard Europe & International Human Resources Operations from July 2011 to December 2012.
In addition, Ms. Lynch was Human Resources Director Manufacturing & Integration, where she held a number of senior roles
from 2004 to 2011.
Brigitte Trafford, 52, became our Chief Corporate Affairs Officer in February 2014. Prior to coming to Virgin Media,
Ms. Trafford served as the Director of Corporate Affairs at ICAP plc beginning in 2011. Previously, Ms. Trafford was Group
Communications Director at Lloyds Banking Group, where she served from 2010 to 2011. She also founded a strategic
communications consultancy, Burghley Communications in 2009. In addition, Ms. Trafford was Group Communications Director
and a member of the Management Board of ITV from 2004 to 2007. Ms. Trafford also held senior roles at M: Communications
and Dow Jones & Company, Inc., publishers of The Wall Street Journal.
Alexander Lorenz, 52, became Managing Director, Integration and Operations in August 2017. Mr. Lorenz was Vice
President-Integration and Access for UPC from August 2014 to July 2017. Prior to this, he worked for Kabel Deutschland and his
career has also included positions with Agilent Technologies, Inet Deutschland GmbH, Group3G UMTS GmbH, Viag Interkom
and Siemens AG. Mr. Lorenz will be taking up the role of Chief Technology and Information Officer for UPC Switzerland later
this year.

I - 23
PRINCIPAL SHAREHOLDER
Virgin Media is indirectly wholly-owned by Liberty Global. Liberty Global is an international TV and broadband company
operating under the consumer brands Virgin Media, Unitymedia, Telenet and UPC. Liberty Global invests in the infrastructure
and digital platforms that empower its customers to make the most of the video, internet and communications revolution. Its
substantial scale and commitment to innovation enables it to develop market-leading products delivered through next-generation
networks that, as of December 31, 2018, connected over 21 million customers subscribing to 45 million television, broadband
internet and telephony services. As of December 31, 2018, Liberty Global also served over six million mobile subscribers. In
addition, Liberty Global owns 50% of VodafoneZiggo, a joint venture in the Netherlands.

I - 24
RISK FACTORS
In addition to the information contained in this annual report, you should consider the following risk factors in evaluating our
results of operations, financial condition, business and operations.
The risk factors described in this section have been separated into three groups:
• risks relating to our industry and our business;
• risks relating to our indebtedness, taxes and other financial matters; and
• risks relating to our management, principal shareholder and related parties.
Although we describe below and elsewhere in this annual report the risks we consider to be the most material, there may be
other unknown or unpredictable economic, business, competitive, regulatory or other factors that could have material adverse
effects on our results of operations, financial condition, business or operations in the future. In addition, past financial performance
may not be a reliable indicator of future performance and historical trends should not be used to anticipate results or trends in
future periods.
If any of the events described below were to occur, our businesses, prospects, financial condition, results of operations and/
or cash flows could be materially adversely affected.
Risks Relating to Regulation in Our Industry and Our Business
We operate in increasingly competitive markets, and there is a risk that we will not be able to effectively compete with other
service providers. The markets for cable television, broadband internet, fixed-line telephony and mobile services in which we
operate are highly competitive and, in certain markets, we compete with established companies that hold positions of market power
in these and/or closely related markets. We face competition from these companies, other established companies and potential new
entrants. Technological advances may increase competition or alter the competitive dynamics of markets in which we operate. For
example, we face increasing competition from video services provided by, or over the networks of, the incumbent
telecommunications operator and other service providers. As the availability and speed of broadband internet increases, we also
face competition from OTT video content providers utilizing our or our competitors’ high-speed internet connections. In the
provision of telephony and broadband internet services, we are experiencing increasing competition from the incumbent
telecommunications operators and other service providers in each country in which we operate, as well as mobile providers of
voice and data. In addition, continued consolidation within the media industry may permit more competitors to offer “triple-play”
bundles of digital television, fixed-line telephony and broadband services, or “quad-play” bundles including mobile telephony
services. Developments in the DSL and other technology used by the incumbent telecommunications operators and alternative
providers have improved the attractiveness of our competitors’ products and services and strengthened their competitive position.
Developments in wireless technologies, such as LTE and WiFi, are creating additional competitive challenges.
In order to compete effectively, we may be required to reduce the prices we charge for our services or increase the value of
our services without being able to recoup associated costs. We may also need to pursue legal and regulatory actions. In addition,
some of our competitors offer services that we are unable to offer. We expect the level and intensity of competition to continue to
increase from both existing competitors and new market entrants as a result of changes in the regulatory framework of the industries
in which we operate, advances in technology, the influx of new market entrants and strategic alliances and cooperative relationships
among industry participants. Increased competition could result in increased customer churn, reductions of customer acquisition
rates for some products and services and significant price and promotional competition in our markets. In combination with difficult
economic environments, these competitive pressures could adversely impact our ability to increase or, in certain cases, maintain
the revenue, average revenue per RGU or mobile subscriber, as applicable (ARPU), RGUs, mobile subscribers, operating income
before depreciation and amortization, share-based compensation, related-party fees and allocations, provisions and provision
releases related to significant litigation and impairment, restructuring and other operating items (Segment OCF), Segment OCF
margins (Segment OCF divided by revenue) and liquidity of our operating segments.
The markets in which we compete are subject to rapid and significant changes in technology, and the effect of technological
changes on our businesses cannot be predicted. Technology in the video, telecommunications and data services industries is
changing rapidly, including advances in current technologies and the emergence of new technologies. New technologies, products

I - 25
and services may impact consumer behavior and therefore demand for our products and services. The ability to anticipate changes
in technology and consumer tastes and to develop and introduce new and enhanced products and services on a timely basis will
affect our ability to continue to grow, increase our revenue and number of subscribers and remain competitive. New products and
services, once marketed, may not meet consumer expectations or demand, can be subject to delays in development and may fail
to operate as intended. A lack of market acceptance of new products and services that we may offer, or the development of significant
competitive products or services by others, could have a material adverse impact on our business, financial condition, results of
operations or cash flow.
Our significant property and equipment additions, namely in connection with our Network Extension, may not generate
a positive return. Significant additions to our property and equipment are, or in the future may be, required to add customers to
our networks and to upgrade or expand our broadband communications networks and upgrade CPE to enhance our service offerings
and improve the customer experience. Additions to our property and equipment, which are currently underway, including in
connection with our Network Extension, require significant capital expenditures for equipment and associated labor costs to build
out and/or upgrade our networks as well as for related CPE. Additionally, significant competition, the introduction of new
technologies, the expansion of existing technologies, such as FTTx and advanced DSL technologies, the impact of natural disasters
or adverse regulatory developments could cause us to decide to undertake previously unplanned builds or upgrades of our networks
and CPE.
No assurance can be given that any rebuilds, upgrades or extensions of our network (including the Network Extension) will
increase penetration rates, increase average monthly subscription revenue per average cable RGU or mobile subscriber, as
applicable, or otherwise generate positive returns as anticipated, or that we will have adequate capital available to finance such
rebuilds, upgrades or extensions. Additionally, costs related to our Network Extension and property and equipment additions could
end up being greater than originally anticipated or planned. If this is the case, we may require additional financing sooner than
anticipated or we may have to delay or abandon some or all of our development and expansion plans or otherwise forego market
opportunities. Additional financing may not be available on favorable terms, if at all, and our ability to incur additional debt will
be limited by our debt agreements. If we are unable to, or elect not to, pay for costs associated with adding new customers,
expanding, extending or upgrading our networks or making our other planned or unplanned additions to our property and equipment,
or are delayed in making such investments, our growth could be limited and our competitive position could be harmed.
Adverse economic developments could reduce customer spending for our cable television, broadband, fixed-line telephony
and mobile services and increase churn. Most of our revenue is derived from customers who could be impacted by adverse
economic developments globally, in Europe, the U.K. and Ireland. Ongoing struggles in Europe related to sovereign debt issues,
among other things, has contributed to a challenging economic environment. Accordingly, unfavorable economic conditions may
impact a significant number of our customers and, as a result, it may be (i) more difficult for us to attract new customers, (ii) more
likely that customers will downgrade or disconnect their services and (iii) more difficult for us to maintain ARPU at existing levels.
The countries in which we operate may also seek new or increased revenue sources due to fiscal deficits. Such actions may further
adversely affect our company. Accordingly, our ability to increase, or, in certain cases, maintain, our revenue, ARPUs, RGUs,
Segment OCF, Segment OCF margins and liquidity could be materially adversely affected if the economic environment in Europe,
the U.K. or Ireland remains uncertain or declines (including as a result of the U.K.’s vote to leave the E.U.). We are currently
unable to predict the extent of any of these potential adverse effects. For a description of the risks associated with the U.K.’s vote
to leave the E.U., see “The U.K. referendum advising for the exit of the U.K. from the E.U. could have a material adverse effect
on our business, financial condition or results of operations” below.
Our fixed-line telephony revenue is declining and unlikely to improve. Business and residential fixed-line telephony usage
is declining across the industry. There is a risk that business and residential customers will migrate from using fixed-line telephony
to using other forms of telephony, such as VoIP, or mobile. There is no assurance that our fixed-line customers will migrate to our
mobile phones and they may eventually shift to other providers of mobile telephony services. Such a migration could have a
material adverse effect on our results of operations, revenue and financial condition.
A failure in our network and information systems, whether caused by a natural failure or a security breach, could
significantly disrupt our operations. Certain network and information systems are critical to our business activities. Network and
information systems may be affected by cyber security incidents that can result from deliberate attacks or system failures. These
may include, but are not limited to computer hackings, computer viruses, worms or other destructive or disruptive software, or
other malicious activities against our systems as well as third party sites, which could affect the security of our customers’ accounts.
Cyber security breaches, internal security breaches, physical security breaches or other unauthorized or accidental access to our

I - 26
servers, other information systems or databases could result in tampering with, or the theft or publication of, sensitive business
information or personal consumer information or the deletion or modification of records, or could otherwise cause interruptions
in our operations. Our network and information systems may also be the subject of power outages, fire, natural disasters, terrorist
attacks, war or other similar events. Theft of metals is particularly acute in the U.K. due to high prices for scrap metal, and our
network is not immune to such thefts. Such events could result in a degradation of, or disruption to, our cable and non-cable
services, and could prevent us from billing and collecting revenue due to us or could damage our equipment and data or could
result in damage to our reputation. Disruption to services could result in excessive call volumes to call centers that may not be
able to cope with such volume, which could in turn have a material adverse effect on our reputation and brand. Our plans for
recovery from, and resilience to, such challenges may not be sufficient. The amount and scope of insurance we maintain against
losses resulting from these events may not be sufficient to cover our losses or otherwise adequately compensate us for any disruptions
to our business that may result.
Sustained or repeated failures of our own or third-party systems that interrupt our ability to provide services to our customers,
prevent us from billing and collecting revenue, or that otherwise prevent us from meeting our obligations in a timely manner, could
materially adversely affect our reputation and result in a loss of customers and revenue. These network and information systems-
related events could also require significant expenditures to repair or replace damaged networks or information systems or to
protect them from similar events in the future. Further, any security breaches, such as misappropriation, misuse, penetration by
viruses, worms or other destructive or disruptive software, leakage, falsification or accidental release or loss of information
maintained in our information technology systems and networks or those of our business partners (including customer, personnel
and vendor data) could damage our reputation, result in legal and/or regulatory action against us, and require us to expend significant
capital and other resources to remedy any such security breach. As a result of the increasing awareness concerning the importance
of safeguarding personal information, the potential misuse of such information and legislation that has been adopted or is being
considered regarding the protection, privacy and security of personal information, the liability associated with information-related
risks is increasing, particularly for businesses like ours that handle a large amount of personal customer data. The occurrence of
any such network or information system-related events or security breaches could have a material adverse effect on our business
and results of operations.
Unauthorized access to our network resulting in piracy could result in a loss of revenue. We rely on the integrity of our
technology to ensure that our services are provided only to identifiable paying customers. Increasingly sophisticated means of
illicit piracy of television, broadband and telephony services are continually being developed in response to evolving technologies.
Furthermore, billing and revenue generation for our pay television services rely on the proper functioning of our encryption systems.
While we continue to invest in measures to manage unauthorized access to our networks, any such unauthorized access to our
cable television service could result in a loss of revenue, and any failure to respond to security breaches could raise concerns under
our agreements with content providers, all of which could have a material adverse effect on our business and results of operations.
We depend on third-party suppliers and licensors to supply necessary equipment, software and certain services required
for our businesses. We rely on third-party vendors for the equipment, software and services that we require in order to provide
services to our customers. Our suppliers often conduct business worldwide and their ability to meet our needs is subject to various
risks, including political and economic instability, natural calamities, interruptions in transportation systems, terrorism and labor
issues. As a result, we may not be able to obtain the equipment, software and services required for our businesses on a timely basis
or on satisfactory terms. Any shortfall in CPE could lead to delays in completing extensions to our networks and in connecting
customers to our services and, accordingly, could adversely impact our ability to maintain or increase our RGUs, revenue and cash
flows. Also, if demand exceeds the suppliers’ and licensors’ capacity or if they experience financial difficulties, the ability of our
businesses to provide some services may be materially adversely affected, which in turn could affect our businesses’ ability to
attract and retain customers. Although we actively monitor the creditworthiness of our key third-party suppliers and licensors, the
financial failure of a key third-party supplier or licensor could disrupt our operations and have an adverse impact on our revenue
and cash flows. We rely upon intellectual property that is owned or licensed by us to use various technologies, conduct our operations
and sell our products and services. Legal challenges could be made against our use of our or our licensed intellectual property
rights (such as trademarks, patents and trade secrets) and we may be required to enter into licensing arrangements on unfavorable
terms, incur monetary damages or be enjoined from use of the intellectual property rights in question.
Our mobile services rely on the radio access networks of third-party wireless network providers to carry our mobile
communications traffic. Our services to mobile customers rely on the use of MVNO arrangements in which we utilize the radio
access networks of third-party wireless network providers to carry our mobile communications traffic. If any of our MVNO
arrangements are terminated, or if the respective third-party wireless network provider fails to provide the services required under

I - 27
an MVNO arrangement, or if a third-party wireless network provider fails to deploy and maintain its network, and we are unable
to find a replacement network operator on a timely and commercially reasonable basis or at all, we could be prevented from
continuing the mobile services relying on such MVNO arrangement. Additionally, as our MVNO arrangements come to term, we
may not be able to renegotiate renewal or replacement MVNO arrangements on the same or more favorable terms.
The “Virgin” brand is not under our control and the activities of Virgin Group and other licensees (in other industries)
could have a material adverse effect on the goodwill of customers towards us as a licensee. The “Virgin” brand is integral to our
corporate identity. We are reliant on the general goodwill of consumers towards the Virgin brand. Consequently, adverse publicity
in relation to Virgin Group or its principals, particularly Sir Richard Branson who is closely associated with the brand, or in relation
to another licensee of the “Virgin” name and logo in another industry (particularly in the U.K.) could have a material adverse effect
on our reputation, business and results of operations. In addition, the licenses from Virgin Enterprises Limited can be terminated
in certain circumstances. For example, Virgin Enterprises Limited can terminate the licenses, after providing us with an opportunity
to cure, (i) if we or any of our affiliates commit persistent and material breaches or a flagrant and material breach of the licenses,
(ii) if Virgin Enterprises Limited has reasonable grounds to believe that the use (or lack of use) of the licensed trademarks by us
has been or is likely to result in a long-term and material diminution in the value of the “Virgin” brand or (iii) if a third party who
is not (or one of whose directors is not) a “fit and proper person,” such as a legally disqualified director or a bankrupt entity,
acquires “control” of Liberty Global. Such a termination could have a material adverse effect on our business and results of
operations.
We depend almost exclusively on our relationships with third-party programming providers and broadcasters for
programming content, and a failure to acquire a wide selection of popular programming on acceptable terms could adversely
affect our business. We enter into agreements for the provision of television programs and channels distributed via our entertainment
service with program providers, such as public and commercial broadcasters, or providers of pay or on-demand television and
services. We have historically obtained a significant amount of our premium programming and some of our basic programming
and PPV sporting events from Sky. Sky is also one of our main competitors in the television services business. Sky is a leading
supplier of programming to pay television platforms in the U.K. and is the exclusive supplier of some programming, including its
Sky Sports channels and Sky Cinema channels, which are the most popular premium subscription sports and film channels available
in the U.K.
The Sky Sports channels, Sky Cinema channels and the BT Sport channels are available in our entertainment service, however,
there can be no assurance that we will be able to continue carriage of such channels at a reasonable cost after the current contracts
end.
Other significant programming and app suppliers include the BBC, ITV, Channel 4, UKTV, Viacom Inc. (including Five),
Discovery Communications Inc., Disney, NBC/Universal, Turner, a division of Time Warner Inc. and Netflix. Our dependence on
these and other suppliers for television programming could have a material adverse effect on our ability to provide attractive
programming at a reasonable cost. Additionally, we are frequently negotiating and renegotiating programming agreements and
our annual costs for programming can vary. There can be no assurance that we will be able to renegotiate or renew the terms of
our programming agreements on acceptable terms or at all. We expect that programming and copyright costs will continue to rise
in future periods as a result of (1) higher costs associated with the expansion of our digital video content, including rights associated
with ancillary product offerings and rights that provide for the broadcast of live sporting events, (2) rate increases and (3) growth
in the number of our enhanced video subscribers.
If we are unable to obtain or retain attractively priced competitive content, demand for our existing and future video services
could decrease, thereby limiting our ability to attract new customers, maintain existing customers and/or migrate customers from
lower tier programming to higher tier programming, thereby inhibiting our ability to execute our business plans. Furthermore, we
may be placed at a competitive disadvantage if certain of our competitors obtain exclusive programming rights, particularly with
respect to popular sports and movie programming, and as certain entrants in the OTT market, for example Netflix, Amazon and
even Disney, increasingly produce their own exclusive content.
We do not insure the underground portion of our cable network and various pavement-based electronics associated with
our cable network. Our cable network is one of our key assets. However, we do not insure the underground portion of our cable
network or various pavement-based electronics associated with our cable network. Almost all of our cable network is constructed
underground. As a result, any catastrophe that affects our underground cable network or our pavement-based electronics could

I - 28
prevent us from providing services to our customers and result in substantial uninsured losses that would have a material adverse
effect on our business and results of operations.
We are subject to significant regulation, and changes in U.K. and E.U. laws, regulations, governmental policy affecting
the conduct of our business, or other risks relating to claims, may have a material adverse effect on our ability to set prices,
enter new markets or control our costs. Our principal business activities are regulated and supervised by Ofcom, ComReg and
the CMA, among other regulators. Regulatory change is an ongoing process in the communications sector at both the U.K. and
E.U. level. Changes in laws, regulations or governmental policy affecting our activities and those of our competitors could
significantly influence how we operate our business and introduce new products and services. For example, regulatory changes
relating to our activities and those of our competitors, such as changes relating to third party access to infrastructure, the costs of
interconnection with other networks, our relationships with third-party programming providers and broadcasters, the prices of
competing products and services, or any change in policy allowing more favorable conditions for other operators, could adversely
affect our ability to set prices, enter new markets or control our costs. In particular, Ofcom may attempt to require us to make
available access to our ducts or may attempt to impose regulation on the cable network, which is currently unregulated.
In July 2013, the U.K. government published a white paper reviewing U.K. communications legislation. This included a number
of elements such as plans to review the payment arrangements in place between public service broadcasters and pay-television
providers and the prominence of various services in platform providers’ electronic program guides. A resulting consultation seeking
evidence on the balance of payments between television platforms and public service broadcasters was published in March 2015.
That consultation closed in May 2015, with the government publishing its conclusions on July 5, 2016 that there should continue
to be no net payments between all platform operators and the public service broadcasters (with the U.K. government stating that
it may seek to legislate to achieve that outcome, if necessary). Legislative changes were introduced on July 31, 2017 with the
relevant sections of the Digital Economy Act 2017 taking effect, including the repeal of section 73 of the Copyright, Designs and
Patent Act 1988, which had previously provided for a copyright exemption for cable.
Our ability to introduce new products and services may also be affected if we cannot predict how existing or future laws,
regulations or policies would apply to such products or services. In addition, our business and the industry in which we operate
are subject to investigation by regulators and claims brought by private parties, which could lead to enforcement actions, fines
and penalties or the assertion of private litigation claims and damages. Any such action could harm our reputation and result in
increased costs to the business.
We are also subject to accreditation requirements with respect to certain of our B2B products and services provided to public
sector organizations in the U.K. We have security accreditations across a range of B2B products and services for public sector
organizations in the U.K., which are granted subject to periodic reviews of our policies and procedures by U.K. governmental
entities. If we were to fail to maintain an accreditation or to obtain a new one when required, it could impact our ability to provide
certain offerings to the public sector.
The U.K. referendum advising for the exit of the U.K. from the E.U. could have a material adverse effect on our business,
financial condition, results of operations or liquidity. On June 23, 2016, the U.K. held a referendum in which U.K. citizens voted
in favor of, on an advisory basis, an exit from the E.U. commonly referred to as “Brexit.” Failing the implementation of an agreed
extension, the U.K. will leave the E.U. on March 29, 2019, under a so-called “hard Brexit” or “no-deal Brexit” without agreements
on trade, finance and other key elements. The foregoing has caused considerable uncertainty as to Brexit’s impact on the free
movement of goods, services, people, data and capital between the U.K. and the E.U., customer behavior, economic conditions,
interest rates, currency exchange rates and availability of capital. Examples of the potential impact Brexit could have on our
business, financial condition or results of operations include:
• changes in foreign currency exchange rates and disruptions in the capital markets;
• shortages of labor necessary to conduct our business, including our Network Extension;
• disruption to our supply chain and related increased cost of supplies;
• a weakened U.K. economy resulting in decreased consumer demand for our products and services;

I - 29
• legal uncertainty and potentially divergent national laws and regulations as the U.K. determines which E.U. laws and
directives to replace or replicate, or where previously implemented by enactment of U.K. laws or regulations, to retain,
amend or repeal; and
• various geopolitical forces may impact the global economy and our business, including, for example, other E.U. member
states proposing referendums to, or electing to, exit the E.U.
Risks Relating to Our Indebtedness, Taxes and Other Financial Matters
We have substantial indebtedness that may have a material adverse effect on our available cash flow, our ability to obtain
additional financing if necessary in the future, our flexibility in reacting to competitive and technological changes and our
operations. We have a substantial amount of indebtedness. As of December 31, 2018, the outstanding principal amount of our
consolidated third-party debt, together with our capital lease obligations, aggregated £12,457.6 million, including £1,931.2 million
that is classified as current in our consolidated balance sheet and £9,157.8 million that is not due until 2024 or thereafter.
Our ability to pay principal and interest on or to refinance the outstanding indebtedness depends upon our operating
performance, which will be affected by, among other things, general economic, financial, competitive, regulatory and other factors,
some of which are beyond our control. Moreover, we may not be able to refinance or redeem such debt on commercially reasonable
terms, on terms acceptable to us, or at all.
The level of our indebtedness could have important consequences, including the following:
• a substantial portion of our cash flow from operations will have to be dedicated to the payment of interest and principal
on existing indebtedness, thereby reducing the funds available for other purposes;
• our ability to obtain additional financing in the future for working capital, capital expenditures, product development,
acquisitions or general corporate purposes may be impaired;
• our flexibility in planning for, or reacting to, changes in our business, the competitive environment and the industry in
which we operate, and to technological and other changes may be limited;
• we may be placed at a competitive disadvantage as compared to our competitors that are not as highly leveraged;
• our substantial degree of leverage could make us more vulnerable in the event of a downturn in general economic conditions
or adverse developments in our business; and
• we are exposed to risks inherent in interest rate and foreign exchange rate fluctuations.
Any of these or other consequences or events could have a material adverse effect on our ability to satisfy our debt obligations,
which could adversely affect our business and operations.
We may not be able to fund our debt service obligations in the future. We have significant principal payments that could
require a partial or comprehensive refinancing of our VM Credit Facilities and other debt instruments. Certain tranches of our VM
Credit Facilities have a term of three to nine years. In addition, certain series of our Senior Secured Notes and Senior Notes mature
between 2021 and 2029. See note 8 to our consolidated financial statements included in Part II of this annual report.
Our ability to implement such a refinancing successfully would be significantly dependent on stable debt capital markets. In
addition, we may not achieve or sustain sufficient cash flow in the future for the payment of principal or interest on our indebtedness
when due. Consequently, we may be forced to raise cash or reduce expenses by doing one or more of the following:
• raising additional debt;
• restructuring or refinancing our indebtedness prior to maturity and/or on unfavorable terms;
• selling or disposing of some of our assets, possibly on unfavorable terms;

I - 30
• issuing equity or equity-related instruments that will dilute the equity ownership interest of existing stockholders; or
• foregoing business opportunities, including the introduction of new products and services, acquisitions and joint ventures.
We cannot be sure that any of, or a combination of, the above actions would be sufficient to fund our debt service obligations,
particularly in times of turbulent capital markets.
The covenants under our debt agreements place certain limitations on our ability to finance future operations and how
we manage our business. The agreements that govern our indebtedness contain financial maintenance tests and restrictive covenants
that restrict our ability to incur additional debt and limit the discretion of our management over various business matters. For
example, the financial maintenance tests include leverage ratios, and the restrictive covenants impact our ability to:
• pay dividends or make other distributions, or redeem or repurchase equity interests or subordinated obligations;
• make investments;
• sell assets, including the capital stock of subsidiaries;
• enter into certain sale and leaseback transactions and certain vendor financing arrangements;
• create liens;
• enter into agreements that restrict some of our subsidiaries’ ability to pay dividends, transfer assets or make related-party
loans;
• merge or consolidate or transfer all or substantially all of our assets; and
• enter into certain transactions with affiliates.
These limitations are subject to significant exceptions and qualifications, including the ability to pay dividends, make
investments or to make significant prepayments of shareholder debt. However, these covenants could limit our ability to finance
our future operations and capital needs and our ability to pursue business opportunities and activities that may be in our interest.
In addition, our ability to comply with the provisions of our debt instruments may be affected by events beyond our control.
If we breach any of these covenants, or are unable to comply with the required financial ratios, we may be in default under
our debt instruments. A significant portion of our indebtedness may then become immediately due and payable, and we may not
have sufficient assets to repay amounts due thereunder. In addition, any default under these facilities could lead to an event of
default and acceleration under other debt instruments that contain cross default or cross acceleration provisions, including the
indentures governing the Senior Secured Notes and the Senior Notes.
These restrictions could also materially adversely affect our ability to finance future operations or capital needs or to engage
in other business activities that may be in our best interest. We may also incur other indebtedness in the future that may contain
financial or other covenants more restrictive than those applicable under our current indebtedness.
We are a holding company dependent upon cash flow from subsidiaries to meet our obligations. Virgin Media Inc. and a
number of its subsidiaries are holding companies with no independent operations or significant assets other than investments in
their subsidiaries. Each of these holding companies depends upon the receipt of sufficient funds from its subsidiaries to meet its
obligations.
The terms of our senior credit facility and other indebtedness limit the payment of dividends, loan repayments and other
distributions to or from these companies under certain circumstances. Various agreements governing our debt may restrict and, in
some cases, may also prohibit the ability of these subsidiaries to move cash within their restricted group. Applicable tax laws may
also subject such payments to further taxation.

I - 31
Applicable law may also limit the amounts that some of our subsidiaries will be permitted to pay as dividends or distributions
on their equity interests or as loans, or even prevent such payments.
We are subject to currency and interest rate risks. We are subject to currency exchange rate risks because substantially all
of our revenues and operating expenses are paid in pounds sterling, but we pay interest and principal obligations with respect to
portions of our indebtedness in U.S. dollars and euros. To the extent that the pound sterling declines in value against the U.S. dollar
and the euro (including as a result of Brexit, as discussed below), the effective cost of servicing our U.S. dollar and euro-denominated
debt will be higher. Changes in the exchange rate result in foreign currency gains or losses.
We are also subject to interest rate risks as we have certain interest determined on a variable basis, either through unhedged
variable rate debt or derivative hedging contracts. We also incur costs in U.S. dollars and euros in the ordinary course of our
business, including for CPE and network maintenance services. Any deterioration in the value of the pound sterling relative to the
U.S. dollar or the euro could cause an increase in the effective cost of purchases made in these currencies as only part of these
exposures are hedged.
In July 2017, the U.K. Financial Conduct Authority (the authority that regulates LIBOR) announced that it intends to stop
compelling banks to submit rates for the calculation of LIBOR after 2021. Currently, it is not possible to predict the exact transitional
arrangements for calculating applicable reference rates that may be made in the U.K., the U.S., the Eurozone or elsewhere given
that a number of outcomes are possible, including the cessation of the publication of one or more reference rates. Our loan documents
contain provisions that contemplate alternative calculations of the base rate applicable to our LIBOR-indexed debt to the extent
LIBOR is not available, which alternative calculations we do not anticipate will be materially different from what would have
been calculated under LIBOR. Additionally, no mandatory prepayment or redemption provisions would be triggered under our
loan documents in the event that the LIBOR rate is not available. It is possible, however, that any new reference rate that applies
to our LIBOR-indexed debt could be different than any new reference rate that applies to our LIBOR-indexed derivative instruments.
We anticipate managing this difference and any resulting increased variable-rate exposure through modifications to our debt and/
or derivative instruments, however future market conditions may not allow immediate implementation of desired modifications
and/or the company may incur significant associated costs.
As a result of the June 23, 2016 referendum by British voters to exit the E.U., global markets and foreign currencies have
been adversely impacted. In particular, the value of the pound sterling relative to the U.S. dollar remains at levels that are significantly
below pre-Brexit levels. This volatility in foreign currencies is expected to continue as the U.K. negotiates and executes its exit
from the E.U., which will occur on March 29, 2019. A significantly weaker pound sterling compared to the U.S. dollar could, in
addition to the consequences discussed above, have a significant negative effect on our business, financial condition and results
of operations. For a description of the risks associated with the U.K.’s vote to leave the E.U., see “Risks Relating to Our Industry
and Our Business - The U.K. referendum advising for the exit of the U.K. from the E.U. could have a material adverse effect on
our business, financial condition or results of operations” above.
We are subject to increasing operating costs and inflation risks, which may adversely affect our results of operations. While
our operations attempt to increase our subscription rates to offset increases in programming and operating costs, there is no assurance
that they will be able to do so. Our ability to increase subscription rates is subject to regulatory controls in both the U.K. and
Ireland. Also, our ability to increase subscription rates may be constrained by competitive pressures. Therefore, operating costs
may rise faster than associated revenue, resulting in a material negative impact on our cash flow and net earnings (loss). We are
also impacted by inflationary increases in salaries, wages, benefits and other administrative costs in the U.K. and Ireland.
We are subject to tax in more than one tax jurisdiction and our structure poses various tax risks. We are subject to taxation
in multiple jurisdictions, in particular the U.S., the U.K. and Ireland. Our effective tax rate and tax liability will be affected by a
number of factors in addition to our operating results, including the amount of taxable income in particular jurisdictions, the tax
rates in those jurisdictions, tax treaties between jurisdictions, the manner in which and the extent to which we transfer funds to
and repatriate funds from our subsidiaries, accounting standards and changes in accounting standards, and future changes in the
law. We may incur losses in one jurisdiction that cannot be offset against income earned in a different jurisdiction and so we may
pay income taxes in one jurisdiction for a particular period even though on an overall basis we incur a net loss for that period.
We may have exposure to additional tax liabilities. We are subject to income taxes as well as non-income based taxes, such
as VAT in the U.K., the U.S. and Ireland. In addition, the tax jurisdictions that we operate in have complex and subjective rules
regarding the valuation of intercompany services, cross-border payments between affiliated companies and the related effects on

I - 32
income tax, VAT and transfer tax. Significant judgment is required in determining our worldwide provision for income taxes and
other tax liabilities. In the ordinary course of our business, there are many transactions and calculations where the ultimate tax
determination is uncertain. We are regularly under audit by tax authorities in the jurisdictions in which we operate. Although we
believe that our tax estimates are reasonable, any material differences as a result of final determinations of tax audits or tax disputes
could have an adverse effect on our financial position and results of operations in the period or periods for which determination
is made.
We are subject to changing tax laws, treaties and regulations in and between countries in which we operate, including treaties
between and among the U.K. and the U.S. Also, various income tax proposals in the jurisdictions in which we operate could result
in changes to the existing laws on which our deferred taxes are calculated. A change in these tax laws, treaties or regulations, or
in the interpretation thereof, could result in a materially higher income or non-income tax expense, and any such material changes
could cause a material change in our effective tax rate. In this regard, there have been significant changes or proposed changes to
the tax laws in numerous jurisdictions in which we operate, the impacts of which have been reflected accordingly in our financial
statements.
Adverse changes in our financial outlook may result in negative or unexpected tax consequences which could adversely
affect our net income. Future adverse changes in the underlying profitability and financial outlook of our operations could cause
us to establish a valuation allowance on our deferred tax assets, which could materially and adversely affect our consolidated
balance sheets and statements of operations. A change in this valuation allowance will not result in any change to the amount of
cash payments we make to the tax authorities.
Strategic transactions present many risks, and we may not realize the financial and strategic goals that were contemplated
at the time of any transaction. From time to time we have made acquisitions, dispositions and have entered into other strategic
transactions, such as the VM Ireland Acquisition and the VM Ireland NCI Acquisition. In connection with such transactions, we
may incur unanticipated expenses, fail to realize anticipated benefits and synergies, have difficulty integrating the combined
businesses, disrupt relationships with current and new employees, customers and suppliers, incur significant indebtedness or
experience delays or fail to proceed with announced transactions. These factors could have a material adverse effect on our business
and/or our reputation.
We are exposed to sovereign debt and currency instability risks that could have an adverse impact on our liquidity, financial
condition and cash flows. Our operations are subject to macroeconomic and political risks that are outside of our control. For
example, high levels of sovereign debt, combined with weak growth and high unemployment, could potentially lead to fiscal
reforms (including austerity measures), tax increases, sovereign debt restructurings, currency instability, increased counterparty
credit risk, high levels of volatility and disruptions in the credit and equity markets, as well as other outcomes that might adversely
impact our company. With regard to currency instability issues, concerns exist in the eurozone with respect to individual macro-
fundamentals on a country-by-country basis, as well as with respect to the overall stability of the European monetary union and
the suitability of a single currency to appropriately deal with specific fiscal management and sovereign debt issues in individual
eurozone countries. The realization of these concerns could lead to the exit of one or more countries from the European monetary
union and the re-introduction of individual currencies in these countries, or, in more extreme circumstances, the possible dissolution
of the European monetary union entirely, which could result in the redenomination of a portion or, in the extreme case, all of our
euro-denominated assets, liabilities and cash flows to the new currency of the country in which they originated. This could result
in a mismatch in the currencies of our assets, liabilities and cash flows. Any such mismatch, together with the capital market
disruption that would likely accompany any such redenomination event, could have a material adverse impact on our liquidity and
financial condition. Furthermore, any redenomination event would likely be accompanied by significant economic dislocation,
particularly within the eurozone countries, which in turn could have an adverse impact on demand for our products and services,
and accordingly, on our revenue and cash flows. Moreover, any changes from euro to non-euro currencies within the countries in
which we operate would require us to modify our billing and other financial systems. No assurance can be given that any required
modifications could be made within a time frame that would allow us to timely bill our customers or prepare and file required
financial reports. In light of the significant exposure that we have to the euro through our euro-denominated borrowings, derivative
instruments, cash balances and cash flows, a redenomination event could have a material adverse impact on our company.
We are exposed to the risk of default by the counterparties to our derivative and other financial instruments, undrawn debt
facilities and cash investments. Although we seek to manage the credit risks associated with our derivative and other financial
instruments, cash investments and undrawn debt facilities, we are exposed to the risk that our counterparties will default on their
obligations to us. While we regularly review our credit exposures and currently have no specific concerns about the creditworthiness

I - 33
of any counterparty for which we have material credit risk exposures, we cannot rule out the possibility that one or more of our
counterparties could fail or otherwise be unable to meet its obligations to us. Any such instance of default or failure could have
an adverse effect on our cash flows, results of operations, financial condition and/or liquidity. In this regard, (i) we may incur
losses to the extent that we are unable to recover debts owed to us, including cash deposited and the value of financial losses, (ii)
we may incur significant costs to recover amounts owed to us, and such recovery may take a long period of time or may not be
possible at all, (iii) our derivative liabilities may be accelerated by the default of our counterparty, (iv) we may be exposed to
financial risks as a result of the termination of affected derivative contracts, and it may be costly or impossible to replace such
contracts or otherwise mitigate such risks, (v) amounts available under committed credit facilities may be reduced and (vi) disruption
to the credit markets could adversely impact our ability to access debt financing on favorable terms, or at all.
At December 31, 2018, our exposure to counterparty credit risk included (i) derivative assets with an aggregate fair value of
£360.2 million, (ii) cash and cash equivalent and restricted cash balances of £24.4 million and (iii) aggregate undrawn debt facilities
of £675.0 million. For more information on our derivative contracts, see note 5 to our consolidated financial statements included
in Part II of this annual report.
Risks Relating to Our Management, Principal Shareholder and Related Parties
The loss of certain key personnel could harm our business. We have experienced employees at both the corporate and
operational levels who possess substantial knowledge of our business and operations. There can be no assurance that we will be
successful in retaining the services of these employees or that we would be successful in hiring and training suitable replacements
without undue costs or delays. As a result, the loss of any of these key employees could cause significant disruptions in our business
operations, which could materially adversely affect our results of operations.
The interests of Liberty Global, our indirect parent company, may conflict with our interests. Liberty Global is our parent,
indirectly owning all of the voting interests in us. When business opportunities, or risks and risk allocation arise, the interests of
Liberty Global (or other Liberty Global controlled entities) may be different from, or in conflict with, our interests on a stand-
alone basis. Because we are indirectly controlled by the parent entity, Liberty Global may allocate certain or all of its risks to us
and there can be no assurance that Liberty Global will permit us to pursue certain business opportunities.

II - 1
Independent Auditors’ Report
The Board of Directors
Virgin Media, Inc.:
Report on the Financial Statements
We have audited the accompanying consolidated financial statements of Virgin Media Inc. and its subsidiaries, which comprise
the consolidated balance sheets as of December 31, 2018 and 2017, and the related consolidated statements of operations,
comprehensive loss, owner’s equity, and cash flows for each of the years in the three-year period ended December 31, 2018, and
the related notes to the consolidated financial statements.
Management’s Responsibility for the Financial Statements
Management is responsible for the preparation and fair presentation of these consolidated financial statements in accordance with
U.S. generally accepted accounting principles; this includes the design, implementation, and maintenance of internal control
relevant to the preparation and fair presentation of consolidated financial statements that are free from material misstatement,
whether due to fraud or error.
Auditors’ Responsibility
Our responsibility is to express an opinion on these consolidated financial statements based on our audits. We conducted our audits
in accordance with auditing standards generally accepted in the United States of America. Those standards require that we plan
and perform the audit to obtain reasonable assurance about whether the consolidated financial statements are free from material
misstatement.
An audit involves performing procedures to obtain audit evidence about the amounts and disclosures in the consolidated financial
statements. The procedures selected depend on the auditors’ judgment, including the assessment of the risks of material misstatement
of the consolidated financial statements, whether due to fraud or error. In making those risk assessments, the auditor considers
internal control relevant to the entity’s preparation and fair presentation of the consolidated financial statements in order to design
audit procedures that are appropriate in the circumstances, but not for the purpose of expressing an opinion on the effectiveness
of the entity’s internal control. Accordingly, we express no such opinion. An audit also includes evaluating the appropriateness of
accounting policies used and the reasonableness of significant accounting estimates made by management, as well as evaluating
the overall presentation of the consolidated financial statements.
We believe that the audit evidence we have obtained is sufficient and appropriate to provide a basis for our audit opinion.
Opinion
In our opinion, the consolidated financial statements referred to above present fairly, in all material respects, the financial position
of Virgin Media Inc. and its subsidiaries as of December 31, 2018 and 2017, and the results of their operations and their cash flows
for each of the years in the three-year period ended December 31, 2018 in accordance with U.S. generally accepted accounting
principles.
The impact of uncertainties due to the U.K. exiting the European Union on our audit
Uncertainties related to the effects of Brexit are relevant to understanding our audit of the financial statements. All audits assess
and challenge the reasonableness of estimates made by the directors, such as recoverability of goodwill and related disclosures
and the appropriateness of the going concern basis of preparation of the financial statements. All of these depend on assessments
of the future economic environment and the company’s future prospects and performance.
Brexit is one of the most significant economic events for the U.K., and at the date of this report its effects are subject to unprecedented
levels of uncertainty of outcomes, with the full range of possible effects unknown. We applied a standardized firm-wide approach
in response to that uncertainty when assessing the company’s future prospects and performance. However, no audit should be
expected to predict the unknowable factors or all possible future implications for a company and this is particularly the case in
relation to Brexit.

II - 2
The purpose of our audit work and to whom we owe our responsibilities
This report is made solely to the Board of Directors of Virgin Media Inc., as a body, in accordance with the terms of our engagement.
Our audit work has been undertaken so that we might state to the Board of Directors of Virgin Media Inc. those matters we are
required to state to them in our auditors’ report and for no other purpose. To the fullest extent permitted by law, we do not accept
or assume responsibility to anyone other than the Board of Directors of Virgin Media Inc., as a body, for our audit work, for this
report, or for the opinions we have formed.
/s/ KPMG LLP
London, England
March 15, 2019

The accompanying notes are an integral part of these consolidated financial statements.
II - 3
VIRGIN MEDIA INC.
CONSOLIDATED BALANCE SHEETS
December 31,
2018 2017
in millions
ASSETS
Current assets:
Cash and cash equivalents ....................................................................................................... £ 16.8 £ 23.8
Trade receivables, net .............................................................................................................. 604.7 574.9
Related-party receivables (note 12) ......................................................................................... 47.1 90.2
Derivative instruments (notes 5 and 12) .................................................................................. 143.1 226.9
Prepaid expenses (note 12) ...................................................................................................... 64.3 48.2
Other current assets (note 4) .................................................................................................... 138.9 104.4
Total current assets ................................................................................................................ 1,014.9 1,068.4
Property and equipment, net (note 7) ......................................................................................... 6,272.2 6,207.6
Goodwill (note 7) ....................................................................................................................... 6,018.4 6,014.6
Deferred income taxes (note 9) .................................................................................................. 1,453.5 1,432.4
Related-party notes receivable (note 12).................................................................................... 4,863.6 5,065.9
Other assets, net (notes 4, 5, 7, 9 and 14)................................................................................... 1,532.0 1,621.0
Total assets .......................................................................................................................... £ 21,154.6 £ 21,409.9

The accompanying notes are an integral part of these consolidated financial statements.
II - 4
VIRGIN MEDIA INC.
CONSOLIDATED BALANCE SHEETS — (Continued)
December 31,
2018 2017
in millions
LIABILITIES AND OWNER'S EQUITY
Current liabilities:
Accounts payable (note 12) ..................................................................................................... £ 410.6 £ 385.4
Deferred revenue (note 4) ........................................................................................................ 369.4 377.4
Current portion of debt and capital lease obligations (note 8)................................................. 1,931.2 1,845.1
Accrued interest ....................................................................................................................... 197.8 185.1
Accrued capital expenditures (note 12) ................................................................................... 146.8 194.1
Other current liabilities (notes 4, 5, 12 and 13) ....................................................................... 577.7 488.6
Total current liabilities........................................................................................................... 3,633.5 3,475.7
Long-term debt and capital lease obligations (notes 8 and 12).................................................. 10,609.2 10,953.4
Other long-term liabilities (notes 4, 5, 9, 13 and 14) ................................................................. 370.8 489.6
Total liabilities..................................................................................................................... 14,613.5 14,918.7
Commitments and contingent liabilities (notes 5, 8, 9, 13, 14 and 16)
Owner's Equity:
Additional paid-in capital ........................................................................................................ 7,818.9 7,787.5
Accumulated deficit ................................................................................................................. (1,367.0) (1,362.8)
Accumulated other comprehensive earnings, net of taxes....................................................... 89.2 66.5
Total owner's equity............................................................................................................... 6,541.1 6,491.2
Total liabilities and owner's equity................................................................................. £ 21,154.6 £ 21,409.9

The accompanying notes are an integral part of these consolidated financial statements.
II - 5
VIRGIN MEDIA INC.
CONSOLIDATED STATEMENTS OF OPERATIONS
Year ended December 31,
2018 2017 2016
in millions
Revenue (note 17) .................................................................................................. £ 5,150.3 £ 4,963.2 £ 4,806.1
Operating costs and expenses (exclusive of depreciation and amortization,shown separately below):
Programming and other direct costs of services (note 12)................................ 1,574.2 1,449.8 1,436.1
Other operating (note 12) .................................................................................. 657.0 639.4 600.7
Selling, general and administrative (SG&A) (notes 11 and 12) ....................... 655.2 661.0 639.6
Related-party fees and allocations, net (note 12) .............................................. 156.9 140.7 110.9
Depreciation and amortization .......................................................................... 1,798.2 1,808.2 1,650.8
Impairment, restructuring and other operating items, net (note 13) ................. 101.9 57.5 26.4
4,943.4 4,756.6 4,464.5
Operating income............................................................................................ 206.9 206.6 341.6
Non-operating income (expense):
Interest expense (note 12) ................................................................................. (655.1) (615.8) (587.8)
Interest income – related-party (note 12) .......................................................... 314.1 329.9 289.6
Realized and unrealized gains (losses) on derivative instruments, net(notes 5 and 12) ............................................................................................. 471.3 (527.4) 665.8
Foreign currency transaction gains (losses), net ............................................... (364.0) 566.2 (950.2)
Losses on debt modification and extinguishment, net (note 8)......................... (28.8) (52.4) (62.9)
Realized and unrealized gains (losses) due to changes in fair values of certain debt, net (note 8) ................................................................................ 0.8 (25.5) (4.5)
Other income, net .............................................................................................. 10.4 10.0 9.0
(251.3) (315.0) (641.0)
Loss before income taxes................................................................................ (44.4) (108.4) (299.4)
Income tax benefit (note 9) .................................................................................... 7.4 21.5 13.8
Net loss ......................................................................................................... £ (37.0) £ (86.9) £ (285.6)

The accompanying notes are an integral part of these consolidated financial statements.
II - 6
VIRGIN MEDIA INC.
CONSOLIDATED STATEMENTS OF COMPREHENSIVE LOSS
Year ended December 31,
2018 2017 2016
in millions
Net loss................................................................................................................... £ (37.0) £ (86.9) £ (285.6)
Other comprehensive earnings (loss), net of taxes (note 15):
Foreign currency translation adjustments............................................................ 25.1 (24.8) (2.9)
Pension-related adjustments and other (notes 5 and 14) ..................................... (2.4) 4.8 (6.3)
Other comprehensive earnings (loss) ............................................................... 22.7 (20.0) (9.2)
Comprehensive loss ....................................................................................... £ (14.3) £ (106.9) £ (294.8)

The accompanying notes are an integral part of these consolidated financial statements.
II - 7
VIRGIN MEDIA INC.
CONSOLIDATED STATEMENTS OF OWNER'S EQUITY
Additionalpaid-incapital
Accumulateddeficit
Accumulatedother
comprehensiveearnings,
net of taxesTotal owner's
equity
in millions
Balance at January 1, 2016 .................................................. £ 8,366.4 £ (1,002.7) £ 95.7 £ 7,459.4
Net loss .............................................................................. — (285.6) — (285.6)
Other comprehensive loss, net of taxes (note 15).............. — — (9.2) (9.2)
Share-based compensation (note 11)................................. 29.1 — — 29.1
Tax losses surrendered by Liberty Global subsidiaries(notes 9 and 12).............................................................. 24.8 — — 24.8
Capital charge in connection with the exercise of share-based incentive awards (note 12)................................... (19.8) — — (19.8)
Deemed contribution of technology-related services(note 12) ......................................................................... 3.8 — — 3.8
Other .................................................................................. 1.2 — — 1.2
Balance at December 31, 2016 ............................................ £ 8,405.5 £ (1,288.3) £ 86.5 £ 7,203.7

The accompanying notes are an integral part of these consolidated financial statements.
II - 8
VIRGIN MEDIA INC.
CONSOLIDATED STATEMENTS OF OWNER'S EQUITY — (Continued)
Additionalpaid-incapital
Accumulateddeficit
Accumulatedother
comprehensiveearnings,
net of taxesTotal owner's
equity
in millions
Balance at January 1, 2017, before effect of accountingchange............................................................................... £ 8,405.5 £ (1,288.3) £ 86.5 £ 7,203.7
Accounting change (note 2)............................................... — 12.4 — 12.4
Balance at January 1, 2017, as adjusted for accountingchange............................................................................... 8,405.5 (1,275.9) 86.5 7,216.1
Net loss .............................................................................. — (86.9) — (86.9)
Other comprehensive loss, net of taxes (note 15).............. — — (20.0) (20.0)
Conversion of a related-party loan receivable and relatedaccrued interest to equity (note 12)................................ (317.9) — — (317.9)
Consideration paid in connection with the VM IrelandNCI Acquisition (note 1)................................................ (268.2) — — (268.2)
Tax losses surrendered to Liberty Global subsidiaries(notes 9 and 12).............................................................. (32.3) — — (32.3)
Capital charge in connection with the exercise of share-based incentive awards (note 12)................................... (21.3) — — (21.3)
Share-based compensation (note 11)................................. 19.7 — — 19.7
Deemed contribution of technology-related services(note 12) ......................................................................... 1.4 — — 1.4
Other .................................................................................. 0.6 — — 0.6
Balance at December 31, 2017 ............................................ £ 7,787.5 £ (1,362.8) £ 66.5 £ 6,491.2

The accompanying notes are an integral part of these consolidated financial statements.
II - 9
VIRGIN MEDIA INC.
CONSOLIDATED STATEMENTS OF OWNER'S EQUITY — (Continued)
Additionalpaid-incapital
Accumulateddeficit
Accumulatedother
comprehensiveearnings,
net of taxesTotal owner's
equity
in millions
Balance at January 1, 2018, before effect of accountingchange............................................................................... £ 7,787.5 £ (1,362.8) £ 66.5 £ 6,491.2
Accounting change (note 2)............................................... — 32.8 — 32.8
Balance at January 1, 2018, as adjusted for accountingchange............................................................................... 7,787.5 (1,330.0) 66.5 6,524.0
Net loss .............................................................................. — (37.0) — (37.0)
Other comprehensive earnings, net of taxes (note 15) ...... — — 22.7 22.7
Share-based compensation (note 11) ................................. 21.5 — — 21.5
Tax losses surrendered by Liberty Global subsidiaries(notes 9 and 12).............................................................. 17.4 — — 17.4
Capital charge in connection with the exercise of share-based incentive awards (note 12)................................... (8.1) — — (8.1)
Other .................................................................................. 0.6 — — 0.6
Balance at December 31, 2018 ............................................ £ 7,818.9 £ (1,367.0) £ 89.2 £ 6,541.1

The accompanying notes are an integral part of these consolidated financial statements.
II - 10
VIRGIN MEDIA INC.
CONSOLIDATED STATEMENTS OF CASH FLOWS
Year ended December 31,
2018 2017 2016
in millions
Cash flows from operating activities:
Net loss ................................................................................................................ £ (37.0) £ (86.9) £ (285.6)
Adjustments to reconcile net loss to net cash provided by operating activities:
Share-based compensation expense .................................................................. 28.7 22.0 31.0
Related-party fees and allocations, net.............................................................. 156.9 140.7 110.9
Depreciation and amortization .......................................................................... 1,798.2 1,808.2 1,650.8
Impairment, restructuring and other operating items, net ................................. 101.9 57.5 26.4
Amortization of deferred financing costs and non-cash interest....................... 16.1 16.8 10.7
Realized and unrealized losses (gains) on derivative instruments, net ............. (471.3) 527.4 (665.8)
Foreign currency transaction losses (gains), net ............................................... 364.0 (566.2) 950.2
Losses on debt modification and extinguishment, net ...................................... 28.8 52.4 62.9
Realized and unrealized losses (gains) due to changes in fair values of certain debt, net ............................................................................................. (0.8) 25.5 4.5
Deferred income tax benefit.............................................................................. (12.7) (17.8) (15.3)
Changes in operating assets and liabilities, net of the effect of acquisitionsand dispositions:
Receivables and other operating assets........................................................... 51.1 (116.1) (53.0)
Payables and accruals ..................................................................................... 178.1 150.3 (21.3)
Net cash provided by operating activities ................................................... 2,202.0 2,013.8 1,806.4
Cash flows from investing activities:
Capital expenditures ............................................................................................ (431.8) (523.3) (559.7)
Repayments from (advances to) related parties, net............................................ 89.2 (852.5) (1,416.7)
Cash paid in connection with acquisitions, net of cash acquired ........................ (3.0) 0.1 (34.1)
Other investing activities, net .............................................................................. 3.4 3.6 0.7
Net cash used by investing activities .......................................................... £ (342.2) £ (1,372.1) £ (2,009.8)

The accompanying notes are an integral part of these consolidated financial statements.
II - 11
VIRGIN MEDIA INC.
CONSOLIDATED STATEMENTS OF CASH FLOWS — (Continued)
Year ended December 31,
2018 2017 2016
in millions
Cash flows from financing activities:
Repayments and repurchases of third-party debt and capital leaseobligations ..................................................................................................... £ (4,045.9) £ (3,376.0) £ (5,428.0)
Borrowings of third-party debt ......................................................................... 2,126.8 3,143.5 5,686.2
Net repayments of related-party debt ............................................................... (0.4) (257.1) (26.3)
Payment of financing costs and debt premiums ............................................... (28.0) (59.6) (53.0)
Net cash received (paid) related to derivative instruments............................... 74.6 (0.4) 30.4
Other financing activities, net........................................................................... 13.0 (90.6) (6.0)
Net cash provided (used) by financing activities......................................... (1,859.9) (640.2) 203.3
Effect of exchange rate changes on cash and cash equivalents and restrictedcash .................................................................................................................... (0.7) 0.5 3.1
Net increase (decrease) in cash and cash equivalents and restrictedcash ........................................................................................................ (0.8) 2.0 3.0
Cash and cash equivalents and restricted cash:
Beginning of period ..................................................................................... 25.2 23.2 20.2
End of period................................................................................................ £ 24.4 £ 25.2 £ 23.2
Cash paid for interest............................................................................................. £ 635.3 £ 603.7 £ 590.8
Net cash paid for taxes .......................................................................................... £ 3.0 £ 0.4 £ 6.3
Reconciliation of end of period cash and cash equivalents and restricted cash:
Cash and cash equivalents................................................................................... £ 16.8 £ 23.8 £ 22.1
Restricted cash included in other current assets and other assets, net ................ 7.6 1.4 1.1
Total cash and cash equivalents and restricted cash ......................................... £ 24.4 £ 25.2 £ 23.2

VIRGIN MEDIA INC.
Notes to Consolidated Financial Statements
December 31, 2018, 2017 and 2016
II - 12
(1) Basis of Presentation
General
Virgin Media Inc. (Virgin Media) is a provider of video, broadband internet, fixed-line telephony and mobile services to
consumers and businesses in the United Kingdom (U.K.) and Ireland. In these notes, the terms “we,” “our,” “our company” and
“us” may refer, as the context requires, to Virgin Media or collectively to Virgin Media and its subsidiaries.
On November 2, 2017, we acquired the remaining 35.0% non-controlling interest in Virgin Media Ireland Ltd. (VM Ireland)
from a subsidiary of Liberty Global plc (Liberty Global) outside of Virgin Media through the acquisition of VM Ireland Group
Limited (VMIGL), formerly known as LG Ireland Group Limited (the VM Ireland NCI Acquisition). We accounted for this
transaction as common control transfer at carryover basis and give effect to this transaction for all periods presented. In connection
with the VM Ireland NCI Acquisition, we acquired the remaining 35.0% of VM Ireland for total consideration of £268.2 million
through the creation of a related-party loan from Liberty Global Europe 2 Limited (LG Europe 2), our immediate parent. This
related-party loan, including accrued interest of £0.3 million, was subsequently cash settled during the fourth quarter of 2017.
During the fourth quarter of 2018, in connection with certain Liberty Global reorganizations, we completed the transfer of
Liberty Property Co I Ltd. and Liberty Property Co II Ltd. from our company to Liberty Property Holdco III Ltd. (Liberty Property
Holdco III), another subsidiary of Liberty Global outside of Virgin Media (the VM Property Transfers). Liberty Property Co I
Ltd., Liberty Property Co II Ltd. and Liberty Property Holdco III are collectively referred to as "the Liberty Property Companies".
The assets held by the Liberty Property Companies are used by Virgin Media and its subsidiaries creating a variable interest in the
Liberty Property Companies for which we are the primary beneficiary and, accordingly, Virgin Media is required to consolidate
the Liberty Property Companies.
Unless otherwise indicated, convenience translations into pound sterling are calculated as of December 31, 2018.
These consolidated financial statements reflect our consideration of the accounting and disclosure implications of subsequent
events through March 15, 2019, the date of issuance.
(2) Accounting Changes and Recent Accounting Pronouncements
Accounting Changes
ASU 2014-09
In May 2014, the Financial Accounting Standards Board (FASB) issued Accounting Standards Update (ASU) No. 2014-09,
Revenue from Contracts with Customers (ASU 2014-09), which requires an entity to recognize the amount of revenue to which
it expects to be entitled for the transfer of goods or services to customers. We adopted ASU 2014-09 effective January 1, 2018 by
recording the cumulative effect of the adoption to our accumulated deficit. We applied the new standard to contracts that were not
complete at January 1, 2018. The comparative information for the years ended December 31, 2017 and 2016 contained within
these consolidated financial statements and notes has not been restated and continues to be reported under the accounting standards
in effect for such periods. The implementation of ASU 2014-09 did not have a material impact on our consolidated financial
statements.
The principal impacts of ASU 2014-09 on our revenue recognition policies relate to our accounting for (i) time-limited discounts
and free service periods provided to our customers and (ii) certain upfront fees charged to our customers, as follows:
• When we enter into contracts to provide services to our customers, we often provide time-limited discounts or free service
periods. Under previous accounting rules, we recognized revenue, net of discounts, during the promotional periods and
did not recognize any revenue during free service periods. Under ASU 2014-09, revenue recognition for those contracts
that contain substantive termination penalties is recognized uniformly over the contractual period. For contracts that do
not have substantive termination penalties, we continue to record the impacts of partial or full discounts during the
applicable promotional periods.

VIRGIN MEDIA INC.
Notes to Consolidated Financial Statements — (Continued)
December 31, 2018, 2017 and 2016
II - 13
• When we enter into contracts to provide services to our customers, we often charge installation or other upfront fees. Under
previous accounting rules, installation fees related to services provided over our cable networks were recognized as
revenue during the period in which the installation occurred to the extent these fees were equal to or less than direct selling
costs. Under ASU 2014-09, these fees are generally deferred and recognized as revenue over the contractual period, or
longer if the upfront fee results in a material renewal right.
ASU 2014-09 also impacted our accounting for certain upfront costs directly associated with obtaining and fulfilling customer
contracts. Under our previous policy, these costs were expensed as incurred unless the costs were in the scope of another accounting
topic that allowed for capitalization. Under ASU 2014-09, certain upfront costs associated with contracts that have substantive
termination penalties and a term of one year or more are recognized as assets and amortized to operating costs and expenses over
the applicable period benefited.
For additional information regarding the impact of our adoption of ASU 2014-09, see note 4.
The cumulative effect of the adoption of ASU 2014-09 on our summary balance sheet information as of January 1, 2018 is
as follows:
Balance atDecember 31, 2017
ASU 2014-09Adjustments
Balance atJanuary 1, 2018
in millions
Assets:
Trade receivables, net................................................................... £ 574.9 (0.6) £ 574.3
Other current assets ...................................................................... £ 104.4 34.5 £ 138.9
Deferred income taxes.................................................................. £ 1,432.4 (10.2) £ 1,422.2
Other assets, net............................................................................ £ 1,621.0 10.5 £ 1,631.5
Liabilities:
Deferred revenue .......................................................................... £ 377.4 1.1 £ 378.5
Other long-term liabilities ............................................................ £ 489.6 0.3 £ 489.9
Equity:
Accumulated deficit ..................................................................... £ (1,362.8) 32.8 £ (1,330.0)
The impact of our adoption of ASU 2014-09 on our consolidated balance sheet as of December 31, 2018 was not materially
different from the impacts set forth in the above January 1, 2018 summary balance sheet information. Similarly, the adoption of
ASU 2014-09 did not have a material impact on our consolidated statement of operations for the year ended December 31, 2018.
ASU 2017-07
In March 2017, the FASB issued ASU No. 2017-07, Improving the Presentation of the Net Periodic Pension Cost and Net
Periodic Postretirement Benefit Cost (ASU 2017-07), which changes the presentation of periodic benefit cost components. Under
ASU 2017-07, we continue to present the service component of our net periodic pension cost as a component of operating income
but present the other components of our net periodic pension cost, which can include credits, within non-operating income (expense)
in our consolidated statements of operations. We adopted ASU 2017-07 on January 1, 2018 on a retrospective basis, which resulted
in the reclassification of credits from SG&A expense to other non-operating income, net of £8.0 million and £6.4 million for the
years ended December 31, 2017 and 2016, respectively. For information regarding our defined benefit plans, see note 14.
ASU 2016-18
In November 2016, the FASB issued ASU No. 2016-18, Restricted Cash (ASU 2016-18), which requires the change in restricted
cash to be included together with the change in cash and cash equivalents in our consolidated statement of cash flows. We adopted
ASU 2016-18 on January 1, 2018 on a retrospective basis.

VIRGIN MEDIA INC.
Notes to Consolidated Financial Statements — (Continued)
December 31, 2018, 2017 and 2016
II - 14
ASU 2016-09
In March 2016, the FASB issued ASU No. 2016-09, Compensation — Stock Compensation, Improvements to Employee Share-
Based Payment Accounting (ASU 2016-09), which simplifies several aspects of the accounting for share-based payment
transactions, including income tax consequences, classification of awards as either equity or liabilities and classification within
the statement of cash flows. We adopted ASU 2016-09 on January 1, 2017. As a result of adopting this standard, we (i) recognized
a cumulative effect adjustment to our accumulated deficit as of January 1, 2017 and (ii) retrospectively revised the presentation
of our consolidated statements of cash flows to remove the operating cash outflows and financing cash inflows associated with
excess tax benefits from share-based compensation. The cumulative effect adjustment, which totaled £12.4 million, represents the
tax effect of deductions in excess of the financial reporting expense for share-based compensation that were not previously
recognized for financial reporting purposes as these tax benefits were not realized as a reduction of income taxes payable.
Recent Accounting Pronouncements
ASU 2016-02
In February 2016, the FASB issued ASU No. 2016-02, Leases (ASU 2016-02), which, for most leases, will result in lessees
recognizing right-of-use assets and lease liabilities on the balance sheet and additional disclosures. ASU 2016-02, as amended by
ASU No. 2018-11, Targeted Improvements, requires lessees and lessors to recognize and measure leases at the beginning of the
earliest period presented using one of two modified retrospective approaches. A number of optional practical expedients may be
applied in transition. ASU 2016-02 is effective for annual reporting periods beginning after December 15, 2019, with early adoption
permitted. We will adopt ASU 2016-02 on January 1, 2019 by recording the cumulative effect of adoption to our accumulated
deficit.
The main impact of the adoption of this standard will be the recognition of right-of-use assets and lease liabilities in our
consolidated balance sheet for those leases classified as operating leases under previous accounting principles generally accepted
in the U.S. (U.S. GAAP). We will not recognize right-of use assets or lease liabilities for leases with a term of 12 months or less,
as permitted by the short-term lease practical expedient in the standard. We generally do not plan to apply the practical expedient
that permits a lessee to account for lease and non-lease components in a contract as a single lease component and, accordingly,
we will continue to account for these components separately. In transition, we will apply the practical expedients that permit us
not to reassess (i) whether expired or existing contracts contain a lease under the new standard, (ii) the lease classification for
expired or existing leases or (iii) whether previously-capitalized initial direct costs would qualify for capitalization under the new
standard. In addition, we will not use hindsight during transition.
We are in the process of implementing a new lease accounting system and related internal controls to meet the requirements
of ASU 2016-02. While we are still evaluating the effect that ASU 2016-02 will have on our consolidated balance sheet, we expect
to record significant right-of-use assets and corresponding lease liabilities upon adoption. We do not expect our adoption of ASU
2016-02 will have a material impact on our consolidated statement of operations or cash flows.
Our current operating lease portfolio primarily includes leases related to real estate, fleet and network equipment. For a
summary of our undiscounted future minimum lease payments under non-cancellable operating leases as of December 31,
2018, see note 16.
ASU 2018-15
In August 2018, the FASB issued ASU No. 2018-15, Customer’s Accounting for Implementation Costs Incurred in a Cloud
Computing Arrangement that is a Service Contract (ASU 2018-15), which requires entities to defer implementation costs incurred
that are related to the application development stage in a cloud computing arrangement that is a service contract. Deferred
implementation costs will be amortized over the term of the cloud computing arrangement and presented in the same expense line
item as the cloud computing arrangement. All other implementation costs will be expensed as incurred. ASU 2018-15 is effective
for annual reporting periods beginning after December 15, 2020, including interim periods within those fiscal years, with early
adoption permitted. We are currently evaluating the effect that ASU 2018-15 will have on our consolidated financial statements.

VIRGIN MEDIA INC.
Notes to Consolidated Financial Statements — (Continued)
December 31, 2018, 2017 and 2016
II - 15
(3) Summary of Significant Accounting Policies
Estimates
The preparation of financial statements in conformity with U.S. GAAP requires management to make estimates and
assumptions that affect the reported amounts of assets and liabilities at the date of the financial statements and the reported amounts
of revenue and expenses during the reporting period. Estimates and assumptions are used in accounting for, among other things,
the valuation of acquisition-related assets and liabilities, allowances for uncollectible accounts, certain components of revenue,
programming and copyright costs, deferred income taxes and related valuation allowances, loss contingencies, fair value
measurements, impairment assessments, capitalization of internal costs associated with construction and installation activities,
useful lives of long-lived assets, share-based compensation and actuarial liabilities associated with certain benefit plans. Actual
results could differ from those estimates.
Reclassifications
Certain prior year amounts have been reclassified to conform to the current year presentation.
Principles of Consolidation
The accompanying consolidated financial statements include our accounts and the accounts of all voting interest entities where
we exercise a controlling financial interest through the ownership of a direct or indirect controlling voting interest and variable
interest entities for which our company is the primary beneficiary. All significant intercompany accounts and transactions have
been eliminated in consolidation.
Cash and Cash Equivalents and Restricted Cash
Cash equivalents consist of money market funds and other investments that are readily convertible into cash and have maturities
of three months or less at the time of acquisition. We record money market funds at the net asset value as there are no restrictions
on our ability, contractual or otherwise, to redeem our investments at the stated net asset value.
Restricted cash consists of cash held in restricted accounts, including cash held as collateral for debt and other compensating
balances. Restricted cash amounts that are required to be used to purchase long-term assets or repay long-term debt are classified
as long-term assets. All other cash that is restricted to a specific use is classified as current or long-term based on the expected
timing of the disbursement.
Our significant non-cash investing and financing activities are disclosed in our consolidated statements of owner's equity and
in notes 7, 8 and 12.
Cash Flow Statement
For the purpose of determining the classification of cash flows in our consolidated statements of cash flows, payments on
related-party loans are first applied to principal (included as cash flows from financing activities) and then to capitalized interest
(included as cash flows from operating activities). Interest-bearing cash advances to related parties and repayments thereof are
classified as investing activities. Receipts on related-party receivables are first applied to principal (included as cash flows from
investing activities) and then to capitalized interest (included as cash flows from operating activities). All other related-party
borrowings, advances and repayments are reflected as financing activities.
For the purpose of our consolidated statements of cash flows, expenses financed by an intermediary are treated as hypothetical
operating cash outflows and hypothetical financing cash inflows when the expenses are incurred. When we pay the financing
intermediary, we record financing cash outflows in our consolidated statements of cash flows.
The capital expenditures that we report in our consolidated statements of cash flows do not include amounts that are financed
under capital-related vendor financing or capital lease arrangements. Instead, these amounts are reflected as non-cash additions
to our property and equipment when the underlying assets are delivered and as repayments of debt when the principal is repaid.

VIRGIN MEDIA INC.
Notes to Consolidated Financial Statements — (Continued)
December 31, 2018, 2017 and 2016
II - 16
Trade Receivables
Our trade receivables are reported net of an allowance for doubtful accounts. At December 31, 2017, our allowance for doubtful
accounts was £21.4 million. Upon adoption of ASU 2014-09 on January 1, 2018, our allowance increased to £49.1 million, and
at December 31, 2018, our allowance was £24.9 million. The allowance for doubtful accounts is based upon our assessment of
probable loss related to uncollectible accounts receivable. We use a number of factors in determining the allowance, including,
among other things, collection trends, prevailing and anticipated economic conditions and specific customer credit risk. The
allowance is maintained until either payment is received or the likelihood of collection is considered to be remote.
Concentration of credit risk with respect to trade receivables is limited due to the large number of residential and business
customers. We also manage this risk by disconnecting services to customers whose accounts are delinquent.
Financial Instruments
Due to the short maturities of cash and cash equivalents, restricted cash, short-term liquid investments, trade and other
receivables, other current assets, accounts payable, accrued liabilities and other accrued and current liabilities, their respective
carrying values approximate their respective fair values. For information concerning the fair values of our derivatives and debt,
see notes 5 and 8, respectively. For information regarding how we arrive at certain of our fair value measurements, see note 6.
Derivative Instruments
All derivative instruments, whether designated as hedging relationships or not, are recorded on the balance sheet at fair value.
If the derivative instrument is not designated as a hedge, changes in the fair value of the derivative instrument are recognized in
earnings. If the derivative instrument is designated as a cash flow hedge, the effective portions of changes in the fair value of the
derivative instrument are recorded in other comprehensive earnings or loss and subsequently reclassified into our consolidated
statements of operations when the hedged forecasted transaction affects earnings. Ineffective portions of changes in the fair value
of cash flow hedges are recognized in earnings. With the exception of a limited number of our foreign currency forward contracts,
we do not apply hedge accounting to our derivative instruments.
The net cash received or paid related to our derivative instruments is classified as an operating, investing or financing activity
in our consolidated statements of cash flows based on the objective of the derivative instrument and the classification of the
applicable underlying cash flows. For derivative contracts that are terminated prior to maturity, the cash paid or received upon
termination that relates to future periods is classified as a financing activity in our consolidated statement of cash flows.
For information regarding our derivative instruments, see note 5.
Property and Equipment
Property and equipment are stated at cost less accumulated depreciation. We capitalize costs associated with the construction
of new cable transmission and distribution facilities and the installation of new cable services. Capitalized construction and
installation costs include materials, labor and other directly attributable costs. Installation activities that are capitalized include
(i) the initial connection (or drop) from our cable system to a customer location, (ii) the replacement of a drop and (iii) the installation
of equipment for additional services, such as digital cable, telephone or broadband internet service. The costs of other customer-
facing activities, such as reconnecting and disconnecting customer locations and repairing or maintaining drops, are expensed as
incurred. Interest capitalized with respect to construction activities was not material during any of the periods presented.
Capitalized internal-use software is included as a component of property and equipment. We capitalize internal and external
costs directly associated with the development of internal-use software. We also capitalize costs associated with the purchase of
software licenses. Maintenance and training costs, as well as costs incurred during the preliminary stage of an internal-use software
development project, are expensed as incurred.
Depreciation is computed using the straight-line method over the estimated useful life of the underlying asset. Equipment
under capital leases is amortized on a straight-line basis over the shorter of the lease term or estimated useful life of the asset.
Useful lives used to depreciate our property and equipment are assessed periodically and are adjusted when warranted. The useful
lives of cable distribution systems that are undergoing a rebuild are adjusted such that property and equipment to be retired will

VIRGIN MEDIA INC.
Notes to Consolidated Financial Statements — (Continued)
December 31, 2018, 2017 and 2016
II - 17
be fully depreciated by the time the rebuild is completed. For additional information regarding the useful lives of our property and
equipment, see note 7.
Additions, replacements and improvements that extend the asset life are capitalized. Repairs and maintenance are charged to
operations.
We recognize a liability for asset retirement obligations in the period in which it is incurred if sufficient information is available
to make a reasonable estimate of fair values. Asset retirement obligations may arise from the loss of rights of way that we obtain
from local municipalities or other relevant authorities, as well as our obligations under certain lease arrangements to restore the
property to its original condition at the end of the lease term. Given the nature of our operations, most of our rights of way and
certain leased premises are considered integral to our business. Accordingly, for most of our rights of way and certain lease
agreements, the possibility is remote that we will incur significant removal costs in the foreseeable future and, as such, we do not
have sufficient information to make a reasonable estimate of fair value for these asset retirement obligations.
As of December 31, 2018 and 2017, the recorded value of our asset retirement obligations was £29.6 million and £31.5 million,
respectively.
Intangible Assets
Our primary intangible assets relate to goodwill and customer relationships. Goodwill represents the excess purchase price
over the fair value of the identifiable net assets acquired in a business combination. Customer relationships are initially recorded
at their fair value in connection with business combinations.
Goodwill is not amortized, but instead is tested for impairment at least annually. Intangible assets with finite lives are amortized
on a straight-line basis over their respective estimated useful lives to their estimated residual values, and reviewed for impairment.
For additional information regarding the useful lives of our intangible assets, see note 7.
Impairment of Property and Equipment and Intangible Assets
When circumstances warrant, we review the carrying amounts of our property and equipment and our intangible assets (other
than goodwill) to determine whether such carrying amounts continue to be recoverable. Such changes in circumstance may include
(i) an expectation of a sale or disposal of a long-lived asset or asset group, (ii) adverse changes in market or competitive conditions,
(iii) an adverse change in legal factors or business climate in the markets in which we operate and (iv) operating or cash flow
losses. For purposes of impairment testing, long-lived assets are grouped at the lowest level for which cash flows are largely
independent of other assets and liabilities, generally at or below the reporting unit level (see below). If the carrying amount of the
asset or asset group is greater than the expected undiscounted cash flows to be generated by such asset or asset group, an impairment
adjustment is recognized. Such adjustment is measured by the amount that the carrying value of such asset or asset group exceeds
its fair value. We generally measure fair value by considering (a) sale prices for similar assets, (b) discounted estimated future
cash flows using an appropriate discount rate and/or (c) estimated replacement cost. Assets to be disposed of are recorded at the
lower of their carrying amount or fair value less costs to sell.
We evaluate goodwill for impairment at least annually on October 1 and whenever facts and circumstances indicate that the
carrying amounts of goodwill may not be recoverable. For impairment evaluations with respect to goodwill, we first make a
qualitative assessment to determine if goodwill may be impaired. If it is more-likely-than-not that a reporting unit’s fair value is
less than its carrying value, we then compare the fair value of the reporting unit to its respective carrying amount. Any excess of
the carrying amount over the fair value would be charged to operations as an impairment loss. A reporting unit is an operating
segment or one level below an operating segment (referred to as a “component”). We have identified one reporting unit to which
all goodwill is assigned.

VIRGIN MEDIA INC.
Notes to Consolidated Financial Statements — (Continued)
December 31, 2018, 2017 and 2016
II - 18
Income Taxes
Income taxes are accounted for under the asset and liability method. We recognize deferred tax assets and liabilities for the
future tax consequences attributable to differences between the financial statement carrying amounts and income tax basis of assets
and liabilities and the expected benefits of utilizing net operating loss and tax credit carryforwards, using enacted tax rates in effect
for each taxing jurisdiction in which we operate for the year in which those temporary differences are expected to be recovered
or settled. We recognize the financial statement effects of a tax position when it is more-likely-than-not, based on technical merits,
that the position will be sustained upon examination. Net deferred tax assets are then reduced by a valuation allowance if we
believe it is more-likely-than-not such net deferred tax assets will not be realized. The effect on deferred tax assets and liabilities
of a change in tax rates is recognized in earnings in the period that includes the enactment date. Deferred tax liabilities related to
investments in foreign subsidiaries and foreign corporate joint ventures that are essentially permanent in duration are not recognized
until it becomes apparent that such amounts will reverse in the foreseeable future. In order to be considered essentially permanent
in duration, sufficient evidence must indicate that the foreign subsidiary has invested or will invest its undistributed earnings
indefinitely, or that earnings will be remitted in a tax-free manner. Interest and penalties related to income tax liabilities are included
in income tax benefit or expense in our consolidated statements of operations.
For additional information regarding our income taxes, see note 9.
Foreign Currency Translation and Transactions
The reporting currency of our company is the pound sterling. The functional currency of our foreign operations generally is
the applicable local currency for each foreign subsidiary. Assets and liabilities of foreign subsidiaries (including intercompany
balances for which settlement is not anticipated in the foreseeable future) are translated at the spot rate in effect at the applicable
reporting date. With the exception of certain material transactions, the amounts reported in our consolidated statements of operations
are translated at the average exchange rates in effect during the applicable period. The resulting unrealized cumulative translation
adjustment, net of applicable income taxes, is recorded as a component of accumulated other comprehensive earnings or loss in
our consolidated statements of owner's equity. With the exception of certain material transactions, the cash flows from our operations
in foreign countries are translated at the average rate for the applicable period in our consolidated statements of cash flows. The
impacts of material transactions generally are recorded at the applicable spot rates in our consolidated statements of operations
and cash flows. The effect of exchange rates on cash balances held in foreign currencies are separately reported in our consolidated
statements of cash flows.
Transactions denominated in currencies other than our or our subsidiaries’ functional currencies are recorded based on exchange
rates at the time such transactions arise. Changes in exchange rates with respect to amounts recorded in our consolidated balance
sheets related to these non-functional currency transactions result in transaction gains and losses that are reflected in our consolidated
statements of operations as unrealized (based on the applicable period end exchange rates) or realized upon settlement of the
transactions.
Revenue Recognition
Service Revenue — Cable Networks. We recognize revenue from the provision of video, broadband internet and fixed-line
telephony services over our cable network to customers in the period the related services are provided, with the exception of
revenue recognized pursuant to certain contracts that contain promotional discounts, as described below. Installation fees related
to services provided over our cable network are generally deferred and recognized as revenue over the contractual period, or longer
if the upfront fee results in a material renewal right.
Sale of Multiple Products and Services. We sell video, broadband internet, fixed-line telephony and mobile services to our
customers in bundled packages at a rate lower than if the customer purchased each product on a standalone basis. Revenue from
bundled packages generally is allocated proportionally to the individual products or services based on the relative standalone
selling price for each respective product or service.
Mobile Revenue — General. Consideration from mobile contracts is allocated to the airtime service component and the handset
component based on the relative standalone selling prices of each component. When we offer handsets and airtime services in
separate contracts entered into at the same time, we account for these contracts as a single contract.

VIRGIN MEDIA INC.
Notes to Consolidated Financial Statements — (Continued)
December 31, 2018, 2017 and 2016
II - 19
Mobile Revenue — Airtime Services. We recognize revenue from mobile services in the period in which the related services
are provided. Revenue from pre-pay customers is deferred prior to the commencement of services and recognized as the services
are rendered or usage rights expire.
Mobile Revenue — Handset Revenue. Revenue from the sale of handsets is recognized at the point in which the goods have
been transferred to the customer. Some of our mobile handset contracts that permit the customer to take control of the handset
upfront and pay for the handset in installments over a contractual period may contain a significant financing component. For
contracts with terms of one year or more, we recognize any significant financing component as revenue over the contractual period
using the effective interest method. We do not record the effect of a significant financing component if the contractual period is
less than one year.
B2B Revenue. We defer upfront installation and certain nonrecurring fees received on business-to-business (B2B) contracts
where we maintain ownership of the installed equipment. The deferred fees are amortized into revenue on a straight-line basis,
generally over the longer of the term of the arrangement or the expected period of performance.
Contract Costs. Incremental costs to obtain a contract with a customer, such as incremental sales commissions, are generally
recognized as assets and amortized to SG&A expenses over the applicable period benefited, which generally is the contract life.
If, however, the amortization period is less than one year, we expense such costs in the period incurred. Contract fulfillment costs,
such as costs for installation activities for B2B customers, are recognized as assets and amortized to other operating costs over the
applicable period benefited, which is generally the substantive contract term for the related service contract.
Promotional Discounts. For subscriber promotions, such as discounted or free services during an introductory period, revenue
is recognized uniformly over the contractual period if the contract has substantive termination penalties. If a contract does not
have substantive termination penalties, revenue is recognized only to the extent of the discounted monthly fees charged to the
subscriber, if any.
Subscriber Advance Payments. Payments received in advance for the services we provide are deferred and recognized as
revenue when the associated services are provided.
Sales and Other Value-Added Taxes (VAT). Revenue is recorded net of applicable sales and other VAT.
For additional information regarding our revenue recognition and related costs, see note 4. For a disaggregation of our revenue
by major category and by reportable and geographic segment, see note 17.
Share-based Compensation
We recognize all share-based payments from Liberty Global to employees of our subsidiaries, including grants of employee
share-based incentive awards, based on their grant-date fair values and Liberty Global’s estimates of forfeitures. We recognize the
grant-date fair value of outstanding awards as a charge to operations over the vesting period. Payroll taxes incurred in connection
with the vesting or exercise of Liberty Global’s share-based incentive awards are recorded as a component of share-based
compensation expense in our consolidated statements of operations.
We use the straight-line method to recognize share-based compensation expense for Liberty Global’s outstanding share awards
to employees of our subsidiaries that do not contain a performance condition and the accelerated expense attribution method for
our outstanding share awards that contain a performance condition and vest on a graded basis.
The grant date fair values for options, share appreciation rights (SARs) and performance-based share appreciation rights
(PSARs) are estimated using the Black-Scholes option pricing model, and the grant-date fair values for restricted share units
(RSUs) and performance-based restricted share units (PSUs) are based upon the closing share price of Liberty Global ordinary
shares on the date of grant. Liberty Global calculates the expected life of options and SARs granted by Liberty Global to employees
based on historical exercise trends. The expected volatility for Liberty Global options and SARs related to Liberty Global Shares
is generally based on a combination of (i) historical volatilities of Liberty Global Shares for a period equal to the expected average
life of the awards and (ii) volatilities implied from publicly-traded options for Liberty Global Shares.
For additional information regarding our share-based compensation, see note 11.

VIRGIN MEDIA INC.
Notes to Consolidated Financial Statements — (Continued)
December 31, 2018, 2017 and 2016
II - 20
Litigation Costs
Legal fees and related litigation costs are expensed as incurred.
(4) Revenue Recognition and Related Costs
Contract Balances
If we transfer goods or services to a customer but do not have an unconditional right to payment, we record a contract asset.
Contract assets typically arise from the uniform recognition of introductory promotional discounts over the contract period and
accrued revenue for handset sales. Our contract assets were £23.8 million and £0.5 million as of December 31, 2018 and January 1,
2018, respectively. The current and long-term portions of our contract asset balance at December 31, 2018 are included within
other current assets and other assets, net, respectively, in our consolidated balance sheet.
We record deferred revenue when we receive payment prior to transferring goods or services to a customer. We primarily
defer revenue for (i) installation and other upfront services and (ii) other services that are invoiced prior to when services are
provided. Our deferred revenue balances were £396.5 million and £412.9 million as of December 31, 2018 and January 1, 2018,
respectively. The decrease in deferred revenue during 2018 is primarily due to £374.0 million of revenue recognized that was
included in our deferred revenue balance at January 1, 2018, partially offset by advanced billings recorded during the period. The
current and long-term portions of our deferred revenue balance at December 31, 2018 are included within deferred revenue and
other long-term liabilities, respectively, in our consolidated balance sheet.
Contract Costs
Our aggregate assets associated with incremental costs to obtain and fulfill our contracts were £44.4 million and £41.7 million
at December 31, 2018 and January 1, 2018, respectively. The current and long-term portions of our assets related to contract costs
at December 31, 2018 are included within other current assets and other assets, net, respectively, in our consolidated balance sheet.
We amortized £57.6 million to operating costs and expenses during 2018 related to these assets.
Unsatisfied Performance Obligations
A large portion of our revenue is derived from customers who are not subject to contracts. Revenue from customers who are
subject to contracts is generally recognized over the term of such contracts, which is typically 12 months for our residential service
contracts, one to three years for our mobile service contracts and one to five years for our B2B service contracts.
(5) Derivative Instruments
In general, we enter into derivative instruments to protect against (i) increases in the interest rates on our variable-rate debt
and (ii) foreign currency movements, particularly with respect to borrowings that are denominated in a currency other than the
functional currency of the borrowing entity. In this regard, we have entered into various derivative instruments to manage interest
rate exposure and foreign currency exposure with respect to the United States (U.S.) dollar ($), the euro (€) and the Indian rupee.
With the exception of a limited number of our foreign currency forward contracts, we do not apply hedge accounting to our
derivative instruments. Accordingly, changes in the fair values of most of our derivative instruments are recorded in realized and
unrealized gains or losses on derivative instruments, net, in our consolidated statements of operations.

VIRGIN MEDIA INC.
Notes to Consolidated Financial Statements — (Continued)
December 31, 2018, 2017 and 2016
II - 21
The following table provides details of the fair values of our derivative instrument assets and liabilities:
December 31, 2018 December 31, 2017
Current (a) Long-term (a) Total Current (a) Long-term (a) Total
in millions
Assets:
Cross-currency and interest ratederivative contracts (b) .................... £ 141.4 £ 743.5 £ 884.9 £ 218.0 £ 476.8 £ 694.8
Foreign currency forward and optioncontracts........................................... 0.1 — 0.1 0.4 — 0.4
Foreign currency forward contracts— related-party................................ 1.6 — 1.6 8.5 — 8.5
Total................................................ £ 143.1 £ 743.5 £ 886.6 £ 226.9 £ 476.8 £ 703.7
Liabilities:
Cross-currency and interest ratederivative contracts (b) .................... £ 81.9 £ 292.7 £ 374.6 £ 55.2 £ 396.7 £ 451.9
Foreign currency forward contracts— related-party................................ — — — 0.8 0.1 0.9
Total................................................ £ 81.9 £ 292.7 £ 374.6 £ 56.0 £ 396.8 £ 452.8
_______________
(a) Our current derivative liabilities, long-term derivative assets and long-term derivative liabilities are included in other current
liabilities, other assets, net, and other long-term liabilities, respectively, in our consolidated balance sheets.
(b) We consider credit risk relating to our and our counterparties’ nonperformance in the fair value assessment of our derivative
instruments. In all cases, the adjustments take into account offsetting liability or asset positions. The changes in the credit
risk valuation adjustments associated with our cross-currency and interest rate derivative contracts resulted in net gains
(losses) of (£31.8 million), £78.3 million and (£28.5 million) during 2018, 2017 and 2016, respectively. These amounts are
included in realized and unrealized gains (losses) on derivative instruments, net, in our consolidated statements of operations.
For further information regarding our fair value measurements, see note 6.
The details of our realized and unrealized gains (losses) on derivative instruments, net, are as follows:
Year ended December 31,
2018 2017 2016
in millions
Cross-currency and interest rate derivative contracts ............................................ £ 470.0 £ (525.2) £ 640.8
Foreign currency forward contracts — related-party............................................. 1.3 (2.2) 15.8
Equity-related derivative instruments (a)............................................................... — — 9.2
Total................................................................................................................... £ 471.3 £ (527.4) £ 665.8
_______________
(a) Equity-related derivative instruments were cash settled during 2016.

VIRGIN MEDIA INC.
Notes to Consolidated Financial Statements — (Continued)
December 31, 2018, 2017 and 2016
II - 22
The net cash received or paid related to our derivative instruments is classified as an operating, investing or financing activity
in our consolidated statements of cash flows based on the objective of the derivative instrument and the classification of the
applicable underlying cash flows. For derivative contracts that are terminated prior to maturity, the cash paid or received upon
termination that relates to future periods is classified as a financing activity. The following table sets forth the classification of the
net cash inflows (outflows) of our derivative instruments:
Year ended December 31,
2018 2017 2016
in millions
Operating activities ................................................................................................ £ 135.5 £ 45.6 £ 35.0
Financing activities ................................................................................................ 74.6 (0.4) 30.4
Total................................................................................................................... £ 210.1 £ 45.2 £ 65.4
Counterparty Credit Risk
We are exposed to the risk that the counterparties to our derivative instruments will default on their obligations to us. We
manage these credit risks through the evaluation and monitoring of the creditworthiness of, and concentration of risk with, the
respective counterparties. In this regard, credit risk associated with our derivative instruments is spread across a relatively broad
counterparty base of banks and financial institutions. Collateral is generally not posted by either party under our derivative
instruments. At December 31, 2018, our exposure to counterparty credit risk included derivative assets with an aggregate fair value
of £360.2 million.
We have entered into derivative instruments under master agreements with each counterparty that contain master netting
arrangements that are applicable in the event of early termination by either party to such derivative instrument. The master netting
arrangements are limited to the derivative instruments and derivative-related debt instruments, governed by the relevant master
agreement and are independent of similar arrangements. For additional information regarding our derivative-related debt, see note
8.
Under our derivative contracts, it is generally only the non-defaulting party that has a contractual option to exercise early
termination rights upon the default of the other counterparty and to set off other liabilities against sums due upon such termination.
However, in an insolvency of a derivative counterparty, under the laws of certain jurisdictions, the defaulting counterparty or its
insolvency representatives may be able to compel the termination of one or more derivative contracts and trigger early termination
payment liabilities payable by us, reflecting any mark-to-market value of the contracts for the counterparty. Alternatively, or in
addition, the insolvency laws of certain jurisdictions may require the mandatory set off of amounts due under such derivative
contracts against present and future liabilities owed to us under other contracts between us and the relevant counterparty.
Accordingly, it is possible that we may be subject to obligations to make payments, or may have present or future liabilities owed
to us partially or fully discharged by set off as a result of such obligations, in the event of the insolvency of a derivative counterparty,
even though it is the counterparty that is in default and not us. To the extent that we are required to make such payments, our ability
to do so will depend on our liquidity and capital resources at the time. In an insolvency of a defaulting counterparty, we will be
an unsecured creditor in respect of any amount owed to us by the defaulting counterparty, except to the extent of the value of any
collateral we have obtained from that counterparty.
In addition, where a counterparty is in financial difficulty, under the laws of certain jurisdictions, the relevant regulators may
be able to (i) compel the termination of one or more derivative instruments, determine the settlement amount and/or compel,
without any payment, the partial or full discharge of liabilities arising from such early termination that are payable by the relevant
counterparty or (ii) transfer the derivative instruments to an alternative counterparty.
Details of our Derivative Instruments
Cross-currency Derivative Contracts
We generally match the denomination of our borrowings with the functional currency of the supporting operations or, when
it is more cost effective, we provide for an economic hedge against foreign currency exchange rate movements by using derivative

VIRGIN MEDIA INC.
Notes to Consolidated Financial Statements — (Continued)
December 31, 2018, 2017 and 2016
II - 23
instruments to synthetically convert unmatched debt into the applicable underlying currency. At December 31, 2018, substantially
all of our debt was either directly or synthetically matched to the functional currency of the borrowing entity. The following table
sets forth the total notional amounts and the related weighted average remaining contractual lives of our cross-currency swap
contracts at December 31, 2018:
Notional amount due from counterparty Notional amount due to counterparty Weighted average remaining life
in millions in years
$ 400.0 € 339.6 4.0
$ 7,182.9 £ 4,759.3 (a) 4.9
£ 2,365.8 $ 3,400.0 (b) 6.1
_______________
(a) Includes certain derivative instruments that are “forward-starting,” such that the initial exchange occurs at a date subsequent
to December 31, 2018. These instruments are typically entered into in order to extend existing hedges without the need to
amend existing contracts.
(b) This derivative instrument does not involve the exchange of notional amounts at the inception and maturity of the
instrument. Accordingly, the only cash flows associated with this derivative instrument are coupon-related payments and
receipts.
Interest Rate Swap Contracts
The following table sets forth the total of the notional amounts and the related weighted average remaining contractual lives
of our interest rate swap contracts at December 31, 2018:
Pay fixed rate (a) Receive fixed rate
Notional amountWeighted average remaining
life Notional amountWeighted average remaining
life
in millions in years in millions in years
£ 13,491.6 3.4 £ 8,664.3 5.2
______________
(a) Includes forward-starting derivative instruments.

VIRGIN MEDIA INC.
Notes to Consolidated Financial Statements — (Continued)
December 31, 2018, 2017 and 2016
II - 24
Interest Rate Swap Options
We have entered into various interest rate swap options (swaptions), which give us the right, but not the obligation, to enter
into certain interest rate swap contracts at set dates in the future, with each such contract having a life of no more than three years.
At the transaction date, the strike rate of each of these contracts was above the corresponding market rate. The following table sets
forth certain information regarding our swaptions at December 31, 2018:
Notional amount Underlying swap currencyWeighted average option
expiration period (a) Weighted average strike rate (b)
in millions in years
£ 4,756.4 £ 0.9 2.47%
£ 462.5 € 0.9 2.08%
______________
(a) Represents the weighted average period until the date on which we have the option to enter into the interest rate swap
contracts.
(b) Represents the weighted average interest rate that we would pay if we exercised our option to enter into the interest rate
swap contracts.
Basis Swaps
Our basis swaps involve the exchange of attributes used to calculate our floating interest rates, including (i) the benchmark
rate, (ii) the underlying currency and/or (iii) the borrowing period. We typically enter into these swaps to optimize our interest rate
profile based on our current evaluations of yield curves, our risk management policies and other factors. At December 31, 2018,
the total pound sterling equivalent of the notional amount due from the counterparty, including forward-starting derivative
instruments, was £3,567.5 million and the related weighted average remaining contractual life of our basis swap contracts was 0.5
years.
Interest Rate Cap
We enter into interest rate cap agreements that lock in a maximum interest rate if variable rates rise, but also allow our company
to benefit from declines in market rates. At December 31, 2018, the notional amount of our interest rate cap was £200.0 million.
Impact of Derivative Instruments on Borrowing Costs
Excluding forward-starting instruments and swaptions, the impact of the derivative instruments that mitigate our foreign
currency and interest rate risk, as described above, was a decrease of 59 basis points to our borrowing costs as of December 31,
2018.
Foreign Currency Forwards and Options
We enter into foreign currency forward and option contracts with respect to non-functional currency exposure. As of
December 31, 2018, the total pound sterling equivalent of the notional amount of foreign currency forward and option contracts
was £0.4 million.
Foreign Currency Forward Contracts – Related-party
At December 31, 2018, we had £49.6 million notional amount of foreign currency forward contracts with Liberty Global
Europe Financing BV (LGE Financing), a subsidiary of Liberty Global.

VIRGIN MEDIA INC.
Notes to Consolidated Financial Statements — (Continued)
December 31, 2018, 2017 and 2016
II - 25
(6) Fair Value Measurements
We use the fair value method to account for (i) our derivative instruments and (ii) certain instruments that we classify as debt.
The reported fair values of these instruments as of December 31, 2018 are unlikely to represent the value that will be paid or
received upon the ultimate settlement or disposition of these assets and liabilities.
U.S. GAAP provides for a fair value hierarchy that prioritizes the inputs to valuation techniques used to measure fair value
into three broad levels. Level 1 inputs are quoted market prices in active markets for identical assets or liabilities that the reporting
entity has the ability to access at the measurement date. Level 2 inputs are inputs other than quoted market prices included within
Level 1 that are observable for the asset or liability, either directly or indirectly. Level 3 inputs are unobservable inputs for the
asset or liability. We record transfers of assets or liabilities into or out of Levels 1, 2 or 3 at the beginning of the quarter during
which the transfer occurred. During 2018, no such transfers were made.
All of our Level 2 inputs (interest rate futures, swap rates and certain of the inputs for our weighted average cost of capital
calculations) and certain of our Level 3 inputs (forecasted volatilities and credit spreads) are obtained from pricing services. These
inputs, or interpolations or extrapolations thereof, are used in our internal models to calculate, among other items, yield curves,
forward interest and currency rates and weighted average cost of capital rates. In the normal course of business, we receive market
value assessments from the counterparties to our derivative contracts. Although we compare these assessments to our internal
valuations and investigate unexpected differences, we do not otherwise rely on counterparty quotes to determine the fair values
of our derivative instruments. The midpoints of applicable bid and ask ranges generally are used as inputs for our internal valuations.
In order to manage our interest rate and foreign currency exchange risk, we have entered into (i) various derivative instruments
and (ii) certain instruments that we classify as debt, as further described in notes 5 and 8, respectively. The recurring fair value
measurements of these instruments are determined using discounted cash flow models. With the exception of the inputs for certain
swaptions, most of the inputs to these discounted cash flow models consist of, or are derived from, observable Level 2 data for
substantially the full term of these instruments. This observable data mostly includes currency rates, interest rate futures and swap
rates, which are retrieved or derived from available market data. Although we may extrapolate or interpolate this data, we do not
otherwise alter this data in performing our valuations. We use a Monte Carlo based approach to incorporate a credit risk valuation
adjustment in our fair value measurements to estimate the impact of both our own nonperformance risk and the nonperformance
risk of our counterparties. The inputs used for our credit risk valuations, including our and our counterparties’ credit spreads,
represent our most significant Level 3 inputs, and these inputs are used to derive the credit risk valuation adjustments with respect
to these instruments. As we would not expect these parameters to have a significant impact on the valuations of these instruments,
we have determined that these valuations (other than the valuations of the aforementioned swaptions) fall under Level 2 of the
fair value hierarchy. Due to the lack of Level 2 inputs for the swaption valuations, we believe these valuations fall under Level 3
of the fair value hierarchy. Our credit risk valuation adjustments with respect to our cross-currency and interest rate swaps are
quantified and further explained in note 5.
Fair value measurements are also used in connection with nonrecurring valuations performed in connection with acquisition
accounting and impairment assessments. The nonrecurring valuations associated with acquisition accounting primarily include
the valuation of reporting units, customer relationships and other intangible assets and property and equipment. Unless a reporting
unit has a readily determinable fair value, the valuation of reporting units is based at least in part on discounted cash flow analyses.
With the exception of certain inputs for our weighted average cost of capital and discount rate calculations that are derived from
pricing services, the inputs used in our discounted cash flow analyses, such as forecasts of future cash flows, are based on our
assumptions. The valuation of customer relationships is primarily based on an excess earnings methodology, which is a form of a
discounted cash flow analysis. The excess earnings methodology requires us to estimate the specific cash flows expected from the
customer relationship, considering such factors as estimated customer life, the revenue expected to be generated over the life of
the customer relationship, contributory asset charges and other factors. Tangible assets are typically valued using a replacement
or reproduction cost approach, considering factors such as current prices of the same or similar equipment, the age of the equipment
and economic obsolescence. Most of our nonrecurring valuations use significant unobservable inputs and therefore fall under
Level 3 of the fair value hierarchy. We did not perform significant nonrecurring fair value measurements during 2018 or 2017.

VIRGIN MEDIA INC.
Notes to Consolidated Financial Statements — (Continued)
December 31, 2018, 2017 and 2016
II - 26
A summary of our assets and liabilities that are measured at fair value on a recurring basis is as follows:
Fair value measurements at December 31, 2018 using:
Description December 31, 2018
Significant otherobservable inputs
(Level 2)
Significantunobservable
inputs (Level 3)
in millions
Assets:
Derivative instruments:
Cross-currency and interest rate derivative contracts ............ £ 884.9 £ 884.7 £ 0.2
Foreign currency forward and option contracts ..................... 0.1 0.1 —
Foreign currency forward contracts — related-party ............. 1.6 1.6 —
Total assets........................................................................... £ 886.6 £ 886.4 £ 0.2
Liabilities:
Derivative instruments:
Cross-currency and interest rate derivative contracts ............ £ 374.6 £ 366.2 £ 8.4
Debt........................................................................................... 195.0 195.0 —
Total liabilities ..................................................................... £ 569.6 £ 561.2 £ 8.4
Fair value measurements at December 31, 2017 using:
Description December 31, 2017
Significant otherobservable inputs
(Level 2)
Significantunobservable
inputs (Level 3)
in millions
Assets:
Derivative instruments:
Cross-currency and interest rate derivative contracts ............ £ 694.8 £ 694.5 £ 0.3
Foreign currency and forward option contracts ..................... 0.4 0.4 —
Foreign currency forward contracts — related-party ............. 8.5 8.5 —
Total assets........................................................................... £ 703.7 £ 703.4 £ 0.3
Liabilities:
Derivative instruments:
Cross-currency and interest rate derivative contracts ............ £ 451.9 £ 450.9 £ 1.0
Foreign currency forward contracts — related-party ............. 0.9 0.9 —
Debt........................................................................................... 225.4 225.4 —
Total liabilities ..................................................................... £ 678.2 £ 677.2 £ 1.0

VIRGIN MEDIA INC.
Notes to Consolidated Financial Statements — (Continued)
December 31, 2018, 2017 and 2016
II - 27
(7) Long-lived Assets
Property and Equipment, Net
The details of our property and equipment and the related accumulated depreciation are set forth below:
Estimated useful life at
December 31, 2018
December 31,
2018 2017
in millions
Distribution systems ................................................................................. 3 to 30 years £ 8,385.9 £ 7,874.4
Customer premises equipment.................................................................. 5 years 2,255.5 2,080.7
Support equipment, buildings and land .................................................... 3 to 50 years 1,606.4 1,387.4
Total property and equipment, gross 12,247.8 11,342.5
Accumulated depreciation......................................................................................................... (5,975.6) (5,134.9)
Total property and equipment, net........................................................................................ £ 6,272.2 £ 6,207.6
Depreciation expense related to our property and equipment was £1,408.8 million, £1,433.9 million and £1,264.1 million
during 2018, 2017 and 2016, respectively.
At December 31, 2018 and 2017, the amount of property and equipment, net, recorded under capital leases was £49.8 million
and £59.6 million, respectively. Most of these amounts relate to assets included in our support equipment, buildings and land
category. Depreciation of assets under capital leases is included in depreciation and amortization in our consolidated statements
of operations.
During 2018, 2017 and 2016, we recorded non-cash increases to our property and equipment related to vendor financing
arrangements of £1,057.2 million, £1,153.2 million and £636.9 million, respectively, which exclude related VAT of £188.0 million,
£215.5 million and £111.1 million, respectively, that was also financed by our vendors under these arrangements. In addition,
during 2018, 2017 and 2016, we recorded non-cash increases to our property and equipment related to assets acquired under capital
leases of £6.8 million, £11.5 million and £14.3 million, respectively.
Most of our property and equipment is pledged as security under our various debt instruments. For additional information,
see note 8.
Goodwill
Changes in the carrying amount of our goodwill during 2018 are set forth below (in millions):
January 1, 2018....................................................................................................................................................... £ 6,014.6
Acquisitions and related adjustments ................................................................................................................... 1.5
Foreign currency translation adjustments ............................................................................................................ 2.3
December 31, 2018................................................................................................................................................. £ 6,018.4
If, among other factors, (i) our enterprise value or Liberty Global’s equity values were to decline or (ii) the adverse impacts
of economic, competitive, regulatory or other factors were to cause our results of operations or cash flows to be worse than
anticipated, we could conclude in future periods that impairment charges are required in order to reduce the carrying values of our
goodwill and, to a lesser extent, other long-lived assets. Any such impairment charges could be significant.
VIRGIN MEDIA INC.
Notes to Consolidated Financial Statements — (Continued)
December 31, 2018, 2017 and 2016
II - 28
Changes in the carrying amount of our goodwill during 2017 are set forth below (in millions):
January 1, 2017....................................................................................................................................................... £ 6,004.3
Acquisitions and related adjustments ................................................................................................................... 1.9
Foreign currency translation adjustments ............................................................................................................ 8.4
December 31, 2017................................................................................................................................................. £ 6,014.6
Intangible Assets Subject to Amortization, Net
The details of our intangible assets subject to amortization, which are included in other assets, net, in our consolidated balance
sheets, are set forth below:
Estimateduseful life at
December 31,2018
December 31, 2018 December 31, 2017
Grosscarryingamount
Accumulatedamortization
Netcarryingamount
Grosscarryingamount
Accumulatedamortization
Netcarryingamount
in millions
Customer relationships.............. 5 to 9 years £ 2,527.9 £ (2,065.7) £ 462.2 £ 2,526.0 £ (1,692.3) £ 833.7
Other (a) .................................... — — — 18.0 (2.0) 16.0
£ 2,527.9 £ (2,065.7) £ 462.2 £ 2,544.0 £ (1,694.3) £ 849.7
_______________
(a) During 2018, we wrote-off the TV3 brand name in Ireland in connection with the rebranding of TV3 to Virgin Media TV.
As a result, the TV3 brand name is no longer used.
Amortization expense related to intangible assets with finite useful lives was £389.4 million, £374.3 million and £386.7 million
during 2018, 2017 and 2016, respectively. Based on our amortizable intangible asset balances at December 31, 2018, we expect
that amortization expense will be as follows for the next five years and thereafter. The pound sterling equivalents of such amortization
expense amounts as of December 31, 2018 are presented below (in millions):
2019 .......................................................................................................................................................................... £ 354.1
2020 .......................................................................................................................................................................... 78.2
2021 .......................................................................................................................................................................... 27.0
2022 .......................................................................................................................................................................... 0.9
2023 .......................................................................................................................................................................... 0.9
Thereafter.................................................................................................................................................................. 1.1
Total........................................................................................................................................................................ £ 462.2

VIRGIN MEDIA INC.
Notes to Consolidated Financial Statements — (Continued)
December 31, 2018, 2017 and 2016
II - 29
(8) Debt and Capital Lease Obligations
The pound sterling equivalents of the components of our consolidated third-party debt are as follows:
December 31, 2018 Principal amount
Weightedaverage
interest rate (a)
Unusedborrowing
capacity (b)
December 31,
2018 2017
in millions
VM Senior Secured Notes................................................................. 5.40% £ — £ 4,917.9 £ 4,854.9
VM Credit Facilities (c) (d) .............................................................. 4.72% 675.0 3,609.4 3,457.6
Vendor financing (e).......................................................................... 4.97% — 1,893.0 1,814.8
VM Senior Notes .............................................................................. 5.54% — 1,569.0 2,218.3
Other (f)............................................................................................. 2.68% — 414.1 386.2
Total third-party debt before deferred financing costs, discountsand premiums (g) ........................................................................ 5.06% £ 675.0 £ 12,403.4 £ 12,731.8
The following table provides a reconciliation of total third-party debt before deferred financing costs, discounts and premiums
to total debt and capital lease obligations:
December 31,
2018 2017
in millions
Total third-party debt before deferred financing costs, discounts and premiums................................ £ 12,403.4 £ 12,731.8
Deferred financing costs, discounts and premiums, net ...................................................................... (29.9) (48.6)
Total carrying amount of third-party debt ......................................................................................... 12,373.5 12,683.2
Capital lease obligations ...................................................................................................................... 54.2 58.4
Total third-party debt and capital lease obligations ........................................................................ 12,427.7 12,741.6
Related-party debt (note 12) ................................................................................................................ 112.7 56.9
Total debt and capital lease obligations ........................................................................................ 12,540.4 12,798.5
Current maturities of debt and capital lease obligations...................................................................... (1,931.2) (1,845.1)
Long-term debt and capital lease obligations............................................................................. £ 10,609.2 £ 10,953.4
_______________
(a) Represents the weighted average interest rate in effect at December 31, 2018 for all borrowings outstanding pursuant to
each debt instrument, including any applicable margin. The interest rates presented represent stated rates and do not include
the impact of derivative instruments, deferred financing costs, original issue premiums or discounts and commitment fees,
all of which affect our overall cost of borrowing. Including the effects of derivative instruments, original issue premiums
or discounts and commitment fees, but excluding the impact of deferred financing costs, the weighted average interest rate
on our aggregate third-party variable- and fixed-rate indebtedness was 4.75% at December 31, 2018. For information
regarding our derivative instruments, see note 5.
(b) Unused borrowing capacity represents the maximum availability under the VM Credit Facilities at December 31, 2018
without regard to covenant compliance calculations or other conditions precedent to borrowing. At December 31, 2018,
based on the most restrictive applicable leverage covenants and leverage-based restricted payment tests, the full amount of
unused borrowing capacity was available to be borrowed and there were no restrictions on our ability to make loans or
distributions from this availability to other Virgin Media subsidiaries and ultimately to Virgin Media. Upon completion of
the relevant December 31, 2018 compliance reporting requirements, and based on the most restrictive applicable leverage
covenants and leverage-based restricted payment tests, we expect that the full amount of unused borrowing capacity will
continue to be available and that there will be no restrictions with respect to loans or distributions from this availability.

VIRGIN MEDIA INC.
Notes to Consolidated Financial Statements — (Continued)
December 31, 2018, 2017 and 2016
II - 30
Our above expectations do not consider any actual or potential changes to our borrowing levels or any amounts loaned or
distributed subsequent to December 31, 2018.
(c) Amounts include £41.9 million and £43.6 million at December 31, 2018 and 2017, respectively, of borrowings pursuant to
excess cash facilities under the VM Credit Facilities. These borrowings are owed to certain non-consolidated special purpose
financing entities that have issued notes to finance the purchase of receivables due from our company to certain other third
parties for amounts that we and our subsidiaries have vendor financed. To the extent that the proceeds from these notes
exceed the amount of vendor financed receivables available to be purchased, the excess proceeds are used to fund these
excess cash facilities.
(d) Unused borrowing capacity under the VM Credit Facilities relates to multi-currency revolving facilities with an aggregate
maximum borrowing capacity equivalent to £675.0 million. During 2018, the VM Revolving Facility was amended and
split into two revolving facilities. As of December 31, 2018, VM Revolving Facility A was a multi-currency revolving
facility maturing on December 31, 2021 with a maximum borrowing capacity equivalent to £50.0 million, and VM Revolving
Facility B was a multi-currency revolving facility maturing on January 15, 2024 with a maximum borrowing capacity
equivalent to £625.0 million. All other terms from the previously existing VM Revolving Facility continue to apply to the
new revolving facilities.
(e) Represents amounts owed pursuant to interest-bearing vendor financing arrangements that are used to finance certain of
our property and equipment additions and operating expenses. These obligations are generally due within one year and
include VAT that was paid on our behalf by the vendor. Repayments of vendor financing obligations are included in
repayments and repurchases of third-party debt and capital lease obligations in our consolidated statements of cash flows.
(f) Includes amounts associated with certain derivative-related borrowing instruments, including £195.0 million and £225.4
million at December 31, 2018 and 2017, respectively, carried at fair value. These instruments mature at various dates through
January 2025. The fair value of this debt has been reduced by credit risk valuation adjustments resulting in net gains of
£29.3 million and £6.5 million during 2018 and 2017, respectively, which are included in realized and unrealized gains
(losses) due to changes in fair values of certain debt, net, in our consolidated statements of operations. For further information
regarding our fair value measurements, see note 6. In addition, amounts include £177.3 million and £119.0 million at
December 31, 2018 and 2017, respectively, of debt collateralized by certain trade receivables of our company.
(g) As of December 31, 2018 and 2017, our debt had an estimated fair value of £12.1 billion and £13.0 billion, respectively.
The estimated fair values of our debt instruments are generally determined using the average of applicable bid and ask prices
(mostly Level 1 of the fair value hierarchy) or, when quoted market prices are unavailable or not considered indicative of
fair value, discounted cash flow models (mostly Level 2 of the fair value hierarchy). The discount rates used in the cash
flow models are based on the market interest rates and estimated credit spreads, to the extent available, and other relevant
factors. For additional information regarding fair value hierarchies, see note 6.
General Information
Credit Facilities. We have entered into a senior secured credit facility agreement with certain financial institutions and senior
credit facility agreements with certain non-consolidated special purpose financing entities (as described under VM Credit Facilities
below) (the "credit facilities"). Our credit facilities contain certain covenants, the more notable of which are as follows:
• Our credit facilities contain certain consolidated net leverage ratios, as specified in the relevant credit facility, which are
required to be complied with (i) on an incurrence basis and/or (ii) in respect of the senior secured credit facilities, when
the associated revolving credit facilities have been drawn beyond a specified percentage of the total available revolving
credit commitments, on a maintenance basis;
• Subject to certain customary and agreed exceptions, our credit facilities contain certain restrictions which, among other
things, restrict our ability to (i) incur or guarantee certain financial indebtedness, (ii) make certain disposals and
acquisitions, (iii) create certain security interests over our assets and (iv) make certain restricted payments to our direct
and/or indirect parent companies through dividends, loans or other distributions;

VIRGIN MEDIA INC.
Notes to Consolidated Financial Statements — (Continued)
December 31, 2018, 2017 and 2016
II - 31
• Our credit facilities require that certain subsidiaries of Virgin Media (i) guarantee the payment of all sums payable under
the relevant credit facility and (ii) in respect of our senior secured credit facilities, grant first-ranking security over
substantially all of their assets to secure the payment of all sums payable thereunder;
• In addition to certain mandatory prepayment events, the instructing group of lenders under our senior secured credit
facilities, under certain circumstances, may cancel the group's commitments thereunder and declare the loan(s) thereunder
due and payable after the notice period following the occurrence of a change of control (as specified in the senior secured
credit facility);
• In addition to certain mandatory prepayment events, the individual lender under each of our senior credit facilities, under
certain circumstances, may cancel its commitments thereunder and declare the loan(s) thereunder due and payable at a
price of 101% after the applicable notice period following the occurrence of a change of control (as specified in the
relevant senior credit facility);
• Our credit facilities contain certain customary events of default, the occurrence of which, subject to certain exceptions,
materiality qualifications and cure rights, would allow the instructing group of lenders to (i) cancel the total commitments,
(ii) declare that all or part of the loans be payable on demand and/or (iii) accelerate all outstanding loans and terminate
their commitments thereunder;
• Our credit facilities require that we observe certain affirmative and negative undertakings and covenants, which are subject
to certain materiality qualifications and other customary and agreed exceptions;
• In addition to customary default provisions, our senior secured credit facilities include cross-default provisions with
respect to our other indebtedness, subject to agreed minimum thresholds and other customary and agreed exceptions; and
• Our senior credit facilities provide that any failure to pay principal after the expiration of any applicable grace period, or
any acceleration with respect to other indebtedness of the borrower or certain subsidiaries over agreed minimum thresholds
(as specified under the applicable senior credit facility), is an event of default under the respective senior credit facility.
Senior and Senior Secured Notes. Virgin Media Finance PLC (Virgin Media Finance) and Virgin Media Secured Finance
PLC (Virgin Media Secured Finance), each a wholly-owned subsidiary of Virgin Media, have issued certain senior and senior
secured notes, respectively. In general, our senior and senior secured notes (i) are senior obligations of the issuer of such notes
that rank equally with all of the existing and future senior debt of such issuer and are senior to all existing and future subordinated
debt of such issuer, (ii) contain, in most instances, certain guarantees from Virgin Media and certain other subsidiaries of Virgin
Media (as specified in the applicable indenture) and (iii) with respect to our senior secured notes, are secured by certain pledges
or liens over the assets and/or shares of our subsidiaries. In addition, the indentures governing our senior and senior secured notes
contain certain covenants, the more notable of which are as follows:
• Our notes provide that any failure to pay principal after the expiration of any applicable grace period, or any acceleration
with respect to other indebtedness of the issuer or certain subsidiaries over agreed minimum thresholds (as specified
under the applicable indenture), is an event of default under the respective notes;
• Subject to certain materiality qualifications and other customary and agreed exceptions, our notes contain (i) certain
customary incurrence-based covenants and (ii) certain restrictions that, among other things, restrict our ability to (a) incur
or guarantee certain financial indebtedness, (b) make certain disposals and acquisitions, (c) create certain security interests
over our assets and (d) make certain restricted payments to our direct and/or indirect parent companies through dividends,
loans or other distributions;
• If we or certain of our subsidiaries (as specified in the applicable indenture) sell certain assets, we must, subject to certain
materiality qualifications and other customary and agreed exceptions, offer to repurchase the applicable notes at par, or
if a change of control (as specified in the applicable indenture) occurs, we must offer to repurchase all of the relevant
notes at a redemption price of 101%; and

VIRGIN MEDIA INC.
Notes to Consolidated Financial Statements — (Continued)
December 31, 2018, 2017 and 2016
II - 32
• Our senior secured notes contain certain early redemption provisions including, for certain senior secured notes, the ability
to, during each 12-month period commencing on the issue date for such notes until the applicable call date (Call Date),
redeem up to 10% of the original principal amount of the notes at a redemption price equal to 103% of the principal
amount of the notes to be redeemed plus accrued and unpaid interest.
VM Notes
The details of the outstanding notes of Virgin Media as of December 31, 2018 are summarized in the following table:
Originalissue
amount
Outstanding principalamount
VM Notes MaturityInterest
rateBorrowingcurrency
Poundsterling
equivalentCarryingvalue (a)
in millions
VM Senior Notes:
2022 VM Senior Notes:
2022 VM 4.875% Dollar Senior Notes.................. February 15, 2022 4.875% $ 118.7 $ 74.3 £ 58.3 £ 58.5
2022 VM 5.25% Dollar Senior Notes.................. February 15, 2022 5.250% $ 95.0 $ 63.3 49.6 49.7
2022 VM Sterling Senior Notes............................. February 15, 2022 5.125% £ 44.1 £ 44.1 44.1 44.3
2024 VM Senior Notes:
2024 VM Dollar Senior Notes ............................... October 15, 2024 6.000% $ 500.0 $ 497.0 389.9 387.3
2024 VM Sterling Senior Notes............................. October 15, 2024 6.375% £ 300.0 £ 300.0 300.0 298.4
2025 VM Senior Notes:
2025 VM Dollar Senior Notes ............................... January 15, 2025 5.750% $ 400.0 $ 400.0 313.8 311.7
2025 VM Euro Senior Notes.................................. January 15, 2025 4.500% € 460.0 € 460.0 413.3 409.9
VM Senior Secured Notes:
2021 VM Senior Secured Notes:
2021 VM Sterling Senior Secured Notes............... January 15, 2021 5.500% £ 628.4 £ 107.1 107.1 106.9
2021 VM Dollar Senior Secured Notes ................. January 15, 2021 5.250% $ 447.9 $ 447.9 351.4 354.6
2025 VM Senior Secured Notes:
2025 VM 6.0% Sterling Senior Secured Notes (b).............................................................. January 15, 2025 6.000% £ 521.3 £ 521.3 521.3 532.7
2025 VM 5.5% Sterling Senior Secured Notes ..... January 15, 2025 5.500% £ 430.0 £ 387.0 387.0 385.8
2025 VM 5.125% Sterling Senior Secured Notes ................................................................... January 15, 2025 5.125% £ 300.0 £ 300.0 300.0 298.0
2025 VM Dollar Senior Secured Notes ................. January 15, 2025 5.500% $ 425.0 $ 354.5 278.1 277.3
2026 VM Senior Secured Notes:
2026 VM 5.25% Dollar Senior Secured Notes...... January 15, 2026 5.250% $ 1,000.0 $ 1,000.0 784.6 786.0
2026 VM 5.5% Dollar Senior Secured Notes........ August 15, 2026 5.500% $ 750.0 $ 750.0 588.4 583.9
2027 Senior Secured Notes:
2027 VM 4.875% Sterling Senior Secured Notes ................................................................... January 15, 2027 4.875% £ 525.0 £ 525.0 525.0 523.4
2027 VM 5.0% Sterling Senior Secured Notes ..... April 15, 2027 5.000% £ 675.0 £ 675.0 675.0 671.6
2029 VM Sterling Senior Secured Notes ................. March 28, 2029 6.250% £ 400.0 £ 400.0 400.0 400.8
Total .................................................................................................................................................................. £ 6,486.9 £ 6,480.8
_______________
(a) Amounts are net of deferred financing costs, discounts and premiums, including amounts recorded in connection with the
acquisition accounting for Virgin Media, where applicable.

VIRGIN MEDIA INC.
Notes to Consolidated Financial Statements — (Continued)
December 31, 2018, 2017 and 2016
II - 33
(b) Interest on the 2025 VM 6.0% Sterling Senior Secured Notes initially accrues at a rate of 6.0% up to January 15, 2021 and
at a rate of 11.0% thereafter. In light of these terms, the maturity table included at the end of this note assumes that the 2025
VM 6.0% Sterling Senior Secured Notes will be repaid in 2021.
Subject to the circumstances described below, the VM Notes are non-callable prior to the applicable Call Date as presented
in the below table. At any time prior to the respective Call Date, Virgin Media may redeem some or all of the applicable notes by
paying a “make-whole” premium, which is the present value of all remaining scheduled interest payments to the applicable Call
Date using the discount rate (as specified in the applicable indenture) as of the redemption date plus 50 basis points (25 basis points
in the case of the 2021 VM Senior Secured Notes).
VM Notes Call Date
2022 VM Senior Notes .................................................................................................................................... (a)
2024 VM Senior Notes .................................................................................................................................... October 15, 2019
2025 VM Senior Notes .................................................................................................................................... January 15, 2020
2021 VM Senior Secured Notes ...................................................................................................................... (a)
2025 VM 6.0% Sterling Senior Secured Notes ............................................................................................... January 15, 2021
2025 VM 5.5% Sterling Senior Secured Notes ............................................................................................... January 15, 2019
2025 VM 5.125% Sterling Senior Secured Notes ........................................................................................... January 15, 2020
2025 VM Dollar Senior Secured Notes ........................................................................................................... January 15, 2019
2026 VM 5.25% Dollar Senior Secured Notes................................................................................................ January 15, 2020
2026 VM 5.5% Dollar Senior Secured Notes.................................................................................................. August 15, 2021
2027 VM 4.875% Sterling Senior Secured Notes ........................................................................................... January 15, 2021
2027 VM 5.0% Sterling Senior Secured Notes ............................................................................................... April 15, 2022
2029 VM Sterling Senior Secured Notes......................................................................................................... January 15, 2021
_______________
(a) The 2022 VM Senior Notes and the 2021 VM Senior Secured Notes are non-callable. At any time prior to maturity, some
or all of these notes may be redeemed by paying a “make-whole” premium, which is the present value of all remaining
scheduled interest payments to the respective maturity date.
Virgin Media may redeem some or all of the VM Senior Notes and the VM Senior Secured Notes (with the exception of the
2022 VM Senior Notes and the 2021 VM Senior Secured Notes) at the following redemption prices (expressed as a percentage of
the principal amount) plus accrued and unpaid interest and additional amounts (as specified in the applicable indenture), if any,
to the applicable redemption date, as set forth below:
Redemption Price
2024 VMDollar
Senior Notes
2024 VMSterling
Senior Notes
2025 VMDollar
Senior Notes
2025 VMEuro Senior
Notes
2025 VM6.0%
SterlingSenior
SecuredNotes
2025 VM5.5%
SterlingSenior
SecuredNotes
2025 VM5.125%SterlingSenior
SecuredNotes
12-month periodcommencing ............. October 15 October 15 January 15 January 15 January 15 January 15 January 15
2019.......................... 103.000% 103.188% N.A. N.A. N.A. 102.75% N.A.
2020.......................... 102.000% 102.125% 102.875% 102.250% N.A. 101.833% 102.563%
2021.......................... 101.000% 101.063% 101.917% 101.500% 105.000% 100.000% 101.708%
2022.......................... 100.000% 100.000% 100.958% 100.750% 102.500% 100.000% 100.854%
2023 and thereafter... 100.000% 100.000% 100.000% 100.000% 100.000% 100.000% 100.000%

VIRGIN MEDIA INC.
Notes to Consolidated Financial Statements — (Continued)
December 31, 2018, 2017 and 2016
II - 34
Redemption Price
2025 VMDollar SeniorSecured Notes
2026 VM5.25% Dollar
Senior SecuredNotes
2026 VM 5.5%Dollar SeniorSecured Notes
2027 VM4.875%
Sterling SeniorSecured Notes
2027 VM 5.0%Sterling SeniorSecured Notes
2029 VMSterling SeniorSecured Notes
12-month periodcommencing ............. January 15 January 15 August 15 January 15 April 15 January 15
2019.......................... 102.750% N.A. N.A. N.A. N.A. N.A.
2020.......................... 101.833% 102.625% N.A. N.A. N.A. N.A.
2021.......................... 100.000% 101.313% 102.750% 102.438% N.A. 103.125%
2022.......................... 100.000% 100.656% 101.375% 101.219% 102.500% 102.083%
2023.......................... 100.000% 100.000% 100.688% 100.609% 101.250% 101.042%
2024.......................... 100.000% 100.000% 100.000% 100.000% 100.625% 100.000%
2025 and thereafter... N.A. 100.000% 100.000% 100.000% 100.000% 100.000%
VM Credit Facilities
The VM Credit Facilities are the senior and senior secured credit facilities of certain subsidiaries of Virgin Media. The details
of our borrowings under the VM Credit Facilities as of December 31, 2018 are summarized in the following table:
VM Credit Facilities Maturity Interest rate
Facilityamount
(in borrowingcurrency)
Outstandingprincipalamount
Unusedborrowingcapacity
Carryingvalue (a)
in millions
Senior SecuredFacilities:
K (b)........................ January 15, 2026 LIBOR + 2.50% $ 3,400.0 £ 2,667.5 £ — £ 2,649.2
L (b) ........................ January 15, 2027 LIBOR +3.25% £ 400.0 400.0 — 396.6
M (b) ....................... November 15, 2027 LIBOR +3.25% £ 500.0 500.0 — 494.0
VM RevolvingFacility A (c) ......... December 31, 2021 LIBOR +2.75% (c) — 50.0 —
VM RevolvingFacility B (c) ......... January 15, 2024 LIBOR +2.75% (c) — 625.0 —
Total Senior Secured Facilities ................................................................................ 3,567.5 675.0 3,539.8
Senior Facilities:
VM FinancingFacility I (d) .......... September 15, 2024 5.50% £ 40.6 40.6 — 40.6
VM FinancingFacility II (d) ......... April 15, 2023 5.75% £ 1.3 1.3 — 1.3
Total Senior Facilities .............................................................................................. 41.9 — 41.9
Total........................................................................................................................ £ 3,609.4 £ 675.0 £ 3,581.7
_______________
(a) Amounts are net of deferred financing costs and discounts, where applicable.
(b) VM Facility K, VM Facility L and VM Facility M are each subject to a LIBOR floor of 0.00%.
(c) Unused borrowing capacity under the VM Credit Facilities relates to multi-currency revolving facilities with an aggregate
maximum borrowing capacity equivalent to £675.0 million and has a fee on unused commitments of 1.1% per year. During
2018, the VM Revolving Facility was amended and split into two revolving facilities. As of December 31, 2018, VM

VIRGIN MEDIA INC.
Notes to Consolidated Financial Statements — (Continued)
December 31, 2018, 2017 and 2016
II - 35
Revolving Facility A was a multi-currency revolving facility maturing on December 31, 2021 with a maximum borrowing
capacity equivalent to £50.0 million and VM Revolving Facility B was a multi-currency revolving facility maturing on
January 15, 2024 with a maximum borrowing capacity equivalent to £625.0 million. All other terms from the previously
existing VM Revolving Facility will continue to apply to the new revolving facilities.
(d) Amounts represent borrowings that are owed to certain non-consolidated special purpose financing entities that have issued
notes to finance the purchase of receivables due from our company to certain other third parties for amounts that we and
our subsidiaries have vendor financed. To the extent that the proceeds from these notes exceed the amount of vendor financed
receivables available to be purchased, the excess proceeds are used to fund these excess cash facilities.
2018 Financing Transactions
In August 2018, we received cash of £417.3 million (equivalent) through the partial repayment of a related-party loan from
Liberty Global Europe 2 Limited (LG Europe 2), our immediate parent. We in turn used this cash to redeem (i) $190.0 million
(£149.1 million) of the $530.0 million (£415.8 million) outstanding principal amount of the 2023 VM Dollar Senior Notes and
(ii) in full the £250.0 million outstanding principal amount of the 2023 VM Sterling Senior Notes. These transactions were funded
with a portion of the proceeds received by another Liberty Global subsidiary in connection with the sale of Liberty Global’s
operations in Austria. In October 2018, we received cash of £255.8 million (equivalent) through the partial repayment of a related-
party loan from LG Europe 2 which we used to redeem in full the $340.0 million (£266.8 million) outstanding principal amount
of the 2023 VM Dollar Senior Notes. In connection with these transactions, we recognized a loss on debt modification and
extinguishment, net, of £28.3 million related to (a) the payment of £22.0 million of redemption premiums and (b) the write-off of
£6.3 million of unamortized deferred financing costs and discounts.
2017 and 2016 Financing Transactions
During 2017 and 2016, we completed a number of financing transactions that generally resulted in lower interest rates and
extended maturities. In connection with these transactions, we recognized losses on debt modification and extinguishment, net,
of £52.4 million and £62.9 million during 2017 and 2016, respectively. These losses include (i) the write-off of unamortized
deferred financing costs and discounts of £31.0 million and £20.7 million, respectively, (ii) the payment of redemption premiums
of £26.0 million and £42.2 million, respectively, (iii) the write-off of £5.7 million of unamortized premiums in 2017 and (iv) the
payment of third-party costs of £1.1 million in 2017.

VIRGIN MEDIA INC.
Notes to Consolidated Financial Statements — (Continued)
December 31, 2018, 2017 and 2016
II - 36
Maturities of Debt and Capital Lease Obligations
The pound sterling equivalents of the maturities of our debt and capital lease obligations as of December 31, 2018 are presented
below:
Third-party debt
Related-party debt
Capital leaseobligations Total
in millions
Year ending December 31:
2019 ..................................................................................................... £ 1,925.5 £ — £ 9.6 £ 1,935.1
2020 ..................................................................................................... 12.4 — 7.3 19.7
2021 ..................................................................................................... 1,036.1 57.2 7.0 1,100.3
2022 ..................................................................................................... 246.4 — 8.8 255.2
2023 ..................................................................................................... 59.1 — 5.4 64.5
Thereafter ............................................................................................ 9,123.9 55.5 135.6 9,315.0
Total maturities.................................................................................. 12,403.4 112.7 173.7 12,689.8
Deferred financing costs, discounts and premiums, net ........................ (29.9) — — (29.9)
Amounts representing interest ............................................................... — — (119.5) (119.5)
Total ................................................................................................... £ 12,373.5 £ 112.7 £ 54.2 £ 12,540.4
Current portion....................................................................................... £ 1,925.5 £ — £ 5.7 £ 1,931.2
Noncurrent portion................................................................................. £ 10,448.0 £ 112.7 £ 48.5 £ 10,609.2
Non-cash Financing Transactions
Certain of our financing transactions include non-cash borrowings and repayments. During 2018, 2017 and 2016, non-cash
borrowings and repayments aggregated £99.3 million, £3,966.5 million and nil, respectively.

VIRGIN MEDIA INC.
Notes to Consolidated Financial Statements — (Continued)
December 31, 2018, 2017 and 2016
II - 37
(9) Income Taxes
Virgin Media files its primary income tax return in the U.S. Our subsidiaries file income tax returns in the U.S., the U.K. and
Ireland. The income taxes of Virgin Media and its subsidiaries are presented on a separate return basis for each tax-paying entity
or group.
The components of our loss before income taxes are as follows:
Year ended December 31,
2018 2017 2016
in millions
U.S. ........................................................................................................................ £ (14.1) £ (23.6) £ (32.8)
U.K. ....................................................................................................................... (10.2) (69.3) (247.3)
Ireland.................................................................................................................... (20.1) (15.5) (19.3)
Total..................................................................................................................... £ (44.4) £ (108.4) £ (299.4)
Income tax benefit consists of:
Current Deferred Total
in millions
Year ended December 31, 2018:
U.S. (a) ................................................................................................................ £ — £ 5.9 £ 5.9
U.K. ..................................................................................................................... (5.3) 6.8 1.5
Total................................................................................................................ £ (5.3) £ 12.7 £ 7.4
Year ended December 31, 2017:
U.S. (a) ................................................................................................................ £ 5.6 £ (16.0) £ (10.4)
U.K. ..................................................................................................................... (1.9) 33.8 31.9
Total................................................................................................................ £ 3.7 £ 17.8 £ 21.5
Year ended December 31, 2016:
U.S. (a) ................................................................................................................ £ 0.2 £ 52.4 £ 52.6
U.K. ..................................................................................................................... (1.9) (37.4) (39.3)
Ireland ................................................................................................................. 0.2 0.3 0.5
Total................................................................................................................ £ (1.5) £ 15.3 £ 13.8
_______________
(a) Includes federal and state income taxes. Our U.S. state income taxes were not material during any of the years presented.

VIRGIN MEDIA INC.
Notes to Consolidated Financial Statements — (Continued)
December 31, 2018, 2017 and 2016
II - 38
Income tax benefit attributable to our loss before income taxes differs from the amounts computed using the U.S. federal
income tax rates of 21.0%, 35.0% and 35.0% for 2018, 2017 and 2016, respectively, as a result of the following factors:
Year ended December 31,
2018 2017 2016
in millions
Computed “expected” tax benefit.......................................................................... £ 9.3 £ 37.9 £ 104.8
Change in valuation allowances ............................................................................ 56.5 (3.8) 54.0
Basis and other differences in the treatment of items associated withinvestments in subsidiaries (a) ........................................................................... (52.4) (24.1) (17.8)
Enacted tax law and rate changes (b) .................................................................... 25.6 7.6 (102.8)
Non-deductible or non-taxable interest and other expenses.................................. (18.4) 6.4 10.1
Non-deductible or non-taxable foreign currency exchange results ....................... (5.8) 10.5 (1.3)
International rate differences (c)............................................................................ (3.6) (21.7) (45.1)
Other, net ............................................................................................................... (3.8) 8.7 11.9
Total income tax benefit ................................................................................... £ 7.4 £ 21.5 £ 13.8
_______________
(a) These amounts reflect the net impact of differences in the treatment of income and loss items between financial reporting
and tax accounting related to investments in subsidiaries and affiliates including the effects of foreign earnings.
(b) On December 22, 2017, the U.S. corporate income tax rate was reduced from 35.0% to 21.0% effective January 1, 2018.
Substantially all of the impacts of the U.S. tax rate change on our deferred tax balances were recorded during the fourth
quarter of 2017. During the third quarter of 2016, the U.K. enacted legislation that will reduce the corporate income tax
rate in April 2020 from 18.0% to 17.0%. Substantially all of the impact of this rate change on our deferred tax balances was
recorded during the third quarter of 2016.
(c) Amounts reflect statutory rates in the U.K. and Ireland, which are lower than the U.S. federal income tax rate.

VIRGIN MEDIA INC.
Notes to Consolidated Financial Statements — (Continued)
December 31, 2018, 2017 and 2016
II - 39
Our net deferred tax assets were £1,453.5 million and £1,432.4 million at December 31, 2018 and December 31, 2017,
respectively.
The tax effects of temporary differences that give rise to significant portions of the deferred tax assets and deferred tax liabilities
are presented below:
December 31,
2018 2017
in millions
Deferred tax assets:
Capital and net operating loss carryforwards ............................................................................... £ 2,272.4 £ 2,344.0
Property and equipment, net ......................................................................................................... 1,465.0 1,486.7
Other future deductible amounts .................................................................................................. 42.8 47.6
Deferred tax assets ................................................................................................................... 3,780.2 3,878.3
Valuation allowance...................................................................................................................... (2,190.6) (2,252.7)
Deferred tax assets, net of valuation allowance .................................................................... 1,589.6 1,625.6
Deferred tax liabilities:
Intangible assets............................................................................................................................ (85.9) (158.5)
Property and equipment, net ......................................................................................................... (15.2) (14.1)
Other future taxable amounts........................................................................................................ (35.0) (20.6)
Deferred tax liabilities.............................................................................................................. (136.1) (193.2)
Net deferred tax asset........................................................................................................... £ 1,453.5 £ 1,432.4
Our deferred income tax valuation allowance decreased £62.1 million in 2018. This decrease primarily reflects the net effect
of (i) the net tax benefit of £56.5 million, (ii) decreases associated with reduction in deferred tax assets and (iii) other individually
insignificant items.
At December 31, 2018 and 2017, we had property and equipment on which future U.K. tax deductions can be claimed of
£14.1 billion and £14.2 billion, respectively. The maximum amount of these “capital allowances” that can be claimed in any one
year is 18% of the remaining balance, after additions, disposals and prior claims. The tax effects of the excess of these capital
allowances over the related financial reporting bases are included in the 2018 and 2017 deferred tax assets related to property and
equipment, net, in the above table.
VIRGIN MEDIA INC.
Notes to Consolidated Financial Statements — (Continued)
December 31, 2018, 2017 and 2016
II - 40
The significant components of our tax loss carryforwards and related tax assets at December 31, 2018 are as follows:
Country
Capital and netoperating losscarryforwards
Relatedtax asset
Expirationdate
in millions
U.K.
Amount attributable to capital losses ....................................................... £ 12,102.8 £ 2,057.5 Indefinite
Amount attributable to net operating losses (a) ....................................... 777.1 132.1 Indefinite
U.S. ............................................................................................................. 299.9 13.2 2033 onwards
Ireland ......................................................................................................... 554.1 69.6 Indefinite
Total ....................................................................................................... £ 13,733.9 £ 2,272.4
_______________
(a) This amount includes only the tax loss carryforwards generated by our U.K. subsidiaries. Our U.K. subsidiaries are within
the same U.K. tax group as our ultimate parent company, Liberty Global, and its U.K. subsidiaries. U.K. tax law permits
the surrendering, without cash payment, of tax losses between entities within the same tax group. During the year ended
December 31, 2018, tax losses with an aggregate tax effect of £17.4 million were surrendered by Liberty Global and its
U.K. subsidiaries outside of Virgin Media to our U.K. subsidiaries. These surrendered tax assets are reflected as an increase
to additional paid-in capital in our consolidated statement of owner’s equity.
The use of our tax loss carryforwards within each tax jurisdiction (both capital and ordinary losses) is limited. Certain tax
jurisdictions limit the ability to offset taxable income of a separate company or different tax group with the tax losses associated
with another separate company or group. The majority of the tax loss carryforwards shown in the above table are not expected to
be realized.
We have taxable outside basis differences on certain investments in non-U.S. subsidiaries. For this purpose, the outside basis
difference is any difference between the aggregate tax basis in the equity of a consolidated subsidiary and the corresponding amount
of the subsidiary’s net equity, including cumulative translation adjustments, as determined for financial reporting purposes. This
outside basis difference does not include unremitted earnings. At December 31, 2018, we have not provided deferred tax liabilities
on an estimated £4.6 billion of cumulative temporary differences on the outside bases of non-U.S. entities.
Through our subsidiaries, we maintain a significant presence in the U.K. The U.K. maintains a highly complex tax regime
that differs significantly from the system of income taxation used in the U.S. We have accounted for the effect of foreign taxes
based on what we believe is reasonably expected to apply to us and our subsidiaries based on tax laws currently in effect and
reasonable interpretations of these laws.
We comply with taxation legislation and are subject to audit by tax authorities in all jurisdictions in which we operate. Although
we expect that the tax amounts presented are reasonable, there is no assurance that the final determination of tax audits or tax
disputes will not be different from what is reflected in our recorded income tax provisions.
The Tax Cuts and Jobs Act (the 2017 U.S. Tax Act) was signed into U.S. law on December 22, 2017. Significant changes to
the U.S. income tax regime include the imposition of taxes on a one-time deemed mandatory repatriation of earnings and profits
of foreign corporations (the Mandatory Repatriation Tax) and a new tax on global intangible low-taxed income (the GILTI
Tax).
The Mandatory Repatriation Tax requires that the aggregate post-1986 earnings and profits of our foreign corporations be
included in our U.S. taxable income. As of December 31, 2018, we do not have a liability for the Mandatory Repatriation Tax.
The GILTI Tax will require U.S. entities that are shareholders in foreign corporations to include in their taxable income for
each year beginning after December 31, 2018, their pro rata share of global intangible low-taxed income. The GILTI Tax is
calculated as the excess of the net foreign corporation income over a deemed return. The GILTI Tax is reported as a period cost
when it is incurred.

VIRGIN MEDIA INC.
Notes to Consolidated Financial Statements — (Continued)
December 31, 2018, 2017 and 2016
II - 41
We and our subsidiaries file consolidated and standalone income tax returns in the U.S., the U.K. and Ireland. In the normal
course of business, our income tax filings are subject to review by various taxing authorities. In connection with such reviews,
disputes could arise with the taxing authorities over the interpretation or application of certain income tax rules related to our
business in that tax jurisdiction. Such disputes may result in future tax and interest and penalty assessments by these taxing
authorities. The ultimate resolution of tax contingencies will take place upon the earlier of (i) the settlement date with the applicable
taxing authorities in either cash or agreement of income tax positions or (ii) the date when the tax authorities are statutorily
prohibited from adjusting the company’s tax computations.
Tax returns filed by our company or our subsidiaries for years prior to 2014 are largely no longer subject to examination by
tax authorities.
The changes in our unrecognized tax benefits are summarized below:
Year ended December 31,
2018 2017 2016
in millions
Balance at beginning of period............................................................................... £ 98.8 £ 17.3 £ 13.8
Additions for tax positions of prior years ............................................................ 16.2 — —
Additions based on tax positions related to the current year ............................... 5.0 89.8 3.3
Foreign currency translation ................................................................................ 6.6 (2.6) 2.2
Reductions for tax positions of prior years .......................................................... — (4.2) (1.7)
Lapse of statute of limitations.............................................................................. — (1.5) (0.3)
Balance at end of period......................................................................................... £ 126.6 £ 98.8 £ 17.3
No assurance can be given that any of these tax benefits will be recognized or realized.
As of December 31, 2018, our unrecognized tax benefits included £120.5 million of tax benefits that would have a favorable
impact on our effective income tax rate if ultimately recognized, after considering amounts that we would expect to be offset by
valuation allowances.
We do not expect any material changes to our unrecognized tax benefits during 2019. No assurance can be given as to the
nature or impact of any changes in our unrecognized tax positions during 2019.
(10) Owner's Equity
Virgin Media has 111 shares of common stock outstanding.
(11) Share-based Compensation
Our share-based compensation expense represents amounts allocated to our company by Liberty Global and related employer
taxes. The amounts allocated by Liberty Global to our company represent share-based compensation associated with the Liberty
Global share-based incentive awards held by certain employees of our subsidiaries. Share-based compensation expense allocated
to our company by Liberty Global is reflected as an increase to parent’s equity and is offset by any amounts recharged to us by
Liberty Global, as further described in note 12. Incentive awards are denominated in U.S. dollars.

VIRGIN MEDIA INC.
Notes to Consolidated Financial Statements — (Continued)
December 31, 2018, 2017 and 2016
II - 42
The following table summarizes our share-based compensation expense, which is included in SG&A expense in our
consolidated statements of operations:
Year ended December 31,
2018 2017 2016
in millions
Performance-based incentive awards (a)................................................................ £ 5.0 £ 4.8 £ 16.1
Other share-based incentive awards ....................................................................... 17.3 16.7 14.9
Other (b) ................................................................................................................. 6.4 0.5 —
Total.................................................................................................................... £ 28.7 £ 22.0 £ 31.0
_______________
(a) Includes share-based compensation expense related to (i) Liberty Global PSUs and (ii) in 2016, a challenge performance
award plan for certain executive officers and key employees of Liberty Global, including certain employees of our
subsidiaries (the Challenge Performance Awards). The Challenge Performance Awards included PSARs and PSUs.
(b) Represents annual incentive compensation and defined contribution plan liabilities that have been or are expected to be
settled with Liberty Global ordinary shares. In the case of the annual incentive compensation, shares will be issued to senior
management and key employees pursuant to a shareholding incentive program that was implemented in the fourth quarter
of 2017. The shareholding incentive program allows these employees to elect to receive up to 100% of their annual incentive
compensation in ordinary shares of Liberty Global in lieu of cash.
As of December 31, 2018, £51.1 million of total unrecognized compensation cost related to our Liberty Global share-based
compensation awards is expected to be recognized by our company over a weighted-average period of approximately 2.1 years.
The following table summarizes incentive awards held by employees of our subsidiaries with respect to Liberty Global ordinary
shares:
Class A Class C
December 31,
2018 2017 2018 2017
Outstanding:
Options ................................................................................... 59,329 86,993 1,352,865 1,544,171
SARs....................................................................................... 2,770,982 2,156,692 5,882,884 4,578,937
RSUs....................................................................................... 239,862 181,958 500,255 361,726
PSUs ....................................................................................... 492,246 343,881 985,576 689,459
Exercisable:
Options ................................................................................... 59,329 76,176 1,302,037 209,162
SARs....................................................................................... 1,550,519 1,070,328 3,440,557 2,400,544
Share Incentive Plans — Liberty Global Ordinary Shares
Incentive Plans
As of December 31, 2018, Liberty Global was authorized to grant incentive awards under the Liberty Global 2014 Incentive
Plan. Generally, the compensation committee of Liberty Global’s board of directors may grant non-qualified share options, SARs,
restricted shares, RSUs, cash awards, performance awards or any combination of the foregoing (collectively, awards). Ordinary
shares issuable pursuant to awards made under these incentive plans will be made available from either authorized but unissued
shares or shares that have been issued but reacquired by Liberty Global. Awards may be granted at or above fair value in any class
of ordinary shares. The maximum number of Liberty Global ordinary shares with respect to which awards may be issued under

VIRGIN MEDIA INC.
Notes to Consolidated Financial Statements — (Continued)
December 31, 2018, 2017 and 2016
II - 43
the Liberty Global 2014 Incentive Plan is 105 million (of which no more than 50.25 million shares may consist of Class B ordinary
shares), subject to anti-dilution and other adjustment provisions in the respective plan. As of December 31, 2018, the Liberty
Global 2014 Incentive Plan had 46,220,904 ordinary shares available for grant.
Awards (other than performance-based awards) under the (i) Liberty Global 2014 Incentive Plan and (ii) VM Incentive Plan
after June 7, 2013 generally (a) vest 12.5% on the six month anniversary of the grant date and then vest at a rate of 6.25% each
quarter thereafter and (b) expire seven years after the grant date. RSUs vest on the date of the first annual general meeting of
Liberty Global shareholders following the grant date. These awards may be granted at or above fair value in any class of ordinary
shares. No further awards will be granted under the VM Incentive Plan.
Performance Awards
The following is a summary of the material terms and conditions with respect to Liberty Global’s performance-based awards
for certain executive officers and key employees.
Liberty Global PSUs
In March 2015, Liberty Global’s compensation committee approved the grant of PSUs to executive officers and key employees
(the 2015 PSUs). The performance plan for the 2015 PSUs covered a two-year period that ended on December 31, 2016 and
included a performance target based on the achievement of a specified compound annual growth rate (CAGR) in a consolidated
operating cash flow metric (as defined in the applicable underlying agreement). The performance target was adjusted for events
such as acquisitions, dispositions and changes in foreign currency exchange rates that affect comparability (OCF CAGR), and
the participant’s annual performance ratings during the two-year performance period. Participants earned 99.5% of their targeted
awards under the 2015 PSUs, which vested 50% on each of April 1 and October 1 of 2017.
In February 2016, Liberty Global’s compensation committee approved the grant of PSUs to executive officers and key
employees (the 2016 PSUs) pursuant to a performance plan that is based on the achievement of a specified OCF CAGR during
the three-year period ending December 31, 2018. The 2016 PSUs require delivery of a compound annual growth rate of our
consolidated OCF CAGR of 6.0% during the three-year performance period, with over- and under-performance payout opportunities
should the OCF CAGR exceed or fail to meet the target, as applicable. The performance payout may be adjusted at the compensation
committee’s discretion for events that may affect comparability, such as changes in foreign currency exchange rates and accounting
principles or policies. The 2016 PSUs will vest 50% on each of April 1, 2019 and October 1, 2019.
During 2018, the compensation committee of Liberty Global’s board of directors approved the grant of PSUs to executive
officers and key employees (the 2018 PSUs) pursuant to a performance plan that is based on the achievement of a specified Adjusted
OIBDA CAGR during the two-year period ending December 31, 2019. The 2018 PSUs include over- and under performance
payout opportunities should the Adjusted OIBDA CAGR exceed or fail to meet the target, as applicable. A performance range of
50% to 125% of the target Adjusted OIBDA CAGR will generally result in award recipients earning 50% to 150% of their target
2018 PSUs, subject to reduction or forfeiture based on individual performance. The earned 2018 PSUs will vest 50% on April 1,
2020 and 50% on October 1, 2020. The target Adjusted OIBDA CAGR for the 2018 PSUs was determined on October 26, 2018
and, accordingly, associated compensation expense has been recognized prospectively from that date.
Liberty Global Challenge Performance Awards
Effective June 24, 2013, Liberty Global’s compensation committee approved the Challenge Performance Awards, which
consisted solely of PSARs for Liberty Global’s senior executive officers and a combination of PSARs and PSUs for other executive
officers and key employees. Each PSU represented the right to receive one Liberty Global or LiLAC Class A or Class C ordinary
share, as applicable. The performance criteria for the Challenge Performance Awards was based on the participant’s performance
and achievement of individual goals in each of the years 2013, 2014 and 2015. As a result of satisfying performance conditions,
100% of the then outstanding Challenge Performance Awards vested and became fully exercisable on June 24, 2016. The PSARs
have a term of seven years and base prices equal to the respective market closing prices of the applicable class on the grant date.

VIRGIN MEDIA INC.
Notes to Consolidated Financial Statements — (Continued)
December 31, 2018, 2017 and 2016
II - 44
Virgin Media Incentive Awards
Equity awards were granted to certain of our employees, prior to Liberty Global’s acquisition of Virgin Media in June 2013,
under certain incentive plans maintained and administered by our company and no new grants will be made under these incentive
plans. The equity awards granted include stock options, restricted shares, RSUs and performance awards. Awards under the VM
Incentive Plan have a 10-year term and become fully exercisable within five years of continued employment.
(12) Related-party Transactions
Our related-party transactions consist of the following:
Year ended December 31,
2018 2017 2016
in millions
Credits (charges) included in:
Programming and other direct costs of services .................................................. £ (9.5) £ (3.3) £ (3.4)
Other operating .................................................................................................... 4.6 12.9 8.9
SG&A................................................................................................................... 8.9 3.5 (3.3)
Allocated share-based compensation expense ....................................................... (27.1) (20.2) (29.1)
Fees and allocations, net:
Operating and SG&A (exclusive of depreciation and share-basedcompensation) .................................................................................................. (32.5) (38.7) (29.5)
Depreciation......................................................................................................... (36.3) (38.2) (18.1)
Share-based compensation................................................................................... (34.1) (15.2) (20.1)
Management fee................................................................................................... (54.0) (48.6) (43.2)
Total fees and allocations, net ............................................................................ (156.9) (140.7) (110.9)
Included in operating income .......................................................................... (180.0) (147.8) (137.8)
Interest expense ...................................................................................................... (3.0) (1.9) (4.2)
Interest income ....................................................................................................... 314.1 329.9 289.6
Realized and unrealized gains (losses) on derivative instruments, net .................. 1.3 (2.2) 15.8
Included in net loss............................................................................................ £ 132.4 £ 178.0 £ 163.4
Property and equipment transfers in, net................................................................ £ 27.1 £ 57.8 £ 100.3
General. Virgin Media charges fees and allocates costs and expenses to certain other Liberty Global subsidiaries and certain
Liberty Global subsidiaries outside of Virgin Media charge fees and allocate costs and expenses to Virgin Media. Depending on
the nature of these related-party transactions, the amount of the charges or allocations may be based on (i) our estimated share of
the underlying costs, (ii) our estimated share of the underlying costs plus a mark-up or (iii) commercially-negotiated rates. The
methodology Liberty Global uses to allocate its central and administrative costs to its borrowing groups impacts the calculation
of the “EBITDA” metric specified by our debt agreements (Covenant EBITDA). In this regard, the components of related-party
fees and allocations that are deducted to arrive at our Covenant EBITDA are based on (a) the amount and nature of costs incurred
by the allocating Liberty Global subsidiaries during the period, (b) the allocation methodologies in effect during the period and
(c) the size of the overall pool of entities that are charged fees and allocated costs, such that changes in any of these factors would
likely result in changes to the amount of related-party fees and allocations that will be deducted to arrive at our Covenant EBITDA
in future periods. For example, to the extent that a Liberty Global subsidiary borrowing group was to acquire (sell) an operating
entity, and assuming no change in the total costs incurred by the allocating entities, the fees charged and the costs allocated to our
company would decrease (increase). Although we believe that the related-party charges and allocations described below are
reasonable, no assurance can be given that the related-party costs and expenses reflected in our consolidated statements of operations
are reflective of the costs that we would incur on a standalone basis. Our related-party transactions are generally cash settled unless
otherwise noted below.

VIRGIN MEDIA INC.
Notes to Consolidated Financial Statements — (Continued)
December 31, 2018, 2017 and 2016
II - 45
Programming and other direct costs of services. Amounts primarily consist of interconnect, roaming, lease and access fees
and other services provided to our company by other Liberty Global subsidiaries.
Other operating expenses. Amounts primarily consist of recharges of £6.2 million, £12.0 million and £11.3 million during
2018, 2017 and 2016, respectively, for network and technology services provided by our company to other Liberty Global
subsidiaries.
SG&A expenses. Amounts primarily consist of the net effect of (i) recharges of £10.7 million, £8.1 million and £2.7 million
during 2018, 2017 and 2016, respectively, for support function staffing and other services provided by our company to another
Liberty Global subsidiary and (ii) charges of £4.0 million, £1.6 million and £1.2 million, during 2018, 2017 and 2016, respectively,
for information technology-related services provided to our company by another Liberty Global subsidiary.
Allocated share-based compensation expense. Amounts are allocated to our company by Liberty Global and represent share-
based compensation expense associated with the Liberty Global share-based incentive awards held by certain employees of our
subsidiaries. Share-based compensation expense is included in SG&A expense in our consolidated statements of operations.
Fees and allocations, net. These amounts, which are based on our company’s estimated share of the applicable costs (including
personnel-related and other costs associated with the services provided) incurred by Liberty Global subsidiaries, represent the
aggregate net effect of charges between subsidiaries of Virgin Media and various Liberty Global subsidiaries that are outside of
Virgin Media. These charges generally relate to management, finance, legal, technology and other services that support our
company’s operations. The categories of our fees and allocations, net, are as follows:
• Operating and SG&A (exclusive of depreciation and share-based compensation). The amounts included in this category,
which are generally loan settled, represent our estimated share of certain centralized technology, management, marketing,
finance and other operating and SG&A expenses of Liberty Global’s subsidiaries, whose activities benefit multiple
operations, including operations within and outside of our company. The amounts allocated represent our estimated share
of the actual costs incurred by Liberty Global’s subsidiaries, without a mark-up. Amounts in this category are generally
deducted to arrive at our Covenant EBITDA.
• Depreciation. The amounts included in this category, which are generally loan settled, represent our estimated share of
depreciation of assets not owned by our company. The amounts allocated represent our estimated share of the actual costs
incurred by Liberty Global’s subsidiaries, without a mark-up.
• Share-based compensation. The amounts included in this category, which are generally loan settled, represent our estimated
share of share-based compensation associated with Liberty Global employees who are not employees of our company.
The amounts allocated represent our estimated share of the actual costs incurred by Liberty Global’s subsidiaries, without
a mark-up.
• Management fee. The amounts included in this category, which are generally loan settled, represent our estimated allocable
share of (i) operating and SG&A expenses related to stewardship services provided by certain Liberty Global subsidiaries
and (ii) the mark-up, if any, applicable to each category of the related-party fees and allocations charged to our company.
Liberty Global charges technology-based costs to our company using a royalty-based method. For 2018, 2017 and 2016, our
proportional share of the technology-based costs of £65.9 million, £37.1 million and £25.9 million, respectively, were nil, £1.4
million and £3.8 million, respectively, more than the actual amount charged under the royalty-based method. Accordingly, these
excess amounts have been reflected as a deemed contribution of technology-related services in our consolidated statements of
owner’s equity. The fees charged under the royalty-based method are expected to escalate in future periods. Any excess of these
charges over our estimated proportionate share of the underlying technology-based costs is classified as a management fee and
added back to arrive at Covenant EBITDA.
Interest expense. Amounts represent interest expense on long-term related-party debt, as further described below.
Interest income. Amounts represent interest income on long-term related-party notes receivable, as further described below.

VIRGIN MEDIA INC.
Notes to Consolidated Financial Statements — (Continued)
December 31, 2018, 2017 and 2016
II - 46
Realized and unrealized gains (losses) on derivative instruments, net. As further described in note 5, these amounts relate to
related-party foreign currency forward contracts with LGE Financing.
Property and equipment transfers, net. These amounts, which are generally cash settled, include the net carrying values of (i)
construction in progress, including certain capitalized labor, transferred to or acquired from other Liberty Global subsidiaries, (ii)
customer premises equipment acquired from other Liberty Global subsidiaries, which centrally procure equipment on behalf of
our company and various other Liberty Global subsidiaries, and (iii) used equipment transferred to or acquired from other Liberty
Global subsidiaries outside of Virgin Media.
The following table provides details of our related-party balances:
December 31,
2018 2017
in millions
Current receivables (a).............................................................................................................. £ 47.1 £ 90.2
Derivative instruments (b) ........................................................................................................ 1.6 8.5
Prepaid expenses....................................................................................................................... — 1.6
Long-term notes receivable (c) ................................................................................................. 4,863.6 5,065.9
Total related-party assets...................................................................................................... £ 4,912.3 £ 5,166.2
Accounts payable...................................................................................................................... £ 34.9 £ 3.0
Accrued capital expenditures (d) .............................................................................................. 15.1 17.3
Other current liabilities (e)........................................................................................................ 27.0 8.9
Long-term related-party debt (f) ............................................................................................... 112.7 56.9
Other long-term liabilities (b)................................................................................................... — 0.1
Total related-party liabilities ................................................................................................ £ 189.7 £ 86.2
_______________
(a) Amounts represent (i) accrued interest on long-term notes receivable from LG Europe 2, including £27.6 million (equivalent)
and £39.7 million (equivalent), respectively, owed to Virgin Media Finco Limited (Virgin Media Finco) and (ii) certain
receivables from other Liberty Global subsidiaries arising in the normal course of business.
(b) Amounts represent the fair value of related-party derivative instruments with LGE Financing, as further described in note
5.
(c) Amounts represent:
(i) a note receivable from LG Europe 2 that is owed to Virgin Media Finco. This note matures on April 15, 2023 and
bears interest at a rate of 8.50%. At December 31, 2018, the principal amount outstanding under this note was
£1,501.5 million. At each December 31, 2017 and 2016, the principal amount outstanding under this note was
£2,174.6 million. The decrease during 2018 relates to £673.1 million of cash repayments. The accrued interest on
this note is payable semi-annually on April 15 and October 15 and may be cash settled or, if mutually agreed, loan
settled;
(ii) a note receivable from LG Europe 2 that is owed to Virgin Media Finco. At December 31, 2018, 2017 and 2016,
the principal amount outstanding under this note was £3,324.5 million, £2,891.3 million and £2,496.6 million,
respectively. The increase during 2018 relates to (i) £4,953.2 million of cash advances, (ii) £4,377.7 million of
cash repayments and (iii) £142.3 million of other non-cash settlements. The increase during 2017 relates to (a)
£2,975.2 million of cash advances, (b) £2,432.2 million of cash repayments and (c) £148.3 million of other non-
cash settlements. The increase during 2016 relates to (1) £4,635.8 million of cash advances, (2) £3,219.1 million
of cash repayments, (3) £196.6 million of non-cash repayments and (4) £79.1 million of non-cash advances. Pursuant

VIRGIN MEDIA INC.
Notes to Consolidated Financial Statements — (Continued)
December 31, 2018, 2017 and 2016
II - 47
to the agreement, the maturity date is July 16, 2023, however Virgin Media Finco may agree to advance additional
amounts to LG Europe 2 at any time and LG Europe 2 may, with agreement from Virgin Media Finco, repay all
or part of the outstanding principal at any time prior to the maturity date. The note receivable is subject to further
advances and repayments. The interest rate on this note, which is subject to adjustment, was 4.825% as of
December 31, 2018, and the accrued interest on this note receivable may be cash settled on the last day of each
month and on the date of each full or partial repayment of the note receivable or, if mutually agreed, loan settled;
(iii) a note receivable from LG Europe 2 that is owed to Virgin Media. This note matures on April 15, 2023 and bears
interest at a rate of 7.875%. At December 31, 2018 and 2017, the principal amount outstanding under this note
was £9.2 million (equivalent) and nil, respectively. The increase during 2018 primarily relates to cash advances.
The activity during 2017 relates to (i) £445.3 million of cash advances, (ii) £317.9 million related to the conversion
of a related-party loan receivable to equity in connection with the VM Ireland NCI Acquisition (including £2.6
million of interest), (iii) £129.4 million of cash repayments (including £8.3 million of interest), (iv) £10.8 million
of accrued interest and (v) a decrease of £8.8 million due to the cumulative translation adjustment during the period.
The accrued interest on this note receivable is payable semi-annually on April 15 and October 15 and may be cash
settled or, if mutually agreed, loan settled; and
(iv) a note receivable from LG Europe 2 that is owed to Virgin Media Communications Limited (Virgin Media
Communications). This note matures on November 30, 2026 and bears interest at a rate, which is subject to
adjustment, of 4.95%. At December 31, 2018, the principal amount outstanding under this note was £28.4 million.
At each December 31, 2017 and 2016, the principal amount outstanding under this note was nil. The increase
during 2018 relates to other non-cash settlements. The accrued interest on this note receivable may be payable on
the last day of each month and on the date of each full or partial repayment of the outstanding Principal Amount,
or, on the first of January of every year, be added to the outstanding Principal Amount.
(d) Amounts represent accrued capital expenditures for property and equipment transferred to our company from other Liberty
Global subsidiaries.
(e) Amounts primarily represent (i) certain payables to other Liberty Global subsidiaries arising in the normal course of business
and (ii) unpaid capital charges from Liberty Global, as described below, which are settled periodically. None of these
payables are interest bearing.
(f) Amounts represent:
(i) a note payable from Virgin Media Mobile Finance Limited to LG Europe 2 which matures on December 18, 2021
and bears interest at a rate of 3.93%. At December 31, 2018, 2017 and 2016, the principal amount outstanding
under this note was £57.2 million, £56.9 million and nil, respectively. The increase in 2018 relates to the net effect
of (i) £76.4 million of cash repayments, (ii) £76.0 million of cash advances and (iii) £0.7 million in non-cash
accrued interest to the loan balance. The increase in 2017 relates to the net effect of (a) £44.0 million of cash
borrowings, (b) £32.9 million of cash repayments and (c) the transfer of £0.1 million in non-cash accrued interest
to the loan balance. The decrease in 2016 relates to the net effect of (1) £99.0 million of cash repayments and (2)
£72.7 million of cash borrowings. Accrued interest may be, as agreed to by our company and LG Europe 2, (I)
transferred to the loan balance annually on January 1 or (II) repaid on the last day of each month and on the date
of principal repayments; and
(ii) a note payable from Liberty Property Holdco III to Liberty Property Holdco II S.à r.l. (Liberty Property Holdco
II) which matures on November 30, 2028 and bears interest at a rate of 6.24%. At December 31, 2018 and 2017,
the principal amount outstanding under this note was £55.5 million and nil, respectively. The increase in 2018
relates to non-cash borrowings in connection with the VM Property Transfers. Accrued interest may be, as agreed
to by our company and Liberty Property Holdco II, (a) transferred to the loan balance annually on January 1 or
(b) repaid on the last day of each month and on the date of principal payments.
During 2018, 2017 and 2016, we recorded capital charges of $10.8 million (£8.1 million at the applicable rate), $25.8 million
(£21.3 million at the applicable rate) and $27.0 million (£19.8 million at the applicable rate), respectively, in our consolidated
statements of owner’s equity in connection with the exercise of Liberty Global SARs and options and the vesting of Liberty Global

VIRGIN MEDIA INC.
Notes to Consolidated Financial Statements — (Continued)
December 31, 2018, 2017 and 2016
II - 48
RSUs and PSUs held by employees of our subsidiaries. We and Liberty Global have agreed that these capital charges will be based
on the fair value of the underlying shares associated with share-based incentive awards that vest or are exercised during the period,
subject to any reduction that is necessary to ensure that the cumulative capital charge does not exceed the cumulative amount of
share-based compensation expense recorded by our company with respect to Liberty Global share-based incentive awards.
During 2018 and 2016, tax losses with an aggregate tax effect of £17.4 million and £24.8 million, respectively, were surrendered
by Liberty Global and its U.K. subsidiaries outside of Virgin Media to our U.K. subsidiaries. During 2017, tax losses with an
aggregate tax effect of £32.3 million were surrendered to Liberty Global and its U.K. subsidiaries outside of Virgin Media from
our U.K. subsidiaries. For additional information, see note 9.
Our parent company, Virgin Media, and certain Liberty Global subsidiaries are co-guarantors of the indebtedness of certain
other Liberty Global subsidiaries. We do not believe these guarantees will result in material payments in the future.
(13) Restructuring Liabilities
A summary of changes in our restructuring liabilities during 2018 is set forth in the table below:
Employeeseverance andtermination Office closures Total
in millions
Restructuring liability as of January 1, 2018 ....................................... £ 2.2 £ 6.8 £ 9.0
Restructuring charges (a).................................................................. 18.0 2.7 20.7
Cash paid .......................................................................................... (16.4) (4.2) (20.6)
Restructuring liability as of December 31, 2018 ................................. £ 3.8 £ 5.3 £ 9.1
Current portion..................................................................................... £ 2.7 £ 2.9 £ 5.6
Noncurrent portion............................................................................... 1.1 2.4 3.5
Total.................................................................................................. £ 3.8 £ 5.3 £ 9.1
_______________
(a) Our restructuring charges include employee severance and termination costs related to certain reorganization activities.
A summary of changes in our restructuring liabilities during 2017 is set forth in the table below:
Employeeseverance andtermination Office closures Total
in millions
Restructuring liability as of January 1, 2017 ....................................... £ 6.4 £ 5.4 £ 11.8
Restructuring charges (a).................................................................. 15.4 6.4 21.8
Cash paid .......................................................................................... (19.6) (5.0) (24.6)
Restructuring liability as of December 31, 2017 ................................. £ 2.2 £ 6.8 £ 9.0
Current portion..................................................................................... £ 1.2 £ 3.0 £ 4.2
Noncurrent portion............................................................................... 1.0 3.8 4.8
Total.................................................................................................. £ 2.2 £ 6.8 £ 9.0

VIRGIN MEDIA INC.
Notes to Consolidated Financial Statements — (Continued)
December 31, 2018, 2017 and 2016
II - 49
_______________
(a) Our restructuring charges include employee severance and termination costs related to certain reorganization and integration
activities.
A summary of changes in our restructuring liabilities during 2016 is set forth in the table below:
Employeeseverance andtermination Office closures Total
in millions
Restructuring liability as of January 1, 2016....................................... £ 2.9 £ 5.1 £ 8.0
Restructuring charges (a) ................................................................. 19.3 1.7 21.0
Cash paid.......................................................................................... (15.8) (1.2) (17.0)
Other ................................................................................................ — (0.2) (0.2)
Restructuring liability as of December 31, 2016................................. £ 6.4 £ 5.4 £ 11.8
Current portion .................................................................................... £ 5.2 £ 1.4 £ 6.6
Noncurrent portion .............................................................................. 1.2 4.0 5.2
Total ................................................................................................. £ 6.4 £ 5.4 £ 11.8
_______________
(a) Our restructuring charges include employee severance and termination costs related to certain reorganization and integration
activities.
(14) Defined Benefit Plans
We operate two defined benefit plans in the U.K. and one defined benefit plan in Ireland, all of which are funded. These
defined benefit plans are closed to new participants and existing participants do not accrue any additional benefits.
The table below provides summary information on our defined benefit plans:
December 31,
2018 2017 2016
in millions
Fair value of plan assets (a) ................................................................................... £ 645.0 £ 684.9 £ 650.9
Projected benefit obligation ................................................................................... £ 563.0 £ 623.5 £ 628.6
Net asset ................................................................................................................. £ 82.0 £ 61.4 £ 22.3
_______________
(a) The fair value of plan assets at December 31, 2018 includes £372.1 million, £77.5 million and £195.4 million, of assets that
are valued based on Level 1, Level 2 and Level 3 inputs, respectively, of the fair value hierarchy (as further described in
note 6). Our plan assets comprise investments in debt securities, equity securities, hedge funds, insurance contracts and
certain other assets.

VIRGIN MEDIA INC.
Notes to Consolidated Financial Statements — (Continued)
December 31, 2018, 2017 and 2016
II - 50
Our net periodic pension benefit was £9.1 million, £8.0 million and £6.4 million during 2018, 2017 and 2016, respectively.
There was no related service cost component in the periods presented. During 2018, contributions to our defined benefit plans
aggregated £14.3 million. Based on December 31, 2018 exchange rates and information available as of that date, we expect this
amount to be £2.5 million in 2019.
(15) Accumulated Other Comprehensive Earnings
Accumulated other comprehensive earnings included in our consolidated balance sheets and statements of owner’s equity
reflect the aggregate impact of foreign currency translation adjustments, pension-related adjustments and other. The changes in
the components of accumulated other comprehensive earnings, net of taxes, are summarized as follows:
Foreigncurrency
translationadjustments
Pension-related
adjustmentsand other
Totalaccumulated
othercomprehensive
earnings
in millions
Balance at January 1, 2016 ............................................................................. £ 125.7 £ (30.0) £ 95.7
Other comprehensive loss............................................................................. (2.9) (6.3) (9.2)
Balance at December 31, 2016 ....................................................................... 122.8 (36.3) 86.5
Other comprehensive loss............................................................................. (24.8) 4.8 (20.0)
Balance at December 31, 2017 ....................................................................... 98.0 (31.5) 66.5
Other comprehensive earnings ..................................................................... 25.1 (2.4) 22.7
Balance at December 31, 2018 ....................................................................... £ 123.1 £ (33.9) £ 89.2
The components of other comprehensive earnings (loss), net of taxes, are reflected in our consolidated statements of
comprehensive loss. The following table summarizes the tax effects related to each component of other comprehensive earnings
(loss), net of amounts reclassified to our consolidated statements of operations:
Pre-taxamount
Tax benefit(expense)
Net-of-taxamount
in millions
Year ended December 31, 2018:
Foreign currency translation adjustments..................................................... £ 25.1 £ — £ 25.1
Pension-related adjustments and other ......................................................... (2.9) 0.5 (2.4)
Other comprehensive earnings ................................................................... £ 22.2 £ 0.5 £ 22.7
Year ended December 31, 2017:
Foreign currency translation adjustments..................................................... £ (24.8) £ — £ (24.8)
Pension-related adjustments and other ......................................................... 5.1 (0.3) 4.8
Other comprehensive loss .......................................................................... £ (19.7) £ (0.3) £ (20.0)
Year ended December 31, 2016:
Foreign currency translation adjustments..................................................... £ (2.9) £ — £ (2.9)
Pension-related adjustments and other ......................................................... (6.9) 0.6 (6.3)
Other comprehensive loss .......................................................................... £ (9.8) £ 0.6 £ (9.2)

VIRGIN MEDIA INC.
Notes to Consolidated Financial Statements — (Continued)
December 31, 2018, 2017 and 2016
II - 51
(16) Commitments and Contingencies
Commitments
In the normal course of business, we have entered into agreements that commit our company to make cash payments in future
periods with respect to programming contracts, network and connectivity commitments, purchases of customer premises and other
equipment and services, non-cancellable operating leases and other items. The following table sets forth the pound sterling
equivalents of such commitments as of December 31, 2018. The commitments included in this table do not reflect any liabilities
that are included in our December 31, 2018 consolidated balance sheet.
Payments due during:
2019 2020 2021 2022 2023 Thereafter Total
in millions
Programming commitments ...................... £ 507.9 £ 321.3 £ 167.1 £ 20.5 £ 11.1 £ 35.1 £ 1,063.0
Network and connectivity commitments... 356.8 172.3 155.1 15.9 4.3 8.7 713.1
Purchase commitments (a) ........................ 350.1 119.0 44.4 10.2 0.7 0.2 524.6
Operating leases......................................... 36.8 29.6 24.9 20.3 17.2 52.1 180.9
Other commitments ................................... 17.0 0.6 — — — — 17.6
Total ...................................................... £ 1,268.6 £ 642.8 £ 391.5 £ 66.9 £ 33.3 £ 96.1 £ 2,499.2
_______________
(a) Includes £1.4 million of related-party purchase obligations due during 2019.
Programming commitments consist of obligations associated with certain of our programming contracts that are enforceable
and legally binding on us as we have agreed to pay minimum fees without regard to (i) the actual number of subscribers to the
programming services or (ii) whether we terminate service to a portion of our subscribers or dispose of a portion of our distribution
systems. Programming commitments do not include increases in future periods associated with contractual inflation or other price
adjustments that are not fixed. Accordingly, the amounts reflected in the above table with respect to these contracts are significantly
less than the amounts we expect to pay in these periods under these contracts. Historically, payments to programming vendors
have represented a significant portion of our operating costs, and we expect that this will continue to be the case in future periods.
In this regard, our total programming and copyright costs aggregated £877.7 million, £841.8 million and £799.4 million during
2018, 2017 and 2016, respectively.
Network and connectivity commitments include (i) commitments associated with our mobile virtual network operator (MVNO)
agreements and (ii) service commitments associated with the network extension program in the U.K. and Ireland (the Network
Extension). The amounts reflected in the above table with respect to certain of our MVNO commitments represent fixed minimum
amounts payable under these arrangements and therefore, may be significantly less than the actual amounts we ultimately pay in
these periods.
Purchase commitments include unconditional and legally binding obligations related to (i) the purchase of customer premises
and other equipment and (ii) certain service-related commitments, including call center, information technology and maintenance
services.
In addition to the commitments set forth in the table above, we have significant commitments under (i) derivative instruments
and (ii) defined benefit plans and similar agreements, pursuant to which we expect to make payments in future periods. For
information regarding our derivative instruments, including the net cash paid or received in connection with these instruments
during 2018, 2017 and 2016, see note 5. For information regarding our defined benefit plans, see note 14.
Rental expense under non-cancellable operating lease arrangements amounted to £27.3 million, £38.4 million and £49.6
million during 2018, 2017 and 2016, respectively. It is expected that in the normal course of business, operating leases that expire
generally will be renewed or replaced by similar leases.

VIRGIN MEDIA INC.
Notes to Consolidated Financial Statements — (Continued)
December 31, 2018, 2017 and 2016
II - 52
We have established defined contribution benefit plans for our subsidiaries’ employees. The aggregate expense for matching
contributions under the defined contribution employee benefit plans was £23.5 million, £18.6 million and £19.8 million during
2018, 2017 and 2016, respectively.
Guarantees and Other Credit Enhancements
In the ordinary course of business, we may provide (i) indemnifications to our lenders, our vendors and certain other parties,
(ii) performance and/or financial guarantees to local municipalities, our customers and vendors and (iii) guarantees as a co-guarantor
with certain other Liberty Global subsidiaries related to various financing arrangements. Historically, these arrangements have not
resulted in our company making any material payments and we do not believe that they will result in material payments in the
future.
Legal and Regulatory Proceedings and Other Contingencies
VAT Matters. Our application of VAT with respect to certain revenue generating activities has been challenged by the U.K.
tax authorities. We have estimated our maximum exposure in the event of an unfavorable outcome to be £47 million as of
December 31, 2018. No portion of this exposure has been accrued by our company as the likelihood of loss is not considered to
be probable. A court hearing was held at the end of September 2014 in relation to the U.K. tax authorities’ challenge and a decision
is expected in 2019.
On March 19, 2014, the U.K. government announced a change in legislation with respect to the charging of VAT in connection
with prompt payment discounts such as those that we offer to our fixed-line telephony customers. This change, which took effect
on May 1, 2014, impacted our company and some of our competitors. The U.K. tax authority issued a decision in the fourth quarter
of 2015 challenging our application of the prompt payment discount rules prior to the May 1, 2014 change in legislation. We
appealed this decision. As part of the appeal process, we were required to make aggregate payments of £67.0 million, comprising
(i) the challenged amount of £63.7 million (which we paid during the fourth quarter of 2015) and (ii) related interest of £3.3 million
(which we paid during the first quarter of 2016). No provision was recorded by our company at that time as the likelihood of loss
was not considered to be probable. The aggregate amount paid does not include penalties, which could be significant in the event
that penalties were to be assessed. In September 2018, the court rejected our appeal and ruled in favor of the U.K. tax authority.
Accordingly, during the third quarter of 2018, we recorded a provision for litigation of £63.7 million and related interest expense
of £3.3 million in our consolidated statement of operations. We have submitted our grounds for appeal to the Upper Tribunal and
expect to receive approval to appeal the judgment during the first quarter of 2019; however, no assurance can be given as to the
ultimate outcome of this matter.
Other Regulatory Issues. Video distribution, broadband internet, fixed-line telephony, mobile and content businesses are
subject to significant regulation and supervision by various regulatory bodies in the jurisdictions in which we operate, and other
U.K. and European Union (E.U.) authorities. Adverse regulatory developments could subject our businesses to a number of risks.
Regulation, including conditions imposed on us by competition or other authorities as a requirement to close acquisitions or
dispositions, could limit growth, revenue and the number and types of services offered and could lead to increased operating costs
and property and equipment additions. In addition, regulation may restrict our operations and subject them to further competitive
pressure, including pricing restrictions, interconnect and other access obligations, and restrictions or controls on content, including
content provided by third parties. Failure to comply with current or future regulation could expose our businesses to various
penalties.
Effective April 1, 2017, the rateable value of our existing network and other assets in the U.K. increased significantly. This
increase affects the amount we pay for network infrastructure charges as the annual amount payable to the U.K. government is
calculated by applying a percentage multiplier to the rateable value of assets. This change has and will continue to significantly
increase our network infrastructure charges. As compared to 2018, we expect the aggregate amount of this increase will be £28
million in 2019. Beyond 2019, we expect further but declining increases to these charges through the first quarter of 2022. We
continue to believe that these increases are excessive and retain the right of appeal should more favorable agreements be reached
with other operators. The rateable value of network and other assets constructed under our network extension program in the U.K.
remains subject to review by the U.K. government.
In addition to the foregoing items, we have contingent liabilities related to matters arising in the ordinary course of business
including (i) legal proceedings, (ii) issues involving VAT and wage, property, withholding and other tax issues and (iii) disputes

VIRGIN MEDIA INC.
Notes to Consolidated Financial Statements — (Continued)
December 31, 2018, 2017 and 2016
II - 53
over interconnection, programming, copyright and channel carriage fees. While we generally expect that the amounts required to
satisfy these contingencies will not materially differ from any estimated amounts we have accrued, no assurance can be given that
the resolution of one or more of these contingencies will not result in a material impact on our results of operations, cash flows or
financial position in any given period. Due, in general, to the complexity of the issues involved and, in certain cases, the lack of
a clear basis for predicting outcomes, we cannot provide a meaningful range of potential losses or cash outflows that might result
from any unfavorable outcomes.
(17) Segment Reporting
We have one reportable segment that provides video, broadband internet, fixed-line telephony, mobile and broadcasting services
in the U.K. and Ireland.
Our revenue by major category is set forth below:
Year ended December 31,
2018 2017 2016
in millions
Residential revenue:
Residential cable revenue (a):
Subscription revenue (b):
Video ............................................................................................................... £ 1,045.3 £ 1,017.9 £ 1,054.8
Broadband internet .......................................................................................... 1,600.4 1,489.6 1,356.1
Fixed-line telephony ....................................................................................... 921.6 940.3 948.4
Total subscription revenue............................................................................ 3,567.3 3,447.8 3,359.3
Non-subscription revenue.................................................................................. 71.1 94.0 83.2
Total residential cable revenue ................................................................... 3,638.4 3,541.8 3,442.5
Residential mobile revenue (c):
Subscription revenue (b).................................................................................... 360.1 370.1 408.8
Non-subscription revenue.................................................................................. 303.4 234.7 205.5
Total residential mobile revenue ..................................................................... 663.5 604.8 614.3
Total residential revenue............................................................................... 4,301.9 4,146.6 4,056.8
B2B revenue (d):
Subscription revenue ......................................................................................... 78.9 57.0 30.9
Non-subscription revenue.................................................................................. 699.1 696.3 673.2
Total B2B revenue........................................................................................... 778.0 753.3 704.1
Other revenue (e).................................................................................................... 70.4 63.3 45.2
Total .............................................................................................................. £ 5,150.3 £ 4,963.2 £ 4,806.1
_______________
(a) Residential cable subscription revenue includes amounts received from subscribers for ongoing services. Residential cable
non-subscription revenue includes, among other items, channel carriage fees, late fees, and revenue from the sale of
equipment. As described in note 2, we adopted ASU 2014-09 on January 1, 2018 using the cumulative effect transition
method. For periods subsequent to our adoption of ASU 2014-09, installation revenue is generally deferred and recognized
over the contractual period as residential cable subscription revenue. For periods prior to the adoption of ASU 2014-09,
installation revenue is included in residential cable non-subscription revenue.
(b) Residential subscription revenue from subscribers who purchase bundled services at a discounted rate is generally allocated
proportionally to each service based on the standalone price for each individual service. As a result, changes in the standalone
pricing of our cable and mobile products or the composition of bundles can contribute to changes in our product revenue
categories from period to period.

VIRGIN MEDIA INC.
Notes to Consolidated Financial Statements — (Continued)
December 31, 2018, 2017 and 2016
II - 54
(c) Residential mobile subscription revenue includes amounts received from subscribers from ongoing services. Residential
mobile non-subscription revenue includes, among other items, interconnect revenue and revenue for sales of mobile handsets
and other devices.
(d) B2B subscription revenue represents revenue from services to certain small or home office (SOHO) subscribers. SOHO
subscribers pay a premium price to receive expanded service levels along with video, broadband internet, fixed-line telephony
or mobile services that are the same or similar to the mass marketed products offered to our residential subscribers. B2B
non-subscription revenue includes business broadband internet, video, fixed-line telephony, mobile and data services offered
to medium to large enterprises and on a wholesale basis, to other operators.
(e) Other revenue primarily includes broadcasting revenue in Ireland.
Geographic Segments
The revenue of our geographic segments is set forth below:
Year ended December 31,
2018 2017 2016
in millions
U.K. ........................................................................................................................ £ 4,757.6 £ 4,598.5 £ 4,481.5
Ireland..................................................................................................................... 392.7 364.7 324.6
Total ................................................................................................................... £ 5,150.3 £ 4,963.2 £ 4,806.1
The long-lived assets of our geographic segments are set forth below:
December 31,
2018 2017
in millions
U.K. ................................................................................................................................................. £ 12,152.3 £ 12,498.5
Ireland.............................................................................................................................................. 600.5 573.4
Total ............................................................................................................................................ £ 12,752.8 £ 13,071.9

VIRGIN MEDIA INC.
Notes to Consolidated Financial Statements — (Continued)
December 31, 2018, 2017 and 2016
II - 55
(18) Condensed Consolidating Financial Information — Senior Notes
We present the following condensed consolidating financial information as of and for the year ended December 31, 2018 as
required by the applicable underlying indentures. For the condensed consolidating financial information as of and for the years
ended December 31, 2017 and 2016, see our 2017 and 2016 annual reports.
As of December 31, 2018, Virgin Media Finance is the issuer of the following senior notes:
• $74.3 million (£58.3 million) aggregate principal amount of 2022 VM 4.875% Dollar Senior Notes;
• $63.3 million (£49.6 million) aggregate principal amount of 2022 VM 5.25% Dollar Senior Notes;
• £44.1 million aggregate principal amount of 2022 VM Sterling Senior Notes;
• $497.0 million (£389.9 million) aggregate principal amount of 2024 VM Dollar Senior Notes;
• £300.0 million aggregate principal amount of 2024 VM Sterling Senior Notes;
• €460.0 million (£413.3 million) aggregate principal amount of 2025 VM Euro Senior Notes; and
• $400.0 million (£313.8 million) aggregate principal amount of 2025 VM Dollar Senior Notes.
Our senior notes are issued by Virgin Media Finance and are guaranteed on a senior basis by Virgin Media and certain of its
subsidiaries, namely Virgin Media Group LLC (Virgin Media Group) and Virgin Media Communications. Each of Virgin Media
Investment Holdings Limited (VMIH) and Virgin Media Investments Limited (VMIL) are conditional guarantors and have
guaranteed the senior notes on a senior subordinated basis.

VIRGIN MEDIA INC.
Notes to Consolidated Financial Statements — (Continued)
December 31, 2018, 2017 and 2016
II - 56
December 31, 2018
Balance sheetsVirginMedia
VirginMedia
FinanceOther
guarantors VMIH VMILAll other
subsidiaries Eliminations Total
in millions
ASSETS
Current assets:
Cash and cash equivalents ............ £ 0.1 £ — £ — £ — £ — £ 16.7 £ — £ 16.8
Related-party receivables ............. 0.6 — 0.1 — — 46.4 — 47.1
Other current assets:
Third-party ................................. 6.6 — — 141.6 — 801.2 — 949.4
Intercompany and related-party ....................................... — 55.6 — 5.8 — 15.4 (75.2) 1.6
Total current assets .................. 7.3 55.6 0.1 147.4 — 879.7 (75.2) 1,014.9
Property and equipment, net............ — — — — — 6,272.2 — 6,272.2
Goodwill.......................................... — — — — — 6,018.4 — 6,018.4
Investments in, and loans to, parentand subsidiary companies............ 6,515.0 8,127.5 6,500.0 15,594.8 14,293.9 (4,969.9) (46,061.3) —
Deferred income taxes..................... 6.7 — — — — 1,446.8 — 1,453.5
Related-party notes receivable ........ 9.2 — 28.4 — — 4,826.0 — 4,863.6
Other assets, net:
Third-party.................................... 5.4 — — 760.3 — 766.3 — 1,532.0
Intercompany ................................ — 372.5 — 13.8 — 188.3 (574.6) —
Total assets .............................. £ 6,543.6 £8,555.6 £ 6,528.5 £16,516.3 £14,293.9 £ 15,427.8 £ (46,711.1) £ 21,154.6
LIABILITIES AND OWNER'SEQUITY
Current liabilities:
Intercompany payables ................. £ — £ 19.9 £ — £ 56.8 £ — £ 181.9 £ (258.6) £ —
Other current liabilities:
Third-party ................................. — 28.6 — 2,013.2 — 1,514.7 — 3,556.5
Intercompany and related-party ....................................... 2.5 5.5 — 69.6 — 74.6 (75.2) 77.0
Total current liabilities ............ 2.5 54.0 — 2,139.6 — 1,771.2 (333.8) 3,633.5
Long-term debt and capital leaseobligations:
Third-party.................................... — 1,559.8 — 250.7 — 8,686.0 — 10,496.5
Related-party ................................ — — — — — 112.7 — 112.7
Other long-term liabilities:
Third-party.................................... — — — 292.7 — 78.1 — 370.8
Intercompany and related-party.... — 9.9 — 560.8 — 3.9 (574.6) —
Total liabilities......................... 2.5 1,623.7 — 3,243.8 — 10,651.9 (908.4) 14,613.5
Total owner's equity ................ 6,541.1 6,931.9 6,528.5 13,272.5 14,293.9 4,775.9 (45,802.7) 6,541.1
Total liabilities and owner'sequity ................................ £ 6,543.6 £8,555.6 £ 6,528.5 £16,516.3 £14,293.9 £ 15,427.8 £ (46,711.1) £ 21,154.6

VIRGIN MEDIA INC.
Notes to Consolidated Financial Statements — (Continued)
December 31, 2018, 2017 and 2016
II - 57
Year ended December 31, 2018
Statements of operationsVirginMedia
VirginMedia
FinanceOther
guarantors VMIH VMILAll other
subsidiaries Eliminations Total
in millions
Revenue .............................................. £ — £ — £ — £ — £ — £ 5,150.3 £ — £ 5,150.3
Operating costs and expenses(exclusive of depreciation andamortization, shown separatelybelow):
Programming and other direct costsof services .................................... — — — — — 1,574.2 — 1,574.2
Other operating ................................ — — — — — 657.0 — 657.0
SG&A .............................................. 1.2 — — — — 654.0 — 655.2
Related-party fees and allocations,net ................................................ (0.1) — — — — 157.0 — 156.9
Depreciation and amortization......... — — — — — 1,798.2 — 1,798.2
Impairment, restructuring and otheroperating items, net...................... — — — — — 101.9 — 101.9
1.1 — — — — 4,942.3 — 4,943.4
Operating income (loss) ................ (1.1) — — — — 208.0 — 206.9
Non-operating income (expense):
Interest expense:
Third-party..................................... — (118.2) — (96.8) — (437.1) — (652.1)
Related-party and intercompany.... — (431.7) — (347.4) — (1,388.8) 2,164.9 (3.0)
Interest income – related-party andintercompany ............................... 0.6 145.4 0.2 110.9 — 2,221.9 (2,164.9) 314.1
Realized and unrealized gains(losses) on derivativeinstruments, net:
Third-party..................................... — — — 470.2 — (0.2) — 470.0
Related-party.................................. — 436.8 — (505.0) — 69.5 — 1.3
Foreign currency transaction gains(losses), net .................................. (14.1) (499.0) (3.2) 146.9 — 5.4 — (364.0)
Losses on debt modification andextinguishment, net...................... — (28.3) — — — (0.5) — (28.8)
Realized and unrealized gains dueto changes in fair values ofcertain debt, net............................ — — — 0.8 — — — 0.8
Other income (expense), net ............ — (0.1) — (0.5) — 11.0 — 10.4
(13.5) (495.1) (3.0) (220.9) — 481.2 — (251.3)
Earnings (loss) before incometaxes .......................................... (14.6) (495.1) (3.0) (220.9) — 689.2 — (44.4)
Income tax benefit .............................. 5.8 — — — — 1.6 — 7.4
Earnings (loss) after incometaxes .......................................... (8.8) (495.1) (3.0) (220.9) — 690.8 — (37.0)
Equity in net earnings (loss) ofsubsidiaries ..................................... (28.2) 456.6 (36.0) 677.3 478.1 — (1,547.8) —
Net earnings (loss) ........................ £ (37.0) £ (38.5) £ (39.0) £ 456.4 £ 478.1 £ 690.8 £ (1,547.8) £ (37.0)
Total comprehensive earnings(loss) ....................................... £ (14.3) £ (34.3) £ (35.0) £ 460.5 £ 482.2 £ 694.9 £ (1,568.3) £ (14.3)

VIRGIN MEDIA INC.
Notes to Consolidated Financial Statements — (Continued)
December 31, 2018, 2017 and 2016
II - 58
Year ended December 31, 2018
Statements of cash flowsVirginMedia
VirginMedia
FinanceOther
guarantors VMIH VMIL
Allother
subsidiaries Total
in millions
Cash flows from operating activities:
Net cash provided (used) by operatingactivities ................................................... £ (1.0) £ (480.6) £ — £ (157.0) £ — £ 2,840.6 £ 2,202.0
Cash flows from investing activities:
Capital expenditures .................................... — — — — — (431.8) (431.8)
Repayments from (advances to) relatedparties, net ................................................ (8.4) — — — — 97.6 89.2
Cash paid in connection with otheracquisitions, net of cash acquired ............ — — — — — (3.0) (3.0)
Other investing activities, net ...................... — — — — — 3.4 3.4
Net cash used by investing activities ........ (8.4) — — — — (333.8) (342.2)
Cash flows from financing activities:
Repayments and repurchases of third-partydebt and capital lease obligations ............ — (723.1) — (3,179.4) — (143.4) (4,045.9)
Borrowings of third-party debt .................... — — — 2,048.8 — 78.0 2,126.8
Net repayments of related-party debt .......... — — — — — (0.4) (0.4)
Contributions (distributions) ....................... 10.1 1,225.7 — 1,218.4 — (2,454.2) —
Payment of financing costs and debtpremiums.................................................. — (22.0) — (5.5) — (0.5) (28.0)
Net cash received related to derivativeinstruments............................................... — — — 74.6 — — 74.6
Other financing activities, net...................... — — — — — 13.0 13.0
Net cash provided (used) by financingactivities................................................. 10.1 480.6 — 156.9 — (2,507.5) (1,859.9)
Effect of exchange rate changes on cash andcash equivalents and restricted cash........... (0.7) — — — — — (0.7)
Net decrease in cash and cash equivalentsand restricted cash ................................. — — — (0.1) — (0.7) (0.8)
Cash and cash equivalents and restrictedcash:
Beginning of period .................................. 0.1 — — 0.1 — 25.0 25.2
End of period............................................. £ 0.1 £ — £ — £ — £ — £ 24.3 £ 24.4
Reconciliation of end of period cash and cash equivalents and restricted cash:
Cash and cash equivalents ........................... £ 0.1 £ — £ — £ — £ — £ 16.7 £ 16.8
Restricted cash included in other currentassets ........................................................ — — — — — 7.6 7.6
Total cash and cash equivalents and restricted cash ...................................... £ 0.1 £ — £ — £ — £ — £ 24.3 £ 24.4

VIRGIN MEDIA INC.
Notes to Consolidated Financial Statements — (Continued)
December 31, 2018, 2017 and 2016
II - 59
(19) Condensed Consolidating Financial Information — Senior Secured Notes
We present the following condensed consolidating financial information as of and for the year ended December 31, 2018 as
required by the applicable underlying indentures. For the condensed consolidating financial information as of and for the years
ended December 31, 2017 and 2016, see our 2017 and 2016 annual reports.
As of December 31, 2018, Virgin Media Secured Finance is the issuer of the following senior secured notes:
• £107.1 million aggregate principal amount of 2021 VM Sterling Senior Secured Notes;
• $447.9 million (£351.4 million) aggregate principal amount of 2021 VM Dollar Senior Secured Notes;
• £387.0 million aggregate principal amount of 2025 VM 5.5% Sterling Senior Secured Notes;
• £300.0 million aggregate principal amount of 2025 VM 5.125% Sterling Senior Secured Notes;
• $354.5 million (£278.1 million) aggregate principal amount of 2025 VM Dollar Senior Secured Notes;
• £521.3 million aggregate principal amount of 2025 VM 6.0% Sterling Senior Secured Notes;
• $1.0 billion (£784.6 million) aggregate principal amount of 2026 VM 5.25% Dollar Senior Secured Notes;
• $750.0 million (£588.4 million) aggregate principal amount of 2026 VM 5.5% Dollar Senior Secured Notes;
• £525.0 million aggregate principal amount of 2027 VM 4.875% Sterling Senior Secured Notes;
• £675.0 million aggregate principal amount of 2027 VM 5.0% Sterling Senior Secured Notes; and
• £400.0 million aggregate principal amount of 2029 VM Sterling Senior Secured Notes.
Our senior secured notes are issued by Virgin Media Secured Finance and are guaranteed on a senior basis by Virgin Media,
Virgin Media Group and Virgin Media Communications and on a senior subordinated basis by VMIH and VMIL. They also rank
pari passu with and, subject to certain exceptions, share in the same guarantees and security which has been granted in favor of
our VM Credit Facilities.

VIRGIN MEDIA INC.
Notes to Consolidated Financial Statements — (Continued)
December 31, 2018, 2017 and 2016
II - 60
December 31, 2018
Balance sheetsVirginMedia
Virgin MediaSecuredFinance Guarantors
Non-Guarantors Eliminations Total
in millions
ASSETS
Current assets:
Cash and cash equivalents ........................ £ 0.1 £ — £ 10.3 £ 6.4 £ — £ 16.8
Related-party receivables.......................... 0.6 — 18.0 28.5 — 47.1
Other current assets:
Third-party ............................................. 6.6 — 710.4 232.4 — 949.4
Intercompany and related-party ............. — 13.8 63.0 — (75.2) 1.6
Total current assets............................... 7.3 13.8 801.7 267.3 (75.2) 1,014.9
Property and equipment, net ....................... — — 5,629.4 642.8 — 6,272.2
Goodwill...................................................... — — 5,793.8 224.6 — 6,018.4
Investments in, and loans to, parent andsubsidiary companies............................... 6,515.0 4,865.8 (2,717.0) 3,210.6 (11,874.4) —
Deferred income taxes ................................ 6.7 — 1,446.8 — — 1,453.5
Related-party notes receivable .................... 9.2 — — 4,854.4 — 4,863.6
Other assets, net:
Third-party................................................ 5.4 — 1,366.2 160.4 — 1,532.0
Intercompany ............................................ — 188.3 386.3 — (574.6) —
Total assets........................................... £ 6,543.6 £ 5,067.9 £ 12,707.2 £ 9,360.1 £ (12,524.2) £ 21,154.6
LIABILITIES AND OWNER'S EQUITY
Current liabilities:
Intercompany payables ............................. £ — £ — £ 217.2 £ 41.4 £ (258.6) £ —
Other current liabilities:
Third-party ............................................. — 110.7 3,298.7 147.1 — 3,556.5
Intercompany and related-party ............. 2.5 — 128.7 21.0 (75.2) 77.0
Total current liabilities ......................... 2.5 110.7 3,644.6 209.5 (333.8) 3,633.5
Long-term debt and capital leaseobligations:
Third-party................................................ — 4,920.9 5,398.7 176.9 — 10,496.5
Related-party............................................. — — — 112.7 — 112.7
Other long-term liabilities:
Third-party................................................ — — 358.9 11.9 — 370.8
Intercompany ............................................ — — 570.9 3.7 (574.6) —
Total liabilities ..................................... 2.5 5,031.6 9,973.1 514.7 (908.4) 14,613.5
Total owner's equity ............................. 6,541.1 36.3 2,734.1 8,845.4 (11,615.8) 6,541.1
Total liabilities and owner's equity .... £ 6,543.6 £ 5,067.9 £ 12,707.2 £ 9,360.1 £ (12,524.2) £ 21,154.6
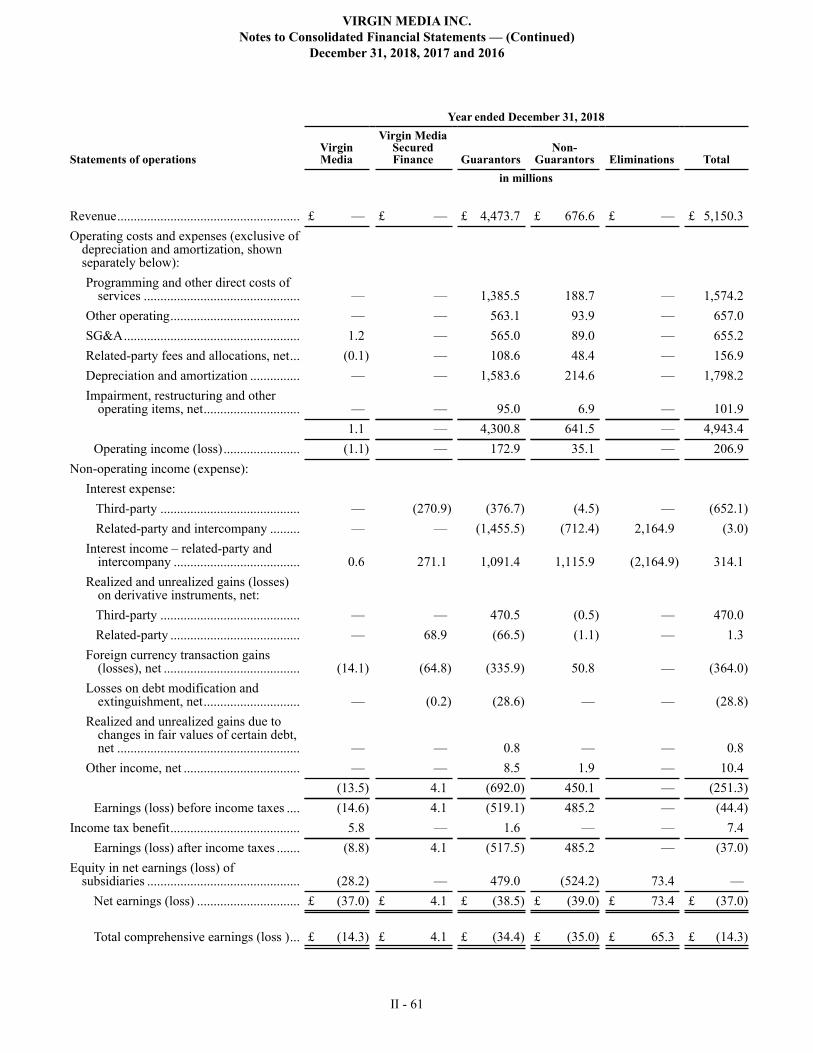
VIRGIN MEDIA INC.
Notes to Consolidated Financial Statements — (Continued)
December 31, 2018, 2017 and 2016
II - 61
Year ended December 31, 2018
Statements of operationsVirginMedia
Virgin MediaSecuredFinance Guarantors
Non-Guarantors Eliminations Total
in millions
Revenue....................................................... £ — £ — £ 4,473.7 £ 676.6 £ — £ 5,150.3
Operating costs and expenses (exclusive ofdepreciation and amortization, shownseparately below):
Programming and other direct costs ofservices ............................................... — — 1,385.5 188.7 — 1,574.2
Other operating....................................... — — 563.1 93.9 — 657.0
SG&A..................................................... 1.2 — 565.0 89.0 — 655.2
Related-party fees and allocations, net... (0.1) — 108.6 48.4 — 156.9
Depreciation and amortization ............... — — 1,583.6 214.6 — 1,798.2
Impairment, restructuring and otheroperating items, net............................. — — 95.0 6.9 — 101.9
1.1 — 4,300.8 641.5 — 4,943.4
Operating income (loss)....................... (1.1) — 172.9 35.1 — 206.9
Non-operating income (expense):
Interest expense:
Third-party .......................................... — (270.9) (376.7) (4.5) — (652.1)
Related-party and intercompany ......... — — (1,455.5) (712.4) 2,164.9 (3.0)
Interest income – related-party andintercompany ...................................... 0.6 271.1 1,091.4 1,115.9 (2,164.9) 314.1
Realized and unrealized gains (losses)on derivative instruments, net:
Third-party .......................................... — — 470.5 (0.5) — 470.0
Related-party ....................................... — 68.9 (66.5) (1.1) — 1.3
Foreign currency transaction gains(losses), net ......................................... (14.1) (64.8) (335.9) 50.8 — (364.0)
Losses on debt modification andextinguishment, net............................. — (0.2) (28.6) — — (28.8)
Realized and unrealized gains due tochanges in fair values of certain debt,net ....................................................... — — 0.8 — — 0.8
Other income, net ................................... — — 8.5 1.9 — 10.4
(13.5) 4.1 (692.0) 450.1 — (251.3)
Earnings (loss) before income taxes .... (14.6) 4.1 (519.1) 485.2 — (44.4)
Income tax benefit....................................... 5.8 — 1.6 — — 7.4
Earnings (loss) after income taxes ....... (8.8) 4.1 (517.5) 485.2 — (37.0)
Equity in net earnings (loss) ofsubsidiaries .............................................. (28.2) — 479.0 (524.2) 73.4 —
Net earnings (loss) ............................... £ (37.0) £ 4.1 £ (38.5) £ (39.0) £ 73.4 £ (37.0)
Total comprehensive earnings (loss )... £ (14.3) £ 4.1 £ (34.4) £ (35.0) £ 65.3 £ (14.3)
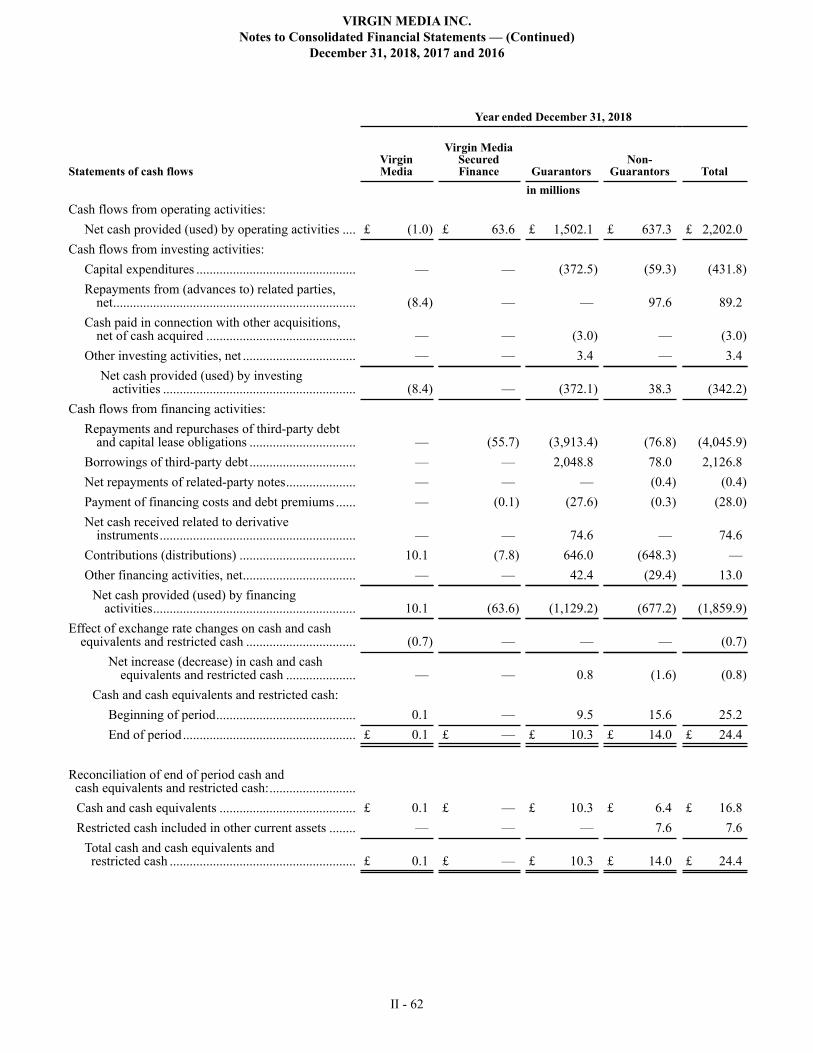
VIRGIN MEDIA INC.
Notes to Consolidated Financial Statements — (Continued)
December 31, 2018, 2017 and 2016
II - 62
Year ended December 31, 2018
Statements of cash flowsVirginMedia
Virgin MediaSecuredFinance Guarantors
Non-Guarantors Total
in millions
Cash flows from operating activities:
Net cash provided (used) by operating activities .... £ (1.0) £ 63.6 £ 1,502.1 £ 637.3 £ 2,202.0
Cash flows from investing activities:
Capital expenditures ................................................ — — (372.5) (59.3) (431.8)
Repayments from (advances to) related parties,net......................................................................... (8.4) — — 97.6 89.2
Cash paid in connection with other acquisitions,net of cash acquired ............................................. — — (3.0) — (3.0)
Other investing activities, net .................................. — — 3.4 — 3.4
Net cash provided (used) by investingactivities .......................................................... (8.4) — (372.1) 38.3 (342.2)
Cash flows from financing activities:
Repayments and repurchases of third-party debtand capital lease obligations ................................ — (55.7) (3,913.4) (76.8) (4,045.9)
Borrowings of third-party debt ................................ — — 2,048.8 78.0 2,126.8
Net repayments of related-party notes..................... — — — (0.4) (0.4)
Payment of financing costs and debt premiums ...... — (0.1) (27.6) (0.3) (28.0)
Net cash received related to derivative instruments........................................................... — — 74.6 — 74.6
Contributions (distributions) ................................... 10.1 (7.8) 646.0 (648.3) —
Other financing activities, net.................................. — — 42.4 (29.4) 13.0
Net cash provided (used) by financingactivities............................................................. 10.1 (63.6) (1,129.2) (677.2) (1,859.9)
Effect of exchange rate changes on cash and cashequivalents and restricted cash ................................. (0.7) — — — (0.7)
Net increase (decrease) in cash and cashequivalents and restricted cash ..................... — — 0.8 (1.6) (0.8)
Cash and cash equivalents and restricted cash:
Beginning of period.......................................... 0.1 — 9.5 15.6 25.2
End of period.................................................... £ 0.1 £ — £ 10.3 £ 14.0 £ 24.4
Reconciliation of end of period cash and cash equivalents and restricted cash:..........................
Cash and cash equivalents ......................................... £ 0.1 £ — £ 10.3 £ 6.4 £ 16.8
Restricted cash included in other current assets ........ — — — 7.6 7.6
Total cash and cash equivalents and restricted cash ........................................................ £ 0.1 £ — £ 10.3 £ 14.0 £ 24.4

II - 63
MANAGEMENT’S DISCUSSION AND ANALYSIS OF FINANCIAL CONDITION AND RESULTS OF OPERATIONS
The following discussion and analysis, which should be read in conjunction with our consolidated financial statements, is
intended to assist in providing an understanding of our results of operations and financial condition and is organized as follows:
• Overview. This section provides a general description of our business and recent events.
• Results of Operations. This section provides an analysis of our results of operations for the years ended December 31,
2018, 2017 and 2016.
• Liquidity and Capital Resources. This section provides an analysis of our corporate and subsidiary liquidity, consolidated
statements of cash flows and contractual commitments.
• Critical Accounting Policies, Judgments and Estimates. This section discusses those material accounting policies that
involve uncertainties and require significant judgment in their application.
• Quantitative and Qualitative Disclosures about Market Risk. This section provides discussion and analysis of the foreign
currency, interest rate and other market risk that our company faces.
The capitalized terms used below have been defined in the notes to our consolidated financial statements. In the following
text, the terms “we,” “our,” “our company” and “us” may refer, as the context requires, to Virgin Media or collectively to Virgin
Media and its subsidiaries.
Unless otherwise indicated, convenience translations into pound sterling are calculated, and operational data (including
subscriber statistics) is presented, as of December 31, 2018.
Overview
General
We are a subsidiary of Liberty Global that provides video, broadband internet, fixed-line telephony, mobile and broadcasting
services in the U.K. and Ireland. We are one of the U.K.’s and Ireland’s largest providers of residential video, broadband internet
and fixed-line telephony services in terms of the number of customers. We believe our advanced, deep-fiber cable access network
enables us to offer faster and higher quality broadband services than our digital subscriber line market participants. As a result,
we provide our customers with a leading next generation broadband service and one of the most advanced interactive television
services available in the U.K. and Irish markets.
Operations
At December 31, 2018, our network passed 15,340,300 homes and served 14,666,900 revenue generating units (RGUs),
consisting of 5,600,300 broadband internet subscribers, 4,923,500 fixed-line telephony subscribers and 4,143,100 video subscribers.
In addition, at December 31, 2018, we served 3,121,000 mobile subscribers.
Digital Video services. Our digital cable service offerings include basic and premium programming and incremental product
and service offerings, such as enhanced pay-per-view programming (including digital cable-on-demand), digital cable recorders,
high definition and 3D programming and access to over-the-top content.
Broadband internet services. Our residential broadband subscribers generally access the internet at various download speeds
ranging up to 350 Mbps in the U.K. and up to 360 Mbps in Ireland, depending on the tier of service selected. We determine pricing
for each different tier of broadband internet service through analysis of speed, market conditions and other factors. We continue
to invest in new technologies that allow us to increase the internet speeds we offer to our customers.
Fixed-line telephony services. We offer fixed-line telephony services via either voice-over-internet-protocol or "VoIP"
technology or circuit-switched telephony.
Mobile services. We offer voice and data mobile services using third-party networks through MVNO arrangements.
B2B services. We provide B2B services, including voice, broadband internet, data, video, wireless and cloud services.

II - 64
For additional information regarding the details of our products and services, see Item 1. Business included in this annual
report.
Strategy and Management Focus
We strive to achieve organic revenue and customer growth in our operations by developing and marketing bundled
entertainment and information and communications services, and extending and upgrading the quality of our networks where
appropriate. As we use the term, organic growth excludes foreign currency translation effects (FX) and the estimated impact of
acquisitions and dispositions. While we seek to increase our customer base, we also seek to maximize the average revenue we
receive from each household by increasing the penetration of our digital video, broadband internet, fixed-line telephony and mobile
services with existing customers through product bundling and upselling.
During 2018, pursuant to the Network Extension, we connected approximately 481,000 residential and commercial premises
(excluding upgrades) to our two-way networks in the U.K. and Ireland. We expect to continue the Network Extension in 2019 to
the extent we believe we can obtain attractive returns on our investments. Depending on a variety of factors, including the financial
and operational results of the program, the Network Extension may be continued, modified or cancelled at our discretion.
The capital costs associated with the Network Extension, which include the costs to build-out the network and the purchase
and installation of related customer premises equipment, are expected to be significant. Our assessment of the impacts of the
Network Extension is subject to competitive, economic, regulatory and other factors outside of our control.
Competition and Other External Factors
We are experiencing significant competition from incumbent telecommunications operators, direct-to-home satellite (DTH)
operators and/or other providers. For additional information regarding the competition we face, see Business - Competition and
Regulatory Matters included in Part I of this annual report. The significant competition we are experiencing, together with
macroeconomic and regulatory factors, has adversely impacted our revenue, RGUs and/or average monthly subscription revenue
per average cable RGU or mobile subscriber, as applicable (ARPU). For additional information regarding the revenue impact of
changes in the RGUs and ARPU, see Discussion and Analysis below.
In addition to competition, our operations are subject to macroeconomic, political and other risks that are outside of our control.
For example, on June 23, 2016, the U.K. held a referendum in which U.K. citizens voted in favor of, on an advisory basis, an exit
from the E.U. commonly referred to as “Brexit.” Failing the implementation of an agreed extension, the U.K. will leave the E.U.
on March 29, 2019 under a so-called “hard Brexit” or “no-deal Brexit” without agreements on trade, finance and other key elements.
The foregoing has caused considerable uncertainty as to Brexit’s impact on the free movement of goods, services, people, data
and capital between the U.K. and the E.U., customer behavior, economic conditions, interest rates, currency exchange rates and
availability of capital. The effects of Brexit could adversely affect our business, results of operations, financial condition and
liquidity. For additional information regarding the potential impact of Brexit on our company, see Item 1A. Risk Factors included
in Part I of this annual report.
Results of Operations
We completed two small acquisitions and one small disposition during 2016. These transactions impact the comparability of
our 2017 and 2016 results of operations. In the following discussion, we quantify the estimated impact of acquisitions (the
Acquisition Impact) on our operating results. The Acquisition Impact represents our estimate of the difference between the
operating results of the periods under comparison that is attributable to an acquisition. In general, we base our estimate of the
Acquisition Impact on an acquired entity’s operating results during the first three to twelve months following the acquisition date,
as adjusted to remove integration costs and any other material unusual or nonoperational items, such that changes from those
operating results in subsequent periods are considered to be organic changes. Accordingly, in the following discussion, (i) organic
variances attributed to an acquired entity during the first 12 months following the acquisition date represent differences between
the Acquisition Impact and the actual results and (ii) the calculation of our organic change percentages includes the organic activity
of an acquired entity relative to the Acquisition Impact of such entity.

II - 65
As further described in note 2 to our consolidated financial statements, we adopted ASU 2014-09 on January 1, 2018 using
the cumulative effect transition method. As such, the information included in our consolidated financial statements and notes
thereto for 2017 and 2016 has not been restated and continues to be reported under the accounting standards in effect for such
years. In order to provide a more meaningful comparison of our results of operations, in the following discussion and analysis of
our results of operations for 2018, as compared to 2017, we present our revenue, expenses and Segment OCF (as described below)
for 2017 on a pro forma basis that gives effect to the adoption of ASU 2014-09 as if such adoption had occurred on January 1,
2017. However, in the discussion and analysis of our results of operations for 2017, as compared to 2016, we present all amounts
on a historical basis.
The following table presents (i) the impact of the adoption of ASU 2014-09 on revenue and Segment OCF for the year ended
December 31, 2018 and (ii) the pro forma impact of the adoption of ASU 2014-09 on revenue and Segment OCF for the year
ended December 31, 2017 as if such adoption had occurred on January 1, 2017.
Year ended December 31,
2018 2017
in millions
Increase (decrease) to revenue.......................................................................................................... £ 25.7 £ (10.0)
Increase (decrease) to Segment OCF................................................................................................ £ 20.6 £ (20.1)
Discussion and Analysis
General
Most of our revenue is subject to VAT or similar revenue-based taxes. Any increases in these taxes could have an adverse
impact on our ability to maintain or increase our revenue to the extent that we are unable to pass such tax increases on to our
customers. In the case of revenue-based taxes for which we are the ultimate taxpayer, we will also experience increases in our
operating expenses and corresponding declines in our Segment OCF and Segment OCF margin (Segment OCF divided by revenue)
to the extent of any such tax increases. As we use the term, "Segment OCF" is defined as operating income before depreciation
and amortization, share-based compensation, related-party fees and allocations, provisions and provision releases related to
significant litigation and impairment, restructuring and other operating items. Other operating items include (i) gains and losses
on the disposition of long-lived assets, (ii) third-party costs directly associated with successful and unsuccessful acquisitions and
dispositions, including legal, advisory and due diligence fees, as applicable, and (iii) other acquisition-related items, such as gains
and losses on the settlement of contingent consideration.
We pay interconnection fees to other telephony providers when calls or text messages from our subscribers terminate on
another network, and we receive similar fees from such providers when calls or text messages from their customers terminate on
our networks or networks that we access through MVNO or other arrangements. The amounts we charge and incur with respect
to fixed-line telephony and mobile interconnection fees are subject to regulatory oversight. To the extent that regulatory authorities
introduce fixed-line or mobile termination rate changes, we would experience prospective changes in our interconnect revenue
and costs. The ultimate impact of any such changes in termination rates on our Segment OCF would be dependent on the call or
text messaging patterns that are subject to the changed termination rates.
We are subject to inflationary pressures with respect to certain costs and foreign currency exchange risk with respect to costs
and expenses that are denominated in currencies other than British pound sterling. Any cost increases that we are not able to pass
on to our subscribers through rate increases would result in increased pressure on our operating margins. For additional information
regarding our foreign currency exchange risks see Quantitative and Qualitative Disclosures about Market Risk — Foreign Currency
Risk below.

II - 66
Revenue
General.We derive our revenue primarily from residential and B2B communications services, including video, broadband
internet, fixed-line telephony and mobile services.
Variances in the subscription revenue that we receive from our customers are a function of (i) changes in the number of RGUs
or mobile subscribers outstanding during the period and (ii) changes in ARPU. Changes in ARPU can be attributable to (a) changes
in prices, (b) changes in bundling or promotional discounts, (c) changes in the tier of services selected, (d) variances in subscriber
usage patterns and (e) the overall mix of cable and mobile products during the period. In the following discussion, we discuss
ARPU changes in terms of the net impact of the above factors on the ARPU that is derived from our video, broadband internet,
fixed-line telephony and mobile products.
2018 compared to 2017
Revenue
Our revenue by major category is set forth below:
Year ended December 31, Increase (decrease)
Organicincrease
(decrease)
2018 2017 £ % %
pro forma
in millions, except percentages
Residential revenue:
Residential cable revenue (a):
Subscription revenue (b):
Video ............................................................................... £ 1,045.3 £ 1,024.3 £ 21.0 2.1 1.9
Broadband internet .......................................................... 1,600.4 1,498.6 101.8 6.8 6.7
Fixed-line telephony ....................................................... 921.6 947.6 (26.0) (2.7) (2.8)
Total subscription revenue............................................ 3,567.3 3,470.5 96.8 2.8 2.7
Non-subscription revenue.................................................. 71.1 66.6 4.5 6.8 6.8
Total residential cable revenue ................................... 3,638.4 3,537.1 101.3 2.9 2.8
Residential mobile revenue (c):
Subscription revenue (b).................................................... 360.1 363.0 (2.9) (0.8) (0.8)
Non-subscription revenue.................................................. 303.4 236.5 66.9 28.3 28.3
Total residential mobile revenue ..................................... 663.5 599.5 64.0 10.7 10.7
Total residential revenue............................................... 4,301.9 4,136.6 165.3 4.0 3.9
B2B revenue (d):
Subscription revenue............................................................ 78.9 57.0 21.9 38.4 38.3
Non-subscription revenue .................................................... 699.1 696.4 2.7 0.4 0.4
Total B2B revenue ............................................................. 778.0 753.4 24.6 3.3 3.2
Other revenue (e).................................................................... 70.4 63.2 7.2 11.4 10.7
Total .............................................................................. £ 5,150.3 £ 4,953.2 £ 197.1 4.0 3.9

II - 67
_______________
(a) Residential cable subscription revenue includes amounts received from subscribers for ongoing services and the recognition
of deferred installation revenue over the associated contract period. Residential cable non-subscription revenue includes,
among other items, channel carriage fees, late fees and revenue from the sale of equipment.
(b) Residential subscription revenue from subscribers who purchase bundled services at a discounted rate is generally allocated
proportionally to each service based on the standalone price for each individual service. As a result, changes in the standalone
pricing of our cable and mobile products or the composition of bundles can contribute to changes in our product revenue
categories from period to period.
(c) Residential mobile subscription revenue includes amounts received from subscribers for ongoing services. Residential
mobile non-subscription revenue includes, among other items, interconnect revenue and revenue from sales of mobile
handsets and other devices. Residential mobile interconnect revenue was £58.0 million and £53.9 million during 2018 and
2017, respectively.
(d) B2B subscription revenue represents revenue from SOHO subscribers. SOHO subscribers pay a premium price to receive
expanded service levels along with video, broadband internet, fixed-line telephony or mobile services that are the same or
similar to the mass marketed products offered to our residential subscribers. A portion of the increases in our B2B subscription
revenue is attributable to the conversion of certain residential subscribers to SOHO subscribers. B2B non-subscription
revenue includes revenue from business broadband internet, video, fixed-line telephony, mobile and data services offered
to medium to large enterprises and on a wholesale basis, to other operators.
(e) Other revenue primarily includes broadcasting revenue in Ireland.
The details of the pro forma increase in our revenue during 2018, as compared to 2017, are set forth below:
Subscription
revenue
Non-
subscription
revenue Total
in millions
Increase in residential cable subscription revenue due to change in:
Average number of RGUs (a).................................................................................. £ 55.0 £ — £ 55.0
ARPU (b)................................................................................................................. 38.2 — 38.2
Increase in residential cable non-subscription revenue (c) ......................................... — 5.2 5.2
Total increase in residential cable revenue............................................................ 93.2 5.2 98.4
Increase (decrease) in residential mobile revenue (d)................................................. (3.0) 66.8 63.8
Increase in B2B revenue (e)........................................................................................ 21.9 3.7 25.6
Increase in other revenue (f) ....................................................................................... — 5.7 5.7
Total organic increase............................................................................................ 112.1 81.4 193.5
Impact of FX ............................................................................................................... 2.5 1.1 3.6
Total....................................................................................................................... £ 114.6 £ 82.5 £ 197.1
_______________
(a) The increase in residential cable subscription revenue related to a change in the average number of RGUs is attributable to
increases in the average number of broadband internet, video and fixed-line telephony RGUs.
(b) The increase in residential cable subscription revenue related to a change in ARPU is attributable to (i) a net increase due
to (a) higher ARPU from broadband internet services, (b) lower ARPU from fixed-line telephony services and (c) higher
ARPU from video services and (ii) an improvement in RGU mix.
(c) The increase in residential cable non-subscription revenue is primarily driven by changes in the U.K., including the net
effect of (i) increases in interconnect revenue and late fees and (ii) a decrease in cancellation revenue.
(d) The decrease in residential mobile subscription revenue is primarily attributable to the net effect of (i) a decrease in the
U.K., due primarily to lower ARPU, and (ii) an increase in Ireland, mainly due to an increase in the average number of

II - 68
mobile subscribers. The increase in residential mobile non-subscription revenue is primarily due to an increase in revenue
from mobile handset sales in the U.K., which typically generate relatively low margins.
(e) The increase in B2B subscription revenue is primarily due to an increase in the average number of broadband internet SOHO
subscribers in the U.K. The increase in B2B non-subscription revenue is primarily driven by changes in the U.K., including
the net effect of (i) higher revenue related to business network services, (ii) a decrease in interconnect revenue, (iii) lower
revenue from wholesale fixed-line telephony services and (iv) lower revenue from data services.
(f) The increase in other revenue is primarily due to an increase in broadcasting revenue in Ireland.
Programming and other direct costs of services
Programming and other direct costs of services include programming and copyright costs, interconnect and access costs, costs
of mobile handsets and other devices and other direct costs related to our operations. Programming and copyright costs, which
represent a significant portion of our operating costs, are expected to rise in future periods as a result of (i) higher costs associated
with the expansion of our digital video content, including rights associated with ancillary product offerings and rights that provide
for the broadcast of live sporting events, (ii) rate increases and (iii) growth in the number of our enhanced video subscribers.
Our programming and other direct costs of services increased £123.6 million or 8.5%, on a pro forma basis, during 2018, as
compared to 2017. On an organic basis, programming and other direct costs of services increased £122.3 million or 8.4%. This
increase includes the following factors:
• An increase in programming and copyright costs of £41.5 million or 5.0%, primarily due to (i) higher costs for certain
premium and/or basic content, including an £8.0 million increase in costs associated with broadcasting rights in Ireland;
• An increase in mobile handset and other device costs of £40.2 million or 25.0%, primarily due to the net effect of (i) a
higher average cost per handset sold and (ii) lower mobile handset and other device sales volumes;
• An increase in interconnect and access costs of £35.5 million or 9.4%, primarily due to (i) a £26.5 million increase resulting
from the net impact of credits recorded during the second quarter of 2017 (£22.5 million), the fourth quarter of 2017 (£7.9
million) and the second quarter of 2018 (£3.9 million), primarily associated with a telecommunications operator’s
agreement to compensate communications providers, including our company, for certain contractual breaches related to
network charges and (ii) higher interconnect and roaming costs; and
• A decrease of £5.8 million in the U.K. associated with the fourth quarter 2017 modification of a software agreement that
resulted in the acquisition of a perpetual license and related conversion of the operating costs to capitalized costs.
Other operating expenses
Other operating expenses include network operations, customer operations, customer care and other costs related to our
operations.
Our other operating expenses increased £14.3 million or 2.2%, on a pro forma basis, during 2018, as compared to 2017. On
an organic basis, other operating expenses increased £13.7 million or 2.1%. This increase includes the following factors:
• An increase in personnel costs of £21.3 million or 11.6%, primarily due to the net effect of (i) a higher average cost per
employee, (ii) lower staffing levels and (iii) higher incentive compensation costs;
• An increase in network infrastructure charges of £17.6 million following an increase in the rateable value of existing
assets. For additional information, see “Other Regulatory Issues” in note 16 to our consolidated financial statements;
• A decrease in core network and information technology-related costs of £7.4 million or 8.9%, primarily due to a decrease
in network maintenance costs;
• A decrease in customer service costs of £4.6 million or 3.9%, primarily due to (i) lower call center costs and (ii) a decrease
in customer premises equipment refurbishment and other supply chain costs; and
• A decrease in encryption costs of £3.5 million in the U.K. associated with the 2018 modification of a service agreement
that resulted in the acquisition of a time-based license and related conversion of the operating costs to capitalized costs.
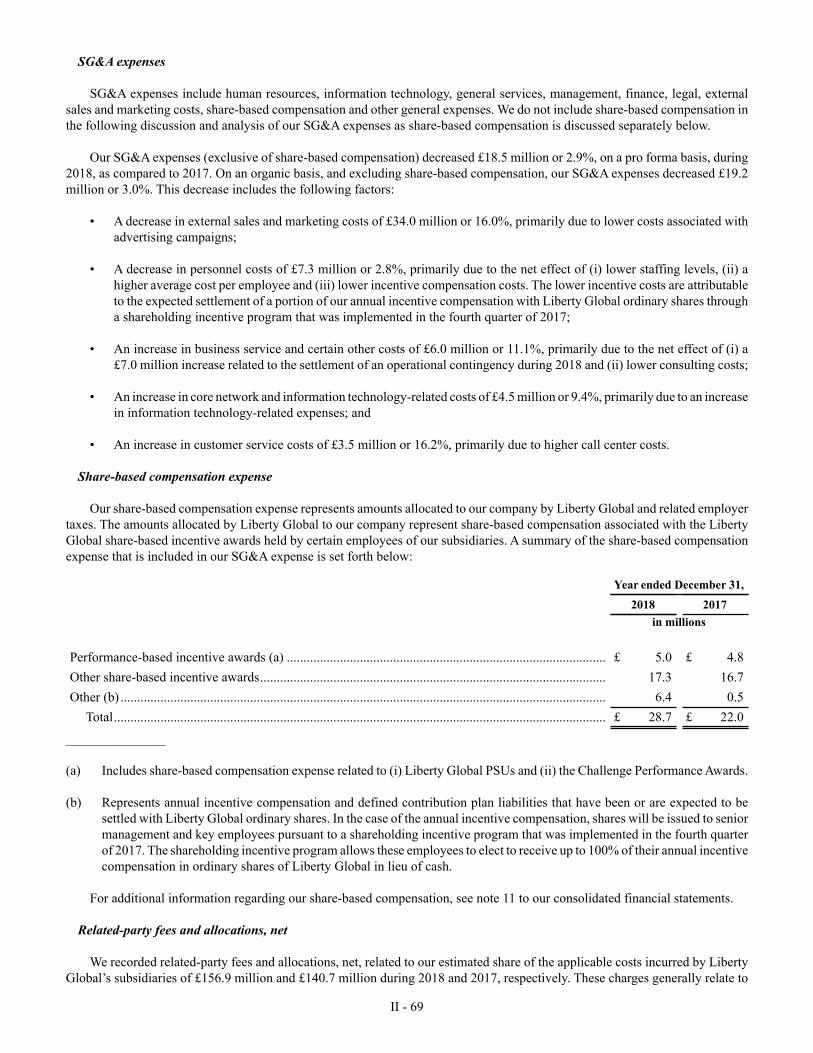
II - 69
SG&A expenses
SG&A expenses include human resources, information technology, general services, management, finance, legal, external
sales and marketing costs, share-based compensation and other general expenses. We do not include share-based compensation in
the following discussion and analysis of our SG&A expenses as share-based compensation is discussed separately below.
Our SG&A expenses (exclusive of share-based compensation) decreased £18.5 million or 2.9%, on a pro forma basis, during
2018, as compared to 2017. On an organic basis, and excluding share-based compensation, our SG&A expenses decreased £19.2
million or 3.0%. This decrease includes the following factors:
• A decrease in external sales and marketing costs of £34.0 million or 16.0%, primarily due to lower costs associated with
advertising campaigns;
• A decrease in personnel costs of £7.3 million or 2.8%, primarily due to the net effect of (i) lower staffing levels, (ii) a
higher average cost per employee and (iii) lower incentive compensation costs. The lower incentive costs are attributable
to the expected settlement of a portion of our annual incentive compensation with Liberty Global ordinary shares through
a shareholding incentive program that was implemented in the fourth quarter of 2017;
• An increase in business service and certain other costs of £6.0 million or 11.1%, primarily due to the net effect of (i) a
£7.0 million increase related to the settlement of an operational contingency during 2018 and (ii) lower consulting costs;
• An increase in core network and information technology-related costs of £4.5 million or 9.4%, primarily due to an increase
in information technology-related expenses; and
• An increase in customer service costs of £3.5 million or 16.2%, primarily due to higher call center costs.
Share-based compensation expense
Our share-based compensation expense represents amounts allocated to our company by Liberty Global and related employer
taxes. The amounts allocated by Liberty Global to our company represent share-based compensation associated with the Liberty
Global share-based incentive awards held by certain employees of our subsidiaries. A summary of the share-based compensation
expense that is included in our SG&A expense is set forth below:
Year ended December 31,
2018 2017
in millions
Performance-based incentive awards (a) ................................................................................................ £ 5.0 £ 4.8
Other share-based incentive awards........................................................................................................ 17.3 16.7
Other (b) .................................................................................................................................................. 6.4 0.5
Total.................................................................................................................................................... £ 28.7 £ 22.0
_______________
(a) Includes share-based compensation expense related to (i) Liberty Global PSUs and (ii) the Challenge Performance Awards.
(b) Represents annual incentive compensation and defined contribution plan liabilities that have been or are expected to be
settled with Liberty Global ordinary shares. In the case of the annual incentive compensation, shares will be issued to senior
management and key employees pursuant to a shareholding incentive program that was implemented in the fourth quarter
of 2017. The shareholding incentive program allows these employees to elect to receive up to 100% of their annual incentive
compensation in ordinary shares of Liberty Global in lieu of cash.
For additional information regarding our share-based compensation, see note 11 to our consolidated financial statements.
Related-party fees and allocations, net
We recorded related-party fees and allocations, net, related to our estimated share of the applicable costs incurred by Liberty
Global’s subsidiaries of £156.9 million and £140.7 million during 2018 and 2017, respectively. These charges generally relate to

II - 70
management, finance, legal, technology and other corporate and administrative services provided to or by our subsidiaries. For
additional information, see note 12 to our consolidated financial statements.
Depreciation and amortization expense
Our depreciation and amortization expense decreased £10.0 million or 0.6% during 2018, as compared to 2017. Excluding
the effects of FX, depreciation and amortization expense decreased £11.1 million or 0.6%, primarily due to the net effect of (i) a
decrease associated with certain assets becoming fully depreciated and (ii) an increase associated with property and equipment
additions related to the installation of customer premises equipment, the expansion and upgrade of our networks and other capital
initiatives.
Impairment, restructuring and other operating items, net
We recognized impairment, restructuring and other operating items, net, of £101.9 million and £57.5 million during 2018 and
2017, respectively. The 2018 amount includes (i) a provision for litigation of £63.7 million related to a VAT matter in the U.K.
recorded during the third quarter of 2018 and (ii) restructuring charges of £20.7 million, primarily due to certain reorganization
activities that resulted in employee severance and termination costs. The 2017 amount includes (a) a £30.1 million legal settlement
recorded during the third quarter of 2017 and (b) restructuring charges of £21.8 million, primarily due to certain reorganization
activities that resulted in employee severance and termination costs and costs related to property closures.
If, among other factors, (i) our enterprise value or Liberty Global’s equity values were to decline or (ii) the adverse impacts
of economic, competitive, regulatory or other factors were to cause our results of operations or cash flows to be worse than
anticipated, we could conclude in future periods that impairment charges are required in order to reduce the carrying values of our
goodwill and, to a lesser extent, other long-lived assets. Any such impairment charges could be significant.
Interest expense – third-party
Our third-party interest expense increased £38.2 million or 6.2% during 2018, as compared to 2017, primarily due to higher
weighted average interest rates and higher average outstanding third-party debt balances. For additional information regarding our
outstanding third-party indebtedness, see note 8 to our consolidated financial statements.
It is possible that the interest rates on (i) any new borrowings could be higher than the current interest rates on our existing
indebtedness and (ii) our variable-rate indebtedness could increase in future periods. As further discussed in note 5 to our
consolidated financial statements and under Qualitative and Quantitative Disclosures about Market Risk below, we use derivative
instruments to manage our interest rate risks.
Interest expense – related-party
Our related-party interest expense remained relatively unchanged during 2018, as compared to 2017. For additional information
regarding our related-party indebtedness, see note 12 to our consolidated financial statements.
Interest income – related-party
Our related-party interest income decreased £15.8 million or 4.8% during 2018, as compared to 2017, primarily due to the
partial repayment of certain related-party notes receivable from LG Europe 2 during 2018. For additional information, see note
12 to our consolidated financial statements.

II - 71
Realized and unrealized gains (losses) on derivative instruments, net
Our realized and unrealized gains or losses on derivative instruments include (i) unrealized changes in the fair values of our
derivative instruments that are non-cash in nature until such time as the derivative contracts are fully or partially settled and (ii)
realized gains or losses upon the full or partial settlement of the derivative contracts. The details of our realized and unrealized
gains (losses) on derivative instruments, net, are as follows:
Year ended December 31,
2018 2017
in millions
Cross-currency and interest rate derivative contracts (a) ....................................................................... £ 470.0 £ (525.2)
Foreign currency forward contracts — related-party ............................................................................. 1.3 (2.2)
Total ................................................................................................................................................... £ 471.3 £ (527.4)
_______________
(a) The gain during 2018 is primarily attributable to the net effect of (i) a net gain associated with changes in the relative value
of certain currencies and (ii) a net loss associated with changes in certain market interest rates. In addition, the gain during
2018 includes a net loss of £31.8 million resulting from changes in our credit risk valuation adjustments. The loss during
2017 is primarily attributable to the net effect of (a) a net loss associated with changes in the relative value of certain
currencies and (b) a net gain associated with changes in certain market interest rates. In addition, the loss during 2017
includes a net gain of £78.3 million resulting from changes in our credit risk valuation adjustments.
For additional information regarding our derivative instruments, see notes 5 and 6 to our consolidated financial statements
and Quantitative and Qualitative Disclosures about Market Risk below.
Foreign currency transaction gains (losses), net
Our foreign currency transaction gains or losses primarily result from the remeasurement of monetary assets and liabilities
that are denominated in currencies other than the underlying functional currency of the applicable entity. Unrealized foreign
currency transaction gains or losses are computed based on period-end exchange rates and are non-cash in nature until such time
as the amounts are settled. The details of our foreign currency transaction gains (losses), net, are as follows:
Year ended December 31,
2018 2017
in millions
U.S. dollar denominated debt issued by our company.................................................................... £ (188.2) £ 304.6
Intercompany payables and receivables denominated in a currency other than the entity’sfunctional currency (a) ................................................................................................................ (169.1) 272.6
Euro-denominated debt issued by our company ............................................................................. (4.4) (15.9)
Other................................................................................................................................................ (2.3) 4.9
Total............................................................................................................................................ £ (364.0) £ 566.2
_______________
(a) Amounts primarily relate to loans between certain of our non-operating subsidiaries.
For information regarding how we manage our exposure to foreign currency risk, see Quantitative and Qualitative Disclosures
about Market Risk — Foreign Currency Risk below.
Realized and unrealized gains (losses) due to changes in fair values of certain debt, net
Our realized and unrealized gains or losses due to changes in fair values of certain debt include unrealized gains or losses
associated with changes in fair values that are non-cash in nature until such time as these gains or losses are realized through cash
transactions. We recognized realized and unrealized gains (losses) due to changes in fair values of certain debt, net, of £0.8 million

II - 72
during 2018 as compared to (£25.5 million) during 2017. For additional information regarding our fair value measurements, see
note 6 to our consolidated financial statements.
Losses on debt modification and extinguishment, net
We recognized losses on debt modification and extinguishment, net, of £28.8 million and £52.4 million during 2018 and 2017,
respectively. The loss during 2018 is attributable to (i) the payment of £22.1 million of redemption premiums and (ii) the write-
off of £6.7 million of unamortized deferred financing costs, discounts and premiums. The loss during 2017 is primarily attributable
to (a) the payment of £26.0 million of redemption premiums and (b) the write-off of £23.2 million of unamortized deferred financing
costs, discounts and premiums.
For additional information regarding our losses on debt modification and extinguishment, net, see note 8 to our consolidated
financial statements.
Income tax benefit
We recognized income tax benefit of £7.4 million and £21.5 million during 2018 and 2017, respectively.
The income tax benefit during 2018 differs from the expected income tax benefit of £9.3 million (based on the U.S. federal
income tax rate of 21.0%), primarily due to the negative impacts of (i) certain permanent differences between the financial and
tax accounting treatment of items associated with investments in subsidiaries and (ii) non-deductible or non-taxable interest and
other expenses. The net negative impact of these items was partially offset by the net positive impact of (a) a decrease in valuation
allowances and (b) an increase in deferred tax assets in the U.K. due to enacted tax law rate changes.
The income tax benefit during 2017 differs from the expected income tax benefit of £37.9 million (based on the U.S. federal
income tax rate of 35.0%), primarily due to the negative impacts of (i) certain permanent differences between the financial and
tax accounting treatment of items associated with investments in subsidiaries and (ii) statutory tax rates in certain jurisdictions in
which we operate that are lower than the U.S. federal income tax rate. The net negative impact of these items was partially offset
by the positive impact of non-deductible or non-taxable foreign currency exchange results.
For additional information concerning our income taxes, see note 9 to our consolidated financial statements.
Net loss
During 2018 and 2017, we reported net losses of £37.0 million and £86.9 million, respectively, including (i) operating income
of £206.9 million and £206.6 million, respectively, (ii) net non-operating expense of £251.3 million and £315.0 million, respectively,
and (iii) income tax benefit of £7.4 million and £21.5 million, respectively.
Gains or losses associated with (i) changes in the fair values of derivative instruments and (ii) movements in foreign currency
exchange rates are subject to a high degree of volatility and, as such, any gains from these sources do not represent a reliable source
of income. In the absence of significant gains in the future from these sources or from other non-operating items, our ability to
achieve earnings is largely dependent on our ability to increase our Segment OCF to a level that more than offsets the aggregate
amount of our (a) share-based compensation expense, (b) related-party fees and allocations, (c) depreciation and amortization, (d)
impairment, restructuring and other operating items, (e) interest expense, (f) other non-operating expenses and (g) income tax
expenses.
Subject to the limitations included in our various debt instruments, we expect that Liberty Global will continue to cause our
company to maintain our debt at current levels relative to our Covenant EBITDA. As a result, we expect that we will continue to
report significant levels of interest expense for the foreseeable future. For information concerning our expectations with respect
to trends that may affect certain aspects of our operating results in future periods, see the discussion under Overview above. For
information concerning the reasons for changes in specific line items in our consolidated statements of operations, see the above
discussion.

II - 73
2017 compared to 2016
Revenue
Our revenue by major category is set forth below:
Year ended December 31, Increase (decrease)
Organicincrease
(decrease)
2017 2016 £ % %
in millions
Residential revenue:
Residential cable revenue (a):
Subscription revenue (b):
Video...................................................................................... £ 1,019.1 £ 1,054.8 £ (35.7) (3.4) (4.0)
Broadband internet ................................................................ 1,489.6 1,356.1 133.5 9.8 9.3
Fixed-line telephony.............................................................. 940.3 948.4 (8.1) (0.9) (1.2)
Total subscription revenue .................................................. 3,449.0 3,359.3 89.7 2.7 2.2
Non-subscription revenue ........................................................ 94.0 83.2 10.8 13.0 17.7
Total residential cable revenue ......................................... 3,543.0 3,442.5 100.5 2.9 2.5
Residential mobile revenue (c):
Subscription revenue (b) .......................................................... 370.1 408.8 (38.7) (9.5) (9.5)
Non-subscription revenue ........................................................ 234.7 205.5 29.2 14.2 14.0
Total residential mobile revenue............................................ 604.8 614.3 (9.5) (1.5) (1.7)
Total residential revenue ..................................................... 4,147.8 4,056.8 91.0 2.2 1.9
B2B revenue (d):
Subscription revenue .................................................................. 57.0 30.9 26.1 84.5 84.6
Non-subscription revenue .......................................................... 695.1 673.2 21.9 3.3 0.8
Total B2B revenue ................................................................... 752.1 704.1 48.0 6.8 4.2
Other revenue (e) .......................................................................... 63.3 45.2 18.1 40.0 9.7
Total..................................................................................... £ 4,963.2 £ 4,806.1 £ 157.1 3.3 2.3
_______________
(a) Residential cable subscription revenue includes amounts received from subscribers for ongoing services. Residential cable
non-subscription revenue includes, among other items, channel carriage fees, installation revenue, late fees and revenue
from the sale of equipment.
(b) Residential subscription revenue from subscribers who purchase bundled services at a discounted rate is generally allocated
proportionally to each service based on the standalone price for each individual service. As a result, changes in the standalone
pricing of our cable and mobile products or the composition of bundles can contribute to changes in our product revenue
categories from period to period.
(c) Residential mobile subscription revenue includes amounts received from subscribers for ongoing services. Residential
mobile non-subscription revenue includes, among other items, interconnect revenue and revenue from sales of mobile
handsets and other devices. Residential mobile interconnect revenue was £53.9 million and £58.9 million during 2017 and
2016, respectively.
(d) B2B subscription revenue represents revenue from SOHO subscribers. SOHO subscribers pay a premium price to receive
expanded service levels along with video, broadband internet, fixed-line telephony or mobile services that are the same or
similar to the mass marketed products offered to our residential subscribers. A portion of the increases in our B2B subscription
revenue is attributable to the conversion of certain residential subscribers to SOHO subscribers. B2B non-subscription
revenue includes revenue from business broadband internet, video, fixed-line telephony, mobile and data services offered
to medium to large enterprises and, on a wholesale basis, to other operators.

II - 74
(e) Other revenue primarily includes broadcasting revenue in Ireland.
The details of the increase in our revenue during 2017, as compared to 2016, are set forth below:
Subscription
revenue
Non-
subscription
revenue Total
in millions
Increase in residential cable subscription revenue due to change in:
Average number of RGUs (a).................................................................................. £ 59.2 £ — £ 59.2
ARPU (b)................................................................................................................. 13.5 — 13.5
Increase in residential cable non-subscription revenue (c) ......................................... — 14.0 14.0
Total increase in residential cable revenue............................................................ 72.7 14.0 86.7
Increase (decrease) in residential mobile revenue (d)................................................. (39.2) 28.8 (10.4)
Increase in B2B revenue (e)........................................................................................ 25.6 5.2 30.8
Increase in other revenue (f) ....................................................................................... — 5.3 5.3
Total organic increase............................................................................................ 59.1 53.3 112.4
Impact of acquisitions ................................................................................................. — 23.2 23.2
Impact of disposals...................................................................................................... — (2.1) (2.1)
Impact of FX ............................................................................................................... 18.3 5.3 23.6
Total....................................................................................................................... £ 77.4 £ 79.7 £ 157.1
_______________
(a) The increase in residential cable subscription revenue related to a change in the average number of RGUs is primarily
attributable to the net effect of (i) increases in the average number of broadband internet, video and fixed-line telephony
RGUs in the U.K. and (ii) a decrease in the average number of video RGUs in Ireland.
(b) The increase in residential cable subscription revenue related to a change in ARPU is attributable to (i) the net effect of (a)
higher ARPU from broadband internet services and (b) lower ARPU from video and fixed-line telephony services and (ii)
an improvement in RGU mix. In addition, ARPU from video, broadband internet and fixed-line telephony services was
adversely impacted by an aggregate revenue decrease of £8.6 million associated with an April 2016 change in the regulations
governing payment handling fees that we charge to our customers in the U.K.
(c) The increase in residential cable non-subscription revenue is primarily attributable to the net effect of (i) an increase in
installation revenue and (ii) a decrease in early termination fees.
(d) The decrease in residential mobile subscription revenue is primarily attributable to the net effect of (i) a decrease in the
U.K., due primarily to lower ARPU, and (ii) an increase in Ireland, mainly due to an increase in the average number of
mobile subscribers. The lower ARPU in the U.K. includes the net effect of (a) a decline of £77.6 million attributable to a
lower number of customers under higher-ARPU subsidized handset contracts and (b) an increase of £31.5 million attributable
to growth in the number of customers under lower-ARPU contracts that provided for two distinct contractual relationships
associated with mobile handsets and mobile airtime services. The increase in residential mobile non-subscription revenue
is primarily due to (1) an increase in revenue from mobile handset sales in the U.K. and (2) a decrease in interconnect
revenue, as a decrease in the U.K. was only partially offset by a volume-related increase in Ireland. The decrease in
interconnect revenue in the U.K. is primarily due to (I) a decline in mobile short message service termination volumes and
(II) lower mobile termination rates and volumes.
(e) The increase in B2B subscription revenue is primarily due to an increase in the average number of broadband internet SOHO
RGUs in the U.K. The increase in B2B non-subscription revenue is primarily due to the net effect of (i) an increase in early
termination fees in the U.K. and (ii) lower revenue from data services in the U.K.
(f) The increase in other revenue is largely due to an increase in broadcasting revenue in Ireland.
II - 75
Programming and other direct costs of services
Our programming and other direct costs of services increased £13.7 million or 1.0% during 2017, as compared to 2016. This
increase includes an increase of £13.5 million attributable to the net impact of acquisitions and a disposition. On an organic basis,
programming and other direct costs of services decreased £6.0 million or 0.4%. This decrease includes the following factors:
• A decrease in interconnect and access costs of £47.6 million or 12.2%. The lower costs are primarily due to the net effect
of (i) a £30.4 million decrease (including £22.5 million and £7.9 million recorded in the second and fourth quarters of
2017, respectively), primarily associated with a telecommunications operator’s agreement to compensate communications
providers, including our company, for certain contractual breaches related to network charges, (ii) lower MVNO costs,
(iii) lower fixed-line telephony call volumes and (iv) a slight increase attributable to higher mobile usage;
• An increase in programming and copyright costs of £28.2 million or 3.5%, primarily due to (i) higher costs for certain
premium and/or basic content, including higher costs for sports rights, and (ii) growth in the number of enhanced video
subscribers;
• An increase in mobile handset and other device costs of £16.5 million or 9.9%, primarily due to the net effect of (i) a
higher average cost per handset sold and (ii) lower mobile handset and other device sales volumes; and
• A net decrease resulting from individually insignificant changes in other direct expense categories.
Other operating expenses
Our other operating expenses increased £38.7 million or 6.4% during 2017, as compared to 2016. This increase includes an
increase of £2.4 million attributable to the impact of acquisitions. On an organic basis, other operating expenses increased £32.1
million or 5.3%. This increase includes the following factors:
• An increase in network infrastructure charges of £25.5 million following an increase in the rateable value of existing
assets. For additional information, see "Other Regulatory Issues" in note 16 to our consolidated financial statements;
• A decrease in personnel costs of £9.2 million or 4.5%, primarily due to the net effect of (i) decreased costs resulting from
higher capitalized labor costs associated with (a) the Network Extension and (b) increased installations of new customer
premises equipment, (ii) lower staffing levels, (iii) annual wage increases and (iv) lower incentive compensation costs;
• A decrease in core network and information technology-related expenses of £5.0 million or 3.5%, primarily due to the
net effect of (i) a decrease in network maintenance and energy costs, (ii) a decrease in information technology-related
expense and (iii) a £4.1 million increase associated with the impact of the settlement of an operational contingency during
the first quarter of 2016; and
• An increase in outsourced labor and professional fees of £1.9 million or 2.5%, primarily due to the net effect of (i) higher
call center costs, largely driven by increased call volumes and (ii) lower consulting costs.
SG&A expenses
Our SG&A expenses (exclusive of share-based compensation) increased £30.4 million or 5.0% during 2017, as compared to
2016. This increase includes an increase of £7.6 million attributable to the impact of acquisitions. On an organic basis, and excluding
share-based compensation, SG&A expenses increased £19.4 million or 3.1%. This increase includes the following factors:
• An increase in core network and information technology-related costs of £13.9 million or 56.1%, primarily due to higher
information technology-related expenses;
• A decrease in personnel costs of £6.3 million or 2.6%, largely due to the net effect of (i) lower incentive compensation
costs, (ii) decreased staffing levels and (iii) annual wage increases;
• An increase in customer service costs of £5.0 million or 31.9% due to higher call center costs;
• A decrease in business service and certain other costs of £2.3 million or 9.5% due to (i) a decrease in consulting costs
and (ii) lower audit and legal fees; and

II - 76
• An increase in external sales and marketing costs of £1.7 million or 0.8%, primarily due to the net effect of (i) higher
third-party sales commissions and (ii) a decrease in costs associated with advertising campaigns.
Share-based compensation expense
A summary of the share-based compensation expense that is included in our SG&A expenses is set forth below:
Year ended December 31,
2017 2016
in millions
Performance-based incentive awards (a) ................................................................................................ £ 4.8 £ 16.1
Other share-based incentive awards........................................................................................................ 16.7 14.9
Other (b) .................................................................................................................................................. 0.5 —
Total (c) .............................................................................................................................................. £ 22.0 £ 31.0
_______________
(a) Includes share-based compensation expense related to (i) Liberty Global PSUs and (ii) the Challenge Performance Awards.
(b) Represents annual incentive compensation and defined contribution plan liabilities that were settled with Liberty Global
ordinary shares.
(c) Amounts include incremental expense of £1.2 million and £2.0 million, respectively, related to the 2015 Award
Modifications .
For additional information regarding our share-based compensation, see note 11 to our consolidated financial statements.
Related-party fees and allocations, net
We recorded related-party fees and allocations, net, related to corporate and administrative services provided to or by our
subsidiaries of £140.7 million and £110.9 million during 2017 and 2016, respectively. For additional information, see note 12 to
our consolidated financial statements.
Depreciation and amortization expense
Our depreciation and amortization expense increased £157.4 million or 9.5% during 2017, as compared to 2016. Excluding
the effects of FX, depreciation and amortization expense increased £153.6 million or 9.3%, primarily due to the net effect of (i)
an increase associated with property and equipment additions related to the installation of customer premises equipment, the
expansion and upgrade of our networks and other capital initiatives, (ii) a decrease associated with certain assets becoming fully
depreciated and (iii) an increase due to accelerated depreciation.
Impairment, restructuring and other operating items, net
We recognized impairment, restructuring and other operating items, net, of £57.5 million and £26.4 million during 2017 and
2016, respectively. The 2017 amount includes (i) a litigation settlement of £30.1 million recorded during the third quarter of 2017
and (ii) restructuring charges of £21.8 million, primarily due to certain reorganization activities that resulted in employee severance
and termination costs and costs related to property closures. The 2016 amount includes (a) restructuring charges of £21.0 million,
primarily related to employee severance and termination costs related to certain reorganization activities and (b) an impairment
charge of £4.1 million.
Interest expense – third-party
Our third-party interest expense increased £30.3 million or 5.2% during 2017, as compared to 2016, primarily due to the net
effect of (i) higher average outstanding third-party debt balances and (ii) lower weighted average interest rates related to the
completion of certain refinancing transactions that resulted in extended maturities and net decreases to certain of our interest rates.
For additional information regarding our outstanding third-party indebtedness, see note 8 to our consolidated financial statements.

II - 77
Interest expense – related-party
Our related-party interest expense decreased £2.3 million or 54.8% during 2017, as compared to 2016, due to lower average
outstanding related-party debt balances. For additional information regarding our related-party indebtedness, see note 12 to our
consolidated financial statements.
Interest income – related-party
Our related-party interest income increased £40.3 million or 13.9% during 2017, as compared to 2016, primarily due to interest
income earned on related-party notes receivable from LG Europe 2. For additional information, see note 12 to our consolidated
financial statements.
Realized and unrealized gains (losses) on derivative instruments, net
The details of our realized and unrealized gains (losses) on derivative instruments, net, are as follows:
Year ended December 31,
2017 2016
in millions
Cross-currency and interest rate derivative contracts (a) ....................................................................... £ (525.2) £ 640.8
Foreign currency forward and option contracts...................................................................................... (2.2) 15.8
Equity-related derivative instruments..................................................................................................... — 9.2
Total ................................................................................................................................................... £ (527.4) £ 665.8
_______________
(a) The loss during 2017 is primarily attributable to the net effect of (i) a net loss associated with changes in the relative value
of certain currencies and (ii) a net gain associated with changes in certain market interest rates. In addition, the loss during
2017 includes a net gain of £78.3 million resulting from changes in our credit risk valuation adjustments. The gain during
2016 is primarily attributable to the net effect of (a) a net gain associated with changes in the relative value of certain
currencies and (b) a net loss associated with changes in certain market interest rates. In addition, the gain during 2016
includes a net loss of £28.5 million resulting from changes in our credit risk valuation adjustments.
For additional information regarding our derivative instruments, see notes 5 and 6 to our consolidated financial statements
and Quantitative and Qualitative Disclosures about Market Risk below.
Foreign currency transaction gains (losses), net
The details of our foreign currency transaction gains (losses), net, are as follows:
Year ended December 31,
2017 2016
in millions
U.S. dollar denominated debt issued by our company ........................................................................... £ 304.6 £ (704.8)
Intercompany payables and receivables denominated in a currency other than the entity’s functionalcurrency (a) ......................................................................................................................................... 272.6 (181.2)
Euro denominated debt issued by our company ..................................................................................... (15.9) (53.8)
Other ....................................................................................................................................................... 4.9 (10.4)
Total ................................................................................................................................................... £ 566.2 £ (950.2)
_______________
(a) Amounts primarily relate to loans between certain of our non-operating subsidiaries.

II - 78
For information regarding how we manage our exposure to foreign currency risk, see Quantitative and Qualitative Disclosures
about Market Risk — Foreign Currency Risk below.
Realized and unrealized losses due to changes in fair values of certain debt, net
Our realized and unrealized gains or losses due to changes in fair values of certain debt include unrealized gains or losses
associated with changes in fair values that are non-cash in nature until such time as these gains or losses are realized through cash
transactions. We recognized realized and unrealized losses due to changes in fair values of certain debt, net, of £25.5 million during
2017 as compared to £4.5 million during 2016. For additional information regarding our fair value measurements, see note 6 to
our consolidated financial statements.
Losses on debt modification and extinguishment, net
We recognized losses on debt modification and extinguishment, net, of £52.4 million and £62.9 million during 2017 and 2016,
respectively. The loss during 2017 is primarily attributable to (i) the payment of £26.0 million of redemption premiums and (ii)
the write-off of £23.2 million of unamortized deferred financing costs, discounts and premiums. The loss during 2016 is attributable
to (a) the payment of £42.2 million of redemption premiums and (b) the write-off of £20.7 million of unamortized deferred financing
costs, discounts and premiums.
For additional information regarding our losses on debt modification and extinguishment, net, see note 8 to our consolidated
financial statements.
Income tax benefit
We recognized income tax benefit of £21.5 million and £13.8 million during 2017 and 2016, respectively.
The income tax benefit during 2017 differs from the expected income tax benefit of £37.9 million (based on the U.S. federal
income tax rate of 35.0%), primarily due to the negative impacts of (i) certain permanent differences between the financial and
tax accounting treatment of items associated with investments in subsidiaries and (ii) statutory tax rates in certain jurisdictions in
which we operate that are lower than the U.S. federal income tax rate. The negative impacts of these items were partially offset
by the positive impact of non-deductible or non-taxable foreign currency exchange results.
The income tax benefit during 2016 differs from the expected income tax benefit of £104.8 million (based on the U.S. federal
income tax rate of 35.0%), primarily due to the negative impacts of (i) a reduction in net deferred tax assets in the U.K. due to
enacted changes in tax law, (ii) statutory tax rates in certain jurisdictions in which we operate that are lower than the U.S. federal
income tax rate and (iii) certain permanent differences between the financial and tax accounting treatment of items associated with
investments in subsidiaries. The negative impacts of these items were partially offset by the positive impact of a net decrease in
valuation allowances.
For additional information concerning our income taxes, see note 9 to our consolidated financial statements.
Net loss
During 2017 and 2016, we reported net losses of £86.9 million and £285.6 million, respectively, including (i) operating income
of £214.6 million and £348.0 million, respectively, (ii) net non-operating expense of £323.0 million and £647.4 million, respectively,
and (iii) income tax benefit of £21.5 million and £13.8 million, respectively.
Liquidity and Capital Resources
Sources and Uses of Cash
Cash and cash equivalents
At December 31, 2018, we had cash and cash equivalents of £16.8 million, substantially all of which was held by our
subsidiaries. The terms of the instruments governing the indebtedness of certain of these subsidiaries may restrict our ability to
access the liquidity of these subsidiaries. In addition, our ability to access the liquidity of our subsidiaries may be limited by tax
and legal considerations and other factors.

II - 79
Liquidity of Virgin Media
Our sources of liquidity at the parent level include (i) our cash and cash equivalents, (ii) funding from LG Europe 2 (and
ultimately from Liberty Global or other Liberty Global subsidiaries) in the form of loans or contributions, as applicable, and (iii)
subject to the restrictions noted above, proceeds in the form of distributions or loans from our subsidiaries. For information regarding
limitations imposed by our subsidiaries’ debt instruments, see note 8 to our consolidated financial statements.
The ongoing cash needs of Virgin Media include corporate general and administrative expenses. From time to time, Virgin
Media may also require cash in connection with (i) the repayment of outstanding debt and related-party obligations (including the
repurchase or exchange of outstanding debt securities in the open market or privately-negotiated transactions), (ii) the satisfaction
of contingent liabilities or (iii) acquisitions and other investment opportunities. No assurance can be given that funding from LG
Europe 2 (and ultimately from Liberty Global or other Liberty Global subsidiaries), our subsidiaries or external sources would be
available on favorable terms, or at all.
Our parent company, Virgin Media, and certain Liberty Global subsidiaries are co-guarantors of the indebtedness of certain
other Liberty Global subsidiaries. We do not believe these guarantees will result in material payments in the future.
Liquidity of our subsidiaries
In addition to cash and cash equivalents, the primary sources of liquidity of our operating subsidiaries are cash provided by
operations and any borrowing availability under the VM Credit Facilities. For details of the borrowing availability of the VM
Credit Facilities, see note 8 to our consolidated financial statements.
The liquidity of our operating subsidiaries generally is used to fund property and equipment additions, debt service requirements
and other liquidity requirements that may arise from time to time. For additional information regarding our consolidated cash
flows, see the discussion under Consolidated Statements of Cash Flows below. Our subsidiaries may also require funding in
connection with (i) the repayment of outstanding debt, (ii) acquisitions and other investment opportunities or (iii) distributions or
loans to Virgin Media, Liberty Global or other Liberty Global subsidiaries. No assurance can be given that any external funding
would be available to our subsidiaries on favorable terms, or at all.
Capitalization
At December 31, 2018, the outstanding principal amount of our consolidated third-party debt, together with our capital lease
obligations, aggregated £12,457.6 million, including £1,931.2 million that is classified as current in our consolidated balance sheet
and £9,157.8 million that is not due until 2024 or thereafter. For additional information regarding our debt maturities, see note 8
to our consolidated financial statements.
As further discussed under Quantitative and Qualitative Disclosures about Market Risk below and in note 5 to our consolidated
financial statements, we use derivative instruments to mitigate foreign currency and interest rate risk associated with our debt
instruments.
Our ability to service or refinance our debt and to maintain compliance with the leverage covenants in our credit agreements
and indentures is dependent primarily on our ability to maintain or increase our Covenant EBITDA and to achieve adequate returns
on our property and equipment additions and acquisitions. In addition, our ability to obtain additional debt financing is limited by
incurrence-based leverage covenants contained in the various debt instruments of our subsidiaries. In this regard, if our Covenant
EBITDA were to decline, our ability to obtain additional debt could be limited. No assurance can be given that we would have
sufficient sources of liquidity, or that any external funding would be available on favorable terms, or at all, to fund any such required
repayment. We do not anticipate any instances of non-compliance with respect to any of our subsidiaries’ debt covenants that
would have a material adverse impact on our liquidity during the next 12 months.
Notwithstanding our negative working capital position at December 31, 2018, we believe that we have sufficient resources
to repay or refinance the current portion of our debt and capital lease obligations and to fund our foreseeable liquidity requirements
during the next 12 months. However, as our maturing debt grows in later years, we anticipate that we will seek to refinance or
otherwise extend our debt maturities. No assurance can be given that we will be able to complete these refinancing transactions
or otherwise extend our debt maturities. In this regard, it is not possible to predict how political and economic conditions, sovereign
debt concerns or any adverse regulatory developments could impact the credit markets we access and, accordingly, our future
liquidity and financial position. Our ability to access debt financing on favorable terms, or at all, could be adversely impacted by
(i) the financial failure of any of our counterparties, which could (a) reduce amounts available under committed credit facilities

II - 80
and (b) adversely impact our ability to access cash deposited with any failed financial institution and (ii) tightening of the credit
markets. In addition, sustained or increased competition, particularly in combination with adverse economic or regulatory
developments, could have an unfavorable impact on our cash flows and liquidity.
All of our consolidated third-party debt and capital lease obligations at December 31, 2018 have been borrowed or incurred
by our subsidiaries. For additional information concerning our debt and capital lease obligations, see note 8 to our consolidated
financial statements.
Consolidated Statements of Cash Flows — 2018 compared to 2017
Summary. Our consolidated statements of cash flows for 2018 and 2017 are summarized as follows:
Year ended December 31,
2018 2017 Change
in millions
Net cash provided by operating activities.................................................................... £ 2,202.0 £ 2,013.8 £ 188.2
Net cash used by investing activities ........................................................................... (342.2) (1,372.1) 1,029.9
Net cash used by financing activities........................................................................... (1,859.9) (640.2) (1,219.7)
Effect of exchange rate changes on cash and cash equivalents and restricted cash..... (0.7) 0.5 (1.2)
Net increase (decrease) in cash and cash equivalents and restricted cash................ £ (0.8) £ 2.0 £ (2.8)
Operating Activities. The increase in net cash provided by our operating activities is primarily attributable to the net effect of
(i) an increase in cash provided by our Segment OCF and related working capital items, (ii) an increase in cash provided due to
higher cash receipts related to derivative instruments and (iii) a decrease in cash provided due to higher payments for interest.
Investing Activities. The decrease in net cash used by our investing activities is primarily attributable to a decrease in cash
used of (i) £941.7 million related to higher net repayments from related parties and (ii) £91.5 million due to lower capital
expenditures.
The capital expenditures that we report in our consolidated statements of cash flows do not include amounts that are financed
under capital-related vendor financing or capital lease arrangements. Instead, these amounts are reflected as non-cash additions
to our property and equipment when the underlying assets are delivered and as repayments of debt when the principal is repaid.
In this discussion, we refer to (i) our capital expenditures as reported in our consolidated statements of cash flows, which exclude
amounts financed under capital-related vendor financing or capital lease arrangements, and (ii) our total property and equipment
additions, which include our capital expenditures on an accrual basis and amounts financed under capital-related vendor financing
or capital lease arrangements. For further details regarding our property and equipment additions, see note 7 to our consolidated
financial statements.
A reconciliation of our consolidated property and equipment additions to our consolidated capital expenditures as reported in
our consolidated statements of cash flows is set forth below:
Year ended December 31,
2018 2017
in millions
Property and equipment additions .................................................................................................... £ 1,488.5 £ 1,672.2
Assets acquired under capital-related vendor financing arrangements ............................................ (1,057.2) (1,153.2)
Assets acquired under capital leases................................................................................................. (6.8) (11.5)
Changes in current liabilities related to capital expenditures (including related-party amounts) .... 7.3 15.8
Capital expenditures ....................................................................................................................... £ 431.8 £ 523.3
The decrease in our property and equipment additions is primarily due to (i) a decrease in expenditures for new build and
upgrade projects, including the Network Extension and (ii) a decrease in expenditures to support new customer products and

II - 81
operational efficiency initiatives. During 2018 and 2017, our property and equipment additions represented 28.9% and 33.7% of
our revenue, respectively. For additional information regarding the Network Extension, see Overview above.
Financing Activities. The increase in cash used by our financing activities is primarily attributable to the net effect of (i) an
increase in cash used of £1,686.6 million related to higher net repayments and repurchases of third-party debt and capital lease
obligations, (ii) a decrease in cash used of £256.7 million related to lower net repayments of related-party debt and (iii) a decrease
in cash used of £75.0 million due to higher cash receipts related to derivative instruments.
Consolidated Statements of Cash Flows — 2017 compared to 2016
Summary. Our consolidated statements of cash flows for 2017 and 2016 are summarized as follows:
Year ended December 31,
2017 2016 Change
in millions
Net cash provided by operating activities ....................................................................... £ 2,013.8 £ 1,806.4 £ 207.4
Net cash used by investing activities .............................................................................. (1,372.1) (2,009.8) 637.7
Net cash provided (used) by financing activities ............................................................ (640.2) 203.3 (843.5)
Effect of exchange rate changes on cash and cash equivalents and restricted cash........ 0.5 3.1 (2.6)
Net increase in cash and cash equivalents and restricted cash .................................... £ 2.0 £ 3.0 £ (1.0)
Operating Activities. The increase in net cash provided by our operating activities is primarily attributable to the net effect of
(i) an increase in cash provided by our Segment OCF and related working capital items, (ii) an increase in cash provided due to
higher receipts of related-party interest income, (iii) a decrease in cash provided due to higher payments for interest and (iv) an
increase in cash provided due to higher cash receipts related to derivative instruments.
Investing Activities. The decrease in net cash used by our investing activities is primarily attributable to decreases in cash used
of (i) £564.2 million to fund loans to subsidiaries of Liberty Global, (ii) £36.4 million due to lower capital expenditures and (iii)
£34.2 million associated with cash paid in connection with acquisitions.
A reconciliation of our consolidated property and equipment additions to our consolidated capital expenditures as reported in
our consolidated statements of cash flows is set forth below:
Year ended December 31,
2017 2016
in millions
Property and equipment additions .................................................................................................... £ 1,672.2 £ 1,317.3
Assets acquired under capital-related vendor financing arrangements ............................................ (1,153.2) (636.9)
Assets acquired under capital leases................................................................................................. (11.5) (14.3)
Changes in current liabilities related to capital expenditures (including related-party amounts) .... 15.8 (106.4)
Capital expenditures ....................................................................................................................... £ 523.3 £ 559.7
The increase in our property and equipment additions is primarily due to the increase in expenditures associated with higher
investment in customer premises equipment and the Network Extension. During 2017 and 2016, our property and equipment
additions represented 33.7% and 27.4% of our revenue, respectively. For additional information regarding the Network Extension,
see Overview above.
Financing Activities. The change in net cash provided (used) by our financing activities is primarily attributable to a decrease
in cash of (i) £490.7 million related to lower net borrowings of third-party debt, (ii) £230.8 million related to higher net repayments
of related-party debt, (iii) £30.8 million due to lower net cash received related to derivative instruments and (iv) £6.6 million due
to higher payments of financing costs and debt premiums.

II - 82
Contractual Commitments
The pound sterling equivalents of our commitments as of December 31, 2018 are presented below:
Payments due during:
2019 2020 2021 2022 2023 Thereafter Total
in millions
Debt (excluding interest):
Third-party .............................................. £ 1,925.5 £ 12.4 £ 1,036.1 £ 246.4 £ 59.1 £ 9,123.9 £ 12,403.4
Related-party ........................................... — — 57.2 — — 55.5 112.7
Capital leases (excluding interest)............. 5.7 3.6 3.4 5.4 2.2 33.9 54.2
Programming commitments ...................... 507.9 321.3 167.1 20.5 11.1 35.1 1,063.0
Network and connectivity commitments... 356.8 172.3 155.1 15.9 4.3 8.7 713.1
Purchase commitments (a) ........................ 350.1 119.0 44.4 10.2 0.7 0.2 524.6
Operating leases......................................... 36.8 29.6 24.9 20.3 17.2 52.1 180.9
Other commitments ................................... 17.0 0.6 — — — — 17.6
Total (b) ................................................ £ 3,199.8 £ 658.8 £ 1,488.2 £ 318.7 £ 94.6 £ 9,309.4 £ 15,069.5
Projected cash interest payments on third-party debt and capital leaseobligations (c) ........................................ £ 617.5 £ 612.1 £ 583.0 £ 549.1 £ 537.0 £ 1,347.6 £ 4,246.3
_______________
(a) Includes £1.4 million of related-party purchase obligations due during 2019.
(b) The commitments included in this table do not reflect any liabilities that are included in our December 31, 2018 consolidated
balance sheet other than debt and capital lease obligations.
(c) Amounts are based on interest rates, interest payment dates, commitment fees and contractual maturities in effect as of
December 31, 2018. These amounts are presented for illustrative purposes only and will likely differ from the actual cash
payments required in future periods. In addition, the amounts presented do not include the impact of our interest rate
derivative contracts, deferred financing costs, original issue premiums or discounts.
For information concerning our debt and capital lease obligations, see note 8 to our consolidated financial statements. For
information concerning our commitments, see note 16 to our consolidated financial statements.
In addition to the commitments set forth in the table above, we have significant commitments under (i) derivative instruments
and (ii) defined benefit plans and similar agreements, pursuant to which we expect to make payments in future periods. For
information regarding projected cash flows associated with these derivative instruments, see Quantitative and Qualitative
Disclosures about Market Risk — Projected Cash Flows Associated with Derivative Instruments below. For information regarding
our derivative instruments, including the net cash paid or received in connection with these instruments during 2018, 2017 and
2016, see note 5 to our consolidated financial statements. For information regarding our defined benefit plans, see note 14 to our
consolidated financial statements.
Critical Accounting Policies, Judgments and Estimates
In connection with the preparation of our consolidated financial statements, we make estimates and assumptions that affect
the reported amounts of assets and liabilities, revenue and expenses and related disclosure of contingent assets and liabilities.
Critical accounting policies are defined as those policies that are reflective of significant judgments, estimates and uncertainties,
which would potentially result in materially different results under different assumptions and conditions. We believe the following
accounting policies are critical in the preparation of our consolidated financial statements because of the judgment necessary to
account for these matters and the significant estimates involved, which are susceptible to change:
• Impairment of property and equipment and intangible assets (including goodwill);
• Costs associated with construction and installation activities;

II - 83
• Fair value measurements; and
• Income tax accounting.
We have discussed the selection of the aforementioned critical accounting policies with the audit committee of Liberty Global’s
board of directors. For additional information concerning our significant accounting policies, see note 3 to our consolidated financial
statements.
Impairment of Property and Equipment and Intangible Assets
Carrying Value. The aggregate carrying value of our property and equipment and intangible assets (including goodwill) that
was held for use comprised 60.3% of our total assets at December 31, 2018.
When circumstances warrant, we review the carrying amounts of our property and equipment and our intangible assets (other
than goodwill) to determine whether such carrying amounts continue to be recoverable. Such changes in circumstance may include
(i) an expectation of a sale or disposal of a long-lived asset or asset group, (ii) adverse changes in market or competitive conditions,
(iii) an adverse change in legal factors or business climate in the markets in which we operate and (iv) operating or cash flow
losses. For purposes of impairment testing, long-lived assets are grouped at the lowest level for which cash flows are largely
independent of other assets and liabilities, generally at or below the reporting unit level (see below). If the carrying amount of the
asset or asset group is greater than the expected undiscounted cash flows to be generated by such asset or asset group, an impairment
adjustment is recognized. Such adjustment is measured by the amount that the carrying value of such asset or asset group exceeds
its fair value. We generally measure fair value by considering (a) sale prices for similar assets, (b) discounted estimated future
cash flows using an appropriate discount rate and/or (c) estimated replacement cost. Assets to be disposed of are recorded at the
lower of their carrying amount or fair value less costs to sell.
We evaluate goodwill for impairment at least annually on October 1 and whenever facts and circumstances indicate that the
carrying amount of goodwill may not be recoverable. For impairment evaluations with respect to goodwill, we first make a
qualitative assessment to determine if the goodwill may be impaired. If it is more-likely-than-not that a reporting unit’s fair value
is less than its carrying value, we then compare the fair value of the reporting unit to its respective carrying amount. Any excess
of the carrying amount over the fair value would be charged to operations as an impairment loss. A reporting unit is an operating
segment or one level below an operating segment (referred to as a “component”). We have identified one reporting unit to which
all goodwill is assigned.
When required, considerable management judgment is necessary to estimate the fair value of reporting units and underlying
long-lived and indefinite-lived assets. We typically determine fair value using an income-based approach (discounted cash flows)
based on assumptions in our long-range business plans and, in some cases, a combination of an income-based approach and a
market-based approach. With respect to our discounted cash flow analysis used in the income-based approach, the timing and
amount of future cash flows under these business plans require estimates of, among other items, subscriber growth and retention
rates, rates charged per product, expected gross margin and Segment OCF margin and expected property and equipment additions.
The development of these cash flows, and the discount rate applied to the cash flows, is subject to inherent uncertainties, and actual
results could vary significantly from such estimates. Our determination of the discount rate is based on a weighted average cost
of capital approach, which uses a market participant’s cost of equity and after-tax cost of debt and reflects the risks inherent in the
cash flows. Based on the results of our 2018 qualitative assessment of our reporting unit carrying value, we determined that it was
more-likely-than-not that fair value exceeded carrying value for the reporting unit.
During the three years ended December 31, 2018, we did not record any significant impairment charges with respect to our
property and equipment and intangible assets (including goodwill). For additional information regarding our long-lived assets, see
note 7 to our consolidated financial statements.
If, among other factors, (i) our enterprise value or Liberty Global’s equity values were to decline or (ii) the adverse impacts
of economic, competitive, regulatory or other factors were to cause our results of operations or cash flows to be worse than
anticipated, we could conclude in future periods that impairment charges are required in order to reduce the carrying values of our
goodwill and, to a lesser extent, other long-lived assets. Any such impairment charges could be significant.

II - 84
Costs Associated with Construction and Installation Activities
We capitalize costs associated with the construction of new cable and mobile transmission and distribution facilities and the
installation of new cable services. Installation activities that are capitalized include (i) the initial connection (or drop) from our
cable system to a customer location, (ii) the replacement of a drop and (iii) the installation of equipment for additional services,
such as digital cable, telephone or broadband internet service. The costs of other customer-facing activities, such as reconnecting
customer locations where a drop already exists, disconnecting customer locations and repairing or maintaining drops, are expensed
as incurred.
The nature and amount of labor and other costs to be capitalized with respect to construction and installation activities involves
significant judgment. In addition to direct external and internal labor and materials, we also capitalize other costs directly attributable
to our construction and installation activities, including dispatch costs, quality-control costs, vehicle-related costs and certain
warehouse-related costs. The capitalization of these costs is based on time sheets, time studies, standard costs, call tracking systems
and other verifiable means that directly link the costs incurred with the applicable capitalizable activity. We continuously monitor
the appropriateness of our capitalization policies and update the policies when necessary to respond to changes in facts and
circumstances, such as the development of new products and services and changes in the manner that installations or construction
activities are performed.
Fair Value Measurements
U.S. GAAP provides guidance with respect to the recurring and nonrecurring fair value measurements and for a fair value
hierarchy that prioritizes the inputs to valuation techniques used to measure fair value into three broad levels. Level 1 inputs are
quoted market prices in active markets for identical assets or liabilities that the reporting entity has the ability to access at the
measurement date. Level 2 inputs are inputs other than quoted market prices included within Level 1 that are observable for the
asset or liability, either directly or indirectly. Level 3 inputs are unobservable inputs for the asset or liability.
Recurring Valuations. We perform recurring fair value measurements with respect to our derivative instruments and certain
instruments that we classify as debt, each of which are carried at fair value. We use (i) cash flow valuation models to determine
the fair values of our interest rate and foreign currency derivative instruments and (ii) a Black Scholes option pricing model to
determine the fair values of our equity-related derivative instruments. For a detailed discussion of the inputs we use to determine
the fair value of our derivative instruments, see note 6 to our consolidated financial statements. See also note 5 to our consolidated
financial statements for information concerning our derivative instruments.
Changes in the fair values of our derivative instruments and certain instruments that we classify as debt have had, and we
believe will continue to have, a significant and volatile impact on our results of operations. During 2018, 2017 and 2016, we
recognized net gains (losses) of £472.1 million, (£552.9 million) and £661.3 million, respectively, attributable to changes in the
fair values of these items.
As further described in note 5 to our consolidated financial statements, actual amounts received or paid upon the settlement
of our derivative instruments may differ materially from the recorded fair values at December 31, 2018.
For information concerning the sensitivity of the fair value of certain of our more significant derivative instruments to changes
in market conditions, see Quantitative and Qualitative Disclosures About Market Risk — Sensitivity Information below.
Nonrecurring Valuations. Our nonrecurring valuations are primarily associated with (i) the application of acquisition
accounting and (ii) impairment assessments, both of which require that we make fair value determinations as of the applicable
valuation date. In making these determinations, we are required to make estimates and assumptions that affect the recorded amounts,
including, but not limited to, expected future cash flows, market comparables and discount rates, remaining useful lives of long-
lived assets, replacement or reproduction costs of property and equipment and the amounts to be recovered in future periods from
acquired net operating losses and other deferred tax assets. To assist us in making these fair value determinations, we may engage
third-party valuation specialists. Our estimates in this area impact, among other items, the amount of depreciation and amortization,
impairment charges and income tax expense or benefit that we report. Our estimates of fair value are based upon assumptions we
believe to be reasonable, but which are inherently uncertain. All of our long-lived assets are subject to impairment assessments.
For additional information, see notes 6 and 7 to our consolidated financial statements.

II - 85
Income Tax Accounting
We are required to estimate the amount of tax payable or refundable for the current year and the deferred tax assets and
liabilities for the future tax consequences attributable to differences between the financial statement carrying amounts and income
tax basis of assets and liabilities and the expected benefits of utilizing net operating loss and tax credit carryforwards, using enacted
tax rates in effect for each taxing jurisdiction in which we operate for the year in which those temporary differences are expected
to be recovered or settled. This process requires our management to make assessments regarding the timing and probability of the
ultimate tax impact of such items.
Net deferred tax assets are reduced by a valuation allowance if we believe it more-likely-than-not such net deferred tax assets
will not be realized. Establishing or reducing a tax valuation allowance requires us to make assessments about the timing of future
events, including the probability of expected future taxable income and available tax planning strategies. At December 31, 2018,
the aggregate valuation allowance provided against deferred tax assets was £2,190.6 million. The actual amount of deferred income
tax benefits realized in future periods will likely differ from the net deferred tax assets reflected in our December 31, 2018
consolidated balance sheet due to, among other factors, possible future changes in income tax law or interpretations thereof in the
jurisdictions in which we operate and differences between estimated and actual future taxable income. Any such factors could
have a material effect on our current and deferred tax positions as reported in our consolidated financial statements. A high degree
of judgment is required to assess the impact of possible future outcomes on our current and deferred tax positions.
Tax laws in jurisdictions in which we have a presence are subject to varied interpretation, and many tax positions we take are
subject to significant uncertainty regarding whether the position will be ultimately sustained after review by the relevant tax
authority. We recognize the financial statement effects of a tax position when it is more-likely-than-not, based on technical merits,
that the position will be sustained upon examination. The determination of whether the tax position meets the more-likely-than-
not threshold requires a facts-based judgment using all information available. In a number of cases, we have concluded that the
more-likely-than-not threshold is not met and, accordingly, the amount of tax benefit recognized in our consolidated financial
statements is different than the amount taken or expected to be taken in our tax returns. As of December 31, 2018, the amount of
unrecognized tax benefits for financial reporting purposes, but taken or expected to be taken in our tax returns, was £126.6 million,
of which £120.5 million would have a favorable impact on our effective income tax rate if ultimately recognized, after considering
amounts that we would expect to be offset by valuation allowances.
We are required to continually assess our tax positions, and the results of tax examinations or changes in judgment can result
in substantial changes to our unrecognized tax benefits.
For additional information regarding our income taxes, see note 9 to our consolidated financial statements.

II - 86
QUANTITATIVE AND QUALITATIVE DISCLOSURES ABOUT MARKET RISK
We are exposed to market risk in the normal course of our business operations due to our ongoing investing and financing
activities. Market risk refers to the risk of loss arising from adverse changes in foreign currency exchange rates and interest rates.
The risk of loss can be assessed from the perspective of adverse changes in fair values, cash flows and future earnings. As further
described below, we have established policies, procedures and processes governing our management of market risks and the use
of derivative instruments to manage our exposure to such risks.
Cash
We invest our cash in highly liquid instruments that meet high credit quality standards. At December 31, 2018, £7.7 million
or 45.9%, £5.3 million or 31.5% and £3.8 million or 22.6% of our consolidated cash balances were denominated in pounds sterling,
euros, and U.S. dollars, respectively.
Foreign Currency Risk
We are exposed to foreign currency exchange rate risk with respect to our consolidated debt in situations where our debt is
denominated in U.S. dollars and euros. Although we generally match the denomination of our and our subsidiaries’ borrowings
with our functional currency, market conditions or other factors may cause us to enter into borrowing arrangements that are not
denominated in our functional currency (unmatched debt). In these cases, our policy is to provide for an economic hedge against
foreign currency exchange rate movements by using derivative instruments to synthetically convert unmatched debt into the
applicable underlying currency. At December 31, 2018, substantially all of our debt was either directly or synthetically matched
to our functional currency. For additional information concerning the terms of our derivative instruments, see note 5 to our
consolidated financial statements.
In addition to the exposure that results from the mismatch of our borrowings and our functional currency, we are exposed to
foreign currency risk to the extent that we enter into transactions denominated in currencies other than our functional currency
(non-functional currency risk), such as equipment purchases, programming contracts, notes payable and notes receivable (including
intercompany amounts). Changes in exchange rates with respect to amounts recorded in our consolidated balance sheets related
to these items will result in unrealized (based upon period-end exchange rates) or realized foreign currency transaction gains and
losses upon settlement of the transactions. Moreover, to the extent that our revenue, costs and expenses are denominated in currencies
other than our functional currency, we will experience fluctuations in our revenue, costs and expenses solely as a result of changes
in foreign currency exchange rates. Generally, we will consider hedging non-functional currency risks when the risks arise from
agreements with third parties that involve the future payment or receipt of cash or other monetary items to the extent that we can
reasonably predict the timing and amount of such payments or receipts and the payments or receipts are not otherwise hedged. In
this regard, we have entered into foreign currency forward and option contracts to hedge certain of these risks. For additional
information concerning our foreign currency forward and option contracts, see note 5 to our consolidated financial statements.
The relationship between (i) the euro and the U.S. dollar and (ii) the pound sterling, which is our reporting currency, is shown
below, per one pound sterling:
As of December 31,
2018 2017
Spot rates:
Euro................................................................................................................................................... 1.1130 1.1250
U.S. dollar ......................................................................................................................................... 1.2746 1.3524
Year ended December 31,
2018 2017 2016
Average rates:
Euro............................................................................................................................ 1.1301 1.1410 1.2207
U.S. dollar .................................................................................................................. 1.3353 1.2875 1.3500

II - 87
Inflation Risk
We are subject to inflationary pressures with respect to labor, programming and other costs. While we attempt to increase our
revenue to offset increases in costs, there is no assurance that we will be able to do so. Therefore, costs could rise faster than
associated revenue, thereby resulting in a negative impact on our operating results, cash flows and liquidity. The economic
environment in the U.K. and Ireland is a function of government, economic, fiscal and monetary policies and various other factors
beyond our control that could lead to inflation. We are unable to predict the extent that price levels might be impacted in future
periods by the current state of the economies in the U.K. and Ireland.
Interest Rate Risks
We are exposed to changes in interest rates primarily as a result of our borrowing activities, which include fixed-rate and
variable-rate borrowings by our subsidiaries. Our primary exposure to variable-rate debt is through our LIBOR-indexed VM Credit
Facilities.
In general, we enter into derivative instruments to protect against increases in the interest rates on our variable-rate debt.
Accordingly, we have entered into various derivative transactions to manage exposure to increases in interest rates. We use interest
rate derivative contracts to exchange, at specified intervals, the difference between fixed and variable interest rates calculated by
reference to an agreed-upon notional principal amount. We also use interest rate cap agreements and swaptions that lock in a
maximum interest rate if variable rates rise, but also allow our company to benefit from declines in market rates. Under our current
guidelines, we use various interest rate derivative instruments to mitigate interest rate risk, generally for five years, with the later
years covered primarily by swaptions. As such, the final maturity dates of our various portfolios of interest rate derivative instruments
generally fall short of the respective maturities of the underlying variable-rate debt. In this regard, we use judgment to determine
the appropriate composition and maturity dates of our portfolios of interest rate derivative instruments, taking into account the
relative costs and benefits of different maturity profiles in light of current and expected future market conditions, liquidity issues
and other factors. For additional information concerning the impacts of these interest rate derivative instruments, see note 5 to our
consolidated financial statements.
In July 2017, the U.K. Financial Conduct Authority (the authority that regulates LIBOR) announced that it intends to stop
compelling banks to submit rates for the calculation of LIBOR after 2021. Currently, it is not possible to predict the exact transitional
arrangements for calculating applicable reference rates that may be made in the U.K., the U.S., the Eurozone or elsewhere given
that a number of outcomes are possible, including the cessation of the publication of one or more reference rates. Our loan documents
contain provisions that contemplate alternative calculations of the base rate applicable to our LIBOR-indexed debt to the extent
LIBOR is not available, which alternative calculations we do not anticipate will be materially different from what would have
been calculated under LIBOR. Additionally, no mandatory prepayment or redemption provisions would be triggered under our
loan documents in the event that the LIBOR rate is not available. It is possible, however, that any new reference rate that applies
to our LIBOR-indexed debt could be different than any new reference rate that applies to our LIBOR-indexed derivative instruments.
We anticipate managing this difference and any resulting increased variable-rate exposure through modifications to our debt and/
or derivative instruments, however future market conditions may not allow immediate implementation of desired modifications
and/or the company may incur significant associated costs.
Weighted Average Variable Interest Rate. At December 31, 2018, the outstanding principal amount of our variable-rate
indebtedness aggregated £1.7 billion, and the weighted average interest rate (including margin) on such variable-rate indebtedness
was approximately 3.9%, excluding the effects of interest rate derivative contracts, deferred financing costs, original issue premiums
or discounts and commitment fees, all of which affect our overall cost of borrowing. Assuming no change in the amount outstanding,
and without giving effect to any interest rate derivative contracts, deferred financing costs, original issue premiums or discounts
and commitment fees, a hypothetical 50 basis point (0.50%) increase (decrease) in our weighted average variable interest rate
would increase (decrease) our annual interest expense and cash outflows by £8.5 million. As discussed above and in note 5 to our
consolidated financial statements, we use interest rate derivative contracts to manage our exposure to increases in variable interest
rates. In this regard, increases in the fair value of these contracts generally would be expected to offset most of the economic impact
of increases in the variable interest rates applicable to our indebtedness to the extent and during the period that principal amounts
are matched with interest rate derivative contracts.

II - 88
Counterparty Credit Risk
We are exposed to the risk that the counterparties to our derivative instruments and undrawn debt facilities will default on
their obligations to us. We manage these credit risks through the evaluation and monitoring of the creditworthiness of, and
concentration of risk with, the respective counterparties. In this regard, credit risk associated with our derivative instruments and
undrawn debt facilities is spread across a relatively broad counterparty base of banks and financial institutions. Collateral is
generally not posted by either party under the derivative instruments. Most of our cash currently is invested in either (i) AAA credit
rated money market funds, including funds that invest in government obligations, or (ii) overnight deposits with banks having a
minimum credit rating of A by Standard & Poor’s or an equivalent rating by Moody’s Investor Service. To date, neither the access
to nor the value of our cash and cash equivalent balances have been adversely impacted by liquidity problems of financial institutions.
At December 31, 2018, our exposure to counterparty credit risk included (i) derivative assets with an aggregate fair value of
£360.2 million, (ii) cash and cash equivalent and restricted cash balances of £24.4 million and (iii) aggregate undrawn debt facilities
of £675.0 million.
We have entered into derivative instruments under master agreements with each counterparty that contain master netting
arrangements that are applicable in the event of early termination by either party to such derivative instrument. The master netting
arrangements are limited to the derivative instruments, and derivative-related debt instruments, governed by the relevant master
agreement and are independent of similar arrangements.
Under our derivative contracts, it is generally only the non-defaulting party that has a contractual option to exercise early
termination rights upon the default of the other counterparty and to set off other liabilities against sums due upon such termination.
However, in an insolvency of a derivative counterparty, under the laws of certain jurisdictions, the defaulting counterparty or its
insolvency representatives may be able to compel the termination of one or more derivative contracts and trigger early termination
payment liabilities payable by us, reflecting any mark-to-market value of the contracts for the counterparty. Alternatively, or in
addition, the insolvency laws of certain jurisdictions may require the mandatory set off of amounts due under such derivative
contracts against present and future liabilities owed to us under other contracts between us and the relevant counterparty.
Accordingly, it is possible that we may be subject to obligations to make payments, or may have present or future liabilities owed
to us partially or fully discharged by set off as a result of such obligations, in the event of the insolvency of a derivative counterparty,
even though it is the counterparty that is in default and not us. To the extent that we are required to make such payments, our ability
to do so will depend on our liquidity and capital resources at the time. In an insolvency of a defaulting counterparty, we will be
an unsecured creditor in respect of any amount owed to us by the defaulting counterparty, except to the extent of the value of any
collateral we have obtained from that counterparty.
In addition, where a counterparty is in financial difficulty, under the laws of certain jurisdictions, the relevant regulators may
be able to (i) compel the termination of one or more derivative instruments, determine the settlement amount and/or compel,
without any payment, the partial or full discharge of liabilities arising from such early termination that are payable by the relevant
counterparty or (ii) transfer the derivative instruments to an alternative counterparty.
While we currently have no specific concerns about the creditworthiness of any counterparty for which we have material
credit risk exposures, we cannot rule out the possibility that one or more of our counterparties could fail or otherwise be unable
to meet its obligations to us. Any such instance could have an adverse effect on our cash flows, results of operations, financial
condition and/or liquidity.
Although we actively monitor the creditworthiness of our key vendors, the financial failure of a key vendor could disrupt our
operations and have an adverse impact on our revenue and cash flows.

II - 89
Sensitivity Information
Information concerning the sensitivity of the fair value of certain of our more significant derivative instruments to changes
in market conditions is set forth below. The potential changes in fair value set forth below do not include any amounts associated
with the remeasurement of the derivative asset or liability into the applicable functional currency. For additional information, see
notes 5 and 6 to our consolidated financial statements.
Cross-currency and Interest Rate Derivative Contracts
Holding all other factors constant, at December 31, 2018 an instantaneous increase (decrease) of 10% in the value of the pound
sterling relative to the U.S. dollar would have decreased (increased) the aggregate fair value of our cross-currency and interest
rate derivative contracts by approximately £560 million.
Projected Cash Flows Associated with Derivative Instruments
The following table provides information regarding the projected cash flows associated with our derivative instruments. The
pound sterling equivalents presented below are based on interest rates and exchange rates that were in effect as of December 31,
2018. These amounts are presented for illustrative purposes only and will likely differ from the actual cash payments required in
future periods. For additional information regarding our derivative instruments see note 5 to our consolidated financial statements.
For information concerning the counterparty credit risk associated with our derivative instruments, see the discussion under
Counterparty Credit Risk above.
Payments (receipts) due during:
Total 2019 2020 2021 2022 2023 Thereafter
in millions
Projected derivative cash payments(receipts), net:
Interest-related (a)............................ £ (49.2) £ (56.7) £ (35.5) £ (25.7) £ (24.6) £ 40.1 £ (151.6)
Principal-related (b) ......................... 4.5 — (74.7) (111.9) (144.7) (457.7) (784.5)
Other (c) .......................................... (2.3) — — — — — (2.3)
Total .............................................. £ (47.0) £ (56.7) £ (110.2) £ (137.6) £ (169.3) £ (417.6) £ (938.4)
_______________
(a) Includes (i) the cash flows of our interest rate cap, swaption and swap contracts and (ii) the interest-related cash flows of
our cross-currency and interest rate swap contracts.
(b) Includes the principal-related cash flows of our cross-currency swap contracts.
(c) Includes amounts related to our foreign currency forward and option contracts, including £1.9 million of related-party
foreign currency forwards.