comprehensive annual financial report · georgia for its comprehensive annual financial report for...
TRANSCRIPT
F i s c a l Ye a r E n d e dJune 30, 2011
A COMPONENT UNIT OF THE STATE OF GEORGIA
TEACHERS RETIREMENT SYSTEM OF GEORGIA
Comprehensive Annual Financial Report

F i s c a l Ye a r E n d e dJune 30, 2011
Jeffrey L. EzellExecutive Director
A COMPONENT UNIT OF THE STATE OF GEORGIA
Comprehensive Annual Financial Report
TEACHERS RETIREMENT SYSTEM OF GEORGIA

INTRODUCTORY SECTION
Table of Contents
Statistical Section Overview 44Financial Trends 45Operating Information 47
Statistical Section
Certificate of Achievement 1Public Pension Standards Award 2Board of Trustees 3Letter of Transmittal 4Your Retirement System 7System Assets 8Administrative Staff and Organization 9Summary of Plan Provisions 10
Introductory SectionInvestment Overview 34Rates of Return 35Asset Allocation 36Schedule of Fees and Commissions 36Investment Summary 36Portfolio Detail Statistics 37
Investment Section
Financial SectionIndependent Auditors’ ReportManagement’s Discussion & Analysis (Unaudited) Basic Financial Statements: Statements of Plan Net Assets
Statements of Changes in Plan Net Assets
Notes to Financial Statements Required Supplementary Schedules (Unaudited): Schedule of Funding Progress Schedule of Employer Contributions
Notes to Required Supplementary Schedules Additional Information: Schedule of Administrative Expenses Schedule of Investment Expenses
13
14
18
1920
3030
31
3233
Actuarial SectionActuary’s Certification Letter 38Summary of Actuarial Assumptions and Methods 39Actuarial Valuation Data 41

INTRODUCTORY SECTION1
Certificate of Achievement

INTRODUCTORY SECTION2
Public Pension Standards Award
2010

INTRODUCTORY SECTION3
Board of Trusteesas of December 1, 2011
* Investment Committee Member
Ms. Jennifer W. FrischClassroom Teacher
Appointed by the GovernorTerm Expires 6/30/14
Mr. Steve McCoy*State Treasurer
Ex-Officio
Dr. Virginia J. Dixon*Retired Teacher
Elected by the Board of TrusteesTerm Expires 6/30/12
Mr. Brad DunaganCitizen of the State
Appointed by the GovernorTerm Expires 6/30/14
Mr. Russell W. Hinton*VICE-CHAIRState Auditor
Ex-Officio
Dr. L. C. Evans*CHAIR
TRS MemberAppointed by the Governor
Term Expires 6/30/12
Dr. Ralph E. SteuerTRS Member
Appointed by the Board of RegentsTerm Expires 6/30/12
Mr. Thomas W. Norwood*Investment Professional
Elected by the Board of TrusteesTerm Expires 6/30/14
Mr. J. Alvin Wilbanks*Administrator
Appointed by the GovernorTerm Expires 6/30/13
Ms. Rachel L. WillisClassroom Teacher
Appointed by the GovernorTerm Expires 6/30/12
INTRODUCTORY SECTION4
Letter of Transmittal
Teachers Retirement System of Georgia Jeffrey L. Ezell
Executive Director
I am pleased to present the Comprehensive Annual Financial Report of the Teachers Retirement System of Georgia (the “System”) for the fiscal year ended June 30, 2011. Responsibility for both the accuracy of the data, and completeness and fairness of the presentation, including all disclosures, rests with the management of the System. To the best of our knowledge and belief, the enclosed data is accurate in all material respects and is reported in a manner designed to present fairly the financial position and results of operations of the System. I trust that you will find this report helpful in understanding your retirement system.
Certificate of Achievement The Government Finance Officers Association of the United States and Canada (GFOA) awarded a Certificate of Achievement for Excellence in Financial Reporting to the Teachers Retirement System of Georgia for its Comprehensive Annual Financial Report for the fiscal year ended June 30, 2010. This was the 23rd consecutive year that the System has achieved this prestigious award.
In order to be awarded a Certificate of Achievement, a government unit must publish an easily readable and efficiently organized Comprehensive Annual Financial Report. This report must satisfy both generally accepted accounting principles and applicable legal requirements.
A Certificate of Achievement is valid for a period of one year only. We believe our current Comprehensive Annual Financial Report continues to meet the
Certificate of Achievement Program’s requirements, and we are submitting it to the GFOA to determine its eligibility for another certificate.
History and Overview The System was created in 1943, by an act of the Georgia General Assembly to provide retirement security to those individuals who choose to dedicate their lives to educating the children of the State of Georgia, and began operations in 1945. A summary of the System’s provisions is provided on pages 10-12 of this report.
The System is the largest public pension fund in the State of Georgia, the 24th largest public pension fund in the United States and the 53rd largest pension fund in the world.
The System is governed by a ten-member Board of Trustees which appoints the Executive Director who is responsible for the administration and operations of the System, which serves more than 394,000 active and retired members, and 399 employers.
Financial Information The management of the System is charged with the responsibility of maintaining a sound system of internal accounting controls. The objectives of such a system are to provide management with reasonable assurance that assets are safeguarded against loss from unauthorized use or disposition, that transactions are executed in accordance with management’s authorizations, and that they are recorded properly
December 16, 2011Board of TrusteesTeachers Retirement System of GeorgiaAtlanta, Georgia

INTRODUCTORY SECTION5
Letter of Transmittalto permit the preparation of financial statements in accordance with generally accepted accounting principles. Even though there are inherent limitations in any system of internal control, the management of the System makes every effort to ensure that through systematic reporting and internal reviews, errors or fraud would be quickly detected and corrected.
Please refer to Management’s Discussion and Analysis starting on page 14 of this report for an overview of the financial status of the System, including a summary of the System’s Net Assets, Changes in Net Assets, and Asset Allocations.
INVESTMENTS — The System has continued to invest in a mix of high quality bonds and stocks as it historically has done. These types of investments have allowed the System to participate in rising markets, while moderating the risks on the downside. New funds continue to be invested in high quality securities. A high quality balanced fund has proven to be a successful strategy in a variety of markets over a long period of time.
As in previous years, maintaining quality was a primary goal and was successfully met. “Conservation of Capital” and “Conservatism” continue to be the principal guides in investment decisions. The System continued to use a diversified portfolio to accomplish these objectives.
FUNDING — The System’s funding policy provides for employee and employer contributions at rates, expressed as a percentage of annual covered payroll, that are sufficient to provide resources to pay benefits when due.
A useful indicator of the funded status of a retirement system is the relationship between the actuarial value of assets and the actuarial accrued liabilities. The System continues to remain strong as evidenced by the ratio of the actuarial value of assets to the actuarial accrued liabilities. This ratio was 85.7% for the fiscal year ended June 30, 2010. The ultimate test of the financial soundness of a retirement system
is its ability to pay all promised benefits when due. I am proud to say that through the continued wisdom and the support of Governor Nathan Deal and the Georgia General Assembly, the System has been and will continue to be funded on an actuarially sound basis, thus providing the membership the comfort and security they expect from their retirement system.
Initiatives The System continuously looks for innovative ways to make the services it provides to its members faster, friendlier, and easier by a continued focus on providing excellent customer service throughout the System.
This year, the System enhanced its online presence by implementing a LiveChat feature on our website. TRS members and visitors, who have non-account specific questions, can chat live with a customer service representative without having to pick up the phone. This new method of communication allows customers to quickly obtain information that they might have otherwise not sought out due to lack of time or opportunity.
New brochures were created to provide detailed information on some of the most requested information: Partial Lump-Sum Option, Purchasing Service Credit, Requesting a Refund, TRS and Social Security, Unused Sick Leave, and Working-After-Retirement.
The annual membership statements, that provide current account information and retirement projections to members, were enhanced with additional information. The statement now identifies the type of service a member has earned or purchased (Military, Out-of-State, etc.). Also, the statement lists outstanding service purchase inquiries for members who have requested a costing to purchase service but did not complete the purchase as a reminder if they should want an updated costing.
We engaged in multiple efforts to upgrade the security and efficiency of our systems. The infrastructure for our disaster recovery systems was upgraded. We

INTRODUCTORY SECTION6
Letter of Transmittaldecreased the number of physical servers in our datacenter, by converting to virtual machines which are connected to physical server hosts resulting in a thirty percent reduction in servers.
The online reporting website used by employers to report employee and employer contributions was enhanced to identify errors prior to submission, allowing contributions to be posted in a more timely and accurate manner. We also implemented a new ACH payment solution that allows employers to securely pay monthly contributions online. This enhancement provides TRS staff with the ability to proactively manage, authorize, and settle transactions in real-time.
Other Information
INDEPENDENT AUDIT — The Board of Trustees requires an annual audit of the financial statements of the System by independent, certified public accountants. The accounting firm of KPMG LLP was selected by the Board. The independent auditors’ report on the statements of plan net assets and the related statements of changes in plan net assets is included in the Financial Section of this report.
ACKNOWLEDGMENTS — The compilation of this report reflects the combined effort of the staff under the leadership of the Board of Trustees. It is intended to provide complete and reliable information as a basis for making management decisions, as a means of determining compliance with legal provisions, and as a means for determining responsible stewardship of the assets contributed by the System’s members, their employers, and the State of Georgia.
Copies of this report can be obtained by contacting the System, or may be downloaded from the System’s website.
I would like to take this opportunity to express my gratitude to Governor Nathan Deal, members of the Georgia General Assembly, the staff, the advisors, and to the many people who have worked so diligently to ensure the successful operation of the System.
Sincerely,
Jeffrey L. EzellExecutive Director
INTRODUCTORY SECTION7
Your Retirement System
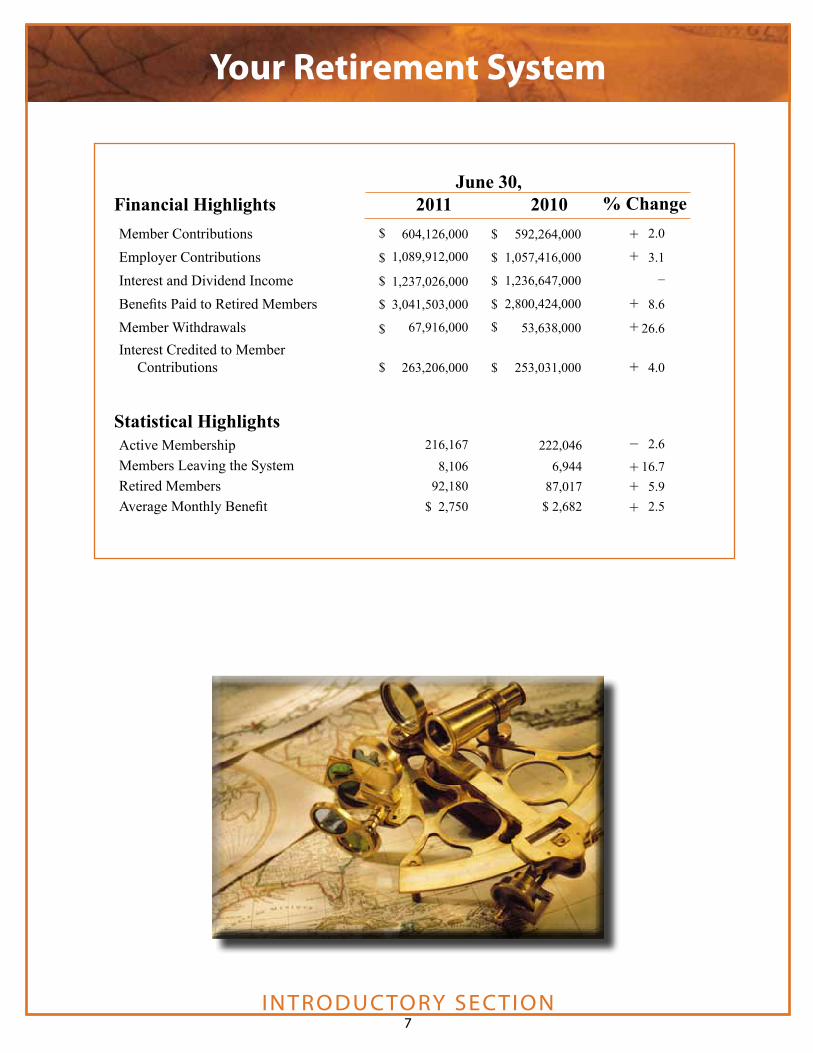
Statistical Highlights222,046 6,944 87,017 $ 2,682
2.6
16.75.92.5
_
+ ++
Financial Highlights June 30,
Member Contributions Employer Contributions Interest and Dividend Income Benefits Paid to Retired Members Member Withdrawals Interest Credited to Member Contributions
Active Membership Members Leaving the System Retired Members Average Monthly Benefit
2010 592,264,000
1,057,416,000
1,236,647,000 2,800,424,000
53,638,000
253,031,000
2.0
3.1–
8.6
26.6
4.0
2011 604,126,000
1,089,912,000
1,237,026,000
3,041,503,000
67,916,000
263,206,000
216,1678,106
92,180$ 2,750
$
$
$
$
$
$
$
$
$
$
$
$
++
++
+
% Change

INTRODUCTORY SECTION8
2006 2007 2008 2009 2010$28,654,45217,243,7981,489,478
$47,387,728
$32,928,37017,115,1703,249,443
$53,292,983
$29,530,82619,801,4421,287,660
$50,619,928
$23,733,15417,944,5481,175,665
$42,853,367
Total System Assets at June 30 (in thousands)
2011$37,567,59814,386,9202,196,449
$54,150,967
Equities Fixed Income Other(1)
Total System Assets
(1) Includes receivables, cash and cash equivalents, short-term securities, and capital assets, net.
$28,237,86716,075,6861,675,244
$45,988,797
15
25
35
45
$55
Equities Fixed Income Other
$42.9
$50.6$53.3
$47.4
Growth of Total System Assets (in billions)
$46.0
06 07 08 09 10 11
System Assets
$54.2

INTRODUCTORY SECTION9
Administrative Staff and Organization
Jeffrey L. EzellExecutive Director
Stephen J. BoyersChief Financial Officer
Dina N. JonesDirector
Member Services
Gregory J. RooksController
Financial Services
Lisa M. HajjDirector
Communications
Diann F. GreenDirector
Retirement Services
Charles W. Cary, Jr.Chief Investment Officer
Investment Services
J. Gregory McQueenDirector
Information Technology
Tonia T. MorrisDirector
Human Resources
Charles P. WarrenDirector
Employer Services andContact Management
Investment Advisors*Albritton Capital ManagementBarrow, Hanley, Mewhinney & StraussCooke & BielerFisher InvestmentsMesirow Financial Investment ManagementMondrian Investment Partners LimitedMunder Capital ManagementPENN Capital Management RidgeWorth Capital ManagementSands Capital Management
* See page 36 in the Investment Section for a summary of fees paid to Investment Advisors.
Consulting ServicesActuaryCavanaugh Macdonald Consulting, LLC
AuditorKPMG LLP
Medical AdvisorsGordon J. Azar, M.D. Atlanta, GeorgiaWilliam Biggers, M.D. Atlanta, GeorgiaPedro Garcia, M.D. Atlanta, GeorgiaHarold Sours, M.D. Atlanta, GeorgiaIra Slade, M.D. Griffin, GeorgiaJoseph W. Stubbs, M.D. Albany, Georgia

INTRODUCTORY SECTION10
Summary of Plan Provisions
PurposeThe Teachers Retirement System of Georgia (the
“System”) was established in 1943, by an act of the Georgia General Assembly for the purpose of providing retirement allowances and other benefits for teachers of this state, and began operations in 1945. The System has the power and privileges of a corporation, and the right to bring and defend actions.
The major objectives of the System are (1) to pay monthly benefits due to retirees accurately and in a timely manner, (2) to soundly invest retirement funds to insure adequate financing for future benefits due and for other obligations of the System, (3) to accurately account for the status and contributions of all active and inactive members, (4) to provide statewide educational and counseling services for System members, and (5) to process refunds due terminated members.
AdministrationState statutes provide that the administration of the
System be vested in a ten-member Board of Trustees comprised as follows:Ex-officio members:
• the State Auditor• the State Treasurer
Governor’s appointees:• two active members of the System who are
classroom teachers and not employees of the Board of Regents
• one active member of the System who is a public school administrator
• one active member of the System who is not an employee of the Board of Regents
• one trustee to be selected by the Governor Board of Regents appointee:
• one active member of the System who is an employee of the Board of Regents
Trustee appointees:• one member who has retired under the System • one individual who is a citizen of the state, not
a member of the System and experienced in the investment of money
A complete listing of the current Board of Trustees is included on page 3 of this report.
Management of the System is the responsibility of the Executive Director who is appointed by the Board and serves at its pleasure. On behalf of the Board, the Executive Director is responsible for the proper operation of the System, engaging such actuarial and other services as shall be necessary to transact business, and paying expenses necessary for operations. A listing of the administrative staff is included on page 9 of this report.
MembershipAll personnel in covered positions of the state’s public
school systems, technical colleges, Regional Educational Service Agency (RESA) units, and all colleges and universities comprising the University System of Georgia who are employed one-half time or more, except eligible faculty members electing to participate in the Board of Regents of the University System of Georgia Optional Retirement Plan, are required to be members of the System as a condition of employment.
EligibilityService Retirement
Active members may retire and elect to receive monthly retirement benefits after one of the following conditions: 1) completion of 10 years of creditable service and attainment of age 60, or 2) completion of 25 years of creditable service.
Disability RetirementMembers are eligible to apply for monthly retirement
benefits under the disability provision of the law if they are an active member, have at least 10 years of creditable service, and are permanently disabled.
INTRODUCTORY SECTION11
Summary of Plan Provisions
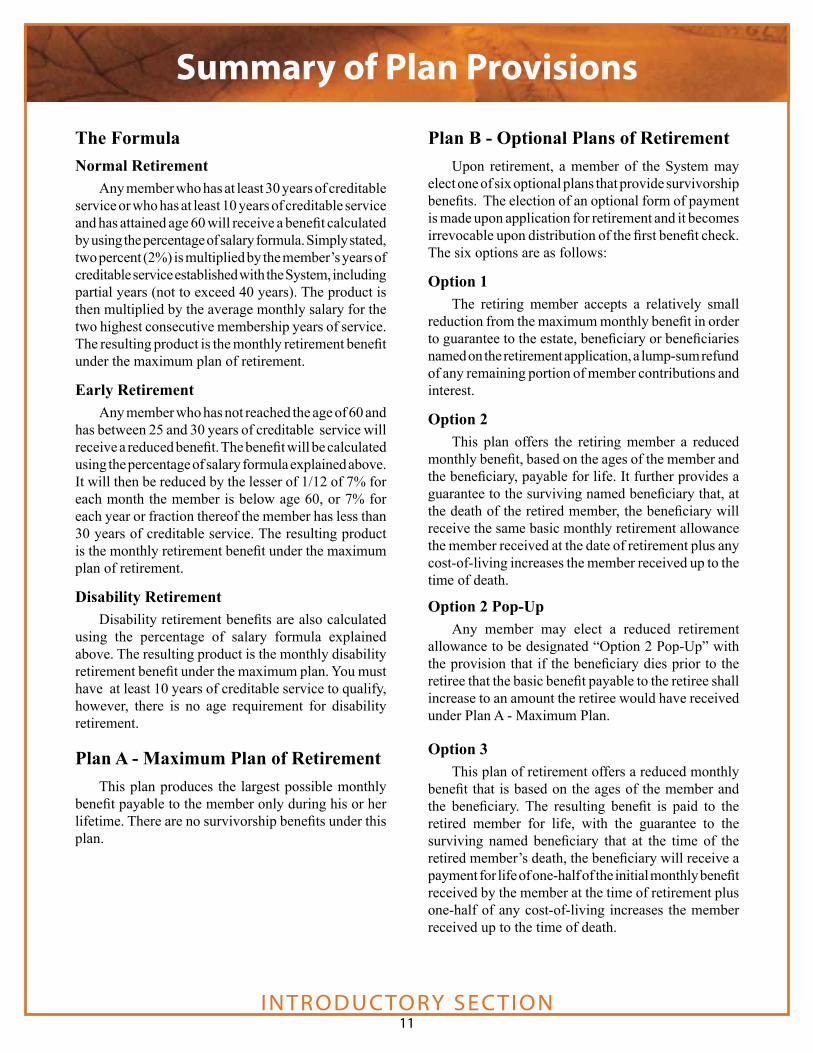
The FormulaNormal Retirement
Any member who has at least 30 years of creditable service or who has at least 10 years of creditable service and has attained age 60 will receive a benefit calculated by using the percentage of salary formula. Simply stated, two percent (2%) is multiplied by the member’s years of creditable service established with the System, including partial years (not to exceed 40 years). The product is then multiplied by the average monthly salary for the two highest consecutive membership years of service. The resulting product is the monthly retirement benefit under the maximum plan of retirement.
Early RetirementAny member who has not reached the age of 60 and
has between 25 and 30 years of creditable service will receive a reduced benefit. The benefit will be calculated using the percentage of salary formula explained above. It will then be reduced by the lesser of 1/12 of 7% for each month the member is below age 60, or 7% for each year or fraction thereof the member has less than 30 years of creditable service. The resulting product is the monthly retirement benefit under the maximum plan of retirement.
Disability RetirementDisability retirement benefits are also calculated
using the percentage of salary formula explained above. The resulting product is the monthly disability retirement benefit under the maximum plan. You must have at least 10 years of creditable service to qualify, however, there is no age requirement for disability retirement.
Plan A - Maximum Plan of RetirementThis plan produces the largest possible monthly
benefit payable to the member only during his or her lifetime. There are no survivorship benefits under this plan.
Plan B - Optional Plans of RetirementUpon retirement, a member of the System may
elect one of six optional plans that provide survivorship benefits. The election of an optional form of payment is made upon application for retirement and it becomes irrevocable upon distribution of the first benefit check. The six options are as follows:
Option 1The retiring member accepts a relatively small
reduction from the maximum monthly benefit in order to guarantee to the estate, beneficiary or beneficiaries named on the retirement application, a lump-sum refund of any remaining portion of member contributions and interest.
Option 2This plan offers the retiring member a reduced
monthly benefit, based on the ages of the member and the beneficiary, payable for life. It further provides a guarantee to the surviving named beneficiary that, at the death of the retired member, the beneficiary will receive the same basic monthly retirement allowance the member received at the date of retirement plus any cost-of-living increases the member received up to the time of death.
Option 2 Pop-UpAny member may elect a reduced retirement
allowance to be designated “Option 2 Pop-Up” with the provision that if the beneficiary dies prior to the retiree that the basic benefit payable to the retiree shall increase to an amount the retiree would have received under Plan A - Maximum Plan.
Option 3This plan of retirement offers a reduced monthly
benefit that is based on the ages of the member and the beneficiary. The resulting benefit is paid to the retired member for life, with the guarantee to the surviving named beneficiary that at the time of the retired member’s death, the beneficiary will receive a payment for life of one-half of the initial monthly benefit received by the member at the time of retirement plus one-half of any cost-of-living increases the member received up to the time of death.

INTRODUCTORY SECTION12
Summary of Plan Provisions
Option 3 Pop-UpAny member may elect a reduced retirement
allowance to be designated “Option 3 Pop-Up” with the provision that if the beneficiary dies prior to the retiree, the basic benefit payable to the retiree shall increase to the amount the retiree would have received under Plan A - Maximum Plan.
Option 4This option offers a reduced monthly lifetime benefit
in exchange for the flexibility to designate a specific dollar amount or percentage of your monthly benefit to be paid to your beneficiary after your death. The beneficiary benefits you specify under this plan cannot cause your monthly benefit to be reduced below 50% of the maximum benefit available to you. If multiple beneficiaries predecease you, the dollar amounts for the percentages are not adjusted. Beneficiaries also receive a prorated share of any cost-of-living increases you received up to the date of death.
Partial Lump-Sum Option Plan TRS offers a Partial Lump-Sum Option Plan (PLOP) at retirement. In exchange for a permanently reduced lifetime benefit, a member may elect to receive a lump-sum distribution in addition to a monthly retirement benefit. The age of the member and plan of retirement are used to determine the reduction in the benefit.
A member is eligible to participate in the Partial Lump-Sum Option Plan if he or she meets the following criteria. A member must:
♦ have 30 years of creditable service or 10 years of creditable service and attain age 60 (not early retirement).
♦ not retire with disability benefits.
At retirement, a member may elect a lump-sum distribution in an amount between 1 and 36 months of his or her normal monthly retirement benefit. This amount will be calculated under Plan A - Maximum Plan of Retirement and will be rounded up and down to be a multiple of $1,000. If a PLOP distribution is elected, the
monthly benefit is actuarially reduced to reflect the value of the PLOP distribution. The combination of both the PLOP distribution and the reduced benefit are the same actuarial value as the unreduced normal benefit alone.
Financing the SystemThe funds to finance the System come from member
contributions, 5.53% of annual salary; employer contributions, 10.28% of annual salary; and investment income.

FINANCIAL SECTION13
Independent Auditors’ Report
KPMG LLPSuite 2000303 Peachtree Street, NEAtlanta, GA 30308www.kpmg.com
The Board of TrusteesTeachers Retirement System of Georgia:
We have audited the accompanying statements of plan net assets of Teachers Retirement System of Georgia (the System), a component unit of the State of Georgia, as of June 30, 2011 and 2010, and the related statements of changes in plan net assets for the years then ended. These financial statements are the responsibility of the System’s management. Our responsibility is to express an opinion on these financial statements based on our audits. We conducted our audits in accordance with auditing standards generally accepted in the United States of America and the standards applicable to financial audits contained in Government Auditing Standards, issued by the Comptroller General of the United States. Those standards require that we plan and perform the audit to obtain reasonable assurance about whether the financial statements are free of material misstatement. An audit includes consideration of internal control over financial reporting as a basis for designing audit procedures that are appropriate in the circumstances, but not for the purpose of expressing an opinion on the effectiveness of the System’s internal control over financial reporting. Accordingly, we express no such opinion. An audit also includes examining, on a test basis, evidence supporting the amounts and disclosures in the financial statements, assessing the accounting principles used and significant estimates made by management, as well as evaluating the overall financial statement presentation. We believe that our audits provide a reasonable basis for our opinion. In our opinion, the financial statements referred to above present fairly, in all material respects, the financial status of the System as of June 30, 2011 and 2010, and the changes in financial status for the years then ended, in conformity with U.S. generally accepted accounting principles.
In accordance with Government Auditing Standards, we have also issued our report dated September 29, 2011 on our consideration of the System’s internal control over financial reporting and on our tests of its compliance with certain provisions of laws, regulations, contracts, and grant agreements and other matters. The purpose of that report is to describe the scope of our testing of internal control over financial reporting and compliance and the results of that testing, and not to provide an opinion on the internal control over financial reporting or on compliance. That report is an integral part of an audit performed in accordance with Government Auditing Standards and should be considered in assessing the results of our audits. The management’s discussion and analysis and the required supplementary schedules listed in the table of contents are not a required part of the basic financial statements but are supplementary information required by U.S. generally accepted accounting principles. We have applied certain limited procedures, which consisted principally of inquiries of management, regarding the methods of measurement and presentation of the required supplementary information. However, we did not audit the information and express no opinion on it. Our audits were conducted for the purpose of forming an opinion on the basic financial statements taken as a whole. The introductory section, schedules of administrative expenses and investment expenses, investment, actuarial, and statistical sections are presented for purposes of additional analysis and are not a required part of the basic financial statements. The schedule of administrative expenses has been subjected to the auditing procedures applied in the audit of the basic financial statements and, in our opinion, is fairly stated, in all material respects in relation to the basic financial statements taken as a whole. The introductory section, schedule of investment expenses, investment, actuarial, and statistical sections have not been subjected to the auditing procedures applied by us in the audit of the basic financial statements and, accordingly, we express no opinion on them.
December 16, 2011

FINANCIAL SECTION14
This section provides a discussion and analysis of the financial performance of the Teachers Retirement System of Georgia (the System) for the years ended June 30, 2011 and 2010. The discussion and analysis of the System’s financial performance is within the context of the accompanying financial statements and disclosures following this section.
Financial Highlights The following highlights are discussed in more detail later in this analysis:• At June 30, 2011, the System’s assets exceeded its
liabilities by $54.1 billion (reported as net assets) as compared to the net assets of $45.9 billion at June 30, 2010, representing an increase of $8.2 billion. At June 30, 2010, the System’s assets exceeded its liabilities by $45.9 billion (reported as net assets) as compared to the net assets of $42.5 billion at June 30, 2009, representing an increase of $3.4 billion.
• Contributions from members increased by $11.9 million or 2.0% from $592.2 million in 2010 to $604.1 million in 2011. Contributions by employers increased by $32.5 million or 3.1% from $1.06 billion in 2010 to $1.09 billion in 2011. Contributions from members increased by $24.6 million or 4.3% from $567.6 million in 2009 to $592.2 million in 2010. Contributions by employers increased by $31.1 million or 3.0% from $1.03 billion in 2009 to $1.06 billion in 2010. The increases in 2011 and 2010 are due to a contribution rate increase, which offset a decrease in the number of active members during both fiscal years.
• Pension benefits paid to retirees and beneficiaries for the years ended June 30, 2011 and 2010 were $3.0 billion and $2.8 billion, representing an increase of 8.6% and an increase of 10.5%, respectively. This is due to increases in the number of retirees and beneficiaries receiving benefit payments and postretirement benefit payments and postretirement benefit adjustments in both years.
Overview of the Financial Statements The basic financial statements include (1) the statements of plan net assets, (2) the statements of changes in plan net assets, and (3) notes to the financial statements. The System also includes in this report additional information to supplement the financial statements. The System prepares its financial statements on an accrual basis in accordance with U.S. generally accepted
accounting principles promulgated by the Governmental Accounting Standards Board (GASB). These statements provide information about the System’s overall financial status. In addition, the System presents two required supplementary schedules, which provide historical trend information about the plan’s funding. The two schedules include (1) a schedule of funding progress and (2) a schedule of employer contributions.
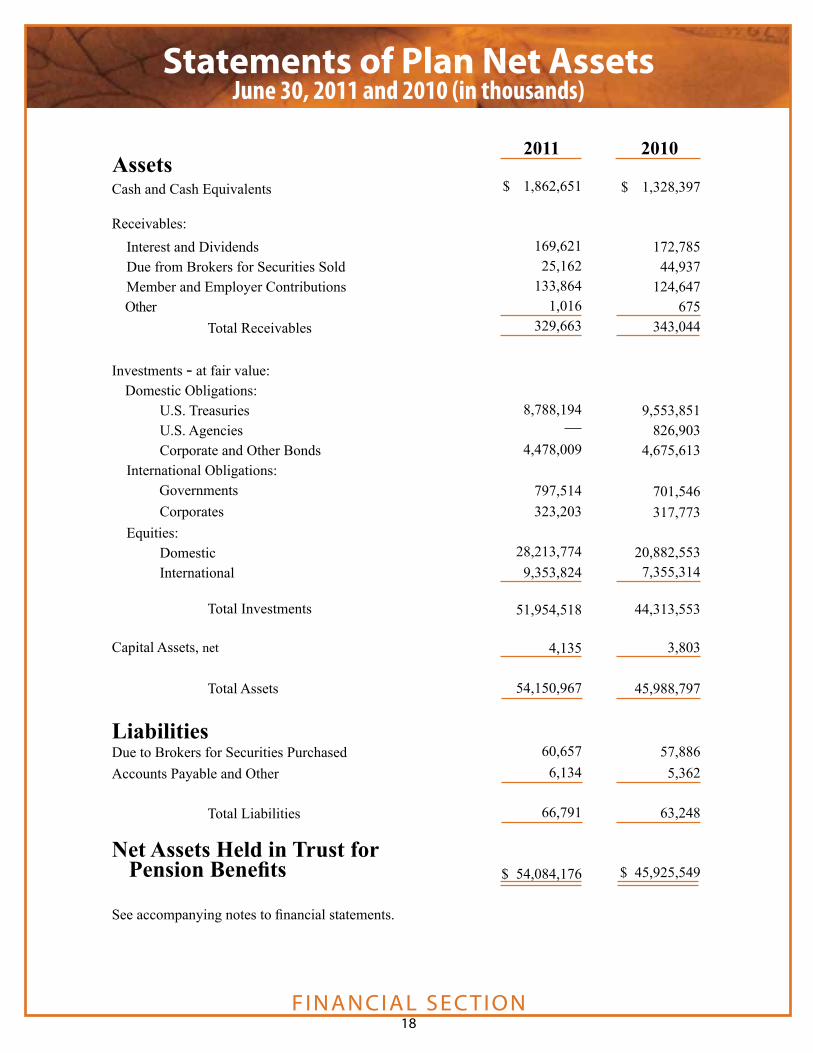
Statements of Plan Net Assets The Statements of Plan Net Assets are the statements of financial position, presenting information that includes all of the System’s assets and liabilities, with the balance reported as and representing the Net Assets Held in Trust for Pension Benefits. The investments of the System in this statement are presented at fair value. These statements are presented on page 18.
Statements of Changes in Plan Net Assets The Statements of Changes in Plan Net Assets report how the System’s net assets changed during the fiscal year. The additions and the deductions to net assets are summarized in this statement. The additions include contributions and investment income, which includes the net increase in the fair value of investments. The deductions include benefit payments, refunds of member contributions, and administrative expenses. These statements are presented on page 19.
Notes to the Financial Statements The accompanying notes to the financial statements provide information essential to a full understanding of the System’s financial statements. The notes to the financial statements begin on page 20 of this report.
Required Supplementary Schedules A brief explanation of the two required schedules found beginning on page 30 of this report follows: Schedule of Funding Progress This schedule includes historical trend information for the last six consecutive fiscal years about the actuarially funded status of the plan from a long-term, ongoing plan perspective, and the progress made in accumulating sufficient assets to pay benefits when due. Schedule of Employer Contributions This schedule presents historical trend information for the last six consecutive fiscal years about the annual required contributions of employers and the contributions made by employers in relation to the requirement.
Management’s Discussion and Analysis(Unaudited)

FINANCIAL SECTION15
54.3 %18.0 %
16.9 %
8.6 %
1.6 %0.6 %
$ 28,213,774 9,353,824
8,788,194
4,478,009
797,514 323,203
$ 51,954,518
2011 2010 2009
Financial Analysis of the SystemA summary of the System’s net assets at June 30, 2011, 2010, and 2009 is as follows (dollars in thousands):
The following table presents the investment allocation at June 30, 2011, 2010, and 2009:
The $8.2 billion increase and $3.4 billion increase in net assets in 2011 and 2010, respectively, are principally related to the increase in the bond and equities markets. The changes in investments are analyzed in the table below.
Amount Percentage Amount Percentage 2011 2010 2009 Change Change Change Change
66,791 63,248 374,784 3,543 5.6 311,536
2010Net Assets June 30
2011
Assets:
83.1
8.1
Liabilities:Due to brokers and accounts payable
Net Assets
Cash and cash equivalents and receivables InvestmentsCapital assets, net
Total Assets
( )
7.3
$ 2,192,314 51,954,518
4,135
54,150,967
1,671,441 44,313,553
3,803
45,988,797
1,171,642 41,677,702
4,023
42,853,367
%%%
%
$ $
%%%
%
%
520,8737,640,965
332
8,162,170
31.2 17.2 8.7
17.7
$
$ $ $
$
$ $
499,799
220
3,135,430
2,635,851 ( )
%
%
42.7 6.35.5
( ) ( )
Equities: Domestic InternationalDomestic Obligations: U.S. Treasuries U.S. Agencies Corporate and Other BondsInternational Obligations: Governments Corporates
Equities: Domestic InternationalDomestic Obligations: U.S. Treasuries U.S. Agencies Corporate and Other BondsInternational Obligations: Governments Corporates
54,084,176 45,925,549 42,478,583 8,158,627 17.8 % 3,446,966
47.1 %16.6 %
21.6 %1.9 %
10.5 %
1.6 %0.7 %
$ 20,882,553 7,355,314
9,553,851826,903
4,675,613
701,546317,773
$ 44,313,553
44.4 %12.6 %
25.2 %2.0 %
15.8 %
$ 18,493,849 5,239,305
10,498,068857,482
6,588,998
$ 41,677,702
Asset Allocation at June 30 (in percentages)
Asset Allocation at June 30 (in thousands)
Management’s Discussion and Analysis(Unaudited)
FINANCIAL SECTION16
Financial Analysis of the System continued
The total investment portfolio at June 30, 2011 increased $7.6 billion from June 30, 2010, which is primarily due to the increase in the bond and equities markets in 2011. The total investment portfolio at June 30, 2010 increased $2.6 billion from June 30, 2009, which is primarily due to the increase in the bond and equities markets in 2010. The investment rate of return in fiscal year 2011 was 21.3%, with a 32.2% return for equities and a 3.2% return for fixed income compared to an investment rate of return in fiscal year 2010 of 11.1%, with a 13.8% return for equities and an 8.7% return
for fixed income. The five-year annualized rate of return on investments at June 30, 2011 was 5.3% with a 3.3% return on equities and a 6.9% return on fixed income. The investment rate of return in fiscal year 2010 was 11.1%, with a 13.8% return for equities and an 8.7% return for fixed income compared to an investment rate of return in fiscal year 2009 of (13.1)%, with a (27.4)% return for equities and a 7.5% return for fixed income. The five-year annualized rate of return on investments at June 30, 2010 was 2.6% with a (0.3)% return on equities and a 5.9% return on fixed income.
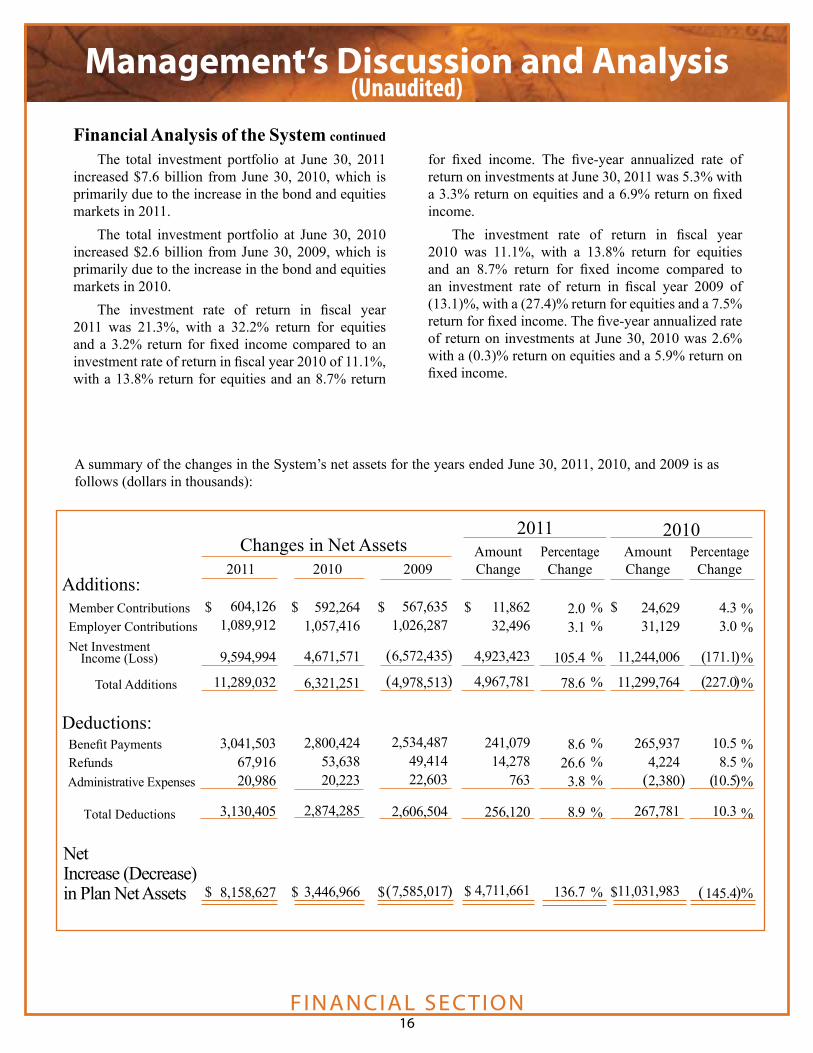
A summary of the changes in the System’s net assets for the years ended June 30, 2011, 2010, and 2009 is as follows (dollars in thousands):
20102011 Member Contributions Employer Contributions Net Investment
Total Additions
Deductions: Benefit Payments Refunds Administrative Expenses
Total Deductions
Net Increase (Decrease) in Plan Net Assets
4.33.0
171.1
227.0
10.58.5
10.5
10.3
145.4
24,629 31,129
11,244,006
11,299,764
265,9374,2242,380
267,781
11,031,983
2.0 3.1
105.4
78.6
8.6 26.6 3.8
8.9
136.7
11,862 32,496
4,923,423
4,967,781
241,079 14,278
763
256,120
4,711,661
567,635 1,026,287
6,572,435
4,978,513
2,534,487 49,414 22,603
2,606,504
7,585,017
592,2641,057,416
4,671,571
6,321,251
2,800,424 53,638 20,223
2,874,285
3,446,966
604,126 1,089,912
9,594,994
11,289,032
3,041,503 67,916 20,986
3,130,405
8,158,627
Changes in Net Assets
Additions:
Income (Loss)
Amount Percentage Amount Percentage 2011 2010 2009 Change Change Change Change
$
$
$
$
$
$
$
$
%%
%
%
%%%
%
%
$
$
( )
( )
( )
( )
%%
%
%
%%%
%
%
( )
( )
( )( )
Management’s Discussion and Analysis(Unaudited)

Member Contributions Employer Contributions Net Investment
Total Additions
Deductions: Benefit Payments Refunds Administrative Expenses
Total Deductions
Net Increase (Decrease) in Plan Net Assets
Amount Percentage Amount Percentage 2011 2010 2009 Change Change Change Change
FINANCIAL SECTION17
Additions The System accumulates resources needed to fund benefits through contributions and returns on invested funds. Member contributions increased 2.0% in 2011 primarily because of an increase in the employee contribution rate to 5.53% from 5.25% in 2010. This rate increase offset a decrease in the number of active members during the fiscal year. Member contributions increased 4.3% in 2010 primarily because of an increase in the employee contribution rate to 5.25% from 5.00% in 2009. This rate increase offset a decrease in the number of active members during the fiscal year. Employer contributions increased 3.1% in 2011 as a result of an increase in the employer contribution rate to 10.28% from 9.74% in 2010. This rate increase offset a decrease in the number of active members during the fiscal year. Employer contributions increased 3.0% in 2010 primarily because of an increase in the employer contribution rate to 9.74% from 9.28% in 2009. This rate increase offset a decrease in the number of active members during the fiscal year. Contribution rates are recommended by the actuary and approved by the System’s Board of Trustees. The net investment income is a result of the increase in the bond and equities markets in 2011 and 2010.
Deductions Deductions increased 8.9% in 2011 and increased 10.3% in 2010, primarily because of the 8.6% and 10.5% increase, respectively, in benefit payments. Regular pension benefit payments increased both years due to an increase in the number of retirees and beneficiaries receiving benefit payments to 92,180 in 2011 from 87,017 in 2010 and 82,382 in 2009; and postretirement benefit increases in both years.
Funding Status The schedule of funding progress and schedule of employer contributions provide information regarding how the plan is performing and funded from an actuarial perspective. The information is based upon actuarial valuations conducted by certified actuaries. The funding ratio, which is presented on the schedule of funding progress, indicates the ratio between the actuarial value of assets and the actuarial accrued liabilities. The higher this ratio, the better funded the System is from an actuarial perspective. The June 30, 2010 actuarial valuation, which is the latest valuation available, indicates that the actuarial value of assets was $54.5 billion and that the actuarial accrued liability was $63.6 billion. This results in a funding ratio of 85.7%. The June 30, 2009 actuarial valuation indicates that the actuarial value of assets was $53.4 billion and
that the actuarial accrued liability was $59.5 billion. This results in a funding ratio of 89.9%. On July 21, 2010, the System adopted a “smoothed valuation interest rate” methodology, which was used for the June 30, 2009 valuation to calculate the annual required contributions for funding purposes. The method determines the interest rate needed over a defined 23-year look-forward period, so that the ultimate investment rate of return (discount rate) is earned over a defined time horizon, based on the actual rates of return for a defined look-back period. It incorporates a long-term time horizon of 30 years and a 7-year look-back period, which equals the System’s asset smoothing period. The ultimate investment rate of return is the long-term rate of return that the System expects to earn based on its long-term capital market assumptions and asset allocations. The System adopted this method as it allows for better alignment of employee and employer contribution rates with the current economy. With this method, the System increases contribution rates during periods of rising revenues and investment returns, while maintaining current contribution rates during periods of declining revenues and investment returns. With the smoothed valuation interest rate method, the required contributions are counter-cyclical, allowing employees and employers to contribute at lower rates during bad economic times and at higher rates when funding is more readily available. On July 27, 2011, the System adopted a refinement of its “smoothed valuation interest rate” methodology to include a corridor around the long-term investment rate of return, effectively reducing the potential volatility of the actuarial valuation results reflected in the financial statements. This approach is used for financial reporting purposes in addition to funding purposes and has been applied to the June 30, 2010 actuarial valuation and retroactively to the June 30, 2009 valuation. Management believes the System continues to be in a solid financial position, as evidenced by the funding ratio and the fact that the employer has always contributed 100% of the annual required contributions.
Requests for Information This financial report is designed to provide a general overview of the System’s finances for all those with interest in the System’s finances. Questions concerning any of the information provided in this report or requests for additional information should be addressed to Teachers Retirement System of Georgia, Two Northside 75, Suite 100, Atlanta, GA 30318.
Management’s Discussion and Analysis(Unaudited)
FINANCIAL SECTION18
Statements of Plan Net AssetsJune 30, 2011 and 2010 (in thousands)
Cash and Cash Equivalents
Receivables:
Interest and Dividends Due from Brokers for Securities Sold Member and Employer Contributions Other Total Receivables
Investments - at fair value: Domestic Obligations: U.S. Treasuries U.S. Agencies Corporate and Other Bonds International Obligations: Governments Corporates Equities: Domestic International Total Investments
Capital Assets, net
Total Assets
LiabilitiesDue to Brokers for Securities PurchasedAccounts Payable and Other
Total Liabilities
Net Assets Held in Trust for Pension Benefits
See accompanying notes to financial statements.
$ 1,862,651
169,621 25,162
133,864 1,016
329,663
8,788,194
4,478,009
797,514 323,203
28,213,774 9,353,824
51,954,518
4,135
54,150,967
60,6576,134
66,791
$ 54,084,176
2011 2010Assets
$ 1,328,397
172,785 44,937
124,647 675
343,044
9,553,851 826,9034,675,613
701,546317,773
20,882,5537,355,314
44,313,553
3,803
45,988,797
57,8865,362
63,248
$ 45,925,549

FINANCIAL SECTION19
Statements of Changes in Plan Net AssetsYears ended June 30, 2011 and 2010 (in thousands)
2011 2010
Net Assets Held in Trust for Pension Benefits - Beginning of year $ 45,925,549 $ 42,478,583
Additions: Contributions: Employer 1,089,912 1,057,416 Member 604,126 592,264
Investment Income: Net Increase in Fair Value of Investments 8,383,204 3,457,353 Interest, Dividends, and Other 1,237,026 1,236,647
Total 9,620,230 4,694,000
Less Investment Expense 25,236 22,429
Net Investment Income 9,594,994 4,671,571 Total Additions 11,289,032 6,321,251
Deductions: Benefit Payments 3,041,503 2,800,424 Refunds of Member Contributions 67,916 53,638
Administrative Expenses, net 20,986 20,223
Total Deductions 3,130,405 2,874,285
Net Increase 8,158,627 3,446,966
Net Assets Held in Trust for Pension Benefits - End of year $ 54,084,176 $ 45,925,549
See accompanying notes to financial statements.

20 FINANCIAL SECTION20
Notes to Financial StatementsJune 30, 2011 and 2010
A. Plan Description Teachers Retirement System of Georgia (the System) was created in 1943 by an act of the Georgia Legislature (the Act) to provide retirement benefits for teachers who qualify under the Act. The System is administered as a cost-sharing, multiple-employer plan as defined in Governmental Accounting Standards Board (GASB) Statement No. 25, Financial Reporting for Defined Benefit Pension Plans and Note Disclosures for Defined Contribution Plans. On October 25, 1996, the Board of Trustees created the Supplemental Retirement Benefit Plan of the Georgia Teachers (SRBP). SRBP was established as a qualified governmental excess benefit plan in accordance with Section 415 of the Internal Revenue Code (IRC §415) as a portion of the System. The purpose of SRBP is to provide retirement benefits to employees covered by the System whose benefits are otherwise limited by IRC §415. Although the System is a component unit of the state of Georgia’s financial reporting entity, it is accountable for its own fiscal matters and presentation of its separate financial statements. A Board of Trustees comprised of two appointees by the Board, two ex-officio state employees, five appointees by the Governor, and one appointee of the Board of Regents is ultimately responsible for the administration of the System. In evaluating how to define the System for financial reporting purposes, the management of the System has considered all potential component units. The decision to include a potential component unit in the reporting entity is made by applying the criteria set forth by GASB Statement No. 14, The Financial Reporting Entity. The concept underlying the definition of the reporting entity is that elected officials are accountable. The decision to include a potential component unit in the reporting entity is also made by applying specific criteria as outlined in GASB Statement No. 39, Determining Whether Certain Organizations are Component Units, including consideration of the nature and significance of the relationship of potential component units. Based on those criteria, the System has not included any other entities in its reporting entity.
Retirement Benefits
The System provides service retirement, disability retirement, and survivor’s benefits. Title 47 of the Official Code of Georgia assigns the authority to establish and amend the provisions of the System to the State Legislature. A member is eligible for normal service retirement after 30 years of creditable service, regardless of age, or after 10 years of service and attainment of age 60. A member is eligible for early retirement after 25 years of creditable service.
As of June 30, 2010, participation in the System is as follows:
Retirees and beneficiariescurrently receiving benefits 87,017
Terminated employees not yetreceiving benefits, vested 7,159
Terminated employees, non-vested 75,004
Active plan members 222,046 Total 391,226
Employers 386
Eligibility and Membership
All teachers in the state public schools, the University System of Georgia (except those professors and principal administrators electing to participate in an optional retirement plan), and certain other designated employees in educational-related work are eligible for membership.
As of June 30, 2011, participation in the System is as follows:
Retirees and beneficiariescurrently receiving benefits 92,180
Terminated employees not yetreceiving benefits, vested 7,677
Terminated employees, non-vested 78,724
Active plan members 216,167 Total 394,748
Employers 399

FINANCIAL SECTION21
Notes to Financial StatementsJune 30, 2011 and 2010
A. Plan Description continued
Retirement Benefits Normal retirement (pension) benefits paid to members are equal to 2% of the average of the member’s two highest paid consecutive years of service, multiplied by the number of years of creditable service up to 40 years. Early retirement benefits are reduced by the lesser of one-twelfth of 7% for each month the member is below age 60, or by 7% for each year or fraction thereof by which the member has less than 30 years of service. It is also assumed that certain cost-of-living adjustments, based on the Consumer Price Index, may be made in future years. Retirement benefits are payable monthly for life. A member may elect to receive a partial lump-sum distribution in addition to a reduced monthly retirement benefit. Options are available for distribution of the member’s monthly pension, at a reduced rate, to a designated beneficiary on the member’s death.
Death and Disability Benefits Retirement benefits also include death and disability benefits, whereby the disabled member or surviving spouse is entitled to receive annually an amount equal to the member’s service retirement benefit or disability retirement, whichever is greater. The benefit is based on the member’s creditable service (minimum of ten years of service) and compensation up to the time of disability.
The death benefit is the amount that would be payable to the member’s beneficiary had the member retired on the date of death on either a service retirement allowance or a disability retirement allowance, whichever is larger. The benefit is based on the member’s creditable service (minimum of ten years of service) and compensation up to the date of death.
Contributions The System is funded by member and employer contributions as adopted and amended by the Board of Trustees.
Contributions required for fiscal year 2011 were based on the June 30, 2008 actuarial valuation as follows:
Contributions required for fiscal year 2010 were based on the June 30, 2007 actuarial valuation as follows:
Members become fully vested after ten years of service. If a member terminates with less than ten years of service, no vesting of employer contributions occurs, but the member’s contributions may be refunded with interest. Member contributions with accumulated interest are reported as net assets held in trust for pension benefits.
SRBP Beginning July 1, 1997, all members and retired former members in the System are eligible to participate in this plan whenever their benefits under the System exceed the limitation on benefits imposed by IRC §415. As of June 30, 2011 and 2010, there were 27 and 24 members, respectively, eligible to participate in this portion of the System. Employer contributions of $492,000 and $375,000 and retirement payments of $495,000 and $367,000 under the SRBP are included in the statements of changes in plan net assets for the years ended June 30, 2011 and 2010, respectively.
Member 5.25 % Employer: Normal 7.96 % Unfunded accrued liability 1.78 % Total 9.74 %
Member 5.53 % Employer: Normal 7.70 % Unfunded accrued liability 2.58 % Total 10.28 %

FINANCIAL SECTION22
Notes to Financial StatementsJune 30, 2011 and 2010
B. Summary of Significant Accounting Policies and Plan Asset Matters
Basis of Accounting
The System’s financial statements are prepared on the accrual basis of accounting. Contributions from the employers and the members are recognized as additions when due, pursuant to formal commitments, as well as statutory or contractual requirements. Retirement and refund payments are recognized as deductions when due and payable. During fiscal year 2011, the System adopted the provisions of GASB Statement No. 59, Financial Instruments Omnibus. The objective of this Statement is to update and improve existing standards regarding financial reporting and disclosure requirements of certain financial instruments and external investment pools. There are no applicable reporting or disclosure requirements for the System in fiscal year 2011.
Reclassification Certain amounts for fiscal year 2010 have been reclassified to conform to the current period presentation.
Cash and Cash Equivalents Cash and cash equivalents, reported at cost, include cash in banks, cash on deposit with the investment custodian earning a credit to offset fees, and short-term highly liquid financial securities with original maturities of three months or less from the date of acquisition.
Investments Investments are reported at fair value. Securities traded on a national or international exchange are valued at the last reported sales price. There are no investments in, loans to, or leases with parties related to the System.
The System utilizes various investment instruments. Investment securities, in general, are exposed to various risks, such as interest rate, credit, and overall market volatility. Due to the level of risk associated with certain investment securities, it is reasonably possible that changes in the values of investment securities will occur in the near term and that such changes could materially affect the amounts reported in the financial statements.
Capital Assets Capital assets are stated at cost less accumulated depreciation. Capital assets costing $5,000 or more are
capitalized. Depreciation on capital assets is computed using the straight-line method over estimated useful lives of three to forty years. Depreciation expense is included in administrative expenses, net. Maintenance and repairs are charged to administrative expenses when incurred. When assets are retired or otherwise disposed of, the costs and related accumulated depreciation are removed from the accounts, and any resulting gain or loss is reflected in the statements of changes in plan net assets in the period of disposal.
Use of Estimates The preparation of financial statements in conformity with U.S. generally accepted accounting principles requires management to make estimates and assumptions that affect the reported amounts of plan net assets and changes therein. Actual results could differ from those estimates.
C. Investment Program The System maintains sufficient cash to meet its immediate liquidity needs. Cash not immediately needed is invested as directed by the Board of Trustees. All investments are held by agent custodial banks in the name of the System. State statutes and the System’s investment policy authorize the System to invest in a variety of short-term and long-term securities as follows:
Cash and Cash Equivalents The carrying amount of cash on deposit with the investment custodian totaled $300,000,881 at June 30, 2011, with an actual bank balance of $300,532,678. The System’s cash balances are fully insured through the Federal Deposit Insurance Corporation, an independent agency of the U.S. Government.
Short-term highly liquid financial securities are authorized in the following instruments:
• Repurchase and reverse repurchase agreements, whereby the System and a broker exchange cash for direct obligations of the U.S. Government or obligations unconditionally guaranteed by agencies of the U.S. Government or U.S. corporations. The System or broker promises to repay the cash received plus interest at a specific date in the future in exchange for the same securities. The System held repurchase agreements of $1,561,593,000 and $1,320,025,000 at June 30, 2011 and 2010, respectively.
21

FINANCIAL SECTION23
Notes to Financial StatementsJune 30, 2011 and 2010
bonds. At June 30, 2011, the System did not hold private placements.
Mortgage investments are authorized to the extent that they are secured by first mortgages on improved real property located in the state of Georgia.
Equity securities are also authorized (in statutes) for investment as a complement to the System’s fixed income portfolio and as a long-term inflation hedge. By statute, no more than 70% of the total invested assets on a historical cost basis may be placed in equities. Equity holdings in any one corporation may not exceed 5% of the outstanding equity of the issuing corporation. The equity portfolio is managed by the Division of Investment Services (the Division) in conjunction with independent advisors. Buy/sell decisions are based on securities meeting rating criteria established by the Board of Trustees; in-house research considering such matters as yield, growth, and sales statistics; and analysis of independent market research. Equity trades are approved and executed by the Division’s staff. Common stocks eligible for investment are approved by the Investment Committee of the Board of Trustees before being placed on an approved list. Equity investments are authorized in the following instruments:
• Domestic equities are those securities considered by The Official Code of Georgia Annotated (O.C.G.A.) to be domiciled in the United States. At June 30, 2011, the System held domestic equities of $28,213,774,474. At June 30, 2010, the System held domestic equities of $20,882,553,125.
• International equities, including American Depository Receipts (ADR), will be a diversified portfolio including both developed and emerging countries. These securities are not considered by the O.C.G.A. to be domiciled in the United States. At June 30, 2011, the System held ADRs of $9,342,148,371 and international equities of $11,675,832. At June 30, 2010, the System held ADRs of $7,355,313,925 and no international equities.
Credit Risk: Credit risk is the risk that an issuer or other counterparty to an investment will not fulfill its obligations to the System. State law limits investments to investment grade securities. It is the System’s investment policy to require that the bond portfolio be of high quality and chosen with respect to maturity
C. Investment Program continued
Other short-term securities authorized, but not currently used, are:
• U.S. Treasury obligations.
• Commercial paper, with a maturity of 180 days or less. Commercial paper is an unsecured promissory note issued primarily by corporations for a specific amount and maturing on a specific day. The System considers for investment only commercial paper of the highest quality, rated P-1 and/or A-1 by national credit rating agencies.
• Master notes, an overnight security administered by a custodian bank, and an obligation of a corporation whose commercial paper is rated P-1 and/or A-1 by national credit rating agencies.
Investments in commercial paper or master notes are limited to no more than $500 million in any one name.
Investments Fixed income investments are authorized in the following instruments:
• U.S. and foreign government obligations. At June 30, 2011, the System held U.S. Treasury bonds of $8,788,193,830 and international government bonds of $797,514,210. At June 30, 2010, the System held U.S. Treasury bonds of $9,553,850,620 and international government bonds of $701,546,360.
• Obligations unconditionally guaranteed by agencies of the U.S. Government. At June 30, 2011, the System did not hold agency bonds. At June 30, 2010, the System held agency bonds of $826,902,990.
• Corporate bonds with at least an “A” rating by a national rating agency. At June 30, 2011, the System held U.S. corporate bonds of $4,478,008,640 and international corporate bonds of $323,202,600. At June 30, 2010, the System held U.S. corporate bonds of $4,675,612,500 and international corporate bonds of $317,773,250.
• Private placements are authorized under the same general restrictions applicable to corporate
FINANCIAL SECTION24
Notes to Financial Statements
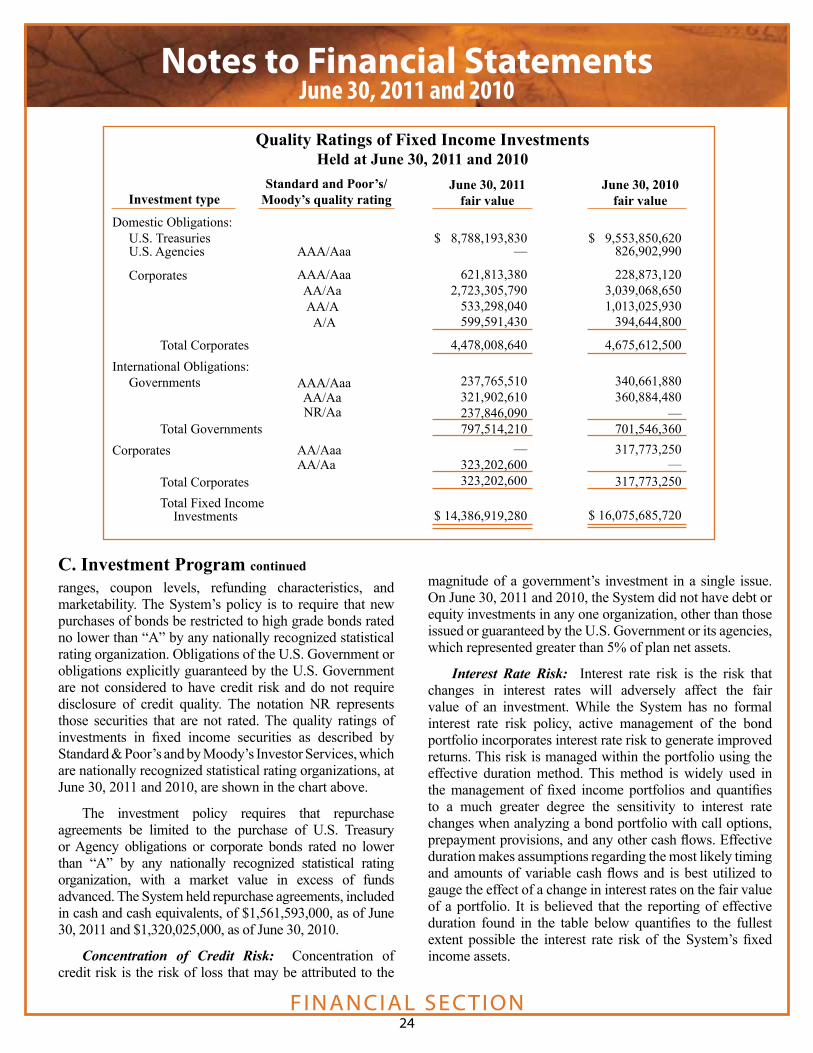
Quality Ratings of Fixed Income InvestmentsHeld at June 30, 2011 and 2010
Investment typeStandard and Poor’s/
Moody’s quality ratingJune 30, 2011
fair valueJune 30, 2010
fair valueDomestic Obligations: U.S. Treasuries U.S. Agencies
Corporates
Total Corporates International Obligations: Governments
Total GovernmentsCorporates Total Corporates Total Fixed Income Investments
AAA/Aaa
AAA/Aaa AA/Aa AA/A A/A
AAA/Aaa AA/Aa NR/Aa
AA/AaaAA/Aa
June 30, 2011 and 2010
$ 8,788,193,830 —
621,813,3802,723,305,790
533,298,040 599,591,430
4,478,008,640
237,765,510321,902,610 237,846,090797,514,210
—323,202,600323,202,600
$ 14,386,919,280
$ 9,553,850,620 826,902,990
228,873,1203,039,068,6501,013,025,930
394,644,800
4,675,612,500
340,661,880360,884,480
—701,546,360317,773,250
—317,773,250
$ 16,075,685,720
C. Investment Program continuedranges, coupon levels, refunding characteristics, and marketability. The System’s policy is to require that new purchases of bonds be restricted to high grade bonds rated no lower than “A” by any nationally recognized statistical rating organization. Obligations of the U.S. Government or obligations explicitly guaranteed by the U.S. Government are not considered to have credit risk and do not require disclosure of credit quality. The notation NR represents those securities that are not rated. The quality ratings of investments in fixed income securities as described by Standard & Poor’s and by Moody’s Investor Services, which are nationally recognized statistical rating organizations, at June 30, 2011 and 2010, are shown in the chart above.
The investment policy requires that repurchase agreements be limited to the purchase of U.S. Treasury or Agency obligations or corporate bonds rated no lower than “A” by any nationally recognized statistical rating organization, with a market value in excess of funds advanced. The System held repurchase agreements, included in cash and cash equivalents, of $1,561,593,000, as of June 30, 2011 and $1,320,025,000, as of June 30, 2010.
Concentration of Credit Risk: Concentration of credit risk is the risk of loss that may be attributed to the
magnitude of a government’s investment in a single issue. On June 30, 2011 and 2010, the System did not have debt or equity investments in any one organization, other than those issued or guaranteed by the U.S. Government or its agencies, which represented greater than 5% of plan net assets.
Interest Rate Risk: Interest rate risk is the risk that changes in interest rates will adversely affect the fair value of an investment. While the System has no formal interest rate risk policy, active management of the bond portfolio incorporates interest rate risk to generate improved returns. This risk is managed within the portfolio using the effective duration method. This method is widely used in the management of fixed income portfolios and quantifies to a much greater degree the sensitivity to interest rate changes when analyzing a bond portfolio with call options, prepayment provisions, and any other cash flows. Effective duration makes assumptions regarding the most likely timing and amounts of variable cash flows and is best utilized to gauge the effect of a change in interest rates on the fair value of a portfolio. It is believed that the reporting of effective duration found in the table below quantifies to the fullest extent possible the interest rate risk of the System’s fixed income assets.

FINANCIAL SECTION25
Notes to Financial Statements
D. Investments Lending Program State statutes and Board of Trustees’ policies permit the System to lend its securities to broker/dealers with a simultaneous agreement to return the collateral for the same securities in the future. The System is presently involved in a securities lending program with major brokerage firms. The System lends equity and fixed income securities for varying terms and receives a fee based on the loaned securities’ value. During a loan, the System continues to receive dividends and interest as the owner of the loaned securities. The brokerage firms pledge collateral securities consisting of U.S. Government and agency securities, mortgage backed securities issued by a U.S. Government agency, and corporate bonds. The collateral value must be equal to at least 102% to 115% of the loaned securities’ value, depending on the type of collateral security.
Securities loaned totaled $10,449,559,639 and $12,404,923,467 at June 30, 2011 and 2010, respectively. The collateral value was equal to 105.5% and 105.7% of the loaned securities’ value at June 30, 2011 and 2010, respectively. The System’s lending collateral was held in the System’s name by the tri-party custodian.
Loaned securities are included in the accompanying statements of plan net assets since the System maintains ownership. The related collateral securities are not recorded as assets on the System’s statements of plan net assets, and a corresponding liability is not recorded, since the System is deemed not to have the ability to pledge or trade the collateral securities. In accordance with the criteria set forth in GASB Statement No. 28,
Percent of all fixed income assets EffectiveFixed income and repurchase Market value, and repurchase duration agreements security type June 30, 2011 agreements (years)
Domestic Obligations: U.S. Treasuries $ 8,788,193,830 55.1 5.2 Corporates 4,478,008,640 28.1 5.1 International Obligations: Governments 797,514,210 5.0 4.0 Corporates 323,202,600 2.0 2.0Repurchase Agreements 1,561,593,000 9.8
__
Total $ 15,948,512,280 100.0
Effective Duration of Fixed Income Assets and Repurchase Agreements by Security Type
Percent of all fixed income assets EffectiveFixed income and repurchase Market value, and repurchase duration agreements security type June 30, 2010 agreements (years)
Domestic Obligations: U.S. Treasuries $ 9,553,850,620 54.9 6.0 U.S. Agencies 826,902,990 4.8 2.1 Corporates 4,675,612,500 26.9 4.3 International Obligations: Governments 701,546,360 4.0 4.3 Corporates 317,773,250 1.8 3.0Repurchase Agreements 1,320,025,000 7.6
__
Total $ 17,395,710,720 100.0
%%%
%%%%
*Total effective duration (years) does not include repurchase agreements.
%
%
%%
%
June 30, 2011 and 2010
4.6*
%
4.8*

26 FINANCIAL SECTION26
Notes to Financial StatementsJune 30, 2011 and 2010
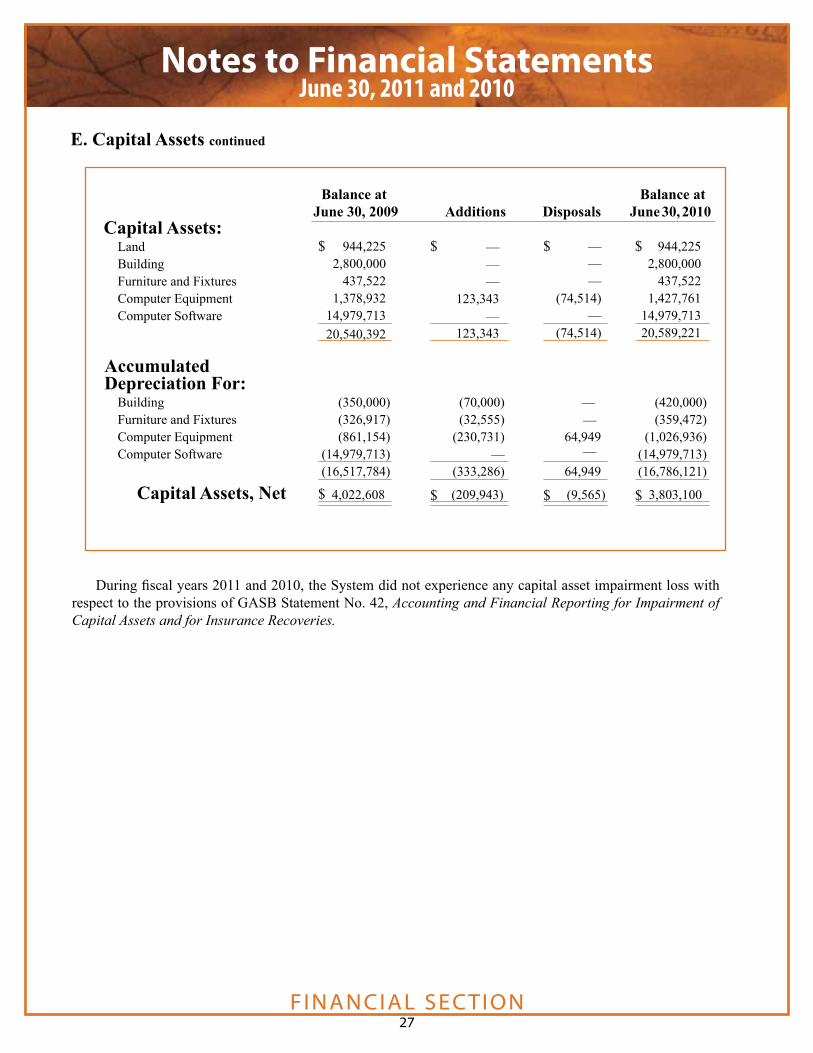
E. Capital AssetsThe following is a summary of capital assets and depreciation information as of June 30 and for the years
then ended:
Balance at Balance at June 30, 2010 Additions Disposals June 30, 2011
Capital Assets:
Land 944,225 — — 944,225 Building 2,800,000 — — 2,800,000Furniture and Fixtures 437,522 16,993 __ 454,515
Computer Equipment 1,427,761 722,184 89,995 2,059,950 Computer Software 14,979,713 — __ 14,979,713 20,589,221 739,177 89,995 21,238,403
AccumulatedDepreciation For:
Building (420,000) (70,000) — (490,000)Furniture and Fixtures (359,472) (31,963) __ (391,435)Computer Equipment (1,026,936) (290,636) 75,390 (1,242,182)Computer Software (14,979,713) — (14,979,713) (16,786,121) (392,599) 75,390 (17,103,330)
Capital Assets, Net 3,803,100 (14,605) 4,135,073
$
$ $
$$
$
$
$
( )
( )
D. Investments Lending Program continued
Accounting and Financial Reporting for Securities Lending Transactions, the System is deemed not to have the ability to pledge or sell collateral securities, since the System’s lending contracts do not address whether the lender can pledge or sell the collateral securities without a borrower default, the System has not previously demonstrated that ability, and there are no indications of the System’s ability to pledge or sell the collateral securities.
346,578
FINANCIAL SECTION27
Notes to Financial StatementsJune 30, 2011 and 2010
During fiscal years 2011 and 2010, the System did not experience any capital asset impairment loss with respect to the provisions of GASB Statement No. 42, Accounting and Financial Reporting for Impairment of Capital Assets and for Insurance Recoveries.
E. Capital Assets continued
Balance at Balance at June 30, 2009 Additions Disposals June 30, 2010
Capital Assets: Land Building Furniture and Fixtures
Computer Equipment Computer Software
AccumulatedDepreciation For:
Building (350,000) (70,000) — (420,000)Furniture and Fixtures (326,917) (32,555) __ (359,472)Computer Equipment (861,154) (230,731) 64,949 (1,026,936)Computer Software (14,979,713) — — (14,979,713) (16,517,784) (333,286) 64,949 (16,786,121)
Capital Assets, Net 4,022,608 (209,943) (9,565) 3,803,100
$
$
$
$
944,225 2,800,000
437,522 1,378,932
14,979,713 20,540,392
— — —
123,343—
123,343
— — —
(74,514) —
(74,514)
944,225 2,800,000
437,522 1,427,761
14,979,713 20,589,221
$
$
$
$
28 FINANCIAL SECTION28
Notes to Financial StatementsJune 30, 2011 and 2010
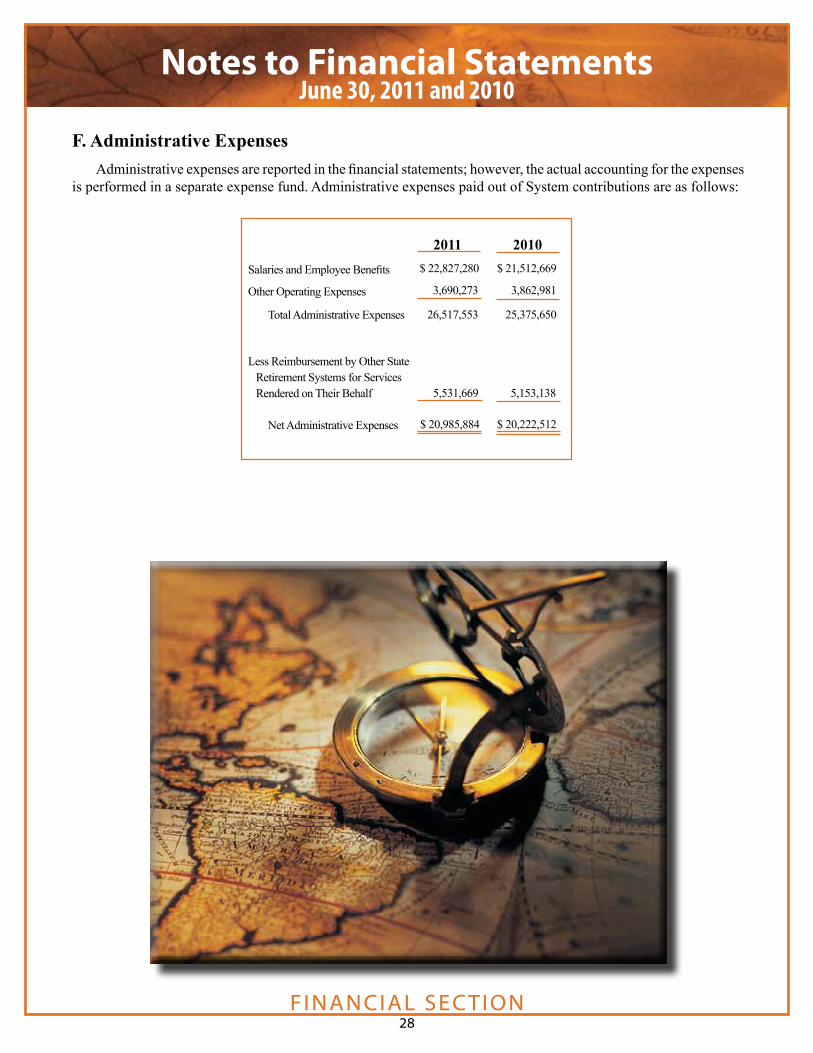
F. Administrative Expenses Administrative expenses are reported in the financial statements; however, the actual accounting for the expenses is performed in a separate expense fund. Administrative expenses paid out of System contributions are as follows:
2011 2010Salaries and Employee Benefits
Other Operating Expenses
Total Administrative Expenses
Less Reimbursement by Other State Retirement Systems for Services Rendered on Their Behalf Net Administrative Expenses
$ 22,827,280 $ 21,512,669
3,690,273 3,862,981
26,517,553 25,375,650
5,531,669 5,153,138
$ 20,985,884 $ 20,222,512
FINANCIAL SECTION29
Notes to Financial StatementsJune 30, 2011 and 2010
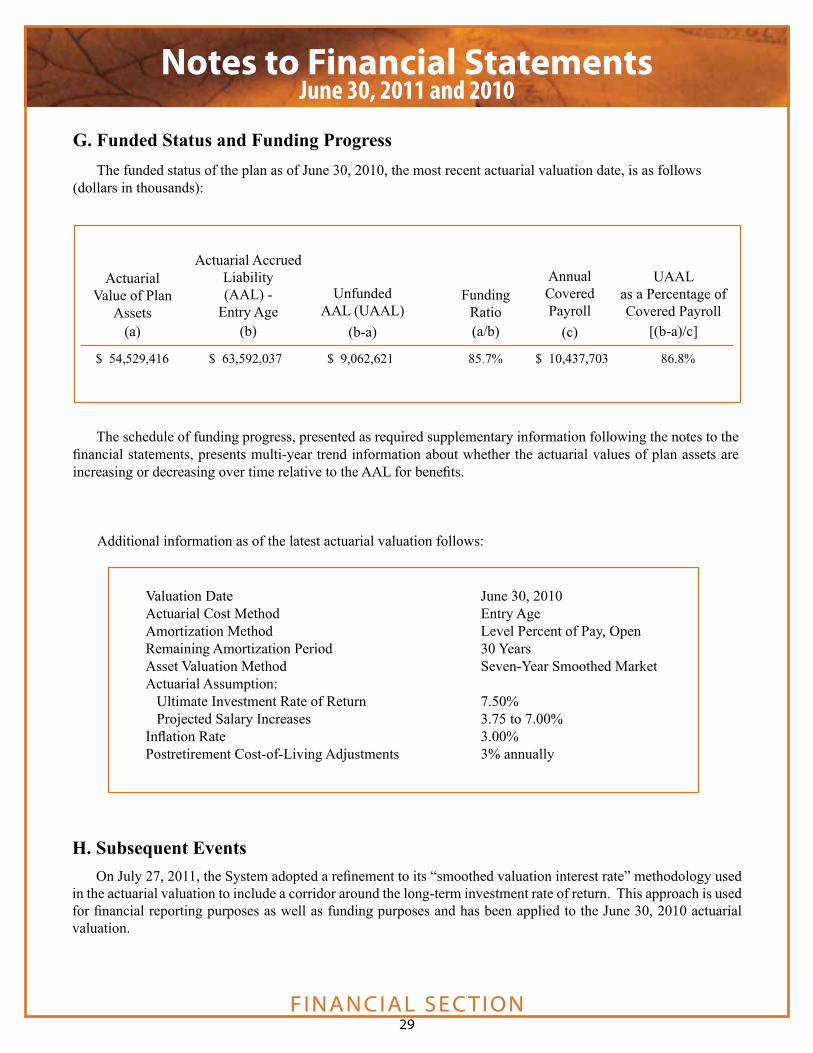
G. Funded Status and Funding Progress The funded status of the plan as of June 30, 2010, the most recent actuarial valuation date, is as follows (dollars in thousands):
The schedule of funding progress, presented as required supplementary information following the notes to the financial statements, presents multi-year trend information about whether the actuarial values of plan assets are increasing or decreasing over time relative to the AAL for benefits.
Valuation Date June 30, 2010 Actuarial Cost Method Entry Age Amortization Method Level Percent of Pay, OpenRemaining Amortization Period 30 Years Asset Valuation Method Seven-Year Smoothed MarketActuarial Assumption: Ultimate Investment Rate of Return 7.50% Projected Salary Increases 3.75 to 7.00% Inflation Rate 3.00% Postretirement Cost-of-Living Adjustments 3% annually
Additional information as of the latest actuarial valuation follows:
H. Subsequent Events On July 27, 2011, the System adopted a refinement to its “smoothed valuation interest rate” methodology used in the actuarial valuation to include a corridor around the long-term investment rate of return. This approach is used for financial reporting purposes as well as funding purposes and has been applied to the June 30, 2010 actuarial valuation.
ActuarialValue of Plan
Assets(a)
Actuarial AccruedLiability(AAL) -
Entry Age(b)
Unfunded AAL (UAAL)
(b-a)
Funding Ratio(a/b)
UAALas a Percentage of Covered Payroll
[(b-a)/c]
$ 54,529,416 $ 63,592,037 $ 9,062,621 85.7% $ 10,437,703 86.8%
AnnualCoveredPayroll
(c)
FINANCIAL SECTION30
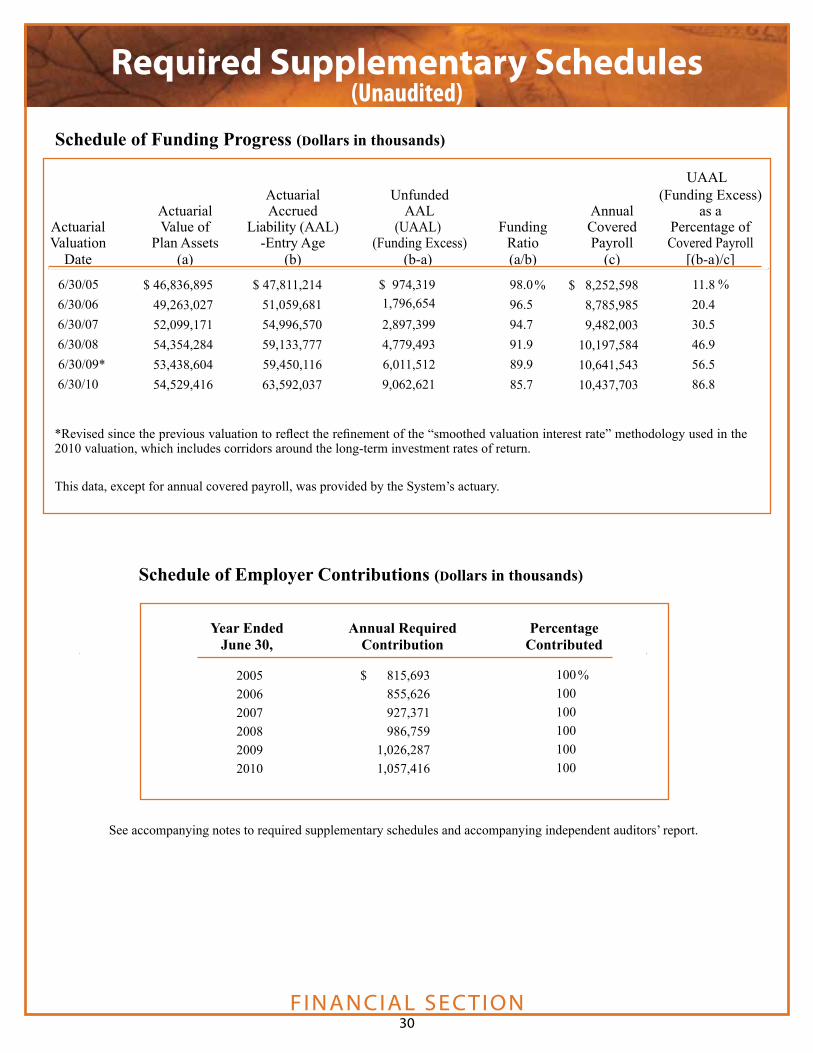
Required Supplementary Schedules
Schedule of Funding Progress (Dollars in thousands)
%
Actuarial Unfunded (Funding Excess) Actuarial Accrued AAL Annual as a Actuarial Value of Liability (AAL) (UAAL) Funding Covered Percentage of Valuation Plan Assets -Entry Age (Funding Excess) Ratio Payroll Covered Payroll Date (a) (b) (b-a) (a/b) (c) [(b-a)/c]
6/30/05 6/30/06 6/30/07 6/30/08 6/30/09* 6/30/10
UAAL
$ 46,836,895 49,263,027 52,099,171 54,354,284 53,438,604 54,529,416
$ 47,811,214 51,059,681 54,996,570 59,133,777 59,450,11663,592,037
98.0 96.594.791.989.985.7
$ 8,252,5988,785,9859,482,003
10,197,58410,641,543 10,437,703
11.820.430.546.956.586.8
%$ 974,319 1,796,654 2,897,399 4,779,493 6,011,512 9,062,621
%
Year Ended Annual Required Percentage June 30, Contribution Contributed
See accompanying notes to required supplementary schedules and accompanying independent auditors’ report.
Schedule of Employer Contributions (Dollars in thousands)
200520062007200820092010
$ 815,693 855,626 927,371 986,759
1,026,287 1,057,416
100 100
100 100 100 100
%
(Unaudited)
*Revised since the previous valuation to reflect the refinement of the “smoothed valuation interest rate” methodology used in the 2010 valuation, which includes corridors around the long-term investment rates of return.
This data, except for annual covered payroll, was provided by the System’s actuary.
FINANCIAL SECTION31
Notes to Required Supplementary Schedules
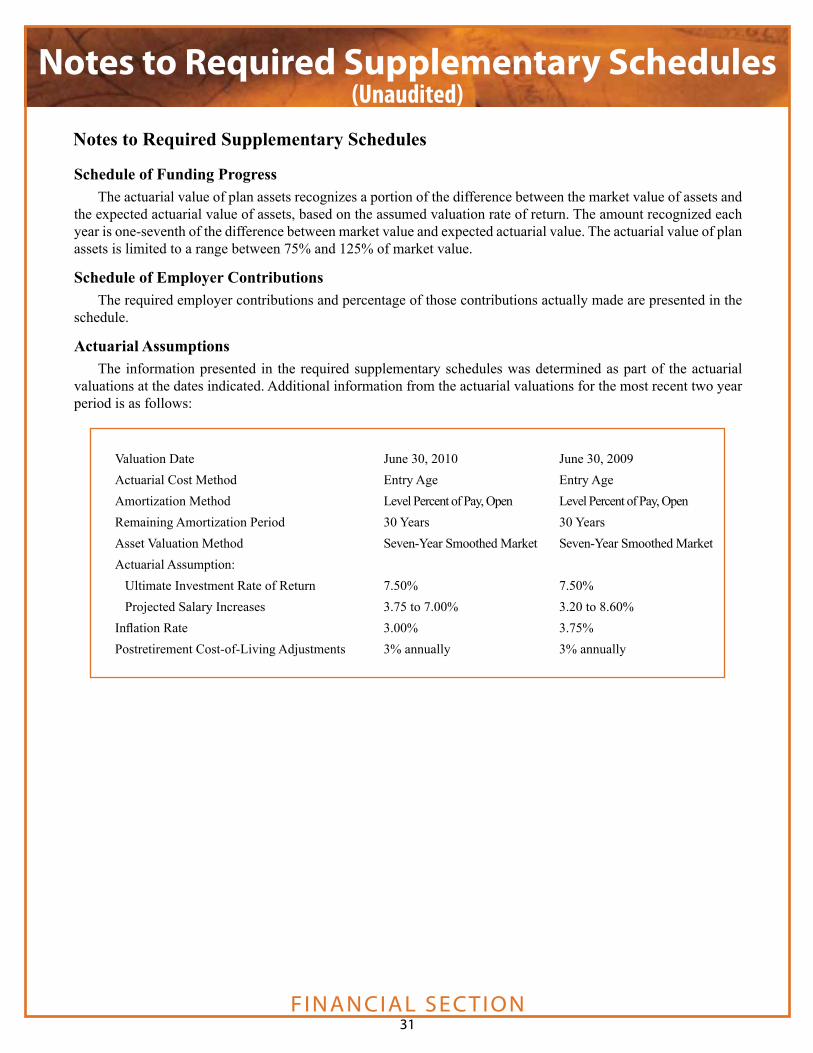
Valuation Date June 30, 2010 June 30, 2009 Actuarial Cost Method Entry Age Entry Age Amortization Method Level Percent of Pay, Open Level Percent of Pay, OpenRemaining Amortization Period 30 Years 30 Years Asset Valuation Method Seven-Year Smoothed Market Seven-Year Smoothed MarketActuarial Assumption: Ultimate Investment Rate of Return 7.50% 7.50% Projected Salary Increases 3.75 to 7.00% 3.20 to 8.60%Inflation Rate 3.00% 3.75%Postretirement Cost-of-Living Adjustments 3% annually 3% annually
Schedule of Funding Progress The actuarial value of plan assets recognizes a portion of the difference between the market value of assets and the expected actuarial value of assets, based on the assumed valuation rate of return. The amount recognized each year is one-seventh of the difference between market value and expected actuarial value. The actuarial value of plan assets is limited to a range between 75% and 125% of market value.
Schedule of Employer Contributions The required employer contributions and percentage of those contributions actually made are presented in the schedule.
Actuarial Assumptions The information presented in the required supplementary schedules was determined as part of the actuarial valuations at the dates indicated. Additional information from the actuarial valuations for the most recent two year period is as follows:
Notes to Required Supplementary Schedules
(Unaudited)
FINANCIAL SECTION32
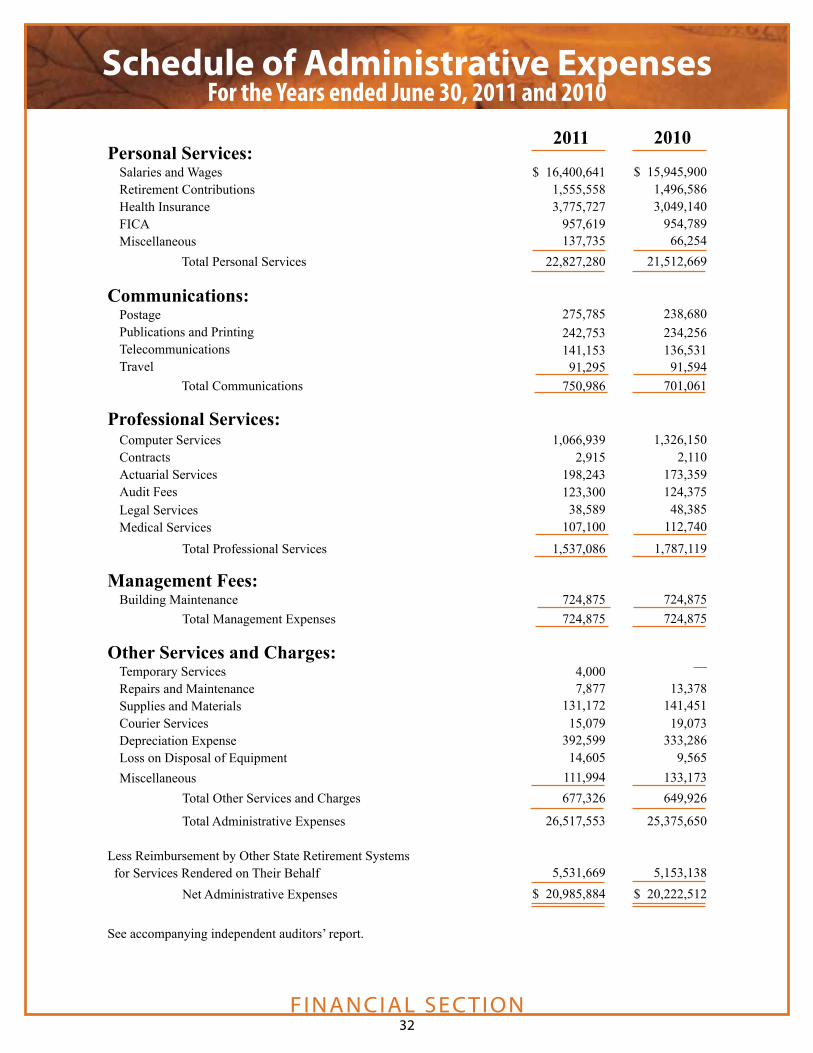
Schedule of Administrative ExpensesFor the Years ended June 30, 2011 and 2010
Personal Services:Salaries and WagesRetirement Contributions Health Insurance FICA Miscellaneous
Total Personal Services
Communications:Postage Publications and Printing Telecommunications Travel
Total Communications
Professional Services:Computer Services Contracts Actuarial Services Audit Fees Legal Services Medical Services
Total Professional Services
Management Fees:Building Maintenance
Total Management Expenses
Other Services and Charges:Temporary Services Repairs and Maintenance Supplies and Materials Courier Services Depreciation Expense Loss on Disposal of EquipmentMiscellaneous Total Other Services and Charges
Total Administrative Expenses
Less Reimbursement by Other State Retirement Systems for Services Rendered on Their Behalf Net Administrative Expenses
See accompanying independent auditors’ report.
2010
$ 15,945,900 1,496,586 3,049,140 954,789
66,254 21,512,669
238,680 234,256 136,531
91,594 701,061
1,326,150 2,110 173,359 124,375 48,385
112,740
1,787,119
724,875 724,875
—
13,378 141,451 19,073 333,286
9,565 133,173 649,926
25,375,650
5,153,138
$ 20,222,512
2011
$ 16,400,641 1,555,558 3,775,727 957,619
137,73522,827,280
275,785 242,753 141,153
91,295 750,986
1,066,939 2,915 198,243 123,300 38,589
107,100
1,537,086
724,875 724,875
4,000 7,877 131,172 15,079 392,599
14,605111,994677,326
26,517,553
5,531,669
$ 20,985,884

FINANCIAL SECTION33
Schedule of Investment ExpensesFor the Years ended June 30, 2011 and 2010
2011 2010
Investment Advisory and Custodial Fees $ 23,164,662 $ 20,557,658
Miscellaneous 2,071,845 1,872,049
Total Investment Expenses $ 25,236,507 $ 22,429,707
See accompanying independent auditors’ report.

INVESTMENT SECTION34
Investment Overview
While returns for the year were positive, the sovereign debt crisis emanating from Europe demonstrated that stock markets are still vulnerable to periods of bad news. There are undoubtedly large problems that need to be resolved, but many parts of the world economy are addressing the prior excesses. So as we cycle between episodes of good news and bad news, the financial markets will likely continue to fluctuate. This pattern is not a new phenomenon and it is easy to get caught up in the latest headlines, but as a pension plan it is more important to stay focused on the long-term. The System continues to invest in a mix of liquid, high quality bonds and stocks. These types of investments allow the System to participate in rising markets while moderating the risks on the downside. A high quality balanced fund has proven to be a successful strategy in a variety of markets over a long period of time. As in previous years, the bias to quality was a primary goal and was successfully met. “Conservation of Capital” and “Conservatism” continue to be the principal guides in investment decisions. The Board of Trustees continues to use a diversified portfolio to accomplish these objectives. The economy grew during the past fiscal year, although at a slow pace. Any improvement in housing will likely continue to be slow and uneven as excess inventory and more foreclosures dampen housing starts and prices. Growth in employment, or rather the lack thereof, remains the largest single factor plaguing the economy. The unemployment rate does not appear to be increasing, but neither is it decreasing and remains mired at year ago levels of 9.2%. The real bright spot has been corporate profits, which rose 15%, as companies slashed costs and benefited from stable business and consumer spending. Studies undertaken to evaluate the investment returns of pension funds over very long time horizons indicate that the asset allocation decision has the most impact on the fund’s returns. Although the returns for the various asset categories vary from year to year, over the long term equities usually outperform fixed income and cash by a very wide margin. For that reason, the System has generally maintained a significant equity exposure with the remainder of the fund in fixed income securities designed to generate income and preserve capital. Returns for one, three, five, ten and twenty-year periods are presented in this section. The longer
time periods, such as the twenty-year period, allow for more valid evaluation of returns, both in absolute terms and relative to an asset class index, by reducing emphasis on the short-term volatility of markets. The Daily Valuation Method was used to calculate rates of return which is in accordance with the CFA Institute’s objectives as stated in its publication “Global Investment Performance Standards Handbook,” second edition. Equity markets rebounded nicely during the fiscal year. The return for the S&P 500 Index was 30.7%. The Dow Jones Industrial Average Index rose 30.4%. Among individual companies, returns varied depending upon the company’s size, industry, and exposure to global markets. The MSCI EAFE Index returned 30.4% and the MSCI Emerging Market Index returned 27.8%. Similarly to last year, large and small capitalization domestic stocks underperformed. The S&P 400 Mid Capitalization Index outperformed both the S&P 500 and S&P 600 with a return of 39.4%. The S&P 600 Small Capitalization Index rose 37.0%, well above its ten-year average return of 7.8%, and also above the S&P 500’s 30.7%. These overall returns can be explained primarily by massive central bank and fiscal stimulus. Corporate profits improved due primarily to cost cutting. The improved foreign returns can be attributed to many of the same reasons and also the relatively strong developed market currencies providing some offset to the weaker currencies of the emerging markets. Returns for the fixed income markets were below average this year. Yields on long-term Treasury bonds began the period at 3.9% and ended the year at 4.4%. Overall the ten-year U.S. Treasury note returned 1.8% and the thirty-year U.S. Treasury bond returned -4.2%. Short-term Treasury bills only returned 0.1%. Our primary benchmark, the Barclays Government / Credit Index rose 3.7%. It is a shorter maturity index containing higher yielding corporate bonds as well as Treasuries. Higher quality bonds underperformed lower quality bonds as evidenced by the 3.6% return for AAA & AA rated bonds versus 7.9% for BBB rated bonds. In summary, the investment status of the System is excellent. The high quality of the System’s investments is in keeping with the continued policy of “Conservatism” and “Conservation of Capital.”
Prepared by the Division of Investment Services

INVESTMENT SECTION35
Note: Rates of return are calculated using the Daily Valuation Method based on market rates of return.
Equities S&P 500
Total Portfolio CPI
1 year 3 year 5 year 10 year 20 year
40
35
30
25
20
15
10
5
—
222018161412108642
—
Fixed Income (%)
Total Portfolio (%)
10
8
6
4
2
—1 year 3 year 5 year 10 year 20 year
Fixed Income Barclays Govt/Credit
Equities (%)
1 year 3 year 5 year 10 year 20 year
EquitiesS&P500
30.69
3.34
2.94
2.72
8.73
32.02
3.05
3.29
3.56
8.60
1 Year
3 Year
5 Year
10 Year
20 Year
1 Year
3 Year
5 Year
10 Year
20 Year
3.07
6.32
6.81
6.11
7.71
Fixed Income
BarclaysGovt/ Credit
3.68
6.17
6.35
5.74
6.83
TotalPortfolio CPI
1 Year
3 Year
5 Year
10 Year
20 Year
21.27
5.41
5.34
5.04
8.44
3.56
1.04
2.15
2.40
2.57
Rates of Return

INVESTMENT SECTION36
Investments
Investment Summary 2006 2007 2008 2009 2010 2011 Equities 61.2% 62.5% 58.8% 57.0% 63.7% 72.3% Fixed Income 36.8% 32.5% 39.5% 43.0% 36.3% 27.7% Short-Term Securities 2.0% 5.0% 1.7% — — —
Equities $28,654 $32,929 $29,531 $23,733 $28,238 $37,568 Fixed Income 17,244 17,115 19,802 17,945 16,076 14,387 Short-Term Securities 906 2,626 865 — — —Total Investments $46,804 $52,670 $50,198 $41,678 $44,314 $51,955
Asset Allocation at June 30
Asset Allocation at June 30 (in millions)
Investment Advisors’ Fees*: U.S. Equity International EquityInvestment Commissions: U.S. Equity International EquitySEC Fees:Miscellaneous*:
Total Fees and Commissions
$ 15,155,1416,505,229
12,803,8616,019,033
149,213 3,576,137$ 44,208,614
2011
Schedule of Fees and CommissionsFor the Year Ended June 30, 2011
Equities Fixed Income Short-term Securities
Asset Allocation
80%
70%
60%
50%
40%
30%
20%
10%
0%
*Amount included in total investment expenses shown on page 33.
06 07 08 09 10 11
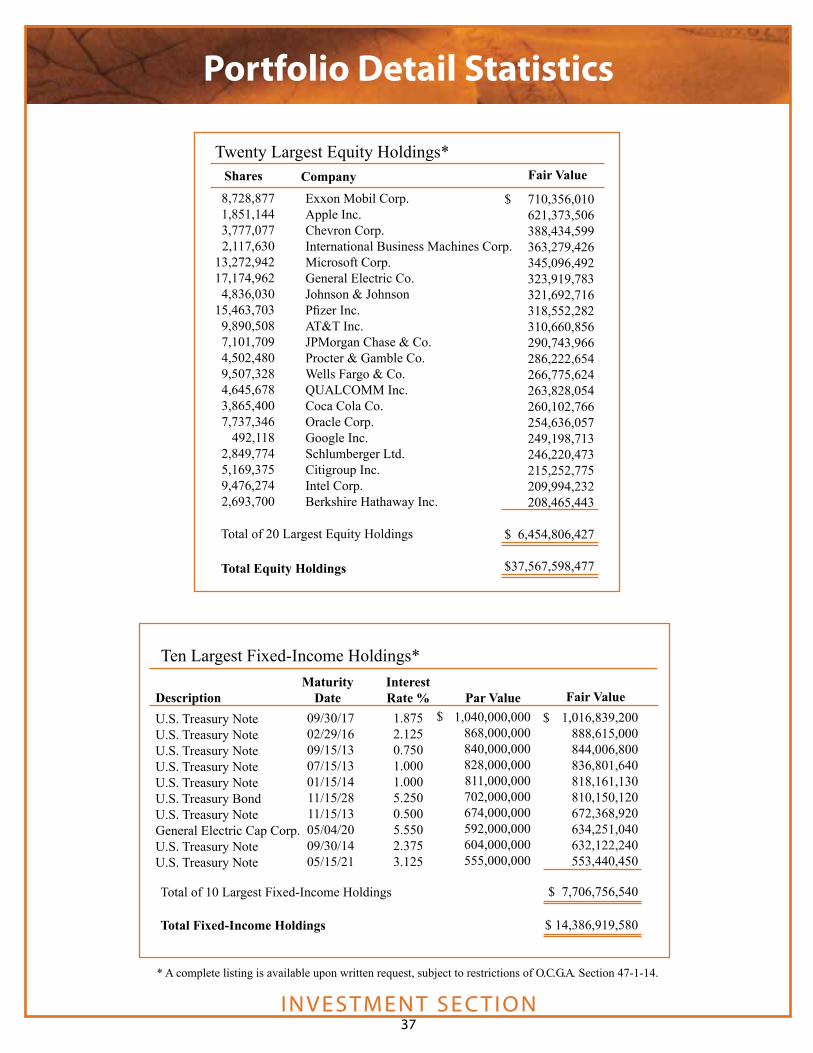
INVESTMENT SECTION37
Portfolio Detail Statistics
8,728,8771,851,1443,777,0772,117,630
13,272,94217,174,9624,836,030
15,463,7039,890,5087,101,7094,502,4809,507,3284,645,6783,865,4007,737,346
492,1182,849,7745,169,3759,476,2742,693,700
Exxon Mobil Corp. Apple Inc.Chevron Corp.International Business Machines Corp.Microsoft Corp.General Electric Co.Johnson & JohnsonPfizer Inc.AT&T Inc.JPMorgan Chase & Co.Procter & Gamble Co.Wells Fargo & Co.QUALCOMM Inc.Coca Cola Co.Oracle Corp.Google Inc.Schlumberger Ltd.Citigroup Inc.Intel Corp.Berkshire Hathaway Inc.
$ 710,356,010621,373,506388,434,599363,279,426345,096,492323,919,783321,692,716318,552,282310,660,856290,743,966286,222,654266,775,624263,828,054260,102,766254,636,057249,198,713246,220,473215,252,775209,994,232208,465,443
$ 6,454,806,427
$37,567,598,477
Total of 20 Largest Equity Holdings
Total Equity Holdings
Company Fair ValueTwenty Largest Equity Holdings*
* A complete listing is available upon written request, subject to restrictions of O. C. G. A. Section 47-1-14.
U.S. Treasury NoteU.S. Treasury NoteU.S. Treasury NoteU.S. Treasury NoteU.S. Treasury NoteU.S. Treasury BondU.S. Treasury Note General Electric Cap Corp.U.S. Treasury NoteU.S. Treasury Note
09/30/1702/29/1609/15/1307/15/1301/15/1411/15/2811/15/1305/04/2009/30/1405/15/21
1.8752.1250.7501.0001.0005.2500.5005.5502.3753.125
1,040,000,000868,000,000840,000,000828,000,000811,000,000702,000,000674,000,000592,000,000 604,000,000555,000,000
1,016,839,200888,615,000844,006,800836,801,640818,161,130810,150,120672,368,920634,251,040632,122,240553,440,450
$ 7,706,756,540
$ 14,386,919,580
Total of 10 Largest Fixed-Income Holdings
Total Fixed-Income Holdings
Maturity DateDescription
Ten Largest Fixed-Income Holdings*
Fair ValueInterest Rate % Par Value
$$
Shares
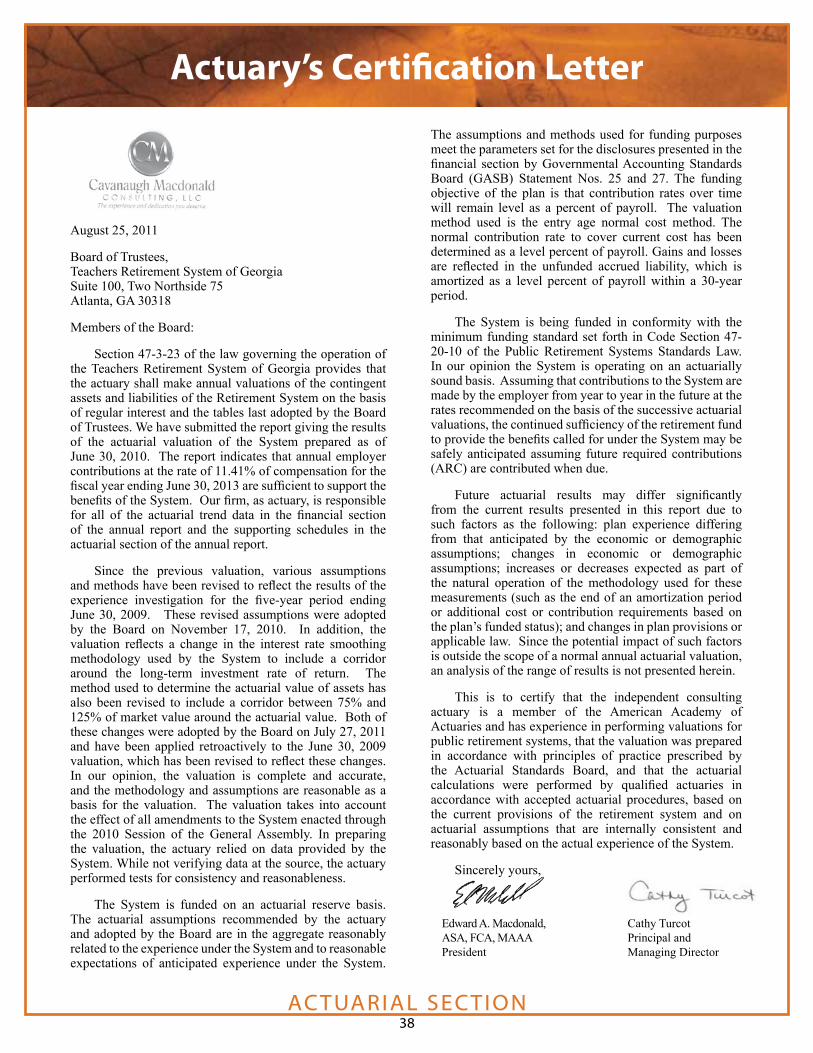
ACTUARIAL SECTION38
Actuary’s Certification Letter
August 25, 2011
Board of Trustees,Teachers Retirement System of GeorgiaSuite 100, Two Northside 75Atlanta, GA 30318
Members of the Board:
Section 47-3-23 of the law governing the operation of the Teachers Retirement System of Georgia provides that the actuary shall make annual valuations of the contingent assets and liabilities of the Retirement System on the basis of regular interest and the tables last adopted by the Board of Trustees. We have submitted the report giving the results of the actuarial valuation of the System prepared as of June 30, 2010. The report indicates that annual employer contributions at the rate of 11.41% of compensation for the fiscal year ending June 30, 2013 are sufficient to support the benefits of the System. Our firm, as actuary, is responsible for all of the actuarial trend data in the financial section of the annual report and the supporting schedules in the actuarial section of the annual report.
Since the previous valuation, various assumptions and methods have been revised to reflect the results of the experience investigation for the five-year period ending June 30, 2009. These revised assumptions were adopted by the Board on November 17, 2010. In addition, the valuation reflects a change in the interest rate smoothing methodology used by the System to include a corridor around the long-term investment rate of return. The method used to determine the actuarial value of assets has also been revised to include a corridor between 75% and 125% of market value around the actuarial value. Both of these changes were adopted by the Board on July 27, 2011 and have been applied retroactively to the June 30, 2009 valuation, which has been revised to reflect these changes. In our opinion, the valuation is complete and accurate, and the methodology and assumptions are reasonable as a basis for the valuation. The valuation takes into account the effect of all amendments to the System enacted through the 2010 Session of the General Assembly. In preparing the valuation, the actuary relied on data provided by the System. While not verifying data at the source, the actuary performed tests for consistency and reasonableness.
The System is funded on an actuarial reserve basis. The actuarial assumptions recommended by the actuary and adopted by the Board are in the aggregate reasonably related to the experience under the System and to reasonable expectations of anticipated experience under the System.
The assumptions and methods used for funding purposes meet the parameters set for the disclosures presented in the financial section by Governmental Accounting Standards Board (GASB) Statement Nos. 25 and 27. The funding objective of the plan is that contribution rates over time will remain level as a percent of payroll. The valuation method used is the entry age normal cost method. The normal contribution rate to cover current cost has been determined as a level percent of payroll. Gains and losses are reflected in the unfunded accrued liability, which is amortized as a level percent of payroll within a 30-year period.
The System is being funded in conformity with the minimum funding standard set forth in Code Section 47-20-10 of the Public Retirement Systems Standards Law. In our opinion the System is operating on an actuarially sound basis. Assuming that contributions to the System are made by the employer from year to year in the future at the rates recommended on the basis of the successive actuarial valuations, the continued sufficiency of the retirement fund to provide the benefits called for under the System may be safely anticipated assuming future required contributions (ARC) are contributed when due.
Future actuarial results may differ significantly from the current results presented in this report due to such factors as the following: plan experience differing from that anticipated by the economic or demographic assumptions; changes in economic or demographic assumptions; increases or decreases expected as part of the natural operation of the methodology used for these measurements (such as the end of an amortization period or additional cost or contribution requirements based on the plan’s funded status); and changes in plan provisions or applicable law. Since the potential impact of such factors is outside the scope of a normal annual actuarial valuation, an analysis of the range of results is not presented herein.
This is to certify that the independent consulting actuary is a member of the American Academy of Actuaries and has experience in performing valuations for public retirement systems, that the valuation was prepared in accordance with principles of practice prescribed by the Actuarial Standards Board, and that the actuarial calculations were performed by qualified actuaries in accordance with accepted actuarial procedures, based on the current provisions of the retirement system and on actuarial assumptions that are internally consistent and reasonably based on the actual experience of the System.
Sincerely yours,
Edward A. Macdonald, ASA, FCA, MAAA President
Cathy TurcotPrincipal and Managing Director

ACTUARIAL SECTION39
Summary of Actuarial Assumptions and Methods
The laws governing the Teachers Retirement Sys-tem of Georgia (the “System”) provide that an actuary perform an annual valuation of the contingent assets and liabilities of the System and perform at least once every five years an actuarial investigation of the mortality, service, and compensation experience of the members and beneficiaries of the System. The latest actuarial valuation of the System prepared as of June 30, 2010, was made on the basis of the interest rate assumption, and the mortality, rates of separation and salary increase tables approved by the Board on November 17, 2010. Changes in the asset smoothing method and the inter-est smoothing method were approved by the Board on July 27, 2011.
The more pertinent facts and significant assumptions underlying the computations included in the June 30, 2010, report are as follows:
a) Actuarial Method Used–The actuarial cost method used to determine funding is the entry age actuarial cost method. Gains and losses are reflected in the unfunded accrued liability. Adopted December 30, 1976.
b) Ultimate Investment Return–7.50% per annum, compounded annually. Adopted November 17, 2010.
c) Earnings Progression–Salaries are expected to increase 3.75% to 7.00% annually depending upon the employee’s age. Includes inflation at 3.00%. Adopted November 17, 2010.
d) Death, Disability and Withdrawal Rates–Death, disability and withdrawal rates for active employees and service retirement tables are based upon the System’s historical experience. The death-after-retirement rates are based on the RP-2000 Combined Mortality Table (set back two years for males and three years for females). The death-after-disability retirement rates are based on the RP-2000 Disabled Mortality Table (set back two years for males). Ad-opted November 17, 2010.
e) Asset Valuation Method–7-year smoothed market actuarial value. The actuarial value of assets recog-nizes a portion of the difference between the market value of the assets and the expected value of assets, based on the assumed valuation rate of return. The amount recognized each year is one-seventh of the
difference between market value and actuarial ex-pected value. The actuarial value of assets is limited to a range between 75% and 125% of market value. Adopted July 27, 2011.
f) Service Retirement Benefit–The service benefit (pension) paid to members is an annuity that is owed to them at retirement that will provide a total annual pension equal to 2% of the average of the member’s two consecutive highest paid years of service multiplied by the number of years of credit-able service up to 40 years. It is also assumed that certain cost-of-living adjustments will be made in future years.
g) Actuarially Determined Unfunded Accrued Li-ability –The present value of the unfunded accrued liability, based on unaudited data provided the actu-ary by the System, was approximately $9.1 billion at June 30, 2010.
h) Required Contributions (% of compensation)– A “smoothed valuation interest rate” methodology was adopted on July 21, 2010 for the purpose of calculating the annual required contributions. A refinement of this methodology was adopted on July 27, 2011 to include a corridor around the long-term investment rate of return. Contributions required by the annual actuarial valuation as of June 30, 2010, to be made for the year ended June 30, 2013:
(1) Member 6.00%
(2) Employer: Normal 6.36% Unfunded Accrued Liability 5.05% Total 11.41%

ACTUARIAL SECTION40
Summary of Actuarial Assumptions and Methods
0-4 Yrs 5-9 Yrs 10+ YrsMale
20 0.03% 0.03% 31.00% — % — % 25 0.04 0.03 18.00 16.00 — 30 0.04 0.04 14.00 8.00 11.00 35 0.06 0.04 14.00 6.00 3.00 40 0.10 0.05 13.00 6.00 2.25 45 0.13 0.09 12.00 6.00 2.20 50 0.19 0.17 11.00 5.50 2.50 55 0.29 0.32 11.00 5.00 2.70 60 0.53 — 11.00 5.00 — 64 0.88 — 11.00 5.00 —
Female 20 0.02% 0.02% 30.00% — % — % 25 0.02 0.02 14.00 25.00 — 30 0.02 0.02 13.00 9.00 9.00 35 0.04 0.03 13.00 7.00 3.50 40 0.06 0.04 11.00 7.00 3.00 45 0.09 0.07 10.00 5.50 2.00 50 0.13 0.12 10.00 5.00 2.00 55 0.20 0.38 10.00 4.75 2.75 60 0.35 — 10.00 4.75 — 64 0.58 — 10.00 4.75 —
Service RetirementAdopted November 17, 2010
Separation Before Service RetirementAdopted November 17, 2010
< 30 years >= 30 years < 30 years >= 30 years Age of service of service of service of service
Male Female
50 5.00% 50.00% 5.00% 50.00% 55 5.00 38.00 5.00 35.00 60 20.00 35.00 25.00 40.00 61 18.00 30.00 25.00 40.00 62 25.00 35.00 25.00 40.00 63 20.00 33.00 25.00 40.00 64 18.00 30.00 25.00 40.00 65 30.00 30.00 30.00 30.00 66 30.00 30.00 30.00 30.00 67 30.00 30.00 28.00 28.00 68 28.00 28.00 28.00 28.00 69 26.00 26.00 28.00 28.00 70 30.00 30.00 30.00 30.00
Annual Rate ofWithdrawal
Years of Service Age Death Disability

ACTUARIAL SECTION41
Actuarial Valuation Data
Retirees and Beneficiaries
% Annual Annual Annual Increase AverageFiscal Allowances Allowances Allowances in Annual AnnualYear(1) Number (000’s) Number (000’s) Number (000’s) Allowances Allowances
2005 6,176 230,973 1,594 33,139 66,172 1,854,279 11.9 28,022
2006 5,691 223,279 1,644 37,087 70,219 2,040,471 10.0 29,059
2007 5,858 230,924 1,656 39,293 74,421 2,232,102 9.4 29,993
2008 5,817 238,137 1,655 39,808 78,583 2,430,431 8.9 30,928
2009 5,543 245,006 1,768 45,116 82,358 2,630,321 8.2 31,938
2010 6,383 279,009 1,763 46,853 86,978 2,862,477 8.8 32,910
(1) Fiscal year refers to the actuarial valuation performed as of June 30 of that year and determines the funding necessary for the fiscal year beginning two years after the valuation date. An actuarial valuation for the fiscal year ended June 30, 2011 is currently in process and was not available for this analysis.
Added to Roll Removed from Roll Roll-End of Year
$ $ $ % $
Active Members Annual Fiscal Payroll Average % Year(1) Members (000’s) Pay Increase
2005 199,088 8,252,598 41,452 1.8
2006 206,592 8,785,985 42,528 2.6
2007 215,566 9,492,003 44,033 3.5
2008 224,993 10,197,584 45,324 2.9
2009 226,537 10,641,543 46,975 3.6
2010 222,020 10,437,703 47,012 0.1
$ $ %
Active Members

42 ACTUARIAL SECTION42
Actuarial Valuation Data
Fiscal Year Member Employer
2007 5.00 % 9.28 %
2008 5.00 9.28
2009 5.00 9.28
2010 5.25 9.74
2011 5.53 10.28
2012 5.53 10.28
Solvency Test (in thousands)
Aggregate Actuarial Accrued Liabilities For Portion of (1) (2) (3) Accrued Active Retirees Active Members Actuarial Liabilities Fiscal Member and (Employer-Financed Value of Covered by Assets Year* Contributions Beneficiaries Portion) Assets (1) (2) (3)
2005 5,171,813 23,229,592 19,409,809 46,836,895 100.0 100.0 95.0
2006 5,417,408 25,653,251 19,989,022 49,263,027 100.0 100.0 91.0
2007 5,703,184 28,212,100 21,081,286 52,099,171 100.0 100.0 86.3
2008 6,009,710 30,915,200 22,208,867 54,354,284 100.0 100.0 78.5
2009** 6,382,932 29,725,063 23,342,121 53,438,604 100.0 100.0 74.2
2010 6,705,274 34,264,548 22,622,215 54,529,416 100.0 100.0 59.9
% %$ $ $ $ %
* Fiscal year refers to the actuarial valuation performed as of June 30 of that year and determines the funding necessary for the fiscal year beginning two years after the valuation date. An actuarial valuation for the fiscal year ended June 30, 2011 is cur-rently in process and was not available for this analysis.
* Revised since the previous valuation to reflect the refinement of the “smoothed valuation interest rate” methodology used in the 2010 valuation, which includes corridors around the long-term investment rate of return.
*
Member and Employer Contribution Rates

ACTUARIAL SECTION43
Actuarial Valuation Data
Analysis of Financial Experience (in millions)
Analysis of the Change in Unfunded Accrued Liability Increase (Decrease) During the Years Ended June 30, Item 2010 2009 2008 2007 2006 2005
Accrued Liability Contribution Experience: Valuation Asset Growth Pensioners’ Mortality Turnover and Retirements New Entrants Salary Increases Method Changes (4) Amendments (1)
Change in Member Contribution Rate (3) Assumption Changes (2) Miscellaneous
Total Increase (Decrease)
Interest Added to Previous Unfunded Accrued Liability $ ( )
( )
$
$
$
$
$
$
$
$
$
( )
( )
( )
( )
( )
$ 486.3312.0
1,674.989.8
269.5123.7
1,040.5—
— 12.8
1,472.4274.2
$ 3,051.1
29.149.4
516.414.059.9
104.0227.5 313.7 —
—589.4
—
1,362.2
73.151.9
675.340.765.8
143.5144.1
339.2 48.5
———
822.3
134.757.2
132.325.6
213.3212.6294.5
— 252.3
8.4—
51.2
1,100.7
217.3
118.5
548.958.4
291.4258.8162.8
—386.3
15.7—
92.4
1,882.1
358.5125.0
2,433.550.1
307.1185.114.1
2,062.3
———
70.9
1,232.0
( )( )
( )( )
( )
(1) Amendments
2006 - Reflects the impact of House Bill 400 which increased allowances effective July 1, 2006 to retirees and benefi-ciaries retired before July 1, 1987.
2007- Reflects the impact of the first phase of the Plymel lawsuit.
2008- Reflects the impact of the final Plymel lawsuit.
(2) Assumption Changes
2005 - The assumed rates of withdrawal, disability, retirement, and mortality and the assumed rates of salary increase have been revised to more closely reflect the actual and anticipated experience of the System. In addition, the adminis-tration expense load was increased to 0.25% from 0.15% of active payroll.
2010 - The assumed rates of withdrawal, disability, retirement, and mortality and the assumed rates of salary increase have been revised to more closely reflect the actual and anticipated experience of the System.
(3) Member Contribution Rate
2007 - Reflects an increase in the member contribution rate from 5.00% to 5.25% effective July 1, 2009.
2008 - Reflects an increase in the member contribution rate from 5.25% to 5.53% effective July 1, 2010.
2010 - Reflects an increase in the member contribution rate from 5.53% to 6.00% effective July 1, 2012.
(4) Method Changes
2006 - Reflects change from 5-year to 7-year market value smoothing (method for determining the actuarial value of assets).
2009 - Reflects change to a valuation interest rate smoothing methodology and a change to include a corridor around the long-term investment rate of return.
( )
STATISTICAL SECTION44
Statistical Section Overview
The statistical section presents additional informa-tion to provide financial statement users with added historical perspective, context, and detail to assist in using the information in the financial statements, notes to financial statements, and required supplemen-tary information to understand and assess the System’s financial condition.
Financial TrendsThe schedules presented on page 45 and page 46
contain trend information to help the reader under-stand how the System’s financial position has changed over time.
Operating InformationThe schedules presented on pages 47 through 58
contain benefits, service and employer data to help the reader understand how the System’s financial report relates to the services of the System and the activities it performs.
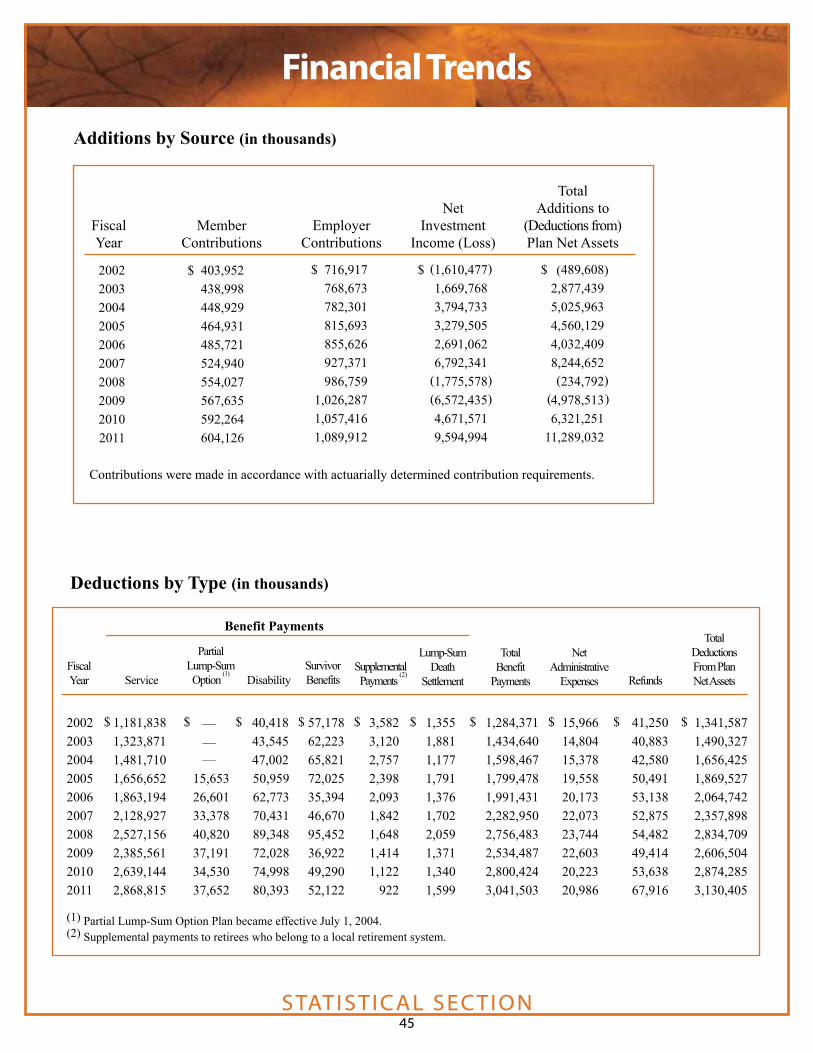
STATISTICAL SECTION45
Financial Trends
Deductions by Type (in thousands)
2002 1,181,838 40,418 57,178 3,582 1,355 1,284,371 15,966 41,250 1,341,587 2003 1,323,871 43,545 62,223 3,120 1,881 1,434,640 14,804 40,883 1,490,327 2004 1,481,710 47,002 65,821 2,757 1,177 1,598,467 15,378 42,580 1,656,425 2005 1,656,652 15,653 50,959 72,025 2,398 1,791 1,799,478 19,558 50,491 1,869,5272006 1,863,194 26,601 62,773 35,394 2,093 1,376 1,991,431 20,173 53,138 2,064,7422007 2,128,927 33,378 70,431 46,670 1,842 1,702 2,282,950 22,073 52,875 2,357,898 2008 2,527,156 40,820 89,348 95,452 1,648 2,059 2,756,483 23,744 54,482 2,834,709 2009 2,385,561 37,191 72,028 36,922 1,414 1,371 2,534,487 22,603 49,414 2,606,5042010 2,639,144 34,530 74,998 49,290 1,122 1,340 2,800,424 20,223 53,638 2,874,285 2011 2,868,815 37,652 80,393 52,122 922 1,599 3,041,503 20,986 67,916 3,130,405 (1) Partial Lump-Sum Option Plan became effective July 1, 2004. (2) Supplemental payments to retirees who belong to a local retirement system.
Fiscal Year Service
PartialLump-SumOption
(1)Disability
SurvivorBenefits
Supplemental Payments
(2)
Lump-SumDeath
Settlement
Benefit Payments
Total Benefit
Payments
NetAdministrative
Expenses Refunds
TotalDeductionsFrom Plan Net Assets
———
$$ $$$$$$$$
Total Net Additions to Fiscal Member Employer Investment (Deductions from)
Year Contributions Contributions Income (Loss) Plan Net Assets
Contributions were made in accordance with actuarially determined contribution requirements.
Additions by Source (in thousands)
( )2002200320042005200620072008200920102011
$ 403,952438,998448,929464,931485,721524,940554,027567,635592,264604,126
$ 716,917768,673782,301815,693855,626927,371986,759
1,026,2871,057,4161,089,912
$ 1,610,4771,669,7683,794,7333,279,5052,691,0626,792,3411,775,5786,572,4354,671,5719,594,994
$ 489,6082,877,4395,025,9634,560,1294,032,4098,244,652
234,7924,978,513 6,321,25111,289,032
( )( )
( )
( )( )

STATISTICAL SECTION46
Financial Trends
Changes in Net Assets (in thousands)
( )
Total Total Additions Deductions Changes Fiscal to Plan from Plan in Plan Year Net Assets Net Assets Net Assets
2002 $ 489,608 $ 1,341,587 $ 1,831,195
2003 2,877,439 1,490,327 1,387,112
2004 5,025,963 1,656,425 3,369,538
2005 4,560,129 1,869,527 2,690,602
2006 4,032,409 2,064,742 1,967,667
2007 8,244,652 2,357,898 5,886,754
2008 234,792 2,834,709 3,069,501
2009 4,978,513 2,606,504 7,585,017
2010 6,321,251 2,874,285 3,446,966
2011 11,289,032 3,130,405 8,158,627
( )
( )
( )
Fiscal Year
( )
( )
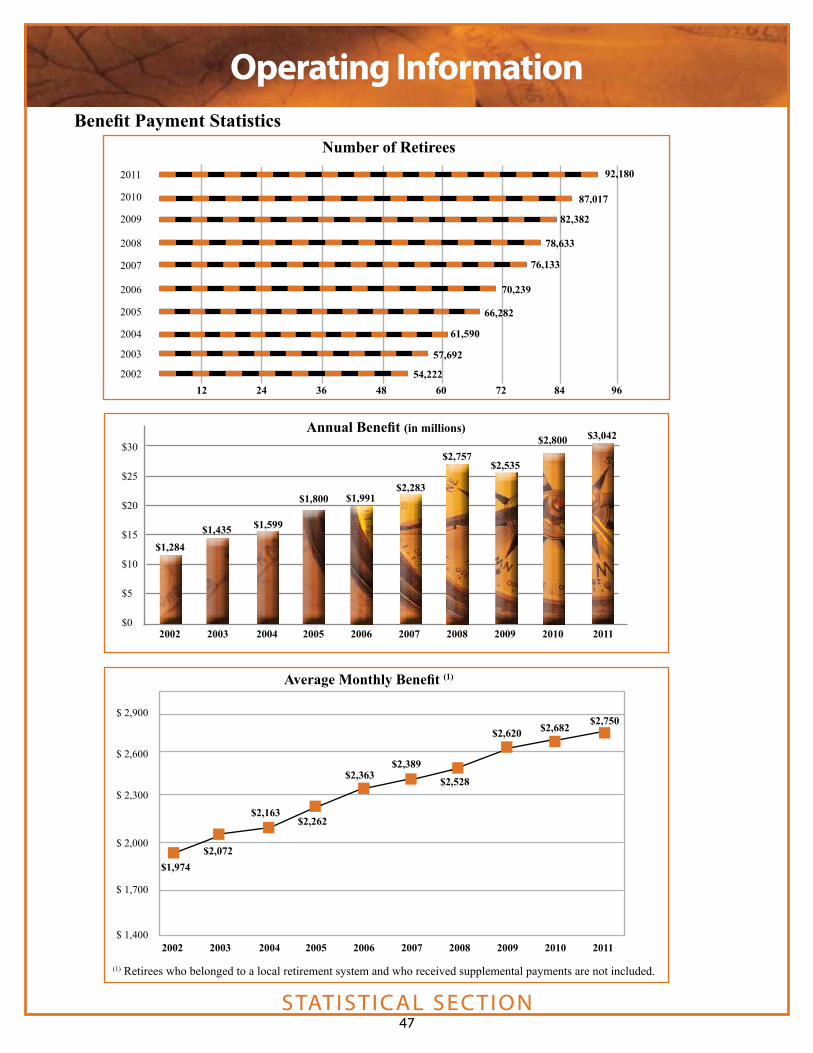
STATISTICAL SECTION47
Operating Information
2,900
2,600
2,300
2,000
1,700
1,4002002 2003 2004 2005 2006 2007 2008 2009 2010 2011
Average Monthly Benefit (1)
(1) Retirees who belonged to a local retirement system and who received supplemental payments are not included.
$
$
$
$
$
$
Number of Retirees
70,239
66,282
61,590
57,692
54,222
78,633
82,382
76,133
12 24 36 48 60 72 84 96
87,017
$1,974$2,072
$2,163$2,262
$2,363$2,389
$2,528
$2,620 $2,682
92,180
$30
$25
$20
$15
$10
$5
$02002 2003 2004 2005 2006 2007 2008 2009 2010 2011
$1,284$1,435 $1,599
$1,800 $1,991
$2,757
$2,283
$2,535
$2,800 $3,042
$2,750
Benefit Payment Statistics
Annual Benefit (in millions)
2011
2010
2009
2008
2007
2006
2005
2004
2003
2002
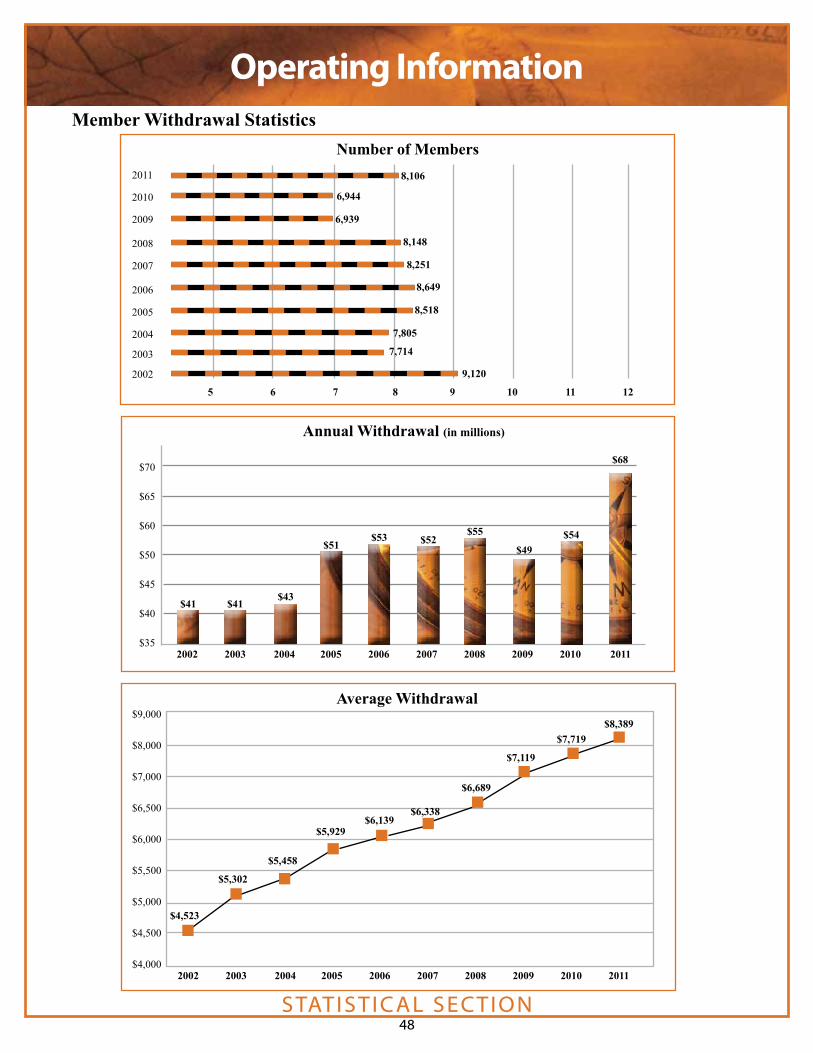
STATISTICAL SECTION48
Operating InformationMember Withdrawal Statistics
Number of Members
5 6 7 8 9 10 11 12
2011
2010
2009
2008
2007
2006
2005
2004
2003
2002
$70
$65
$60
$50
$45
$40
$352002 2003 2004 2005 2006 2007 2008 2009 2010 2011
$41 $41$43
$51$53 $55
$52$49
$54
$68
8,251
8,518
9,120
8,148
7,805
7,714
8,649
6,939
6,944
8,106
Annual Withdrawal (in millions)
$9,000
$8,000
$7,000
$6,500
$6,000
$5,500
$5,000
$4,500
$4,0002002 2003 2004 2005 2006 2007 2008 2009 2010 2011
Average Withdrawal
$5,302
$5,458
$6,338
$5,929$6,139
$6,689
$7,119
$7,719
$4,523
$8,389
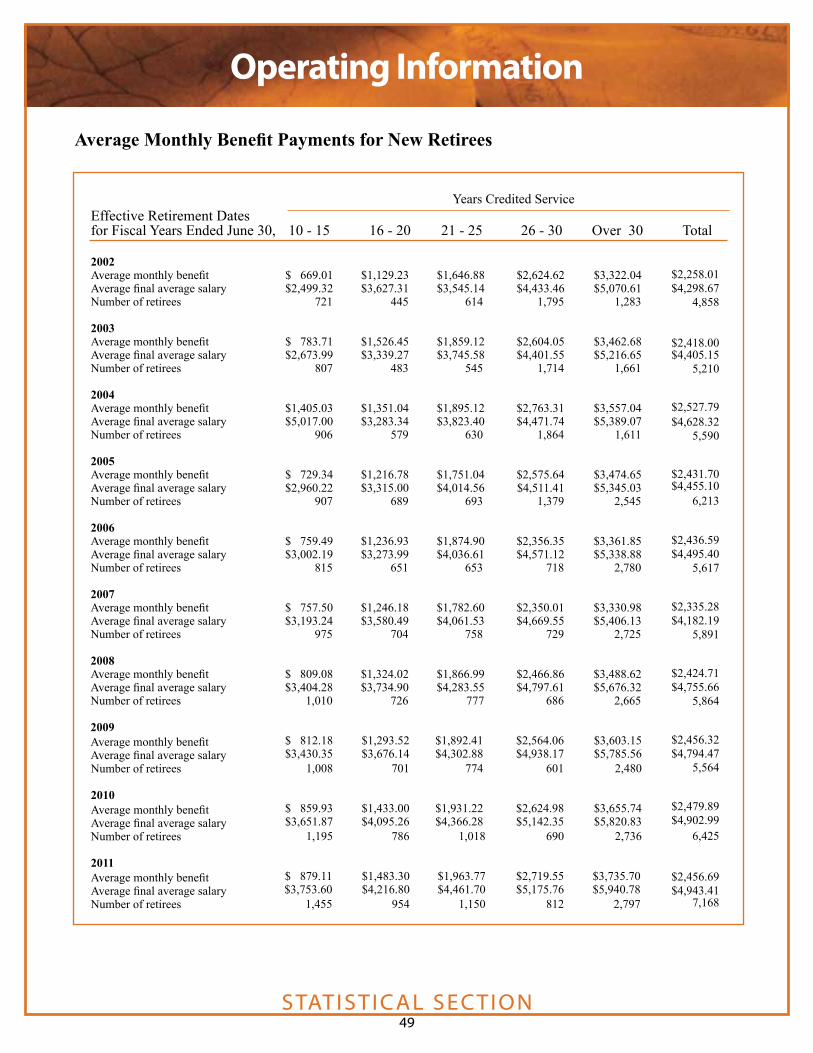
STATISTICAL SECTION49
Operating Information
Average Monthly Benefit Payments for New Retirees
Years Credited Service Effective Retirement Dates for Fiscal Years Ended June 30, 10 - 15 16 - 20 21 - 25 26 - 30 Over 30 Total
2002 Average monthly benefit $ 669.01 $1,129.23 $1,646.88 $2,624.62 $3,322.04 Average final average salary $2,499.32 $3,627.31 $3,545.14 $4,433.46 $5,070.61 Number of retirees 721 445 614 1,795 1,283 2003 Average monthly benefit $ 783.71 $1,526.45 $1,859.12 $2,604.05 $3,462.68 Average final average salary $2,673.99 $3,339.27 $3,745.58 $4,401.55 $5,216.65 Number of retirees 807 483 545 1,714 1,661 2004 Average monthly benefit $1,405.03 $1,351.04 $1,895.12 $2,763.31 $3,557.04 Average final average salary $5,017.00 $3,283.34 $3,823.40 $4,471.74 $5,389.07 Number of retirees 906 579 630 1,864 1,611 2005 Average monthly benefit $ 729.34 $1,216.78 $1,751.04 $2,575.64 $3,474.65 Average final average salary $2,960.22 $3,315.00 $4,014.56 $4,511.41 $5,345.03 Number of retirees 907 689 693 1,379 2,545 2006 Average monthly benefit $ 759.49 $1,236.93 $1,874.90 $2,356.35 $3,361.85 Average final average salary $3,002.19 $3,273.99 $4,036.61 $4,571.12 $5,338.88 Number of retirees 815 651 653 718 2,780 2007 Average monthly benefit $ 757.50 $1,246.18 $1,782.60 $2,350.01 $3,330.98 Average final average salary $3,193.24 $3,580.49 $4,061.53 $4,669.55 $5,406.13 Number of retirees 975 704 758 729 2,725 2008 Average monthly benefit $ 809.08 $1,324.02 $1,866.99 $2,466.86 $3,488.62 Average final average salary $3,404.28 $3,734.90 $4,283.55 $4,797.61 $5,676.32Number of retirees 1,010 726 777 686 2,665
2009Average monthly benefitAverage final average salary Number of retirees
2010Average monthly benefitAverage final average salary Number of retirees
2011Average monthly benefitAverage final average salary Number of retirees
$ 812.18$3,430.35 1,008
$1,293.52$3,676.14 701
$1,892.41$4,302.88 774
$2,564.06$4,938.17 601
$3,603.15$5,785.56 2,480
$2,258.01$4,298.67 4,858
$2,418.00 $4,405.15 5,210
$2,527.79$4,628.32 5,590
$2,431.70$4,455.10 6,213
$2,436.59$4,495.40 5,617
$2,335.28$4,182.19 5,891
$2,424.71$4,755.66 5,864
$2,456.32$4,794.47 5,564
$2,479.89$4,902.99 6,425
$2,456.69 $4,943.41 7,168
$ 859.93$3,651.87 1,195
$1,433.00$4,095.26 786
$1,931.22$4,366.28 1,018
$2,624.98$5,142.35 690
$3,655.74$5,820.83 2,736
$ 879.11$3,753.60 1,455
$1,483.30$4,216.80 954
$1,963.77 $4,461.70
1,150
$2,719.55$5,175.76 812
$3,735.70$5,940.78 2,797
Years Credited Service
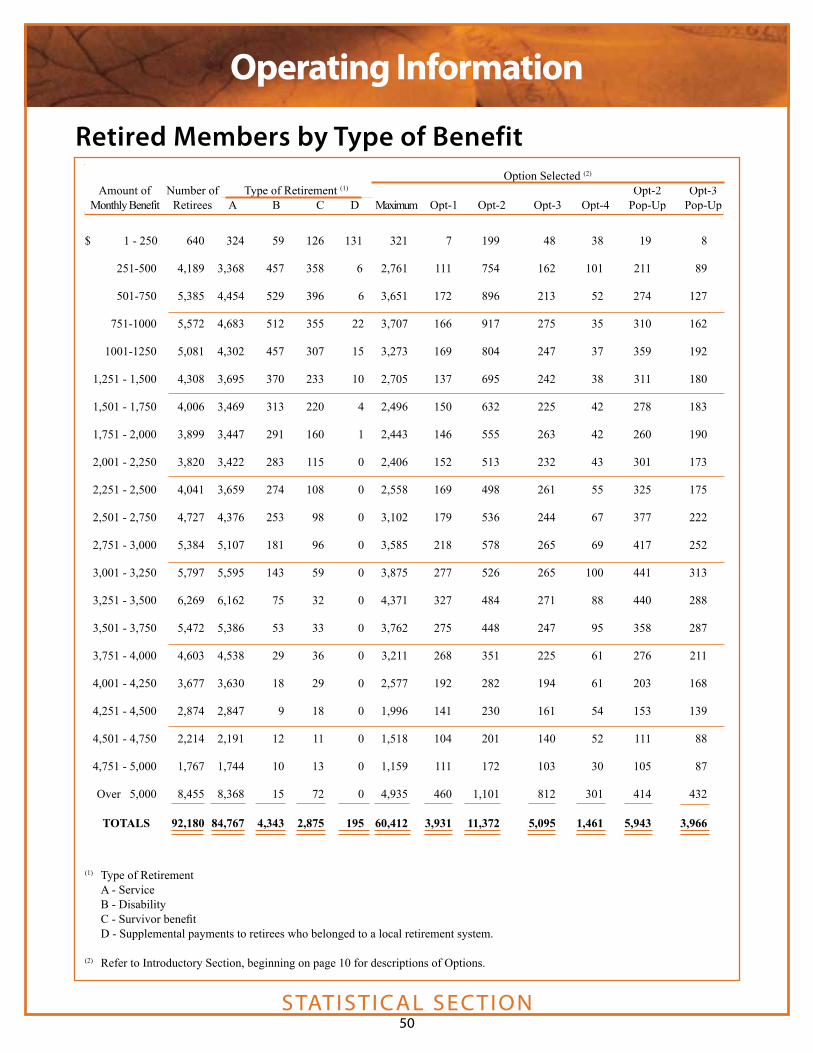
STATISTICAL SECTION50
Operating Information
Retired Members by Type of Benefit Option Selected (2)
Amount of Number of Type of Retirement (1) Opt-2 Opt-3 Monthly Benefit Retirees A B C D Maximum Opt-1 Opt-2 Opt-3 Opt-4 Pop-Up Pop-Up
$ 1 - 250 640 324 59 126 131 321 7 199 48 38 19 8
251-500 4,189 3,368 457 358 6 2,761 111 754 162 101 211 89
501-750 5,385 4,454 529 396 6 3,651 172 896 213 52 274 127
751-1000 5,572 4,683 512 355 22 3,707 166 917 275 35 310 162
1001-1250 5,081 4,302 457 307 15 3,273 169 804 247 37 359 192
1,251 - 1,500 4,308 3,695 370 233 10 2,705 137 695 242 38 311 180
1,501 - 1,750 4,006 3,469 313 220 4 2,496 150 632 225 42 278 183
1,751 - 2,000 3,899 3,447 291 160 1 2,443 146 555 263 42 260 190
2,001 - 2,250 3,820 3,422 283 115 0 2,406 152 513 232 43 301 173
2,251 - 2,500 4,041 3,659 274 108 0 2,558 169 498 261 55 325 175
2,501 - 2,750 4,727 4,376 253 98 0 3,102 179 536 244 67 377 222
2,751 - 3,000 5,384 5,107 181 96 0 3,585 218 578 265 69 417 252
3,001 - 3,250 5,797 5,595 143 59 0 3,875 277 526 265 100 441 313
3,251 - 3,500 6,269 6,162 75 32 0 4,371 327 484 271 88 440 288
3,501 - 3,750 5,472 5,386 53 33 0 3,762 275 448 247 95 358 287
3,751 - 4,000 4,603 4,538 29 36 0 3,211 268 351 225 61 276 211
4,001 - 4,250 3,677 3,630 18 29 0 2,577 192 282 194 61 203 168
4,251 - 4,500 2,874 2,847 9 18 0 1,996 141 230 161 54 153 139
4,501 - 4,750 2,214 2,191 12 11 0 1,518 104 201 140 52 111 88
4,751 - 5,000 1,767 1,744 10 13 0 1,159 111 172 103 30 105 87
Over 5,000 8,455 8,368 15 72 0 4,935 460 1,101 812 301 414 432
TOTALS 92,180 84,767 4,343 2,875 195 60,412 3,931 11,372 5,095 1,461 5,943 3,966
(1) Type of Retirement A - Service B - Disability C - Survivor benefit D - Supplemental payments to retirees who belonged to a local retirement system.
(2) Refer to Introductory Section, beginning on page 10 for descriptions of Options.

STATISTICAL SECTION51
Operating Information
Retirement Payments By County Residence
ApplingAtkinsonBaconBakerBaldwinBanksBarrowBartowBen HillBerrienBibbBleckleyBrantleyBrooksBryanBullochBurkeButtsCalhounCamdenCandlerCarrollCatoosaCharltonChathamChattahoocheeChattoogaCherokeeClarkeClayClaytonClinchCobb
24072
1227
574151468720223229
1,770229110162211
1,10218820024
265131
1,39535177
2,32924
2531,3342,744
1092483
4,254
$ 7,838,786.18 2,406,033.684,169,411.20
222,049.7418,726,373.293,949,810.93
12,450,900.6322,037,477.297,371,096.016,535,330.36
57,486,240.126,740,487.693,435,141.075,402,143.136,113,972.06
38,843,910.286,192,247.156,074,842.03
1,3825,222.529,401,286.063,626,154.98
46,402,545.0311,073,771.242,546,586.69
78,142,918.12742,236.25
7,686,861.0339,337,526.55
116,417,237.421,022,850.00
42,555,063.322,815,815.05
159,310,672.60
CoffeeColquittColumbiaCookCowetaCrawfordCrispDadeDawsonDecaturDekalbDodgeDoolyDoughertyDouglasEarlyEcholsEffinghamElbertEmanuelEvansFanninFayetteFloydForsythFranklinFultonGilmerGlascockGlynnGordonGradyGreene
427382
1,67119494451
28011221282
4,750235101
1,118700257
297226327122272
1,2161,153
645294
5,78224232
1,02544666
238
CountyNumber of
Retirees
FY11 Total Gross Pay County
Number ofRetirees
FY11 Total Gross Pay
$ 13,970,695.70 12,899,676.0652,982,542.645,909,637.28
31,072,909.351,735,989.928,554,639.523,455,027.576,400,453.864,697,102.51
207,257,209.027,488,148.803,440,044.46
42,610,255.1924,459,657.012,673,933.20
226,114.568,139,476.885,700,142.21
10,963,683.553,509,652.167,848,448.79
46,786,688.9737,708,472.4018,463,564.359,009,927.90
244,574,726.747,602,653.461,069,330.69
32,066,947.0413,499,436.603,085,696.367,145,120.56

STATISTICAL SECTION52
Operating Information
GwinnettHabershamHallHancockHaralsonHarrisHartHeardHenryHoustonIrwinJacksonJasperJeff DavisJeffersonJenkinsJohnsonJonesLamarLanierLaurensLeeLibertyLincolnLongLowndesLumpkinMaconMadisonMarionMcDuffieMcIntoshMeriwether
3,254494
1,44111926530123866
1,2661,033
9073117312918710610519121156
62321921012542
1,36737413960667
255141216
$ 127,954,125.3713,635,486.3349,311,388.703,135,996.367,890,265.599,112,154.467,470,777.872,392,133.84
42,412,235.0435,428,617.883,085,833.88
17,956,193.875,738,270.703,789,680.585,825,932.683,236,307.642,989,926.056,443,704.186,000,739.011,623,045.47
19,318,440.167,163,194.117,104,483.843,545,068.931,384,530.08
43,070,401.3311,665,260.704,718,321.13
15,608,542.362,194,642.899,139,463.653,718,284.017,129,419.08
MillerMitchellMonroeMontgomeryMorganMurrayMuscogeeNewtonOconeeOglethorpePauldingPeachPickensPiercePikePolkPulaskiPutnamQuitmanRabunRandolphRichmondRockdaleSchleyScrevenSeminoleSpaldingStephensStewartSumterTalbotTaliaferroTattnall
19227225108282281
2,157 570932225415522509199195400106294
123119
2,53163246
19724
71633370
4006819
172
$ 909,134.287,270,046.376,851,730.373,143,893.718,388,607.619,089,359.36
74,956,228.7916,828,495.1132,821,614.896,590,682.54
11,304,247.5418,220,143.3015,137,721.755,859,259.675,604,996.90
13,773,775.013,347,983.508,789,790.29
593,445.606,633,514.081,106,237.44
82,487,983.9924,911,615.141,317,419.775,668,276.191,382,322.16
23,167,311.9810,205,301.792,339,583.61
14,162,874.001,760,302.64
479,190.485,146,395.74
CountyNumber of
Retirees
FY11 Total Gross Pay County
Number ofRetirees
FY11 Total Gross Pay
Retirement Payments By County Residence continued
51

STATISTICAL SECTION53
Operating Information
Retirement Payments By County Residence continued
TaylorTelfairTerrellThomasTiftToombsTownsTreutlenTroupTurnerTwiggsUnionUpsonWalkerWaltonWareWarrenWashingtonWayneWebsterWheelerWhiteWhitfieldWilcoxWilkesWilkinsonWorthOutside GA
TOTALS
10819232
59374130819185
64615566
27331451081549760
2453232189
357794130151111181
11,577
92,180
$ 3,439,175.736,121,684.152,005,834.71
18,644,922.3725,128,297.3210,047,727.094,850,463.242,669,566.12
21,556,868.504,951,415.832,007,182.356,790,774.66
10,198,371.4115,354,150.5323,259,625.8917,569,011.001,765,368.488,228,871.259,744,389.30
523,507.802,906,997.819,194,410.64
28,842,139.004,016,562.384,092,545.803,572,941.125,529,810.88
241,997,229.26
$ 3,041,503,202.97
CountyNumber of
Retirees
FY11 Total Gross Pay

STATISTICAL SECTION54
Operating Information
Principal Participating Employers 2011 2002 Percentage Percentage Covered of Total Covered of Total Employees Rank System Employees Rank System
Gwinnett County Schools 16,115 1 7.45 % 12,249 1 6.09 %Cobb County Schools 11,219 2 5.19 11,339 2 5.63Dekalb County Schools 10,709 3 4.95 11,161 3 5.55Fulton County Schools 9,471 4 4.38 8,055 5 4.00University of Georgia 7,613 5 3.52 8,762 4 4.35Atlanta City Schools 5,425 6 2.51 5,996 6 2.98Clayton County Schools 5,234 7 2.42 5,342 7 2.65Chatham County Schools 4,314 8 2.00 4,276 8 2.12Henry County Schools 3,974 9 1.84 __ __ __
Muscogee County Schools 3,817 10 1.77 3,841 9 1.91Richmond County Schools __ __ __ 3,759 10 1.87 All Others 138,276 63.97 126,498 62.85
Total 216,167 100.00 % 201,278 100.00 %
Employers

STATISTICAL SECTION55
Operating Information
Participating EmployersUniversities and CollegesAbraham Baldwin Agricultural CollegeAlbany State UniversityArmstrong Atlantic State UniversityAtlanta Metropolitan CollegeAugusta State UniversityBainbridge CollegeClayton College and State UniversityCoastal College Columbus State UniversityDalton State CollegeDarton CollegeEast Georgia CollegeFort Valley State UniversityGainesville CollegeGeorgia College and State UniversityGeorgia Gwinnett College Georgia Highlands CollegeGeorgia Institute of TechnologyGeorgia Perimeter CollegeGeorgia Southern UniversityGeorgia Southwestern CollegeGeorgia State UniversityGordon CollegeKennesaw State UniversityMacon State CollegeMedical College of GeorgiaMiddle Georgia CollegeNorth Georgia College and State UniversitySavannah State UniversitySkidaway Institute of OceanographySouth Georgia CollegeSouthern Polytechnic State UniversityState University of West GeorgiaUniversity of GeorgiaValdosta State UniversityWaycross College
Boards of EducationAppling County Atkinson County Atlanta City Bacon County
Boards of Education cont.
Baker County Baldwin County Banks County Barrow County Bartow County Ben Hill CountyBerrien CountyBibb County Bleckley County Brantley County Bremen City Brooks County Bryan County Buford City Bulloch County Burke County Butts County Calhoun City Calhoun County Camden County Candler County Carroll County Carrollton City Cartersville City Catoosa County Charlton County Chatham CountyChattahoochee County Chattooga County Cherokee CountyChickamauga City Clarke County Clay County Clayton County Clinch County Cobb County Coffee County Colquitt County Columbia County Commerce City Cook County Coweta County Crawford County Crisp County
Dade County Dalton City Dawson County Decatur City Decatur County Dekalb County Dodge County Dooly CountyDougherty County Douglas County Dublin City Early County Echols County Effingham County Elbert County Emanuel County Evans County Fannin County Fayette County Floyd County Forsyth County Franklin County Fulton County Gainesville City Gilmer County Glascock County Glynn County Gordon County Grady County Greene County Griffin-Spalding County Gwinnett CountyHabersham County Hall County Hancock County Haralson County Harris County Hart County Heard CountyHenry CountyHouston CountyIrwin County Jackson CountyJasper County
Boards of Education cont.

STATISTICAL SECTION56
Operating Information
Jeff Davis County Jefferson CityJefferson County Jenkins County Johnson County Jones County Lamar County Lanier County Laurens County Lee CountyLiberty County Lumpkin County Macon County Madison County Marietta City Marion County McDuffie County McIntosh County Meriwether County Miller County Mitchell County Monroe County Montgomery County Morgan County Murray County Muscogee County Newton County Oconee County Oglethorpe County Paulding County Peach County Pelham City Pickens County Pierce County Pike County Polk School DistrictPulaski County Putnam County Quitman County Rabun County Randolph County Richmond County
Rockdale County Rome City Schley County Screven County Seminole County Social Circle City Stephens County Stewart County Sumter County Talbot County Taliaferro CountyTattnall County Taylor County Telfair County Terrell CountyThomas County Thomasville City Thomaston-Upson County Tift County Toombs County Towns County Treutlen County Trion City Troup County Turner County Twiggs County Union County Valdosta City Vidalia City Walker County Walton CountyWare County Warren County Washington County Wayne County Webster County Wheeler County White County Whitfield County Wilcox CountyWilkes County Wilkinson County Worth County
Boards of Education cont. Boards of Education cont.
Participating EmployersPublic LibrariesAthens Regional LibraryBarnesville-Lamar County LibraryBartow County LibraryBartram Trail Regional LibraryBrooks County LibraryCamden County LibraryChatsworth-Murray County LibraryChattooga County LibraryCherokee Regional LibraryChestatee Regional LibraryClayton County Regional LibraryCoastal Plains Regional LibraryCobb County Public LibraryConyers-Rockdale Library Coweta County Public LibraryDekalb County Public LibraryDesota Trail Regional LibraryDougherty County Public LibraryEast Central Georgia Regional LibraryElbert County Public LibraryFitzgerald-Ben Hill County Library Flint River Regional LibraryForsyth County Public LibraryGwinnett County Public LibraryHall County LibraryHart County LibraryHawkes LibraryHenry County LibraryHouston County Public LibraryJefferson County LibraryKinchafoonee Regional LibraryLake Blackshear Regional LibraryLee County Public LibraryLincoln County LibraryLive Oak Public LibraryM.E. Roden Memorial LibraryMary Vinson Memorial LibraryMiddle Georgia Regional LibraryMoultrie-Colquitt County LibraryMountain Regional LibraryNewton County LibraryNortheast Georgia Regional LibraryNorthwest Georgia Regional Library

Public LibrariesAthens Regional LibraryBarnesville-Lamar County LibraryBartow County LibraryBartram Trail Regional LibraryBrooks County LibraryCamden County LibraryChatsworth-Murray County LibraryChattooga County LibraryCherokee Regional LibraryChestatee Regional LibraryClayton County Regional LibraryCoastal Plains Regional LibraryCobb County Public LibraryConyers-Rockdale Library Coweta County Public LibraryDekalb County Public LibraryDesota Trail Regional LibraryDougherty County Public LibraryEast Central Georgia Regional LibraryElbert County Public LibraryFitzgerald-Ben Hill County Library Flint River Regional LibraryForsyth County Public LibraryGwinnett County Public LibraryHall County LibraryHart County LibraryHawkes LibraryHenry County LibraryHouston County Public LibraryJefferson County LibraryKinchafoonee Regional LibraryLake Blackshear Regional LibraryLee County Public LibraryLincoln County LibraryLive Oak Public LibraryM.E. Roden Memorial LibraryMary Vinson Memorial LibraryMiddle Georgia Regional LibraryMoultrie-Colquitt County LibraryMountain Regional LibraryNewton County LibraryNortheast Georgia Regional LibraryNorthwest Georgia Regional Library
STATISTICAL SECTION57
Operating Information
Ocmulgee Regional LibraryOconee Regional LibraryOhoopee Regional LibraryOkefenokee Regional LibraryPeach Public LibraryPiedmont Regional LibraryPine Mountain Regional LibraryRoddenberry Memorial LibrarySara Hightower Regional LibrarySatilla Regional LibraryScreven-Jenkins Regional LibrarySequoyah Regional LibrarySouth Georgia Regional LibrarySouthwest Georgia Regional LibraryStatesboro Regional LibraryThomas County Public LibraryThree Rivers Regional LibraryTroup-Harris-Coweta Regional LibraryUncle Remus Regional LibraryWarren County Public LibraryWest Georgia Regional Library Worth County Library System
Technical CollegesAlbany Technical CollegeAltamaha Technical CollegeAthens Technical CollegeAtlanta Technical CollegeAugusta Technical CollegeCentral Georgia Technical CollegeChattahoochee Technical CollegeColumbus Technical CollegeDekalb Technical CollegeGeorgia Northwestern Technical CollegeGwinnett Technical CollegeHeart of Georgia Technical CollegeLanier Technical CollegeMiddle Georgia Technical CollegeMoultrie Technical CollegeNorth Georgia Technical CollegeOgeechee Technical College
Public Libraries continued
Participating Employers
Okefenokee Technical CollegeSandersville Technical CollegeSavannah Technical CollegeSouth Georgia Technical CollegeSoutheastern Technical College Southern Crescent Technical CollegeSouthwest Georgia Technical CollegeWest Georgia Technical College Wiregrass Georgia Technical College
Regional Educational Service AgenciesCentral Savannah River Area RESAChattahoochee Flint RESA Coastal Plains RESA First District RESAGriffin RESA Heart of Georgia RESAMetro RESAMiddle Georgia RESANorth Georgia RESA Northeast Georgia RESANorthwest Georgia RESAOconee RESAOkefenokee RESAPioneer RESASouthwest Georgia RESAWest Georgia RESA
Charter SchoolsAcademy of Lithonia Charter Academy of Mableton Academy of Smyrna Charter Amana AcademyAtlanta Heights Charter School Atlanta Preparatory AcademyBaconton Community Charter School Brighten Academy Challenge Charter Academy Chancellor Beacon Academy Charles Drew Charter School
Technical Colleges continued

STATISTICAL SECTION58
Operating Information
Charter Conservatory for Liberal Arts and Technology, Inc.Coweta Academy CharterDekalb Academy of TechnologyDekalb Path AcademyFulton Leadership AcademyFulton Science Academy HighFulton Science Academy Charter SchoolFulton Sunshine AcademyGeorgia Magnet Charter SchoolImagine Wesley International AcademyInternational Community Charter SchoolIvy Preparatory AcademyKennesaw Charter ScienceKidspeace National CentersKipp Metro Atlanta CollaborateKipp South Fulton AcademyLeadership Preparatory AcademyLewis Academy of ExcellenceMain Street AcademyMarietta Charter SchoolMountain Education CenterMuseum School of AvondaleNeighborhood Charter SchoolNew Life Academy of ExcellenceOdyssey Charter SchoolPataula Charter AcademyPeachtree Hope CharterScholars Academy Inc.Southeast Atlanta Charter SchoolsT.E.A.C.H. Charter SchoolTech High SchoolThe Kindezi SchoolUniversity Community Academy
State AgenciesCooperative Extension ServiceDepartment of Behavioral HealthDepartment of Community HealthDepartment of CorrectionsDepartment of Human Resources Department of Juvenile Justice
Participating EmployersCharter Schools cont.
Department of Natural ResourcesDepartment of Public SafetyGeorgia Department of Driver ServicesGeorgia Department of Economic DevelopmentGeorgia Department of AgricultureGeorgia Department of AuditsGeorgia Department of Early Care and LearningGeorgia Department of EducationGeorgia Department of LaborGeorgia General AssemblyGeorgia Public Defender CouncilGeorgia Public TelecommunicationsGeorgia Student Finance CommitteeOffice of Planning and BudgetSecretary of StateState Accounting OfficeTechnical College System of Georgia
Other Baldwin County Board of HealthBoard of RegentsCherokee County Board of HealthDekalb County DFCSEffingham County Tax OfficeGeorgia Association of EducatorsGeorgia Military CollegeGlynn County Health DepartmentHenry County Health DepartmentLowndes County DFACSMitchell Baker ServicesWare County Health Department
State Agencies cont.


Two Northside 75, Suite 100Atlanta, GA 30318
(404) 352-6500 or (800) 352-0650 www.trsga.com