comprehensive annual financial report
TRANSCRIPT

EMPLOYEES’ RETIREMENT SYSTEM
OF THE STATE OF HAWAII
COMPREHENSIVE ANNUAL
FINANCIAL REPORT FOR THE FISCAL YEAR ENDED JUNE 30, 2004

EMPLOYEES’ RETIREMENT SYSTEM
OF THE STATE OF HAWAII
COMPREHENSIVE
ANNUAL FINANCIAL REPORT
FOR THE FISCAL YEAR ENDED JUNE 30, 2004
Prepared by the Staff of the: Employees' Retirement System of the State of Hawaii
201 Merchant Street, Suite 1400 Honolulu, Hawaii 96813
(808) 586-1735 • (808) 586-1650 Facsimile (808) 586-1677 • http://www2.hawaii.gov/ers/
DAVID Y. SHIMABUKURO, Administrator WESLEY K. MACHIDA, Assistant Administrator T. KIMO BLAISDELL, Chief Investment Officer

Table of Contents
INTRODUCTORY SECTION Certificate of Achievement 4 Letter from the Chair 5 Letter of Transmittal 6 Board of Trustees 11 Organizational Structure 12 Plan Summary 13 Summary of Retirement Benefit Plan Provisions 14 Retirement Options 18 Legislative Highlights 2004 20 FINANCIAL SECTION Independent Auditors’ Report 22 Management’s Discussion and Analysis 24 Financial Statements Combining Statements of Plan Net Assets — All Trust and Agency Funds 30 Statements of Changes in Plan Net Assets All Trust Funds 32 Notes to Financial Statements 33 Required Supplementary Information Schedule of Funding Progress 46 Schedule of Employer Contribution 46 Note to Required Supplementary Information 47 Supplementary Information Schedule 1 – Combining Schedules of Changes in Plan Net Assets – All Trust Funds 48 Schedule 2 - Social Security Contribution Fund, Statements of Changes in Assets and Liabilities 50 Schedule 3 – Schedules of Administrative Expenses 51 Schedule 4 – Schedule of Investment Expenses 52 INVESTMENT SECTION Letter from Chief Investment Officer 55 Letter from Investment Consultant 57 Report on Investment Activity by Investment Consultant Outline of Investment Policies 59 Investment Results 61 Asset Allocation 62 Investment Professionals 63 List of Largest Assets Directly Held 64 Investments Summary 65 Schedule of Investment Fees 65 Schedule of Broker Commissions 66
ACTUARIAL SECTION Letter from the Actuary 68 Executive Summary 72 Actuarial Certification Statement 73 Summary of 2004 Actuarial Valuation Exhibit 1 – Development of Employer Cost 74 Exhibit 2 – Actuarial Present Value of Future Benefits 75 Exhibit 3 – Analysis of Normal Cost 76 Exhibit 4 – Development of Actuarial Value of Assets 77 Exhibit 5 – Total Experience Gain or Loss 78 Exhibit 6 – Investment Experience Gain or Loss 79 Exhibit 7 – Employer Appropriations to Pension Accumulation Fund 80 Exhibit 8 – Highlights of Last Five Annual Actuarial Valuations 81 Summary of Actuarial Assumptions and Methods 82 Summary of Plan Changes 88 Ten Year Actuarial Schedules, 1995 to 2004 Retirement System Membership 90 Membership Data, March 31, 2004 91 Historical Summary of Active Member Data 91 Pensioners, Average Annual Pension, and Active Member/Pensioner Comparison 92 Number of Retirants and Beneficiaries 92 Solvency Test 93 Employer Contribution Rates as Percentage of Payroll 94 Employer Appropriations to Pension Accumulation Fund, Appropriation Years 1997-1998 to 2006-2007 95 State Retirement Systems' Funded Ratios 96 STATISTICAL SECTION Participating Employers and Active Members 98 Revenues by Source 98 Expenses by Type 99 Benefit Payments by Type 99 Average Monthly Service Pension by Year of Credited Services 100 Benefit Payments by Retirement Type and Option 101

EMPLOYEES’ RETIREMENT SYSTEM
OF THE STATE OF HAWAII
INTRODUCTORY SECTION

4 Introductory Section _______________________________________________________ Certificate of Acheivement
_________________________________________________________________________________ Employees’ Retirement System of the State of Hawaii

____________________________________________________ Introductory Section 5 Letter from the Chair
City Financial Tower • 201 Merchant Street, Suite 1400 • Honolulu, Hawaii 96813-2980
Telephone (808) 586-1735 • Fax (808) 586-1677 • http://www2.hawaii.gov/ers Comprehensive Annual Financial Report 2004
LINDA LINGLE
GOVERNOR
STATE OF HAWAII EMPLOYEES’ RETIREMENT SYSTEM
December 13, 2004 Honorable Linda Lingle Governor, State of Hawaii Honolulu, Hawaii 96813 Dear Governor Lingle: It is my pleasure to submit the Employees’ Retirement System’s (ERS) Comprehensive Annual Financial Report for the fiscal year ended June 30, 2004. This report provides information on the financial status of the ERS and highlights significant changes that occurred during the past fiscal year. We are pleased to report that the ERS’ investment portfolio earned 15.8% for the fiscal year ended June 30, 2004. While we are encouraged by the positive results, the actuarial funded ratio decreased to 71.7% during the past fiscal year. This is the result of a four-year “smoothing” method used by our actuary to determining the unfunded liability and includes the effect of unfavorable investment returns in FY 2001 and FY 2002. During the past year, Board members, staff and consultants worked diligently with your administration and legislature to establish a new hybrid contributory retirement plan effective July 1, 2006 that improves retirement benefits for our members at no additional cost to the employers To help stabilize the employer contribution payments going forward, legislation was enacted to change the financing objectives to a fixed percentage of payroll methodology, effective July 1, 2005. The current methodology has resulted in significant year-to-year changes in the contribution requirements in periods of volatile investment returns. The new method will provide employers with a more predictable budget and the ERS with a more predictable cash flow. On behalf of the Board of Trustees, I would like to thank the dedicated staff, investment managers, consultants and the many others who have worked so diligently to assure the successful operation of the ERS. Respectfully submitted,
Jackie Ferguson-Miyamoto, Chair Board of Trustees

6 Introductory Section _______________________________________________________ Letter of Transmittal
City Financial Tower • 201 Merchant Street, Suite 1400 • Honolulu, Hawaii 96813-2980
Telephone (808) 586-1735 • Fax (808) 586-1677 • http://www2.hawaii.gov/ers
_________________________________________________________________________________ Employees’ Retirement System of the State of Hawaii
LINDA LINGLE
GOVERNOR
STATE OF HAWAII EMPLOYEES’ RETIREMENT SYSTEM
December 13, 2004 Board of Trustees Employees’ Retirement System of the State of Hawaii Ladies and Gentlemen: We are pleased to submit to you the Comprehensive Annual Financial Report (CAFR) of the Employees’ Retirement System of the State of Hawaii (ERS) for the fiscal year ended June 30, 2004. The report is a complete review of the financial, investment and actuarial conditions of the programs administered by the ERS. Responsibility for both the accuracy of the data, as well as the completeness and fairness of the presentation, rests with the management of the ERS. STRUCTURE OF REPORT This report complies with generally accepted accounting principles as established by the Government Accounting Standards Board (GASB), including the financial reporting model established by GASB Statement 34 Basic Financial Statements – and Management’s Discussion and Analysis – for State and Local Governments. This report is divided into five sections:
(1) Introductory - includes transmittal letters, the ERS’ organizational structure, a summary of benefit provisions and retirement options, and recent legislation affecting the ERS;
(2) Financial - contains the report of independent auditors, management’s discussion and analysis regarding the operations, the audited financial statements of the ERS, required supplementary information and supplemental financial schedules;
(3) Investment - includes reports of investment activity, investment policies, investment results, and various other investment schedules;
(4) Actuarial - contains the report of the independent actuary, the results of the annual actuarial valuation, and supporting schedules; and
(5) Statistical – which contains information regarding ERS’ participants and finances. BACKGROUND The ERS was established by the Legislature in 1925 to provide retirement, disability and survivor benefits for State and county employees including teachers, professors, police officers, firefighters, judiciary employees, judges, and elected officials. The ERS is a qualified defined benefit public pension plan covered under Section 401(a) of the Internal Revenue Code. Hawaii Revised Statutes Chapter 88 contains

____________________________________________________ Introductory Section 7 Letter of Transmittal (continued)
Comprehensive Annual Financial Report 2004
the actual language governing the pension trust. The plan covers all full-time State and county employees in the State of Hawaii. The ERS is funded on an actuarial reserve basis. Benefit funding comes from employer and member contributions and investment earnings. On March 31, 2004, the ERS’ total membership of 99,371 was comprised of 62,573 active members, 4,501 inactive vested members, and 32,297 retirees and beneficiaries. This represents a 1.6% growth in the total membership over the past year. The number of retirees and beneficiaries had the largest net increase while the number of active members remained fairly constant. Participating employers include the State of Hawaii, City and County of Honolulu and the Counties of Hawaii, Maui and Kauai. The ERS is also responsible for the custody of the Social Security Contribution Fund for the State of Hawaii. This fund receives and invests the State’s employer share of Social Security taxes, and makes payment to the Internal Revenue Service. The Social Security contributions withheld from employees are remitted directly to the IRS by the State. As an agency type fund that is custodial in nature, the ERS has limited discretion in the management of this fund. MAJOR ACCOMPLISHMENTS AND INITIATIVES IN 2004 One of the major accomplishments during the past year was the enactment of legislation to create a new hybrid defined benefit contributory retirement plan which will become effective in July 2006. The new plan is the result of a comprehensive study by the Board to determine the feasibility of allowing current noncontributory plan members to return to a defined benefit contributory plan at no additional cost to the State and county governments. Under the provisions of Act 179/2004, approximately 55,000 noncontributory and certain contributory plan members who are in active service on June 30, 2006, will be given the opportunity to switch to the new plan. Generally, all new members enrolled after June 30, 2006 would be covered by the new hybrid plan. Another legislative measure, Act 181/2004, changes the methodology used to calculate employer contributions to the ERS. The new funding methodology will be based on a percentage of payrolls, and requires employer contributions to the ERS to be paid currently instead of on a 3-year lag. It also smoothes out the huge swings in the employers’ annual contributions and reduces ERS’ investment risks. The new law will strengthen the ERS and help ensure that sufficient funds will be available to pay benefits promised to current and future retirees. The legislature provided funds for the design and installation of a new computer and office automation system that will improve operational efficiencies, but more importantly, provide improved service to members. The design and installation of all systems is expected to be completed in FY 2008. Legislative proposals to increase noncontributory service-connected disability benefits and bring parity between the various retirement plans were also approved. New actuarial retirement factors were adopted by the Board to reflect members’ longer life expectancies and are age-specific instead of using five-year age groupings. A “pop up” feature for the joint survivor retirement options was also adopted. Currently, the joint survivor options provide a lifetime-reduced pension for the retiree and a continuing monthly benefit for the beneficiary when the retiree dies. If the beneficiary dies before the retiree, the same reduced pension continues to the retiree. With the “pop up” feature, the retiree’s reduced pension “pops up” to the corresponding maximum allowance if the beneficiary passes away before the retiree. These changes go into effect on December 1, 2004, and are generally expected to have a favorable impact on members’ retirement benefits.

8 Introductory Section _______________________________________________________ Letter of Transmittal (continued)
_________________________________________________________________________________ Employees’ Retirement System of the State of Hawaii
In September 2003, the ERS rolled out two contributory plan calculators on its website to enable members to estimate their future pension benefits. The ERS continuously adds pertinent information including forms and applications to the website which enables members to obtain information without having to call or come to the ERS’ offices. In February 2004, the ERS completed a 7-month project to convert 14 subsystems off an obsolete Wang computer system to new IBM hardware. Computer processing time has improved significantly and the conversion reduced the risk of being unable to process pension payments to 32,000 retirees and beneficiaries. In April 2004, an automated information services system was installed to provide automated telephone service to members and improve routing of incoming calls. A Deferred Retirement Option Plan (DROP) study was also completed in FY 2004. The study was conducted in response to House Concurrent Resolution 109. ACHIEVEMENT AWARDS The Government Finance Officers Association of the United States and Canada awarded a Certificate of Achievement for Excellence in Financial Reporting to the Employees’ Retirement System of the State of Hawaii for its comprehensive annual financial report for the year ended June 30, 2003. In order to be awarded the Certificate of Achievement, a government unit must publish an easily readable and efficiently organized comprehensive annual financial report. This report must satisfy both generally accepted accounting principles and applicable legal requirements. A Certificate of Achievement is valid for only one year. We believe our current report continues to meet the Certificate of Achievement Program requirements and we are submitting it to the GFOA to determine its eligibility for another certificate.
FINANCIAL INFORMATION Please refer to Management’s Discussion and Analysis in the Financial Section for condensed financial information and activities of the current and prior fiscal years. We encourage you to read it in conjunction with this letter and the financial statements and notes for a better understanding of the ERS.
ACCOUNTING SYSTEM AND REPORTS The accrual basis of accounting is used in recording financial transactions. Expenses are recorded when the liability is incurred, and revenues are recorded in the accounting period in which they are earned and become measurable. Interest earned is accrued on a monthly basis. Accounts receivable at year-end, in addition to accrued interest receivable, reflect accrued employer charges and investment proceeds due on sales that have not yet settled. Investments are recorded at fair value. Fixed assets are recorded at cost less accumulated depreciation. The Notes to the Financial Statements (Notes) contain additional detailed information on the statutory provisions under which the ERS operates. In addition, the Notes include a summary of significant accounting policies, and provide explanatory information to help readers better understand the data contained in the financial statements.

____________________________________________________ Introductory Section 9 Letter of Transmittal (continued)
Comprehensive Annual Financial Report 2004
The management of the ERS is responsible for and has implemented systems of internal accounting controls designed to provide reasonable assurances for the safeguarding of assets and the reliability of financial records. We believe that the internal accounting controls currently in place are adequate to meet the purpose for which they were intended. To the best of our knowledge and belief, the enclosed data, including the financial statements, supporting schedules and statistical tables is accurate in all material respects and is reported in a manner that fairly presents the financial position and results of the ERS’ operations. INVESTMENT ACTIVITIES The Board of Trustees has diversified the ERS' investment portfolio to secure consistent, positive long-term investment returns while preserving capital. The diversification of investments through a long-term asset allocation strategy is generally regarded as the most important decision made in the investment process. A summary of the ERS’ long-term asset allocation strategy can be found in the Investment Section of this report, in addition to a report by our Chief Investment Officer and investment consultant. Professional investment managers have been retained to execute the Board's investment strategies and have full discretion within statutory provisions, Board policies and their respective guidelines. The investment managers retained by the Board as of June 30, 2004 are listed in the Investment Section. Investment income, including dividends, interest, other investment earnings, and gains/losses on the sale of investments, is a significant revenue source for the ERS, and totaled $1.2 billion for FY 2004, net of investment related expenses. This resulted in a 15.8% return on investments for the year, using time-weighted rate of return methodologies that are generally accepted by the Association for Investment Management and Research, and compared to 3.0% for FY 2003. FUNDING AND ACTUARIAL OVERVIEW The overall objective of the ERS is to accumulate sufficient funds to meet current and future retirement, disability and death benefit obligations to retirees and beneficiaries. The accumulated balance is referred to as the “net assets held in trust for pension benefits” in the audited financial statements in the Financial Section of this report. The actuarial accrued liability is disclosed in the required supplementary schedules following the notes to the financial statements. These schedules show the actuarial value of assets, which is based on a four-year smoothed valuation that recognizes the excess or shortfall of investment income over or under the actuarial assumed income of 8% over a four-year period. This is the value of assets used by the actuary each year to determine the employer contribution requirements to the ERS. The annual employer contributions are intended to be sufficient to pay the ERS’ normal cost and to amortize the ERS’s unfunded actuarial accrued liability by June 30, 2029. Member contribution rates are established by statute and discussed in note E to the financial statements. The actuarial accrued liability of the ERS is determined by the actuary. It is a measure of the present value of actuarial accrued liabilities estimated to be payable in the future to current retirees, beneficiaries, and employees for service earned to date. The ERS’ unfunded actuarial accrued liability increased to $3.5 billion from $2.9 billion on June 30, 2003. The unfunded actuarial accrued liability is primarily the result of unfavorable investment returns in FY 2001 and FY 2002, and the previous use of the ERS’ excess investment earnings to reduce State and county government contributions to the ERS.

10 Introductory Section _______________________________________________________ Letter of Transmittal (continued)
_________________________________________________________________________________ Employees’ Retirement System of the State of Hawaii
The percentage computed by dividing the actuarial value of net assets available for benefits by the actuarial accrued liability is generally referred to as the “funded ratio”. This ratio provides an indication of the funded status of the ERS on a going-concern basis and generally the greater the percentage, the stronger the pension trust. A higher level of funding gives the participants a greater degree of assurance that their pension benefits are secure. The funded status and progress for the ERS are presented in the Required Supplementary Information Schedules of Funding Progress. Although the ERS had a 15.8% investment return during the past year, the funded ratio on an actuarial basis decreased from 75.9% on June 30, 2003 to 71.7% on June 30, 2004. The decrease in the funded ratio is the result of the four-year smoothing effect of unfavorable investment returns in prior years. PROFESSIONAL SERVICES Professional consultants are appointed by the Board to perform professional services that are essential to the effective and efficient operation of the ERS. Opinions from the certified public accounting firm, KPMG LLP, and the actuary, Gabriel, Roeder, Smith & Company, are included in this report. Callan Associates Inc. is our investment consultant and their report on the ERS' investment program and performance results is also included in this report. ACKNOWLEDGEMENTS This report represents the dedicated collaborative efforts of the ERS staff and consultants to provide extensive and reliable information as a basis for making management decisions, determining compliance with legal provisions, and for determining responsible stewardship of the assets contributed by the ERS’ members and their employers. This report will be provided to legislators, State and county officials, and other interested parties. We would like to take this opportunity to express our gratitude to the Board of Trustees, the Staff, the advisors, and to the many people who work so diligently to help our members. Respectfully yours,
David Shimabukuro Administrator

____________________________________________________ Introductory Section 11 Board of Trustees
Comprehensive Annual Financial Report 2004
The Board of Trustees is the governing body of the Employees' Retirement System of the State of Hawaii, with certain areas of administrative control vested in the State Department of Budget and Finance. Four of the eight members on the Board are elected by the membership: two general employees, a teacher and a retiree. Three members are citizens of the State, one of whom is an officer of a bank authorized to do business in the State or a person of similar experience, who are not employees and are appointed by the Governor. The State Director of Finance is an ex-officio member by statute.
Back Row (L-R): Darwin J. Hamamoto; Henry F. Beerman; Jackie Ferguson-Miyamoto, Chair; Richard L. Humphreys, Vice Chair; Colbert M. Matsumoto. Front Row (L-R) Georgina K. Kawamura; Odetta U. Fujimori; Pilialoha E. Lee Loy.
Date Current Date Term Began Term Ends
Elected: Mr. Darwin J. Hamamoto ........................................... January 2, 2000 January 1, 2006 Ms. Jackie Ferguson-Miyamoto, Chair ....................... January 2, 2002 January 1, 2008 Ms. Odetta U. Fujimori ................................................ January 2, 2002 January 1, 2008 Ms. Pilialoha E. Lee Loy .......................................... January 2, 2004 January 1, 2010
Appointed: Mr. Richard (Rick) L. Humphreys, Vice Chair ........ May 10, 1999 January 1, 2005 Mr. Colbert M. Matsumoto ....................................... May 14, 2001 January 1, 2007 Mr. Henry F. Beerman .............................................. July 1, 2003 January 1, 2009
Ex-Officio: Ms. Georgina K. Kawamura ..................................... December 2, 2002

12 Introductory Section _______________________________________________________ Organizational Structure
_________________________________________________________________________________ Employees’ Retirement System of the State of Hawaii
Administrator David Y. Shimabukuro Assistant Administrator Wesley K. Machida Chief Investment Officer T. Kimo Blaisdell
Actuary Medical Board Gabriel, Roeder, Smith and Company Dr. Patricia L. Chinn, Chair
Dr. Gerald J. McKenna, Member Auditors Dr. Inam U.R. Rahman, Member
KPMG LLP
Legal Advisor Attorney General of Hawaii
** A list of investment professionals is located in the Investment Section of this CAFR.
Chief Investment Officer
Assistant Administrator
Mortgage Services
Enrollment Claims & Benefits Branch
Information Systems
Board of Trustees
Administrator
Accounting Branch
Staff Support Services

____________________________________________________ Introductory Section 13 Plan Summary
Comprehensive Annual Financial Report 2004
The Employees' Retirement System (ERS) of the State of Hawaii was established by the Legislature in 1925 to provide retirement, disability and survivor benefits for State employees, teachers, professors, county employees, police officers, firefighters, judges and elected officials. The ERS is a qualified defined benefit pension plan under Section 401(a) of the Internal Revenue Code. As such, the ERS is exempt from federal income taxation on its investment earnings. Since January 1, 1988, member contributions have been tax deferred under Section 414(h) of the Internal Revenue Code. Members are covered by the provisions of the Contributory or Noncontributory retirement plan. Those in the Contributory Plan are required to make contributions to the ERS and may also be covered by Social Security. Employees in the following occupational groups are required to be members of the Contributory Plan: police officers, firefighters, judges, elected officials, legislative officers, State and County department heads and deputies, attorney general investigators, and narcotics enforcement investigators. As of March 31, 2004, 9,466 active employees were enrolled in the Contributory Plan, or 15% of our active members. Members of the Noncontributory Plan do not make contributions to the ERS and may be covered by Social Security. The Noncontributory Plan covers most employees hired from July 1, 1984, as well as employees hired before that date who elected to join the plan. As of March 31, 2004, there were 53,107 active employees in the Noncontributory Plan of the total active members, which represents almost 85% of all active members. Since most new employees are required to become members of the Noncontributory Plan, these numbers will continue to increase until June 2006. The number of active members increased by only 281 members since last year, from 62,292 to 62,573. For the 57,853 All Other employee group of active members (excluding Police and Firefighters), 4,746 were Contributory members (8%) and 53,107 were Noncontributory members (92%). In July 2004, the Governor signed Act 179/2004 into law as passed by the State Legislature that establishes a Hybrid Contributory Plan which will become effective July 1, 2006. Members in the Hybrid Plan will be eligible for retirement at age 62 years with 5 years of credited service or age 55 and 30 years of credited service, and credit for unused sick leave is not eligible for determining service credits. Retirees will receive a benefit multiplier of 2% for each year credited service as an employee, with the benefit payment options similar to the current payment options of the Contributory Plan. Approximately 55,000 current members, all members of the Noncontributory Plan and certain members of the Contributory Plan, will be eligible to join the new Hybrid Plan. All new employees in certain job classes hired from July 1, 2006 will also be required to join the Hybrid Plan. Certain positions will still be required to join the current Contributory Plan. A summary of the general retirement benefits, including retirement options, for Contributory and Noncontributory members are on the following pages. For more detailed and current information on the Hybrid Plan please visit the ERS website at http://www2.hawaii.gov/ers/ or write to the ERS main office listed on the title page of the CAFR.

14 Introductory Section _______________________________________________________ Summary of Retirement Benefit Plan Provisions
_________________________________________________________________________________ Employees’ Retirement System of the State of Hawaii
Noncontributory Plan Contributory Plan
Employee Contributions No employee contributions 7.8% of salary
Normal Retirement Eligibility Age 62 and 10 years credited service
or Age 55 and 5 years credited service
Age 55 and 30 years credited service Benefit
1-1/4% of average final compensation times years of credited service (Average final compensation or AFC is an average of the highest salaries during any three years of credited service, excluding any salary paid in lieu of vacation or if ERS membership occurred prior to 1/1/71, AFC may be an average of the highest salaries during any five years of credited service including any salary paid in lieu of vacation.)
2% of average final compensation times years of credited service (Average final compensation or AFC is an average of the highest salaries during any three years of credited service, excluding any salary paid in lieu of vacation or if ERS membership occurred prior to 1/1/71, AFC may be an average of the highest salaries during any five years of credited service including any salary paid in lieu of vacation.)
Early Retirement
Eligibility Age 55 and 20 years credited service Any age and 25 years credited service
Benefit
Maximum allowance reduced 6% per year under age 62
Maximum allowance reduced 5% per year under age 55 plus 4% per year under age 50
Deferred Retirement Requirements
10 years credited service
5 years credited service and contributions left in the ERS
Benefit
Accrued maximum allowance payable at age 65
Accrued maximum allowance payable at age 55
Ordinary Disability Eligibility
10 years credited service
10 years credited service
Benefit
Accrued maximum allowance unreduced for age
1-3/4% AFC for each full year of credited service with a minimum of 30% AFC unreduced for age

____________________________________________________ Introductory Section 15 Summary of Retirement Benefit Plan Provisions (continued)
Comprehensive Annual Financial Report 2004
Noncontributory Plan
Contributory Plan
Service-Connected Disability (due to accident on the job) Eligibility
Any age or credited service
Any age or credited service
Benefit
35% of AFC unreduced for age for accidents on or after July 1, 2004 For accidents prior to July 1, 2004, accrued maximum allowance, but not less than 15% AFC unreduced for age
50% of AFC unreduced for age, and return of contributions for accidents on or after July 7, 1998. For accidents prior to July 7, 1998: Totally disabled: lifetime pension of 66-2/3% AFC plus annuity, unreduced for age.
or Occupationally disabled: same benefit (66-2/3% of AFC plus annuity) paid for 3 years and then pension is reduced to 33-1/3% AFC if not totally disabled, unreduced for age.
Ordinary Death Eligibility
Active employee at time of death with at least 10 years of credited service
Active employee at time of death with at least 1 year of service
Benefit
Surviving spouse/reciprocal beneficiary and dependent children receive a benefit equal to a percentage of member’s accrued maximum allowance unreduced for age or if member was eligible for retirement at the time of death, Option B (100% Joint and Survivor) benefit for surviving spouse/ reciprocal beneficiary and a percentage of member’s accrued maximum allowance unreduced for age for the dependent children
Return of member’s contributions and accrued interest plus a percentage of the salary earned in the 12 months preceding death or Option 2 (100% Joint and Survivor) benefit if member was eligible for retirement at the time of death and one beneficiary designated or Option 3 (50% Joint and Survivor) benefit if member was not eligible for retirement at the time of death, credited with 10 years of service, and one beneficiary designated
Service-Connected Death (due to accident on the job) Eligibility
Any age or service
Any age or service
Benefit
Surviving spouse/reciprocal beneficiary and dependent children receive pension equal to a percentage of member’s accrued maximum allowance, based on minimum accrued maximum allowance of 30% AFC
Return of member’s contributions, and accrued interest plus pension of 50% AFC to surviving spouse, dependent children or dependent parents

16 Introductory Section _______________________________________________________ Summary of Retirement Benefit Plan Provisions (continued)
_________________________________________________________________________________ Employees’ Retirement System of the State of Hawaii
The plan provisions summarized above apply to teachers and most State and County employees. Special provisions applicable to other groups of employees are outlined below:
A) Police officers, firefighters, investigators of the Department of the Prosecuting Attorney and the
Attorney General, and narcotic enforcement investigators, contribute 12.2% of their monthly salary to the ERS instead of 7.8%. These members may retire at age 55 with 5 years of credited service or at any age with 25 years of credited service and receive a retirement benefit of 2-1/2% of average final compensation (AFC) for each year of such service up to a maximum of 80% AFC, provided the last 5 years is credited service in any of these occupations.
B) Judges, elected officials, and legislative officers may retire at age 55 with at least 5 years of
credited service, or at any age with at least 10 years of credited service and receive a pension of 3-1/2% of AFC for each year of such service plus an annuity from their contributions allocable to the period of such service. This benefit cannot exceed 75% of the AFC. Judges hired after June 30, 1999 need 25 years of credited service in order to retire before age 55.
C) Sewer workers in specified classifications and water safety officers may retire at any age if they are
credited with 25 years of such service with the last 5 or more years in these occupations. D) Emergency medical technicians (EMT) may retire at any age if they are credited with 30 years of
such service with the last 5 or more years in these occupations effective June 30, 2003. The years of service to qualify for early retirement is gradually being reduced through June 30, 2008 when 25 years of EMT service will qualify these members for early retirement.
Post Retirement Benefit Each retiree's original retirement allowance is increased by 2.5% on each July 1 beginning the calendar year after retirement. This cumulative benefit is not compounded and increases each year by another 2.5% of the original retirement allowance without a ceiling (i.e., 2.5% of the original retirement allowance the first year, 5% the second year, 7.5% the third year, etc.). Taxation of Benefits All retirement benefits are subject to Federal income taxes but are exempt from Hawaii State income tax. Certain occupational (work related) disability benefits are exempt from Federal income taxes. Arrangements to initiate voluntary withholding of Federal income tax can be made at any time. The ERS also provides retirees with a 1099-R tax form on or before January 31 of each year. Additional Benefits Retirees, their spouses and dependent children under age 19 are eligible to receive life insurance, medical, dental, vision, and prescription drug coverage from the Employer-Union Health Benefits Trust Fund (EUTF) if they were hired before July 1, 1996, and retire with at least 10 years of credited service. If they were first hired after June 30, 1996, health benefits are available on a cost-sharing basis as long as the member retires with at least 10 years of service. A dependent of a retiree who is a full-time student at an accredited college, university or technical school and who is 19 through 23 years old is also eligible for coverage. A retiree with a hire date after July 1, 2001 will only receive coverage for him or herself.

____________________________________________________ Introductory Section 17 Summary of Retirement Benefit Plan Provisions (continued)
Comprehensive Annual Financial Report 2004
Unused sick leave is excluded from credited service in determining health benefit coverage. Retirees will be responsible for premiums in excess of the amount of employer contributions. Retirees and their spouses are also eligible to receive a reimbursement of the Medicare Part B medical insurance premium. More information is available on the EUTF's website at http://www.eutf.hawaii.gov . Applying for Retirement A service retirement application can be filed with the ERS 150 days but no less than 30 days prior to the effective date of retirement. Once the application has been filed, cancellation prior to the effective date of retirement is permitted; however, the law requires mandatory retirement upon the third application. Members residing on the neighbor islands may obtain retirement information and application forms at the following locations:
Hawaii District Office 101 Aupuni Street, Suite 203 Hilo, Hawaii 96720
Kauai District Office 3060 Eiwa Street, Room 302 Lihue, Hawaii 96766
Maui District Office 54 S. High Street, Room 218 Wailuku, Hawaii 96793
Counseling Service It is the policy of the ERS to render every possible service to its members; however, as thousands of inquiries are received and answered annually, in addition to the actual processing of claims and benefits, present staff and appropriations restrict this service to those members whose immediate welfare is dependent upon the prompt settlement of benefits. Members who are not planning immediate retirement but who are interested in their benefit status, should contact the ERS for the estimate worksheets that will enable them to do their own calculations. Members who are definite about retirement should contact the ERS to request formal retirement estimates. A retirement benefit calculator for members and other retirement information are also available on the ERS’ website at http://www2.hawaii.gov/ers/ .

18 Introductory Section _______________________________________________________ Retirement Options
_________________________________________________________________________________ Employees’ Retirement System of the State of Hawaii
CONTRIBUTORY PLAN Maximum Allowance: The member receives a lifetime maximum allowance and at death, the difference between the value of the member's contributions at the time of retirement and the retirement allowance paid prior to death is paid to the designated beneficiary(ies) or estate. Option One: The member receives a reduced lifetime allowance based on age and at death, the difference between the initial insurance reserve and the retirement allowance paid prior to death is paid to the designated beneficiary(ies) or estate. Option Two (100% Joint and Survivor): The member receives a reduced lifetime allowance based on ages of both the member and the sole beneficiary and at death; the same allowance is paid to the designated beneficiary for life. Should the designated beneficiary predecease the retiree, another beneficiary cannot be named and all payments will cease at the retiree's death. For retirements on or after December 1, 2004, should the beneficiary predecease the retiree, the retiree’s reduced pension “pops up” or increases to the corresponding Maximum Allowance instead of remaining at the reduced amount. Option Three (50% Joint and Survivor): This plan is similar to Option Two. The member receives a reduced lifetime allowance which is higher than Option Two and is based on ages of both the member and the sole beneficiary; however, at death one-half of the allowance is paid to the designated beneficiary for life. Like Option Two, should the designated beneficiary predecease the retiree, another beneficiary cannot be named and all payments will cease at the retiree's death. For retirements on or after December 1, 2004, should the beneficiary predecease the retiree, the retiree’s reduced pension “pops up” or increases to the corresponding Maximum Allowance instead of remaining at the reduced amount. Option Four: This option allows the member to devise a plan that will provide a benefit according to the member's specifications. It requires certification by the Actuary and approval of the Board of Trustees. The following Option Four plans have been approved: Combination of Options Five and Maximum Allowance: The member receives a reduced lifetime allowance and is allowed to withdraw the pre-1987 nontaxable contributions, 50% of accumulated contributions, or 75% of accumulated contributions; at death, the difference between the value of the member's contributions at the time of retirement and the retirement allowance paid prior to death is paid to the designated beneficiary(ies) or estate. Combination of Options Five and One: The member receives a reduced lifetime allowance and is allowed to withdraw the pre-1987 nontaxable contributions, 50% of accumulated contributions, or 75% of accumulated contributions; at death, the difference between the initial insurance reserve and the retirement allowance paid prior to death is paid to the designated beneficiary(ies) or estate. Combination of Options Five and Two: The member receives a reduced lifetime allowance based on ages of both the member and the sole beneficiary, and is allowed to withdraw the pre-1987 nontaxable contributions, 50% of accumulated contributions, or 75% of accumulated contributions; at death, the same allowance is paid to the designated beneficiary for life. As in the case of Option Two, should the designated beneficiary predecease the retiree, another beneficiary cannot be named and all payments will cease at the retiree's death. For retirements on or after December 1, 2004, should the beneficiary predecease the retiree, the retiree’s reduced pension “pops up” or increases to the corresponding Maximum Allowance instead of remaining at the reduced amount.

____________________________________________________ Introductory Section 19 Retirement Options (continued)
Comprehensive Annual Financial Report 2004
CONTRIBUTORY PLAN (continued) Combination of Options Five and Three: The member receives a reduced lifetime allowance based on ages of both the member and the sole beneficiary, and is allowed to withdraw the pre-1987 nontaxable contributions, 50% of accumulated contributions, or 75% of accumulated contributions; at death, one-half of the allowance is paid to the designated beneficiary for life. As in the case of Option Three, should the designated beneficiary predecease the retiree, another beneficiary cannot be named and all payments will cease at the retiree's death. For retirements on or after December 1, 2004, should the beneficiary predecease the retiree, the retiree’s reduced pension “pops up” or increases to the corresponding Maximum Allowance instead of remaining at the reduced amount. Option Five: The member receives a reduced lifetime allowance and is allowed to withdraw all accumulated contributions; at death, the prorated amount from the last pension payment through the date of death is payable to the beneficiary(ies) or estate. Option Four and Option Five are restricted to those members with at least ten years of credited service excluding unused sick leave credit. Regardless of the option selected, should death of a Contributory member occur during the first year of retirement, the designated beneficiary may elect to receive benefits as if death had occurred immediately prior to retirement in lieu of the death benefits described above. NONCONTRIBUTORY PLAN Maximum Allowance: The member receives a lifetime pension and at death, the prorated amount from the last pension payment through the date of death is payable to the beneficiary(ies) or estate. Option A (50% Joint and Survivor): The member receives a reduced lifetime pension and at death, one-half of the pension is paid to the sole designated beneficiary for life. Should the designated beneficiary predecease the retiree, another beneficiary cannot be named and all payments will cease upon the retiree's death. For retirements on or after December 1, 2004, should the beneficiary predecease the retiree, the retiree’s reduced pension “pops up” or increases to the corresponding Maximum Allowance instead of remaining at the reduced amount. Option B (100% Joint and Survivor): The member receives a reduced lifetime pension and at death, the same pension is paid to the sole designated beneficiary for life. Like Option A, should the designated beneficiary predecease the retiree, another beneficiary cannot be named and all payments will cease upon the retiree's death. For retirements on or after December 1, 2004, should the beneficiary predecease the retiree, the retiree’s reduced pension “pops up” or increases to the corresponding Maximum Allowance instead of remaining at the reduced amount. Option C (Ten-Year Guarantee): The member receives a reduced lifetime pension. Should death occur within ten years of retirement, the same pension will be paid to the designated beneficiary for the balance of the ten-year period. Should the designated beneficiary predecease the retiree, another beneficiary can be named. Effective for retiree deaths on or after July 1, 2004 regardless of the Noncontributory Option selected, should death occur during the first year of retirement, the designated beneficiary may elect to receive benefits as if death had occurred immediately prior to retirement in lieu of the death benefits described above.

20 Introductory Section _______________________________________________________ Legislative Highlights 2004
_________________________________________________________________________________ Employees’ Retirement System of the State of Hawaii
The following Acts, sponsored by the ERS or other agencies or parties, were passed by the 2004 Legislature and approved by the Governor:
Act 176 — East West Center • Gives certain East West Center employees the option to enroll in the Medicare program.
Act 177 — Police Officer Disability • Allows police officers with 10 years of service who are medically disqualified by the employer's
physician due to a service-connected disability, to retain the 2.5% benefit formula for each year of police officer service.
• Enables police officers to work in another position in the Contributory Plan and retire on a split formula.
Act 179 — Retirement Plan Changes • Establishes the new Hybrid Contributory Plan which will become effective on July 1, 2006. • Provides "pop-up" benefit feature on joint survivor options for those retiring after November 30,
2004. • Increases Noncontributory Plan service-connected disability retirement benefit from 15% to 35%
of a member's average final compensation. • Allows ordinary death benefits to be paid to the designated beneficiary if a member files for
retirement but dies prior to the retirement date. • Allows Noncontributory Plan retiree's beneficiary to select the active death benefit if the retiree
dies within one year of the retirement date. This "look back" feature is already available to Contributory Plan retirees.
Act 180 — University of Hawaii Optional Retirement System • Allows the implementation of the Optional Retirement System (ORS) by the UH for faculty and
certain administrative, professional and technical employees hired after the implementation of ORS.
• Fixes the State's contribution rate at 6% of employee's salary up to $100,000. • Defines ORS service as non-creditable for ERS purposes. • July 1, 2009 sunset date.
Act 181 — Employer Funding Methodology • State and county government employer contributions to the ERS to be based on a percentage of
payroll beginning July 1, 2005. The use of a fixed percentage of payroll provides employers with more predictable and consistent budgetary requirements and also reduces ERS' investment risk.
Act 182 — Federal Tax Compliance • Amends ERS statutes to comply with Federal tax qualification requirements. • Gives Board of Trustees expedited rule-making authority to adopt rules to comply with IRS tax
law changes.
Act 183 — Federal Tax Compliance • Amends ERS statutes to comply with Federal tax limits on compensation that can be used to
calculate a member's retirement benefit retroactive to July 1, 1996. • Establishes a nonqualified plan for members who exceeded IRS ceilings up to June 30, 2004.

EMPLOYEES’ RETIREMENT SYSTEM
OF THE STATE OF HAWAII
FINANCIAL SECTION

KPMG LLP, a U.S. limited liability partnership, is the U.S. member firm of KPMG International, a Swiss cooperative.
KPMG LLP P.O. Box 4150 Honolulu, HI 96812-4150
22 Financial Section _______________________________________________________ Independent Auditors’ Report
__________________________________________________________________________________ Employees’ Retirement System of the State of Hawaii
Independent Auditors’ Report Board of Trustees Employees’ Retirement System of the State of Hawaii: We have audited the accompanying combining statement of plan net assets – all trust and agency funds of the Employees’ Retirement System of the State of Hawaii (the ERS) as of June 30, 2004, and the related statement of changes in plan net assets – all trust funds for the year then ended. These financial statements are the responsibility of the ERS’ management. Our responsibility is to express an opinion on these financial statements based on our audit. The financial statements of the ERS as of and for the year ended June 30, 2003, were audited by other auditors whose report thereon dated October 25, 2003, expressed an unqualified opinion on those statements. We conducted our audit in accordance with auditing standards generally accepted in the United States of America and the standards applicable to financial audits contained in Government Auditing Standards, issued by the Comptroller General of the United States. Those standards require that we plan and perform the audit to obtain reasonable assurance about whether the financial statements are free of material misstatement. An audit includes examining, on a test basis, evidence supporting the amounts and disclosures in the financial statements. An audit also includes assessing the accounting principles used and significant estimates made by management, as well as evaluating the overall financial statement presentation. We believe that our audit provides a reasonable basis for our opinion. In our opinion, the 2004 financial statements referred to above present fairly, in all material respects, the plan net assets of the ERS as of June 30, 2004, and its changes in plan net assets for the year then ended in conformity with accounting principles generally accepted in the United States of America.

______________________________________________________ Financial Section 23 Independent Auditors’ Report (continued)
Comprehensive Annual Financial Report 2004
Board of Trustees Employees’ Retirement System of the State of Hawaii
In accordance with Government Auditing Standards, we have also issued our report dated October 15, 2004, on our consideration of the ERS’ internal control over financial reporting and on our tests of its compliance with certain provisions of laws, regulations, contracts, and grant agreements and other matters. The purpose of that report is to describe the scope of our testing of internal control over financial reporting and compliance and the results of that testing, and not to provide an opinion on the internal control over financial reporting or on compliance. That report is an integral part of an audit performed in accordance with Government Auditing Standards and should be considered in assessing the results of our audit. The management’s discussion and analysis on pages 24 through 29 and the schedules of funding progress and employer contributions on pages 46 and 47 are not a required part of the basic financial statements, but are supplementary information required by accounting principles generally accepted in the United States of America. We have applied certain limited procedures, which consisted principally of inquiries of management regarding the methods of measurement and presentation of the required supplementary information. However, we did not audit the information and express no opinion on it. Our audit for the year ended June 30, 2004, was conducted for the purpose of forming an opinion on the basic financial statements of the ERS taken as a whole. The supplementary information included in schedules 1 through 4 for the year ended June 30, 2004, is presented for purposes of additional analysis and is not a required part of the basic financial statements. Such information has been subjected to the auditing procedures applied in our audit of the basic financial statements and, in our opinion, is fairly stated, in all material respects in relation to the basic financial statements taken as whole for the year ended June 30, 2004. The report of the other auditors referred to above, dated October 25, 2003, stated that the supplementary information included in schedules 1 through 4 for the year ended June 30, 2003, was subjected to auditing procedures applied in their audit of the 2003 basic financial statements and, in their opinion, was fairly stated in all material respects in relation to the basic financial statements for the year ended June 30, 2003, taken as a whole. The introductory, investment, actuarial, and statistical sections have not been subjected to the auditing procedures applied in the audit of the basic financial statements and, accordingly, we express no opinion on them.
Honolulu, Hawaii October 15, 2004

24 Financial Section _______________________________________________________ Management’s Discussion and Analysis
_________________________________________________________________________________ Employees’ Retirement System of the State of Hawaii
Management’s Discussion and Analysis (MD&A) of the Employees’ Retirement System of the State of Hawaii (the ERS) provides highlights and comparisons of the financial position and performance of ERS as of and for the years ended June 30, 2004 and 2003. The MD&A is presented as a narrative overview and analysis in conjunction with the Letter of Transmittal, which is included in the Introductory Section of the ERS Comprehensive Annual Financial Report (CAFR). For more detailed information pertaining to the ERS’ financial activities, the reader should also review the actual financial statements, including the notes and supplementary schedules. Overview of the Financial Statements The ERS is responsible for administering a defined benefit pension plan for state, local government and public education employees in the State of Hawaii (the State). The ERS also oversees short-term investment of the federal Social Security employer contributions for the State in the Social Security Contribution Fund (Contribution Fund). The ERS financial statements include fiduciary type funds that are used to account for resources held for the benefit of parties outside of the ERS. The primary fund is defined as a pension trust fund as these assets are held for the benefit of its members and their beneficiaries for the payment of pension benefits, while the Contribution Fund is an agency type fund that is custodial in nature. Throughout this discussion and analysis units of measure (i.e. billions, millions, and thousands) are approximate, being rounded up or down to the nearest tenth of the respective unit value. This discussion and analysis is intended to serve as an introduction to the ERS financial reporting which is comprised of the following components:
• The statements of plan net assets provide a snapshot of the financial position of the ERS at June 30, 2004 and 2003. These financial statements reflect the resources available to pay benefits to members, including retirees and beneficiaries, at the end of the fiscal years reported.
• The statements of changes in plan net assets summarize the ERS’ financial activities that occurred during the fiscal period from July 1, 2003 to June 30, 2004 (FY 2004), and the fiscal year from July 1, 2002 to June 30, 2003 (FY 2003). The financial statements measure the changes in the resources available to pay pension benefits to members, retirees and beneficiaries for fiscal years 2004 and 2003.
• The notes to financial statements provide additional information that is essential to a full understanding of the financial statements. The notes are an integral part of the financial statements and include detailed information that is essential to a full understanding of the data provided in the basic financial statements.
• The required supplementary information immediately following the notes to financial statements provides two schedules showing historical actuarial information concerning the funded status of the ERS and the employer contributions, with related notes.
• The remaining supplementary information provides additional detailed information concerning the changes in operating funds established by legislation, and the operating and investment related expenses of the ERS.

______________________________________________________ Financial Section 25 Management’s Discussion and Analysis (continued)
Comprehensive Annual Financial Report 2004
Financial Highlights
• The plan net assets of the ERS increased by over 11.4% during the fiscal year ended June 30, 2004 to $8.6 billion, from $7.7 billion as of June 30, 2003, after experiencing a decrease of 2.8% during fiscal year ended June 30, 2003. Net assets at June 30, 2002 totaled $7.9 billion. The increase was primarily due to the improved investment earnings of 15.8% in FY 2004 compared to 3.0% return in FY 2003 and a 5.5% loss in FY 2002.
• No significant legislation was enacted during the 2004 or 2003 legislative sessions that had a material impact on the financial position of the Fund. See the “Legislative Highlights 2004” in the Introductory Section of the CAFR for a summary of the 2004 legislative changes that affect the ERS and its membership. There is also a summary of significant legislation impacting the ERS in the “Summary of Plan Changes” located in the Actuarial Section of the CAFR.
• The actuarial funded ratio as of June 30, 2004 decreased to 71.7% from 75.9% as of June 30, 2003, and 84.0% as of June 30, 2002. The decrease in the funded ratio of the ERS was primarily the result of the four-year smoothing effect of unfavorable investment returns from fiscal years prior to FY 2004 on an actuarial basis, that were less than the 8.0% expected investment returns. The unrecognized actuarial losses will be recognized over the next two actuarial valuations as discussed below. Refer to the actuarial section in the ERS’ 2004 and 2003 CAFR for more information.
• Total employee and employer contributions received increased by almost $43 million, or 17.4%, during the FY 2004 due primarily from an increase in the employer contributions. In FY 2003 there was an increase of almost $25 million, or 11.2%, from the prior year. The employer contributions were based on the actuarial valuations as of June 30, 2001, 2000, and 1999. Employee contributions decreased in FY 2004 for first time in several years with the continued decline in active contributory members due to retirements. Since 1984, most new members of the ERS are required to be enrolled in the Noncontributory Plan.
• Total pension plan benefit payouts increased by 5.5% during FY 2004 to $636 million, after experiencing an increase of 6.6% in FY 2003. This is due to the continued growth in the number of retirees and beneficiaries (32,297 in 2004 compared to 31,389 in 2003, and 30,330 in 2002), an increase in the average pension benefit for new retirees, and the annual post-retirement increase of 2.5% on base pensions.
• Administrative expenses increased by $3.7 million, to $10.5 million in FY 2004 from $6.8 million in FY 2003, and $5.8 million in FY 2002. The amounts for all years were within the ERS’s budgeted amounts. Most of the FY 2004 increase is related to the office automation project, including the expensing of certain assets in FY 2004 that were capitalized in prior fiscal years beginning in the fiscal year ended June 30, 2000. Repairs and maintenance decreased in FY 2004 with the retirement of some older computer equipment that was in service for the past 10 to 15 years. There was an increase in personnel costs due to negotiated pay raises for employees, new authorized and established positions, fewer vacant positions during FY 2004, overtime, and an increase in the fringe benefit rate. Medical board costs increased in FY 2004 with the first full year of a five-year contract entered into in FY 2003. The decrease in postage was due to the timing of mailings and by expanding the services available on the ERS website. Legal services decreased in FY 2004 with the conclusion of several lawsuits initiated in previous fiscal years, after experiencing a significant increase in

26 Financial Section _______________________________________________________ Management’s Discussion and Analysis (continued)
_________________________________________________________________________________ Employees’ Retirement System of the State of Hawaii
legal expenses in FY 2003. Most of the FY 2003 increase in administrative expenses was attributed to legal services for litigation, an increase in the fringe benefit rate on employees' salaries, overtime, and the increase in the number of staff positions filled and delays in our office automation project.
Analysis of Plan Net Assets for Pension Trust
Summary of Plan Net Assets June 30, 2004, 2003 and 2002
(dollars in millions)
2004 2003 FY 2004 % change 2002
FY 2003 % change
Assets Cash and short-term investments $ 694.7 $ 521.6 33.2 % $ 309.9 68.3 % Receivables 60.8 169.4 (64.1)% 218.9 (22.6)% Investments 8,002.0 7,504.3 6.6 % 7,827.1 (4.1)% Invested securities lending collateral 637.1 486.0 31.1 % 489.7 (0.8)% Capital assets 1.5 4.8 (68.8)% 4.9 (2.7)% Total assets 9,396.1 8,686.1 8.2 % 8,850.5 (1.9)% Liabilities Securities lending liability 637.1 486.0 31.1% 489.6 (0.7)% Investment accounts and other payables 193.6 512.9 (62.3)% 455.4 12.6 % Total liabilities 830.7 998.9 (16.8)% 945.0 5.7 % Plan net assets $ 8,565.4 $ 7,687.2 11.4 % $ 7,905,5 (2.8)%
Summary of Changes in Plan Net Assets Years ended June 30, 2004, 2003 and 2002
(dollars in millions)
2004
2003 FY 2004
% change
2002 FY 2003
% change Additions: Contributions $ 290.8 $ 247.8 17.4 % $ 222.9 11.2 % Net investment income (loss) 1,236.4 146.1 746.3 % (504.0) 129.0 % Total additions 1,527.2 393.9 287.7 % (281.1) 240.1 % Deductions Retirement benefit payments 636.2 602.8 5.5 % 565.5 6.6 % Refunds of contributions 2.3 2.6 (11.5)% 3.2 (18.7)% Administrative expenses 10.5 6.8 54.4 % 5.8 17.2 % Total deductions 649.0 612.2 6.0 % 574.5 6.6 % Increase (decrease) in plan net assets $ 878.2 $ (218.3) 502.3 % $ (855.6) 74.5 % Investments, Investment Income and Investment Expense The ERS is a long-term investor and manages the pension trust assets with long-term objectives in mind. A primary element of the ERS’ investment philosophy is that diversification among various asset classes is a prudent way to achieve its goals. The ERS makes estimates of long-term market return and establishes an asset allocation plan taking into account the risk associated with each asset class as well as the financial objectives of the ERS.

______________________________________________________ Financial Section 27 Management’s Discussion and Analysis (continued)
Comprehensive Annual Financial Report 2004
For FY 2004, the ERS’s rate of return on pension trust investments was 15.8%, which was primarily attributable to positive returns from the ERS's equity managers due to improved market conditions. Net investment income increased by almost $1.1 billion over FY 2003, when the ERS earned slightly less than 3.0% on investment assets. In FY 2002, the ERS experienced a net loss of 5.5% on investments due to a weak global economy. Net investment income also includes net income from securities lending activities as an addition and investment expenses as a deduction. The asset distribution of the ERS investment securities for the pension trust, excluding pending trade settlements and securities lending collateral, at June 30, 2004, 2003, and 2002 at fair market value is presented below. Please refer to the Investment Section of the CAFR for a discussion on asset allocation plan targets and investments by investment strategy.
Asset Class June 30,
(dollars in millions) 2004 % 2003 % 2002 % Short-term and cash $ 694.7 8.0% $ 521.6 6.5% $ 309.9 3.9% Equity securities 3,776.5 43.4% 3,356.8 41.8% 3,363.2 41.3% Fixed income 1,722.5 19.8% 2,094.6 26.1% 2,426.9 29.8% Index funds 1,605.7 18.4% 1,178.7 14.7% 1,089.2 13.4% Real estate 609.2 7.0% 587.5 7.3% 619.7 7.6% Real estate mortgages 14.1 0.2% 37.1 0.5% 89.6 1.1% Alternative investments 274.0 3.2% 249.6 3.1% 238.5 2.9% Total $ 8,696.7 100.0% $ 8,025.9 100.0% $ 8,137.0 100.0% Investments in short-term securities and cash of the pension trust are primarily held by external investment managers for the settlement of pending trades and investments. Fluctuations will occur based on the trading activity and timing of the settlements. The allocation to equity securities, including index funds and alternative investments, increased about $871 million during FY 2004 as a result of the strong performance of the equity markets, and remained relatively constant during FY 2003. FY 2002 saw a slight decline in equities due to negative returns in both the domestic and international markets. Fixed income holdings decreased over $372 million, or 17.8%, during the fiscal year ended June 30, 2004 due primarily to reductions of the asset class during FY 2004 to pay for pension benefits in accordance with ERS’ asset allocation strategy. The fixed income asset class was slightly over allocated at June 30, 2003 due to the strong performance in the fiscal year then ended. The asset class was also adversely affected in FY 2004 by the negative returns of the domestic bond market due to rising interest rates during the year. The total real estate related investments remained relatively constant during the past three years although there was a net transfer of cash from the asset class to help pay for pension obligations. Investment expenses consists primarily of investment management fees paid to external investment advisor firms that oversee the ERS investment portfolio. Total investment expenses for FY 2004 increased by almost $2 million over FY 2003. Investment manager fees increased due to an increase in asset values managed by external investment advisor firms and an increase in performance fees for certain managers that out performed their benchmarks. To help control investment manager fees, the

28 Financial Section _______________________________________________________ Management’s Discussion and Analysis (continued)
_________________________________________________________________________________ Employees’ Retirement System of the State of Hawaii
ERS requires external managers to provide the ERS with a “most favored nations” clause that guarantees the ERS with the lowest management fees the managers offer their clients for investment accounts of a similar investment mandate for asset class and a similar account size for assets under management. In FY 2003, investment expenses also included litigation costs due to several foreclosures by ERS on loans secured by real estate. Contributions During FY 2004 contributions from employers and employees totaled $290.8 million compared to $247.8 million during FY 2003. The increase in employer contributions of $45.1 million is in accordance with results of the actuarial valuations dated June 30, 2001 and June 30, 2000. Theincrease in FY 2003 employer contributions of $23.1 million is in accordance with the results of the actuarial valuations dated June 30, 2000 and June 30, 1999. The ERS uses a four-year market smoothing actuarial methodology to calculate employer contributions to help dampen some of the year-to-year fluctuations which would occur if the market value was used instead. This actuarial method used phases in differences between actual and expected earnings 25% per year. Refer to the actuarial section in the ERS 2003 and 2004 CAFR for more information. Employer contributions for FY 2003 also includes the cost of a one-time lump sum bonus of $200 for certain retirees as a result of Act 233/2002. Receipts from members decreased by approximately $2.1 million in FY 2004 due to the continuing decrease in contributory members. Pension Plan Benefits and Expenses The primary source of expense during FY 2004 was for the payment of pension benefits totaling $636.2 million compared to $602.8 million during FY 2003 and $548.8 million in FY 2002. Pension benefits increased for FY 2004 increased 5.5% due to net addition in the number of new retirees and the annual post-retirement increase. Pension benefits for FY 2003 also included a one-time payment of $200 to certain pensioners in accordance with Act 233/2002. Refunds of contributions are in line with the declining number of contributory members. Administrative expenses totaled almost $10.5 million during FY 2004 compared to $6.8 million during FY 2003 and $4.9 million in FY 2002. Increases were primarily due to an increase in office automation projects, the expensing of certain assets previously capitalized and filling additional staff positions approved. As discussed above, most of the FY 2004 office automation project expense was for the expensing of certain software development costs that were capitalized over the past four years, starting in the fiscal year ended June 30, 2000, in accordance with generally accepted accounting principles for accrual basis of accounting. If the ERS reported on a cash basis of accounting, these costs would have been recognized when actually paid. FY 2003 also saw increased legal expenses due to a number of lawsuits and increased repairs and maintenance due to delays in the office automation project.
Pension Plan Changes Pension plan changes, including legislative and Board of Trustees actions, affecting the ERS membership are summarized in the Introductory Section and Actuary Report of the ERS CAFR. Benefit enhancements for members are being implemented on a cost-neutral basis to the employers.

______________________________________________________ Financial Section 29 Management’s Discussion and Analysis (continued)
Comprehensive Annual Financial Report 2004
Actuarial Valuations and Funded Status The ERS uses an actuarial reserve type of funding that is financed by member contributions, employer contributions and earnings from invested assets. An independent actuarial valuation of the ERS actuarial assets and liabilities is performed annually. As part of this valuation, the progress toward funding pension obligations of the retirement system is measured by comparing the actuarial value of assets to actuarial accrued liability. This measurement is referred to as the funded ratio or funded status. The actuarial funded status declined to 71.7% as of June 30, 2004 from 75.9% as of June 30, 2003. The actuarial funded status at June 30, 2002 was 84.0%. The decrease in the funded ratio is primarily the result of the four-year smoothing effect of unfavorable investment returns in FY 2001 and FY 2002. At June 30, 2004 the ERS’s unfunded actuarial accrued liability increased to $3.5 billion from $2.9 billion as of June 30, 2003. This is an increase in the unfunded liability of approximately $600 million as of June 30, 2004. At June 30, 2004 the difference between the actuarial value of the assets and the market value of the assets was about $232 million in actuarially deferred losses. This was a decrease of $1.2 billion in actuarially deferred losses from the $1.4 billion actuarially deferred losses at June 30, 2003. These actuarially deferred losses will be recognized by the actuary over the next following three actuarial valuations. The employer’s past practice of using the ERS’ excess investment earnings to reduce their contributions, prior to FY 2002, also adversely impacted the ERS’ unfunded actuarial accrued liability and funding ratio. This diversion denied the ERS the contribution amounts and prevented the ERS from capturing the full earnings potential of the contributions as markets have risen during this time. Requests for Information This financial report is designed to provide a general overview of the Employees’ Retirement System of the State of Hawaii’s finances. For questions concerning any information in this report or for additional information contact the Employees’ Retirement System of the State of Hawaii, 201 Merchant Street, Suite 1400, Honolulu, Hawaii 96813.

30 Financial Section _______________________________________________________ Financial Statements
_________________________________________________________________________________ Employees’ Retirement System of the State of Hawaii
Combining Statements of Plan Net Assets – All Trust and Agency Funds
June 30, 2004 and 2003
2004 Pension Trust Agency Employees’ Social Retirement Security
System Contribution Total Assets Cash and short-term investments (notes C2 and F) Cash $ 34,555,603 $ 1,023,206 $ 35,578,809 Short-term investments 660,118,573 1,341,713 661,460,286 694,674,176 2,364,919 697,039,095 Receivables Accounts receivable and others 1,129,902 - 1,129,902 Investment sales proceeds 31,519,740 - 31,519,740 Accrued investment income 27,583,055 - 27,583,055 Employer appropriations - 5,733,390 5,733,390 Member contributions 574,383 - 574,383 60,807,080 5,733,390 66,540,470 Investments, at fair value (notes C2 and F) Equity securities 3,776,482,422 - 3,776,482,422 Fixed income securities 1,722,464,847 - 1,722,464,847 Index funds 1,605,690,512 - 1,605,690,512 Real estate investments 609,169,471 - 609,169,471 Real estate mortgages 14,174,954 - 14,174,954 Alternative investments 274,046,792 - 274,046,792 8,002,028,998 - 8,002,028,998 Other Invested securities lending collateral (note F) 637,120,873 - 637,120,873 Equipment at cost, net of depreciation 1,479,796 - 1,479,796 Other assets - - - 638,600,669 - 638,600,669 Total assets 9,396,110,923 8,098,309 9,404,209,232 Liabilities Bank overdraft (note F) 3,200,030 - 3,200,030 Accounts and other payables 18,683,515 - 18,683,515 Investment commitments payable 171,701,368 - 171,701,368 Payable to Internal Revenue Service - 6,696,432 6,696,432 Due to employers - 1,401,877 1,401,877 Securities lending collateral (note F) 637,120,873 - 637,120,873 Total liabilities 830,705,786 8,098,309 838,804,095 Commitments and contingencies (notes F, G, H and I) Net assets held in trust for pension benefits (note D) (a schedule of funding progress is presented on page 46) $ 8,565,405,137 $ - $ 8,565,405,137
See accompanying notes to financial statements.

______________________________________________________ Financial Section 31 Financial Statements
Comprehensive Annual Financial Report 2004
2003 Pension Trust Agency Employees’ Social Retirement Security System Contribution Total
$ 11,987,942 $ 259 $ 11,988,201 509,651,269 1,383,589 511,034,858 521,639,211 1,383,848 523,023,059 811,286 811,286 136,836,097 – 136,836,097 29,674,969 – 29,674,969 1,402,600 9,478,289 10,880,889 643,723 – 643,723 169,368,675 9,478,289 178,846,964
3,356,750,689 – 3,356,750,689 2,094,619,386 – 2,094,619,386 1,178,688,353 – 1,178,688,353 587,477,227 – 587,477,227 37,141,699 – 37,141,699 249,608,820 – 249,608,820 7,504,286,174 – 7,504,286,174
486,040,925 – 486,040,925 4,762,843 – 4,762,843 40,628 – 40,628 490,844,396 – 490,844,396
8,686,138,456 10,862,137 8,697,000,593
13,405,231 – 13,405,231 20,857,309 – 20,857,309 478,635,108 – 478,635,108 – 6,568,665 6,568,665 – 4,293,472 4,293,472 486,040,925 – 486,040,925
998,938,573 10,862,137 1,009,800,710
$ 7,687,199,883 $ – $ 7,687,199,883

32 Financial Section _______________________________________________________ Financial Statements (continued)
_________________________________________________________________________________ Employees’ Retirement System of the State of Hawaii
Statements of Changes in Plan Net Assets – All Trust Funds
Years ended June 30, 2004 and 2003
2004 2003 Additions Appropriations and contributions (note E) Employers $ 235,685,796 $ 190,586,276 Members 55,116,452 57,214,521 Total contributions 290,802,248 247,800,797 Investment income (loss) (note F) From investing activities Net appreciation (depreciation) in fair value of investments
1,017,709,259
(43,289,894)
Interest on fixed income securities 87,975,406 108,389,945 Dividends on equity securities 79,803,683 44,618,281 Interest and fees on real estate mortgages, net 2,930,482 2,096,318 Interest on short-term investments 1,599,794 3,736,280 Income on real estate investments 45,399,209 43,905,926 Alternative investment income 23,506,976 7,567,513 Miscellaneous 2,002,347 1,459,584 1,260,927,156 168,483,953 Less investment expenses 26,015,189 23,984,082 Net investment income from investing activities 1,234,911,967 144,499,871 From securities lending activities Securities lending income 6,953,448 7,171,283 Securities lending expenses Borrower rebates 5,074,777 5,120,608 Management fees 375,711 409,795 Less securities lending activities expense 5,450,488 5,530,403 Net investment income from securities lending activities
1,502,960
1,640,880
Total net investment income 1,236,414,927 146,140,751 Total additions 1,527,217,175 393,941,548 Deductions Benefit payments (note A3) 636,214,617 602,805,080 Refunds of member contributions 2,328,796 2,605,602 Refunds paid to State and counties - 2,800 Administrative expenses 10,468,508 6,780,824 Total deductions 649,011,921 612,194,306 Net increase (decrease) in net assets 878,205,254 (218,252,758) Net assets held in trust for pension benefits (note D) Beginning of year 7,687,199,883 7,905,452,641 End of year $ 8,565,405,137 $ 7,687,199,883 See accompanying notes to financial statements.

______________________________________________________ Financial Section 33 Notes to Financial Statements
Comprehensive Annual Financial Report 2004
June 30, 2004 and 2003
Note A – Description of the ERS
1. General The Employees’ Retirement System of the State of Hawaii (the ERS) began operations on
January 1, 1926, having been established by the Territorial Legislature in the preceding year. The ERS is a cost-sharing, multiple-employer public employee retirement system established to administer a pension benefits program for all State and county employees, including teachers, police officers, firefighters, correction officers, judges and elected officials.
Employer, pensioner and employee membership data as of March 31, 2004 and 2003:
2004 2003 Employers: State 1 1 Counties 4 4 Total employers 5 5 Pensioners and beneficiaries currently receiving benefits: Pensioners currently receiving benefits: Police and firefighters 2,636 2,579 All others 27,867 27,151 Total pensioners 30,503 29,730 Beneficiaries currently receiving benefits: Police and firefighters 136 126 All others 1,658 1,533 Total beneficiaries 1,794 1,659 Total pensioners and beneficiaries 32,297 31,389 Terminated vested members entitled to benefits but not yet receiving benefits: Police and firefighters 140 130 All others 4,361 4,020 Total terminated vested members 4,501 4,150 Current employees: Vested: Police and firefighters 3,634 3,635 All other employees 32,569 33,032 Nonvested: Police and firefighters 1,086 1,021 All other employees 25,284 24,604 Total current employees 62,573 62,292

34 Financial Section _______________________________________________________ Notes to Financial Statements (continued)
_________________________________________________________________________________ Employees’ Retirement System of the State of Hawaii
Note A – Description of the ERS (continued)
2. The Financial Reporting Entity As required by accounting principles generally accepted in the United States of America, these
financial statements present the ERS (the primary government) as a separate reporting entity from the State of Hawaii (the State). The ERS is not part of the State’s financial reporting entity because it is a separate legal entity that is fiscally independent of the State. The ERS was established by Chapter 88 of the Hawaii Revised Statutes and is governed by a board of trustees (the Board) as discussed below. The ERS is comprised of the Employees’ Retirement System and Social Security Contribution Funds.
The Board administers the ERS on behalf of public employees of both the State and county
governments. Except for limited administrative functions, the State does not have the power to supervise or control the Board in the exercise of its functions, duties and powers. The Board consists of eight members. The State Director of Finance is a statutory member of the Board. Four members of the Board are elected by members of the ERS and the other three members of the Board are appointed by the Governor. Decisions are made with the concurring vote of five members of the Board. The Board appoints the Administrator and Chief Investment Officer and engages actuarial and other services required to transact the business of the ERS.
3. Benefits Members of the ERS belong to either the contributory or noncontributory plan. All assets of
the ERS (in the Pension Trust) may be used to pay benefits to any member of the ERS. Employees covered by Social Security on June 30, 1984 were given the option of joining the noncontributory plan or remaining in the contributory plan. All new employees hired after June 30, 1984, who are covered by Social Security, are generally required to join the noncontributory plan. Most members of the contributory plan are required to contribute 7.8% of their salary. Both plans provide a monthly retirement allowance based on the member’s age, years of credited service, and average final compensation (AFC). The AFC is the average salary earned during the five highest paid years of service, including the payment of salary in lieu of vacation, or three highest paid years of service, excluding the payment of salary in lieu of vacation, if the employee became a member prior to January 1, 1971. The AFC for members hired on or after this date is based on the three highest paid years of service excluding the payment of salary in lieu of vacation. Vesting requirements for the contributory and noncontributory plans are five years and ten years, respectively.
Ordinary disability retirement benefits require a minimum of ten years of service, whereas
service connected disability resulting from a job related accident does not have any service requirement. Under both plans, there is no age requirement.
Ordinary death benefits under the contributory and noncontributory plans require at least one year and ten years of service, respectively. Under both plans, there is no service requirement for service connected death benefits.

______________________________________________________ Financial Section 35 Notes to Financial Statements (continued)
Comprehensive Annual Financial Report 2004
Note A – Description of the ERS (continued)
3. Benefits (continued)
Retirement benefits for certain groups of contributory members, such as police officers, firefighters, some investigators, sewer workers, judges and elected officials, vary from general employees. All contributions, benefits and eligibility requirements are governed by Chapter 88 of the Hawaii Revised Statutes.
Every retiree’s original retirement allowance is increased by 2-1/2% on each July 1 following the calendar year of retirement. This cumulative benefit is not compounded and increases each year by 2-1/2% of the original retirement allowance without a ceiling (2-1/2% of the original retirement allowance the first year, 5% the second year, 7-1/2% the third year, etc.).
4. The ERS as Employer
As an employer, the ERS participates in its pension benefits program, through the State of Hawaii. The ERS provides benefits for all of its full-time employees through the Contributory or Noncontributory Plan. Contributions are calculated as part of the State’s total contribution requirements and are reimbursed to the State’s General Fund as part of the fringe benefit rate on ERS employees’ actual salaries. The required pension contributions by the ERS for the years ended June 30, 2004, and 2003, were $293,331 and $284,666, respectively, which represented 9.1% and 8.9% of covered payroll and was equal to the required contributions for each year. There were no required pension contributions for FY 2002.
Note B – Social Security Contribution Fund
The Social Security Contribution Fund (Contribution Fund) was established under Section 88-224 of the Hawaii Revised Statutes for the following purposes: 1. To receive all federal Social Security employers’ contributions from the State and interest and
penalties on unpaid amounts; 2. To receive any appropriations to the Contribution Fund; 3. To pay amounts required to be paid to the Internal Revenue Service (IRS); and 4. Invest and collect income on resources held by the Contribution Fund. All other governmental agencies remit social security contributions directly to the IRS. Social Security contributions withheld from employees are remitted directly to the IRS by the employers. The Contribution Fund is considered an agency fund for financial reporting purposes.

36 Financial Section _______________________________________________________ Notes to Financial Statements (continued)
_________________________________________________________________________________ Employees’ Retirement System of the State of Hawaii
Note C – Summary of Accounting Policies
A summary of the significant accounting policies consistently applied in the preparation of the accompanying financial statements follows. 1. Basis of Accounting
Fiduciary funds are used to account for assets held by the ERS in a trustee capacity or as an agent for individuals, private organizations, other governments, and or other funds. The fiduciary fund types used by the ERS are a pension trust fund and an agency fund. Each of the fiduciary funds are considered a separate fiscal and accounting entity with a self-balancing set of accounts that comprise its assets, liabilities, equity, revenues and expenditures, or expenses, as appropriate. The accounting and reporting treatment applied to a fund is determined by its measurement focus. The Pension Trust Fund is accounted for on a flow of economic resources measurement focus. As an agency fund, the Contribution Fund is custodial in nature and does not measure results of operations.
The financial statements are prepared using the accrual basis of accounting under which
expenses are recorded when the liability is incurred, revenues are recorded in the accounting period in which they are earned and become measurable. Employer and member contributions are recognized in the period in which the contributions are due. Benefits and refunds are recognized when due and payable in accordance with the terms of the plan. Investment purchases and sales are recorded as of their trade date. Administrative expenses are financed exclusively with investment income.
2. Investments Pursuant to Sections 88-119 and 88-119.5 of the Hawaii Revised Statutes, the Pension Trust
may invest in real estate loans and mortgages; preferred and common stocks; government obligations; corporate obligations; certain other debt obligations (such as obligations secured by collateral of certain other authorized securities listed here, obligations issued or guaranteed by certain development banks, insurance company obligations); real property; alternative investments; and other securities and futures contracts. The investment decision is further dictated by internal investment policies and asset allocation established by the Board of Trustees. Assets in the Pension Trust may be invested in any of these assets, while investments in the Contribution Fund are limited to investment grade, short-term marketable securities.

______________________________________________________ Financial Section 37 Notes to Financial Statements (continued)
Comprehensive Annual Financial Report 2004
Note C – Summary of Accounting Policies (continued)
2. Investments (continued)
Investments are reported at fair value. Where appropriate, the fair value includes disposition costs. Short-term investments are reported at cost, which approximates fair value. Securities (categorized as fixed-income, equity, index funds, and alternative investments) traded on a national or international exchange are valued at the last reported sales price at current exchange rates. Mortgages are valued on the basis of future principal and interest payments. The fair value of real estate investments is based on independent appraisals and estimated values. Investments that do not have an established market are reported at estimated fair value.
3. Interest and Earnings Allocation Pursuant to Section 88-21 and 88-107 of the Hawaii Revised Statutes, the Board shall annually
allocate interest and other earnings of the Pension Trust to the funds of the Pension Trust, as follows:
a. Annuity Savings Fund – Fixed at 4-1/2% regular interest rate. b. Expense Fund – To be credited all money to pay the administrative expenses of the ERS. c. Pension Accumulation Fund – To be credited with any remaining investment earnings.
4. Risk Management The ERS reports liabilities, as discussed in note G, related to certain types of losses (including
torts, theft of, damage to, or destruction of assets, errors or omissions, natural disasters and injuries to employees) when it is probable that the losses have occurred and the amount of those losses can be reasonably estimated.
5. New Accounting Pronouncements In March 2003, the GASB issued Statement No. 40, Deposit and Investment Risk Disclosures,
an Amendment of GASB Statement No.3. The objective of this Statement is to update the custodial credit risk disclosure requirements of Statement No. 3 and to establish more comprehensive disclosure requirements addressing other common risks of the deposits and investments of state and local governments. The requirements of this Statement are effective for financial statements for periods beginning after June 15, 2004, and will not have a material effect on the ERS’ financial statements.

38 Financial Section _______________________________________________________ Notes to Financial Statements (continued)
_________________________________________________________________________________ Employees’ Retirement System of the State of Hawaii
Note C – Summary of Accounting Policies (continued)
6. Use of Estimates In preparing financial statements in conformity with accounting principles generally accepted
in the United States of America, management is required to make estimates and assumptions that affect the reported amounts of assets and liabilities, the disclosure of contingent assets and liabilities at the date of the financial statements, and the reported amounts of revenues and expenses during the reporting period. Actual results could differ from those estimates.
7. Reclassifications Certain reclassifications have been made to the 2003 financial statements to conform to the
2004 presentation. Such reclassifications had no effect on previously reported changes in plan net assets.
Note D – Description of Funds
Section 88-109 of the Hawaii Revised Statutes requires the establishment and maintenance of specific funds within the ERS. The funds in the Pension Trust and their purposes are described hereunder: 1. Pension Accumulation Fund To accumulate contributions made by the State and counties, transfers of retired members’
contributions plus related interest income from the Annuity Savings Fund and income from investments. All pension benefits, including the pensioners’ bonus are paid through this Fund.
2. Annuity Savings Fund To accumulate members’ contributions and related interest income. Upon a member’s
retirement, the accumulated contributions and related interest income are transferred to the Pension Accumulation Fund or refunded to the member upon termination.
3. Expense Fund To pay all the expenses necessary in connection with the administration and operation of the
ERS. The Board estimates the amount of money necessary to be paid into the expense fund for the ensuing biennium to provide for the expense of operation of the ERS, and pays that amount into the expense account from the investment earnings of the ERS, subject to review by the legislature and approval by the Governor.

______________________________________________________ Financial Section 39 Notes to Financial Statements (continued)
Comprehensive Annual Financial Report 2004
Note D – Description of Funds (continued)
Net assets held in trust for pension benefits as of June 30, 2004 and 2003 are as follows:
2004 2003 Pension Accumulation Fund $7,653,613,762 $6,768,638,086 Annuity Savings Fund 906,543,513 906,504,024 Expense Fund 5,247,862 12,057,773 Total net assets held in trust for pension benefits $8,565,405,137 $7,687,199,883
Note E – Contributions
The ERS’ funding policy provides for periodic employer contributions at actuarially determined rates, expressed as a percentage of annual covered payroll, such that the employer contributions, along with employee contributions and an actuarially determined rate of investment return, are adequate to accumulate sufficient assets to pay benefits when due. The funding method used to calculate the total employer contribution required is the entry age normal actuarial cost method. Under this method, the total employer contribution is comprised of the “normal cost” plus the level annual payments required to amortize the unfunded actuarial accrued liability over the closed period ending June 30, 2029. The employer normal cost is the level percentage of payroll contribution required to pay all benefits. Actuarial gains and losses resulting from differences between actual and assumed experience are reflected in the employer unfunded accrued liability. Most members of the contributory plan are required to contribute 7.8% of their salary. Police officers, firefighters, investigators of the department of prosecuting attorney and the attorney general, narcotics enforcement investigators, and public safety investigators are required to contribute 12.2% of their salary. Employer and member contributions are governed by Chapter 88 of the Hawaii Revised Statutes. The annual required employer contributions for the years ended June 30, 2004 and 2003 were determined as part of actuarial valuations dated June 30, 2001 and 2000, respectively.
Note F – Cash Deposits and Investments
The ERS’ policy is to invest cash in excess of operating requirements in income-producing investments. The carrying amount of the ERS’ total deposits (including those classified as short-term investments) as of June 30, 2004 and 2003, net of a bank overdraft of $3,200,030 and $13,405,231, was $198,739,264 and $143,815,312 (which includes cash and time deposits of $166,660,484 and $145,432,343), respectively. Total bank balances of these deposits amounted to $201,793,231 and $158,597,098, respectively. Of the bank balances, $1,534,283 and $2,111,435, respectively, was covered by the Federal Deposit Insurance Corporation or by collateral held by the ERS or by its agent in the ERS’ name, and $200,258,948 and $156,485,663, respectively, was uninsured and uncollateralized. The uninsured and uncollateralized balances are primarily U.S. dollar equivalents of foreign cash held for the purpose of settling transactions.

40 Financial Section _______________________________________________________ Notes to Financial Statements (continued)
_________________________________________________________________________________ Employees’ Retirement System of the State of Hawaii
Note F – Cash Deposits and Investments (continued)
The ERS’ investments are categorized to give an indication of the level of risk assumed at fiscal year-end. The three categories of credit risk are: • Category 1 includes investments that are insured or registered, or for which the securities are
held by the ERS or its agent in the ERS’ name. • Category 2 includes uninsured and unregistered investments for which the securities are held by
the counterparty’s trust department or agent in the ERS’ name. • Category 3 includes uninsured and unregistered investments for which the securities are held by
the counterparty or by its trust department or agent, but not in the ERS’ name.
The ERS’ investments that can be categorized within these guidelines meet the criteria of Category 1. A security, for purposes of classification in the above categories, is a transferable financial instrument that evidences ownership or creditor status. “Securities” do not include investments made with another party, real estate or direct investments in mortgages. Securities lent at year-end for cash collateral are presented as “not subject to categorization,” as the cash collateral is invested in the lending agent’s short-term investment pool. Securities Investments in mutual funds, limited partnerships, and commingled trust funds also are not considered securities for purposes of credit risk classification. Such investments are shown in the schedule on the below as “not subject to classification.”
The following table summarizes the risk categories and fair values of investments held by the ERS as of June 30, 2004 and 2003 (amounts expressed as thousands):
2004 2003 (In thousands) Investments – Category 1: Short-term securities: U.S. Treasury issues $ 15,309 $ 5,137 Commercial paper 150,173 79,216 Certificates of deposit 166,660 145,432
332,142 229,785 Equity securities: Common stock 3,140,733 3,016,478 Depository receipts, preferred stock and other 38,712 2,527
3,179,445 3,019,005 Fixed income securities: Mortgage-backed securities 492,892 584,490 U.S. Government bonds 85,895 134,776 Foreign bonds 592,583 480,528 U.S. corporate bonds 324,199 478,352 Asset backed securities 59,423 89,846 Other 14,388 26,974
1,569,380 1,794,966
Total categorized investments, carried forward $ 5,080,967 $ 5,043,756

______________________________________________________ Financial Section 41 Notes to Financial Statements (continued)
Comprehensive Annual Financial Report 2004
Note F – Cash Deposits and Investments (continued)
2004 2003 (In thousands) Total categorized investments, brought forward $ 5,080,967 $ 5,043,756
Investments – Not subject to categorization: Investments held by broker dealers under securities loans for cash collateral: Short-term securities: U.S. Treasury issues 13,846 3,242 Commercial paper 101,445 23,037 Equity securities: Common stock 328,676 139,160 Depository receipts, preferred stock and other 3,749 1,238 Fixed income securities: Mortgage-backed securities 12,150 10,811 U.S. Government bonds 132,860 140,345 Foreign bonds 1,936 135,561 U.S. corporate bonds 11,352 13,141 Other – 295 Mutual funds, commingled funds, and others Short-term securities 218,574 255,170 Equity securities 264,729 197,348 Index funds 1,605,691 1,178,688 Real estate investments 609,169 587,477 Real estate mortgages 14,175 37,142 Alternative investments (direct investments in timber properties, limited partnership, and limited liability company interests) 274,047 249,609
3,592,399 2,972,264
Total investments $ 8,673,366 $ 8,016,020 Reconciliation to investments on combining statements of plan net assets (amounts expressed in thousands):
2004 2003 (In thousands)
Total investments $ 8,673,366 $ 8,016,020
Less short-term securities U.S. Treasury issues (24,608) (8,379) Commercial paper (251,618) (102,253) Pooled funds and other (218,574) (255,170) Certificates of deposit (166,660) (145,432)Less investments on securities loans that were sold and pending settlement; included in investment sales proceeds receivable U.S. Treasury issues (4,547) (500) Mortgage-backed securities (5,213) – Common stock (117) –
Investments on combining statements of plan net assets $ 8,002,029 $ 7,504,286

42 Financial Section _______________________________________________________ Notes to Financial Statements (continued)
_________________________________________________________________________________ Employees’ Retirement System of the State of Hawaii
Note F – Cash Deposits and Investments (continued)
Short-term securities are reported as short-term investments in the accompanying combining statements of plan net assets. The following managers held investments at fair value in excess of 5% of the ERS’ net asset held in trust for pension benefits as of June 30, 2004 and 2003:
2004 2003 Mellon Enhanced Equity Index Fund $ 996,669,594 $ 876,077,475State Street Global Advisors EAFE Index Fund 609,020,917 302,610,878
1. Derivative Investments The ERS enters into various derivative investment contracts to hedge, reduce costs and enhance
liquidity. As with any investment, derivative contracts are subject to various types of credit and market risks. Notably, these would include the possible inability of a counterparty to meet the terms of the contract, changes in the market value of the underlying collateral, or changes in the interest rate environment. Certain of the ERS’ investments in derivative securities and contracts and their associated credit and market risks are described as follows:
Forward Currency Exchange Contracts The ERS enters into various forward currency exchange contracts to manage exposure to changes in foreign currency exchange rates and to facilitate the settlement of foreign security transactions. A forward contract is an agreement to buy or sell a specific amount of currency at a specific delivery or maturity date for an agreed-upon price. Risks associated with such contracts include movements in the value of the foreign currency relative to the U.S. dollar and the ability of the counterparty to perform in accordance with the terms of the contract. Changes in the market value of open and closed forward contracts are recorded as net appreciation (depreciation) in fair value of investments in the statement of changes in plan net assets. The fair value of forward currency exchange contracts outstanding at June 30, 2004 and 2003 is as follows:
2004 2003 Forward currency purchases $ 367,345,715 $ 479,627,480 Forward currency sales (367,699,394) (478,131,674) Unrealized gains (losses) $ (353,679) $ 1,495,806
Mortgage-Backed Securities As of June 30, 2004 and 2003, the fair value of mortgage-backed securities issued or backed by the U.S. government or its agencies, or corporate issues rated AAA by at least one of the major rating agencies was $499,828,900 and $599,300,566, respectively. A mortgage-backed security depends on the underlying pool of mortgage loans to provide the cash flow to make principal and interest payments on the security. Therefore, they are sensitive to

______________________________________________________ Financial Section 43 Notes to Financial Statements (continued)
Comprehensive Annual Financial Report 2004
Note F – Cash Deposits and Investments (continued)
1. Derivative Investments (continued)
Mortgage-Backed Securities (continued) prepayments by mortgagees, which may result from a decline in interest rates. For example, if interest rates decline and homeowners refinance mortgages, thereby pre-paying the mortgages underlying these securities, the cash flows from interest payments are reduced and the value of these securities declines. Conversely, if homeowners pay on mortgages longer than anticipated, the cash flows are greater and the return on the investment would be higher than anticipated. A collateralized mortgage obligation (CMO) is a mortgage-backed security that is comprised of classes of bonds created by prioritizing the cash flows of the underlying mortgage pool. As of June 30, 2004 and 2003, the fair value of CMO securities was $67,743,584 and $73,711,786, respectively.
2. Securities Lending The ERS participated in a securities lending program administered by its bank custodian.
Under this program, which is permissible under Chapter 88 of the Hawaii Revised Statutes, certain equity and fixed income securities of the ERS were lent to participating broker-dealers and banks (borrowers). In return, the ERS received cash, securities issued or guaranteed by the U.S. government and/or letters of credit as collateral. The ERS did not have the ability to pledge or sell collateral securities absent of borrower default. Borrowers were required to deliver collateral for each loan equal to: (a) in the case of loaned securities denominated in U.S. dollars or whose primary trading market was located in the U.S., 102% of the market value of the loaned securities; and (b) in the case of loaned securities not denominated in U.S. dollars or whose primary trading market was not located in the U.S., 105% of the market value of the loaned securities. The collateral was marked to market daily. If the market value of the collateral fell below the minimum collateral requirements, additional collateral was provided. Securities on loan for cash collateral are presented as unclassified in the preceding schedule of custodial credit risk; securities on loan for securities collateral are classified according to the underlying security. At June 30, 2004 and 2003, the ERS had no credit risk exposure to borrowers because the market value of collateral held by the ERS exceeded the market value of securities loaned. As of June 30, 2004 and 2003, the market value of securities loaned amounted to approximately $615,894,012 and $469,589,342, respectively, and the associated collateral amounted to approximately $637,120,873 and $486,040,925, respectively. In addition, the bank custodians indemnified the ERS by agreeing to purchase replacement securities or return cash collateral in the event the borrower failed to return the loaned security or pay distributions.
The ERS did not impose any restrictions on the amount of loans the bank custodian made on behalf of the ERS. Also, the ERS and the borrowers maintained the right to terminate securities lending transactions on demand. As such, the maturities of the investments made

44 Financial Section _______________________________________________________ Notes to Financial Statements (continued)
_________________________________________________________________________________ Employees’ Retirement System of the State of Hawaii
Note F – Cash Deposits and Investments (continued)
2. Securities Lending (continued)
with cash collateral generally did not match the maturities of the securities loans. The extent of such mismatch as of June 30, 2004 and 2003 was 52 and 62 days, respectively.
3. Foreign Investments The fair value of the ERS’ investments in foreign equity and fixed income securities as of
June 30, 2004 and 2003 is as follows:
2004 2003 Foreign equity securities $1,309,166,030 $1,045,636,632 Foreign fixed income securities 594,519,173 616,089,286 $1,903,685,203 $1,661,725,918
Note G – Risk Management
The ERS is exposed to various risks of loss related to torts; theft of, damage to, or destruction of assets; errors or omissions; natural disasters; and injuries to employees. As required by state law, the ERS participates in coverage with the State of Hawaii. The State retains various risks and insures certain excess layers with commercial insurance policies. The excess layers are consistent with the prior fiscal year. Settled claims for the State have not exceeded the coverage provided by commercial insurance policies in any of the three fiscal years prior to June 30, 2004. Losses not covered by insurance are generally paid from legislative appropriations. 1. Torts The ERS is involved in various litigation and claims, including claims regarding retirement
benefits, the outcome of which cannot be presently determined, and as discussed in note I. In the opinion of management, the outcome of these actions will not have a material adverse effect on the ERS’ financial position.
2. Property and Liability Insurance The ERS also purchased property and liability insurance for all real estate owned from outside
carriers. During the past three fiscal years, no loss settlements exceeded insurance coverages. 3. Workers’ Compensation Policy The State has a self-insured workers’ compensation policy. Workers’ compensation claims are
paid from legislative appropriations.

______________________________________________________ Financial Section 45 Notes to Financial Statements (continued)
Comprehensive Annual Financial Report 2004
Note H – Commitments
In the normal course of business, the ERS enters into commitments with associated risks. The ERS adheres to the same credit policies, financial and administrative controls and risk limiting and monitoring procedures for these commitments as for all investments. The ERS has future financial commitments of up to an additional $257,359,000 as of June 30, 2004, including $92,561,000 in real estate and $164,798,000 in alternative investments, and $344,438,000 as of June 30, 2003, consisting of $183,444,000 in real estate and $160,994,000 in alternative investments
Note I – Contingencies
In 1998, the State of Hawaii Supreme Court ruled against the ERS in a class action suit filed by the retired public school principals, vice principals and teachers whose retirement benefits were calculated using the “High 3” method of computing average final compensation. Under the terms of the court order, the ERS was required to recalculate monthly retirement benefits for all members of the class who are (a) school principals and vice principals collecting a retirement benefit in 1984, (b) teachers collecting a retirement benefit in 1988, and (c) members of these groups who have since retired. The ERS substantially completed payments of over $4 million to the 4,100 identified class members during the fiscal year ended June 30, 2000. The teachers filed an appeal and were awarded additional moneys as “interest” on the underpayments amounting to approximately $1,000,000 in October 2000 by the State of Hawaii First Circuit Court. The ERS has filed an appeal of the First Circuit Court’s decision to the Hawaii Supreme Court.
Note J – Deferred Compensation Plan
The ERS does not sponsor a deferred compensation program. The ERS employees are eligible to participate in the deferred compensation plan sponsored by the State of Hawaii. The State sponsored plan was created in accordance with Internal Revenue Code Section 457. The plan, available to all ERS employees, permits them to defer a portion of their salary until future years. The deferred compensation is not available to the employees until termination, retirement, death, or an unforeseeable emergency. All compensation deferred under the plan is held in trust by a custodian for the exclusive benefit of participants and beneficiaries.

46 Financial Section _______________________________________________________ Required Supplementary Information
_________________________________________________________________________________ Employees’ Retirement System of the State of Hawaii
June 30, 2004
Schedule of Funding Progress (In thousands)
UAAL as a Unfunded percentage Actuarial actuarial of annual
Actuarial Actuarial accrued accrued Funded Annual covered valuation value of liability liability ratio covered payroll
date assets (1) (AAL) (2)* (3)*= (2)-(1) (4)=(1)/(2) payroll (5) (6)=(3)/(5)
June 30: 2004 $8,797,133 $12,271,331 $3,474,198 71.7% $2,865,106 121.3% 2003 9,073,960 11,952,057 2,878,097 75.9% 2,826,682 101.8% 2002 9,415,160 11,210,226 1,795,066 84.0% 2,671,689 67.2% 2001 9,515,957 10,506,913 990,956 90.6% 2,444,200 40.5% 2000 9,204,707 9,748,033 543,316 94.4% 2,275,298 23.9% 1999 8,590,807 9,181,730 590,923 93.6% 2,186,499 27.0%
* Note: Items (2) and (3) include the unfunded liabilities related to the Early Incentive Retirement
(EIR) Program retirees who retired on December 31, 1994 and June 30, 1995 amounting to $68,546,378, $69,414,527, $70,218,385, $75,173,210, $77,736,700, and $80,110,400 as of June 30, 2004, 2003, 2002, 2001, 2000, and 1999, respectively. For the fiscal year ended June 30, 2004, the annual payment related to the EIR Program cost of $5,945,684 is included in the employer contribution requirement on the financial statements. Based on a level amortization period ending June 30, 2029, this represents a reduction of principal and payment of “interest” in the amount $868,152 and $5,077,532, respectively.
In June 2000, and June 1999, the Legislature of the State of Hawaii enacted Acts 216, and 100, respectively, which amends Sections 88-107 and 88-122 of the Hawaii Revised Statutes related to assumptions used in determining the actuarial valuation. The amounts as of June 30, 1999 have been revised to be in compliance with these Acts and a related lawsuit settlement agreement.
Schedule of Employer Contributions (In thousands)
Annual required Actual Percentage contribution contribution Contributed
Year ended June 30,:
2004 $235,686 $235,686 100.0% 2003 190,586 190,586 100.0% 2002 167,459 167,459 100.0% 2001 164,397 8,132 4.9% 2000 172,255 22,392 13.0% 1999 185,387 154,470 83.3%

______________________________________________________ Financial Section 47 Note to Required Supplementary Information
Comprehensive Annual Financial Report 2004
June 30, 2004
The information presented in the required supplementary schedules was determined as part of the annual actuarial valuation. Additional information as of the latest actuarial valuation follows.
Valuation date June 30, 2004 Actuarial cost method Entry age normal Amortization method Level dollar, closed Remaining amortization period (years) 22.6 Asset valuation method 4-year smoothed market Actuarial assumptions: Investment rate of return (set by statute)* 8.0% Projected salary increases (set by statute)* 4.0% Cost of living adjustments 2.5% (not compounded) *Includes inflation at 4.0%
In 2002, the Legislature of the State of Hawaii approved a bill changing the remaining amortization period to be fully amortized by June 30, 2029. Prior to that, the unfunded actuarial accrued liability was to be fully amortized by 2016. The annual required contribution for the year ended June 30, 2004 was determined as part of an actuarial valuation dated June 30, 2001 that is consistent with the current actuarial valuation.
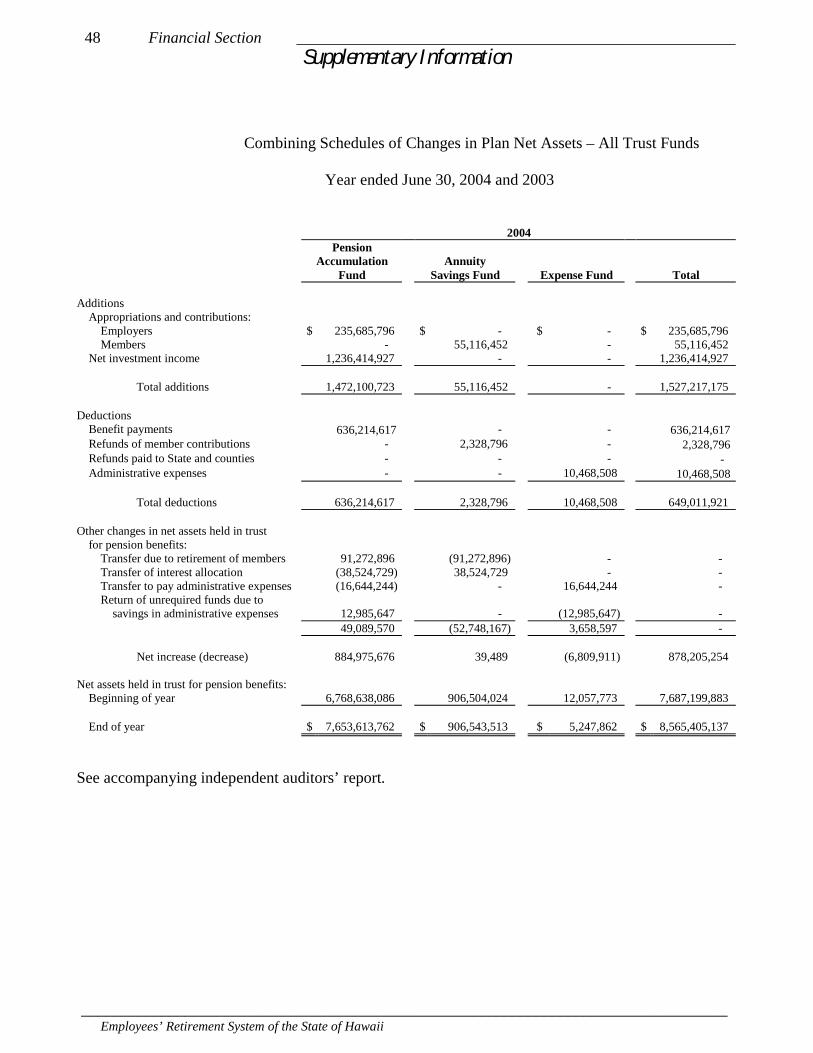
48 Financial Section _______________________________________________________ Supplementary Information
_________________________________________________________________________________ Employees’ Retirement System of the State of Hawaii
Combining Schedules of Changes in Plan Net Assets – All Trust Funds
Year ended June 30, 2004 and 2003
2004 Pension Accumulation Annuity Fund Savings Fund Expense Fund Total Additions Appropriations and contributions: Employers $ 235,685,796 $ - $ - $ 235,685,796 Members - 55,116,452 - 55,116,452 Net investment income 1,236,414,927 - - 1,236,414,927 Total additions 1,472,100,723 55,116,452 - 1,527,217,175 Deductions Benefit payments 636,214,617 - - 636,214,617 Refunds of member contributions - 2,328,796 - 2,328,796 Refunds paid to State and counties - - - - Administrative expenses - - 10,468,508 10,468,508 Total deductions 636,214,617 2,328,796 10,468,508 649,011,921 Other changes in net assets held in trust for pension benefits: Transfer due to retirement of members 91,272,896 (91,272,896) - - Transfer of interest allocation (38,524,729) 38,524,729 - - Transfer to pay administrative expenses (16,644,244) - 16,644,244 - Return of unrequired funds due to savings in administrative expenses 12,985,647 - (12,985,647) - 49,089,570 (52,748,167) 3,658,597 - Net increase (decrease) 884,975,676 39,489 (6,809,911) 878,205,254 Net assets held in trust for pension benefits: Beginning of year 6,768,638,086 906,504,024 12,057,773 7,687,199,883 End of year $ 7,653,613,762 $ 906,543,513 $ 5,247,862 $ 8,565,405,137 See accompanying independent auditors’ report.

______________________________________________________ Financial Section 49 Supplementary Information
Comprehensive Annual Financial Report 2004
Schedule 1
2003 Pension
Accumulation Annuity Fund Savings Fund Expense Fund Total
$ 190,586,276 $ – $ – $ 190,586,276 – 57,214,521 – 57,214,521
146,140,751 – – 146,140,751
336,727,027 57,214,521 – 393,941,548
602,805,080 – – 602,805,080 – 2,605,602 – 2,605,602
2,800 2,800 – – 6,780,824 6,780,824
602,807,880 2,605,602 6,780,824 612,194,306
102,302,062 (102,302,062) – – (38,949,337) 38,949,337 – – (7,062,765) – 7,062,765 –
1,404,366 – (1,404,366) –
57,694,326 (63,352,725) 5,658,399 –
(208,386,527) (8,743,806) (1,122,425) (218,252,758)
6,977,024,613 915,247,830 13,180,198 7,905,452,641
$ 6,768,638,086 $ 906,504,024 $ $12,057,773 $ 7,687,199,883

50 Financial Section _______________________________________________________ Supplementary Information (continued)
_________________________________________________________________________________ Employees’ Retirement System of the State of Hawaii
Schedule 2 Social Security Contribution Fund
Statements of Changes in Assets and Liabilities
Years ended June 30, 2004 and 2003
2004
Assets Beginning
balance Additions Deductions Ending balance
Cash $ 259 $ 156,073,728 $ 155,050,781 $ 1,023,206 Short-term investments 1,383,589 2,974,127 3,016,003 1,341,713 Employer appropriations receivable 9,478,289 151,727,229 155,472,128 5,733,390 Total assets $ 10,862,137 $ 310,775,084 $ 313,538,912 $ 8,098,309
Liabilities
Payable to Internal Revenue Service $ 6,568,665 $ 154,651,954 $ 154,524,187 $ 6,696,432 Due to employers 4,293,472 151,761,879 154,653,474 1,401,877 Total liabilities $ 10,862,137 $ 306,413,833 $ 309,177,661 $ 8,098,309 2003
Assets Beginning
balance Additions Deductions Ending balance
Cash $ 916,681 $ 149,918,186 $ 150,834,608 $ 259 Short-term investments 3,015,875 9,459,864 11,092,150 1,383,589 Employer appropriations receivable 13,573,483 146,739,487 150,834,681 9,478,289 Total assets $ 17,506,039 $ 306,117,537 $ 312,761,439 $ 10,862,137
Liabilities
Payable to Internal Revenue Service $ 6,988,385 $ 153,105,607 $ 153,525,327 $ 6,568,665 Due to employers 10,517,654 146,882,436 153,106,618 4,293,472 Total liabilities $ 17,506,039 $ 299,988,043 $ 306,631,945 $ 10,862,137 See accompanying independent auditors’ report.

______________________________________________________ Financial Section 51 Supplementary Information (continued)
Comprehensive Annual Financial Report 2004
Schedule 3 Schedules of Administrative Expenses
Year ended June 30, 2004 and 2003
2004 2003 Personnel services Salaries and wages $ 3,209,310 $ 2,946,683 Fringe benefits 929,649 834,036 Net change in unused vacation credits 46,672 26,687
Total personnel services 4,185,631 3,807,406 Professional services Actuarial 113,769 98,378 Auditing and tax consulting 101,896 133,043 Disability hearing expenses 18,825 18,331 Legal services 453,766 814,383 Medical 220,188 189,942 Other services 25,626 25,604
Total professional services 934,070 1,279,681 Communication Postage 86,804 123,317 Printing and binding 12,053 15,541 Telephone 31,462 26,953 Travel 32,030 23,398
Total communication 162,349 189,209 Rentals Rental of equipment 28,350 25,709 Rental of premises 7,039 7,730
Total rentals 35,389 33,439 Other Armored car service 6,578 6,673 Computer and office automation systems 4,276,579 445,278 Equipment 15,091 16,030 Microfilm 5,638 10,280 Repairs and maintenance 143,747 301,885 Stationery and office supplies 57,027 43,962 Miscellaneous 98,661 40,390
Total other 4,603,321 864,498 Depreciation 547,748 606,591 $ 10,468,508 $ 6,780,824 See accompanying independent auditors’ report.

52 Financial Section _______________________________________________________ Supplementary Information (continued)
_________________________________________________________________________________ Employees’ Retirement System of the State of Hawaii
Schedule 4
Schedules of Investment Expenses
Years ended June 30, 2004 and 2003 2004 2003 Investment expenses Investment manager/advisor fees $ 25,249,872 $ 22,249,553 Bank custodian fees 310,000 351,924 Other investment expenses 455,317 1,382,605 Total investment expenses 26,015,189 23,984,082 Securities lending expenses Borrower rebates 5,074,777 5,120,608 Management fees 375,711 409,795 Total securities lending expenses 5,450,488 5,530,403 $ 31,465,677 $ 29,514,485
See accompanying independent auditors’ report.

EMPLOYEES’ RETIREMENT SYSTEM
OF THE STATE OF HAWAII
INVESTMENT SECTION

54 Investment Section _______________________________________________________
Employees’ Retirement System of the State of Hawaii
This page is intentionally left blank.

_____________________________________________________ Investment Section 55 Letter from Chief Investment Officer
City Financial Tower • 201 Merchant Street, Suite 1400 • Honolulu, Hawaii 96813-2980 Telephone (808) 586-1660 • Fax (808) 586-1677 • http://www2.state.hi.us/ers/
Comprehensive Annual Financial Report 2004
LINDA LINGLE
GOVERNOR
STATE OF HAWAII EMPLOYEES’ RETIREMENT SYSTEM
November 3, 2004 Dear Members: It is my honor and privilege to present the Investment Section of the Comprehensive Annual Financial Report for the fiscal year ending June 30, 2004. The following are a few ERS investment highlights of the past fiscal year:
• As of June 30, 2004, ERS was one of the 150 largest defined benefit plans in the US with total assets of just under $8.6 billion.
• The fund returned 15.81% for the fiscal year 2004 and has an 8.40% return over the last ten years. In both the short and long term the fund has produced returns in excess of our actuarial target return of 8%.
• Over the last three years the fund returned 4.06%, surpassing the S&P 500 return of -0.70% over that same time period.
While the ERS investment portfolio saw a return to double-digit gains in Fiscal Year 2004 our enthusiasm for the future is tempered with caution. Most economists would agree that there are concerns looming on the horizon. Fiscal Year 2004 ended with the Federal Reserve raising interest rates for the first time in four years. Investors are now confronted by the prospect of rising interest rates, higher oil prices and the possibility of further terrorist attacks. Amid this uncertainty in the markets we will remain grounded in our simple yet disciplined investment process. The behavior of the securities markets resembles the movement of a pendulum. While the midpoint of its arc best describes the location of the pendulum “on average”, it actually spends very little of its time there. Instead, the pendulum is almost always swinging toward or away from the midpoint of its arc. Whenever the pendulum is near either extreme, it is inevitable that it will move back toward the midpoint sooner or later. It is this movement toward the extremes of the arc that supplies the energy for the swing back toward the midpoint. While this concept is easy to understand the difficulty lies in identifying where the markets are in the arc and where the pendulum is headed. Hindsight is a wonderful thing but it is difficult to see the world around you with any clarity while you are experiencing it.

56 Investment Section _______________________________________________________ Letter from Chief Investment Officer (continued)
Employees’ Retirement System of the State of Hawaii
Experience has shown that investment success cannot be achieved by predicting the movements of the markets and that it is important to always maintain focus and discipline. At the ERS, we base our decisions on a few guiding principles fundamental to prudent investment management.
• Diversify among asset classes that do not perform similarly at the same time. Diversification among asset classes, including investment size and style, should dampen overall portfolio volatility and improve performance over the long run. ERS has a diversified investment portfolio that ranges from conventional stock and bond investments to real estate and venture capital.
• Design and implement a procedure to systematically rebalance the portfolio back to target allocations. It seems against human nature to “sell the good ones” and “buy the bad ones.” People possess built-in biases in the way they make decisions in stressful or uncertain situations, and those biases can cause them to act counter to their own best interests. By systematically selling better performing assets and using the proceeds to buy more of the underperforming assets you are following the golden rule of “selling high and buying low.”
• Investing is a process that requires conviction and discipline. Through our disciplined investment process ERS has developed a strategy to invest the assets of our members and provide for their retirement benefits. As with any strategy, if you stick with it, there will be periods of underperformance in the short-term. However, given the long time horizon of the ERS we will avoid giving in to the short-term momentum that drives the market and most of its participants.
We are committed to the interests of our members and will continue to manage the assets of ERS in a prudent fashion, seeking reasonable market rates of return while attempting to avoid unreasonable risk. We stand behind our investment process, which has been tested in both bull and bear markets. While we cannot guarantee future results, our disciplined investment process will allow us to maintain consistent performance for the long run. Our patience and discipline have paid off and we will continue to strive to produce investment results necessary to meet the long-term needs of our members. Aloha pumehana,
T. Kimo Blaisdell Chief Investment Officer

_____________________________________________________ Investment Section 57 Letter from Investment Consultant
Comprehensive Annual Financial Report 2004
November 3, 2004
San Francisco
New
Jersey
Chicago
Atlanta
Denver
Board of Trustees Employees’ Retirement System of the State of Hawaii City Financial Tower 201 Merchant Street, Suite 1400 Honolulu, HI 96813-2980 Dear Trustees: Enclosed is our report on investment activity for the Hawaii Employees’ Retirement System for periods ended June 30, 2004, as requested by the Government Financial Officers’ Association (GFOA). Hawaii ERS-Total Fund Performance The total assets of the Retirement System were $8.6 billion as of June 30, 2004, an increase of roughly $800 million for the fiscal year. The increase in assets was primarily due to outstanding investment results for the year. The investment return for the total fund expressed as a time-weighted total rate of return was +15.81% for the 2004 fiscal year, compared to the benchmark’s return of +17.18%. For the three-year period ending June 30, 2004 the total fund returned +4.06% per annum versus the benchmark’s +4.68%, and for the trailing five-year period the total fund posted a return of +2.43% per annum versus the benchmark’s +2.65%. Asset Class Performance Domestic equity returned +21.80% for the fiscal year, versus the S&P 500 Index’s +19.11% and the Callan Domestic Equity Database median of +23.52%. Domestic fixed-income was down -1.45% for the year, behind the Lehman Brothers Aggregate return of +0.32% and the Callan Fixed-Income Database median return of +0.74%. International equity returned +28.02% for the 2004 fiscal year versus the MSCI EAFE Index return of +32.37%, whereas international fixed-income returned +7.87% versus the Citigroup Non-US Government Bond Index gain of +7.60%. Real Estate gained +12.26% for the year ending June 30, 2004 versus the NCREIF Total Index gain of +10.83%. Alternative investments were a positive contributor to performance, returning +18.51% for the fiscal year.
71 STEVENSON STREET, SUITE 1300, SAN FRANCISCO, CALIFORNIA 94105 Telephone 415.974.5060 Fax 415.512.0524

58 Investment Section _______________________________________________________ Letter from Investment Consultant (continued)
Employees’ Retirement System of the State of Hawaii
Employees’ Retirement System of the State of Hawaii November 3, 2004 Page 2
Market Conditions The fiscal year began with a sustained two-quarter rally in the equity markets. As with the first half of 2003, the market in the second half of the year tended to be led by lower quality or no-earnings stocks rebounding from several years of poor results. In particular, the markets received a big boost from news that the economy grew at an annual rate of 8.2% in the third quarter, the highest in nearly two decades. For the fiscal year the S&P 500 returned +19.11%. Growth stocks performed about the same as value stocks for the year. Small cap stocks led large cap stocks, continuing a recent trend. In retrospect, the beginning of 2003 did not forecast the robust recovery to come. The year got off to a wobbly start over concerns of war with Iraq. However, the economy did stage a comeback, fueled by tax cuts, lean inventories and the lowest interest rates in more than four decades. The economic rebound and a weak dollar provided the stimulus for the final missing piece: corporate profits, which had their best year since 1999. The domestic bond market finally took a breather after several years of stellar performance. The roller coaster third quarter of 2003 was a microcosm of the fiscal year for fixed-income. Bellwether bond index Lehman Aggregate (+0.32% for the fiscal year) recorded its worst month in 22 years in July (-3.4%), then turned around in September to register its best monthly gain (+2.7%) in more than six years, dating back to July 1997. The threat and then the reality of Federal Reserve rate hikes and longer term rising interest rates kept fixed-income running in place for much of the year. The one exception was the High Yield sector, which performed in excess of 10% for the year. International equities outpaced US equities for the year ended June 30, 2004 as non-US stocks rebounded from a poor protracted period of performance. The MSCI EAFE Index was up +32.37% for the fiscal year. The asset class continued to benefit from the dollar’s decline relative to foreign currencies. Fiscal year 2005 has started out with much of the same, as international markets are in positive territory so far. International bonds benefited from the dollar’s decline, outperforming the US bond market with returns above 7%. Fiscal year 2005 has been mixed so far, with flat capital market performance in the third quarter. Economic indicators are improving slowly, but there are also several obstacles to positive market performance, including the high cost of energy and the continued threat of terrorism. Throughout the difficult market conditions of the past four years, with its constant review and oversight, the Board continues to position the Retirement System for competitive performance consistent with its objectives.
Callan Associates Inc.

_____________________________________________________ Investment Section 59 Report on Investment Activity by Investment Consultant
Comprehensive Annual Financial Report 2004
Report on Investment Activity for the Employees’ Retirement System of the State of Hawaii
Prepared by Callan Associates Inc.
November 2004 Outline of Investment Policies The primary goal of the Plan is the preservation of capital. The Board of Trustees seeks preservation of capital with a consistent, positive return for the Fund. Although pure speculation is to be avoided, the Board appreciates the fact that an above average return is associated with a certain degree of risk. Risk to be assumed must be considered appropriate for the return anticipated and consistent with the total diversification of the Fund. Expected Annualized Return and Risk Based on 2004 capital market projections for 5 years, the target allocation is expected to achieve an average annualized return of 7.9% (5.3% real return with expected inflation of 2.6%). The annual nominal return is expected to fall within a range of –4.5% and 20.3% two-thirds of the time. Long-range Asset Allocation Target
The ERS only invests in the following asset classes:
Lower Limit Strategic Allocation
Upper Limit
Domestic Equity 29% 32% 35% Small/Mid Cap Equity 7% 9% 11% International Equity 15% 17% 19% Domestic Fixed-Income 19% 21% 23% International Fixed-Income 5% 7% 9% Mortgages NA 0% *** NA Equity Real Estate 0% 9% * 9% Alternative Investments 0% 5% ** 5%
* The real estate target will be the percentage actually invested up to 9% of the total fund. Changes in
the real estate target will be offset by an equal percentage change in the large cap domestic equity target.
** The alternatives target will be the percentage actually invested up to 5% of the total fund. Changes in
the alternatives target will be offset by an equal percentage change in the large cap domestic equity target.
*** The mortgage target will be the percentage of the total fund actually invested. Changes in the mortgage target will be offset by an equal change in the domestic fixed-income target.

60 Investment Section _______________________________________________________ Report on Investment Activity by Investment Consultant (continued)
Employees’ Retirement System of the State of Hawaii
Adjustments in the above targets take place annually in conjunction with the annual asset allocation review. The target is evaluated on the basis of assets designated to each asset class by the Board, rather than on a current invested position. The target is to be pursued primarily by cash flow on a long-term basis and be revised if significant changes occur within the economic and/or capital market environment according to the rebalancing guidelines. The target is to be reviewed annually for reasonableness relative to significant economic and market changes. A formal asset allocation/liability study is conducted at least every three years to verify or amend the targets. The last formal asset allocation/liability study was completed in the first half of 2002. At that time, the Board chose to maintain the current strategic asset allocation implemented July 1, 2000. The target was again reviewed in early 2003 and 2004. A full asset/liability study will next take place in early 2005. Portfolio Evaluation Benchmark To monitor the total fund result, a special target index has been constructed to measure the fund’s performance based on the current target mix. This serves as a minimum performance objective for the Fund. The target is adjusted quarterly to reflect the assets actually invested in real estate and alternative investments. The target index objective is included in all quarterly evaluation reports of the ERS. The composition of the index as of June 30, 2004 is:
♦ 35.8% of the Standard & Poor’s 500 Stock Index ♦ 4.5% of the Standard & Poor’s Mid Cap 400 Index ♦ 4.5% of the Russell 2000 Index ♦ 17% of the Morgan Stanley Capital International EAFE Index ♦ 21% of the Lehman Brothers Aggregate Bond Index ♦ 7% of the Citigroup Non-U.S. World Government Bond Index ♦ 7% of the NCREIF Total Index ♦ 3.2% of the Post Venture Cap Index
Individual investment managers are not to be measured against this total fund objective. However, it is expected that the sum of their efforts exceeds the objective over time. Manager Evaluation Individual domestic and international equity and bond managers are measured against relevant indexes and their respective peer groups of managers. Market indices and peer group benchmarks are assigned to each manager and are intended as a guide for the investment manager to understand the risk/reward posture of their portfolio. Real Estate managers are measured against the median performance of the Callan Associates Real Estate database and the NCREIF Total Index. Managers have full discretion to manage the risk posture of their portfolios relative to their designated market index and may, with conviction and appropriate expertise, execute security strategies not reflected by their market index as long as they conform to the investment guidelines and the laws of the State of Hawaii.

_____________________________________________________ Investment Section 61 Report on Investment Activity by Investment Consultant (continued)
Comprehensive Annual Financial Report 2004
Investment Practices The full Investment Policy Statement describes in detail acceptable investment practices, manager reporting requirements, manager performance guidelines, the distribution of brokerage commissions, and securities lending guidelines. The IPS was revised in August 2004. All rates of return are calculated using methodologies that are generally accepted by the Association for Investment Management and Research (AIMR). All domestic equity manager returns are daily, time-weighted rates of return based on custodial data. International equity, domestic fixed-income, and global fixed-income returns are monthly, time-weighted returns. Real estate returns are calculated using statements received directly from the manager. This ensures that the performance is based on accurate cash flows and appraisal values. Investment Results
Year Ended June 30,
Three Years Ended
Five Years Ended
2004 2003 2002 2001 2000 6/2004 6/2004
Domestic Equity 21.80% (0.39%) (14.57%) (10.11%) 2.26% 1.20% (0.96%)
Standard & Poor's 500 19.11% 0.25% (17.99%) (14.83%) 7.25% (0.70%) (2.20%) CAI Total Domestic Equity DB 23.52% (0.13%) (13.83%) (6.75%) 11.79% 2.48% 3.94%
Domestic Fixed-Income (1.45%) 11.12% 8.82% 11.18% 4.94% 6.02% 6.81% Lehman Bros. Aggregate Index 0.32% 10.40% 8.63% 11.22% 4.57% 6.36% 6.95% CAI Dom Fixed-Income DB 0.74% 10.55% 7.97% 11.05% 4.58% 6.42% 6.88%
International Equity 28.02% (7.90%) (12.25%) (23.27%) 23.31% 1.14% (0.43%) MSCI EAFE Index-USD 32.37% (6.46%) (9.49%) (23.60%) 17.15% 3.87% 0.06% CAI Non-U.S. Equity DB 31.18% (5.61%) (7.74%) (23.47%) 24.15% 5.19% 2.86%
International Fixed-Income 7.87% 20.43% 16.84% (4.34%) 0.96% 14.93% 7.95% Citigroup Non-U.S.
Government Bond Idx
7.60%
17.90%
15.73%
(7.43%)
2.42%
13.66%
6.84% CAI Non-U.S. Fixed DB 7.61% 18.24% 15.65% (6.16%) 1.35% 13.96% 6.99%
Real Estate 12.26% 6.89% 3.09% 5.65% 9.93% 7.35% 7.52% NCREIF Total Property Index 10.83% 7.64% 5.50% 11.57% 11.62% 7.97% 9.40% CAI Real Estate Funds 9.35% 7.79% 5.76% 11.21% 10.10% 7.71% 8.86%
Alternative Investments 18.51% (11.26%) (13.40%) 7.68% 44.34% (3.07%) 7.20% Post Venture Cap Index 32.38% 19.79% (44.29%) (48.23%) 40.35% (4.05%) 8.49%
Total Fund 15.81% 2.97% (5.52%) (6.80%) 7.38% 4.06% 2.43% Composite Benchmark 17.18% 4.61% (6.42%) (8.68%) 8.82% 4.68% 2.65%

62 Investment Section _______________________________________________________ Report on Investment Activity by Investment Consultant (continued)
Employees’ Retirement System of the State of Hawaii
Asset Allocation as of June 30, 2004 Actual Asset Allocation Target Asset Allocation
Small & MidCap Eqty10%
Intl Equity18%
Intl Fixed-Inc.7%
Real Estate7%
Alternative Inv.3%
Lrg Cap Equity36%
Domestic Fixed-Income
19%
Small & MidCap Eqty9%
Intl Equity17%
Intl Fixed-Inc.7%
Real Estate7%
Alternative Inv.3%
Lrg Cap Equity36%
Domestic Fixed-Income
21%
The Target Benchmark as of June 30, 2004 was 35.8% S&P 500, 4.5% S&P Mid Cap 400, 4.5% Russell 2000, 21.0% Lehman Aggregate, 7.0% NCREIF Total Index, 3.2% Post Venture Capital Index, 17.0% MSCI EAFE Index and 7.0% Citigroup Non-US Government Bond Index. Monies to be allocated to long-term real estate and alternatives are considered to be “parked” in domestic equities until drawn down.
Asset Class Weights vs CAI Public Fund - Large (>1B)
Wei
ghts
0%
10%
20%
30%
40%
50%
60%
70%
Domestic Domestic Short Real Intl Intl. AlternativeBroad Eq Fixed-Income Term/Cash Estate Equity Fixed-Inc. Inv.
(35)(41)
(93)(87)
(36)(36)
(70)(72)
(37)(36)(52)(52)
10th Percentile 55.04 40.48 3.15 8.66 21.84 14.21 9.5725th Percentile 49.99 31.19 1.75 7.81 20.92 7.91 6.20
Median 41.10 27.81 0.90 5.64 18.40 5.74 3.4475th Percentile 39.53 22.07 0.13 2.55 16.88 3.86 2.6690th Percentile 32.65 19.79 0.04 0.62 13.01 3.26 1.26
Fund 46.32 18.94 - 7.08 17.56 6.89 3.21
Target 44.75 21.00 - 7.04 17.00 7.00 3.21

_____________________________________________________ Investment Section 63 Investment Professionals
Comprehensive Annual Financial Report 2004
INVESTMENT MANAGERS
U.S. EQUITIES REAL ESTATE Ark Asset Management Co. Clarion Partners Bank of Hawaii C.B. Richard Ellis Investors Barrow, Hanley, Mewhinney & Strauss Heitman Capital Management Bishop Street Capital Management Invesco Realty Advisors CM Bidwell & Associates Delaware Investment Advisors Denver Investment Advisors Goldman Sachs Asset Management Independence Investment Associates Jennison Associates Mellon Capital Management Corporation Oppenheimer Capital Corporation T. Rowe Price INTERNATIONAL EQUITIES U.S. FIXED-INCOME Bank of Ireland Asset Management Bishop Street Capital Management Capital International, Inc. Bradford and Marzec Julius Baer Investment Management Pacific Income Advisers Mercator Asset Management Pacific Investment Management Company State Street Global Advisors ALTERNATIVE INVESTMENTS INTERNATIONAL FIXED-INCOME Abbott Capital Management, LLC Oechsle International Advisors Hancock Timber Resource Group Pacific Investment Management Company
OTHER SERVICE PROVIDERS
COMMISSION RECAPTURE BROKERS CUSTODIAL BANK Donaldson & Co., Incorporated State Street Bank & Trust Company Rochdale Securities Corporation Lynch, Jones & Ryan/Instinet INVESTMENT ADVISOR SunTrust Robinson Humphrey Callan Associates Inc.

64 Investment Section _______________________________________________________ Investment Schedules
Employees’ Retirement System of the State of Hawaii
List of Assets Directly Held (by fair value)* as of June 30, 2004 (excludes investments in pooled vehicles) * A complete list of holdings is available for review upon request.
Rank Par / Shares Security Coupon Due Standard & Poors Fair Value
Domestic Fixed Income
1 26,200,000 Federal National Mortg Discount Notes 1.4144% 9/22/2004 AAA $ 26,105,195 2 24,800,000 Federal National Mortg Discount Notes 1.040% 7/21/2004 AAA 24,734,668 3 23,578,000 United States Treasury Bonds 5.375% 2/15/2031 AAA 23,784,308 4 21,570,000 United States Treasury Note 5.875% 11/15/2004 AAA 21,910,400 5 20,304,000 Federal National Mortg (REMIC) 6.389% 5/25/2036 AAA 20,504,254 6 20,240,000 United States Treasury Note 2.250% 4/30/2006 AAA 20,100,850 7 19,727,375 Federal National Mortg (Pool 725257) 5.500% 2/1/2034 AAA 19,695,780 8 17,422,544 United States Treasury Note 3.875% 1/15/2009 AAA 19,420,692 9 17,800,000 Federal National Mortg Discount Notes 1.055% 8/4/2004 AAA 17,752,333
10 15,848,000 Federal Natl Mortg (TBA Jul30 SingleFamily) 6.000% 12/31/2099 AAA 16,169,913
International Fixed Income 1 26,660,000 Republic of Italy 4.500% 5/01/2009 AA- $ 33,636,020 2 2,510,000,000 Japan 0.300% 12/20/2007 AA- 22,866,154 3 16,356,000 Republic of Greece 3.500% 4/18/2008 A+ 19,943,308 4 11,700,000 Federal Republic of Germany 5.250% 1/4/2011 AAA 15,292,452 5 8,400,000 United Kingdom Stock 5.000% 3/07/2012 AAA 15,129,810 6 11,480,000 Kingdom of Spain 5.150% 7/30/2009 AA+ 14,934,633 7 10,000,000 Bundesrepublik Deutsche (Germany) 6.500% 7/04/2027 AAA 14,818,798 8 1,567,000,000 Republic of Italy 0.375% 10/10/2006 AA 14,427,056 9 1,563,000,000 Compagnie De Financie (France) 0.400% 9/22/2006 AAA 14,378,053
10 11,014,000 Republic of Greece 5.350% 5/18/2011 A+ 14,369,688
Domestic Equities 1 1,527,466 Pfizer Inc. $ 52,361,534 2 1,588,590 Intel Corp 43,845,084 3 1,510,588 Microsoft Corp 43,142,393 4 1,769,338 Cisco Systems Inc 41,933,311 5 772,846 Citigroup Inc 35,937,339 6 664,735 Pepsico Inc 35,815,922 7 401,844 Bank America Corp 34,004,039 8 843,165 General Electric Co 27,318,546 9 501,860 BP PLC 26,884,640
10 513,800 Occidental Pete Corp 24,873,058
International Equities 1 73,188 Nestle SA – CHF1 (Regd) $ 19,518,358 2 89,038 Total SA, Euro10 Series B 16,975,012 3 320,160 Carnival Corp – Paired 1 Com Carn
& 1 Tr Sh Ben
15,047,520 4 6,505,132 Vodafone Group Ord USD0.10 14,244,944 5 178,600 XL Capital Ltd 13,477,156 6 253,900 Canon Inc – JPY50 13,379,691 7 565,532 ING Group NV - CVA Euro .24 13,348,259 8 181,457 UBS AG – CHF.80 (Regd) 12,786,314 9 157,755 E on AG 11,381,605
10 518,946 ABN AMRO Holdings NV – Euro 0.56 11,352,135

______________________________________________________ Investment Section 65 Investment Schedules (continued)
Comprehensive Annual Financial Report 2004
Investments Summary (Dollar values expressed in thousands) Fair Value as of
June 30, 2004
Percentage Fair Value as of
June 30, 2003
Percentage Equity securities Common stock $ 3,469,292 43.4% $ 3,155,638 42.1% Index funds 1,605,691 20.1% 1,178,688 15.7% Pooled and others 307,190 3.8% 201,113 2.7% 5,382,173 67.3% 4,535,439 60.5% Fixed income securities Mortgage-backed securities 499,829 6.3% 595,301 7.9% U.S. Government bonds 218,755 2.7% 274,621 3.7% Foreign bonds 594,519 7.4% 616,089 8.2% U.S. corporate bonds 335,551 4.2% 491,493 6.5% Asset backed securities 59,423 0.7% 89,846 1.2% Pooled and others 14,388 0.2% 27,269 0.4% 1,722,465 21.5% 2,094,619 27.9% Others Real estate equities 609,169 7.6% 587,477 7.8% Real estate mortgages 14,175 0.2% 37,142 0.5% Alternative investments 274,047 3.4% 249,609 3.3% 897,391 11.2% 874,228 11.6% Total, investments at fair value $ 8,002,029 100.0% $ 7,504,286 100.0% Schedule of Investment Fees by Asset Class Allocation (Dollar values expressed in thousands) Fair value as of
June 30, 2004 Total FY 2004
Investment Fees Basis
Points Equities U.S. equities $ 3,973,294 International equities 1,506,504 5,479,798 $ 12,957 Fixed Income U.S. bonds 1,610,112 International bonds 591,247 2,201,359 3,556 Other Asset Allocations Real estate 609,169 Real estate mortgages 14,175 Alternative investments 274,047 897,391 8,176 Other Investment Services Custodian fees 310 Investment consultant fees 561 Total $ 8,578,548 $ 25,560 30 bp

66 Investment Section ________________________________________________________ Investment Schedules (continued)
Employees’ Retirement System of the State of Hawaii
Schedule of Broker Commissions
The Employees' Retirement System participates in a Commission Recapture Program with four brokerage firms for equity trades, which are listed in the Investment Professionals section. Domestic and international investment managers are required to direct at least 35% of all brokerage transactions to participating brokers. Commissions charged per share are based on the investment manager’s normal rate schedule. All commissions recaptured are used exclusively by the ERS for the benefit of its members and beneficiaries. ERS does not guarantee participating brokers any minimums, required volumes or fees. During the fiscal year ended June 30, 2004 the ERS recaptured $875,379 in commissions. The following is a list of brokers who received $50,000 or more in commissions during Fiscal Year 2004. A complete list of all commissions is available for review upon request.
Commission
Brokerage Firms Shares Traded
Dollar Volume of Trades
Dollar Amount Per Share
Donaldson & Co 8,217,020 $301,793,340 $ 397,789 $0.048 Citigroup 11,206,879 228,103,725 366,059 0.033 Credit Suisse First Boston 35,247,505 321,599,613 328,241 0.009 Merrill Lynch Pierce Fenner & Smith 15,115,194 208,737,798 302,425 0.020 Lynch Jones & Ryan / Instinet 14,179,815 268,689,512 297,133 0.021 Morgan Stanley Dean Witter 10,872,660 167,615,545 266,652 0.025 UBS Warburg 11,365,891 203,533,068 260,118 0.023 Bear Stearns & Co. 13,080,675 351,045,483 242,461 0.019 Lehman Brothers 3,489,021 95,275,176 165,794 0.048 ABN AMRO 24,591,580 170,529,760 165,450 0.007 AG Edwards 3,283,017 107,448,807 154,611 0.047 Deutsche Bank Morgan Grenfell 8,971,176 106,937,858 141,240 0.016 J P Morgan Chase Bank 3,462,530 78,831,733 137,775 0.040 Broadcort Capital 2,673,690 83,396,978 133,877 0.050 Goldman Sachs 8,362,798 77,982,849 132,721 0.016 Credit Lyonnais 16,724,817 174,320,189 129,059 0.008 Bank of New York 2,520,376 85,191,025 116,982 0.046 Suntrust Capital 2,385,767 71,987,411 112,662 0.047 Citation Group 1,821,200 68,084,705 91,060 0.050 Rochdale Securities 1,676,055 65,919,756 84,412 0.050 Sanford C Bernstein 2,104,741 58,330,825 75,393 0.036 Knight Securities 1,540,500 46,866,901 52,261 0.034 Jefferies Company 1,347,200 22,726,182 51,161 0.038 Others (includes 156 firms) 121,637,976 922,047,186 1,378,273 0.011 Commissioned equity trades 325,878,083 $4,286,995,425 $5,583,609 $0.017 Less commissions recaptured (875,379)
Trades at net commission 325,878,083 $4,286,995,425 $4,708,230 $0.014

EMPLOYEES’ RETIREMENT SYSTEM
OF THE STATE OF HAWAII
ACTUARIAL SECTION

68 Actuarial Section _______________________________________________________ Letter from the Actuary
_________________________________________________________________________________ Employees’ Retirement System of the State of Hawaii
December 13, 2004
Board of Trustees Employees’ Retirement System of The State of Hawaii City Financial Tower 201 Merchant St., Ste. 1400 Honolulu, HI 96813-2980 Dear Trustees: Subject: Actuarial Valuation as of June 30, 2004 We certify that the information contained in the 2004 actuarial valuation report is accurate and fairly presents the actuarial position of the Employees’ Retirement System of the State of Hawaii (ERS) as of June 30, 2004. All calculations have been made in conformity with generally accepted actuarial principles and practices, and with the Actuarial Standards of Practice issued by the Actuarial Standards Board. In our opinion, the results presented comply with the requirements of the Hawaii statutes and, where applicable, the Internal Revenue Code, ERISA, and the Statements of the Governmental Accounting Standards Board. The undersigned are independent actuaries. One or more of them are an Enrolled Actuary, a Member of the American Academy of Actuaries, and/or are experienced in performing valuations for large public retirement systems. Actuarial valuations The primary purpose of the valuation report is to determine the adequacy of the current employer contribution rate through measuring the resulting funding period, to describe the current financial condition of ERS, and to analyze changes in ERS’s condition. In addition, the report provides information required by ERS in connection with Governmental Accounting Standards Board Statement No. 25 (GASB No. 25), and it provides various summaries of the data. Valuations are prepared annually, as of June 30th of each year, the last day of ERS’s plan year and fiscal year.

_______________________________________________________ Actuarial Section 69 Letter from the Actuary (continued)
GABRIEL, ROEDER, SMITH & COMPANY Comprehensive Annual Financial Report 2004
Trustees December 13, 2004 Page 2 Financing objectives Contribution rates are established by Law that, over time, are intended to remain level as a percent of payroll. The employee and employer contribution rates have been set by Law and are intended to provide for the normal cost plus the level percentage of payroll required to amortize the unfunded actuarial accrued liability (UAAL) over a period not in excess of 30 years. Act 181/2004 amended the statute to change the financing objectives to this fixed contribution rate policy. Prior valuations calculated the required employer contribution to amortize the UAAL over a closed period. Progress toward realization of financing objectives The actuarial accrued liability, the unfunded actuarial accrued liability (UAAL), and the calculation of the resulting funding period illustrate the progress toward the realization of financing objectives. Based on this actuarial valuation as of June 30, 2004, ERS’s underfunded status has increased because of the further recognition of the deferred investment losses that occurred as a result of the poor investment markets in FY2002 and FY2003, and the UAAL is now $3.474 billion. Based on the statutory employer contribution rate of 15.75% for Police and Fire employees, 13.75% for All Other Employees, and Employee contributions, the remaining amortization period is 22.6 years. Because this period is less than 30 years, the financing objectives of ERS are being realized. Benefit provisions and Legislative Changes Since the last valuation, the legislature enacted the following benefit enhancement to the ERS statutes: • Act 177/2004 allows police officers with a permanent service-connected disability to retain
the 2-1/2% benefit multiplier for each year of service as a police officer. • Act 179/2004 increased the Noncontributory service-connected disability formula to 35%
of average final compensation. The Act adds a “pop-up” feature to the joint & survivor benefit options if the beneficiary predeceases the retiree. The Act also changed the methodology for crediting interest on contributions for terminated members so that interest continues to accrue until the date of refund. Finally, the Act also created the new Hybrid Plan. However, the Hybrid Plan is not reflected in this valuation since the effective date of the plan is July 1, 2006.
The legislature also enacted two other pieces of legislation which impact ERS.

70 Actuarial Section _______________________________________________________ Letter from the Actuary (continued)
GABRIEL, ROEDER, SMITH & COMPANY _________________________________________________________________________________________________
Employees’ Retirement System of the State of Hawaii
Trustees December 13, 2004 Page 3 • Act 181/2004 establishes fixed employer contribution rates as a percentage of
compensation effective July 1, 2005. Employers will contribute 15.75% for their police officers and firefighters and 13.75% for other employees.
• Act 183/2004 amends the ERS statutes to comply with the federal tax limits on compensation retroactive to July 1, 1996.
See the Summary of Retirement Benefit Plan Provisions in the Introductory Section of this CAFR for more details on the benefit provisions. Assumptions and methods With the exception of the assumptions for the investment return and for the salary scale, the actuarial assumptions used were adopted based on the recommendations provided by an experience study performed by the prior actuary. The investment return assumption and the salary scale assumption were set by legislative action. Further detail on the assumptions and methods may be found in Table 19 of this report. The assumptions that are based on the actuaries’ recommendations are internally consistent and are reasonably based on the actual experience of ERS. These assumptions are also in full compliance with all parameters established by GASB No. 25. Data Member data for retired, active, and inactive participants was supplied as of March 31, 2004, by ERS’s staff. We have not subjected this data to any auditing procedures, but have examined the data for reasonableness and consistency with the prior year's data. Asset information was supplied by ERS’s staff. Responsibility for Tables and Schedules
The actuary is responsible for the information with respect to years after 1999 in the Required Supplementary Information, the Schedule of Employer Contributions, and the Note To Required Supplementary Information in the Financial Section of the ERS’s Comprehensive Annual Financial Report (CAFR). Information with respect to years prior to 2000 was supplied by ERS. Tables and schedules in the Actuarial Section of the CAFR were generally prepared directly by the Actuary. Certain of these tables, however, were prepared by ERS utilizing information from this report. When those tables were prepared by ERS from our report, they are so noted.

_______________________________________________________ Actuarial Section 71 Letter from the Actuary (continued)
GABRIEL, ROEDER, SMITH & COMPANY Comprehensive Annual Financial Report 2004
Trustees December 13, 2004 Page 4 The following exhibits and tables were prepared by the Actuary:
• Executive Summary • Actuarial Certification Statement • Exhibit 1 – Development of Employer Cost • Exhibit 2 – Actuarial Present Value of Future Benefits • Exhibit 3 – Analysis of Normal Cost • Exhibit 4 – Development of Actuarial Value of Assets • Exhibit 5 – Total Experience Gain or Loss • Exhibit 6 – Investment Experience Gain or Loss • Exhibit 7 – Employer Appropriations to Pension Accumulation Fund • Exhibit 8 – Highlights of Last Five Annual Actuarial Valuations • Ten-Year Actuarial Schedules
o Membership Data, March 31, 2004 o Historical Summary of Active Member Data
Sincerely, Gabriel, Roeder, Smith & Company
klb j:\3046\2004\Val\2004_Val.doc

72 Actuarial Section _______________________________________________________ Executive Summary
GABRIEL, ROEDER, SMITH & COMPANY _________________________________________________________________________________________________
Employees’ Retirement System of the State of Hawaii
The following summarizes the key results of the June 30, 2004 actuarial valuation of the Employees’ Retirement System of the State of Hawaii (ERS).
Item 2004 2003 Membership
• Number of - Active members 62,573 62,292 - Retirees and beneficiaries 32,297 31,389 - Inactive, vested 4,501 4,150 - Total 99,371 97,831
• Covered payroll for active members $2,755.5 million $2,718.4 million• Actual benefit payments and refunds $638.5 million $605.4 million
Assets
• Actuarial value $8,797.1 million $9,074.0 million• Market value $8,565.4 million $7,687.2 million• Return on actuarial value 0.8% 0.2%• Return on market value 16.5% 1.9%• Employer contributions during fiscal
year $235,685,796 $190,586,276• External cash flow % (4.2%) (4.7%)
Actuarial Information
• Normal cost % 7.32% 7.26%• Unfunded actuarial accrued liability
(UAAL) $3,474.2 million $2,878.1 million• Funded ratio (based on actuarial
assets) 71.7% 75.9%• Funded ratio (based on market assets) 69.8% 62.6%• Funding period (years) 22.6 26.0• Employer contribution rate % of projected payroll * 13.95% N/A **
* Weighted average of 15.75% Contribution Rate for Police and Firefighters and 13.75% Contribution Rate for All Other Employees.
** Act 181/2004 changed the funding policy from a fixed amortization period to a fixed contribution rate. The fixed contribution rate is effective beginning July 1, 2005.

_______________________________________________________ Actuarial Section 73 Actuarial Certification Statement
GABRIEL, ROEDER, SMITH & COMPANY Comprehensive Annual Financial Report 2004
Police and Firefighters
All Other Employees All Employees
June 30, 2004 June 30, 2004 June 30, 2004 1. Gross normal cost as a percentage of
pay 16.61% 6.25% 7.32% 2. Present value of future benefits a. Active employees $ 1,425,953,862 $ 5,975,957,090 $ 7,401,910,952 b. Inactive members 15,847,734 197,942,611 213,790,345 c. Pensioners and beneficiaries 969,825,560 5,308,770,818 6,278,596,378 d. Total $ 2,411,627,156 $ 11,482,670,519 $ 13,894,297,675 3. Present value of future employee and
employer contributions a. Present value of future normal costs $ 397,572,685 $ 1,225,394,100 $ 1,622,966,785 b. Present value of future employee
contributions 294,587,249 99,501,677 394,088,926 c. Present value of future employer
normal costs (Item 3a – Item 3b) $ 102,985,436 $ 1,125,892,423 $ 1,228,877,859 4. Actuarial accrued liability (Item 2d – Item 3a) $ 2,014,054,471 $ 10,257,276,419 $ 12,271,330,890 5. Actuarial value of assets a. Annuity Savings Fund $ 433,585,113 $ 472,958,400 $ 906,543,513 b. Pension Accumulation Fund 1,103,880,227 6,786,709,409 7,890,589,636 c. Total $ 1,537,465,340 $ 7,259,667,809 $ 8,797,133,149 6. Unfunded actuarial accrued liability $ 476,589,131 $ 2,997,608,610 $ 3,474,197,741 7. Adequacy of contribution rates a. Statutory Contribution Rate as of
July 1, 2005 15.75% 13.75% 13.95% b. Funding Period as of June 30, 2004
(in years) 23.2 22.5 22.6 The actuarial valuation as of June 30, 2004 is based on the provisions of Chapter 88 of the Hawaii Revised Statutes, as amended. The assumptions used in the cost calculations were those adopted by the Board of Trustees based on statutory requirements and on the prior actuary’s actuarial experience investigation report covering the 1995-2000 period. The actuarial calculations were performed by qualified actuaries in accordance with accepted actuarial procedures. In our opinion, the contributions required to meet the ERS’s liabilities were calculated in accordance with the provisions of Chapter 88 regarding the funding of the Employees’ Retirement System on an actuarial reserve basis.
W. Michael Carter, FSA, EA Senior Consultant

74 Actuarial Section _______________________________________________________ Summary of 2004 Actuarial Valuation
GABRIEL, ROEDER, SMITH & COMPANY _________________________________________________________________________________________________
Employees’ Retirement System of the State of Hawaii
Exhibit 1 Development of Employer Cost
Police and Firefighters
All Other Employees All Employees
June 30, 2004 June 30, 2004 June 30, 2004 1. Payroll (adjusted for one year’s pay increase) $ 288,245,533 $ 2,576,860,398 $ 2,865,105,931 2. Present value of future benefits (Exhibit 2) $ 2,411,627,156 $ 11,482,670,519 $ 13,894,297,675 3. Gross normal cost at 6/30/2004 (Exhibit 3) 16.61% 6.25% 7.32% 4. Present value future normal cost $ 397,572,685 $ 1,225,394,100 $ 1,622,966,785 5. Actuarial accrued liability (Item 2 – Item 4) $ 2,014,054,471 $ 10,257,276,419 $ 12,271,330,890 6. Present value future employee contributions $ 294,587,249 $ 99,501,677 $ 394,088,926 7. Weighted effective employee contribution % (Exhibit 3) 12.20% 0.50% 1.78% 8. Employer normal cost rate (Item 3 - Item 7) 4.41% 5.75% 5.54% 9. Actuarial value of assets $ 1,537,465,340 $ 7,259,667,809 $ 8,797,133,149 10. Unfunded actuarial accrued liability (UAAL) (Item 5 - Item 9) $ 476,589,131 $ 2,997,608,610 $ 3,474,197,741 11. Funding period a. Statutory Contribution Rate Beginning July 1, 2005 15.75% 13.75% 13.95% b. Less Employer normal cost - 4.41% - 5.75% - 5.54% c. Employer Amortization payment (level %) (Item 11a – Item 11b) 11.34% 8.00% 8.41% d. Funding Period in years 23.2 22.5 22.6

_______________________________________________________ Actuarial Section 75 Summary of 2004 Actuarial Valuation (continued)
GABRIEL, ROEDER, SMITH & COMPANY Comprehensive Annual Financial Report 2004
Exhibit 2 Actuarial Present Value of Future Benefits
Police and Firefighters
All Other Employees All Employees
June 30, 2004 June 30, 2004 June 30, 2004 (1) (2) (3) 1. Active members a. Service retirement benefits $ 1,332,961,920 $ 5,322,887,861 $ 6,655,849,781 b. Deferred termination benefits 21,149,767 260,159,387 281,309,154 c. Refunds 25,568,570 5,189,093 30,757,663 d. Survivor benefits 33,676,618 129,425,620 163,102,238 e. Disability retirement benefits 12,596,987 258,295,129 270,892,116 f. Total $ 1,425,953,862 $ 5,975,957,090 $ 7,401,910,952 2. Retired members a. Service retirement $ 913,558,257 $ 5,040,846,669 $ 5,954,404,926 b. Disability retirement 23,037,586 87,330,858 110,368,444 c. Beneficiaries 33,229,717 180,593,291 213,823,008 d. Total $ 969,825,560 $ 5,308,770,818 $ 6,278,596,378 3. Inactive members a. Vested terminations $ 11,998,851 $ 187,505,709 $ 199,504,560 b. Nonvested terminations 3,848,883 10,436,902 14,285,785 c. Total $ 15,847,734 $ 197,942,611 $ 213,790,345 4. Total actuarial present value of future
benefits $ 2,411,627,156 $ 11,482,670,519 $ 13,894,297,675 June 30, 2003 June 30, 2003 June 30, 2003 (1) (2) (3) 1. Active members a. Service retirement benefits $ 1,238,320,865 $ 5,353,642,662 $ 6,591,963,527 b. Deferred termination benefits 18,346,151 277,455,905 295,802,056 c. Refunds 21,851,349 644,901 22,496,250 d. Survivor benefits 32,246,881 142,355,434 174,602,315 e. Disability retirement benefits 11,288,771 252,110,291 263,399,062 f. Total $ 1,322,054,017 $ 6,026,209,193 $ 7,348,263,210 2. Retired members a. Service retirement $ 868,250,149 $ 4,748,854,632 $ 5,617,104,781 b. Disability retirement 22,582,153 81,064,146 103,646,299 c. Beneficiaries 29,869,249 161,636,349 191,505,598 d. Total $ 920,701,551 4,991,555,127 5,912,256,678 3. Inactive members a. Vested terminations $ 10,792,835 $ 188,486,159 $ 199,278,994 b. Nonvested terminations 3,159,856 9,926,237 13,086,093 c. Total $ 13,952,691 $ 198,412,396 $ 212,365,087 4. Total actuarial present value of future
benefits $ 2,256,708,259 $ 11,216,176,716 $ 13,472,884,975

76 Actuarial Section _______________________________________________________ Summary of 2004 Actuarial Valuation (continued)
GABRIEL, ROEDER, SMITH & COMPANY _________________________________________________________________________________________________
Employees’ Retirement System of the State of Hawaii
Exhibit 3
Analysis of Normal Cost
Police and Firefighters
All Other Employees All Employees
June 30, 2004 June 30, 2004 June 30, 2004 1. Normal cost as a percent of pay a. Service retirement benefits 13.80% 4.93% 5.85% b. Deferred termination benefits 0.35% 0.66% 0.63% c. Refunds 1.60% 0.16% 0.31% d. Disability retirement benefits 0.21% 0.32% 0.31% e. Survivor benefits 0.65% 0.18% 0.22% f. Total 16.61% 6.25% 7.32% 2. Weighted average employee contribution rate a. Present value of employee contributions (in $000) $ 294,587 $ 99,502 $ 394,089 b. Present value of future salary (in $000) $ 2,414,650 $ 19,760,692 $ 22,175,342 c. Effective employee contribution rate (a / b) 12.20% 0.50% 1.78% 3. Effective employer normal cost rate (Item 1f – Item 2c) 4.41% 5.75% 5.54%

_______________________________________________________ Actuarial Section 77 Summary of 2004 Actuarial Valuation (continued)
GABRIEL, ROEDER, SMITH & COMPANY Comprehensive Annual Financial Report 2004
Exhibit 4
Development of Actuarial Value of Assets
June 30, 2004 June 30, 2003 1. Actuarial value at beginning of year $ 9,073,960,399 $ 9,415,160,481 2. Contributions 290,802,248 247,800,797 3. Benefits and refunds paid (638,543,413) (605,413,482) 4. Expected investment return 712,007,185 738,908,331 5. Preliminary actuarial value of assets at end of year $ 9,438,226,419 $ 9,796,456,127 6. Market value at end of year $ 8,565,405,137 $ 7,687,164,883 7. Outstanding excess investment earnings credit (Act 100/1999) - - 8. Adjusted market value of assets (Items 7 + Item 8) $ 8,565,405,137 $ 7,687,164,883 9. Market value excess (Item 8 – Item 5) $ (872,821,282) $ (2,109,291,244) 10. Determination of market value excess for current year a. Balance from 3 years ago $ (302,665,924) $ 47,091,100 b. Balance from 2 years ago (633,266,245) (605,331,847) c. Balance from 1 year ago (450,863,347) (949,899,368) d. Balance from current year 513,974,234 (601,151,129) 11. Amortization of market value excess a. Write-up from 3 years ago $ (302,665,924) $ 47,091,100 b. Write-up from 2 years ago (316,633,123) (302,665,923) c. Write-up from 1 year ago (150,287,782) (316,633,123) d. Write-up from current year 128,493,559 (150,287,782) e. Total excess investment return $ (641,093,270) $ (722,495,728) 12. Actuarial value at end of year (Item 5 + Item 11e) $ 8,797,133,149 $ 9,073,960,399 13. Annuity Savings Fund $ 906,543,513 $ 906,504,024 14. Pension Accumulation Fund (Item 12 – Item 13) $ 7,890,589,636 $ 8,167,456,375 15. Reserve for future years (Item 8 – Item 12) $ (231,728,012) $ (1,386,795,516)

78 Actuarial Section _______________________________________________________ Summary of 2004 Actuarial Valuation (continued)
GABRIEL, ROEDER, SMITH & COMPANY _________________________________________________________________________________________________
Employees’ Retirement System of the State of Hawaii
Exhibit 5 Total Experience Gain or Loss
Police and Firefighters
All Other Employees All Employees
Item June 30, 2004 June 30, 2004 June 30, 2004 A. Calculation of total actuarial gain or loss 1. Unfunded actuarial accrued liability (UAAL),
previous year $ 331,523,898 $ 2,546,573,145 $ 2,878,097,043 2. Normal cost for the year (employer and
employee) $ 44,074,893 $ 161,160,024 $ 205,234,917 3. Less: contributions and assessments for the year $ (56,742,742) $ (234,059,506) $ (290,802,248) 4. Interest at 8% a. On UAAL $ 26,521,912 $ 203,725,852 $ 230,247,764 b. On normal cost 1,762,996 6,446,401 8,209,397 c. On contributions (2,269,710) (9,362,380) (11,632,090) d. Total 26,015,198 200,809,873 226,825,071 5. Expected UAAL (Sum of Items 1 – 4) $ 344,871,247 $ 2,674,483,536 $ 3,019,354,783 6. Actual UAAL $ 476,589,131 $ 2,997,608,610 $ 3,474,197,741 7. Total gain (loss) for the year (Item 5 – Item 6) $ (131,717,884) $ (323,125,074) $ (454,842,958) B. Source of gains and losses 8. Asset gain (loss) for the year (Exhibit 6) $ (111,049,247) $ (530,044,023) $ (641,093,270) 9. Liability gain (loss) for the year $ (20,247,043) $ 208,951,287 $ 188,704,244 10. Change in benefit provisions (Act 177, Act 179) (421,594) (2,032,338) (2,453,932) 11. Total $ (131,717,884) $ (323,125,074) $ (454,842,958)

_______________________________________________________ Actuarial Section 79 Summary of 2004 Actuarial Valuation (continued)
GABRIEL, ROEDER, SMITH & COMPANY Comprehensive Annual Financial Report 2004
Exhibit 6 Investment Experience Gain or Loss
Item June 30, 2004 June 30, 2003
1. Actuarial assets, beginning of year $ 9,073,960,399 $ 9,415,160,481 2. Total contributions during year $ 290,802,248 $ 247,800,797 3. Benefits and refunds paid $ (638,543,413) $ (605,413,482) 4. Assumed net investment income at 8% a. Beginning of year assets $ 725,916,832 $ 753,212,838 b. Contributions 11,632,090 9,912,032 c. Benefits and refunds paid (25,541,737) (24,216,539) d. Total $ 712,007,185 $ 738,908,331 5. Expected actuarial assets, end of year (Sum of Items 1 through 4) $ 9,438,226,419 $ 9,796,456,127 6. Actual actuarial assets, end of year $ 8,797,133,149 $ 9,073,960,399 7. Asset gain (loss) for year (Item 6 – Item 5) $ (641,093,270) $ (722,495,728) 8. Asset gain (loss) as a percent of actuarial value of
assets, end of year (Item 7 / Item 6) (7.29%) (7.96%)

80 Actuarial Section _______________________________________________________ Summary of 2004 Actuarial Valuation (continued)
GABRIEL, ROEDER, SMITH & COMPANY _________________________________________________________________________________________________
Employees’ Retirement System of the State of Hawaii
Exhibit 7 Employer Contribution to Pension Accumulation Fund
The employer contribution requirements for the fiscal year ending June 30, 2005 are based on the actuarial valuation dated June 30, 2002. The funding method will change for future fiscal years as discussed below.
Appropriations for Fiscal Year 2004/2005
(Based on 6/30/2002 Valuation)
Employer Police and Firefighters
All Other Employees Total
State of Hawaii $ 1,436,081 $ 250,248,917 $ 251,684,998 City and County of Honolulu 19,017,353 28,635,898 47,653,251 - Board of Water Supply - 3,380,240 3,380,240 County of Hawaii 3,856,705 6,631,058 10,487,763 County of Maui 3,342,065 6,810,170 10,152,235 County of Kauai 1,540,602 3,817,629 5,358,231 Total All Employers $ 29,192,806 $ 299,523,912 $ 328,716,718
Appropriations for Fiscal Year 2005/2006 are based on Statutory Contribution Rates. Beginning fiscal year 2005/2006 (starting July 1, 2005) employers will contribute 15.75% of actual payroll for Police and Fire and 13.75% for All Other employees under the provisions of Act 181/2004.

_______________________________________________________ Actuarial Section 81 Summary of 2004 Actuarial Valuation (continued)
GABRIEL, ROEDER, SMITH & COMPANY Comprehensive Annual Financial Report 2004
Exhibit 8 Highlights of Last Five Annual Actuarial Valuations
2000 through 2004 Valuation Date: June 30,
Item 2000 2001 2002 2003 2004
Number of active members 59,191 59,992 62,208 62,292 62,573
Number of inactive members 3,016 3,416 3,835 4,150 4,501
Number of pensioners 27,357 28,210 28,770 29,730 30,503
Number of beneficiaries 1,358 1,450 1,560 1,659 1,794
Average monthly contributory plan pension amount $ 1,419 $ 1,475 $ 1,571 $ 1,559 $ 1,636
Average monthly noncontributory plan pension amount $ 1,142 $ 1,170 $ 1,208 $ 1,237 $ 1,272
Average monthly beneficiary amount $ 805 $ 838 $ 875 $ 909 $ 950
Total actuarial value of assets ($millions) $ 9,205 $ 9,516 $ 9,415 $ 9,074 $ 8,797
Unfunded actuarial accrued liabilities ($millions) $ 494.2 $ 991.0 $ 1,795.1 $ 2,878.1 $ 3,474.2
Funding period (in years) (1) 16.0 28.0 27.0 26.0 22.6
Item Appropriation Year
(Dollar amounts in millions) 2002 -2003
2003 -2004(2)
2004 -2005
2005 -2006
2006 -2007
Total calculated appropriations $ 180.4 $ 229.8 $ 322.8 N/A (3) N/A (3)
EIR Program appropriations 8.1 5.9 5.9
Excess investment earnings credit - - -
Net employers appropriations $ 188.5 $ 235.7 $ 328.7 N/A (3) N/A (3)
(1) Beginning with the 2004 valuation, the purpose of the valuation is to determine the remaining amortization period based on the statutory contribution rates. Prior valuations determined the dollar amount needed to amortize the UAAL over a fixed period of time.
(2) Figure from 2001 valuation has been revised to reflect reamortization to 6/30/2029 under Act 147/2002. (3) Beginning with fiscal year beginning July 1, 2005 a dollar contribution amount is not determined under the
provisions of Act 181/2004. Instead a fixed percentage of payroll will be contributed (15.75% for Police and Fire, 13.75% for All Others).

82 Actuarial Section _______________________________________________________ Summary of Actuarial Methods and Assumptions (continued)
GABRIEL, ROEDER, SMITH & COMPANY _________________________________________________________________________________________________
Employees’ Retirement System of the State of Hawaii
I. Valuation Date
The valuation date is June 30th of each plan year. This is the date as of which the actuarial present value of future benefits and the actuarial value of assets are determined.
II. Actuarial Cost Method
The funding period required to amortize the unfunded actuarial accrued liability (UAAL) is determined using the Entry Age Actuarial Cost Method. This method assigns the plan's total unfunded liabilities (the actuarial present value of future benefits less the actuarial value of assets) to various periods. The unfunded actuarial accrued liability is assigned to years prior to the valuation, and the normal cost is assigned to the year following the valuation. The remaining costs are assigned to future years. The normal cost is the level percentage of payroll contribution required to accumulate the needed funds to pay all expected benefits. This percentage of payroll is then applied to the total compensation for the prior year for all active members, and is then adjusted for the payroll growth assumption. The actuarial accrued liability is the difference between the total present value of future benefits and the actuarial present value of future normal costs. The unfunded actuarial accrued liability (UAAL) is the excess of the actuarial accrued liability over the actuarial value of assets. Since the State statutes governing the System establish the current employee and State contribution rates, the actuarial valuation determines the number of years required to amortize (or fund) the UAAL on a level percentage of payroll basis, taking into account the payroll growth assumption and the normal cost expressed as a percent of pay. Because of this amortization procedure, any change in the unfunded actuarial accrued liability due to (i) actuarial gains and losses, (ii) changes in actuarial assumptions, or (iii) amendments, affects the funding period.
III. Funding of Unfunded Actuarial Accrued Liability
All of the following concepts will be discussed on an aggregate basis with regards to the contributory and noncontributory plans. The total normal cost for benefits provided by ERS is 7.32% of payroll, which is 8.41% of payroll less than the total contributions required by Law (13.95% from employers plus 1.78% from employees). Since only 5.54% of the employer’s 13.95% contribution is required to meet the normal cost (1.78% comes from the employee contribution), it is intended that the remaining 8.41% of payroll will be used to amortize any unfunded actuarial accrued liabilities over a period of years in the future, assuming that total payroll increases by 4.0% per year.

_______________________________________________________ Actuarial Section 83 Summary of Actuarial Methods and Assumptions (continued)
GABRIEL, ROEDER, SMITH & COMPANY Comprehensive Annual Financial Report 2004
IV. Actuarial Value of Assets The actuarial value of assets is equal to the market value, adjusted for a four-year phase in of
actual investment return in excess of expected investment return. The actual return is calculated net of investment and administrative expenses, and the expected investment return is equal to the assumed investment return rate multiplied by the prior year’s market value of assets, adjusted for contributions, benefits paid, and refunds.
V. Actuarial Assumptions A. Economic Assumptions
1. Investment return: 8% per year, compounded annually, composed of an assumed
4.00% inflation rate and a 4.00% net real rate of return. (Set by legislative action.)
2. Salary increase rate: 4% per year, compounded annually. (Set by legislative action.)
3. Payroll growth rate: 4% per annum.
B. Demographic Assumptions
1. Mortality rates
General Employees
a. Healthy males – 1994 US Group Annuity Mortality Static Table for males, set back one year.
b. Healthy females - 1994 US Group Annuity Mortality Static Table for females.
c. Disabled males - 1994 US Group Annuity Mortality Static Table for males, set forward ten years.
d. Disabled females - 1994 US Group Annuity Mortality Static Table for males, set forward eleven years.
Teachers
a. Healthy males – 1994 US Group Annuity Mortality Static Table for males, set back three years.
b. Healthy females - 1994 US Group Annuity Mortality Static Table for females, set back one year.
c. Disabled males - 1994 US Group Annuity Mortality Static Table for males, set forward four years.
d. Disabled females - 1994 US Group Annuity Mortality Static Table for males, set forward six years.

84 Actuarial Section _______________________________________________________ Summary of Actuarial Methods and Assumptions (continued)
GABRIEL, ROEDER, SMITH & COMPANY _________________________________________________________________________________________________
Employees’ Retirement System of the State of Hawaii
Police and Fire
a. Healthy males – 1994 US Group Annuity Mortality Static Table for males, set forward two years.
b. Healthy females - 1994 US Group Annuity Mortality Static Table for females, set forward two years.
c. Disabled males - 1994 US Group Annuity Mortality Static Table for males, set forward five years.
d. Disabled females - 1994 US Group Annuity Mortality Static Table for males, set forward five years.
2. Disability rates – The assumed total disability rates for employees covered by the
contributory plan and the noncontributory plan at select ages are as follows:
General Employees Teachers Police and Fire Age Male & Female Male & Female Male & Female 25 0.025% 0.008% 0.010% 30 0.025% 0.008% 0.010% 35 0.030% 0.010% 0.012% 40 0.045% 0.015% 0.018% 45 0.090% 0.030% 0.036% 50 0.200% 0.066% 0.080% 55 0.425% 0.139% 0.170% 60 0.870% 0.285% 0.348%
Note: The disability rates project the percentage of employees at each age that is assumed
to become disabled before retiring. The percentage of disabilities assumed to be ordinary disability as opposed to accidental disability varies by employee group as follows:
General Employees Teachers Police and Fire
Type Male & Female Male & Female Male & Female Ordinary 85% 100% 50%
Accidental 15% 0% 50%

_______________________________________________________ Actuarial Section 85 Summary of Actuarial Methods and Assumptions (continued)
GABRIEL, ROEDER, SMITH & COMPANY Comprehensive Annual Financial Report 2004
3. Termination Rates - Separate male and female rates, based on both age and service,
developed from 2000 Experience Study. Rates reflect terminations for causes other than death, disability or retirement. Sample rates are shown below: General Employees
Expected Terminations per 100 Lives Male Members Female Members
Years of Service Years of Service Age 0 1 2 3 or more 0 1 2 3 or more 25 19.02 12.34 9.39 6.08 21.80 17.26 15.63 8.97 30 16.37 12.64 10.38 5.65 21.62 15.50 14.16 7.23 35 15.24 11.75 9.66 4.54 19.57 14.39 12.25 5.35 40 14.87 11.22 8.71 3.70 16.63 13.02 10.31 3.68 45 13.99 10.47 8.45 2.95 16.64 11.97 9.27 2.95 50 12.52 9.16 7.86 2.45 18.15 12.11 8.89 2.61 55 11.53 8.48 6.65 1.98 20.67 13.14 9.24 2.32 60 12.54 9.53 5.25 1.69 23.88 15.62 11.38 1.96
Teachers
Expected Terminations per 100 Lives Male Members Female Members
Years of Service Years of Service Age 0 1 2 3 or more 0 1 2 3 or more
25 24.33 10.12 13.20 7.97 20.12 12.62 13.16 8.61 30 23.04 12.60 12.75 6.62 21.78 15.04 15.25 7.25 35 24.32 14.33 12.20 5.07 23.58 16.33 16.75 5.62 40 27.14 15.40 11.29 4.33 24.54 15.93 15.95 4.16 45 30.24 15.67 10.52 3.53 24.73 15.14 13.98 2.80 50 33.50 15.43 9.97 2.49 25.71 15.70 13.25 2.00 55 37.79 14.99 9.56 1.92 27.19 16.91 12.94 1.61 60 43.72 14.18 9.24 1.76 28.47 17.93 12.13 1.87
Police and Fire
Expected Terminations per 100 Lives Male Members Female Members
Years of Service Years of Service Age 0 1 2 3 or more 0 1 2 3 or more 25 6.43 2.58 2.69 3.71 6.43 2.58 2.69 3.71 30 7.46 3.33 3.66 3.35 7.46 3.33 3.66 3.35 35 9.33 4.39 4.48 2.54 9.33 4.39 4.48 2.54 40 11.44 6.36 4.76 1.56 11.44 6.36 4.76 1.56 45 12.83 9.31 4.30 0.79 12.83 9.31 4.30 0.79 50 13.45 12.47 3.57 0.39 13.45 12.47 3.57 0.39 55 13.79 15.38 2.77 0.32 13.79 15.38 2.77 0.32 60 14.10 18.19 1.95 0.45 14.10 18.19 1.95 0.45
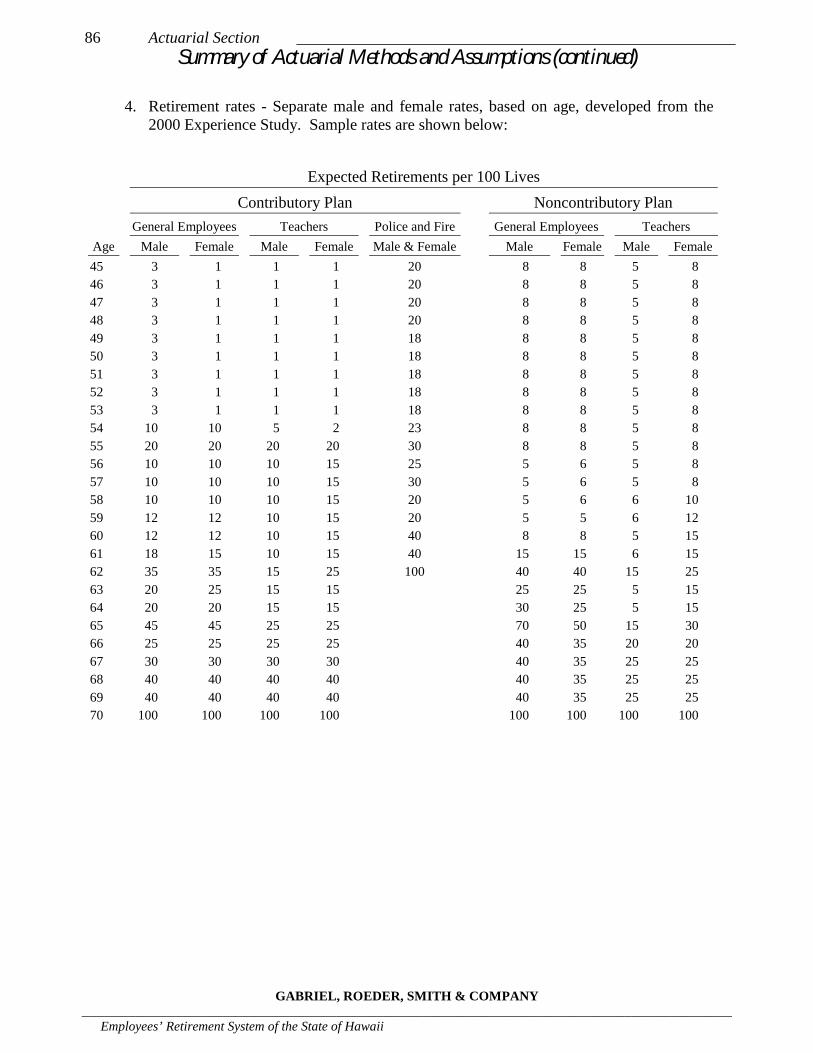
86 Actuarial Section _______________________________________________________ Summary of Actuarial Methods and Assumptions (continued)
GABRIEL, ROEDER, SMITH & COMPANY _________________________________________________________________________________________________
Employees’ Retirement System of the State of Hawaii
4. Retirement rates - Separate male and female rates, based on age, developed from the
2000 Experience Study. Sample rates are shown below:
Expected Retirements per 100 Lives Contributory Plan Noncontributory Plan
General Employees Teachers Police and Fire General Employees Teachers Age Male Female Male Female Male & Female Male Female Male Female 45 3 1 1 1 20 8 8 5 8 46 3 1 1 1 20 8 8 5 8 47 3 1 1 1 20 8 8 5 8 48 3 1 1 1 20 8 8 5 8 49 3 1 1 1 18 8 8 5 8 50 3 1 1 1 18 8 8 5 8 51 3 1 1 1 18 8 8 5 8 52 3 1 1 1 18 8 8 5 8 53 3 1 1 1 18 8 8 5 8 54 10 10 5 2 23 8 8 5 8 55 20 20 20 20 30 8 8 5 8 56 10 10 10 15 25 5 6 5 8 57 10 10 10 15 30 5 6 5 8 58 10 10 10 15 20 5 6 6 10 59 12 12 10 15 20 5 5 6 12 60 12 12 10 15 40 8 8 5 15 61 18 15 10 15 40 15 15 6 15 62 35 35 15 25 100 40 40 15 25 63 20 25 15 15 25 25 5 15 64 20 20 15 15 30 25 5 15 65 45 45 25 25 70 50 15 30 66 25 25 25 25 40 35 20 20 67 30 30 30 30 40 35 25 25 68 40 40 40 40 40 35 25 25 69 40 40 40 40 40 35 25 25 70 100 100 100 100 100 100 100 100

_______________________________________________________ Actuarial Section 87 Summary of Actuarial Methods and Assumptions (continued)
GABRIEL, ROEDER, SMITH & COMPANY Comprehensive Annual Financial Report 2004
C. Other Assumptions
1. Percent married: 77% of male employees and 57.6% of female employees are assumed to be married.
2. Age difference: Male members are assumed to be four years older than their spouses,
and female members are assumed to be four years younger than their spouses. 3. Percent electing annuity on death for contributory participants (when eligible): All of
the spouses of married participants who die after becoming eligible for a retirement benefit are assumed to elect an annuity or a refund, whichever is more valuable at time of participant’s death.
4. Percent electing deferred termination benefit: vested terminating members are assumed
to elect a refund or a deferred benefit, whichever is more valuable at the time of termination.
5. Assumed age for commencement of deferred benefits: Members electing to receive a
deferred benefit are assumed to commence receipt when eligible for early retirement. 6. Administrative expenses: The assumed investment return rate represents the anticipated
net return after payment of all investment and administrative expenses. 7. Reemployment, purchase of service, transfers: No recognition is made of (i) future
member reimbursements upon reemployment, (ii) future purchase of additional service, or (iii) special transfer provisions.
VI. Participant Data
Participant data was supplied on CD-ROM for (i) active members, (ii) inactive vested members, who are entitled to a future deferred benefit, (iii) members and beneficiaries receiving benefits. Salary supplied for the current year was based on the earnings for the March preceding the valuation date. This salary was compared to March base pay plus a twelve-month average of overtime, with the greater of the two being used for valuation pay.
VII. Dates of Adoption of Assumptions and Methods
Generally, actuarial assumptions and methods were adopted by the Board of Trustees in 2000 as recommended by the Segal Company, the prior actuary, with respect to the assumptions, and by Gabriel, Roeder, Smith & Company with respect to the methods. These assumptions and methods were first reflected in the 2001 actuarial valuation. The legislature sets the investment return assumption and the salary scale assumption in the statutes governing the ERS.

88 Actuarial Section _______________________________________________________ Summary of Actuarial Methods and Assumptions (continued)
GABRIEL, ROEDER, SMITH & COMPANY _________________________________________________________________________________________________
Employees’ Retirement System of the State of Hawaii
Summary of Plan Changes
Act 65, effective July 1, 1999
Requires judges who enter or re-enter service after June 30, 1999 to be at least 55 years old and five years of service or have 25 years of service to rehire. Act 100, effective June 30, 1999
Uses actuarial investment earnings in excess of a ten percent (10%) actuarial investment yield rate to reduce the employer’s contribution requirements by $147.0 million and $50.6 million for fiscal years ending June 30, 2000 and 2001, respectively. Act 284, effective June 30, 2001
Provide an increase in pension benefits for current retirees with military service who retired prior to July 2, 1989. A retirant who rendered honorable active military service could be granted up to 4 years of military service credits based upon his/her years of credited service under the ERSf, not to exceed his/her actual years of military service. The years of military service credits granted are based on the following schedule:
• 0 years for retirants with less than 8 years of credited service • Up to 2 years of retirants with 8 years or more of credited service • Up to 3 years of retirants with 20 years or more of credited service • Up to 4 years of retirants with 25 years or more of credited service For each year of military service credits granted on the schedule above, the retirant will be provided a $36.00 increase is his/her monthly pension or retirement allowance. Act 199, effective June 30, 2003
Emergency Medical Technicians (EMTs) are allowed to retire with an unreduced benefit after 25 years of service regardless of age, of which the last five or more years prior to retirement must be in that capacity. This feature is phased in one year at a time, July 1, 2003 through June 30, 2008. Act 177, effective July 1, 2004
This Act allows police officers with a permanent service-connected disability to retain the 2-1/2% benefit multiplier for each year of service as a police officer.
Act 179, effective July 1, 2004
This Act increased the Noncontributory service-connected disability formula to 35% of average final compensation. The Act also changed the methodology for crediting interest on contributions for terminated members so that interest continues to accrue until the date of refund. The Act adds a “pop-up” feature to the joint & survivor benefit options if the beneficiary pre-deceases the retiree. This Act also created the new Hybrid Plan which will become effective July 1, 2006.

_______________________________________________________ Actuarial Section 89 Summary of Actuarial Methods and Assumptions (continued)
GABRIEL, ROEDER, SMITH & COMPANY Comprehensive Annual Financial Report 2004
Summary of Plan Changes (continued)
Act 181, effective July 1, 2004 This Act establishes fixed employer contribution rates as a percentage of compensation effective July 1, 2005. Employers will contribute 15.75% for their police officers and firefighters and 13.75% for other employees. Act 183, effective July 1, 2004 This Act amends the ERS statutes to comply with the federal tax limits on compensation retroactive to July 1, 1996.

90 Actuarial Section _______________________________________________________ Ten-Year Actuarial Schedules
_________________________________________________________________________________________________
Employees’ Retirement System of the State of Hawaii
Ten Year Actuarial Schedules
1995 to 2004
- Retirement System Membership ** - 2004 Membership Data *
- Historical Summary of Active Member Data * - Pensioners, Average Annual Pension and Active Member/Ptensioner Comparison ** - Number of Retirants and Beneficiaries ** - Solvency Test ** - Employer Contribution Rates as a Percentage of Payroll ** - Employer Appropriations to Pension Accumulation Fund, Appropriation Years 1997-1998 to
2006-2007 **
Note: * Prepared by Gabriel, Roeder, Smith & Company ** Compiled by ERS Staff from actuary reports, or other data.
Retirement System Membership ** 1995 to 2004
March 31, Active
Members
Inactive Vested
Members Pensioners & Beneficiaries
Total Membership
1995 58,498 2,189 25,360 86,047 1996 56,985 2,290 26,926 86,201 1997 57,044 2,456 27,173 86,673 1998 57,797 2,650 27,403 87,850 1999 58,387 2,777 27,950 89,114
2000 59,191 3,016 28,715 90,922 2001 59,992 3,416 29,660 93,068 2002 62,208 3,835 30,330 96,373 2003 62,292 4,150 31,389 97,831 2004 62,573 4,501 32,297 99,371
** Schedule compiled by ERS Staff from actuary reports.

_______________________________________________________ Actuarial Section 91 Ten-Year Actuarial Schedules (continued)
Comprehensive Annual Financial Report 2004
2004 Membership Data * March 31, 2004
Police and Firefighters All Other Employees All Employees June 30, 2004 June 30, 2003 June 30, 2004 June 30, 2003 June 30, 2004 June 30, 2003 1. Active members a. Number 4,720 4,656 57,853 57,636 62,573 62,292 b. Total payroll $277,266,099 $257,496,167 $2,478,279,311 $2,460,939,412 $2,755,545,410 $2,718,435,579 c. Average salary $ 58,743 $ 53,304 $ 42,838 $ 42,698 $ 44,037 $ 43,640 d. Average age 40.1 40.1 46.5 46.5 46.0 46.0 e. Average service 13.0 13.1 13.0 13.1 13.0 13.1 2. Inactive members a. Number 140 130 4,361 4,020 4,501 4,150 b. Total annual deferred
benefits $ 2,078,098 $ 1,950,910 $ 28,741,491 $ 28,691,500 $ 30,819,589 $ 30,642,410 c. Average annual deferred
benefit $ 14,844 $ 15,007 $ 6,591 $ 7,137 $ 6,847 $ 7,384 3. Service retirees a. Number 2,469 2,411 26,801 26,135 29,270 28,546 b. Total annual benefits $ 81,302,080 $ 76,395,874 $ 495,242,143 $ 465,717,257 $ 576,544,223 $ 542,113,131 c. Average annual benefit $ 32,929 $ 31,686 $ 18,478 $ 17,820 $ 19,697 $ 18,991 4. Disabled retirees a. Number 167 168 1,066 1,016 1,233 1,184 b. Total annual benefits $ 2,350,058 $ 2,285,859 $ 9,172,727 $ 8,625,296 $ 11,522,785 $ 10,911,155 c. Average annual benefit $ 14,072 $ 13,606 $ 8,605 $ 8,489 $ 9,345 $ 9,216 5. Beneficiaries a. Number 136 126 1,658 1,533 1,794 1,659 b. Total annual benefits $ 2,930,878 $ 2,582,432 $ 17,512,021 $ 15,515,143 $ 20,442,899 $ 18,097,575 c. Average annual benefit $ 21,551 $ 20,495 $ 10,562 $ 10,121 $ 11,395 $ 10,909 * Prepared by Gabriel, Roeder, Smith & Company
Historical Summary of Active Member Data * 1995 to 2004
Active Members Covered Payroll Average Salary Year
Ending June 30, Number
Percent Increase
Amount in $Millions
Percent Increase $ Amount
Percent Increase
Average Age
Average Service
1995 58,498 -0.7% 2,083.0 2.6% 35,608 3.3%
1996 56,985 -2.6% 1,990.1 -4.5% 34,923 -1.9% 1997 57,044 0.1% 2,019.3 1.5% 35,399 1.4% 1998 57,797 1.3% 2,135.9 5.8% 36,955 4.4% 1999 58,387 0.9% 2,186.5 2.4% 37,448 1.3%
2000 59,191 1.4% 2,275.3 4.1% 38,440 2.6% 45.5 13.0 2001 59,992 1.4% 2,350.2 3.3% 39,175 1.9% 45.6 13.3 2002 62,208 3.7% 2,568.7 9.3% 41,292 5.4% 45.8 13.2 2003 62,292 0.1% 2,718.4 5.8% 43,640 5.7% 46.0 13.1 2004 62,573 0.5% 2,755.5 1.4% 44,037 0.9% 46.0 13.0
* Prepared by Gabriel, Roeder, Smith & Company

92 Actuarial Section _______________________________________________________ Ten-Year Actuarial Schedules (continued)
_________________________________________________________________________________________________ Employees’ Retirement System of the State of Hawaii
Pensioners, Average Annual Pension and Active Member/Pensioner Comparison **
1995 to 2004
March 31, Number of Pensioners
Average Annual Pension
Ratio of Active Members per
Pensioner
1995 24,517 $13,452 2.6 1996 25,975 $14,364 2.4 1997 26,152 $14,976 2.2 1998 26,257 $15,552 2.2 1999 26,709 $16,116 2.2
2000 27,357 $16,632 2.2 2001 28,210 $16,853 2.1 2002 28,770 $17,898 2.1 2003 29,730 $18,601 2.1 2004 30,503 $19,279 2.1 ** Schedule compiled by ERS Staff from actuary reports.
Number of Retirants and Beneficiaries ** 1995 to 2004
As of Mar 31, Added
Average Added to
Rolls Removed
Average Removed to
Rolls Total Average Pension % Chg
Retirants 1995 1 2,301 n/a 664 n/a 25,360 $13,452 7.9% 1996 1 2,249 n/a 683 n/a 26,926 $14,364 6.8% 1997 1 943 n/a 696 n/a 27,173 $14,976 4.3% 1998 1 1,013 n/a 783 n/a 27,403 $15,552 3.9% 1999 1 1,311 n/a 764 n/a 27,950 $16,116 3.6%
2000 1 1,549 n/a 784 n/a 28,715 $16,632 3.2% 2001 1 1,668 n/a 723 n/a 29,660 $16,853 1.3% 2002 1,229 $18,707 739 $12,559 28,770 $17,898 4.1% 2003 1,723 $20,292 763 $12,836 29,730 $18,601 3.9% 2004 1,630 $20,136 857 $13,596 30,503 $19,279 3.6%
Beneficiaries 1 2002 176 $11,904 66 $ 6,660 1,560 $10,499 4.5% 2003 147 $12,137 48 $ 6,068 1,659 $10,909 3.9% 2004 177 $12,588 42 $7,596 1,794 $11,395 3.9%
Notes: 1 Beneficiary counts are included in retirant counts through 2001. As of March 31, 2001, there were 28,210
retirants and 1,450 beneficiaries, receiving annual retirement benefits of $17,202 and $10,050, respectively. n/a Information not available. ** Schedule compiled by ERS staff from actuary reports.

_______________________________________________________ Actuarial Section 93 Ten-Year Actuarial Schedules (continued)
Comprehensive Annual Financial Report 2004
Solvency Test ** 1995 to 2004
Actuarial Accrued Liabilities (AAL)
Cumulative Portion of Actuarial Accrued Liabilities Covered by Assets
June 30, Active Member Contributions
Retirees, Beneficiaries, and Inactive
Vested Members
Active and Inactive
Members Employer Financed Portion
Actuarial Value of Assets
Column (1) Column (2) Column (3) (1) (2) (3) (4) (5) (6) (7)
1995 $780.7 $3,530.0 $3,089.1 $5,615.9 100% 100% 42.3% 1996 811.6 4,091.3 2,496.8 6,084.8 100% 100% 47.3% 1997 830.7 4,369.8 2,716.9 7,268.5 100% 100% 76.1% 1998 883.5 4,472.7 3,053.5 7,916.2 100% 100% 83.5% 1999 902.2 4,682.2 3,517.2 8,590.8 100% 100% 85.5%
2000 938.0 4,914.5 3,817.8 9,204.7 100% 100% 87.8% 2001 876.0 5,232.4 4,398.5 9,516.0 100% 100% 77.5% 2002 889.9 5,499.4 4,820.9 9,415.2 100% 100% 62.7% 2003 872.3 5,912.3 5,167.5 9,074.0 100% 100% 44.3% 2004 870.3 6,278.6 5,121.2 8,792.0 100% 100% 32.1%
** Schedule compiled by ERS Staff from actuary reports.
Unfunded Actuarial Accrued Liability FY 1997-2004
$733 $586 $591 $543$991
$1,795
$2,878
$3,474
$0$500
$1,000$1,500$2,000$2,500$3,000$3,500
1997 1998 1999 2000 2001 2002 2003 2004
Millions

94 Actuarial Section _______________________________________________________ Ten-Year Actuarial Schedules (continued)
_________________________________________________________________________________________________ Employees’ Retirement System of the State of Hawaii
Employer Contribution Rates as a Percentage of Payroll ** 1995 to 2004
Note: Beginning 1995, Amortization Percent includes EIR payment percentage and Excess Investment
Earnings Credit percentage. Also, beginning 1995, the funding method was changed from Frozen Initial Liability Actuarial Cost Method to Entry Age Normal Actuarial Cost Method. Beginning in 1997, the actuarial value of assets was changed from book value to a market related value.
Effective with the June 30, 2004 valuation, the employer contribution rate is statutorily changed to a
percentage of pay of 15.75% of actual pay for Police and Fire and 13.75% of actual pay for All Other Employees, per Act 181/2004 SLH.
** Schedule compiled by ERS Staff from actuary reports.
Police and Firefighters All Other Employees All Active Employees Actuarial Valuation
as of June 30,
Normal Cost Rate
Amorti-zation
Percent
Total Employer
Rate
Normal Cost Rate
Amorti-zation
Percent
Total Employer
Rate
Normal Cost Rate
Amorti-zation
Percent
Total Employer
Rate
1995 15.95% 7.24% 23.19% 5.38% 8.65% 14.03% 6.39% 8.52% 14.91% 1996 14.23% 1.23% 15.46% 3.76% 3.19% 6.95% 4.76% 3.00% 7.76% 1997 18.40% -11.36% 7.04% 3.87% -3.45% 0.42% 5.38% -4.27% 1.11% 1998 11.47% -11.22% 0.25% 4.28% -3.88% 0.40% 4.99% -4.61% 0.38% 1999 18.01% -2.53% 15.48% 5.19% 1.61% 6.80% 6.46% 1.20% 7.66%
2000 13.17% -8.82% 4.35% 6.03% 3.72% 9.75% 6.72% 2.50% 9.22% 2001 3.88% 4.16% 8.04% 5.59% 4.86% 10.45% 5.42% 4.78% 10.20% 2002 3.88% 6.46% 10.34% 5.62% 5.87% 11.49% 5.45% 5.93% 11.38% 2003 4.27% 11.06% 15.33% 5.73% 8.74% 14.47% 5.59% 8.96% 14.55% 2004 4.41% 11.34% 15.75% 5.75% 8.00% 13.75% 5.54% 8.41% 13.95%

_______________________________________________________ Actuarial Section 95 Ten-Year Actuarial Schedules (continued)
Comprehensive Annual Financial Report 2004
Employer Appropriations to Pension Accumulation Fund ** Appropriation Years 1997-1998 to 2006-2007
(Amounts in Millions)
Investment Yield Rate
Fiscal Year
Assumed for Actuarial Valuation
Actuarial Investment
Return Appropriation
Year
Total Calculated
Contribution (1)
Investment Earnings
Adjustment Employer
Appropriations
1994-1995 8.0% 6.19% 1997-1998 $ 310.6 $ - (2) $ 310.6 1995-1996 8.0% 9.99% 1998-1999 245.2 (90.7) 154.5 1996-1997 8.0% 13.72% 1999-2000 179.3 (156.9) 22.4 1997-1998 8.0% 11.68% 2000-2001 164.4 (156.3) 8.1 1998-1999 8.0% 12.33% 2001-2002 201.2 (33.7) 167.5
1999-2000 8.0% 12.58% 2002-2003 188.5 - 188.5 2000-2001 8.0% 8.91% 2003-2004 235.7 - 235.7 2001-2002 8.0% 2.62% 2004-2005 328.7 - 328.7 2002-2003 8.0% 0.18% 2005-2006 N/A N/A 2003-2004 8.0% 0.74% 2006-2007 N/A N/A
Notes: (1) Beginning in appropriation year 1997-98, total calculated contribution includes appropriations for the Early Incentive Retirement program. 2001 results adjusted for reamortization of Unfunded Actuarial Accrued Liability and Early Incentive Retirement Program to June 30, 2029 under Act 147/2002.
(2) $99.4 million in additional employer contributions were deferred pursuant to the pension reform provisions in Act 327/1997
(3) Beginning with the valuation for fiscal year 1996-97 (appropriation fiscal year 1999-2000), the actuarial investment income is the sum of the expected net investment income based on the actuarial assumption of 8% and a four-year smoothing of the difference between the market value of assets at year-end and the expected actuarial value of assets. In prior years, the actuarial investment income was the sum of interest, dividends, and net realized gains less net realized losses and investment expenses.
(4) Beginning fiscal year 2005/2006 employers will contribute 15.75% of actual payroll for Police and Fire and 13.75% for All Other Employees, per Act 181/2004 SLH.
** Schedule compiled by ERS Staff from actuary reports.
Employer Contributions$322.1
$154.5
$22.4 $8.1
$188.5$235.7
$328.7$310.6
$167.5
$0
$100
$200
$300
$400
1996-1997
1997-1998
1998-1999
1999-2000
2000-2001
2001-2002
2002-2003
2003-2004
2004-2005
Appropriation Year
Millions

96 Actuarial Section _______________________________________________________ State Retirement System’s Funded Ratios
GABRIEL, ROEDER, SMITH & COMPANY _________________________________________________________________________________________________
Employees’ Retirement System of the State of Hawaii
Funded Ratio
100% or more 9 Florida FRS 114.2% Arizona ASRS 104.6%North Carolina TSERS 111.6% Georgia ERS 100.5%New Jersey PERS 107.3% Virginia VRS 100.4%Delaware SEPP 106.9% Montana PERS 100.0%Pennsylvania PSERS 104.9%
90% to 99% 17 Tennessee CRS 99.6% Wisconsin WRS 97.1%Indiana PERF 99.2% Alabama ERS 95.4%Minnesota MSRS 99.1% California PERS 95.2%Michigan MSERS 98.7% Arkansas PERS 94.5%North Dakota PERS 98.1% Maryland MSRPS 93.1%Texas ERS 97.6% Utah SRS 92.5%Vermont VSRS 97.5% Wyoming WRS 91.7%New Mexico PERA 97.3% Missouri PSRS 90.9%South Dakota SDRS 97.2%
80% to 89% 9 Kentucky KERS 80.4% Massachusetts SERS 83.9%Oregon PERS 89.9% Iowa PERS 89.6%Washington PERS 85.6% Nevada PERS 83.2%Idaho PERS 83.8% South Carolina SCRS 82.8%Ohio PERS 85.9%
70% to 79% 8 Mississippi PERS 79.0% Alaska PERS 75.2%Kansas PERS 77.6% Colorado PERA 75.2%Oklahoma PERS 76.8% New Hampshire NHRS 75.0%Hawaii ERS * 75.9% West Virginia PERS 73.2%
Less than 70% 5 Maine MSRS 69.4% Connecticut SERS 61.6%Louisiana LASERS 66.2% Illinois SERS 42.6%Rhode Island ERSRI 65.5%
Number of General State Retirement Systems (excluding separate systems for teachers, school employees, or municipal employees)
Note: GASB 25 funded ratios are shown for 48 general state retirement systems for valuation year(s) through December 31, 2003. A funded ratio is not shown for the Nebraska System because it is a defined contribution plan. A funded ratio for the New York System does not exist because of the use of the Aggregate Cost Method.
* Hawaii’s GASB 25 funded ratio for the fiscal year ended June 30, 2004 was 71.7%.

EMPLOYEES’ RETIREMENT SYSTEM
OF THE STATE OF HAWAII
STATISTICAL SECTION

98 Statistical Section _______________________________________________________
_________________________________________________________________________________ Employees’ Retirement System of the State of Hawaii
Participating Employers and Active Members As of March 31,
2004 2003
Active Members Percentage Active Members Percentage
State of Hawaii 48,704 78% 48,445 78% City & County of Honolulu 8,158 13 8,223 13 - Board of Water Supply 554 1 568 1 Hawaii County 2,081 3 2,028 3 Maui County 2,025 3 1,994 3 Kauai County 1,051 2 1,034 2 62,573 100% 62,292 100%
Revenues by Source
Year ended
June 30
Employer appropriations
(1)
Employer appropriations as a
percentage of covered payroll (2)
Member contributions
Net investment income (3) Total
1995 $192,536,598 9.24% $65,720,847 $ 340,909,684 $ 599,167,129 1996 288,070,687 14.48 53,766,483 1,176,991,469 * 1,518,828,639 1997 322,141,010 15.59 54,364,380 1,293,952,952 1,670,458,342 1998 310,627,135 14.54 56,168,443 1,251,839,166 1,618,634,744 1999 154,469,844 7.06 55,702,647 904,809,348 1,114,981,839
2000 22,392,100 0.98 57,358,185 695,151,054 744,901,339 2001 8,131,900 0.39 54,489,895 (679,605,059) (616,983,264) 2002 167,458,900 6.52 55,451,218 (503,995,090) (281,084,977) 2003 190,586,276 7.01 57,214,521 146,140,751 393,941,548 2004 235,685,796 8.55 55,116,452 1,236,414,927 1,527,217,175
(1) Employer appropriations were made in accordance with actuarially determined contributions requirements. Prior to
Fiscal Year 1996, employer appropriations included funding for administrative expenses. (2) Covered payroll as reported by the actuary, effective March 31 of each year. (3) Prior to Fiscal Year 1997, assets were reported at cost, thus net investment income includes only realized gains and
losses, plus dividends, interest and other earnings. Effective July 1, 1996, ERS adopted GASB Statement 25 changing from reporting investments at cost to reporting investments at fair value (includes unrealized gains and losses). * Includes recognition of previously deferred income and net unrealized gains and losses totaling $594,325,421 as a
result of adoption of GASB Statement 25.

______________________________________________________ Statistical Section 99
Comprehensive Annual Financial Report 2004
Expenses by Type
Year ended
June 30,
Total Benefit
Payments Refunds to Members
Administrative Expenses Other Total
1995 $405,551,920 $2,653,593 $2,896,684 $ - $411,102,197 1996 454,078,620 3,634,085 2,960,240 - 460,672,945 1997 432,732,753 3,963,721 3,217,348 - 439,913,822 1998 442,997,525 3,791,848 3,331,700 - 450,121,073 1999 478,744,074 4,454,658 3,775,942 29,272 487,003,946
2000 514,401,221 4,318,654 4,168,717 - 522,888,592 2001 544,906,809 3,892,377 4,893,712 - 553,692,898 2002 565,559,305 3,244,334 5,754,832 - 574,558,471 2003 602,805,080 2,605,602 6,780,824 2,800 612,194,306 2004 636,214,617 2,328,796 10,468,508 - 649,011,921
Benefit Payments by Type
Year ended Pension Benefit Payments
Refund Option Total Benefit
June 30, Service Disability Death Subtotal Payments Payments
1995 $315,636,011 $6,311,914 $2,843,789 $324,791,714 $80,760,206 $405,551,920 1996 376,976,563 6,399,486 3,358,029 386,734,078 70,978,627 454,078,620 1997 398,471,144 7,424,424 4,626,452 410,522,020 22,210,733 432,732,753 1998 410,622,492 7,633,183 3,770,474 422,026,149 20,971,376 442,997,525 1999 431,410,418 8,055,791 4,581,030 444,047,239 34,696,835 478,744,074
2000 460,293,937 8,305,398 2,644,579 471,243,914 43,157,307 514,401,221 2001 491,957,932 8,950,018 2,369,546 503,277,496 41,629,313 544,906,809 2002 518,579,831 9,336,267 2,465,179 530,381,277 35,178,028 565,559,305 2003 557,439,020 10,046,637 1,749,855 569,235,512 33,568,568 602,805,080 2004 594,915,346 10,502,637 3,147,690 608,565,175 27,649,442 636,214,617
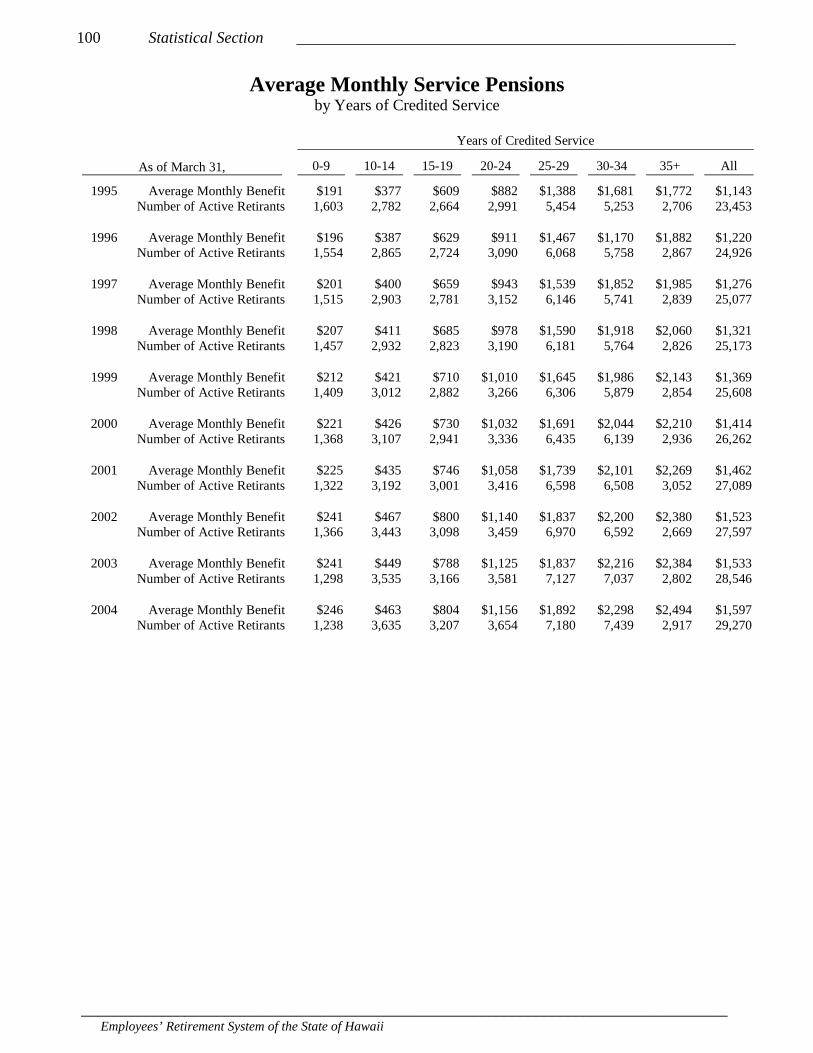
100 Statistical Section _______________________________________________________
_________________________________________________________________________________ Employees’ Retirement System of the State of Hawaii
Average Monthly Service Pensions by Years of Credited Service
Years of Credited Service
As of March 31, 0-9 10-14 15-19 20-24 25-29 30-34 35+ All
1995 Average Monthly Benefit $191 $377 $609 $882 $1,388 $1,681 $1,772 $1,143 Number of Active Retirants 1,603 2,782 2,664 2,991 5,454 5,253 2,706 23,453
1996 Average Monthly Benefit $196 $387 $629 $911 $1,467 $1,170 $1,882 $1,220 Number of Active Retirants 1,554 2,865 2,724 3,090 6,068 5,758 2,867 24,926
1997 Average Monthly Benefit $201 $400 $659 $943 $1,539 $1,852 $1,985 $1,276 Number of Active Retirants 1,515 2,903 2,781 3,152 6,146 5,741 2,839 25,077
1998 Average Monthly Benefit $207 $411 $685 $978 $1,590 $1,918 $2,060 $1,321 Number of Active Retirants 1,457 2,932 2,823 3,190 6,181 5,764 2,826 25,173
1999 Average Monthly Benefit $212 $421 $710 $1,010 $1,645 $1,986 $2,143 $1,369 Number of Active Retirants 1,409 3,012 2,882 3,266 6,306 5,879 2,854 25,608
2000 Average Monthly Benefit $221 $426 $730 $1,032 $1,691 $2,044 $2,210 $1,414 Number of Active Retirants 1,368 3,107 2,941 3,336 6,435 6,139 2,936 26,262
2001 Average Monthly Benefit $225 $435 $746 $1,058 $1,739 $2,101 $2,269 $1,462 Number of Active Retirants 1,322 3,192 3,001 3,416 6,598 6,508 3,052 27,089
2002 Average Monthly Benefit $241 $467 $800 $1,140 $1,837 $2,200 $2,380 $1,523 Number of Active Retirants 1,366 3,443 3,098 3,459 6,970 6,592 2,669 27,597
2003 Average Monthly Benefit $241 $449 $788 $1,125 $1,837 $2,216 $2,384 $1,533 Number of Active Retirants 1,298 3,535 3,166 3,581 7,127 7,037 2,802 28,546
2004 Average Monthly Benefit $246 $463 $804 $1,156 $1,892 $2,298 $2,494 $1,597 Number of Active Retirants 1,238 3,635 3,207 3,654 7,180 7,439 2,917 29,270

______________________________________________________ Statistical Section 101
Comprehensive Annual Financial Report 2004
Benefit Payments by Retirement Type and Option As of March 31, 2004
Retired Contributory Members
1 2 3 4 5 Max Opt. 1 Opt. 2 Opt. 3 Opt. 4 Opt. 5 Other
1$ - 300 1,719 1,463 23 11 4 218 442 482 183 64 187 352 9 301 - 600 2,992 2,542 164 60 10 216 348 282 157 64 836 1,300 5 601 - 900 2,831 2,429 102 88 12 200 308 209 124 55 1,056 1,074 5 901 - 1,200 2,689 2,396 39 88 9 157 242 187 99 52 1,072 1,031 6
1,201 - 1,500 2,478 2,311 17 47 6 97 198 147 102 29 1,077 921 4 1,501 - 1,800 2,278 2,164 11 30 7 66 149 119 82 23 977 921 7 1,801 - 2,100 2,305 2,223 3 21 4 54 126 67 50 18 953 1,087 4 2,101 - 2,400 2,157 2,091 6 9 3 48 127 58 53 28 850 1,038 3 2,401 - 2,700 1,852 1,810 2 5 2 33 151 52 63 29 883 673 1 2,701 - 3,000 1,366 1,338 - 3 1 24 132 39 38 29 763 364 1 3,001 2,884 2,826 - 8 4 46 380 108 151 103 1,588 554 -
25,551 23,593 367 370 62 1,159 2,603 1,750 1,102 494 10,242 9,315 45
Monthly Benefit
Type of Retirement * Retirement Option Number of Recipients
Retired Noncontributory Members
1 2 3 4 5 Max Opt. A Opt. B Opt. C Other
1$ - 300 780 519 73 25 69 94 306 116 233 50 75 301 - 600 1,533 1,142 182 31 42 136 814 211 366 101 41 601 - 900 875 679 96 8 27 65 484 139 168 61 23 901 - 1,200 585 505 37 1 3 39 315 112 107 49 2
1,201 - 1,500 489 429 28 1 1 30 250 93 106 40 - 1,501 - 1,800 523 495 8 - 3 17 299 87 76 61 - 1,801 - 2,100 728 706 5 - 2 15 504 89 57 77 1 2,101 - 2,400 561 549 1 - - 11 420 53 35 53 - 2,401 - 2,700 259 252 - - - 7 176 41 30 12 - 2,701 - 3,000 177 173 - - 2 2 107 42 18 10 - 3,001 236 228 - - - 8 150 50 26 10 -
6,746 5,677 430 66 149 424 3,825 1,033 1,222 524 142
Monthly Benefit
Type of Retirement * Retirement Option Number of Recipients
* Type of Retirement 1 – Normal retirement for age & service 2 – Ordinary disability retirement 3 – Occupational disability retirement 4 – Survivor payment – death in service 5 – Survivor payment – normal or disability retirement
Note: Refer to Plan Summary in the Introductory Section for descriptions of the types of retirements and benefit options selected by the members.