financial report comprehensive annual
TRANSCRIPT

G
Comprehensive Annual Financial Report
With Report on Audit by Independent Certified Public Accountants
For Year Ended June 30, 2019
Prepared by: Finance Department
Laguna Beach, California

(This page intentionally left blank)

SOUTH COAST WATER DISTRICT Comprehensive Annual Financial Report For the Fiscal Year Ended June 30, 2019 Table of Contents
Page Number
Introductory Section: Letter of Transmittal i Service Area Map viii Organization Chart ix
Board of Directors and Executive Staff x GFOA Certificate of Achievement for Excellence in Financial Reporting xi
Financial Section: Independent Auditors’ Report 1
Management’s Discussion and Analysis (Required Supplementary Information) 5 Basic Financial Statements:
Statement of Net Position 15 Statement of Revenues, Expenses and Changes in Net Position 17 Statement of Cash Flows 18 Statement of Fiduciary Net Position - Private Purpose Trust Fund 20 Statement of Changes in Fiduciary Net Position - Private Purpose Trust Fund 21 Notes to Basic Financial Statements 23
Required Supplementary Information: Schedule of Proportionate Share of the Net Pension Liability 59 Schedule of Contributions - Pension 60 Schedule of Changes in the Net Other Postemployment Benefits (OPEB)
Liability and Related Ratios 61 Schedule of Contributions - OPEB 62
Supplementary Information – Joint Regional Water Supply System (JRWSS): General Expenses Allocation by Facilities 64 General Expenses Allocation by Participants 66 Budget Allocation Factors by Participants 68
Statistical Section: Description of Statistical Section Contents 71
Financial Trends: Net Position 72
Changes in Net Position 74 Revenue Capacity:
Water Sold by Type of Customer (in Acre Feet) 76 Water Rates 78
Ten Largest Water Customers 81 Sewer Rates 82
Ten Largest Sewer Customers 84

SOUTH COAST WATER DISTRICT Comprehensive Annual Financial Report For the Fiscal Year Ended June 30, 2019 Table of Contents
Page Number
Statistical Section (Continued): Debt Capacity:
Assessed Valuation and Estimated Actual Value of Taxable Property and 1% Property Tax Revenue 85
Direct and Overlapping Property Tax Rates 86 Principal Property Taxpayers 87
Ratio of Outstanding Debt 88 Debt Coverage 89
Ratio of Annual Debt Service Expenditures to Total General Expenditures 90 Demographic and Economic Information:
Demographics 91 Ten Largest Employers 92 Operating Information:
Number of Water Connections 93 Number of Sewer Connections 95 Average Monthly Usage (in CCF) 96 Source of Supply and Water Deliveries/Sales in Acre Feet 99
Capital Asset Statistics 100 Number of Employees 102

SOUTHCOAST WATERDISTRICT
Mailing Address: P.O. Box 30205, Laguna Niguel, CA 92607-0205
Street Address: 31592 West Street, Laguna Beach, CA 92651 Fax: (949) 499-4256 Phone: (949) 499-4555
i
BoardofDirectors
William Green President
Dennis Erdman VicePresident
Wayne Rayfield Director
Doug Erdman Director
Rick Erkeneff Director
December 19, 2019 Members of the Board of Directors South Coast Water District
Introduction
The Comprehensive Annual Financial Report (CAFR) of the South Coast Water District for the fiscal year ended June 30, 2019, is hereby submitted. This report was prepared pursuant to the guidelines set forth by the Governmental Accounting Standards Board (GASB).
District staff prepared this financial report in conjunction with an unmodified opinion issued by the independent audit firm White, Nelson, Diehl, Evans LLP. The independent auditor’s report is located at the front of the Financial Section of this document. The Management’s Discussion and Analysis (MD&A) immediately follows the independent auditor’s report and provides a narrative introduction, overview, and analysis of the basic financial statements. The MD&A complements this letter of transmittal and should be read in conjunction with it.
This report consists of management’s representations concerning finances of the District. Consequently, management assumes responsibility for the completeness and reliability of information presented in this report. To provide a reasonable basis for making these representations, the District has established a comprehensive internal control framework that is designed to protect assets from loss, theft or misuse, and to compile sufficient, reliable information for preparation of financial statements in conformity with Generally Accepted Accounting Principles (GAAP). Because the cost of internal control should not outweigh its benefits, the District’s comprehensive framework of internal controls has been designed to provide reasonable, rather than absolute, assurance that the financial statements will be free from material misstatement. Management asserts that, to the best of our knowledge and belief, this financial report is complete and reliable in all material aspects.
The Government Finance Officers Association of the United States and Canada (GFOA) awards Certificates of Achievement for Excellence in Financial Reporting to governmental entities. In order to be awarded a Certificate of Achievement, a governmental entity must publish an easily readable and efficiently organized comprehensive annual financial report. This report must satisfy both generally accepted accounting principles and applicable legal requirements. A Certificate of Achievement is valid for a period of one year only. The District received its first Certificate of Achievement for the fiscal year ending June 30, 2018 and will be submitting the current fiscal year’s CAFR for consideration of the award.

ii
District Structure and Leadership
The District is an independent special district, which operates under the authority of Division 12, Section 30000 et seq. of the California Water Code. The District provides water and sewer services to the City of Dana Point and portions of the cities of Laguna Beach, San Juan Capistrano, and San Clemente. The District was formed in 1932 and subsequent mergers have increased the original service area. Since March 2000, the District has been the contract operator for the former Tri-Cities Municipal Water District, now known as the Joint Regional Water Supply System (JRWSS).
The District is governed by a five-member Board of Directors, elected at large from within the District’s service area for staggered four-year terms. The General Manager administers the day-to-day operations of the District in accordance with policies and procedures established by the Board of Directors. The District employs a full-time staff of 92 employees, including six assigned to JRWSS. The Board of Directors meets on the second and fourth Thursdays of each month. Meetings are publicly noticed, and citizens are encouraged to attend. The meetings can also be viewed real-time or on demand via the District’s website, www.scwd.org.
The District provides water, sewer, or a combination of both services to residents and businesses within its service area, which includes approximately 5,300 acres of land comprising 8.8 square miles. The District serves a population of approximately 36,000 and currently provides water service through approximately 12,690 residential, commercial, and irrigation connections and 19,059 sewer connections.
District Services
Residential customers make up approximately 90% of the District’s customer base for water services and consume approximately 60% of the water provided annually by the District. The District obtained approximately 83% of its water supply from the Metropolitan Water District (MWD) through the Municipal Water District of Orange County (MWDOC), 4% from groundwater within the area, and 13% from recycled water. During Fiscal Year (FY) 2019, the District provided 5,853 acre-feet of water to its customers.
Residential customers make up approximately 97% of the District’s customer base for sewer collection services. Treatment services are provided by the South Orange County Wastewater Authority (SOCWA), a joint powers authority. The District is a member agency in SOCWA.
Economic Condition and Outlook
The District’s administrative office is in the City of Laguna Beach in Orange County, California. The service area consists of the City of Dana Point, South Laguna Beach, and portions of the cities of San Juan Capistrano and San Clemente.
The County of Orange has a strong economic base with unemployment rates of 2.5% in October 2019 compared to 2.8% in October 2018. Median income for the City of Dana Point in 2017 was $95,127 compared to $71,805 for California. The median property value for the City of Dana Point in 2017 was $912,947.

iii
Tourism is a major part of the local economy due to the area’s harbor, beaches, golf courses, resorts, hotels, and visitor-oriented commercial and retail establishments. Property values are high with a limited availability of space. The service area is mostly built-out, however, there are areas within the District that are experiencing redevelopment of single-family residences, condominiums, townhomes, and commercial areas that resulted in a slight increase in water connections and an increase in sewer connections of 1,053 in FY 2019. The economic outlook for the area is positive based on the above noted activities.
Water Supply
California’s water supply continues to be a concern due to recent drought conditions and State mandates. Conservation efforts continue, resulting in declining revenues for the District in prior years. In 2016, rates were revised to reflect a revenue base of approximately 60% fixed charges and 40% variable commodity rates. This was done to stabilize revenues and maintain ongoing operational and infrastructure needs. Water usage has not returned to pre-drought levels and is not expected to change in the future.
The District imports most of its potable water from the MWD through the MWDOC. The District purchased 5,035-acre feet of potable water from MWDOC in FY 2019, an increase of 175-acre feet from the prior fiscal year. The District also pumps potable groundwater from the Groundwater Reclamation Facility (GRF). The GRF produced 235-acre feet of potable water in FY 2019, a decrease of 492-acre feet from the prior fiscal year. The GRF was offline for approximately seven months due to major repairs and maintenance. The District continues to study the feasibility of building a desalination plant near Doheny State Beach in the City of Dana Point to provide a local source of water and reduce dependency on imported water sources.
Mission/Vision Statements and Major Initiatives
The activities of the Board and staff of the District are driven by its Mission Statement: “We are entrusted by our community to provide water resources essential for sustaining life,” and its Vision Statement: “Recognized as a premier water district unsurpassed in customer service, reliability, environmental stewardship, and organizational excellence.” The Mission and Vision Statements dictate the following five core values of the District:
1. Accountability – We are answerable for our behavior, actions, decisions, and producingexcellence in all we do.
2. Leadership – We inspire and guide individuals to work together to achieve our goals, attainexcellence in our craft, and push the boundaries of innovation.
3. Customer Service – We will demonstrate outstanding customer service through dedication,respect, courteous communication, and timely response.
4. Integrity – We commit to the highest standards of ethics, professionalism, and character inworking with each other and the public.
5. Teamwork – We work together collaboratively – where planning, decisions, and actions areaccomplished more effectively as a group than individually.

iv
Major Accomplishments and Future Projects
During FY 2019, the District accomplished the following:
Implemented a leadership academy for employees. Developed and implemented an employee professional development program. Implemented Microsoft Office 365. Started the implementation of new financial software to be completed during FY 2020. Completion of the pilot project for installation of the Advanced Metering Infrastructure program
for 3,000 customers. Partnered with the Water Emergency Response Organization of Orange County to prepare a risk
and resilience assessment and update emergency response plans according to the AmericasWater Infrastructure Act. The certified assessment report is due to the Environmental ProtectionAgency in March 2020.
Started the Hazard Mitigation Plan update by working with multi regional agencies. The Boardof Directors adopted the certified Plan in September 2019.
Completion of a Water Loss Audit that concluded that the District’s water loss percentage fallswithin the State of California’s standards.
Completion of a leak detection program for 50% of the District’s lines and repairs of leaksdetected.
Completed full-length lining of 18 gravity sewer mains totaling 3,300 linear feet (LF). Cleaned 928,230 LF of sewer lines. This equates to 127% of the District’s sewer lines which
includes cleaning all the sewer lines, root foaming twice a year and cleaning hot spots (repetitiveproblem areas) four times a year.
Refinanced the 2010B Build America Bonds and acquired $25 million of new debt for majorcapital projects through the issuance of revenue bonds in February 2019.
Major capital improvement projects in progress during FY 2019 are as follows:
Completed planning, design and started construction of Phase 2 of the Tunnel Project. Completed planning and design for Phase 4 of the Tunnel Project. Continued to study and plan feasibility of the Doheny Ocean Desalination plant. The
environmental impact report was released for public review and the Board adopted theEnvironmental Impact Review in June 2019.
Completed most of the construction for the Lift Station 2 Force Main Replacement project. Completed planning and design for rehabilitation of Lift Station Force Mains 6 and 11. Completed most of the construction for the Golden Lantern/Stonehill RW Bottleneck project.
Key operating priorities for FY 2020 are noted below:
Conduct an economic analysis of operating a consolidated district headquarters versus continuedrehabilitation of aging, segregated District facilities, in order to support of a competitiveworkplace suitable for industry standards.
Continue planning of the Asset Management Program, focusing on a “Consequence of Failure”analysis of the District’s potable water system.
Analyze the long-term viability of the current water/sewer rate structure. Ensure enterprise resiliency through the District’s continued coordination and partnership with
external agencies and stakeholders.

v
Identify and implement critical capital improvement projects to maintain water/sewer systemintegrity.
Execute the Tunnel Stabilization and Pipeline Replacement project. Execute planning and permitting of the Doheny Ocean Desalination project.
FY 2020 estimated revenues are $46.4 million and budgeted operating expenditures are $37 million. Capital projects for FY 2020 are budgeted at $38.4 million and funded by revenues in excess of expenditures, undesignated fund balance, and the issuance of debt. Major projects include the following:
Phase 3 and 4 of the Tunnel Project ($23.4 million). Lift Station 6 Force Main Replacement ($3 million). Planning for the Doheny Ocean Desalination Plant ($2.5 million). Tank recoating at 0.6 MG Reservoir 1A; 0.1 MG Reservoir 2B, 0.6 MG Reservoir 2C; and 0.1
MG Reservoir 3B ($1 million). Golden Lantern/Stonehill Recycled Water Bottleneck 2 Project ($1.4 million).
Water and Sewer Rates
In 2016, the District approved a five-year rate schedule effective from FY 2017 through FY 2021 in accordance with Proposition 218. The goals of the new rates were to simplify the existing rate structure, cover fixed costs to keep the District financially stable, fairly allocate fixed charges across all services classes, and protect against rate volatility.
During the drought, mandatory conservation measures resulted in lower revenues causing the District to struggle to recover fixed costs required to provide water services. In addition, costs increased for imported water, putting further stress on the District’s finances. Aging reservoirs, pipelines, and pump stations need rehabilitation or replacement over time and funding for these projects is necessary. The District is also working on an additional future source of water from a desalination facility.
Three components comprise water charges:
Variable – the price per unit of water which is billed on a monthly basis. Fixed – to recover fixed costs that exist without the sale of water, such as repairs, maintenance,
and rehabilitation of distribution systems. Fixed charges vary by meter size and are billedannually with property taxes.
Peak Demand – a new component of the rate structure that is based on a customer’s secondhighest usage month in the previous year. This charge reflects costs incurred to provide,transport, treat, and store water to be able to provide service for all peak demand timesthroughout the year. Peak demand charges are billed annually with property taxes.
Sewer rates consist of:
Variable Block – for single family residences, based on calculated winter usage billed annuallywith property taxes.
Variable Rate – for multi-family residences, based on water used billed on a monthly basis. Fixed – for multi-family residences, based on the number of dwelling units billed annually with
property taxes.

vi
Low/Medium/High Strength – for commercial customers based on water usage and type of use, such as office, mixed use, and restaurants billed on a monthly basis.
During FY 2019, the average monthly water and sewer bill for residential customers using 10 hundred cubic feet (CCF) including fixed charges was $76.02 (water) and $57.92 (sewer). The average monthly bill for commercial customers using 66 CCF was $366.82 (water) and $519.42 (sewer). The fixed charges include the Peak Demand charge. For residential customers the average monthly Peak Demand charge was $21.14 and $116.31 for commercial customers. Internal Control Structure District management is responsible for the establishment and maintenance of an internal control structure that ensures that assets of the District are protected from loss, theft or misuse. The internal control structure also ensures that adequate accounting data is compiled to allow for the preparation of financial statements in conformity with generally accepted accounting principles. The District’s internal control structure is designed to provide reasonable assurance that these objectives are met. The concept of reasonable assurance recognizes that (1) the cost of a control should not exceed the benefits likely to be derived, and (2) the valuation of costs and benefits requires estimates and judgments by management. Budgetary Control The District Board of Directors adopts an operating and capital budget every fiscal year. The budget authorizes and provides the basis for reporting and control of financial operations and accountability for the District’s enterprise operations and capital projects. The budget and reporting treatment applied to the District is consistent with the accrual basis of accounting and financial statement presentation. Investment Policy The Board has adopted an Investment Policy that conforms to state law, prudent money management, and the “prudent person” standards. The objectives of the policy are safety, liquidity, and then yield. Currently, funds are invested in various securities as authorized by the policy and are managed by Chandler Asset Management. Audit and Financial Reporting State law and bond covenants require the District to obtain annual audits of its financial statements by an independent certified public accountant. The accounting firm of White, Nelson, Diehl, Evans LLP has conducted the audit of the District’s financial statements. Their unmodified (clean) Independent Auditor’s Report appears in the Financial Section. Other References More information is contained in the Management’s Discussion and Analysis and the Notes to the Basic Financial Statements found in the Financial Section of the report.

vii
Acknowledgements
I wish to express my appreciation to the entire Finance and Customer Service Department staff for their contribution to the department during the year. Their efforts are reflected in this report and in other documents resulting from the annual audit process. Special thanks are due to Amy Doucet C.P.A., Controller; Matthew Perea, Senior Accountant; Anna Nguyen C.P.A. (inactive), Accountant; William Covington C.P.A., accounting consultant; Elizabeth Andrew C.P.A., Part-Time Senior Accountant; and Cassandra Garcia, Customer Service Manager. Their significance in preparing final financial documents is reflected in the quality of this report.
The Board of Directors are to be commended for their interest and support in conducting the financial operations of the District in a responsible and progressive manner.
Respectfully submitted,
_______________________________________ Pamela Arends-King Chief Financial Officer

viii
SOUTH COAST WATER DISTRICT
SERVICE AREA

ix
d
RECREATION
MANAGER
PUBLIC
INFORMATION
OFFICER
ENVIRONMENTAL
HEALTH AND
SAFTEY
HUMAN
RESOURCES/RISK
MANAGEMENT
ADMINISTRATION
DIVISION
INFORMATION
TECHNOLOGY
OFFICE
CLERK OF THE BOARD
EXECUTIVE ASSISTANT
GENERAL
MANAGER
ENGINEERING
DEPARTMENT
FINANCE
DEPARTMENT
OPERATIONS
DEPARTMENT
CONTRACTS
FINANCE/
BUDGET
DIVISION
CUSTOMER
SERVICE
DIVISION
O & M
DIVISION
JOINT REGIONAL
WATER SUPPLY
SYSTEM
WATER
PRODUCTION
DIVISION
WATER
CONSERVATION
COLLECTION
SYSTEM
SECTION
DISTRIBUTION
SYSTEM
SECTION
SUPPORT
SYSTEM
SECTION
South Coast Water District – Organization Chart
BOARD OF
DIRECTORS
PERMITTING/
INSPECTION
ENGINEERING
GIS

x
South Coast Water District
Board of Directors
William Green Dennis Erdman Rick Erkeneff President Vice President Director
Douglas Erdman Wayne Rayfield Director Director
Executive Staff
General Manager Rick Shintaku Chief Financial Officer Pamela Arends-King Chief Operations Officer Joseph McDivitt Chief Engineer Marc Serna


xii
(This page intentionally left blank)

2875 Michelle Drive, Suite 300 | Irvine, California 92606 | WNDECPA.com | 714.978.1300
1
INDEPENDENT AUDITORS’ REPORT
Board of Directors South Coast Water District Laguna Beach, California
Report on the Financial Statements
We have audited the accompanying financial statements of each major fund and the aggregate remaining fund information of the South Coast Water District (the District) as of and for the year ended June 30, 2019, and the related notes to the financial statements, which collectively comprise the District’s basic financial statements as listed in the table of contents.
Management’s Responsibility for the Financial Statements
Management is responsible for the preparation and fair presentation of these financial statements in accordance with accounting principles generally accepted in the United States of America; this includes the design, implementation, and maintenance of internal control relevant to the preparation and fair presentation of financial statements that are free from material misstatement, whether due to fraud or error.
Auditors’ Responsibility
Our responsibility is to express opinions on these financial statements based on our audit. We conducted our audit in accordance with auditing standards generally accepted in the United States of America, the standards applicable to financial audits contained in Government Auditing Standards, issued by the Comptroller General of the United States, and the State Controller’s Minimum Audit Requirements for California Special Districts. Those standards require that we plan and perform the audit to obtain reasonable assurance about whether the financial statements are free from material misstatement.
An audit involves performing procedures to obtain audit evidence about the amounts and disclosures in the financial statements. The procedures selected depend on the auditors’ judgment, including the assessment of the risks of material misstatement of the financial statements, whether due to fraud or error. In making those risk assessments, the auditors consider internal control relevant to the District’s preparation and fair presentation of the financial statements in order to design audit procedures that are appropriate in the circumstances, but not for the purpose of expressing an opinion on the effectiveness of the District’s internal control. Accordingly, we express no such opinion. An audit also includes evaluating the appropriateness of accounting policies used and the reasonableness of significant accounting estimates made by management, as well as evaluating the overall presentation of the financial statements.
We believe that the audit evidence we have obtained is sufficient and appropriate to provide a basis for our audit opinions.

2
Opinions In our opinion, the financial statements referred to above present fairly, in all material respects, the financial position of the South Coast District, as of June 30, 2019, and the respective changes in financial position and cash flows thereof for the year then ended in accordance with accounting principles generally accepted in the United States of America. Emphasis of Matter As discussed in Note 14 to the financial statements, the net position as of July 1, 2018 was restated. Our opinions are not modified with respect to this matter. Other Matters Prior-Year Comparative Information The financial statements include partial prior-year comparative information. Such information does not include all of the information required for a presentation in accordance with accounting principles generally accepted in the United States of America. Accordingly, such information should be read in conjunction with the District’s financial statements for the year ended June 30, 2018, from which such partial information was derived. Report on Required Supplementary Information Accounting principles generally accepted in the United States of America require that the management’s discussion and analysis, the schedule of proportionate share of the net pension liability, the schedule of contributions - pension, schedule of changes in the net OPEB liability and related ratios, and schedule of contributions - OPEB, identified as Required Supplementary Information (RSI) in the accompanying table of contents, be presented to supplement the basic financial statements. Such information, although not a part of the basic financial statements, is required by the Governmental Accounting Standards Board, who considers it to be an essential part of financial reporting for placing the basic financial statements in an appropriate operational, economic, or historical context. We have applied certain limited procedures to the RSI in accordance with auditing standards generally accepted in the United States of America, which consisted of inquiries of management about the methods of preparing the information and comparing the information for consistency with management’s responses to our inquiries, the basic financial statements, and other knowledge we obtained during the audit of the basic financial statements. We do not express an opinion or provide any assurance on the RSI because the limited procedures do not provide us with sufficient evidence to express an opinion or provide any assurance. Other Information Our audit was conducted for the purpose of forming opinions on the financial statements that collectively comprise the District’s basic financial statements. The introductory section, general expenses allocation by facilities, general expenses allocation by participants, and budget allocation factors by participants (supplementary information for JRWSS) and statistical section, as listed in the accompanying table of contents, are presented for purposes of additional analysis and are not a required part of the basic financial statements.

3
Other Matters (Continued)
Other Information (Continued)
The supplementary information for JRWSS is the responsibility of management and was derived from and relates directly to the underlying accounting and other records used to prepare the basic financial statements. Such information has been subjected to the auditing procedures applied in the audit of the basic financial statements and certain additional procedures, including comparing and reconciling such information directly to the underlying accounting and other records used to prepare the basic financial statements or to the basic financial statements themselves, and other additional procedures in accordance with auditing standards generally accepted in the United States of America. In our opinion, the supplementary information for JRWSS is fairly stated in all material respects in relation to the basic financial statements as a whole.
The introductory and statistical sections have not been subjected to the auditing procedures applied in the audit of the basic financial statements, and accordingly, we do not express an opinion or provide any assurance on them.
Other Reporting Required by Government Auditing Standards
In accordance with Government Auditing Standards, we have also issued our report dated December 19, 2019, on our consideration of the District’s internal control over financial reporting and on our tests of its compliance with certain provisions of laws, regulations, contracts, and grant agreements and other matters. The purpose of that report is to describe the scope of our testing of internal control over financial reporting and compliance and the results of that testing, and not to provide an opinion on the internal control over financial reporting or on compliance. That report is an integral part of an audit performed in accordance with Government Auditing Standards in considering the District’s internal control over financial reporting and compliance.
Irvine, California December 19, 2019

4
(This page intentionally left blank)

SOUTH COAST WATER DISTRICT Management’s Discussion and Analysis For the Fiscal Year Ended June 30, 2019
5
The following discussion and analysis of the financial performance of the South Coast Water District (District) provides an overview of the District’s financial activities for the fiscal year ended June 30, 2019. This section should be read in conjunction with the basic financial statements, notes to the basic financial statements, and the Transmittal Letter in the Introductory Section of this report.
Financial Highlights
Total assets and deferred outflows of resources exceed total liabilities and deferred inflows of resourcesby $170.6 million (net position), consisting of $140.8 million in net investment in capital assets, $20.7million in restricted for debt service/covenants, and $9.0 million in unrestricted net position. This is anincrease of $180,020 or 0.1% over the prior fiscal year restated net position of $170.4 million.
Total assets are $257.1 million, an increase of $29.4 million, or 12.9%, from the prior fiscal year. Theincrease in assets is primarily due to the increase in capital assets not being depreciated (construction inprogress) for the Tunnel Rehabilitation and Sewer Pipeline Replacement project (Tunnel Project) and theLift Station 2 Force Main Replacement project.
Total liabilities are $90.6 million, an increase of $29.3 million, or 47.8%, from the prior fiscal year. Thisincrease is primarily due to an increase in accounts payables ($3.1 million), the issuance of the 2019ARevenue Bonds ($25.9 million of new debt) to fund major capital projects, and an increase in fundingfrom the State Resource Funding loan ($1.6 million) to fund the Tunnel Project.
Total operating revenues are $34.3 million, an increase of $1.8 million, or 5.6%, from the prior fiscal year.The primarily reason for the increase is due to the implementation of the third year of the adopted five-year rate increases.
Total operating expenses are $39.4 million, an increase of $3.8 million, or 10.6%, from the prior fiscalyear primarily due to the increase in operating expenses for the District’s contribution for wastewatertreatment to the South Orange County Wastewater Authority (SOCWA) of $979,000; computer servicesfor software implementation of $546,459; writing off inventory of $494,123; and an increase in repairsand maintenance of infrastructure throughout the District of $1.1 million.
Net income before capital contributions was $9,489, down $3.2 million, or 99.7%, from the prior fiscalyear. Contributions to this decline were the above noted operating expensing items, plus non-operatingexpenses of $5.7 million, $3.8 million higher than fiscal year 2018. The major items impacting thisincrease were higher interest expense and one-time costs related to the disposal of impaired assets.
Required Financial Statements
The annual report consists of a series of financial statements. The Statement of Net Position, Statement of Revenues, Expenses, and Changes in Net Position, and Statement of Cash Flows provide information about the activities and performance of the District using accounting methods like those used by private sector companies.
The financial statements consist of two funds, one for the District’s activities and a private purpose trust fund for the Joint Regional Water Supply System (JRWSS). The District maintains its accounting records on an enterprise basis, as it is the intent of the Board of Directors that the costs of providing water and sewer services to customers of the District are financed primarily through user charges. Records for JRWSS are also maintained on an enterprise basis.

SOUTH COAST WATER DISTRICT Management’s Discussion and Analysis For the Fiscal Year Ended June 30, 2019
6
The Statement of Net Position includes all investments in resources (assets), deferred outflows of resources, obligations to creditors (liabilities), and deferred inflows of resources. This statement also provides the basis for computing a rate of return, evaluating the capital structure of the District, and assessing liquidity and financial flexibility.
The Statement of Revenues, Expenses, and Changes in Net Position accounts for all current year revenues and expenses. This statement measures the performance of operations over the past year and used to determine if the District has successfully recovered all its costs through its rates and other charges. Other uses for this statement are to evaluate profitability and credit worthiness.
The final required financial statement is the Statement of Cash Flows, which provides information about the District’s cash receipts and cash payments during the reporting period by reporting cash receipts, cash payments, and net changes in cash resulting from operations, investing, non-capital financing, and capital and related financing activities. This statement provides answers to such questions as where cash came from, what was cash used for, and what was the change in cash balance during the reporting period.
Notes to the Basic Financial Statements
The notes provide additional information that is essential to a full understanding of the data provided in the basic financial statements. The notes to the basic financial statements are on pages 23 through 55.
Financial Analysis of the District
One of the most important questions asked about District finances is, “Is the District better or worse off as a result of this year’s activities?” The Statement of Net Position and the Statement of Revenues, Expenses, and Changes in Net Position report information in a way that helps answer this question. These statements include all assets, deferred outflows of resources, liabilities, and deferred inflows of resources using the accrual basis of accounting, which is like the accounting used by most private sector companies. All the current year’s revenues and expenses are considered regardless of when the cash is received or paid.
These two statements report net position and changes during the fiscal year. You can think of net position (the difference between assets, deferred outflows of resources, liabilities, and deferred inflows of resources), as one way to measure the District’s financial health, or financial position. Over time, increases or decreases in net position are one indicator of whether its financial health is improving or deteriorating. However, one will also need to consider other non-financial factors such as changes in economic conditions, conservation mandates, population growth, zoning, and new or changed government legislation, such as changes in Federal and State water quality standards.
The following condensed schedules contain summary financial information extracted from the basic financial statements to assist general readers in evaluating the District’s overall financial position and results of operations as described in this Management’s Discussion and Analysis (MD&A). Increases or decreases in these schedules can be used as performance indicators to assess whether overall financial position has improved or deteriorated. Other external factors such as changes in economic conditions, customer growth, and legislative mandates should also be considered as a part of this analysis.

SOUTH COAST WATER DISTRICT Management’s Discussion and Analysis For the Fiscal Year Ended June 30, 2019
7
Financial Position Summary
The Statement of Net Position reflects the District’s financial position as of June 30, 2019. This statement includes assets, deferred outflows of resources, liabilities, and deferred inflows of resources. Net position represents net worth including, but not limited to, capital contributions and investments in capital assets. A condensed summary of the District’s total net position is set forth below:
2019 2018 $ Change % ChangeAssets:
Current assets $ 60,049,653 54,344,998 $ 5,704,655 10.5%Capital assets:
Not depreciable 62,640,034 40,542,192 22,097,842 54.5%Being depreciated (net of accumulated depreciation) 126,449,085 124,624,205 1,824,880 1.5%
Other assetsInvestment in joint venture 7,951,147 8,219,287 (268,140) -3.3%
Total assets 257,089,919 227,730,682 29,359,237 12.9%
Deferred outflows of resources:Deferred amounts on refunding, pension & OPEB 4,922,884 5,531,177 (608,293) -11.0%
Liabilities:Current liabilities 11,465,539 8,026,333 3,439,206 42.8%Non-current liabilities 79,153,539 53,272,612 25,880,927 48.6%
Total liabilities 90,619,078 61,298,945 29,320,133 47.8%
Deferred inflows of resources:Deferred amounts on pension & OPEB 790,558 1,539,767 (749,209) -48.7%
Net position:Net investment in capital assets 140,811,169 121,807,991 19,003,178 15.6%Restricted for debt service/covenants 20,748,829 457 20,748,372 4540125.2%Unrestricted 9,043,169 48,614,699 (39,571,530) -81.4%
Total net position $ 170,603,167 $ 170,423,147 $ 180,020 0.1%

SOUTH COAST WATER DISTRICT Management’s Discussion and Analysis For the Fiscal Year Ended June 30, 2019
8
As noted earlier, net position may serve as a useful indicator over time of a government’s financial position. In the case of the District, assets and deferred outflows of resources exceeded liabilities and deferred inflows of resources by $170.6 million as of June 30, 2019. The net change between fiscal year (FY) 2019 and 2018 of $180,020 reflects a decrease in the changes in net position of $3.2 million primarily due to the increase in operating expenses; the increase in the loss on the disposal of capital assets of $2.4 million; and the increase of Net position, beginning of year, as restated of $3.4 million.
Assets increased $29.4 million, or 12.9 %, from FY 2018. Cash and Investments decreased $15.7 million from prior fiscal year primarily due to cash expended for the Tunnel Project and the delay in getting reimbursed from the California State Water Resources Board for the State Revolving Fund (SRF) loan to cover the costs of the Tunnel Project of $17.7 million. The State’s delay in reimbursing the District was due to a major software conversion. As the State was unable to determine when the District would receive the reimbursement for the costs incurred for the Tunnel Project and for ongoing costs, the District acquired a line of credit in July 2019 to help alleviate any possible cash flow issues. Cash and investments restricted by debt agreements increased $20.7 million from FY 2018. The $20.7 million are restricted bond proceeds from the issuance of revenue bonds in February 2019 to fund major capital projects. Capital assets not being depreciated increased $22.1 million, or 54.5%, from the prior fiscal year due to increased activity on the Tunnel Project.
Liabilities increased $29.3 million, or 47.8%, from FY 2018. The primary reason for the increase is due to the issuance of new debt totaling $25.9 million through revenue bonds in February 2019, to fund major rehabilitation of the District’s sewer lift stations and other major capital improvement projects with a useful life exceeding 15 years. Loans payable increased $1.6 million from the prior fiscal year due to funding the Tunnel Project with an SRF loan. Accounts Payables increased $3 million from FY 2018 due to costs incurred for the Tunnel Project. The net pension liability decreased $547,647, and OPEB liability decreased $312,758, reflecting the Districts on-going funding of required costs.
By far the largest portion of the District’s net position (82.5% as of June 30, 2019) reflects investment in capital assets (net of accumulated depreciation) less any related debt used to acquire those assets that is still outstanding. The District uses these capital assets to provide services to customers within its service area; consequently, these assets are not available for future spending.
For the year ended June 30, 2019, the District showed a positive balance in its unrestricted net position of $9.0 million, which is a $39.6 million decline from the prior fiscal year. This decline represents $20.7 million restricted for debt service/covenants due to the new debt obligation noted above and the use of unrestricted net position for pay as you go capitalized capital projects of $9.9 million

SOUTH COAST WATER DISTRICT Management’s Discussion and Analysis For the Fiscal Year Ended June 30, 2019
9
Activities and Changes in Net Position
The Statement of Revenues, Expenses, and Changes in Net Position summarizes operations during the current fiscal year. A summary of the District’s changes in net position for the fiscal year ended June 30, 2019 is included below:
2019 2018 Change
Revenues:Operating revenues:
Water sales $ 17,518,158 16,415,394 $ 1,102,764 6.7%Sewer service charges 14,702,662 13,839,953 862,709 6.2%Recycled water 1,770,840 1,907,580 (136,740) -7.2%Recreation facilities 294,177 291,564 2,613 0.9%
Total operating revenues 34,285,837 32,454,491 1,831,346 5.6%Non-operating revenues:
Investment income 1,412,028 353,704 1,058,324 299.2%Property taxes - general and bond levy 6,558,495 6,332,296 226,199 3.6%Standby charges - 1,605 (1,605) -100.0%Rental income (net of expenses) 832,059 782,842 49,217 6.3%Other revenues 2,044,497 819,595 1,224,902 149.5%
Total non-operating revenues 10,847,079 8,290,042 2,557,037 30.8%Total revenues 45,132,916 40,744,533 4,388,383 10.8%
Expenses:Operating expenses:
Source of supply (purchased water) 6,085,677 5,804,144 281,533 4.9%Groundwater recovery facility 1,011,303 686,714 324,589 47.3%Recycled water 942,374 621,481 320,893 51.6%Pumping expense 1,111,566 1,101,671 9,895 0.9%Sewer treatment plant 5,400,627 4,421,065 979,562 22.2%Transmission and distribution 4,854,330 4,217,828 636,502 15.1%Operations support 2,932,001 2,409,490 522,511 21.7%Recreation facilities 294,565 365,952 (71,387) -19.5%Engineering and consulting 2,314,667 2,577,966 (263,299) -10.2%General and administrative 8,216,031 7,058,374 1,157,657 16.4%Depreciation 6,259,702 6,384,604 (124,902) -2.0%
Total operating expenses 39,422,843 35,649,289 3,773,554 10.6%Non-operating expenses:
Interest expense 2,294,818 1,337,020 957,798 71.6%Loss on disposal of capital assets 2,430,233 12,354 2,417,879 19571.6%Share of joint venture expenses 571,241 393,387 177,854 45.2%Other expenses 404,292 124,755 279,537 224.1%
Total non-operating expenses 5,700,584 1,867,516 3,833,068 205.2%Total expenses 45,123,427 37,516,805 7,606,622 20.3%
Income before capital contributions 9,489 3,227,728 (3,218,239) -99.7%
Capital contributions 757,263 745,969 11,294 1.5%
Change in net position 766,752 3,973,697 (3,206,945) -80.7%Net position at beginning of year 170,423,147 169,143,596 1,279,551 0.8%Adjustment for restatement (586,732) (2,694,146) 2,107,414 -78.2%Net position at beginning of year, as restated 169,836,415 166,449,450 3,386,965 2.0%
Net position at end of year $ 170,603,167 $ 170,423,147 $ 180,020 0.1%
SOUTH COAST WATER DISTRICT Management’s Discussion and Analysis For the Fiscal Year Ended June 30, 2019
10
The Statement of Revenues, Expenses, and Changes of Net Position details how net position changed during the fiscal year. The District’s net position increased by $180,020 for the fiscal year ended June 30, 2019. A closer examination of the sources of changes in net position reveals that:
• Water sales increased $1.1 million (6.7%) from the prior fiscal year. The primary reason for the increase in revenue is due to the implementation of the third year of the five-year rate increase. Commodity sales remain fairly the same as FY 2018, therefore most of the revenue increase was due to increases in the fixed charges. The fixed service capacity charge increased $332,910 and the Peak Demand charge increased $692,439 from FY 2018.
• Sewer service charges increased $862,709 (6.2%) from the prior fiscal year. The primary reason for the increase in revenue is due to the implementation of the third year of the five-year rate increase. The fixed sewer service charge for residential customers increased $598,880 and the sewer commodity charge for commercial customers increased $190,907 from FY 2018.
• Investment income increased $1 million, or 299.2%, from FY 2018 primarily due to the increase in unrealized gain on investments of $766,219. Interest income earned increased $237,447 from the prior fiscal year primarily due to the increase in interest rates. The average yield the District received on investments in FY 2019 was 2% compared to 1.3% in FY 2018.
• Other revenues increased $1.2 million (149.5%) from the prior fiscal year primarily due to the District receiving $1.3 million for reimbursement of legal costs incurred regarding Moulton Niguel Water District (MNWD) vs SOCWA litigation. MNWD disputed its share of financial obligation for maintenance and operation of the coastal treatment plant known as Project Committee 15 (PC15). The District shared the legal costs of this litigation with the City of Laguna Beach, also a member of PC15. The court judgement ruled in favor of SOCWA, therefore MNWD was required to reimburse the City of Laguna Beach and the District for legal costs incurred.
• Sewer treatment plant expense increased $979,000, or 22.2%, from the prior fiscal year due to the required contribution for the District’s share of SOCWA’s operation and maintenance costs for FY 2019.
• Overall operating expenses other than Sewer treatment plant increased $2.7 million from FY 2018. Of that amount $1.1 million represents the increase in expenses for repairs and maintenance for various areas of the District. This includes $527,453 for recoating reservoirs; $233,862 for repairs to the Ground Water Recovery Facility; and $338,685 for repairs such as fencing, sewer lateral maintenance, landscaping and manhole maintenance. Computer services and software maintenance agreements increased $546,459 from FY 2018 due to the acquisition and implementation of new finance software. The District incurred a one-time expense of $494,123 to write off inventory. Staff determined that inventory balances were immaterial in relation to the amount of staff time needed to maintain it, therefore, departments will now acquire supplies and parts on an as needed basis.
• Total labor costs excluding benefits and overtime were $10.4 million for FY 2019. Labor costs decreased$812,836 from FY 2018 primarily due to vacant positions. Employees received a cost of living increase of 3.6% based on CPI for FY 2019. The average merit increase was 3%, therefore, the total average salary increase for employees was 6.6%.
• Interest expense increased $957,798, or 71.6%, from the prior fiscal year due to issuance costs of$325,314 for the 2019A revenue bonds issued in February 2019 and the interest expense for the 2019A revenue bonds of $554,418.

SOUTH COAST WATER DISTRICT Management’s Discussion and Analysis For the Fiscal Year Ended June 30, 2019
11
Loss on disposal of capital assets increased $2.4 million from FY 2018 due to expensing construction in progress for the Ground Water Recovery Facility Water Well Head project. The project started approximately eight years ago and due to the annual fluctuations in water yield in the San Juan Basin it was determined it would not be effective to continue with the construction of the well head, pumps and piping and additional funding.
The adjustment for restatement decreased $2.1 million, or 78.2%, from the prior fiscal year. The FY 2018 adjustment for restatement to beginning Net Position of $2.6 million was due to the implementation of GASB 75, which requires the OPEB liability is reported on the statement of Net Position. Before the implementation of GASB 75, this liability was disclosed as a note to the financial statements. The FY 2019 adjustment for restatement to beginning Net Position of $586,732 is the correction of FY 2018 pension contributions subsequent to measurement date.
Capital Assets Changes in capital asset amounts for FY 2019 were as follows:
At the end of FY 2019, the District’s investment in capital assets was $189.1 million (net of accumulated depreciation). This investment in capital assets includes land, treatment systems, transmission and distribution systems, reservoirs, tanks, pumps, buildings and structures, equipment, vehicles, and construction-in-process, etc. Major capital assets projects in FY 2019 include:
Planning and construction of phase 2 of the Tunnel Project.
Planning and design for phase 3 of the Tunnel Project.
Planning and construction for the Lift Station 2 Force Main Rehabilitation Project.
Planning and construction for the Golden Lantern/Stonehill RW Bottleneck project.
Transfers/Deletions include completed construction in progress (capital assets, not being depreciated) to Capital assets, being depreciated of $5 million and $2.4 million due to expensing the Ground Water Recovery Facility Water Well Head project. See Note 3 in the notes to the Basic Financial Statement for Additional information regarding capital assets.
Balance Transfers/ Balance2018 Additions Deletions 2019
Capital assets:Capital assets, not being depreciated $ 40,542,192 29,482,512 (7,384,670) $ 62,640,034 Capital assets, being depreciated 255,123,025 8,084,582 (92,835) 263,114,772 Less accumulated depreciation (130,498,820) (6,259,702) 92,835 (136,665,687)
Total capital assets, net $ 165,166,397 $ 31,307,392 $ (7,384,670) $ 189,089,119

SOUTH COAST WATER DISTRICT Management’s Discussion and Analysis For the Fiscal Year Ended June 30, 2019
12
Long-Term Liabilities Changes in long-term debt amounts for the year ended June 30, 2019 were as follows:
The District issued $41.7 million of revenue bonds in February 2019. The new debt refinanced the 2010B Revenue Bonds (Build America Bonds) a total of $19.4 million and issued $25 million of new money. The $25 million in bond proceeds is intended to fund the Golden Lantern/Stonehill RW Bottleneck projects totaling $8.6 million; the Lift Station 6 Improvements and Force Main Replacement project totaling $3.2 million; improvements to Lift Station 11 totaling $775,000; and Lift Station 2 Force Main Replacement project totaling $3.4 million. The remainder of the bond proceeds will fund capital improvement projects for assets with a useful life exceeding twenty years. All other activity during the fiscal year consisted of scheduled debt payments, amortization, and compensated absence usage and accruals. Additional information regarding long-term liabilities can be found in Note 4 in Notes to Basic Financial Statements. Requests for Information This financial report is designed to provide the District’s funding sources, customers, stakeholders, and other interested parties with an overview of financial operations and condition. Should the reader have questions regarding the information included in this report or wish to request additional financial information, please contact the District at 31592 West Street, Laguna Beach, California 92651 or the Finance Department at (949) 499-4555.
Beginning Ending Balance Additions Deletions Balance
2000 State Revolving Loan $ 846,156 $ - $ (423,078) $ 423,078 2016 State Revolving Loan (Tunnel Project) 10,939,106 1,584,403 12,523,509 2010B Revenue Bonds (Build America Bonds) 19,350,000 - (19,350,000) - 2016A Refunding Revenue Bonds 11,585,000 - (850,000) 10,735,000 2019A Revenue Bonds - 41,680,000 - 41,680,000
Subtotal 42,720,262 43,264,403 (20,623,078) 65,361,587
Add (Less):2000 State Revolving Loan Discount (125,669) - 71,612 (54,057) 2010B Revenue Bonds Discount (473,946) - 473,946 - 2016A Refunding Revenue Bonds Premium 1,955,016 - (119,390) 1,835,626 2019A Revenue Bonds Premium - 3,701,350 (41,126) 3,660,224
Total 44,075,663 46,965,753 (20,238,036) 70,803,380
Compensated Absences 1,201,923 259,481 (166,377) 1,295,027
Total $ 45,277,586 $ 47,225,234 $ (20,404,413) $ 72,098,407

13
BASIC FINANCIAL STATEMENTS

14
(This page intentionally left blank)
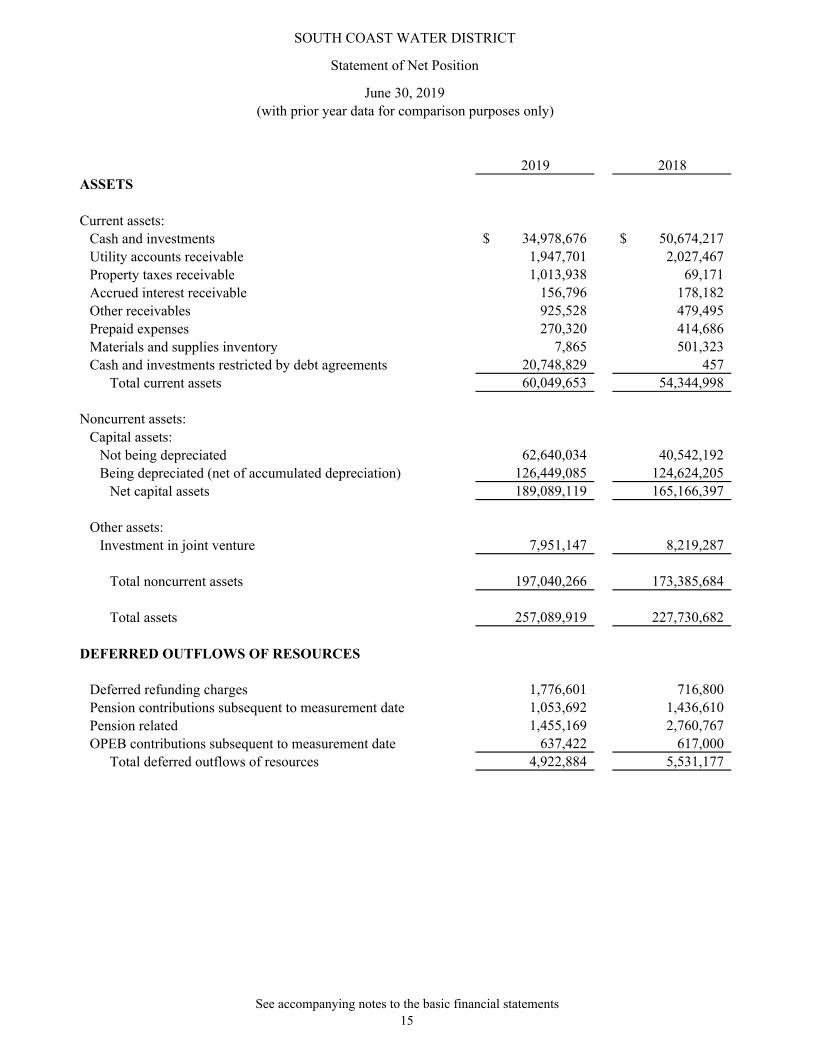
2019 2018ASSETS
Current assets:Cash and investments 34,978,676$ 50,674,217$ Utility accounts receivable 1,947,701 2,027,467 Property taxes receivable 1,013,938 69,171 Accrued interest receivable 156,796 178,182 Other receivables 925,528 479,495 Prepaid expenses 270,320 414,686 Materials and supplies inventory 7,865 501,323 Cash and investments restricted by debt agreements 20,748,829 457
Total current assets 60,049,653 54,344,998
Noncurrent assets:Capital assets:
Not being depreciated 62,640,034 40,542,192 Being depreciated (net of accumulated depreciation) 126,449,085 124,624,205
Net capital assets 189,089,119 165,166,397
Other assets:Investment in joint venture 7,951,147 8,219,287
Total noncurrent assets 197,040,266 173,385,684
Total assets 257,089,919 227,730,682
DEFERRED OUTFLOWS OF RESOURCES
Deferred refunding charges 1,776,601 716,800 Pension contributions subsequent to measurement date 1,053,692 1,436,610 Pension related 1,455,169 2,760,767 OPEB contributions subsequent to measurement date 637,422 617,000
Total deferred outflows of resources 4,922,884 5,531,177
SOUTH COAST WATER DISTRICT
Statement of Net Position
June 30, 2019(with prior year data for comparison purposes only)
See accompanying notes to the basic financial statements15

2019 2018LIABILITIES
Current liabilities: Accounts payable 7,921,201$ 4,862,232$ Accrued salaries and benefits 396,191 373,916 Advances from developers 222,728 195,784 Customer deposits 159,197 158,462 Accrued interest payable 768,532 517,738 Current portion of loans payable, net 423,078 423,078 Current portion of bonds payable, net 880,000 850,000 Current portion of compensated absences 694,612 645,123
Total current liabilities 11,465,539 8,026,333
Noncurrent liabilities: Loans payable, net 12,469,452 11,236,515 Bonds payable, net 57,030,850 31,566,070 Compensated absences 600,415 556,800 Net pension liability 6,961,317 7,508,964 Net OPEB liability 2,091,505 2,404,263
Total noncurrent liabilities 79,153,539 53,272,612
Total liabilities 90,619,078 61,298,945
DEFERRED INFLOWS OF RESOURCESPension related 609,782 1,368,335 OPEB related 180,776 171,432
Total deferred inflows of resources 790,558 1,539,767
NET POSITIONNet investment in capital assets 140,811,169 121,807,991 Restricted for debt service/covenants 20,748,829 457 Unrestricted 9,043,169 48,614,699
Total net position 170,603,167$ 170,423,147$
SOUTH COAST WATER DISTRICT
Statement of Net Position
June 30, 2019
(Continued)(with prior year data for comparison purposes only)
See accompanying notes to the basic financial statements16

2019 2018Operating revenues:
Water sales 17,518,158$ 16,415,394$ Sewer service charges 14,702,662 13,839,953 Recycled water 1,770,840 1,907,580 Recreation facilities 294,177 291,564
Total operating revenues 34,285,837 32,454,491
Operating expenses:Source of supply (purchased water) 6,085,677 5,804,144 Groundwater recovery facility 1,011,303 686,714 Recycled water 942,374 621,481 Pumping expense 1,111,566 1,101,671 Sewer treatment plant 5,400,627 4,421,065 Transmission and distribution 4,854,330 4,217,828 Operations support 2,932,001 2,409,490 Recreation facilities 294,565 365,952 Engineering and consulting 2,314,667 2,577,966 General and administrative 8,216,031 7,058,374 Depreciation 6,259,702 6,384,604
Total operating expenses 39,422,843 35,649,289
Income (Loss) from operations (5,137,006) (3,194,798)
Non-operating revenues (expenses):Property taxes – general and bond levy 6,558,495 6,332,296 Standby charges - 1,605 Investment income 1,412,028 353,704 Other revenues 2,044,497 819,595 Rental income 832,059 782,842 Interest expense (2,294,818) (1,337,020) Gain (loss) on disposal of capital assets (2,430,233) (12,354) Share of joint venture income (expenses) (571,241) (393,387) Other expenses (404,292) (124,755)
Total non-operating revenues (expenses) 5,146,495 6,422,526
Income before capital contributions 9,489 3,227,728
Capital contributions:Capital grant - 506 Contributed assets 270,639 160,916 Connection fees 486,624 584,547
Total capital contributions 757,263 745,969
Change in net position 766,752 3,973,697
Net position at beginning of the year 170,423,147 169,143,596Prior period adjustments (586,732) (2,694,146)Net position at beginning of the year, as restated 169,836,415 166,449,450
Net position at end of the year 170,603,167$ 170,423,147$
SOUTH COAST WATER DISTRICT
Statement of Revenues, Expenses and Changes in Net Position
For the Year Ended June 30, 2019(with prior year data for comparison purposes only)
See accompanying notes to the basic financial statements17

2019 2018Cash flows from operating activities:
Cash received from customers 33,920,305$ 33,433,174$ Cash payments to employees for services (10,444,693) (9,717,437) Cash payments to suppliers for goods and services (19,434,529) (19,217,374) Standby charges received - 1,605 Rental income received 832,059 782,842 Other expenses (404,292) (124,755) Other operating revenues 2,044,497 819,595
Net cash provided by operating activities 6,513,347 5,977,650
Cash flows from noncapital financing activities:Proceeds from property taxes, general levy 5,613,728 6,342,800
Net cash provided by noncapital financing activities 5,613,728 6,342,800
Cash flows from capital and related financing activities:Acquisitions and construction of capital assets (32,359,603) (15,909,987) Proceeds from capital grant - 506 Proceeds from sale of capital assets 17,585 14,751 Proceeds from bond issuance 45,381,351 - Proceeds from loan 1,325,635 10,939,106 Repayment of loans and bonds (1,273,078) (1,630,391) Payment made to refunding escrow agent (20,036,131) - Interest paid (1,656,900) (1,697,216) Receipt of interest subsidy 208,330 378,921 Payments for cost of bond issuance (325,314) - Water and sewer connection fees received 486,624 584,547 Receipts (return) of customer deposits and developer advances 26,944 41,611
Net cash used for capital and related financing activities (8,204,557) (7,278,152)
Cash flows from investing activities:Investment redemptions and sales 9,067,892 15,859,642 Investment purchases (4,592,004) (17,690,859) Interest income received 955,563 587,869 Payments to joint venture (303,101) (127,390)
Net cash provided (used) by investing activities 5,128,350 (1,370,738)
Total increase in cash and cash equivalents 9,050,868 3,671,560
Cash and cash equivalents at beginning of year, as originally reported 28,097,515 24,601,831
Prior period adjustment - (175,876)Cash and cash equivalents at beginning of year, as restated 28,097,515 24,425,955
Cash and cash equivalents at end of year $ 37,148,383 $ 28,097,515
(with prior year data for comparison purposes only)
SOUTH COAST WATER DISTRICT
Statement of Cash Flows
For the Year Ended June 30, 2019
See accompanying notes to the basic financial statements18

2019 2018Reconciliation of loss from operations to net cashprovided by operating activities:
Income (loss) from operations $ (5,137,006) $ (3,194,798)Adjustments to reconcile income (loss) from operations to net cash provided by operating activities:
Operating activities:Depreciation 6,259,702 6,384,604 Rental income received 832,059 782,842 Standby charges and other revenues - 1,605 Other revenues (expenses) 1,640,205 694,840
Changes in assets, deferred outflows of resources, liabilities, and deferred inflows of resources:
Decrease (increase) in utility accounts receivable 79,766 30,314 Decrease (increase) in other receivables (446,033) 950,315 Decrease (increase) in prepaid expenses 144,366 (156,139)Decrease (increase) in inventory 493,458 (46,532)Decrease (increase) in other assets - 144,816 Decrease (increase) in deferred outflows of resources 1,081,361 2,936,290 Increase (decrease) in accounts payable 3,058,969 770,517 Increase (decrease) in accrued salaries and benefits 22,275 38,192 Increase (decrease) in deposits payable 735 (1,946)Increase (decrease) in compensated absences 93,104 (185,038)Increase (decrease) in net pension liability (547,647) (3,566,532)Increase (decrease) in net OPEB liability (312,758) 210,533 Increase (decrease) in deferred inflows of resources (749,209) 183,768
Net cash provided by operating activities $ 6,513,347 $ 5,977,651
Reconciliation of cash and cash equivalents to statement of net position:
Cash and investments $ 34,978,676 $ 50,674,217 Cash and investments restricted by debt agreements 20,748,829 457 Less investments with maturities greater than 3 months (18,579,122) (22,577,159)
Cash and cash equivalents $ 37,148,383 $ 28,097,515
Supplemental disclosure of noncash capital and related financing and investing activities:
Share of joint venture revenues (expenses) $ (571,241) $ (393,387)
Contributed assets from developers $ 270,639 $ 160,916
Gain (loss) on disposal of capital assets $ (2,447,818) $ -
For the Year Ended June 30, 2019
(Continued)(with prior year data for comparison purposes only)
SOUTH COAST WATER DISTRICT
Statement of Cash Flows
See accompanying notes to the basic financial statements19

ASSETS 2019 2018
Current assets:Cash and investments 3,604,936$ 3,349,559$ Accounts receivable:
Water 77,268 37,721 Other 396,277 100,058
Prepaid expenses and deposits 22,844 8,717 Total current assets 4,101,325 3,496,055
Noncurrent assets:Capital assets:
Not being depreciated 3,274,420 2,567,117 Being depreciated (net of accumulated depreciation) 24,969,255 25,801,655
Net capital assets 28,243,675 28,368,772 Total noncurrent assets 28,243,675 28,368,772
Total assets 32,345,000 31,864,827
LIABILITIES
Current liabilities:Accounts payable 1,266,473 787,899Accrued salaries and benefits 65,718 53,110
Total current liabilities 1,332,191 841,009
Noncurrent liabilities:Capital deposits 3,490,711 1,795,477
Total noncurrent liabilities 3,490,711 1,795,477
Total liabilities 4,822,902 2,636,486
NET POSITIONHeld in trust 27,522,098$ 29,228,341$
(JRWSS) Trust
(with prior year data for comparison purposes only)
SOUTH COAST WATER DISTRICT
Statement of Fiduciary Net Position - Private Purpose Trust Fund
June 30, 2019
Joint Regional Water Supply System
See accompanying notes to the basic financial statements20

Additions 2019 2018
Contributions:Water sales and charges 170,111$ 143,222$ Maintenance and operation advances 1,801,224 1,770,032 Investment income 32,858 32,460 Participant contributions for projects 353,863 450,028 Property taxes 1,574,639 1,509,001 Miscellaneous 720 840
Total additions 3,933,415 3,905,583
Deductions
Water purchases 170,116 143,365Direct operating expenses 2,294,886 2,027,879General and administrative expenses 333,559 463,999Depreciation 1,186,262 1,201,960Interest expense - 12,917Refunds to participants 1,654,835 1,629,809
Total deductions 5,639,658 5,479,929
Change in net position (1,706,243) (1,574,346)
Net position at beginning of year 29,228,341 30,802,687
Net position at end of year 27,522,098$ 29,228,341$
SOUTH COAST WATER DISTRICT
Statement of Changes in Fiduciary Net Position - Private Purpose Trust Fund
For the Year Ended June 30, 2019
(JRWSS) Trust
(with prior year data for comparison purposes only)
Joint Regional Water Supply System
See accompanying notes to the basic financial statements21

22
(This page intentionally left blank)

SOUTH COAST WATER DISTRICT Notes to Basic Financial Statements June 30, 2019
23
NOTE 1 - REPORTING ENTITY AND SUMMARY OF SIGNIFICANT ACCOUNTING POLICIES A. Organization and Description of Reporting Entity
South Coast Water District (the District) was formed in 1932 under the California Water Code. The District serves an area of approximately 8.8 square miles, encompassing the City of Dana Point, and portions of the Cities of Laguna Beach, San Clemente, and San Juan Capistrano.
Effective July 1, 1976, the District was designated as successor to the South Laguna Sanitary District for the purpose of succeeding to all rights, duties and obligations of the South Laguna Sanitary District under Orange County Reorganization No. 31. These functions are performed by the District under the title of the South Coast Water District Improvement District No. 1-S. The Improvement District serves an area of approximately 2,750 acres located within the water operation boundaries.
In February 1997, the District entered into an agreement for the District-served Laguna Sur/Monarch Point Community to be annexed by the Moulton Niguel Water District (the Reorganization RO 96-05). This reorganization was effective July 1, 1997. In June 1998, the District was the primary filing applicant in a request for consolidation filed with the Local Agency Formation Commission of Orange County (LAFCO). In October 1998, LAFCO adopted resolution RO 97-18, effective January 1, 1999, which provided for the consolidation of the District and Capistrano Beach Water District, and the dissolution of the Dana Point Sanitary District. The District was the successor agency to this consolidation. Following the consolidation, the District established four separate financial zones, each separately accounting for assets, reserves, bond obligations and operations. Rates, charges and assessments for water and sewer services varied between financial zones. Based on a Financial Equalization Study, completed in 2002, the District implemented an Asset Equalization Charge and no longer maintained separate accounting by service area. On July 1, 1999, a portion of the service area of the District that is within the City of Laguna Beach was annexed by the City for delivery of services. The agreement between the District and the City of Laguna Beach provides for the District to continue to provide both water and sewer service to this area for several years. The agreement provides for annual extensions of services unless terminated by either party.
Effective March 31, 2000, in accordance with LAFCO resolution (RO 99-07), the District was designated the contract operator for future operations and maintenance of the system and facilities of the former Tri-Cities Municipal Water District (TCMWD), which was legally consolidated with the Coastal Municipal Water District, the successor agency. Certain assets of TCMWD, other than operating and other cash reserves, were transferred over to the participating agencies, equal to their respective ownership percentages. The remaining net assets were assigned to the District to be held in trust and used for the benefit of the agreement participants. The succeeding agency became the Joint Regional Water Supply System (JRWSS). See Note 6. The District’s water supply is purchased from the Metropolitan Water District through the Municipal Water District of Orange County.

SOUTH COAST WATER DISTRICT Notes to Basic Financial Statements June 30, 2019
24
NOTE 1 - REPORTING ENTITY AND SUMMARY OF SIGNIFICANT ACCOUNTING POLICIES (CONTINUED) A. Organization and Description of Reporting Entity (Continued)
The financial statements present the District and its component units. The District is the primary government unit. Component units are those entities which are financially accountable to the primary government, either because the District appoints a voting majority on the component unit’s board, or because the component unit will provide a financial benefit or impose a financial burden on the District. The District’s reporting entity includes the South Coast Water District Financing Authority (the Financing Authority), a California nonprofit public benefit corporation, formed for the purpose of providing financial assistance to the District. Although the District and the Financing Authority are legally separate entities, the District’s Board of Directors is financially responsible for the Financing Authority and, therefore, the accompanying financial statements include the accounts and records of the Financing Authority using the blending method as required by accounting principles generally accepted in the United States of America. There are no separate financial statements for the Financing Authority. The South Coast Water District owns and operates the Dana Hills Tennis Center (Tennis Center). The Tennis Center operates tennis courts and related facilities, charging fees to the public.
B. Basis of Accounting, Measurement Focus, and Financial Statement Presentation
Proprietary Fund
The District’s activities are reported in an enterprise fund, which is used to account for operations that are financed and operated in a manner similar to business enterprises, where the intent of providing goods and services to the general public on a continuing basis is financed or recovered primarily through user charges.
The basic financial statements are prepared using the economic resource measurement focus and the accrual basis of accounting. Under the economic resources measurement focus all assets, deferred outflows of resources, liabilities and deferred inflows of resources (whether current or noncurrent) associated with the District’s activities are included on the Statement of Net Position. The Statement of Revenues, Expenses, and Changes in Net Position presents increases (revenues) and decreases (expenses) in total net position. Under the accrual basis of accounting, revenues are recognized when earned while expenses are recognized when the liability is incurred regardless of the timing of cash flow. The District distinguishes operating revenues and expenses from non-operating items. Operating revenues and expenses generally result from providing services, delivering water, and collecting, treating and disposing of wastewater in connection with the District’s principal ongoing operations. The District’s principal operating revenues are charges to customers for sales and services. Operating expenses include the cost of sales and services, administrative expenses, and depreciation on capital assets. All revenues and expenses not meeting this definition are reported as non-operating revenues and expenses. Capital contributions are reported as a separate line item in the Statement of Revenues, Expenses, and Changes in Net Position.

SOUTH COAST WATER DISTRICT Notes to Basic Financial Statements June 30, 2019
25
NOTE 1 - REPORTING ENTITY AND SUMMARY OF SIGNIFICANT ACCOUNTING POLICIES (CONTINUED)
B. Basis of Accounting, Measurement Focus, and Financial Statement Presentation (Continued)
Fiduciary Fund
The fiduciary fund financial statements include the Statement of Fiduciary Net Position - Private Purpose Trust Fund and the Statement of Changes in Fiduciary Net Position - Private Purpose Trust Fund and is accounted for using the economic resources measurement focus and accrual basis of accounting. The statements reflect the activities of the JRWSS that are held in trust.
C. Joint Powers Agreements The District is a participant in both the South Orange County Wastewater Authority (SOCWA) and the San Juan Basin Authority (SJBA) for the purposes of (1) operating and maintaining wastewater delivery, treatment and disposal facilities and (2) management of regional groundwater and recycled water facilities.
South Orange County Wastewater Authority (a California Joint Powers Authority)
The District is a member of SOCWA, which collects, treats, beneficially reuses and disposes of wastewater in South Orange County. SOCWA operates four wastewater treatment plants (WWTP) in the region. SOCWA has ten member agencies, including three cities, six water districts, and one community services district, which appoints representatives to the Board of Directors. The Board of Directors controls the operations of SOCWA, including selection of management and approval of the annual budget. SOCWA has project committees through which member agencies participate in financially supporting operations and capital investment at various levels, depending on their capacity rights. Each WWTP is a project, as well as various other physical facilities such as outfall pipelines. The District deposits money with SOCWA to cover its share of operations and for capital in the project committees in which it participates. The District has no equity interest in SOCWA and does not receive a share of operating results. Construction deposits made to SOCWA for capital projects are recorded as capital assets.
To obtain complete financial information from SOCWA please contact SOCWA’s Finance Controller at 34156 Del Obispo Street, Dana Point, CA 92629.
San Juan Basin Authority (a California Joint Powers Authority)
The District is also a member of the SJBA, which is a joint powers authority formed to secure and develop water rights for its member agencies. It currently has permits for usage of the San Juan Groundwater Basin as an underground storage reservoir. Its Board of Directors consists of representatives from member agencies that govern SJBA. The Board of Directors oversees contracts and approves the annual budget. SJBA has project committees that member agencies participate in financially at various levels based upon ownership or usage. The District deposits money with SJBA to cover its share of costs in the respective projects.
The District has no equity interest in SJBA and does not receive a share of operating results. Construction deposits made to SJBA for capital projects are recorded as capital assets.
To obtain complete financial information from SJBA contact South Coast Water District’s Chief Financial Officer.

SOUTH COAST WATER DISTRICT Notes to Basic Financial Statements June 30, 2019
26
NOTE 1 - REPORTING ENTITY AND SUMMARY OF SIGNIFICANT ACCOUNTING POLICIES (CONTINUED) D. New Accounting Pronouncements
Current Year Standards GASB 83 - Certain Asset Retirement Obligations, effective for periods beginning after June 15, 2018, and did not impact the District. GASB 88 - Certain Disclosures Related to Debt, Including Direct Borrowings and Direct Placements, effective for periods beginning after June 15, 2018, and did not significantly impact the District. Pending Accounting Standards GASB has issued the following statements, which may impact the District’s financial reporting requirements in the future: GASB 84 - Fiduciary Activities, effective for periods beginning after December 15, 2018.
GASB 87 - Leases, effective for periods beginning after December 15, 2019.
GASB 90 - Majority Equity Interests – an amendment of GASB Statements No. 14 and No. 61, effective
for periods beginning after December 15, 2018.
GASB 91 - Conduit Debt Obligations, effective for periods beginning after December 15, 2020. E. Cash and Cash Equivalents
The District’s cash and cash equivalents are considered to be cash on hand, demand deposits, and short-term investments with original maturities of three months or less from the date of acquisition.
F. Cash and Investments
Investments are carried at fair value. In the financial statements, changes in fair value that occur during a fiscal year are recognized as investment income reported for the fiscal year. Investment income includes interest earnings, changes in fair value, and any gains or losses realized upon the liquidation or sale of investments.

SOUTH COAST WATER DISTRICT Notes to Basic Financial Statements June 30, 2019
27
NOTE 1 - REPORTING ENTITY AND SUMMARY OF SIGNIFICANT ACCOUNTING POLICIES (CONTINUED) G. Materials and Supplies Inventory
Inventories of materials and supplies are valued at the lower of cost or market using the first-in, first-out method.
H. Prepaid Expenses
Certain payments to vendors reflect costs applicable to future accounting periods and are recorded as prepaid expenses.
I. Allowance for Doubtful Accounts
An allowance for doubtful accounts has not been established for utility accounts receivable, as District management believes all amounts are collectible. Accounts having balances outstanding over 60 days are not significant for the fiscal year ended June 30, 2019.
J. Revenue Recognition
Revenues are recognized when earned and recorded as meters are read. Metered water accounts are read and billed bi-monthly on 30-day cycles. Residential wastewater customers fixed charges are included on their property tax bills. Commercial wastewater customers fixed charges are billed on a monthly basis. In certain areas of the District, the wastewater billing is handled by another water utility agency but is estimated and accrued as revenues by the District each month. These third-party collections are forwarded to the District monthly, based on actual receipts. Unbilled water and wastewater charges are accrued for the period from the last meter reading through year-end and are included in accounts receivable. Unbilled accounts receivable amounted to $750,159 at June 30, 2019.
K. Compensated Absences
The District has a policy whereby employees can accumulate sick leave and vacation. The sick leave is to be used for extended periods of sickness. Upon an employee’s termination or retirement, a portion of the earned and accrued benefits will be paid out in cash. Upon completion of employment, employees with three years or more service will be paid for 50% of the then unused sick leave at regular payroll rates in effect at the date of the termination. The District has accounted for these future benefits by accruing the following unused sick leave and vacation costs, which are included in compensated absences in the accompanying statement of net position:
Unused sick leave 682,819$ Unused vacation 612,208
1,295,027$

SOUTH COAST WATER DISTRICT Notes to Basic Financial Statements June 30, 2019
28
NOTE 1 - REPORTING ENTITY AND SUMMARY OF SIGNIFICANT ACCOUNTING POLICIES (CONTINUED) L. Capital Assets
Capital assets are stated at cost with an initial cost of $5,000 or more. Contributed capital assets are recorded at acquisition value as of date received and consist primarily of potable water, recycled water, and sewer systems contributed by real estate developers. Costs of normal maintenance and repairs that do not add to the value of the asset or materially extend asset lives are not capitalized. Depreciation and amortization are computed using the straight-line method over the estimated useful lives of capital assets as follows:
Tract facilities, reservoirs, transmission connections, recreation facilities, collection lines, and administrative building 50 years Conservation facilities, reclamation terminals, intangible plant, source of supply, pumping plants, and sewer connections 40 years Groundwater recovery facility 30 years Collection system 33 years Meters 12 years Power operated equipment, office furniture, and automotive 10 years Tools and computer hardware 5 years Computer software 3-5 years
M. Deferred Outflows/Inflows of Resources
In addition to assets, the Statement of Net Position will sometimes report a separate section for deferred outflows of resources. This separate financial statement element, deferred outflows of resources, represents a consumption of net position that applies to future periods and so will not be recognized as an outflow of resources (expense) until that time. The District has the following items that qualify for reporting in this category:
Deferred outflows related to the deferred charge on refunding of long-term debt. Deferred charges on refunding result from the difference between the carrying value of the refunded debt and its reacquisition price. These amounts are deferred and amortized over the shorter of the life of the refunded debt or the new issuance.
Deferred outflows related to the pension and OPEB plan equal to employer contributions made after the measurement date of the net pension liability and net OPEB liability, respectively.
Deferred outflows related to the pension plan for differences between expected and actual experience. These amounts are amortized over a closed period equal to the average of the expected remaining services lives of all employees that are provided with pensions through the plan.
Deferred outflows related to the pension plan resulting from changes in assumptions. These amounts are amortized over a closed period equal to the average expected remaining service lives of all employees that are provided with pensions through the plan.
Deferred outflows related to the pension plan resulting from the difference in projected and actual earnings on plan investments. These amounts are amortized over five years.
Deferred outflows related to the pension plan for the changes in proportion and differences between employer contributions and the proportionate share of contributions. These amounts are amortized over a closed period equal to the average expected remaining services lives of all employees that are provided with pensions through the plans.

SOUTH COAST WATER DISTRICT Notes to Basic Financial Statements June 30, 2019
29
NOTE 1 - REPORTING ENTITY AND SUMMARY OF SIGNIFICANT ACCOUNTING POLICIES (CONTINUED) M. Deferred Outflows/Inflows of Resources (Continued)
In addition to liabilities, the Statement of Net Position will sometimes report a separate section for deferred inflows of resources. This separate financial statement element, deferred inflows of resources, represents an acquisition of net position that applies to future periods and will not be recognized as an inflow of resources (revenue) until that time. The District has the following items that qualify for reporting in this category:
Deferred inflows related to the pension plan for differences between expected and actual
experience. These amounts are amortized over a closed period equal to the average expected remaining services lives of all employees that are provided with pensions through the plan.
Deferred inflows related to the pension plan resulting from changes in assumptions. These amounts are amortized over a closed period equal to the average expected remaining services lives of all employees that are provided with pensions through the plan.
Deferred inflows related to the pension plan for the changes in proportion and differences between employer contributions and the proportionate share of contributions. These amounts are amortized over a closed period equal to the average expected remaining services lives of all employees that are provided with pensions through the plans.
Deferred inflows related to the OPEB plan resulting from the difference in projected and actual earnings on plan investments. These amounts are amortized over five years.
N. Net Position Flow Assumption
Sometimes the District will fund outlays for a particular purpose from both restricted (e.g., restricted bond or grant proceeds) and unrestricted resources. In order to calculate the amounts to report as restricted - net position and unrestricted - net position, a flow assumption must be made about the order in which the resources are considered to be applied. It is the District’s policy to consider restricted - net position to have been depleted before unrestricted - net position is applied.
O. Property Taxes
Property tax in California is levied in accordance with Article XIIA of the State Constitution at 1% of countywide assessed valuations. Property taxes collected by the levying agency are placed in a pool, and then allocated to the local governmental units. Property tax revenue is recognized in the fiscal year in which taxes are levied.
The property tax calendar is as follows:
Lien date: January 1 Levy date: July 1 Due date: First installment - November 10 Second installment - February 10 Delinquent date: First installment - December 10 Second installment - April 11

SOUTH COAST WATER DISTRICT Notes to Basic Financial Statements June 30, 2019
30
NOTE 1 - REPORTING ENTITY AND SUMMARY OF SIGNIFICANT ACCOUNTING POLICIES (CONTINUED) P. Pensions
For purposes of measuring the net pension liability and deferred outflows/inflows of resources related to pensions and pension expense, information about the fiduciary net position of the District’s California Public Employees’ Retirement System (CalPERS) plans (Plans) and additions to/deductions from the Plans’ fiduciary net position have been determined on the same basis as they are reported by CalPERS. For this purpose, benefit payments (including refunds of employee contributions) are recognized when due and payable in accordance with the benefit terms. Investments are reported at fair value.
Q. Postemployment Benefits Other Than Pensions (OPEB) For purposes of measuring the net OPEB liability and deferred outflows/inflows of resources related to the District’s OPEB and OPEB expense, information about the fiduciary net position of its OPEB plan and additions to/deductions from the OPEB plan’s fiduciary net position has been determined on the same basis as they are reported by the plan. For this purpose, the District’s OPEB plan recognizes benefit payments when due and payable in accordance with the benefit terms. Investments are reported at fair value.
R. Use of Estimates
The financial statements are prepared in accordance with generally accepted accounting principles in the United States and, accordingly, include amounts that are based on management’s best estimates and judgments. Actual results could differ from those estimates.
S. Prior Year Data
Certain amounts presented in the prior year financial statements have been reclassified in order to be consistent with current year’s presentation. Selected information regarding the prior year has been included in the accompanying financial statements. This information has been included for comparison purposes only and does not represent a complete presentation in accordance with generally accepted accounting principles. Accordingly, such information should be read in conjunction with the government’s prior year financial statements, from which this selected financial data was derived.

SOUTH COAST WATER DISTRICT Notes to Basic Financial Statements June 30, 2019
31
NOTE 2 - CASH AND INVESTMENTS
Cash and investments as of June 30, 2019 are classified in the accompanying financial statements as follows:
Statement of Net Position:Cash and investments 34,978,676$ Restricted cash and investments 20,748,829
Statement of Fiduciary Net Position:Cash and investments 3,604,936
Total cash and investments 59,332,441$
Cash and investments as of June 30, 2019 consist of the following:
Cash on hand 1,600$ Deposits with financial institutions - District 879,019 Deposits with financial institutions - JRWSS 2,006,999 Investments 35,695,994 Investments held by bond fiscal agents 20,748,829
Total cash and investments 59,332,441$
Investments Authorized by the California Government Code and the District’s Investment Policy
The table on the following page identifies investment types available to the District as authorized by the California Government Code (or the District’s investment policy, where more restrictive). The table also identifies certain provisions of the California Government Code (or the District’s investment policy, where more restrictive) that address interest rate risk, credit risk, and concentration of credit risk. The District’s investment policy also contains certain allocation goals or targets that are viewed to be general guidelines to promote diversification, rather than restrictions. The District determines conformity to any percentage limitations or guidelines contained in its investment policy, or the California Government Code, by comparing the specified investment balance as of a given date to the total par value of the District’s cash and investment portfolio as of the beginning of the fiscal year containing that date. This table does not address investments of debt proceeds held by bond trustees that are governed by the provisions of debt agreements of the District rather than the general provisions of the California Government Code or the District’s investment policy.

SOUTH COAST WATER DISTRICT Notes to Basic Financial Statements June 30, 2019
32
NOTE 2 - CASH AND INVESTMENTS (CONTINUED) Investments Authorized by the California Government Code and the District’s Investment Policy (Continued)
Investment Types Authorized by State Law or the District's Investment Policy
Maximum Maturity*
Maximum Percentage of
Portfolio*
Maximum Investment in One Issuer*
Municipal Bonds 5 years 30% 5%U.S. Treasury Obligations 5 years None NoneFederal Agency Securities 5 years None 25%Banker's Acceptances 180 days 40% 5%Commercial Paper 270 days 25% 5%Negotiable Certificates of Deposit 5 years 30%*** 5%**Certificates of Deposit Placement Service 5 years 30%*** N/ARepurchase Agreements 1 year None NoneLocal Agency Investment Fund (LAIF) N/A None $65,000,000Medium-Term Corporate Notes 5 years 30% 5%Mortgage Pass-Through Securities 5 years 20% 5%Money Market Mutual Funds N/A 20% NoneSupranational Securities 5 years 30% 10%Local Government Investment Pools (CAMP) N/A None None
* Based on state law requirements or investment policy requirement, whichever is more restrictive.** Allowed up to FDIC limit.
N/A - Not Applicable
***The 30% maximum percentage of portfolio is applicable to negotiable certificates of deposit and certificates of deposit placement service in aggregate.
Disclosures Relating to Interest Rate Risk
Interest rate risk is the risk that changes in market interest rates will adversely affect the fair value of an investment. Generally, the longer the maturity of an investment, the greater the sensitivity of its fair value to changes in market interest rates. One of the ways that the District manages its exposure to interest rate risk is by purchasing a combination of shorter and longer term investments and by timing cash flows from maturities so that a portion of the portfolio is maturing or coming close to maturity evenly over time as necessary to provide the cash flow and liquidity needed for operations. Information about the sensitivity of the fair values of the District’s investments (including investments held by bond trustee) to market interest rate fluctuations is provided by the following table, which shows the distribution of the District’s investments by maturity as of June 30, 2019.

SOUTH COAST WATER DISTRICT Notes to Basic Financial Statements June 30, 2019
33
NOTE 2 - CASH AND INVESTMENTS (CONTINUED) Disclosures Relating to Interest Rate Risk (Continued)
6 Months 7 to 12 13 to 24 25 to 60 or Less Months Months Months Total
Money Market Mutual Funds 874,374$ -$ -$ -$ 874,374$ U.S. Treasury Obligations 997,575 497,385 2,486,485 1,895,420 5,876,865 Medium-Term Corporate Notes 299,355 898,062 2,325,404 1,687,334 5,210,155 Federal Agency Securities 2,710,002 1,493,770 1,360,024 2,029,885 7,593,681 Commercial Paper 249,705 - - - 249,705 Supranational Securities 499,460 498,975 850,007 276,463 2,124,905 CAMP 3,101,288 - - - 3,101,288 LAIF 9,067,084 - - - 9,067,084 Held by JRWSS Trust:
Money Market Mutual Funds 1,597,937 - - - 1,597,937 Held by Bond Trustee:
Money Market Mutual Funds 20,748,829 - - - 20,748,829 Total 40,145,609$ 3,388,192$ 7,021,920$ 5,889,102$ 56,444,823$
Remaining Maturity (in Months)
Investment Type
Disclosures Relating to Credit Risk
Generally, credit risk is the risk that an issuer of an investment will not fulfill its obligation to the holder of the investment. This is measured by the assignment of a rating by a nationally recognized statistical rating organization. Presented below is the minimum rating required by, where applicable, the California Government Code, the District’s investment policy, or debt agreements and Standard and Poor’s actual rating as of year-end for each investment type:
MinimumLegal Not Rated/
Total Rating AAA AA +/- A +/- A-1 +/- ExemptMoney Market Mutual Funds 874,374$ AAA 874,374$ -$ -$ -$ -$ U.S. Treasury Obligations 5,876,865 N/A - - - - 5,876,865 Medium-Term Corporate Notes 5,210,155 A - 1,202,256 4,007,899 - - Federal Agency Securities 7,593,681 N/A - 7,593,681 - - - Commercial Paper 249,705 A-1 - - - 249,705 - Supranational Securities 2,124,905 N/A 2,124,905 - - - - CAMP 3,101,288 N/A 3,101,288 - - - - LAIF 9,067,084 N/A - - - - 9,067,084 Held by JRWSS Trust:
Money Market Mutual Funds 1,597,937 AAA 1,597,937 - - - - Held by Bond Trustee:
Money Market Mutual Funds 20,748,829 AAA 20,748,829 - - - - Total 56,444,823$ 28,447,333$ 8,795,937$ 4,007,899$ 249,705$ 14,943,949$
Investment Type

SOUTH COAST WATER DISTRICT Notes to Basic Financial Statements June 30, 2019
34
NOTE 2 - CASH AND INVESTMENTS (CONTINUED) Concentration of Credit Risk The investment policy of the District contains no limitations on the amount that can be invested in any one issuer beyond that stipulated by the California Government Code. There are no investments in any one issuer (other than U.S. Treasury securities, mutual funds, and external investment pools) that represent 5% or more of total District investments. Custodial Credit Risk
Custodial credit risk for deposits is the risk that, in the event of the failure of a depository financial institution, a government will not be able to recover its deposits or will not be able to recover collateral securities that are in the possession of an outside party. The custodial credit risk for investments is the risk that, in the event of the failure of the counterparty (e.g. broker-dealer) to a transaction, a government will not be able to recover the value of its investment or collateral securities that are in the possession of another party. With respect to investments, custodial credit risk generally applies only to direct investments in marketable securities. Custodial credit risk does not apply to a local government’s indirect investment in securities through the use of mutual funds or government investment pools (such as LAIF and CAMP). The California Government Code and the District’s investment policy do not contain legal or policy requirements that would limit the exposure to custodial credit risk for deposits or investments, other than the following provision for deposits. The California Government Code requires that a financial institution secure deposits made by state or local governmental units by pledging securities in an undivided collateral pool held by a depository regulated under State law (unless so waived by the governmental unit). The market value of the pledged securities in the collateral pool must equal at least 110% of the total amount deposited by the public agencies. California law also allows financial institutions to secure deposits by pledging first trust deed mortgage notes having a value of 150% of the secured public deposits. At June 30, 2019, all of the District’s deposits were insured or collateralized as required by California Law. For investments identified herein as held by bond trustee, the bond trustee selects the investment under the terms of the applicable trust agreement, acquires the investment, and holds the investment on behalf of the District.
Investment in State Investment Pool
The District is a voluntary participant in the Local Agency Investment Fund (LAIF) that is regulated by the California Government Code under the oversight of the Treasurer of the State of California. The fair value of the District’s investment in this pool is reported in the accompanying financial statements at amounts based upon the District’s pro-rata share of the fair value provided by LAIF for the entire LAIF portfolio (in relation to the amortized cost of that portfolio). The balance available for withdrawal is based on the accounting records maintained by LAIF, which are recorded on an amortized cost basis.
Investment in California Asset Management Program (CAMP)
The District invests in CAMP, an investment trust, which is similar to a money market mutual fund. The fund invests, primarily, in certificates of deposit, commercial paper, and U.S. Government and Agency obligations. The District is a voluntary participant in the investment pool.

SOUTH COAST WATER DISTRICT Notes to Basic Financial Statements June 30, 2019
35
NOTE 2 - CASH AND INVESTMENTS (CONTINUED)
Investment in California Asset Management Program (CAMP) (Continued) The CAMP Cash Reserve Portfolio (the Pool) is exempt from registration with the Securities and Exchange Commission (SEC) under the Investment Company Act of 1940, but operates in a manner consistent with SEC Rule 2a-7, “Money Market Funds”, of that Act. Accordingly, the Pool meets the definition of a “2a7-like pool” set forth in GASB Statement No. 31, “Accounting and Financial Reporting for Certain Investments and External Investment Pools”. While the Pool itself is exempt from SEC registration, the Pool’s investment advisor and administrator, PFM Asset Management, LLC, is registered with the SEC as an investment advisor under the Investment Advisors Act of 1940. PFM Asset Management, LLC has also filed a notice with the California Department of Corporations, as well as various other states, as an investment advisor under state securities laws. In addition, the Pool also meets the definition of “Municipal Fund Security” outlined by Municipal Securities Rulemaking Board (MSRB) Rule 0-12. Contracts with prospective investors relating to shares of the Pool are entered into through PFM Asset Management’s wholly-owned subsidiary, PFMAM, Inc., a broker-dealer which is registered with the SEC and MSRB, and is a member of the National Association of Securities Dealers. The Pool also files an income tax return annually with the Internal Revenue Service, though the net income of the Pool is generally exempt from federal income tax. Fair Value Measurement The District categorizes its fair value measurement of investments utilizing the fair value hierarchy established by generally accepted accounting principles. The hierarchy is based on the valuation inputs used to measure the fair value of each asset. Level 1 inputs are quoted prices in active markets for identical assets; Level 2 inputs are inputs other than quoted prices included in Level 1 that are observable for the assets and liabilities through corroboration with market data; and Level 3 inputs are significant unobservable inputs.
The District has the following recurring fair value measurements as of June 30, 2019:
Quoted Observable UnobservableFair Prices Inputs Inputs
Value Level 1 Level 2 Level 3Investment Type (Subject to Hierarchy):
U.S. Treasury Obligations 5,876,865$ -$ 5,876,865$ -$ Medium-Term Corporate Notes 5,210,155 - 5,210,155 - Federal Agency Securities 7,593,681 - 7,593,681 - Commercial Paper 249,705 - 249,705 - Supranational 2,124,905 - 2,124,905 -
Total Subject to Hierarcy 21,055,311 -$ 21,055,311$ -$
Uncategorized (Not Subject to Hierarchy):Money Market Mutual Funds 874,374 LAIF 9,067,084 CAMP 3,101,288 Held by JRWSS Trust:
Money Market Mutual Funds 1,597,937 Held by Bond Trustee:
Money Market Mutual Funds 20,748,829 Total Investment Portfolio 56,444,823$

SOUTH COAST WATER DISTRICT Notes to Basic Financial Statements June 30, 2019
36
NOTE 3 - CAPITAL ASSETS Changes in capital assets for the year ended June 30, 2019 were as follows:
Balance at Deletions/ Balance atJune 30, 2018 Additions Transfers June 30, 2019
Capital assets, not depreciated:Land 2,053,609$ -$ -$ 2,053,609$ Construction in progress 38,488,583 29,482,512 (7,384,670) 60,586,425
Total capital assets,not depreciated 40,542,192 29,482,512 (7,384,670) 62,640,034
Capital assets, being depreciated:Intangible plant 36,027,481 74,899 - 36,102,380 Source of supply 21,700,775 - - 21,700,775 Pumping plant 17,734,369 180,039 - 17,914,408 Treatment plants 41,254,973 5,278,367 - 46,533,340 Transmission and distribution 75,945,233 1,695,721 - 77,640,954 Sewer collection system 41,561,668 - - 41,561,668 General plant 19,623,664 855,556 (92,835) 20,386,385 Recreation facilities 1,274,862 - - 1,274,862
Total capital assets,being depreciated 255,123,025 8,084,582 (92,835) 263,114,772
Less accumulated depreciation for:Intangible plant (29,200,729) (784,517) - (29,985,246) Source of supply (14,700,056) (510,604) - (15,210,660) Pumping plant (6,653,693) (456,619) - (7,110,312) Treatment plants (12,800,320) (954,211) - (13,754,531) Transmission and distribution (31,912,749) (1,850,353) - (33,763,102) Sewer collection system (18,891,134) (886,815) - (19,777,949) General plant (15,452,369) (793,445) 92,835 (16,152,979) Recreation facilities (887,770) (23,138) - (910,908)
Total accumulated depreciation (130,498,820) (6,259,702) 92,835 (136,665,687)
Total capital assets,being depreciated, net 124,624,205 1,824,880 - 126,449,085
Capital Assets, net 165,166,397$ 31,307,392$ (7,384,670)$ 189,089,119$

SOUTH COAST WATER DISTRICT Notes to Basic Financial Statements June 30, 2019
37
NOTE 4 - LONG-TERM DEBT
The following is a summary of long-term debt at June 30, 2019:
DueBalance Balance Within
June 30, 2018 Additions Deletions June 30, 2019 One YearDirect Borrowings:
2000 State revolving loan 846,156$ -$ (423,078)$ 423,078$ 423,078$ Less: Unamortized discount (125,669) - 71,612 (54,057) -
State revolving loan - tunnel project 10,939,106 1,584,403 - 12,523,509 - Other Debt:
Bonds payable 30,935,000 41,680,000 (20,200,000) 52,415,000 880,000 Less: Unamortized discount (473,946) - 473,946 - - Plus: Unamortized premium 1,955,016 3,701,350 (160,516) 5,495,850 -
Compensated absences 1,201,923 259,481 (166,377) 1,295,027 694,612
Totals 45,277,586$ 47,225,234$ (20,404,413)$ 72,098,407$ 1,997,690$
2000 State Revolving Loan
On December 2, 1998, the District entered into a loan agreement with the State of California, acting by and through the State Water Resources Control Board for the District purchase of and improvements to the Victoria Wastewater Treatment Plant. On December 21, 2000, the District received the first phase of funding in the amount of $3,650,192. On November 18, 2004, the District received its final payment of $2,720,860. The loan bears no interest with an annual principal payment of $423,078 maturing on June 30, 2020. The annual requirements to service the outstanding balance at June 30, 2019 are as follows:
YearEnding Unamortized Net
June 30, Principal Loan Discount Amount2020 423,078$ (54,057)$ 369,021$

SOUTH COAST WATER DISTRICT Notes to Basic Financial Statements June 30, 2019
38
NOTE 4 - LONG-TERM DEBT (CONTINUED) State Revolving Loan - Tunnel Project In November 2016, the District entered into an agreement with the State Water Resources Control Board for the construction of the Tunnel Stabilization and Pipeline Replacement project. The District may borrow up to the lesser of $102,560,000 or the eligible costs of the project. At June 30, 2019, the State Water Resources Control Board had disbursed $12,264,741 under the loan contract and added $258,768 of accrued interest to the principal. The loan has an interest rate of 1.7% with a repayment period of 30 years after project completion. The outstanding balance totaled $12,523,509 as of June 30, 2019. The annual requirements to service the outstanding balance at June 30, 2019 are as follows:
YearEnding Total
June 30, Principal Interest Payment2020 -$ -$ -$ 2021 - - - 2022 - - - 2023 323,473 212,900 536,373 2024 328,972 207,401 536,373
2025-2029 1,730,674 951,189 2,681,863 2030-2034 1,882,869 798,995 2,681,864 2035-2039 2,048,447 633,416 2,681,863 2040-2044 2,228,587 453,276 2,681,863 2045-2049 2,424,568 257,296 2,681,864 2050-2053 1,555,919 53,198 1,609,117
12,523,509$ 3,567,671$ 16,091,180$
2016A Refunding Revenue Bonds
In October 2016, the District issued $13,325,000 of Refunding Revenue Bonds, Series 2016A (2016A Bonds). The 2016A Bonds were issued to provide funds (1) to advance refund all of the outstanding South Coast Water District Financing Authority Refunding Revenue Bonds, Series 2010A (2010A Bonds); and (2) to pay costs of issuance of the 2016A Bonds. The 2016A Bonds proceeds were invested in an escrow fund with a trustee to pay interest and principal on the 2010A Bonds until February 1, 2020 and to redeem all 2010A Bonds in full on February 1, 2020. As of June 30, 2019, the defeased 2010A Bonds have a remaining outstanding balance of $11,135,000. The reacquisition price exceeded the net carrying amount of the old debt by $668,860 and is amortized as interest expense over the remaining life of the 2016A Bonds. The remaining balance at June 30, 2019, is $649,071. The 2016A Bonds repayments include principal installments due in varying amounts from $880,000 to $1,295,000 annually from February 1, 2017 to February 1, 2029 with interest ranging from 2.0% to 5.0%.

SOUTH COAST WATER DISTRICT Notes to Basic Financial Statements June 30, 2019
39
NOTE 4 - LONG-TERM DEBT (CONTINUED) 2016A Refunding Revenue Bonds (Continued) Total 2016A Bonds outstanding as of June 30, 2019, net of unamortized premium is as follows:
Principal outstanding at June 30, 2019 10,735,000$ Plus: unamortized premium 1,835,626
Net bonds outstanding at June 30, 2019 12,570,626
The annual requirements to service the outstanding Bonds at June 30, 2019 are as follows:
YearEnding Total
June 30, Principal Interest Payment2020 880,000$ 461,900$ 1,341,900$ 2021 920,000 426,700 1,346,700 2022 955,000 389,900 1,344,900 2023 995,000 351,700 1,346,700 2024 1,030,000 311,900 1,341,900
2025-2029 5,955,000 769,350 6,724,350 10,735,000$ 2,711,450$ 13,446,450$
2010B Revenue Bonds (Build America Bonds) In June 2010, the South Coast Water District Financing Authority issued $19,350,000 of Revenue Bonds, Series 2010B (2010B Bonds). The 2010B Bonds were issued to provide funds (1) to acquire certain improvements for the 2010 Projects, and (2) to pay costs incurred in connection with the issuance of the 2010B Bonds. The 2010 Projects included: (1) the acquisition and construction of portions of the improvements to enlarge and stabilize the Beach Interceptor Sewer Tunnel, including the installation of a new pipeline, and the acquisition of entitlements in connection therewith; (2) the acquisition and construction of improvements to the District’s Water System and Recycled Water System, including the District’s share of improvements to Joint Regional Water Supply System facilities serving the District; (3) acquisition and construction of improvements for the expansion and upgrade of the Groundwater Recovery Facility; and (4) the acquisition and construction of improvements to the Wastewater System. In February 2019, the 2010B Bonds were refunded in advance using the bond proceeds from the 2019A Revenue Bonds.

SOUTH COAST WATER DISTRICT Notes to Basic Financial Statements June 30, 2019
40
NOTE 4 - LONG-TERM DEBT (CONTINUED) 2019A Revenue Bonds In February 2019, the District issued $41,680,000 of Revenue Bonds, Series 2019A (2019A Bonds). The 2019A Bonds were issued to provide funds (1) to finance the acquisition and construction of certain improvements to the District’s Water System and Wastewater System; (2) to refund all of the South Coast Water District Financing Authority Revenue Bonds, Series 2010B (2010B Bonds); (3) to pay costs of issuance of the 2019A Bonds. The District received $45,381,351 in proceeds from the 2019A Bonds, including a premium of $3,701,351, and deposited $20,036,131 in an escrow fund with a trustee to advance refund the 2010B Bonds, $25,000,000 in an acquisition fund for capital improvement and use $345,219 for cost of issuance. The trustee for the 2010B Bonds escrow fund will pay interest and principal on the 2010B Bonds until February 1, 2020 and to redeem all 2010B Bonds in full on February 1, 2020. As of June 30, 2019, the defeased 2010B Bonds have a remaining outstanding balance of $19,350,000. The reacquisition price exceeded the net carrying amount of the old debt by $1,146,131 and is amortized as interest expense over the remaining life of the 2010B Bonds. The remaining balance at June 30, 2019, is $1,127,530 The District refunded the 2010B Bonds to reduce its total debt service payments over 20 years by $1,513,196 and to obtain an economic gain (difference between the present values of the old and new debt) of $979,810. Total 2019A Bonds outstanding as of June 30, 2019, net of unamortized premium, is as follows:
Principal outstanding at June 30, 2019 41,680,000$ Plus: unamortized premium 3,660,224
Net bonds outstanding at June 30, 2019 45,340,224
The annual requirements to service the outstanding Bonds at June 30, 2019 are as follows:
YearEnding Total
June 30, Principal Interest Payment2020 -$ 1,706,302$ 1,706,302$ 2021 - 1,801,375 1,801,375 2022 - 1,801,375 1,801,375 2023 - 1,801,375 1,801,375 2024 - 1,801,375 1,801,375
2025-2029 - 9,006,875 9,006,875 2030-2034 7,390,000 8,304,125 15,694,125 2035-2039 9,160,000 6,536,625 15,696,625 2040-2044 11,175,000 4,514,575 15,689,575 2045-2049 13,955,000 1,735,000 15,690,000
41,680,000$ 39,009,002$ 80,689,002$

SOUTH COAST WATER DISTRICT Notes to Basic Financial Statements June 30, 2019
41
NOTE 5 - PLEDGED REVENUES
The District has pledged its revenues, net of specified operating expenses, to repay $13.3 million in water refunding revenue bonds issued in 2016 and $41.7 million in water revenue bonds issued in 2019. The bonds are payable from District net revenues and are payable through 2049. Coverage of net revenues for annual principal and interest payments in future years are expected to approximate that of the current year (see below). Total future principal and interest remaining to be paid on the bonds is $94,135,452 as of June 30, 2019.
Debt service paid and net revenues for the year ended June 30, 2019 are as follows:
Gross revenues 45,890,236$ Less: excluded revenues (754,686)
Includable revenues 45,135,550
All expenses 45,123,419 Less: excludable expenses (8,554,520)
Includable expenses 36,568,899
Net revenues 8,566,651$
Debt service 3,301,270
Coverage percentage 259%
Required coverage percentage 125% NOTE 6 - INVESTMENT IN JOINT VENTURE The District is a member in the Joint Regional Water Supply System (JRWSS), a joint venture providing potable water to its members. There are eight other members who participate in JRWSS. The agreement provided for the District to act as a trustee for the joint venture and administer the assets and liabilities. The District reports the JRWSS trust as a fiduciary fund. In a series of restructuring and consolidations, initiated in March 2000, JRWSS was formed to succeed two water districts, Tri-Cities Municipal Water District and the Costal Municipal Water District, with substantially all assets and liabilities of predecessor districts transferred to JRWSS. The District’s interest in joint venture assets is reflected on the statement of net position of the District as “investment in joint venture” in the amount of $7,951,147 at June 30, 2019, as required under the equity method of accounting for investments.

SOUTH COAST WATER DISTRICT Notes to Basic Financial Statements June 30, 2019
42
NOTE 7 - DEFINED BENEFIT PENSION PLAN A. General Information about the Pension Plan
Plan Description
All qualified permanent and probationary employees are eligible to participate in the District’s Miscellaneous Employee Pension Plan, a cost-sharing multiple employer defined benefit pension plan administered by CalPERS. Benefit provisions under the Plan are established by State statute and Local Government resolution. CalPERS issues publicly available reports that include a full description of the pension plan regarding benefits provisions, assumptions and membership information that can be found on the CalPERS website.
Benefits Provided
CalPERS provides service retirement and disability benefits, annual cost of living adjustments and death benefits to plan members, who must be public employees and beneficiaries. Benefits are based on years of credited service, equal to one year of full time employment. Members with five years of total service are eligible to retire at age 50 to 62 with statutorily reduced benefits. All members are eligible for non-industrial disability benefits after five years of service. The death benefit is one of the following: the Basic Death Benefit, the 1957 Survivor Benefit, or the Optional Settlement 2W Death Benefit. The cost of living adjustments for the plan are applied as specified by the Public Employees’ Retirement Law.
The plan provisions and benefits in effect as of the measurement date ended June 30, 2018, are summarized as follows:
Prior to On or AfterHire Date January 1, 2013 January 1, 2013Benefit Formula 2%@55 2%@62Benefit Vesting Schedule 5 years of service 5 years of serviceBenefit Payments monthly for life monthly for lifeRetirement Age 50 - 55 52 - 67Monthly Benefits, as a % of Eligible Compensation 1.426% to 2.0% 1.0% to 2.5%Required Employee Contribution Rates 7% 6.25%Required Employer Contribution Rates:
Normal Cost Rate 8.880% 6.56%Payment of Unfunded Liability 161,930$ 1,491$
Miscellaneous

SOUTH COAST WATER DISTRICT Notes to Basic Financial Statements June 30, 2019
43
NOTE 7 - DEFINED BENEFIT PENSION PLAN (CONTINUED) A. General Information about the Pension Plan
Contributions
Section 20814(c) of the California Public Employees’ Retirement Law requires that the employer contribution rates for all public employers are determined on an annual basis by the actuary and shall be effective on the July 1 following notice of a change in the rate. The total plan contributions are determined through CalPERS’ annual actuarial valuation process. The actuarially determined rate is the estimated amount necessary to finance the costs of benefits earned by employees during the year, with an additional amount to finance any unfunded accrued liability. The District is required to contribute the difference between the actuarially determined rate and the contribution rate of employees. District contribution rates may change if plan contracts are amended. Payments made by the employer to satisfy contribution requirements that are identified by the pension plan terms as plan member contributions requirements are classified as plan member contributions.
B. Pension Liabilities, Pension Expenses and Deferred Outflows/Inflows of Resources Related to Pension
As of June 30, 2019, the District reported a net pension liability of $6,961,317 for its proportionate share of the net pension liability of the CalPERS administered miscellaneous plan. The District’s net pension liability for the plan is measured as the proportionate share of the net pension liability of the CalPERS administered miscellaneous plan. The net pension liability of the plan is measured as of June 30, 2018, and the total pension liability of the plan used to calculate the net pension liability was determined by an actuarial valuation as of June 30, 2017, rolled forward to June 30, 2018, using standard update procedures. The District’s proportionate share of the net pension liability was based on a projection of the District’s long-term share of contributions to the pension plan relative to the projected contributions of all participating employers, actuarially determined.
The District’s proportionate share of the net pension liability for the plan as of the measurement dates ended June 30, 2017 and 2018 were as follows:
MiscellaneousProportion - June 30, 2017 0.19048%Proportion - June 30, 2018 0.18471%Change - Increase (Decrease) -0.00577%

SOUTH COAST WATER DISTRICT Notes to Basic Financial Statements June 30, 2019
44
NOTE 7 - DEFINED BENEFIT PENSION PLAN (CONTINUED)
B. Pension Liabilities, Pension Expenses and Deferred Outflows/Inflows of Resources Related to Pension (Continued)
For the year ended June 30, 2019, the District recognized pension expense of $849,275. At June 30, 2019, the District reported deferred outflows of resources and deferred inflows of resources related to pensions from the following sources:
Deferred DeferredOutflows Inflows
of Resources of Resources
Pension contributions subsequent to measurement date 1,053,692$ -$ Differences between actual and expected experience 267,093 (90,890) Change in assumptions 793,611 (194,499) Change in employer's proportion and differences
between the employer's contributions and the employer's proportionate share of contributions 360,050 (324,393)
Net differences between projected and actualearnings on plan investments 34,415 -
Total 2,508,861$ (609,782)$
$1,053,692 reported as deferred outflows of resources related to contributions subsequent to the measurement date will be recognized as a reduction of the net pension liability in the year ending June 30, 2020. Other amounts reported as deferred outflows of resources and deferred inflows of resources related to pensions will be recognized as a reduction to pension expense as follows:
Year
EndingJune 30, Amount
2020 614,423$ 2021 398,342 2022 (104,765) 2023 (62,613) 2024 -
Thereafter -

SOUTH COAST WATER DISTRICT Notes to Basic Financial Statements June 30, 2019
45
NOTE 7 - DEFINED BENEFIT PENSION PLAN (CONTINUED)
B. Pension Liabilities, Pension Expenses and Deferred Outflows/Inflows of Resources Related to Pension (Continued)
Actuarial Assumptions
The total pension liability for the June 30, 2018 measurement period was determined by an actuarial valuation as of June 30, 2017, with update procedures used to roll forward the total pension liability to June 30, 2018. The total pension liability was based on the following assumptions:
Miscellaneous
Valuation Date June 30, 2017Measurement Date June 30, 2018Actuarial Cost Method Entry-Age Normal
Cost MethodActuarial Assumptions:
Discount Rate 7.15%Inflation 2.50%Salary Increases (1)Mortality (2)Post Retirement Benefit Increase (3)
(1) Varies by entry age and service.(2)
(3) Contract COLA up to 2.00% until Purchasing Power Protection Allowance Floor onPurchasing Power applies, 2.50% thereafter.
The mortality table used was developed based on CalPERS-specific data. The table includes15 years of mortality improvements using the Society of Actuaries Scale 90% of scale MP2016. For more details on this table, please refer to the December 2017 experience studyreport (based on CalPERSdemographic data from 1997 to 2015) that can be found on the
CalPERS website.

SOUTH COAST WATER DISTRICT Notes to Basic Financial Statements June 30, 2019
46
NOTE 7 - DEFINED BENEFIT PENSION PLAN (CONTINUED)
B. Pension Liabilities, Pension Expenses and Deferred Outflows/Inflows of Resources Related to Pension (Continued)
Long-term Expected Rate of Return The long-term expected rate of return on pension plan investments was determined using a building-block method in which expected future real rates of return (expected returns, net of pension plan investment expense and inflation) are developed for each major asset class. In determining the long-term expected rate of return, CalPERS took into account both short-term and long-term market return expectations as well as the expected pension fund cash flows. Using historical returns of all the funds’ asset classes, expected compound (geometric) returns were calculated over the short-term (first 10 years) and the long-term (11+ years) using a building-block approach. Using the expected nominal returns for both short-term and long-term, the present value of benefits was calculated for each fund. The expected rate of return was set by calculating the rounded single equivalent expected return that arrived at the same present value of benefits for cash flows as the one calculated using both short-term and long-term returns. The expected rate of return was then set equal to the single equivalent rate calculated above and adjusted to account for assumed administrative expenses. The expected real rates of return by asset class are as follows:
Assumed Real Return Real Return
Asset Years YearsAllocation 1 - 10 (b) 11+ (c)
Global Equity 50.00% 4.80% 5.98%Fixed Income 28.00% 1.00% 2.62%Inflation Assets 0.00% 0.77% 1.81%Private Equity 8.00% 6.30% 7.23%Real Assets 13.00% 3.75% 4.93%Liquidity 1.00% 0.00% -0.92%
Total 100.00%
(a)
(b) An expected inflation of 2.0% used for this period(c) An expected inflation of 2.92% used for this period
Asset Class (a)
In the CalPERS CAFR, Fixed Income is included in Global Debt Securities; Liquidity isincluded in Short-term Investments; Inflation Assets are included in both Global EquitySecurities and Global Debt Securities

SOUTH COAST WATER DISTRICT Notes to Basic Financial Statements June 30, 2019
47
NOTE 7 - DEFINED BENEFIT PENSION PLAN (CONTINUED)
B. Pension Liabilities, Pension Expenses and Deferred Outflows/Inflows of Resources Related to Pension (Continued)
Discount Rate The discount rate used to measure the total pension liability was 7.15%. The projection of cash flows used to determine the discount rate assumed that contributions from plan members will be made at the current member contribution rates and that contributions from employers will be made at statutorily required rates, actuarially determined. Based on those assumptions, the Plan’s fiduciary net position was projected to be available to make all projected future benefit payments of current plan members. Therefore, the long-term expected rate of return on plan investments was applied to all periods of projected benefit payments to determine the total pension liability.
Sensitivity of the Proportionate Share of the Net Pension Liability to Changes in the Discount Rate
The following presents the District’s proportionate share of the net pension liability for the plan, calculated using the discount rate for the plan, as well as what the District’s proportionate share of the net pension liability would be if it were calculated using a discount rate that is 1-percentage point lower or 1-percentage point higher than the current rate:
Miscellaneous
1% Decrease 6.15%Net Pension Liability 14,633,051$
Current Discount Rate 7.15%Net Pension Liability 6,961,317$
1% Increase 8.15%Net Pension Liability 628,427$
Pension Plans Fiduciary Net Position
Detailed information about the pension plan’s fiduciary net position is available in the separately issued CalPERS financial reports.
C. Payable to the Pension Plan
At June 30, 2019, the District had no outstanding amount of contributions to the pension plans due for the year ended June 30, 2019.

SOUTH COAST WATER DISTRICT Notes to Basic Financial Statements June 30, 2019
48
NOTE 8 - OTHER POST-EMPLOYMENT BENEFITS (OPEB) A. General Information about the OPEB Plan
Plan Description The District provides an agent multiple-employer defined post-employment health care plan that provides post-employment health care benefits to retirees with requirements depending on the retiree’s initial employment date. The plan is managed through the California Employers’ Retiree Benefit Trust (CERBT). For employees of record as of May 18, 1988, five years of full-time continuous employment with the District is required. The employee must be at least 50 years of age and have participated in the CalPERS plan for at least five years as well as receiving service retirement benefits pursuant to the terms and conditions of the District CalPERS plan. The District provides medical insurance for the retired employee and employee’s eligible spouse from the date of retirement until both become eligible to receive Medicare benefits. The obligation of the District is to provide the plan of insurance, and the specific terms and conditions may vary from time to time. Thereafter, the District pays the full premium cost of Medicare supplemental coverage. Certain retirees, who were participants in legacy benefit plans, also receive dental coverage (retiree only) for life. For employees commencing employment subsequent to May 18, 1988, 20 years of full-time continuous employment is required. The employee must be at least 50 years of age and have participated in CalPERS for at least five years as well as receiving service retirement benefits pursuant to CalPERS plan requirements. The District provides medical insurance for the retired employee from the date of retirement until the retired employee is eligible to receive Medicare benefits. The obligation of the District is to provide the plan of insurance, and the specific terms and conditions may vary from time to time. Thereafter, Medicare supplement insurance is provided at the District’s expense. A separate financial report is not prepared for the plan. Employees Covered As of measurement date June 30, 2018, the following numbers of participants were covered by the benefit terms under the plan:
Inactive employees or beneficiaries currently receiving benefits 36 Active employees 84
Total 120
Contributions
The contribution requirements of the District are established and may be amended annually by the Board of Directors. Currently, contributions are not required from plan members. The annual contribution is based on the actuarially determined contributions. For the measurement date ended June 30, 2018, the District contributed $573,000 to the trust, paid $48,097 for retiree premiums, and the estimated implied subsidy was $44,000, resulting in total contributions of $665,097.
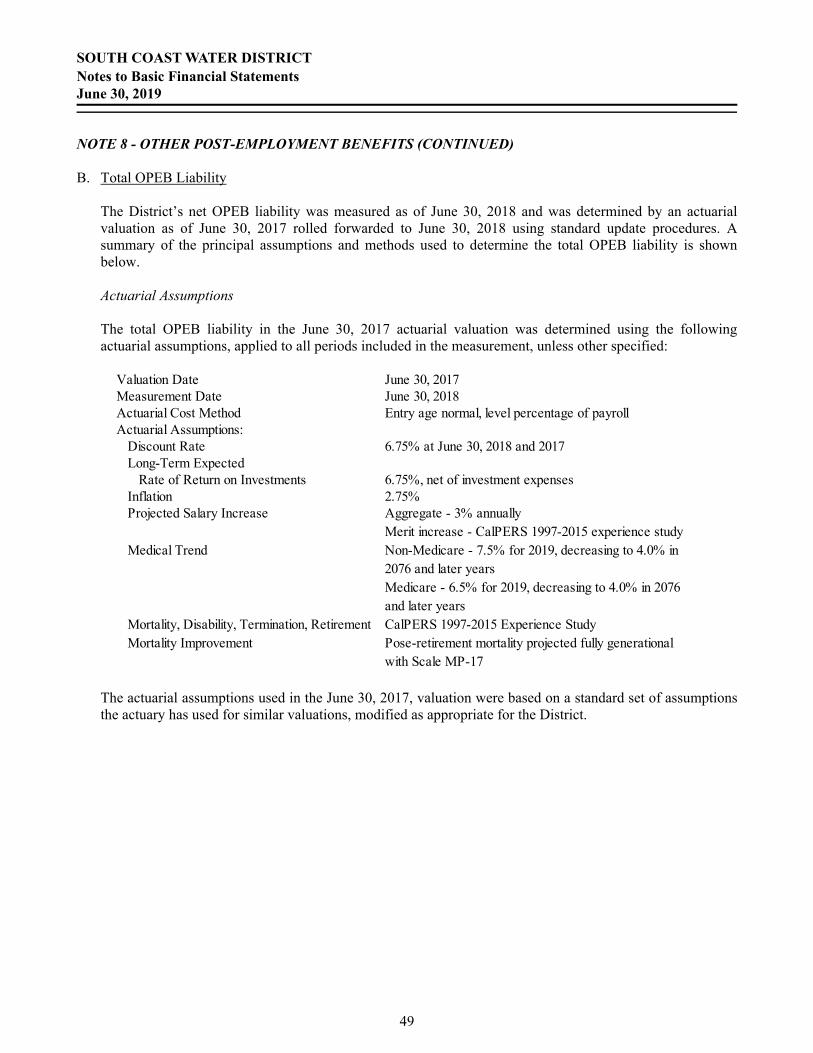
SOUTH COAST WATER DISTRICT Notes to Basic Financial Statements June 30, 2019
49
NOTE 8 - OTHER POST-EMPLOYMENT BENEFITS (CONTINUED) B. Total OPEB Liability
The District’s net OPEB liability was measured as of June 30, 2018 and was determined by an actuarial valuation as of June 30, 2017 rolled forwarded to June 30, 2018 using standard update procedures. A summary of the principal assumptions and methods used to determine the total OPEB liability is shown below. Actuarial Assumptions The total OPEB liability in the June 30, 2017 actuarial valuation was determined using the following actuarial assumptions, applied to all periods included in the measurement, unless other specified:
Valuation Date June 30, 2017Measurement Date June 30, 2018Actuarial Cost Method Entry age normal, level percentage of payrollActuarial Assumptions:
Discount Rate 6.75% at June 30, 2018 and 2017Long-Term Expected
Rate of Return on Investments 6.75%, net of investment expensesInflation 2.75%Projected Salary Increase Aggregate - 3% annually
Merit increase - CalPERS 1997-2015 experience studyMedical Trend Non-Medicare - 7.5% for 2019, decreasing to 4.0% in
2076 and later yearsMedicare - 6.5% for 2019, decreasing to 4.0% in 2076 and later years
Mortality, Disability, Termination, Retirement CalPERS 1997-2015 Experience StudyMortality Improvement Pose-retirement mortality projected fully generational
with Scale MP-17
The actuarial assumptions used in the June 30, 2017, valuation were based on a standard set of assumptions the actuary has used for similar valuations, modified as appropriate for the District.

SOUTH COAST WATER DISTRICT Notes to Basic Financial Statements June 30, 2019
50
NOTE 8 - OTHER POST-EMPLOYMENT BENEFITS (CONTINUED) B. Total OPEB Liability (Continued)
Long-term Expected Rate of Return The long-term expected rate of return was determined using a building-block method in which best-estimate ranges of expected future real rates of return (expected returns, net of OPEB plan investment expense and inflation) are developed for each major asset class. These ranges are combined to produce the long-term expected rate of return by weighing the expected future real rates of return by the target asset allocation percentage and by adding expected inflation. Best estimates of arithmetic real rates of return for each major asset class included in the OPEB plan’s target asset allocation as of June 30, 2018 are summarized in the following table:
Target Allocation Long-TermCERBT - Expected RealStrategy 1 Rate of Return
CERBTGlobal Equity 57.00% 4.82%Fixed Income 27.00% 1.47%TIPS 5.00% 1.29%Commodities 3.00% 0.84%REITs 8.00% 3.76%Total 100.00%
Asset Class
Discount Rate The discount rate used to measure the total OPEB liability was 6.75%. The projection of cash flows used to determine the discount rate assumed that the District’s contributions will be made at rates equal to the actuarially determined contribution rates. Based on those assumptions, the OPEB plan’s fiduciary net position was projected to be available to make all projected OPEB payments for current active and inactive employees and beneficiaries. Therefore, the long-term expected rate of return on the OPEB plan investments was applied to all periods of the projected benefit payments to determine the total OPEB liability.

SOUTH COAST WATER DISTRICT Notes to Basic Financial Statements June 30, 2019
51
NOTE 8 - OTHER POST-EMPLOYMENT BENEFITS (CONTINUED) C. Changes in the Net OPEB Liability
The changes in the net OPEB liability are as follows:
Total Plan NetOPEB Fiduciary OPEB
Liability Net Position Liability (Asset)Balance at June 30, 2017
(Measurement Date) 7,436,963$ 5,032,700$ 2,404,263$ Changes in the Year:
Service cost 245,162 - 245,162 Interest on the total OPEB liability 506,612 - 506,612 Contribution - employer - 665,097 (665,097) Net investment income - 408,823 (408,823) Administrative expenses - (9,388) 9,388 Benefit payments (353,515) (353,515) -
Net Changes 398,259 711,017 (312,758)
Balance at June 30, 2018(Measurement Date) 7,835,222$ 5,743,717$ 2,091,505$
Increase (Decrease)
Change of Assumptions There were no changes of assumptions. Change of Benefit Terms There were no changes of benefit terms. Subsequent Events There were no subsequent events that would materially affect the results presented in this disclosure. Sensitivity of the Net OPEB Liability to Changes in the Discount Rate The following presents the net OPEB liability of the District, as well as what the District’s net OPEB liability would be if it were calculated using a discount rate that is one percentage point lower or one percentage point higher than the current discount rate:
1% Decrease Discount Rate 1% Increase(5.75%) (6.75%) (7.75%)
Net OPEB Liability 3,075,000$ 2,091,505$ 1,268,217$

SOUTH COAST WATER DISTRICT Notes to Basic Financial Statements June 30, 2019
52
NOTE 8 - OTHER POST-EMPLOYMENT BENEFITS (CONTINUED) C. Changes in the Net OPEB Liability (Continued)
Sensitivity of the Net OPEB Liability to Changes in the Health-Care Cost Trend Rates The following presents the net OPEB liability of the District as well as what the District’s net OPEB liability would be if it were calculated using healthcare cost trend rates that are one percentage point lower or one percentage point higher than the current discount rate:
Current Healthcare 1% Decrease Cost Trend Rates 1% Increase(6.5%/5.5% (7.5%/6.5% (8.5%/7.5%
decreasing to 3.0%) decreasing to 4.0%) decreasing to 5.0%)Net OPEB Liability 1,094,003$ 2,091,505$ 3,319,073$
D. OPEB Expense and Deferred Outflows/Inflows of Resources Related to OPEB
For the year ended June 30, 2019, the District recognized OPEB expense of $361,683. At June 30, 2019, the District reported deferred outflows of resources and deferred inflows of resources related to the OPEB from the following sources:
Deferred DeferredOutflows Inflows
of Resources of ResourcesOPEB contributions subsequent to measurement date 637,422$ -$ Differences between projected and actual earnings - (180,776)
Total 637,422$ (180,776)$
An amount of $637,422 reported as deferred outflows of resources related to contributions subsequent to the measurement date will be recognized as a reduction of the net OPEB liability in the year ending June 30, 2020. Other amounts reported as deferred outflows of resources and deferred inflows of resources related to OPEB will be recognized as OPEB expense as follows:
YearEnding
June 30, Amount2019 (55,909)$ 2020 (55,909) 2021 (55,909) 2022 (13,049) 2023 -
Thereafter - E. Payable to the OPEB Plan
At June 30, 2019, the District had no outstanding amount of contributions to the OPEB plan required for the year ended June 30, 2019.

SOUTH COAST WATER DISTRICT Notes to Basic Financial Statements June 30, 2019
53
NOTE 9 - DEFERRED COMPENSATION The District offers a 457 deferred compensation plan to employees. Nationwide Retirement Solutions, Inc. acts as the third party administrative services provider for the defined contribution plan. Employees can contribute up to the IRS determined limits to the plan. The District will match contributions up a certain amount as determined by the District’s Board of Directors. Distributions under the plan may generally not be made prior to the earlier of the employees’ attainment of age 70½ or the employees’ termination of employment. Total District contributions to the plan during fiscal year 2018-19 were $122,969. NOTE 10 - RISK MANAGEMENT The District is exposed to various risks of loss related to torts, theft, damage to and destructions of assets, errors and omissions, injuries to employees and natural disasters. In an effort to manage its risk exposure, the District is a member of the Association of California Water Agencies Joint Powers Insurance Authority (Insurance Authority). The Insurance Authority is a risk-pooling self-insurance authority, created under provisions of California Government Code Section 6500 et seq. The purpose of the Insurance Authority is to arrange and administer programs of insurance for the pooling of self-insured losses and to purchase excess insurance coverage. At June 30, 2019, the District participated in the self-insurance programs of the Insurance Authority as follows:
Property Loss - The Insurance Authority has pooled self-insurance up to $100,000 per occurrence and has purchased excess insurance coverage up to $500,000,000 (total insurable value of $23,692,711 for the District and $2,597,855 for JRWSS). The District has a $1,000 deductible for coverage including special form with exclusions, mobile equipment physical damage, and vehicle comprehension/collision. Deductible for coverage of accidental mechanical breakdown is $25,000 or $50,000 depending on the type of equipment and has a sublimit of $100,000,000.
General and Auto Liability - The Insurance Authority has pooled self-insurance up to $5,000,000 per occurrence and has purchased excess insurance coverage up to $60,000,000. The District has no deductible.
Public Official's Errors and Omissions - The Insurance Authority has pooled self-insurance up to $5,000,000 per occurrence and has purchased excess insurance coverage up to $60,000,000. The District has no deductible.
Underground Storage Tank Pollution Liability - The Insurance Authority has pooled self-insurance up to $500,000 per occurrence and has purchased excess insurance coverage up to $3,000,000 ($750,000 aggregate expense limit). The District has a $10,000 deductible. Crime - The Insurance Authority has pooled self-insurance up to $100,000 per occurrence. The District has a $1,000 deductible.
Workers' Compensation - The Insurance Authority has pooled self-insurance up to $2,000,000 and excess insurance coverage has been purchased up to the statutory limit. The District has no deductible.
Dam Failure Liability - The Insurance Authority has purchased insurance coverage up to $5,000,000 per occurrence with a $50,000 retention. Cyber Liability – The Insurance Authority has purchased insurance coverage up to $3,000,000 per occurrence and up to $5,000,000 in aggregate. The District has no deductible.
The District pays annual premiums for coverage. There have been no settlements that exceeded the District’s insurance coverage and no reduction in the District insurance coverage for the past three years.

SOUTH COAST WATER DISTRICT Notes to Basic Financial Statements June 30, 2019
54
NOTE 11 - CONTINGENCIES AND COMMITMENTS
Lawsuits - The District is a defendant in various lawsuits. Although the outcome of these lawsuits is not presently determinable, it is the opinion of the District's management that resolution of these matters will not have a material adverse effect on the financial condition of the District.
Contract Commitments - The District had $60,891,288 outstanding contract commitments at June 30, 2019. The three largest contracts outstanding include:
Contract Balance toProject Description Amount CompleteTunnel stabilization and sewer pipeline replacement 25,562,920$ 9,754,194$ Contract management services for the tunnel 11,013,817 6,375,182 Ocean desalinization development project manager 8,000,000 3,292,619
NOTE 12 - OPERATING LEASES
As of June 30, 2019, the District has operating leases with various companies to rent space on District owned property. The operating leases are on a month-to-month basis with the District receiving monthly lease payments totaling $86,245. The capital assets included in these operating leases consist of a portion of the District’s general plant that cannot be readily determined. NOTE 13 - JOINT REGIONAL WATER SUPPLY SYSTEM CAPITAL ASSETS
Changes in capital assets for the year ended June 30, 2019 were as follows:
Balance at Deletions/ Balance atJune 30, 2018 Additions Transfers June 30, 2019
Capital assets, not depreciated:Land and land rights 861,355$ -$ -$ 861,355$ Construction in progress 1,705,762 1,061,165 (353,862) 2,413,065
Total capital assets,not depreciated 2,567,117 1,061,165 (353,862) 3,274,420
Capital assets, being depreciated:Intangible plant 2,481,746 - - 2,481,746 Source of supply 10,684,769 - - 10,684,769 Transmission and distribution 35,711,392 281,002 - 35,992,394 General plant 922,811 72,860 - 995,671
Total capital assets,being depreciated 49,800,718 353,862 - 50,154,580
Less accumulated depreciation for:Intangible plant (1,427,005) (62,044) - (1,489,049) Source of supply (6,972,276) (195,801) - (7,168,077) Transmission and distribution (14,919,889) (878,887) - (15,798,776) General plant (679,893) (49,530) - (729,423)
Total accumulated depreciation (23,999,063) (1,186,262) - (25,185,325)
Total capital assets,being depreciated, net 25,801,655 (832,400) - 24,969,255
Capital Assets, net 28,368,772$ 228,765$ (353,862)$ 28,243,675$

SOUTH COAST WATER DISTRICT Notes to Basic Financial Statements June 30, 2019
55
NOTE 14 - RESTATEMENT OF NET POSITION Beginning balance of net position as of July 1, 2018, have been restated as follows: Net position at July 1, 2018 as original reported $ 170,423,147
Correction of fiscal year 2017-18 pension contributions subsequent to measurement date (586,732)
Net position at July 1, 2018, as restated $ 169,836,415 NOTE 15 - SUBSEQUENT EVENTS In July 2019, the District entered into a credit agreement with Opus Bank not to exceed $25 million outstanding at any one time by the issuance of short-term promissory notes solely for the purpose of funding all or a portion of the costs of the Tunnel Project. The credit agreement contains a pledge of wastewater system revenues to repay the notes and allows the District to borrow funds under the note on a revolving basis. The notes bear interest at 1.98% per annum and mature on December 1, 2020. The credit agreement also requires the District to fix and prescribe rates and charges for the wastewater service provided by the wastewater system to be at least sufficient to yield net revenues during each fiscal year equal to 125% of debt service payable in such fiscal year. In July 2019, the District received $15 million under the State Revolving Fund Loan - Tunnel Project contract for eligible costs incurred on the project. In preparing these financial statements, the District has evaluated events and transactions for potential recognition or disclosure through December 19, 2019, the date the financial statements were available to be issued.

56
(This page intentionally left blank)

57
REQUIRED SUPPLEMENTARY INFORMATION

58
(This page intentionally left blank)

Fiscal year ended June 30, 2019 June 30, 2018 June 30, 2017 June 30, 2016 June 30, 2015
Measurement period June 30, 2018 June 30, 2017 June 30, 2016 June 30, 2015 June 30, 2014
Plan's proportion of thenet pension liability 0.07224% 0.07572% 0.12799% 0.11904% 0.12543%
Plan's proportionate shareof the net pension liability 6,961,317$ 7,508,964$ 11,075,496$ 8,170,473$ 7,805,073$
Plan's covered payroll 8,547,122$ 8,688,674$ 7,022,391$ 6,941,886$ 7,086,467$
Plan's proportionate shareof the net pension liability aspercentage of its covered payroll 81.45% 86.42% 157.72% 117.70% 110.14%
Plan's proportionate share of thefiduciary net position as apercentage of the Plan's totalpension liability 75.26% 73.31% 74.06% 78.40% 83.03%
Plan's proportionate share ofaggregate employer contributions 1,895,122$ 1,744,136$ 1,422,678$ 1,340,851$ 1,032,582$
Notes to Schedule:
Benefit Changes:
Changes in Assumptions:From fiscal year June 30, 2015 to June 30, 2016:
From fiscal year June 30, 2016 to June 30, 2017:There were no changes in assumptions.
From fiscal year June 30, 2017 to June 30, 2018:The discount rate was reduced from 7.65% to 7.15%
From fiscal year June 30, 2018 to June 30, 2019:There were no significant changes in assumptions.
* Fiscal year 2015 was the 1st year of implementation, therefore only five years are shown.
GASB 68, paragraph 68 states that the long-term expected rate of return should be determined net of pension plan investmentexpense but without reduction for pension plan administrative expense. The discount rate of 7.50% used for the June 30, 2014measurement date was net of administrative expenses. The discount rate of 7.65% used for the June 30, 2015 measurement dateis without reduction of pension plan administrative expense.
SOUTH COAST WATER DISTRICT
SCHEDULE OF PROPORTIONATE SHARE OF THE NET PENSION LIABILITY
Last Ten Fiscal Years*
There were no changes in benefits.
59

Fiscal year ended June 30, 2019 June 30, 2018 June 30, 2017 June 30, 2016 June 30, 2015
Contractually required contribution (actuarially determined) 1,053,692$ 1,436,610$ 1,075,499$ 934,063$ 937,929$
Contributions in relation tothe actuarially determinedcontributions (1,053,692) (1,436,610) (6,075,499) (934,063) (937,929)
Contribution deficiency (excess) -$ -$ (5,000,000)$ -$ -$
Covered payroll 8,817,816$ 8,547,122$ 8,688,674$ 7,022,391$ 6,941,886$
Contributions as a percentageof covered payroll 11.95% 16.81% 69.92% 13.30% 13.51%
Notes to Schedule:
Valuation Date 6/30/2016 6/30/2015 6/30/2014 6/30/2013 6/30/2012
Methods and Assumptions Used to Determine Contribution Rates:Actuarial cost method Entry age Entry age Entry age Entry age Entry ageAmortization method (1) (1) (1) (1) (1)Asset valuation method Market Value Market Value Market Value Market Value 15 Year
SmoothedMarket Method
Inflation 2.75% 2.75% 2.75% 2.75% 2.75%
Salary increases (2) (2) (2) (2) (2)
Investment rate of return 7.375% (3) 7.50% (3) 7.50% (3) 7.50% (3) 7.50% (3)
Retirement age (4) (4) (4) (4) (4)Mortality (5) (5) (5) (5) (5)
(1) Level percentage of payroll, closed(2) Depending on age, service, and type of employment(3) Net of pension plan investment expense, including inflation(4) 2% @ 55 and 2% @ 62(5) Mortality assumptions are based on mortality rates resulting from the most recent CalPERS Experience Study
adopted by the CalPERS Board.
* Fiscal year 2015 was the 1st year of implementation, therefore only five years are shown.
SOUTH COAST WATER DISTRICT
SCHEDULE OF CONTRIBUTIONS - PENSION
Last Ten Fiscal Years*
60

Fiscal year ended June 30, 2019 June 30, 2018
Measurement period June 30, 2018 June 30, 2017
Total OPEB Liability:Service cost 245,162$ 238,021$ Interest on total OPEB liability 506,612 479,880 Benefit payments (353,515) (304,511)
Net Change in Total OPEB Liability 398,259 413,390 Total OPEB Liability - Beginning of Year 7,436,963 7,023,573 Total OPEB Liability - End of Year (a) 7,835,222 7,436,963
Plan Fiduciary Net Position:Contributions - employer 665,097 596,000 Net investment income 408,823 509,829 Administrative expenses (9,388) (2,461) Benefit payments (353,515) (304,511)
Net Change in Plan Fiduciary Net Position 711,017 798,857 Plan Fiduciary Net Position - Beginning of Year 5,032,700 4,233,843 Plan Fiduciary Net Position - End of Year (b) 5,743,717 5,032,700
Net OPEB Liability - Ending (a)-(b) 2,091,505$ 2,404,263$
Plan fiduciary net position as a percentage of thetotal OPEB liability 73.31% 67.67%
Covered - employee payroll 9,811,343$ 8,688,674$
Net OPEB liability as percentage of covered - employee payroll 21.32% 27.67%
Notes to Schedule:
Benefit Changes:There were no changes in benefits.
Changes in Assumptions:There were no changes in assumptions
* Fiscal year 2018 was the first year of implementation; therefore, only two years are shown.
SOUTH COAST WATER DISTRICT
SCHEDULE OF CHANGES IN THE NET OPEB LIABILITY AND RELATED RATIOS
Last Ten Fiscal Years*
61

Fiscal year ended June 30, 2019 June 30, 2018
Actuarially determined contribution 605,000$ 573,000$
Contributions in relation to the actuarially determined contributions (637,422) (665,097)
Contribution deficiency (excess) (32,422)$ (92,097)$
Covered - employee payroll 9,899,581$ 9,811,343$
Contributions as a percentage of covered - employee payroll 6.44% 6.78%
Notes to Schedule:
Valuation Date 6/30/2017 6/30/2015
Methods and Assumptions Used to Determine Contribution Rates:Actuarial cost methodAmortization methodAmortization period 8-year average fixed 10-year average fixedAsset valuation method (1) (1)Discount rate 6.75% 7.25%Inflation 2.75% 3.00%Medical Trend (3) (2)Mortality (5) (4)
(1) Investment gain and losses spread over 5-year rolling period(2) Non-Medicare - 7.0% for 2017, decreasing to 5.0% in 2021 and later.
Medicare - 7.2% for 2017, decreasing to 5.0% in 2021 and later.(3) Non-Medicare - 7.5% for 2019, decreasing to 4.0% in 2076 and later.
Medicare - 6.5% for 2019, decreasing to 4.0% in 2076 and later.(4) CalPERS 1997-2011 experience study(5) CalPERS 1997-2015 experience study
* Fiscal year 2018 was the first year of implementation; therefore, only two years are shown.
SOUTH COAST WATER DISTRICT
SCHEDULE OF CONTRIBUTIONS - OPEB
Last Ten Fiscal Years*
Entry age, level percentage of payrollLevel percent of pay
62

63
SUPPLEMENTARY INFORMATION

Joint WaterTransmission Bradt Importation
General Main (JTM) Reservoir PipelineOperating expenses:
Labor, benefits and related costs 300,843$ 100,349$ 180,665$ 28,475$ Materials, repairs and contractors 86,524 974,725 187,746 32,131 Utilities 9,025 4,273 39,496 2,463 Engineering services - 9,290 - - Water testing 5,848 16,037 11,370 16,552
Total operating expenses 402,240 1,104,674 419,277 79,621
General and administrative expenses:Labor, benefits and related costs 172,156 - - - Office supplies and maintenance 25,415 - 5,389 - Utilities 9,034 - 329 - Insurance 27,093 - - - Professional fees 31,301 - - - Regulatory fees 15,711 - 42,555 - Dues and subscriptions 3,396 - - -
Total general and administrativeexpenses 284,106 - 48,273 -
Total general expenses 686,346$ 1,104,674$ 467,550$ 79,621$
SOUTH COAST WATER DISTRICTJoint Regional Water Supply System
General Expenses Allocation by FacilitiesFor the Year Ended June 30, 2019
64

LocalTransmission San Onofre
Main Schlegel Feeder Total
40,937$ 43,845$ 37,505$ 732,619$ 44,689 36,249 23,985 1,386,049
8,169 18,296 271 81,993 - - - 9,290
7,408 12,092 15,628 84,935 101,203 110,482 77,389 2,294,886
983 - - 173,139 - 197 - 31,001 - - - 9,363 - - - 27,093 - - - 31,301 - - - 58,266 - - - 3,396
983 197 - 333,559
102,186$ 110,679$ 77,389$ 2,628,445$
65

Joint WaterTransmission Bradt Importation
General Main (JTM) Reservoir PipelineAllocation Allocation Allocation Allocation
Participant Factor #1 Factor* Factor #11 Factor #10
Irvine Ranch Water District 6,726$ 14,704$ -$ -$ El Toro Water District 2,677 11,722 - - Moulton Niguel Water District 296,021 508,494 22,910 - Capistrano Valley Water District 68,703 88,165 4,956 - South Coast Water District (SCWD) 84,628 130,476 122,357 49,763 City of San Clemente 197,187 304,129 281,231 29,858 Camp Pendleton 2,677 4,099 3,133 - State Parks 1,030 1,669 1,262 - SONGS 26,699 41,216 31,700 -
Total 686,350$ 1,104,674$ 467,550$ 79,621$
SOUTH COAST WATER DISTRICTJoint Regional Water Supply System
General Expenses Allocation by ParticipantsFor the Year Ended June 30, 2019
* The allocation factor for the JTM line is a weighted average of the pipeline capacity and the budgetedallocation factors by reach.
66

LocalTransmission San Onofre
Main Schlegel FeederAllocation Allocation AllocationFactor #9 Factor #12 Factor #13 Total
-$ -$ -$ 21,430$ - - - 14,399 - - - 827,425 - - - 161,824 - - - 387,224
88,534 64,559 - 965,498 1,196 - 6,787 17,892
480 - 2,716 7,157 11,976 46,120 67,886 225,597
102,186$ 110,679$ 77,389$ 2,628,445$
67

Allocation Allocation Allocation Allocation Allocation AllocationFactor #1 Factor #2 Factor #3 Factor #4 Factor #5 Factor #6
System Unit 1 Unit 1 Unit 2 Unit 2 Unit 3Participant Wide Reach 1 Reach 2 Reach 3 Reach 4 Reach 5
Irvine Ranch Water District 0.98% 5.66% 0.00% 0.00% 0.00% 0.00%El Toro Water District 0.39% 2.26% 2.40% 0.00% 0.00% 0.00%Moulton Niguel Water District 43.13% 48.64% 51.56% 62.50% 53.57% 40.61%Capistrano Valley Water District 10.01% 16.97% 17.98% 0.00% 0.00% 0.00%South Coast Water District 12.33% 7.17% 7.60% 10.16% 12.58% 16.09%City of San Clemente 28.73% 16.72% 17.72% 23.69% 29.33% 37.51%Camp Pendleton 0.39% 0.23% 0.24% 0.32% 0.39% 0.51%State Parks 0.15% 0.09% 0.10% 0.13% 0.16% 0.20%SONGS 3.89% 2.26% 2.40% 3.20% 3.97% 5.08%
100.00% 100.00% 100.00% 100.00% 100.00% 100.00%
For the Year Ended June 30, 2019Budget Allocation Factors by Participants
Joint Regional Water Supply SystemSOUTH COAST WATER DISTRICT
68

Allocation Allocation Allocation Allocation Allocation Allocation Allocation Allocation AllocationFactor #7 Factor #8 Factor #9 Factor #10 Factor #11 Factor #12 Factor #13 Factor #14 Factor #15
SCWD Master PlanPass-through Debt Facilities
Unit 3 Unit 3 Local Water Bradt Schlegel O&M Service ReplacementReach 6 Reach 7 Trans Main Import Pipe Reservoir Reservoir SONGS PPL COP's Reserve
0.00% 0.00% 0.00% 0.00% 0.00% 0.00% 0.00% 0.00% 0.00%0.00% 0.00% 0.00% 0.00% 0.00% 0.00% 0.00% 0.00% 0.00%
17.61% 0.00% 0.00% 0.00% 4.90% 0.00% 0.00% 0.00% 0.00%0.00% 0.00% 0.00% 0.00% 1.06% 0.00% 0.00% 0.00% 0.00%
22.32% 27.09% 0.00% 62.50% 26.17% 0.00% 0.00% 37.60% 27.09%52.04% 63.16% 86.64% 37.50% 60.15% 58.33% 0.00% 54.40% 63.16%
0.71% 0.86% 1.17% 0.00% 0.67% 0.00% 8.77% 0.00% 0.86%0.28% 0.34% 0.47% 0.00% 0.27% 0.00% 3.51% 0.00% 0.34%7.04% 8.55% 11.72% 0.00% 6.78% 41.67% 87.72% 8.00% 8.55%
100.00% 100.00% 100.00% 100.00% 100.00% 100.00% 100.00% 100.00% 100.00%
69

70
STATISTICAL SECTION (UNAUDITED)

SOUTH COAST WATER DISTRICT Description of Statistical Section Contents June 30, 2019
71
This part of the District’s comprehensive annual financial report presents detailed information as a context for understanding what the information in the financial statements and the note disclosures say about the government’s overall financial health.
Contents: Pages
Financial Trends - these schedules contain trend information to help the reader understand how the District’s financial performance and well-being have changed over time. 72-75
Revenue Capacity - these schedules contain information to help the reader assess the District’s most significant revenue source from water and sewer commodity and fixed charges. 76-84
Debt Capacity - these schedules present information to help the reader assess the affordability of the District’s current levels of outstanding debt and the District’s ability to issue additional debt in the future. 85-90
Demographic and Economic Information - these schedules offer demographic and economic indicators to help the reader understand the environment within which the District’s financial activities take place. 91-92
Operating Information - these schedules contain service and infrastructure data to help the reader understand how the information in the District’s financial report relates to the services the District provides and the activities it performs. 93-102

Net Position: 2019 2018 2017 2016 Assets : Current Assets 60,049,653$ 54,344,998$ 50,040,724$ 63,046,515$ Noncurrent Assets: Restricted Assets - - - - Net Capital Assets 189,089,119 165,166,397 155,831,742 144,780,028 Other Assets 7,951,147 8,219,287 8,630,100 8,822,497
Total Assets 257,089,919 227,730,682 214,502,566 216,649,040
Deferred Outflows of Resources: Deferred Refunding Charges 1,776,601 716,800 784,529 - Pension Contributions Subsequent to
Measurement Date 1,053,692 1,436,610 6,075,499 934,063 Pension Related 1,455,169 2,760,767 1,675,168 86,953
Other Post-Employment Benefits Contributions Subsequent to
Measurement Date 637,422 617,000 - -
Total Deferred Outlflows of Resource 4,922,884 5,531,177 8,535,196 1,021,016
Liabilities: Current Liabilities 11,465,539 8,026,333 7,811,739 6,214,723 Noncurrent Liabilities 79,153,539 53,272,612 44,726,428 42,029,933
Total Liabilities 90,619,078 61,298,945 52,538,167 48,244,656
Deferred Inflows of Resources: Deferred Refunding Charges - - - 508,116 Pension Related 609,782 1,368,335 1,355,999 2,078,899
Other Post-Employment Benefits Related 180,776 171,432 - -
Total Deferred Inflows of Resources 790,558 1,539,767 1,355,999 2,587,015
Net Position: Net Investment in Capital Assets 140,811,169 121,807,991 122,393,683 109,822,913 Restricted for Debt Service/Covenants 20,748,829 457 573,681 784,475 Unrestricted 9,043,169 48,614,699 46,176,232 56,230,997
Total Net Position 170,603,167$ 170,423,147$ 169,143,596$ 166,838,385$
(Continued)NOTES:
N/A - information not available.
Source: District Audited Financial Statements
South Coast Water DistrictNet Position
Last Ten Fiscal Years
Fiscal Year
72
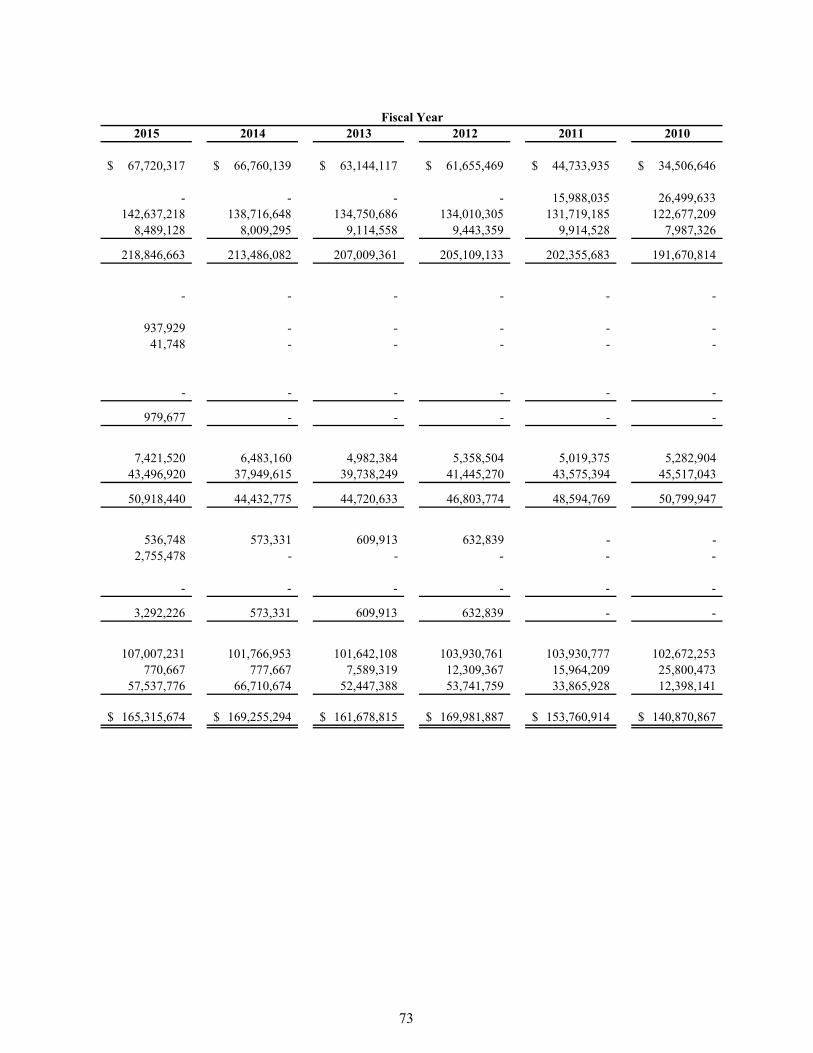
2015 2014 2013 2012 2011 2010
67,720,317$ 66,760,139$ 63,144,117$ 61,655,469$ 44,733,935$ 34,506,646$
- - - - 15,988,035 26,499,633 142,637,218 138,716,648 134,750,686 134,010,305 131,719,185 122,677,209
8,489,128 8,009,295 9,114,558 9,443,359 9,914,528 7,987,326
218,846,663 213,486,082 207,009,361 205,109,133 202,355,683 191,670,814
- - - - - -
937,929 - - - - - 41,748 - - - - -
- - - - - -
979,677 - - - - -
7,421,520 6,483,160 4,982,384 5,358,504 5,019,375 5,282,904 43,496,920 37,949,615 39,738,249 41,445,270 43,575,394 45,517,043
50,918,440 44,432,775 44,720,633 46,803,774 48,594,769 50,799,947
536,748 573,331 609,913 632,839 - - 2,755,478 - - - - -
- - - - - -
3,292,226 573,331 609,913 632,839 - -
107,007,231 101,766,953 101,642,108 103,930,761 103,930,777 102,672,253 770,667 777,667 7,589,319 12,309,367 15,964,209 25,800,473
57,537,776 66,710,674 52,447,388 53,741,759 33,865,928 12,398,141
165,315,674$ 169,255,294$ 161,678,815$ 169,981,887$ 153,760,914$ 140,870,867$
Fiscal Year
73

Changes in Net Position: 2019 2018 2017 2016 Operating Revenues Water Sales 17,518,158$ 16,415,394$ 14,133,228$ 14,105,212$ Sewer Service Charges 14,702,662 13,839,953 12,421,268 12,070,688 Recycled Water 1,770,840 1,907,580 1,640,610 1,358,360 Recreation Facilities 294,177 291,564 215,069 208,811
Operating Expenses Source of Supply (Purchased Water) 6,085,677 5,804,144 5,616,206 5,579,348 Groundwater Recovery Facility 1,011,303 686,714 570,996 437,110 Recycled Water 942,374 621,481 1,082,906 1,024,908 Pumping Expense 1,111,566 1,101,671 1,043,175 956,397 Sewer Treatment Plant 5,400,627 4,421,065 3,169,418 2,592,137 Transmission and Distribution 4,854,330 4,217,828 4,727,882 4,249,310 Operations Support 2,932,001 2,409,490 - - Recreation Facilities 294,565 365,952 453,661 316,364 Engineering and Consulting 2,314,667 2,577,966 1,515,371 - General and Administrative 8,216,031 7,058,374 9,109,631 8,523,132 Depreciation 6,259,702 6,384,604 6,639,471 7,367,975
Income From Operations (5,137,006) (3,194,798) (5,518,542) (3,303,610)
Nonoperating Revenues (Expenses) Property Taxes-General and Bond Levy 6,558,495 6,332,296 6,021,573 6,128,107 Connection Fees - - - - Standby Charges - 1,605 10,601 8,976 Investment Income 1,412,028 353,704 358,885 290,475 Other Revenues 2,044,497 819,595 572,107 624,843 Rental Income 832,059 782,842 788,711 785,393 Grant Revenue - - - - Interest Expense (2,294,818) (1,337,020) (825,110) (900,665) Gain (Loss) on Disposal of Capital Asset (2,430,233) (12,354) (57,550) 26,438 Share of Joint Venture Income (Expense (571,241) (393,387) (282,950) 183,361 Other Expenses (404,292) (124,755) (121,012) (3,188,858)
Total Nonoperating Revenues (Expenses) 5,146,495 6,422,526 6,465,255 3,958,070
Income Before Capital Contributions 9,489 3,227,728 946,713 654,460
Capital Contributions 757,263 745,969 1,358,498 868,251
Change in Net Position 766,752$ 3,973,697$ 2,305,211$ 1,522,711$
(Continued)Source: District Audited Financial Statements
South Coast Water DistrictChanges in Net PositionLast Ten Fiscal Years
Fiscal Year
74
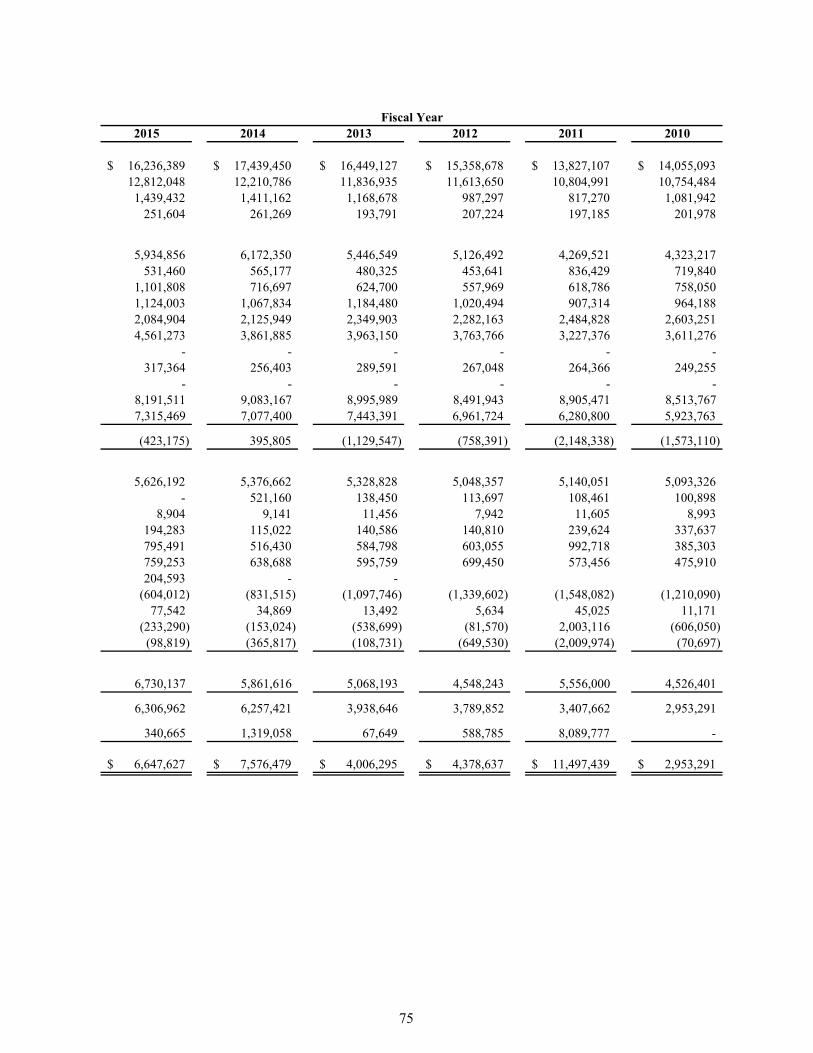
2015 2014 2013 2012 2011 2010
16,236,389$ 17,439,450$ 16,449,127$ 15,358,678$ 13,827,107$ 14,055,093$ 12,812,048 12,210,786 11,836,935 11,613,650 10,804,991 10,754,484
1,439,432 1,411,162 1,168,678 987,297 817,270 1,081,942 251,604 261,269 193,791 207,224 197,185 201,978
5,934,856 6,172,350 5,446,549 5,126,492 4,269,521 4,323,217 531,460 565,177 480,325 453,641 836,429 719,840
1,101,808 716,697 624,700 557,969 618,786 758,050 1,124,003 1,067,834 1,184,480 1,020,494 907,314 964,188 2,084,904 2,125,949 2,349,903 2,282,163 2,484,828 2,603,251 4,561,273 3,861,885 3,963,150 3,763,766 3,227,376 3,611,276
- - - - - - 317,364 256,403 289,591 267,048 264,366 249,255
- - - - - - 8,191,511 9,083,167 8,995,989 8,491,943 8,905,471 8,513,767 7,315,469 7,077,400 7,443,391 6,961,724 6,280,800 5,923,763
(423,175) 395,805 (1,129,547) (758,391) (2,148,338) (1,573,110)
5,626,192 5,376,662 5,328,828 5,048,357 5,140,051 5,093,326 - 521,160 138,450 113,697 108,461 100,898
8,904 9,141 11,456 7,942 11,605 8,993 194,283 115,022 140,586 140,810 239,624 337,637 795,491 516,430 584,798 603,055 992,718 385,303 759,253 638,688 595,759 699,450 573,456 475,910 204,593 - -
(604,012) (831,515) (1,097,746) (1,339,602) (1,548,082) (1,210,090) 77,542 34,869 13,492 5,634 45,025 11,171
(233,290) (153,024) (538,699) (81,570) 2,003,116 (606,050) (98,819) (365,817) (108,731) (649,530) (2,009,974) (70,697)
6,730,137 5,861,616 5,068,193 4,548,243 5,556,000 4,526,401
6,306,962 6,257,421 3,938,646 3,789,852 3,407,662 2,953,291
340,665 1,319,058 67,649 588,785 8,089,777 -
6,647,627$ 7,576,479$ 4,006,295$ 4,378,637$ 11,497,439$ 2,953,291$
Fiscal Year
75

2019 2018 2017 2016 2015
Single Family Residential 2,679 2,798 2,504 2,350 3,103 Multi-Family Residential 952 971 960 961 1,137 Commercial/Industrial 902 928 914 917 1,115 Irrigation/Other 1,332 1,640 1,385 1,402 1,953
Total 5,865 6,337 5,763 5,630 7,308
(Continued)Source: District Billing System
South Coast Water DistrictWater Sold By Type of Customer (in Acre Feet)
Last Ten Fiscal Years
Customer TypeFiscal Year
76

2014 2013 2012 2011 2010
3,185 3,095 3,066 2,937 3,139 1,153 1,164 1,173 1,145 1,176 1,089 1,054 1,037 992 970 1,980 1,753 1,582 1,500 1,805
7,407 7,066 6,858 6,574 7,090
Fiscal Year
77

2019 2018 2017 2016 1 2015Potable Water:
Single Family Residence (Variable)Tier 1 2.93$ 2.74$ 2.54$ 2.25$ 2.25$ Tier 2 3.09 2.89 2.68 4.18 4.18 Tier 3 3.27 3.05 2.83 6.27 6.27 Tier 4 - - - 8.36 8.36 Tier 5 - - - 10.45 10.45
Multi-Family (Variable) 2.95 2.76 2.56 4.13 4.13 Commercial (Variable) 3.17 2.96 2.75 4.13 4.13 Irrigation (Variable)
Tier 1 3.29 3.08 2.85 4.18 4.18 Tier 2 - - - 6.27 6.27 Tier 3 - - - 8.36 8.36
Fixed Charges 2
3/4" 297.25 278.05 257.70 294.20 294.20 1" 495.40 463.40 429.50 529.56 529.56 1 1/2" 990.80 926.80 859.00 1,182.69 1,182.69 2" 1,585.25 1,482.85 1,374.35 2,100.69 2,100.69 3" 3,467.70 3,243.70 3,006.40 4,727.83 4,727.83 4" 6,241.85 5,838.65 5,411.50 8,399.48 8,399.48 6" 12,880.00 12,048.00 11,166.55 18,896.62 18,896.62
Peak Demand Charges (Fixed) 2/3 21.15 19.80 18.35 - -
Recycled Water:Variable Charges 4.35 4.16 3.94 3.72 3.72
Fixed Charges 2
3/4" 297.25 278.05 257.70 - - 1" 495.40 463.40 429.50 - - 1 1/2" 990.80 926.80 859.00 - - 2" 1,585.25 1,482.85 1,374.35 - - 3" 3,467.70 3,243.70 3,006.40 - - 4" 6,241.85 5,838.65 5,411.50 - - 6" 12,880.00 12,048.00 11,166.55 - -
(Continued)NOTES:
1 In general, variable rates for water service decreased after 2016 due to the transfer of some costs to Fixed and Peak
Demand Charges in the new rate structure. Variable rates are based on usage by centum cubic feet (CCF). One CCF
equals 100 cubic feet or 748 gallons.2 Fixed charges for single family residences are billed on an annual basis and collected with property tax payments. 3 This new fee is based on the second highest demand month during the preceding fiscal year.
Source: District records
South Coast Water DistrictWater Rates
Last Ten Fiscal Years
Description
Fiscal Year
78

2014 2013 2012 2011 2010
2.16$ 2.01$ 1.91$ 1.52$ 1.52$ 4.07 3.85 3.71 3.04 3.04 6.10 5.77 5.56 4.56 4.56 8.13 7.69 7.42 6.08 6.08
10.16 9.61 9.27 7.60 7.60 4.02 3.72 3.58 3.42 3.42 4.02 3.72 3.58 3.42 3.42
4.07 3.85 3.71 3.04 3.04 6.10 5.77 5.56 4.56 4.56 8.13 7.69 7.42 6.08 6.08
284.62 284.62 257.65 235.95 235.95 512.31 512.31 463.77 589.87 589.87
1,144.17 1,144.17 1,035.75 1,179.75 1,179.75 2,032.18 2,032.18 1,839.61 1,887.59 1,887.59 4,573.82 4,573.82 4,140.41 3,539.24 3,539.24 8,125.87 8,125.87 7,355.87 7,078.48 7,078.48
18,281.07 18,281.07 16,548.77 11,797.47 11,797.47
- - - - -
3.62 3.34 3.58 3.42 3.42
- - - - - - - - - - - - - - - - - - - - - - - - - - - - - - - - - - -
Fiscal Year
79

80
(This page intentionally left blank)

FY 2018/2019
Customer Name Business TypeAnnual
Revenues% of Total Revenues
1 Monarch Beach Golf Links Golf Course 407,549$ 2.33%2 City of Dana Point Government 312,507 1.79%3 MMB Management LLC Residential Properties 278,043 1.59%4 County of Orange Government 169,625 0.97%5 Laguna Beach Resorts-LLC Hotel 165,962 0.95%6 Niguel Shores Community Association Homeowners' Association 158,745 0.91%7 Ritz Carlton Hotel 129,529 0.74%8 Laguna Beach Golf & Bungalow Village, Hotel/Golf Course 126,679 0.72%9 Monarch Beach Resort and Spa Hotel 117,269 0.67%
10 Seascape Homeowners' Association Homeowners' Association 115,276 0.66%1,981,184$ 11.33%
FY 2009/2010 1
Customer Name Business TypeAnnual
Revenues% of Total Revenues
1 Monarch Beach Golf Links Golf Course 324,245$ 2.61%2 Niguel Shores Community Association Homeowners' Association 203,659 1.64%3 City of Dana Point Government 278,291 2.24%4 Monarch Beach Resort and Spa Hotel 179,294 1.45%5 County of Orange Government 233,524 1.88%7 Ritz Carlton Hotel 174,435 1.41%6 Laguna Beach Resorts-LLC Hotel 124,352 1.00%8 Headlands Reserve-LLC Real Estate 165,732 1.34%9 Seascape Homeowners' Association Homeowners' Association 142,077 1.15%
10 Niguel Beach Terrace Homeowners' Association 131,958 1.06%1,957,567$ 15.78%
1 Does not include assessments received through property taxes.
Source: District Billing System
South Coast Water DistrictTen Largest Water CustomersCurrent and Nine Years Ago
81

2019 2018 2017 2016 2015
Single Family Residence 1
Fixed -$ -$ -$ 446.46$ 446.46$
Variable Block Rate (Fixed) 2
Tier 1 - 0-5 CCF 638.00 597.00 554.00 - - Tier 2 - 6-10 CCF 695.00 650.00 603.00 - - Tier 3 - 11+ CCF 796.00 744.00 690.00 - -
Variable - - - 1.20 1.20 Multi-Family
Variable 1.19 1.11 1.03 1.20 1.20 Fixed 415.25 388.25 360.00 - -
Duplex - - - 296.53 296.53 Triplex - - - 309.89 309.89 Fourplex - - - 314.19 314.19 Multi-Plex - - - 231.91 231.91
CommercialVariable
Low Strength 7.87 7.36 6.83 - - Medium Strength 8.93 8.35 7.74 - - High Strength 11.53 10.78 9.99 - - Various Business Types - - - 6.54 to 8.31 6.54 to 8.31
Fixed - - - 446.46 446.46
(Continued)NOTES:
1 Fixed charges for single family residences are billed on an annual basis and collected with property tax payments. All variable rates are based on usage by centum cubic feet (CCF). One CCF equals 100 cubic feet or 748 gallons.
2 This new rate includes both variable and fixed charges based on a winter quarter average (average of prior year usageduring December, January, and February).
Source: District records
South Coast Water DistrictSewer Rates
Last Ten Fiscal Years
DescriptionFiscal Year
82
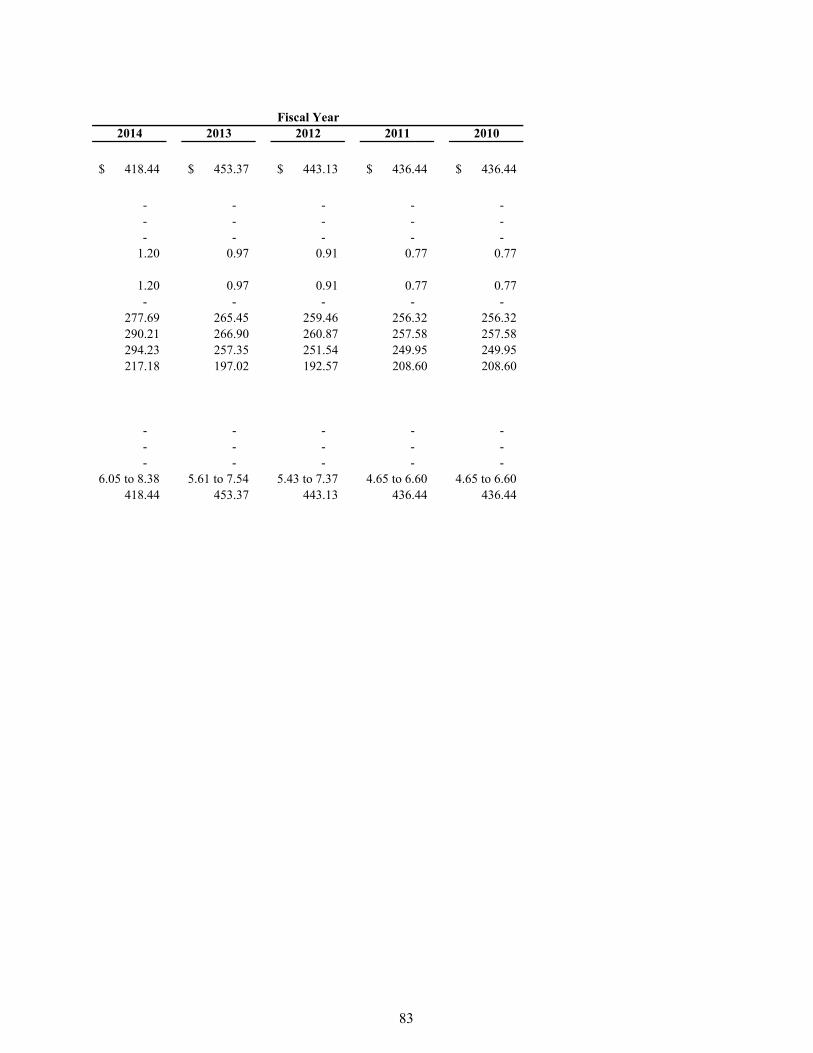
2014 2013 2012 2011 2010
418.44$ 453.37$ 443.13$ 436.44$ 436.44$
- - - - - - - - - - - - - - -
1.20 0.97 0.91 0.77 0.77
1.20 0.97 0.91 0.77 0.77 - - - - -
277.69 265.45 259.46 256.32 256.32 290.21 266.90 260.87 257.58 257.58 294.23 257.35 251.54 249.95 249.95 217.18 197.02 192.57 208.60 208.60
- - - - - - - - - - - - - - -
6.05 to 8.38 5.61 to 7.54 5.43 to 7.37 4.65 to 6.60 4.65 to 6.60418.44 453.37 443.13 436.44 436.44
Fiscal Year
83

FY 2018/2019
Customer Name Business TypeAnnual
Revenues% of Total Revenues
1 Laguna Beach Resorts-LLC Hotel 378,827$ 2.58%2 Ritz Carlton Hotel 318,689 2.17%3 Monarch Beach Resort and Spa Hotel 315,024 2.14%4 St Joseph Health Mission Hospital Hospital 135,818 0.92%5 Beachwood Mobile Home Park Mobile Home Park 132,840 0.90%6 Capistrano Unified School District Government 126,477 0.86%7 MMB Management LLC Residential Properties 108,676 0.74%8 Business Properties Residential Properties 102,257 0.70%9 St Apartments Apartments 92,804 0.63%
10 St Apartments LLC Apartments 63,654 0.43%1,775,066$ 12.08%
FY 2009/2010 1
Customer Name Business TypeAnnual
Revenues% of Total Revenues
1 Monarch Beach Resort and Spa Hotel 203,912$ 2.21%2 Ritz Carlton Hotel 195,806 2.12%3 South Coast Medical Center Hospital 143,490 1.56%4 Laguna Beach Resorts-LLC Hotel 118,929 1.29%5 Capo Unified School District Government 79,898 0.87%6 The Villas at Monarch Beach Apartments 28,604 0.31%7 Niguel Beach Terrace Homeowners' Association 22,832 0.25%8 Seascape Homeowners' Association Homeowners' Association 16,960 0.18%9 Mira Costa Homeowners' Association Homeowners' Association 14,119 0.15%
10 Monarch Hills Condominium Association Homeowners' Association 13,527 0.15%838,077$ 9.09%
1 Does not include assessments received through property taxes.
Source: District Billing System and Finance Department
South Coast Water DistrictTen Largest Sewer CustomersCurrent and Nine Years Ago
84
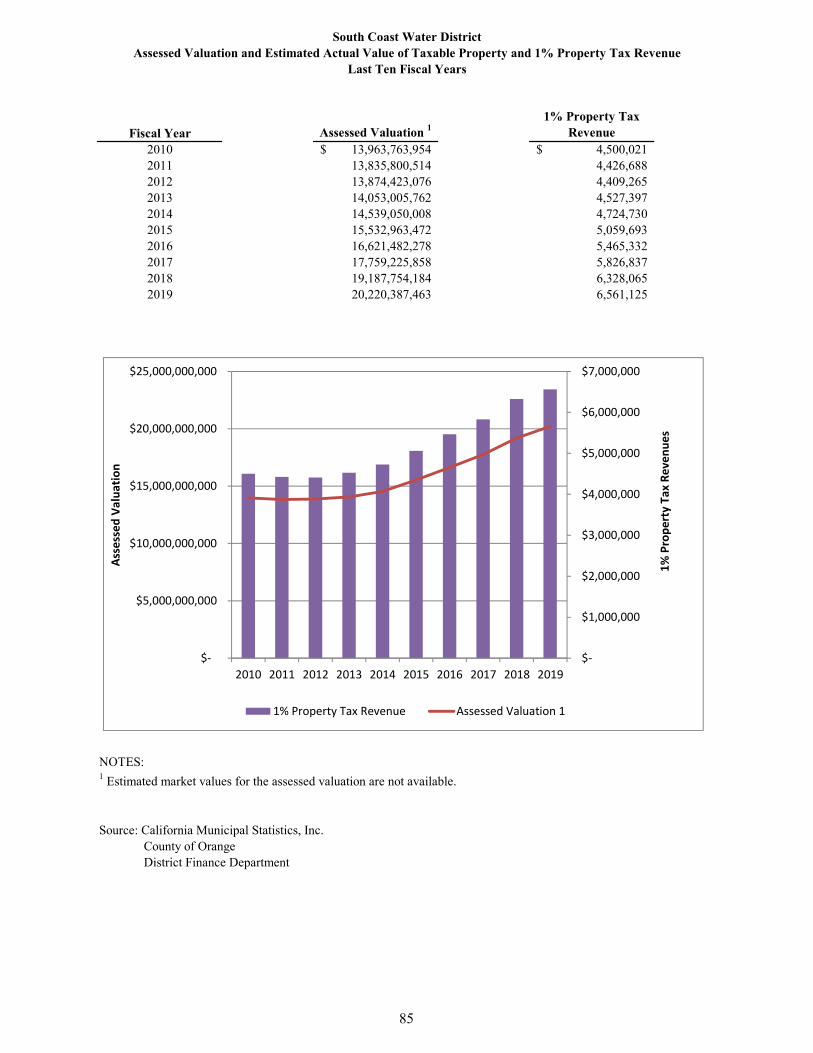
Fiscal Year Assessed Valuation 11% Property Tax
Revenue2010 13,963,763,954$ 4,500,021$ 2011 13,835,800,514 4,426,688 2012 13,874,423,076 4,409,265 2013 14,053,005,762 4,527,397 2014 14,539,050,008 4,724,730 2015 15,532,963,472 5,059,693 2016 16,621,482,278 5,465,332 2017 17,759,225,858 5,826,837 2018 19,187,754,184 6,328,065 2019 20,220,387,463 6,561,125
NOTES:1 Estimated market values for the assessed valuation are not available.
Source: California Municipal Statistics, Inc. County of Orange District Finance Department
South Coast Water District
Last Ten Fiscal YearsAssessed Valuation and Estimated Actual Value of Taxable Property and 1% Property Tax Revenue
$‐
$1,000,000
$2,000,000
$3,000,000
$4,000,000
$5,000,000
$6,000,000
$7,000,000
$‐
$5,000,000,000
$10,000,000,000
$15,000,000,000
$20,000,000,000
$25,000,000,000
2010 2011 2012 2013 2014 2015 2016 2017 2018 20191% Property Tax Revenues
Assessed Valuation
1% Property Tax Revenue Assessed Valuation 1
85

Agency/District Rate
Direct Rate:
South Coast Water District $0.00000
Overlapping Rates:
Capistrano Unified School District SFID No. 1 $0.00786 Laguna Beach Unified School District $0.01285 Metropolitan Water District $0.00350
Source: California Municipal Statistics, Inc.
Direct and Overlapping Property Tax RatesFiscal Year Ended June 30, 2019
South Coast Water District
86

FY 2018/2019
Property Owner Name Business Type
Assessed
Valuation 1
Percent of Total
Assessed Value
1 SHC Laguna Niguel 1 LLC Hotel 389,613,722$ 1.96%2 Monroe MBR LLC Hotel 318,590,239 1.60%3 MMB Management LLC Property 264,398,020 1.33%4 Regency Laguna LP Hotel 187,302,307 0.94%5 27 DBV Owner LLC Planned Residential Development 60,175,039 0.30%6 Fountains Sea Bluffs Owner NT-HCI LLC Commercial 56,203,396 0.28%7 Kenneth L. Wagner Jr. Trust Residential 42,546,561 0.21%8 William Lyon Homes Inc. Residential 37,258,346 0.19%9 ERGS Aim Hotel Realty LLC Hotel 35,391,613 0.18%
10 ST Apartments LLC Apartments 29,256,749 0.15%1,420,735,992$ 7.14%
FY 2009/2010
Property Owner Name Business Type
Assessed
Valuation 1
Percent of Total
Assessed Value
1 MMB Management LLC Residential Properties 307,841,932$ 2.27%2 SHC Laguna Niguel 1 LLC Hotel 209,605,395 1.54%3 Regency Laguna LP Hotel 188,560,260 1.39%4 CPH Monarch Hotel LLC Golf Resort 187,085,977 1.38%5 St. Apartments LLC Apartments 25,850,828 0.19%6 Theresa C. Morrison Commercial 24,487,588 0.18%7 Sunrise IV Sea Bluffs SL LP Commercial 24,224,985 0.18%8 Felcor Suites Ltd. Hotel 21,746,609 0.16%9 Doheny Estates LLC Commercial 17,883,898 0.13%
10 Headlands AM LLC Residential Properties 16,000,000 0.12%1,023,287,472$ 7.53%
NOTES:1 Local secured assessed valuations
Source: California Municipal Statistics, Inc.
South Coast Water DistrictPrincipal Property TaxpayersCurrent and Nine Years Ago
87

Fiscal Year
State Revolving Loans
General Obligation Bonds Revenue Bonds Total Debt
Per Connection Per Capita
2010 3,532,217$ 4,060,000$ 38,717,767$ 46,309,984$ 2,609$ 1,198$ 2011 3,180,750 3,153,542 37,744,698 44,078,990 2,482 1,163 2012 2,829,284 3,122,118 36,967,223 42,918,625 2,416 1,154 2013 2,477,818 2,584,310 35,699,038 40,761,166 2,308 1,118 2014 2,126,351 2,020,737 34,884,045 39,031,133 2,210 1,092 2015 1,774,884 1,442,164 34,026,532 37,243,580 2,104 1,064 2016 1,423,419 843,590 33,133,378 35,400,387 1,970 1,000 2017 1,071,952 220,000 33,501,237 34,793,189 1,955 971 2018 11,659,593 - 32,416,070 44,075,663 2,448 1,216 2019 12,633,761 - 57,910,851 70,544,612 3,701 1,925
Sources: District Audited Financial Statements District billing system Demographics data
Totals
South Coast Water DistrictRatio of Outstanding Debt
Last Ten Fiscal Years
$‐
$20,000,000
$40,000,000
$60,000,000
$80,000,000
2010 2011 2012 2013 2014 2015 2016 2017 2018 2019
Composition of Debt
Revenue Bonds
State Revolving Loans
General Obligation Bonds
$‐
$500
$1,000
$1,500
$2,000
$2,500
$3,000
$3,500
$4,000
2010 2011 2012 2013 2014 2015 2016 2017 2018 2019
Debt per Connection
88

Debt ServiceFiscal Operating & Net Coverage Year Revenues Maint. Costs 1 Revenues Principal Interest Total Ratio2010 26,093,497$ 21,742,844$ 4,350,653$ 1,732,758$ 897,212$ 2,629,970$ 1.652011 25,646,553 21,514,091 4,132,462 1,103,398 1,036,733 2,140,131 1.932012 34,082,981 22,613,046 11,469,935 1,179,038 1,669,152 2,848,190 4.032013 35,278,450 23,443,418 11,835,032 1,721,558 1,686,131 3,407,689 3.472014 37,872,355 24,368,303 13,504,052 1,757,198 1,679,104 3,436,302 3.932015 38,071,049 24,410,343 13,660,706 1,814,718 1,618,378 3,433,096 3.982016 35,440,172 26,867,564 8,572,608 1,870,358 1,561,255 3,431,613 2.502017 36,150,005 27,496,480 8,653,525 2,094,758 1,310,775 3,405,533 2.542018 40,740,301 29,795,181 10,945,120 1,630,398 1,319,362 2,949,760 3.712019 45,135,550 36,568,899 8,566,651 1,273,078 2,028,192 3,301,270 2.59
NOTES:1 Excludes depreciation and debt service payments
Source: Audited Financial StatementsDistrict Finance Department
South Coast Water DistrictDebt Coverage
Last Ten Fiscal Years
89

Fiscal YearTotal Annual Debt Service
Total General Expenditures
Ratio of Total Annual Debt Service to Total General Expenditures
2010 2,629,969$ 27,666,607$ 9.5%2011 2,140,130 27,794,891 7.7%2012 2,848,190 28,925,240 9.8%2013 3,407,688 30,778,078 11.1%2014 3,436,302 30,926,862 11.1%2015 3,433,095 31,162,648 11.0%2016 3,431,613 31,046,681 11.1%2017 3,405,533 33,928,717 10.0%2018 2,949,760 35,649,289 8.3%2019 3,301,270 39,422,843 8.4%
Source: District Finance Department District Audited Financial Statements
South Coast Water DistrictRatio of Annual Debt Service Expenditures to Total General Expenditures
Last Ten Fiscal Years
$‐
$5,000,000
$10,000,000
$15,000,000
$20,000,000
$25,000,000
$30,000,000
$35,000,000
$40,000,000
$45,000,000
2010 2011 2012 2013 2014 2015 2016 2017 2018 2019
Total GeneralExpenditures
Total AnnualDebt Service
90

YearEstimated District
Population
City of Dana Point
Population 1
City of Dana Point Personal Income
(in Millions) 1Personal Income
per Capita 1
2010 38,641 35,561 1,706$ 44,150$ 2011 37,914 35,109 1,816 47,898 2012 37,187 33,054 1,663 44,720 2013 36,460 33,398 1,723 47,257 2014 35,732 33,625 1,699 47,548 2015 35,004 33,710 1,649 47,109 2016 35,415 34,264 1,743 49,216 2017 35,828 34,902 1,811 50,547 2018 36,240 34,619 1,841 50,800
2019 36,651 34,249 4 N/A 5 N/A 5
Year PopulationUnemployment
RatePersonal Income (in Thousands)
Personal Income per Capita
2010 2/3 3,170,721 9.8% 150,467,328$ 47,455$
2011 2/3 3,192,916 8.7% 155,323,766 48,646
2012 2 3,182,171 7.9% 160,637,055 50,480
2013 2 3,055,792 8.5% 160,072,905 52,383 2014 3,081,804 6.2% 168,966,068 54,827 2015 3,113,991 5.4% 177,412,900 56,973 2016 3,132,681 4.6% 169,792,810 54,200 2017 3,194,024 3.2% 172,509,495 54,010 2018 3,221,103 3.1% 215,479,000 66,896
2019 3,222,498 3.0% N/A 5 N/A 5
NOTES: 1 City of Dana Point information has been used since approximately 90% of the District'scustomers are within its borders.
2 No personal income data was available for the County of Orange, so used State of
California data.3 No population data was available for County of Orange, used State of California data.4 Department of Finance data for January 1, 2018.5 Information not available.
Sources: District Infrastructure Master Plan Update 2017City of Dana Point Comprehensive Annual Financial ReportsCounty of Orange Comprehensive Annual Financial ReportsState of California, Employment Development DepartmentState of California, Department of Finance
County of Orange
South Coast Water District
South Coast Water DistrictDemographics
Last Ten Fiscal Years
91

% of Total % of TotalRank Employer Employees Labor Force Employees Labor Force
1 Ritz-Carlton-Laguna Niguel 970 5.39% 970 5.46%2 Capistrano Unified School District 954 5.31% 4,228 23.81%3 Monarch Beach Resort (Former St. Regis) 800 4.45% 800 4.51%4 Montage Laguna Beach 700 3.89% 780 4.39%5 Ritz-Carlton Hotel Co LLC 404 2.25% - 0.00%6 Mission Hospital 310 1.72% 565 3.18%7 Marriott-Laguna Cliffs Resort 250 1.39% 250 1.41%8 Dana Hills High School 249 1.38% 200 1.13%9 Wind & Sea Restaurant 150 0.83% 125 0.70%10 Harpoon Henry's Seafood Restaurant 150 0.83% 150 0.84%
Total 4,937 27.45% 8,068 45.44%
NOTES: 1 Most current available data is from 2018 Comprehensive Annual Financial Reports of cities noted below.
2 Data shown above for 2010 consists of information available for Fiscal Year 2019 top 10 employers only. Oldest available data is from 2014 for Montage Laguna Beach, Mission Hospital, and Dana Hills High School. Only included employers reported in 2018 Comprehensive Annual Financial Reports of the cities listed below.
Sources: City of Laguna Beach Comprehensive Annual Financial Reports City of Dana Point Comprehensive Annual Financial Reports City of San Juan Capistrano Comprehensive Annual Financial Reports City of San Clemente Comprehensive Annual Financial Reports
South Coast Water DistrictTen Largest Employers
2019 and Nine Years Ago
2019 1 2010 2
92

Fiscal YearSingle Family
ResidentialMulti-Family Residential
Commercial / Industrial
Irrigation / Other
Total Connections
2010 9,646 1,517 702 537 12,402 2011 9,658 1,518 679 541 12,396 2012 9,663 1,519 682 541 12,405 2013 9,627 1,572 778 716 12,693 2014 9,627 1,579 525 548 12,279 2015 9,636 1,588 526 654 12,404 2016 9,637 1,544 579 651 12,411 2017 9,673 1,584 513 704 12,474 2018 9,712 1,588 513 801 12,614 2019 9,767 1,591 510 822 12,690
Source: District Billing System
South Coast Water DistrictNumber of Water Connections
Last Ten Fiscal Years
‐
2,000
4,000
6,000
8,000
10,000
12,000
14,000
2010 2011 2012 2013 2014 2015 2016 2017 2018 2019
Irrigation / Other
Commercial / Industrial
Multi‐Family Residential
Single Family Residential
93

94
(This page intentionally left blank)

Fiscal YearSingle Family
ResidentialMulti-Family Residential
Commercial / Industrial Total Connections
2010 10,315 6,910 522 17,747 2011 10,318 6,915 525 17,758 2012 10,323 6,915 526 17,764 2013 10,205 6,917 536 17,658 2014 10,208 6,917 537 17,662 2015 10,209 6,953 540 17,702 2016 10,500 6,952 514 17,966 2017 10,336 6,951 514 17,801 2018 10,542 6,951 513 18,006 2019 11,591 6,958 510 19,059
Source: District Billing System
South Coast Water DistrictNumber of Sewer Connections
Last Ten Fiscal Years
‐
2,000
4,000
6,000
8,000
10,000
12,000
14,000
16,000
18,000
20,000
2010 2011 2012 2013 2014 2015 2016 2017 2018 2019
Commercial / Industrial
Multi‐Family Residential
Single Family Residential
95

2019 2018 2017 2016 2015
Water:Single Family Residential 10 10 9 12 12 Multi-Family Residential 22 22 22 23 26 Commercial/Industrial 64 66 64 58 77 Irrigation/Other 80 98 99 111 150
Total 176 196 194 204 265
Recycled Water:Irrigation/Other 143 177 155 160 198
Total 143 177 155 160 198
(Continued)Source: District Billing System
South Coast Water DistrictAverage Monthly Usage (in CCF)
Last Ten Fiscal Years
Customer TypeFiscal Year
96

2014 2013 2012 2011 2010
12 12 12 11 12 27 27 28 27 28 75 49 55 53 50
191 169 155 147 178
305 257 250 238 268
184 167 143 130 171
184 167 143 130 171
Fiscal Year
97

98
(This page intentionally left blank)
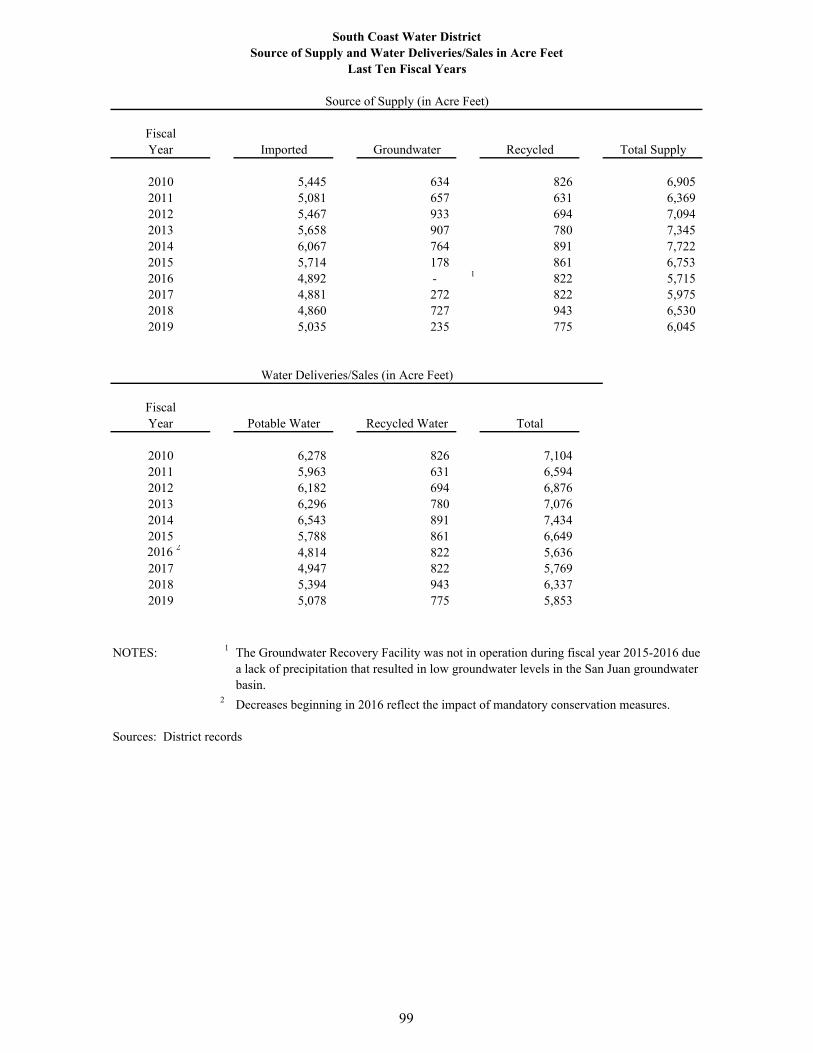
FiscalYear Imported Groundwater Recycled Total Supply
2010 5,445 634 826 6,905 2011 5,081 657 631 6,369 2012 5,467 933 694 7,094 2013 5,658 907 780 7,345 2014 6,067 764 891 7,722 2015 5,714 178 861 6,753 2016 4,892 - 1 822 5,715 2017 4,881 272 822 5,975 2018 4,860 727 943 6,530 2019 5,035 235 775 6,045
FiscalYear Potable Water Recycled Water Total
2010 6,278 826 7,104 2011 5,963 631 6,594 2012 6,182 694 6,876 2013 6,296 780 7,076 2014 6,543 891 7,434 2015 5,788 861 6,649
2016 2 4,814 822 5,636 2017 4,947 822 5,769 2018 5,394 943 6,337 2019 5,078 775 5,853
NOTES: 1 The Groundwater Recovery Facility was not in operation during fiscal year 2015-2016 due a lack of precipitation that resulted in low groundwater levels in the San Juan groundwaterbasin.
2 Decreases beginning in 2016 reflect the impact of mandatory conservation measures.
Sources: District records
Source of Supply (in Acre Feet)
South Coast Water DistrictSource of Supply and Water Deliveries/Sales in Acre Feet
Last Ten Fiscal Years
Water Deliveries/Sales (in Acre Feet)
99

2019 2018 2017 2016 2015
Potable SystemMiles of Water Line 158 158 158 158 158 Number of Storage Tanks 13 13 13 13 13 Maximum Storage (MG) 21.6 21.6 21.6 21.6 21.6 Capacity (MG) 50.0 50.0 50.0 50.0 50.0 Number of Pumping Plants 9 9 9 9 9 Number of Wells 1 1 1 1 1 Well Production Capacity (MGD) 0.85 0.85 0.85 0.85 0.85 Potable Treatment Plants 1 1 1 1 1
Non-Potable and Recycled SystemsMiles of Recycled Line 17 17 17 17 16 Number of Storage Tanks 3 3 3 3 3 Maximum Storage (MG) 3.7 3.7 3.7 3.7 3.7 Capacity (MG) 4.7 4.7 4.7 4.7 4.7 Number of Pumping Plants 3 3 3 3 3
Sewer SystemMiles of Sewer Line 141 141 141 141 140 Number of Lift Stations 13 13 13 13 13
(Continued)
NOTES: MG - Million GallonsMGD - Million Gallons per Day
Source: District Records
South Coast Water DistrictCapital Asset StatisticsLast Ten Fiscal Years
DescriptionFiscal Year
100

2014 2013 2012 2011 2010
158 158 158 158 158 13 13 13 13 13
21.6 21.6 21.6 21.6 21.6 50.0 50.0 50.0 31.4 31.4
9 9 9 9 9 1 1 1 1 1
0.85 0.85 0.85 0.85 0.85 1 1 1 1 1
15 15 15 15 15 3 3 3 3 3
3.7 3.7 3.7 3.7 3.7 4.7 4.7 4.7 4.7 4.7
3 3 3 3 3
140 140 140 140 140 14 14 14 14 14
Fiscal Year
101

Fiscal
Year Administration Executive Finance Engineering Operations JRWSS 2 Total
2010 26.0 2.0 - 11.0 42.0 5.0 86.0 2011 26.0 2.0 - 11.0 42.0 5.0 86.0 2012 27.0 2.0 - 11.0 41.0 5.0 86.0 2013 27.0 2.0 - 10.0 42.0 5.0 86.0 2014 27.0 2.0 - 10.0 42.0 6.0 87.0 2015 - 2.0 29.0 11.0 38.0 6.0 86.0 2016 - 2.0 30.0 11.0 38.0 6.0 87.0 2017 - 13.0 19.0 12.0 38.0 6.0 88.0 2018 - 16.0 16.0 9.0 41.0 6.0 88.0 2019 - 15.0 17.0 9.0 45.0 6.0 92.0
NOTE: 1 Number of employees in each department consist of authorized positions.2 Joint Regional Water Supply System personnel are employees of the District. Reimbursements are received from
Source: District Annual Budgets
South Coast Water DistrictNumber of EmployeesLast Ten Fiscal Years
Full Time Equivalent Employees by Department 1
Department
‐
10.0
20.0
30.0
40.0
50.0
60.0
70.0
80.0
90.0
100.0
2010 2011 2012 2013 2014 2015 2016 2017 2018 2019
JRWSS 2
Executive
Operations
Engineering
Finance
Administration
102