2017 comprehensive annual financial report · 2017 comprehensive annual financial ... his part of...
TRANSCRIPT


2017 COMPREHENSIVE ANNUAL FINANCIAL REPORTFor the Fiscal Year Ended June 30, 2017
Indiana Public Retirement System
225 Summary of Statistical Section226 Schedule of Changes and Growth in
Fiduciary Net Position227 Summary of Income Sources for a Ten-
Year Period228 Summary of Participating Employers229 Membership Data Summary233 Ratio of Active Members to Annuitants234 Pension Benefits by Indiana County235 Retirees by Geographical Location236 Summary of Defined Benefit
Retirement Benefits
Public Employees’ Retirement Fund
237 Schedule of Changes and Growth in Fiduciary Net Position
238 Schedule of Historical Contribution Rates
239 Ratio of Active Members to Annuitants240 Schedule of Benefit Recipients by Type
of Benefit Option241 Schedule of Average Benefit Payments242 Schedule of Participating Employers:
Top 10
Teachers’ Pre-1996 Account
243 Schedule of Changes and Growth in Fiduciary Net Position
244 Ratio of Active Members to Annuitants245 Schedule of Benefit Recipients by Type
of Benefit Option246 Schedule of Average Benefit Payments247 Schedule of Participating Employers:
Top 10
Teachers’ 1996 Account
248 Schedule of Changes and Growth in Fiduciary Net Position
249 Schedule of Historical Contribution Rates
250 Ratio of Active Members to Annuitants251 Schedule of Benefit Recipients by Type
of Benefit Option252 Schedule of Average Benefit Payments253 Schedule of Participating Employers:
Top 10
1977 Police Officers’ and Firefighters’ Retirement Fund
254 Schedule of Changes and Growth in Fiduciary Net Position
255 Schedule of Historical Contribution Rates
256 Ratio of Active Members to Annuitants257 Schedule of Benefit Recipients by Type
of Benefit Option258 Schedule of Average Benefit Payments259 Schedule of Participating Employers:
Top 10
Judges’ Retirement System
260 Schedule of Changes and Growth in Fiduciary Net Position
261 Ratio of Active Members to Annuitants262 Schedule of Benefit Recipients by Type
of Benefit Option263 Schedule of Average Benefit Payments
Excise, Gaming and Conservation Officers’ Retirement Fund
264 Schedule of Changes and Growth in Fiduciary Net Position
265 Schedule of Historical Contribution Rates
266 Ratio of Active Members to Annuitants267 Schedule of Benefit Recipients by Type
of Benefit Option268 Schedule of Average Benefit Payments
Prosecuting Attorneys’ Retirement Fund
269 Schedule of Changes and Growth in Fiduciary Net Position
270 Ratio of Active Members to Annuitants271 Schedule of Benefit Recipients by Type
of Benefit Option272 Schedule of Average Benefit Payments
Legislators’ Defined Benefit Fund
273 Schedule of Changes and Growth in Fiduciary Net Position
274 Ratio of Active Members to Annuitants275 Schedule of Benefit Recipients by Type
of Benefit Option276 Schedule of Average Benefit Payments
Legislators’ Defined Contribution Fund
277 Schedule of Changes and Growth in Fiduciary Net Position
278 Schedule of Historical Contribution Rates
State Employees’ Death Benefit Fund
279 Schedule of Changes and Growth in Fiduciary Net Position
280 Schedule of Average Death Benefit Payments
Public Safety Officers’ Special Death Benefit Fund
281 Schedule of Changes and Growth in Fiduciary Net Position
282 Schedule of Average Death Benefit Payments
Local Public Safety Pension Relief Fund
283 Schedule of Average Death Benefit Payments
Statistical Section
Indiana Public Retirement System
STATISTICAL SECTION 225
Summary of Statistical Section
This part of the Comprehensive Annual Financial Report contains more detailed information regarding the financial
viability and pension benefit offerings for understanding the Financial Statements, Notes to the Financial Statements,
and Required Supplementary Information.
Financial Trends
The following schedules contain trends to assist in understanding changes over time in financial performance of each
retirement fund:
�� Schedule of Changes and Growth in Fiduciary Net Position
�� Schedule of Income Sources for a Ten-Year Period
�� Schedule of Historical Contribution Rates
Demographic and Economic Information
The following schedules contain benefit and member data to provide a better understanding of the benefit offerings of each
retirement fund:
�� Summary of Participating Employers
�� Membership Data Summary
�� Ratio of Active Members to Annuitants
�� Pension Benefits by Indiana County
�� Retirees by Geographical Location
�� Summary of Defined Benefit Retirement Benefits
�� Schedule of Benefit Recipients by Type of Benefit Option
�� Schedule of Average Benefit Payments
�� Schedule of Participating Employers: Top 10
�� Schedule of Average Death Benefit Payments
Indiana Public Retirement System
226 STATISTICAL SECTION
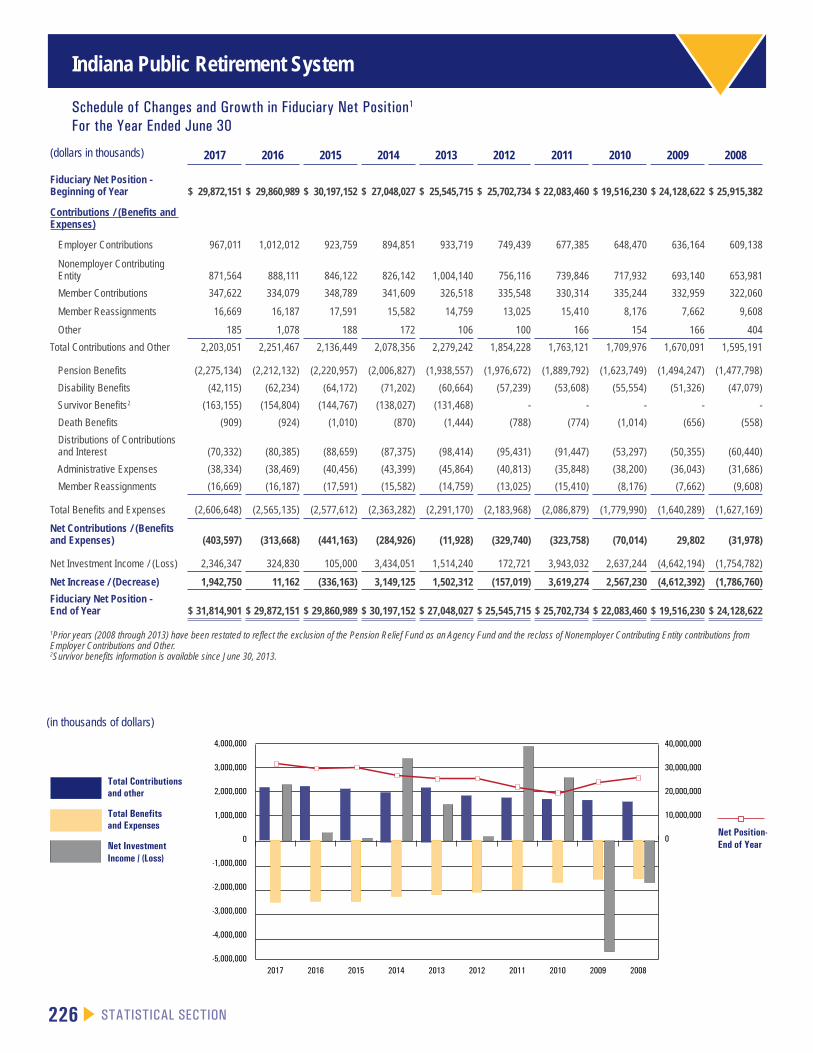
Schedule of Changes and Growth in Fiduciary Net Position1
For the Year Ended June 30
-5,000,000
-4,000,000
-3,000,000
-2,000,000
-1,000,000
0
1,000,000
2,000,000
3,000,000
4,000,000
2008200920102011201220132014201520162017
Net Position-End of Year
0
10,000,000
20,000,000
30,000,000
40,000,000
Total Contributionsand other
Total Benefitsand Expenses
Net InvestmentIncome / (Loss)
(in thousands of dollars)
(dollars in thousands) 2017 2016 2015 2014 2013 2012 2011 2010 2009 2008
Fiduciary Net Position - Beginning of Year $ 29,872,151 $ 29,860,989 $ 30,197,152 $ 27,048,027 $ 25,545,715 $ 25,702,734 $ 22,083,460 $ 19,516,230 $ 24,128,622 $ 25,915,382
Contributions / (Benefits and Expenses)
Employer Contributions 967,011 1,012,012 923,759 894,851 933,719 749,439 677,385 648,470 636,164 609,138
Nonemployer Contributing Entity 871,564 888,111 846,122 826,142 1,004,140 756,116 739,846 717,932 693,140 653,981
Member Contributions 347,622 334,079 348,789 341,609 326,518 335,548 330,314 335,244 332,959 322,060
Member Reassignments 16,669 16,187 17,591 15,582 14,759 13,025 15,410 8,176 7,662 9,608
Other 185 1,078 188 172 106 100 166 154 166 404
Total Contributions and Other 2,203,051 2,251,467 2,136,449 2,078,356 2,279,242 1,854,228 1,763,121 1,709,976 1,670,091 1,595,191
Pension Benefits (2,275,134) (2,212,132) (2,220,957) (2,006,827) (1,938,557) (1,976,672) (1,889,792) (1,623,749) (1,494,247) (1,477,798)
Disability Benefits (42,115) (62,234) (64,172) (71,202) (60,664) (57,239) (53,608) (55,554) (51,326) (47,079)
Survivor Benefits2 (163,155) (154,804) (144,767) (138,027) (131,468) - - - - -
Death Benefits (909) (924) (1,010) (870) (1,444) (788) (774) (1,014) (656) (558)
Distributions of Contributions and Interest (70,332) (80,385) (88,659) (87,375) (98,414) (95,431) (91,447) (53,297) (50,355) (60,440)
Administrative Expenses (38,334) (38,469) (40,456) (43,399) (45,864) (40,813) (35,848) (38,200) (36,043) (31,686)
Member Reassignments (16,669) (16,187) (17,591) (15,582) (14,759) (13,025) (15,410) (8,176) (7,662) (9,608)
Total Benefits and Expenses (2,606,648) (2,565,135) (2,577,612) (2,363,282) (2,291,170) (2,183,968) (2,086,879) (1,779,990) (1,640,289) (1,627,169)
Net Contributions / (Benefits and Expenses) (403,597) (313,668) (441,163) (284,926) (11,928) (329,740) (323,758) (70,014) 29,802 (31,978)
Net Investment Income / (Loss) 2,346,347 324,830 105,000 3,434,051 1,514,240 172,721 3,943,032 2,637,244 (4,642,194) (1,754,782)
Net Increase / (Decrease) 1,942,750 11,162 (336,163) 3,149,125 1,502,312 (157,019) 3,619,274 2,567,230 (4,612,392) (1,786,760)
Fiduciary Net Position - End of Year $ 31,814,901 $ 29,872,151 $ 29,860,989 $ 30,197,152 $ 27,048,027 $ 25,545,715 $ 25,702,734 $ 22,083,460 $ 19,516,230 $ 24,128,622
1Prior years (2008 through 2013) have been restated to reflect the exclusion of the Pension Relief Fund as an Agency Fund and the reclass of Nonemployer Contributing Entity contributions from Employer Contributions and Other.2Survivor benefits information is available since June 30, 2013.
Indiana Public Retirement System
STATISTICAL SECTION 227
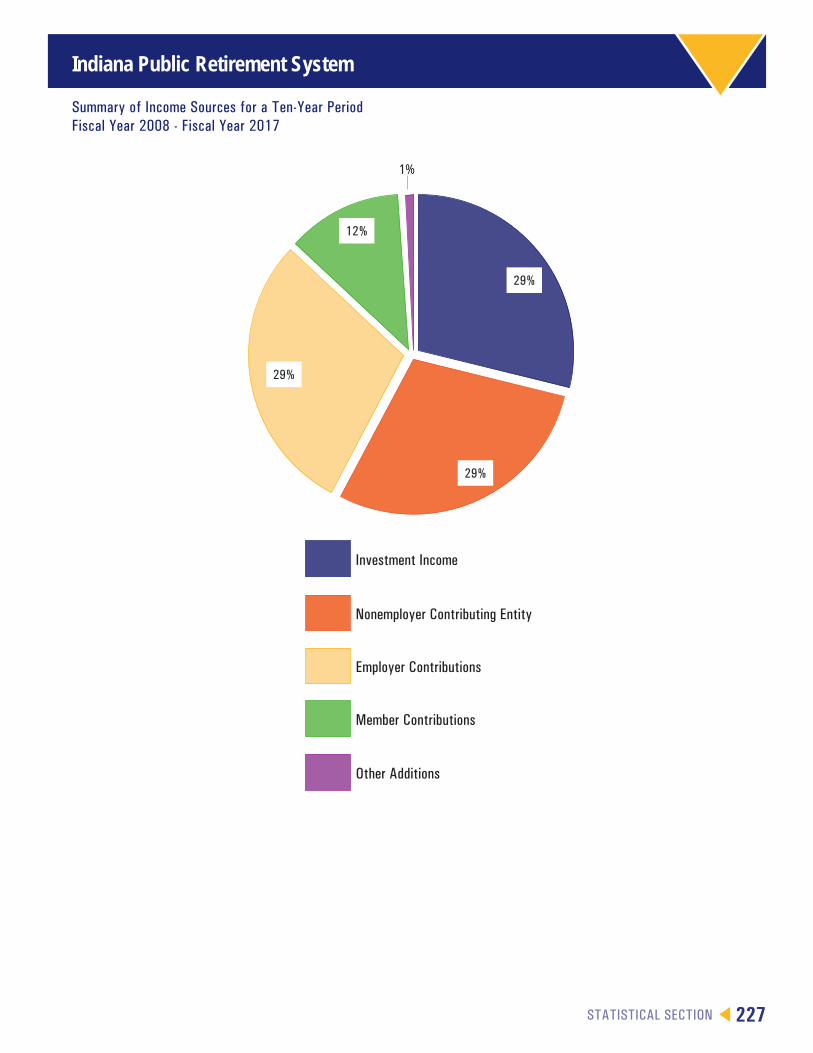
Summary of Income Sources for a Ten-Year PeriodFiscal Year 2008 - Fiscal Year 2017
Other Additions
Member Contributions
Employer Contributions
Nonemployer Contributing Entity
Investment Income
29%
29%
12%
29%
1%
Indiana Public Retirement System
228 STATISTICAL SECTION
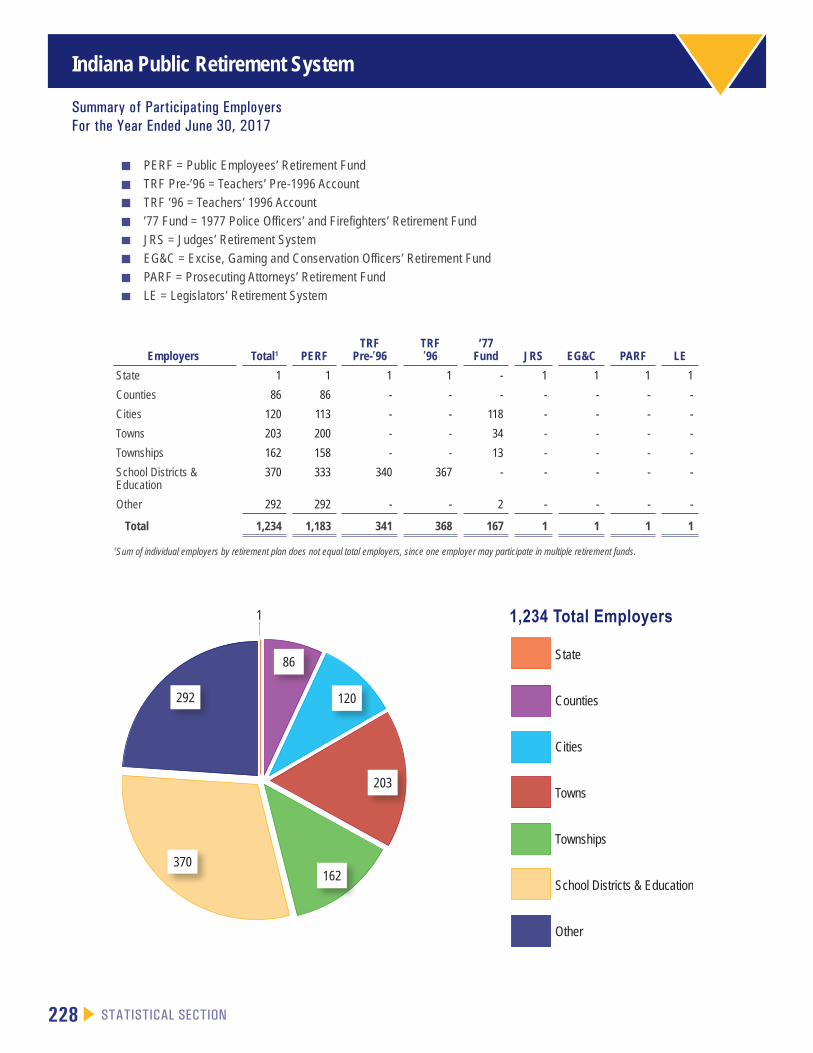
Summary of Participating EmployersFor the Year Ended June 30, 2017
�� PERF = Public Employees’ Retirement Fund
�� TRF Pre-’96 = Teachers’ Pre-1996 Account
�� TRF ’96 = Teachers’ 1996 Account
�� ’77 Fund = 1977 Police Officers’ and Firefighters’ Retirement Fund
�� JRS = Judges’ Retirement System
�� EG&C = Excise, Gaming and Conservation Officers’ Retirement Fund
�� PARF = Prosecuting Attorneys’ Retirement Fund
�� LE = Legislators’ Retirement System
Employers Total1 PERFTRF
Pre-’96TRF’96
’77 Fund JRS EG&C PARF LE
State 1 1 1 1 - 1 1 1 1
Counties 86 86 - - - - - - -
Cities 120 113 - - 118 - - - -
Towns 203 200 - - 34 - - - -
Townships 162 158 - - 13 - - - -
School Districts & Education
370 333 340 367 - - - - -
Other 292 292 - - 2 - - - -
Total 1,234 1,183 341 368 167 1 1 1 1
1Sum of individual employers by retirement plan does not equal total employers, since one employer may participate in multiple retirement funds.
1,234 Total Employers
State
Counties
Cities
Towns
Townships
School Districts & Education
Other
292
370162
203
120
86
1
Indiana Public Retirement System
STATISTICAL SECTION 229
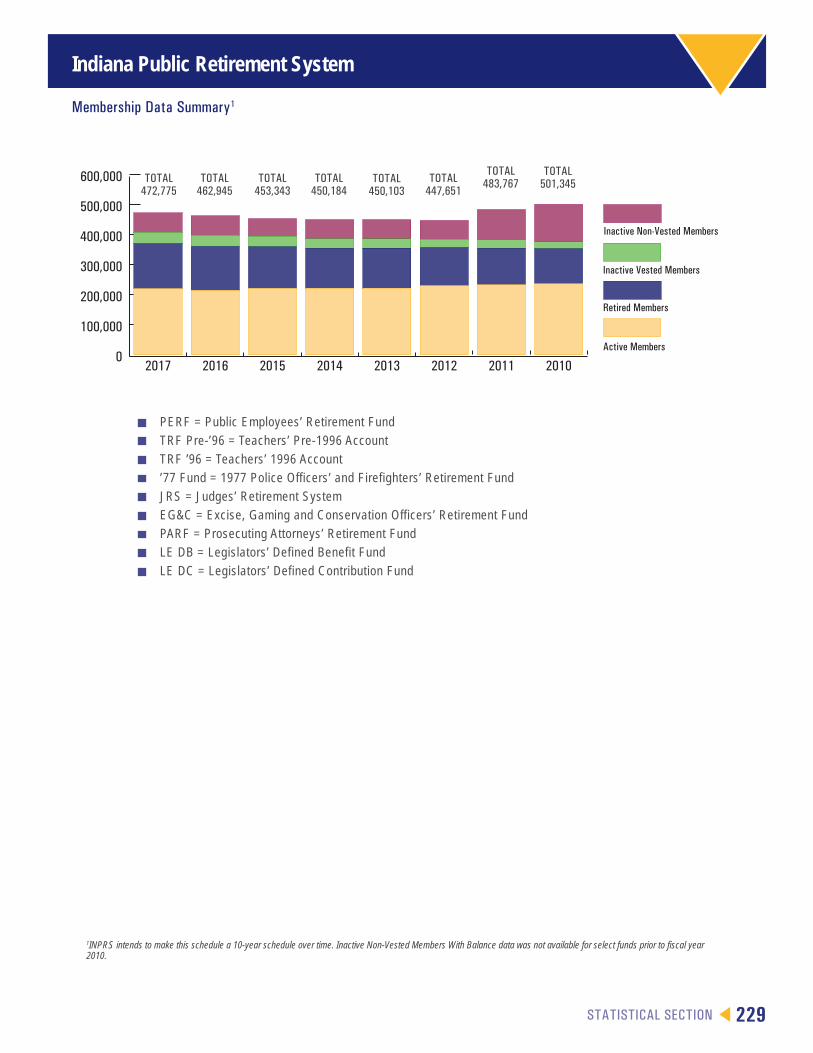
Membership Data Summary1
�� PERF = Public Employees’ Retirement Fund
�� TRF Pre-’96 = Teachers’ Pre-1996 Account
�� TRF ’96 = Teachers’ 1996 Account
�� ’77 Fund = 1977 Police Officers’ and Firefighters’ Retirement Fund
�� JRS = Judges’ Retirement System
�� EG&C = Excise, Gaming and Conservation Officers’ Retirement Fund
�� PARF = Prosecuting Attorneys’ Retirement Fund
�� LE DB = Legislators’ Defined Benefit Fund
�� LE DC = Legislators’ Defined Contribution Fund
0
100,000
200,000
300,000
400,000
500,000
600,000
Inactive Non-Vested Members
Inactive Vested Members
Retired Members
Active Members
20102011201220132014201520162017
TOTAL450,184
TOTAL450,103
TOTAL447,651
TOTAL483,767
TOTAL501,345TOTAL
453,343TOTAL
462,945TOTAL
472,775
1INPRS intends to make this schedule a 10-year schedule over time. Inactive Non-Vested Members With Balance data was not available for select funds prior to fiscal year 2010.
Indiana Public Retirement System
230 STATISTICAL SECTION
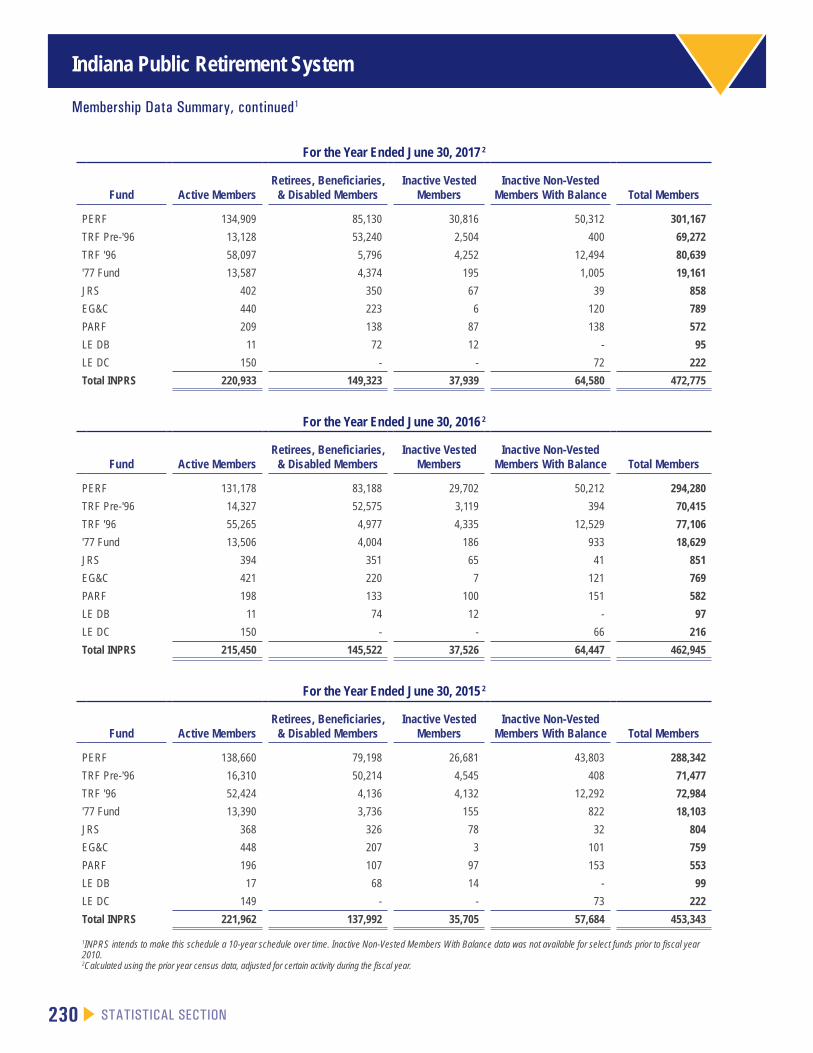
Membership Data Summary, continued1
For the Year Ended June 30, 2017 2
Fund Active MembersRetirees, Beneficiaries,
& Disabled MembersInactive Vested
MembersInactive Non-Vested
Members With Balance Total Members
PERF 134,909 85,130 30,816 50,312 301,167
TRF Pre-'96 13,128 53,240 2,504 400 69,272
TRF '96 58,097 5,796 4,252 12,494 80,639
'77 Fund 13,587 4,374 195 1,005 19,161
JRS 402 350 67 39 858
EG&C 440 223 6 120 789
PARF 209 138 87 138 572
LE DB 11 72 12 - 95
LE DC 150 - - 72 222
Total INPRS 220,933 149,323 37,939 64,580 472,775
For the Year Ended June 30, 2016 2
Fund Active MembersRetirees, Beneficiaries,
& Disabled MembersInactive Vested
MembersInactive Non-Vested
Members With Balance Total Members
PERF 131,178 83,188 29,702 50,212 294,280
TRF Pre-'96 14,327 52,575 3,119 394 70,415
TRF '96 55,265 4,977 4,335 12,529 77,106
'77 Fund 13,506 4,004 186 933 18,629
JRS 394 351 65 41 851
EG&C 421 220 7 121 769
PARF 198 133 100 151 582
LE DB 11 74 12 - 97
LE DC 150 - - 66 216
Total INPRS 215,450 145,522 37,526 64,447 462,945
For the Year Ended June 30, 2015 2
Fund Active MembersRetirees, Beneficiaries,
& Disabled MembersInactive Vested
MembersInactive Non-Vested
Members With Balance Total Members
PERF 138,660 79,198 26,681 43,803 288,342
TRF Pre-'96 16,310 50,214 4,545 408 71,477
TRF '96 52,424 4,136 4,132 12,292 72,984
'77 Fund 13,390 3,736 155 822 18,103
JRS 368 326 78 32 804
EG&C 448 207 3 101 759
PARF 196 107 97 153 553
LE DB 17 68 14 - 99
LE DC 149 - - 73 222
Total INPRS 221,962 137,992 35,705 57,684 453,343
1INPRS intends to make this schedule a 10-year schedule over time. Inactive Non-Vested Members With Balance data was not available for select funds prior to fiscal year 2010.2Calculated using the prior year census data, adjusted for certain activity during the fiscal year.
Indiana Public Retirement System
STATISTICAL SECTION 231
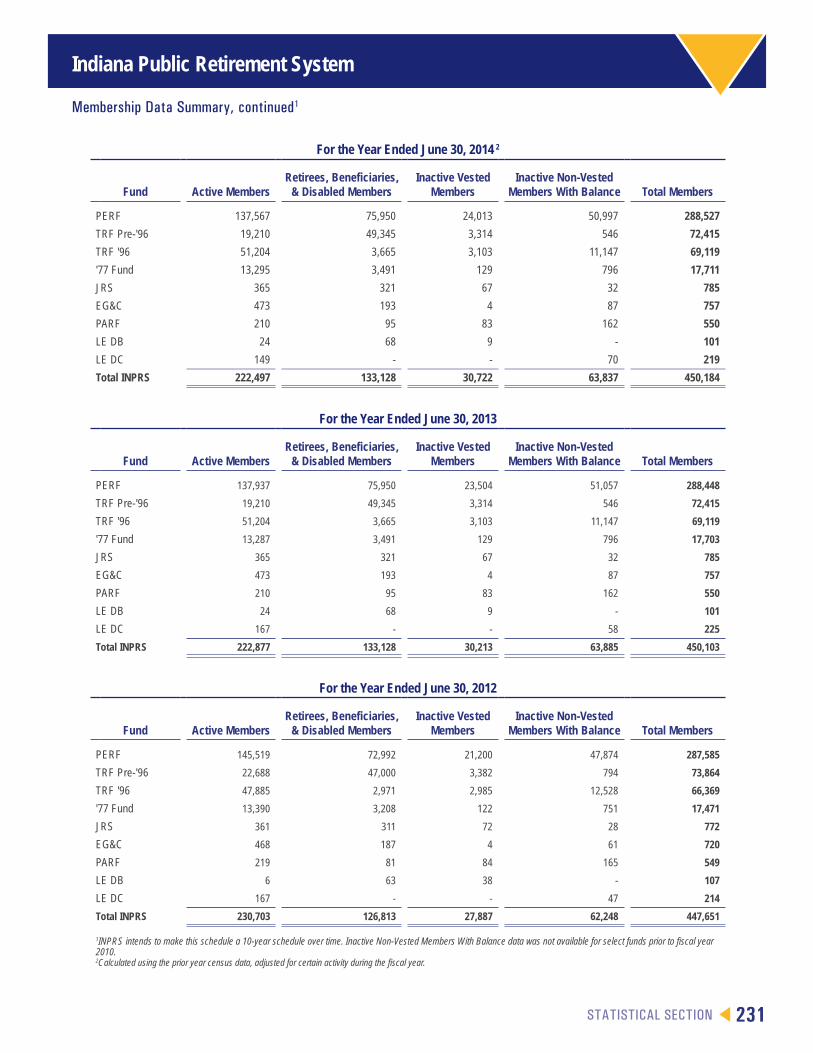
Membership Data Summary, continued1
For the Year Ended June 30, 2014 2
Fund Active MembersRetirees, Beneficiaries,
& Disabled MembersInactive Vested
MembersInactive Non-Vested
Members With Balance Total Members
PERF 137,567 75,950 24,013 50,997 288,527
TRF Pre-'96 19,210 49,345 3,314 546 72,415
TRF '96 51,204 3,665 3,103 11,147 69,119
'77 Fund 13,295 3,491 129 796 17,711
JRS 365 321 67 32 785
EG&C 473 193 4 87 757
PARF 210 95 83 162 550
LE DB 24 68 9 - 101
LE DC 149 - - 70 219
Total INPRS 222,497 133,128 30,722 63,837 450,184
For the Year Ended June 30, 2013
Fund Active MembersRetirees, Beneficiaries,
& Disabled MembersInactive Vested
MembersInactive Non-Vested
Members With Balance Total Members
PERF 137,937 75,950 23,504 51,057 288,448
TRF Pre-'96 19,210 49,345 3,314 546 72,415
TRF '96 51,204 3,665 3,103 11,147 69,119
'77 Fund 13,287 3,491 129 796 17,703
JRS 365 321 67 32 785
EG&C 473 193 4 87 757
PARF 210 95 83 162 550
LE DB 24 68 9 - 101
LE DC 167 - - 58 225
Total INPRS 222,877 133,128 30,213 63,885 450,103
For the Year Ended June 30, 2012
Fund Active MembersRetirees, Beneficiaries,
& Disabled MembersInactive Vested
MembersInactive Non-Vested
Members With Balance Total Members
PERF 145,519 72,992 21,200 47,874 287,585
TRF Pre-'96 22,688 47,000 3,382 794 73,864
TRF '96 47,885 2,971 2,985 12,528 66,369
'77 Fund 13,390 3,208 122 751 17,471
JRS 361 311 72 28 772
EG&C 468 187 4 61 720
PARF 219 81 84 165 549
LE DB 6 63 38 - 107
LE DC 167 - - 47 214
Total INPRS 230,703 126,813 27,887 62,248 447,651
1INPRS intends to make this schedule a 10-year schedule over time. Inactive Non-Vested Members With Balance data was not available for select funds prior to fiscal year 2010.2Calculated using the prior year census data, adjusted for certain activity during the fiscal year.
Indiana Public Retirement System
232 STATISTICAL SECTION
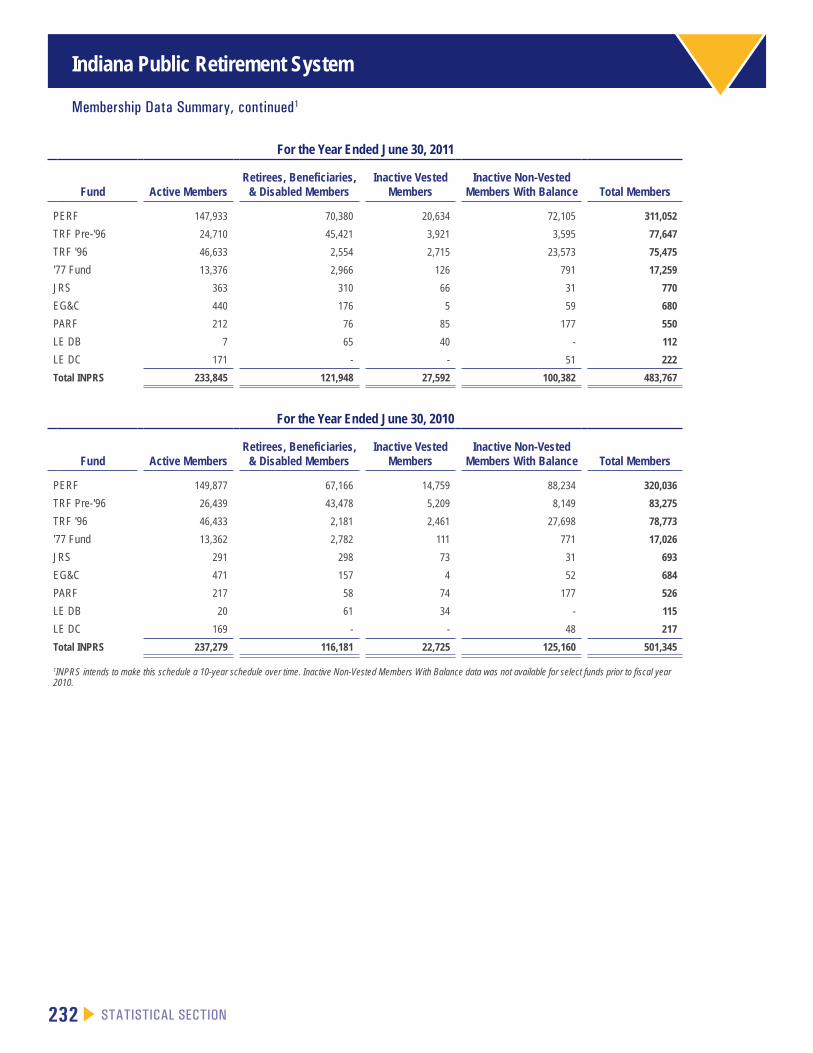
For the Year Ended June 30, 2011
Fund Active MembersRetirees, Beneficiaries,
& Disabled MembersInactive Vested
MembersInactive Non-Vested
Members With Balance Total Members
PERF 147,933 70,380 20,634 72,105 311,052
TRF Pre-'96 24,710 45,421 3,921 3,595 77,647
TRF '96 46,633 2,554 2,715 23,573 75,475
'77 Fund 13,376 2,966 126 791 17,259
JRS 363 310 66 31 770
EG&C 440 176 5 59 680
PARF 212 76 85 177 550
LE DB 7 65 40 - 112
LE DC 171 - - 51 222
Total INPRS 233,845 121,948 27,592 100,382 483,767
For the Year Ended June 30, 2010
Fund Active MembersRetirees, Beneficiaries,
& Disabled MembersInactive Vested
MembersInactive Non-Vested
Members With Balance Total Members
PERF 149,877 67,166 14,759 88,234 320,036
TRF Pre-'96 26,439 43,478 5,209 8,149 83,275
TRF '96 46,433 2,181 2,461 27,698 78,773
'77 Fund 13,362 2,782 111 771 17,026
JRS 291 298 73 31 693
EG&C 471 157 4 52 684
PARF 217 58 74 177 526
LE DB 20 61 34 - 115
LE DC 169 - - 48 217
Total INPRS 237,279 116,181 22,725 125,160 501,345
1INPRS intends to make this schedule a 10-year schedule over time. Inactive Non-Vested Members With Balance data was not available for select funds prior to fiscal year 2010.
Membership Data Summary, continued1
Indiana Public Retirement System
STATISTICAL SECTION 233
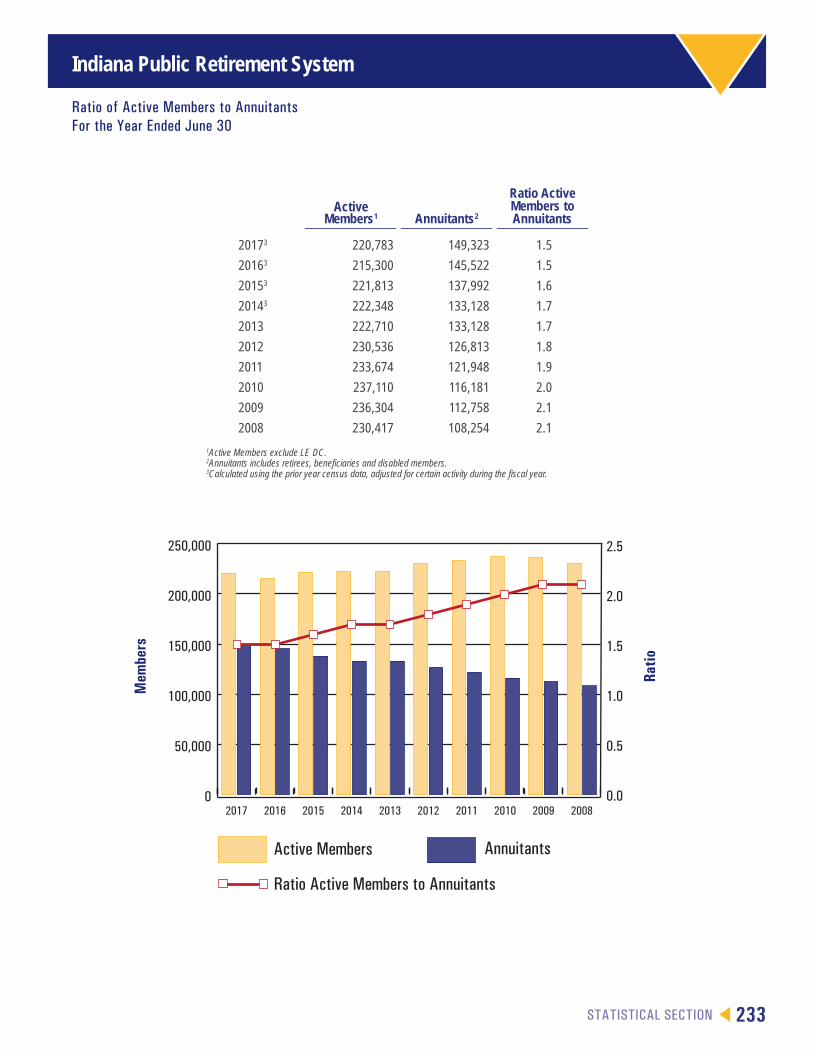
Ratio of Active Members to Annuitants For the Year Ended June 30
Active Members1 Annuitants2
Ratio Active Members to Annuitants
20173 220,783 149,323 1.5
20163 215,300 145,522 1.5
20153 221,813 137,992 1.6
20143 222,348 133,128 1.7
2013 222,710 133,128 1.7
2012 230,536 126,813 1.8
2011 233,674 121,948 1.9
2010 237,110 116,181 2.0
2009 236,304 112,758 2.1
2008 230,417 108,254 2.1
1Active Members exclude LE DC.2Annuitants includes retirees, beneficiaries and disabled members.3Calculated using the prior year census data, adjusted for certain activity during the fiscal year.
0
50,000
100,000
150,000
200,000
250,000
2008200920102011201220132014201520162017
Ratio Active Members to Annuitants
AnnuitantsActive Members
0.0
0.5
1.0
1.5
2.0
2.5
Mem
bers
Ratio
Indiana Public Retirement System
234 STATISTICAL SECTION
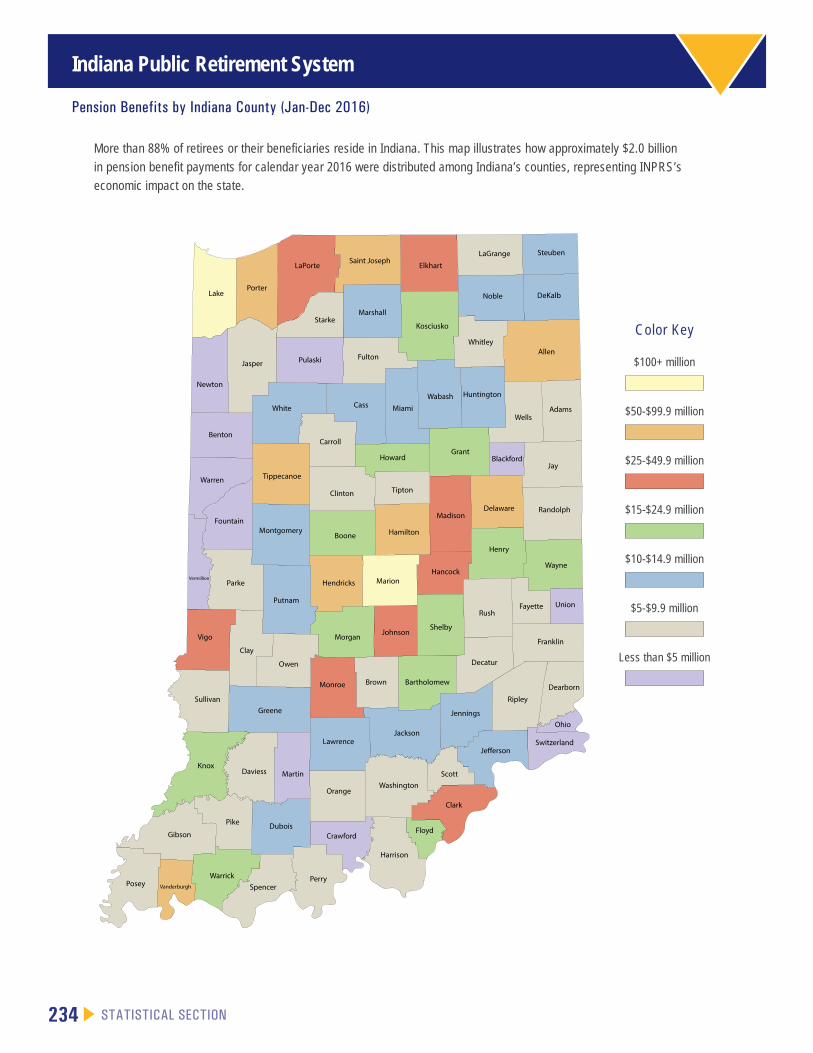
Pension Benefits by Indiana County (Jan-Dec 2016)
Color Key
$100+ million
$50-$99.9 million
$25-$49.9 million
$15-$24.9 million
$10-$14.9 million
$5-$9.9 million
Less than $5 million
More than 88% of retirees or their beneficiaries reside in Indiana. This map illustrates how approximately $2.0 billion
in pension benefit payments for calendar year 2016 were distributed among Indiana’s counties, representing INPRS’s
economic impact on the state.

Indiana Public Retirement System
STATISTICAL SECTION 235
Retirees by Geographical Location (December 2016)
Retirees outside the United States:
New Hampshire - 18Vermont - 12Massachusetts - 50Connecticut - 28Rhode Island - 16New Jersey - 33Delaware - 12Washington, D.C. - 13Maryland - 90
Maine32
New York77
Pennsylvania142
West Virginia
41Virginia
225
North Carolina 535
South Dakota - 52
Mississippi115
Texas - 813
South Carolina
429
Ohio796
Minnesota132
New Mexico - 111
Florida 5,171
Georgia559
Hawaii - 35
Alabama273
Michigan1,027
Colorado - 307
Oklahoma - 83
Kentucky 1,150
Tennessee - 822
Washington - 146
Indiana128,289
Iowa - 75
California467
North Dakota - 8
Arkansas 180
Wisconsin205
Illinois1,009
Arizona - 1,015
Montana - 47
Louisiana - 75
Kansas - 69
Oregon - 138
Missouri 232
Nebraska - 40
Utah - 57
Idaho - 39
Alaska - 20
Nevada - 233
Wyoming - 23
Color Key
1,000 +
500 – 999
100 - 499
0 – 99
Armed Forces, Pacific – 1
Australia – 1
Canada – 13
China – 1
Croatia – 2
Ecuador – 1
England – 2
France – 2
Germany – 4
Greece – 1
Hong Kong – 1
India – 1
Isle of Man – 1
Israel – 2
Jamaica – 1
Mexico – 1
Philippines – 1
Puerto Rico – 13
Romania – 1
Spain – 2
Thailand – 2
Turkmenistan – 1
Virgin Islands – 1
In the month of December 2016, more than 144 thousand retirees received benefits from INPRS.
Indiana Public Retirement System
236 STATISTICAL SECTION
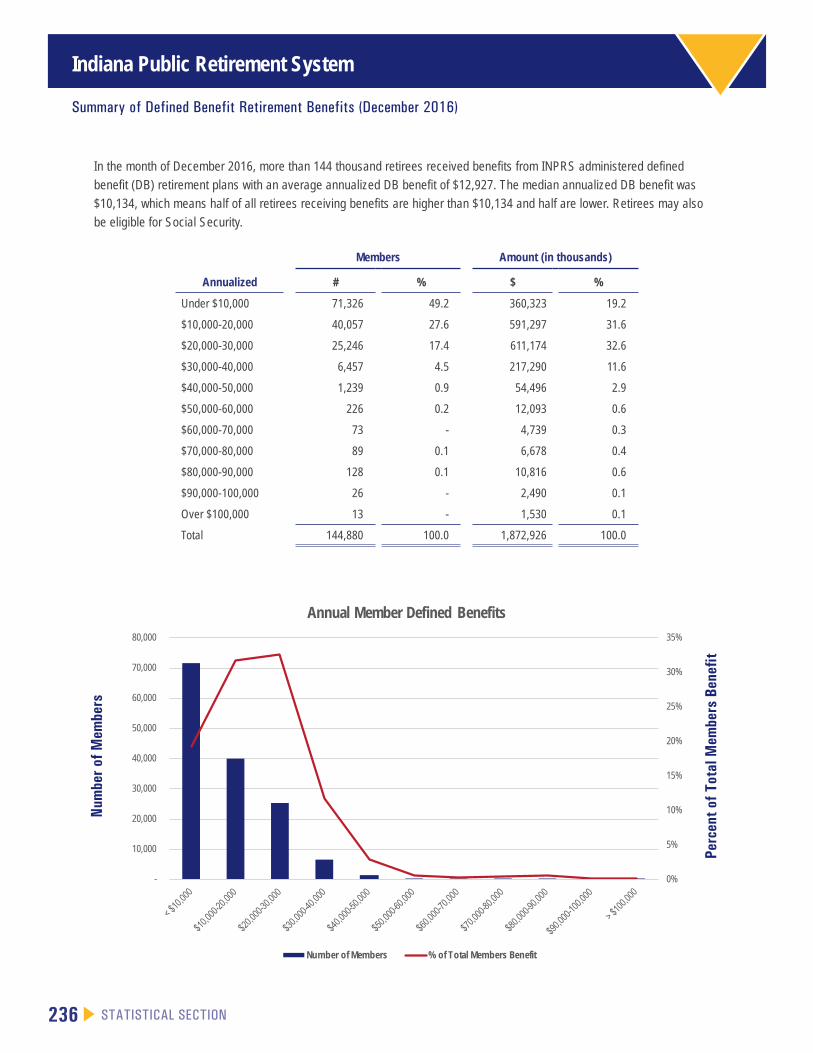
Summary of Defined Benefit Retirement Benefits (December 2016)
In the month of December 2016, more than 144 thousand retirees received benefits from INPRS administered defined
benefit (DB) retirement plans with an average annualized DB benefit of $12,927. The median annualized DB benefit was
$10,134, which means half of all retirees receiving benefits are higher than $10,134 and half are lower. Retirees may also
be eligible for Social Security.
Members Amount (in thousands)
Annualized # % $ %
Under $10,000 71,326 49.2 360,323 19.2
$10,000-20,000 40,057 27.6 591,297 31.6
$20,000-30,000 25,246 17.4 611,174 32.6
$30,000-40,000 6,457 4.5 217,290 11.6
$40,000-50,000 1,239 0.9 54,496 2.9
$50,000-60,000 226 0.2 12,093 0.6
$60,000-70,000 73 - 4,739 0.3
$70,000-80,000 89 0.1 6,678 0.4
$80,000-90,000 128 0.1 10,816 0.6
$90,000-100,000 26 - 2,490 0.1
Over $100,000 13 - 1,530 0.1
Total 144,880 100.0 1,872,926 100.0
0%
5%
10%
15%
20%
25%
30%
35%
-
10,000
20,000
30,000
40,000
50,000
60,000
70,000
80,000
Annual Member Defined Benefits
Number of Members % of Total Members Benefit
Num
ber o
f Mem
bers
Perc
ent o
f Tot
al M
embe
rs B
enefi
t
Public Employees’ Retirement Fund
STATISTICAL SECTION 237
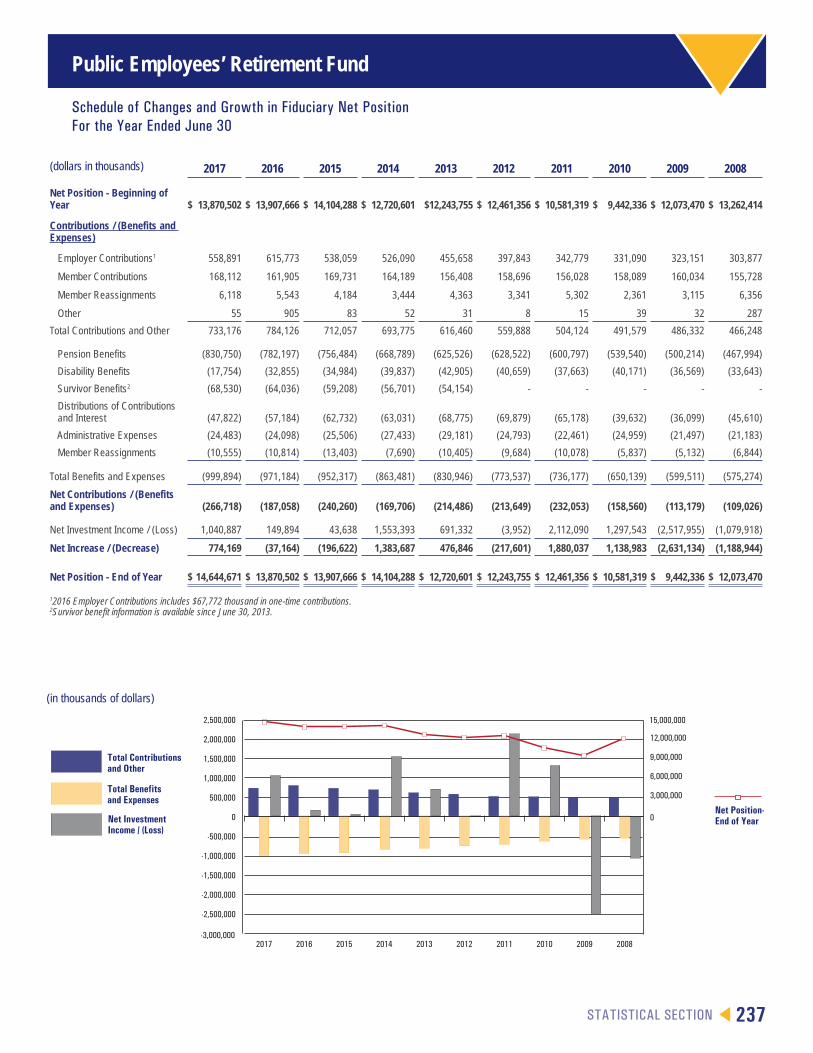
Schedule of Changes and Growth in Fiduciary Net Position For the Year Ended June 30
-3,000,000
-2,500,000
-2,000,000
-1,500,000
-1,000,000
-500,000
0
500,000
1,000,000
1,500,000
2,000,000
2,500,000
2008200920102011201220132014201520162017
0
3,000,000
6,000,000
9,000,000
12,000,000
15,000,000
Net Position-End of YearNet Investment
Income / (Loss)
Total Benefitsand Expenses
Total Contributionsand Other
(dollars in thousands) 2017 2016 2015 2014 2013 2012 2011 2010 2009 2008
Net Position - Beginning of Year $ 13,870,502 $ 13,907,666 $ 14,104,288 $ 12,720,601 $12,243,755 $ 12,461,356 $ 10,581,319 $ 9,442,336 $ 12,073,470 $ 13,262,414
Contributions / (Benefits and Expenses)
Employer Contributions1 558,891 615,773 538,059 526,090 455,658 397,843 342,779 331,090 323,151 303,877
Member Contributions 168,112 161,905 169,731 164,189 156,408 158,696 156,028 158,089 160,034 155,728
Member Reassignments 6,118 5,543 4,184 3,444 4,363 3,341 5,302 2,361 3,115 6,356
Other 55 905 83 52 31 8 15 39 32 287
Total Contributions and Other 733,176 784,126 712,057 693,775 616,460 559,888 504,124 491,579 486,332 466,248
Pension Benefits (830,750) (782,197) (756,484) (668,789) (625,526) (628,522) (600,797) (539,540) (500,214) (467,994)
Disability Benefits (17,754) (32,855) (34,984) (39,837) (42,905) (40,659) (37,663) (40,171) (36,569) (33,643)
Survivor Benefits2 (68,530) (64,036) (59,208) (56,701) (54,154) - - - - -
Distributions of Contributions and Interest (47,822) (57,184) (62,732) (63,031) (68,775) (69,879) (65,178) (39,632) (36,099) (45,610)
Administrative Expenses (24,483) (24,098) (25,506) (27,433) (29,181) (24,793) (22,461) (24,959) (21,497) (21,183)
Member Reassignments (10,555) (10,814) (13,403) (7,690) (10,405) (9,684) (10,078) (5,837) (5,132) (6,844)
Total Benefits and Expenses (999,894) (971,184) (952,317) (863,481) (830,946) (773,537) (736,177) (650,139) (599,511) (575,274)
Net Contributions / (Benefits and Expenses) (266,718) (187,058) (240,260) (169,706) (214,486) (213,649) (232,053) (158,560) (113,179) (109,026)
Net Investment Income / (Loss) 1,040,887 149,894 43,638 1,553,393 691,332 (3,952) 2,112,090 1,297,543 (2,517,955) (1,079,918)
Net Increase / (Decrease) 774,169 (37,164) (196,622) 1,383,687 476,846 (217,601) 1,880,037 1,138,983 (2,631,134) (1,188,944)
Net Position - End of Year $ 14,644,671 $ 13,870,502 $ 13,907,666 $ 14,104,288 $ 12,720,601 $ 12,243,755 $ 12,461,356 $ 10,581,319 $ 9,442,336 $ 12,073,470
12016 Employer Contributions includes $67,772 thousand in one-time contributions.2Survivor benefit information is available since June 30, 2013.
(in thousands of dollars)
Public Employees’ Retirement Fund
238 STATISTICAL SECTION
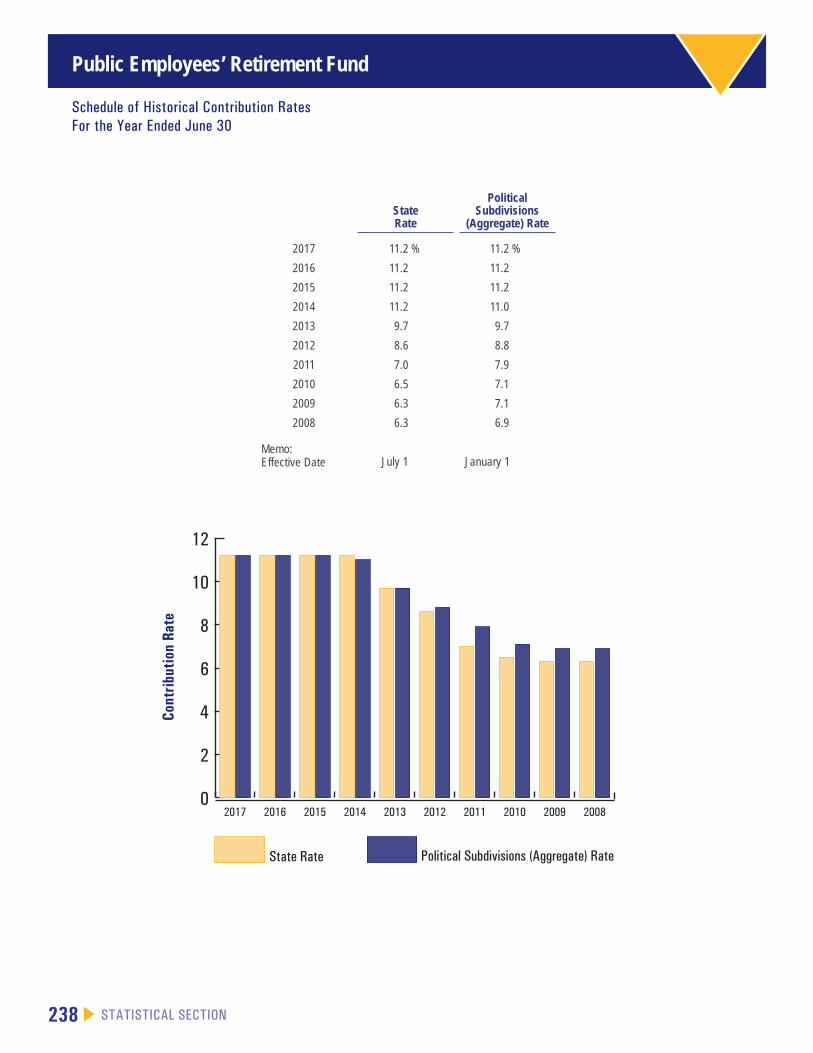
Schedule of Historical Contribution RatesFor the Year Ended June 30
StateRate
Political Subdivisions
(Aggregate) Rate
2017 11.2 % 11.2 %
2016 11.2 11.2
2015 11.2 11.2
2014 11.2 11.0
2013 9.7 9.7
2012 8.6 8.8
2011 7.0 7.9
2010 6.5 7.1
2009 6.3 7.1
2008 6.3 6.9
Memo:Effective Date July 1 January 1
0
2
4
6
8
10
12
2008200920102011201220132014201520162017
Political Subdivisions (Aggregate) RateState Rate
Cont
ribut
ion
Rate
Public Employees’ Retirement Fund
STATISTICAL SECTION 239
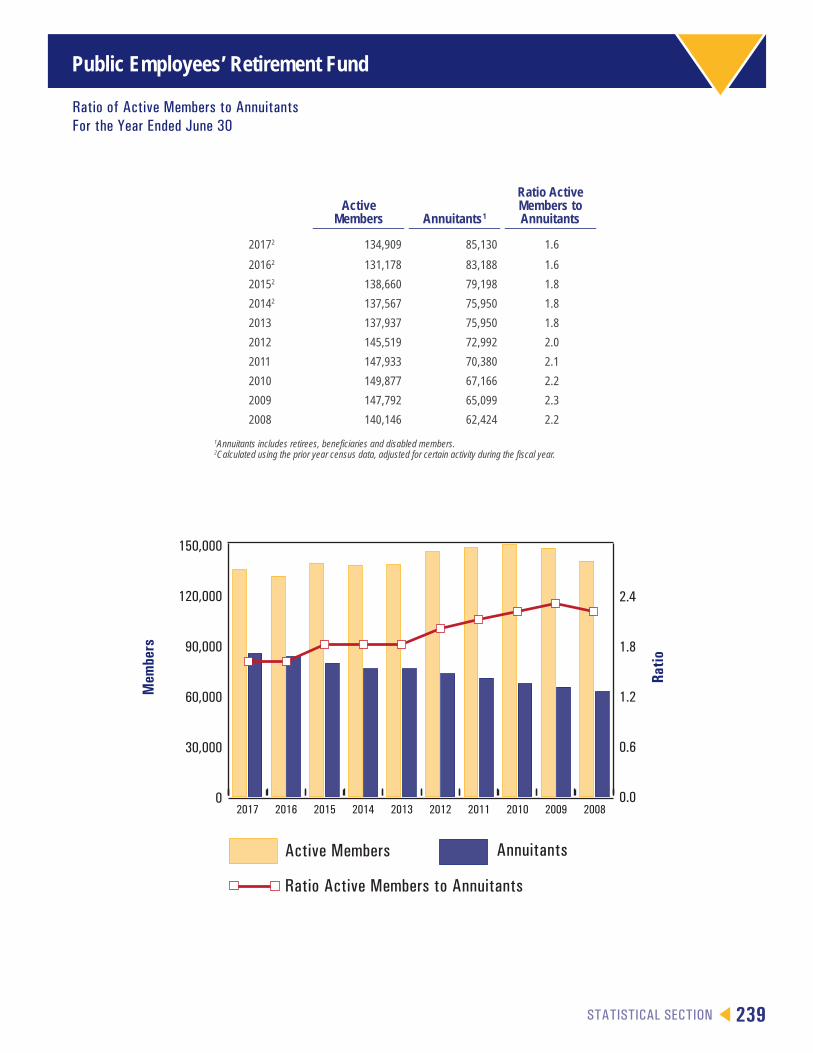
Ratio of Active Members to AnnuitantsFor the Year Ended June 30
0
30,000
60,000
90,000
120,000
150,000
20082009201020112012201320142015201620170.0
0.6
1.2
1.8
2.4
Ratio Active Members to Annuitants
AnnuitantsActive Members
Active Members Annuitants1
Ratio Active Members to Annuitants
20172 134,909 85,130 1.6
20162 131,178 83,188 1.6
20152 138,660 79,198 1.8
20142 137,567 75,950 1.8
2013 137,937 75,950 1.8
2012 145,519 72,992 2.0
2011 147,933 70,380 2.1
2010 149,877 67,166 2.2
2009 147,792 65,099 2.3
2008 140,146 62,424 2.2
1Annuitants includes retirees, beneficiaries and disabled members.2Calculated using the prior year census data, adjusted for certain activity during the fiscal year.
Mem
bers
Ratio
Public Employees’ Retirement Fund
240 STATISTICAL SECTION
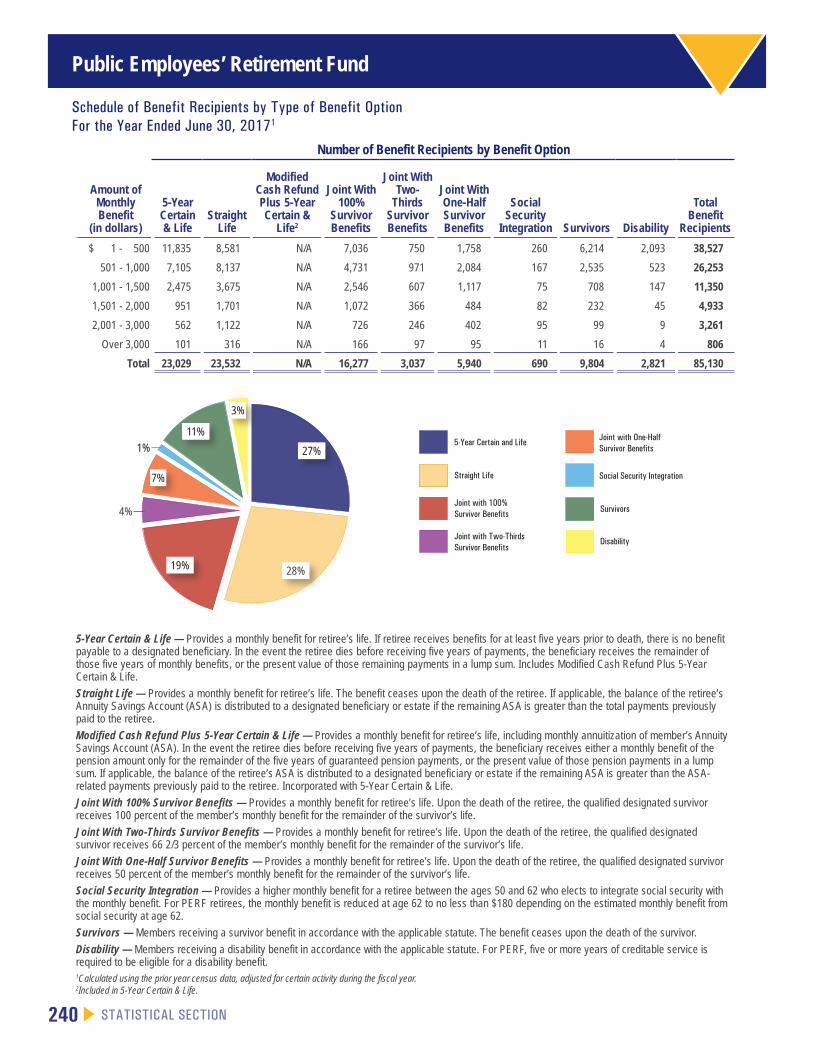
Schedule of Benefit Recipients by Type of Benefit OptionFor the Year Ended June 30, 20171
Number of Benefit Recipients by Benefit Option
Amount of Monthly Benefit
(in dollars)
5-Year Certain & Life
Straight Life
Modified Cash Refund Plus 5-Year Certain &
Life2
Joint With 100%
Survivor Benefits
Joint With Two-
Thirds Survivor Benefits
Joint With One-Half Survivor Benefits
Social Security
Integration Survivors Disability
Total Benefit
Recipients
$ 1 - 500 11,835 8,581 N/A 7,036 750 1,758 260 6,214 2,093 38,527
501 - 1,000 7,105 8,137 N/A 4,731 971 2,084 167 2,535 523 26,253
1,001 - 1,500 2,475 3,675 N/A 2,546 607 1,117 75 708 147 11,350
1,501 - 2,000 951 1,701 N/A 1,072 366 484 82 232 45 4,933
2,001 - 3,000 562 1,122 N/A 726 246 402 95 99 9 3,261
Over 3,000 101 316 N/A 166 97 95 11 16 4 806
Total 23,029 23,532 N/A 16,277 3,037 5,940 690 9,804 2,821 85,130
5-Year Certain & Life — Provides a monthly benefit for retiree’s life. If retiree receives benefits for at least five years prior to death, there is no benefit payable to a designated beneficiary. In the event the retiree dies before receiving five years of payments, the beneficiary receives the remainder of those five years of monthly benefits, or the present value of those remaining payments in a lump sum. Includes Modified Cash Refund Plus 5-Year Certain & Life.
Straight Life — Provides a monthly benefit for retiree’s life. The benefit ceases upon the death of the retiree. If applicable, the balance of the retiree’s Annuity Savings Account (ASA) is distributed to a designated beneficiary or estate if the remaining ASA is greater than the total payments previously paid to the retiree.
Modified Cash Refund Plus 5-Year Certain & Life — Provides a monthly benefit for retiree’s life, including monthly annuitization of member’s Annuity Savings Account (ASA). In the event the retiree dies before receiving five years of payments, the beneficiary receives either a monthly benefit of the pension amount only for the remainder of the five years of guaranteed pension payments, or the present value of those pension payments in a lump sum. If applicable, the balance of the retiree’s ASA is distributed to a designated beneficiary or estate if the remaining ASA is greater than the ASA-related payments previously paid to the retiree. Incorporated with 5-Year Certain & Life.
Joint With 100% Survivor Benefits — Provides a monthly benefit for retiree’s life. Upon the death of the retiree, the qualified designated survivor receives 100 percent of the member’s monthly benefit for the remainder of the survivor’s life.
Joint With Two-Thirds Survivor Benefits — Provides a monthly benefit for retiree’s life. Upon the death of the retiree, the qualified designated survivor receives 66 2/3 percent of the member’s monthly benefit for the remainder of the survivor’s life.
Joint With One-Half Survivor Benefits — Provides a monthly benefit for retiree’s life. Upon the death of the retiree, the qualified designated survivor receives 50 percent of the member’s monthly benefit for the remainder of the survivor’s life.
Social Security Integration — Provides a higher monthly benefit for a retiree between the ages 50 and 62 who elects to integrate social security with the monthly benefit. For PERF retirees, the monthly benefit is reduced at age 62 to no less than $180 depending on the estimated monthly benefit from social security at age 62.
Survivors — Members receiving a survivor benefit in accordance with the applicable statute. The benefit ceases upon the death of the survivor.
Disability — Members receiving a disability benefit in accordance with the applicable statute. For PERF, five or more years of creditable service is required to be eligible for a disability benefit.1Calculated using the prior year census data, adjusted for certain activity during the fiscal year. 2Included in 5-Year Certain & Life.
Joint with Two-Thirds Survivor Benefits
Joint with 100% Survivor Benefits
Straight Life
5-Year Certain and Life
Disability
Survivors
Social Security Integration
Joint with One-Half Survivor Benefits27%
28%19%
7%
4%
1%
11%
3%
Public Employees’ Retirement Fund
STATISTICAL SECTION 241
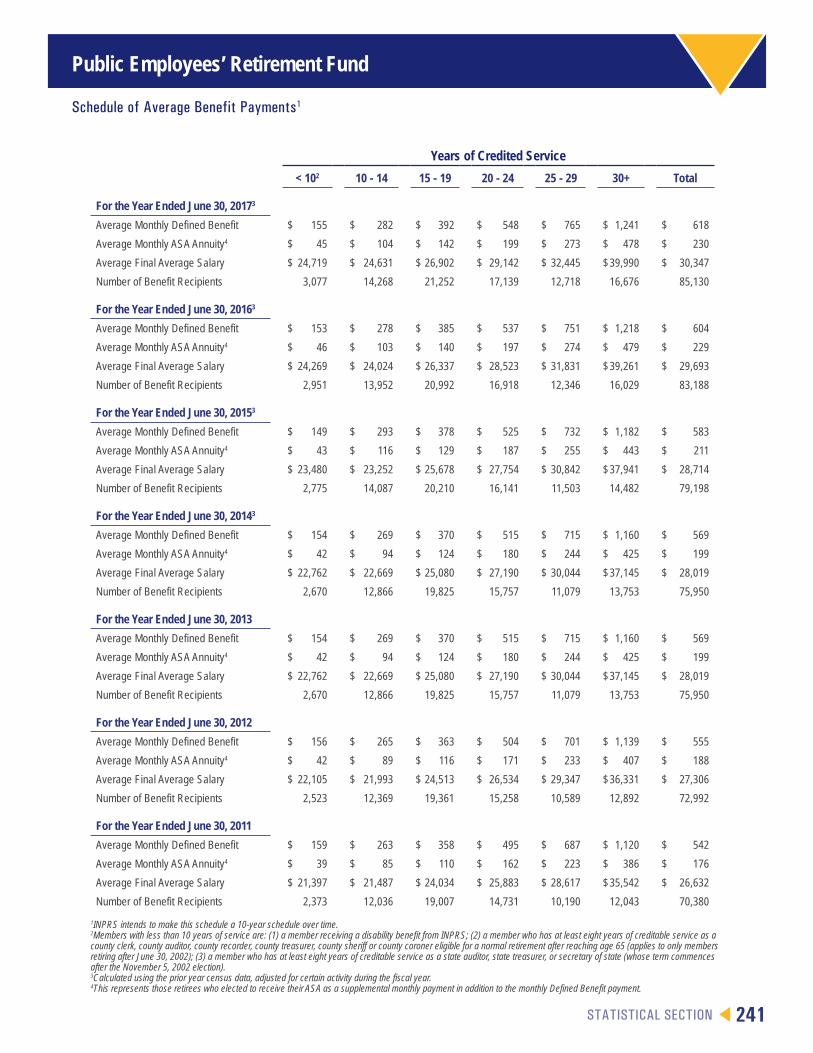
Schedule of Average Benefit Payments1
Years of Credited Service
< 102 10 - 14 15 - 19 20 - 24 25 - 29 30+ Total
For the Year Ended June 30, 20173
Average Monthly Defined Benefit $ 155 $ 282 $ 392 $ 548 $ 765 $ 1,241 $ 618
Average Monthly ASA Annuity4 $ 45 $ 104 $ 142 $ 199 $ 273 $ 478 $ 230
Average Final Average Salary $ 24,719 $ 24,631 $ 26,902 $ 29,142 $ 32,445 $ 39,990 $ 30,347
Number of Benefit Recipients 3,077 14,268 21,252 17,139 12,718 16,676 85,130
For the Year Ended June 30, 20163
Average Monthly Defined Benefit $ 153 $ 278 $ 385 $ 537 $ 751 $ 1,218 $ 604
Average Monthly ASA Annuity4 $ 46 $ 103 $ 140 $ 197 $ 274 $ 479 $ 229
Average Final Average Salary $ 24,269 $ 24,024 $ 26,337 $ 28,523 $ 31,831 $ 39,261 $ 29,693
Number of Benefit Recipients 2,951 13,952 20,992 16,918 12,346 16,029 83,188
For the Year Ended June 30, 20153
Average Monthly Defined Benefit $ 149 $ 293 $ 378 $ 525 $ 732 $ 1,182 $ 583
Average Monthly ASA Annuity4 $ 43 $ 116 $ 129 $ 187 $ 255 $ 443 $ 211
Average Final Average Salary $ 23,480 $ 23,252 $ 25,678 $ 27,754 $ 30,842 $ 37,941 $ 28,714
Number of Benefit Recipients 2,775 14,087 20,210 16,141 11,503 14,482 79,198
For the Year Ended June 30, 20143
Average Monthly Defined Benefit $ 154 $ 269 $ 370 $ 515 $ 715 $ 1,160 $ 569
Average Monthly ASA Annuity4 $ 42 $ 94 $ 124 $ 180 $ 244 $ 425 $ 199
Average Final Average Salary $ 22,762 $ 22,669 $ 25,080 $ 27,190 $ 30,044 $ 37,145 $ 28,019
Number of Benefit Recipients 2,670 12,866 19,825 15,757 11,079 13,753 75,950
For the Year Ended June 30, 2013
Average Monthly Defined Benefit $ 154 $ 269 $ 370 $ 515 $ 715 $ 1,160 $ 569
Average Monthly ASA Annuity4 $ 42 $ 94 $ 124 $ 180 $ 244 $ 425 $ 199
Average Final Average Salary $ 22,762 $ 22,669 $ 25,080 $ 27,190 $ 30,044 $ 37,145 $ 28,019
Number of Benefit Recipients 2,670 12,866 19,825 15,757 11,079 13,753 75,950
For the Year Ended June 30, 2012
Average Monthly Defined Benefit $ 156 $ 265 $ 363 $ 504 $ 701 $ 1,139 $ 555
Average Monthly ASA Annuity4 $ 42 $ 89 $ 116 $ 171 $ 233 $ 407 $ 188
Average Final Average Salary $ 22,105 $ 21,993 $ 24,513 $ 26,534 $ 29,347 $ 36,331 $ 27,306
Number of Benefit Recipients 2,523 12,369 19,361 15,258 10,589 12,892 72,992
For the Year Ended June 30, 2011
Average Monthly Defined Benefit $ 159 $ 263 $ 358 $ 495 $ 687 $ 1,120 $ 542
Average Monthly ASA Annuity4 $ 39 $ 85 $ 110 $ 162 $ 223 $ 386 $ 176
Average Final Average Salary $ 21,397 $ 21,487 $ 24,034 $ 25,883 $ 28,617 $ 35,542 $ 26,632
Number of Benefit Recipients 2,373 12,036 19,007 14,731 10,190 12,043 70,380
1INPRS intends to make this schedule a 10-year schedule over time.2Members with less than 10 years of service are: (1) a member receiving a disability benefit from INPRS; (2) a member who has at least eight years of creditable service as a county clerk, county auditor, county recorder, county treasurer, county sheriff or county coroner eligible for a normal retirement after reaching age 65 (applies to only members retiring after June 30, 2002); (3) a member who has at least eight years of creditable service as a state auditor, state treasurer, or secretary of state (whose term commences after the November 5, 2002 election).3Calculated using the prior year census data, adjusted for certain activity during the fiscal year.4This represents those retirees who elected to receive their ASA as a supplemental monthly payment in addition to the monthly Defined Benefit payment.
Public Employees’ Retirement Fund
242 STATISTICAL SECTION
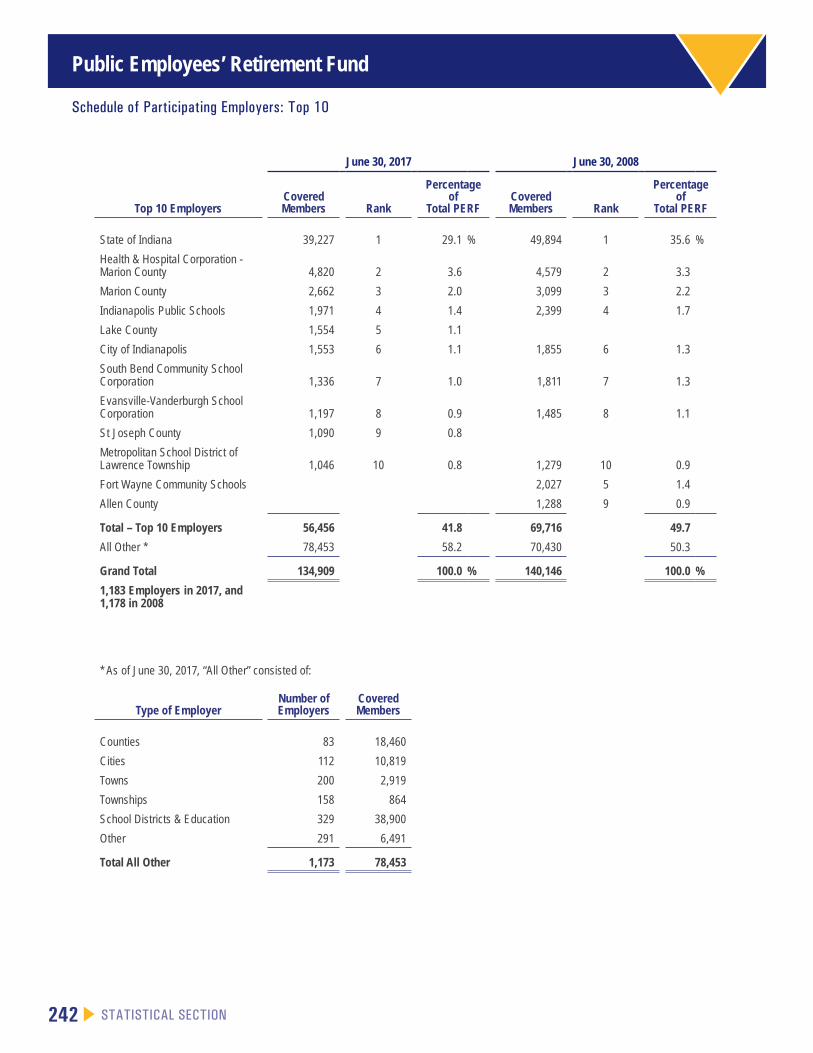
Schedule of Participating Employers: Top 10
June 30, 2017 June 30, 2008
Top 10 EmployersCovered Members Rank
Percentage of
Total PERFCovered Members Rank
Percentage of
Total PERF
State of Indiana 39,227 1 29.1 % 49,894 1 35.6 %
Health & Hospital Corporation - Marion County 4,820 2 3.6 4,579 2 3.3
Marion County 2,662 3 2.0 3,099 3 2.2
Indianapolis Public Schools 1,971 4 1.4 2,399 4 1.7
Lake County 1,554 5 1.1
City of Indianapolis 1,553 6 1.1 1,855 6 1.3
South Bend Community School Corporation 1,336 7 1.0 1,811 7 1.3
Evansville-Vanderburgh School Corporation 1,197 8 0.9 1,485 8 1.1
St Joseph County 1,090 9 0.8
Metropolitan School District of Lawrence Township 1,046 10 0.8 1,279 10 0.9
Fort Wayne Community Schools 2,027 5 1.4
Allen County 1,288 9 0.9
Total – Top 10 Employers 56,456 41.8 69,716 49.7
All Other * 78,453 58.2 70,430 50.3
Grand Total 134,909 100.0 % 140,146 100.0 %
1,183 Employers in 2017, and 1,178 in 2008
* As of June 30, 2017, “All Other” consisted of:
Type of EmployerNumber of Employers
Covered Members
Counties 83 18,460
Cities 112 10,819
Towns 200 2,919
Townships 158 864
School Districts & Education 329 38,900
Other 291 6,491
Total All Other 1,173 78,453
STATISTICAL SECTION 243
Teachers’ Pre-1996 Account
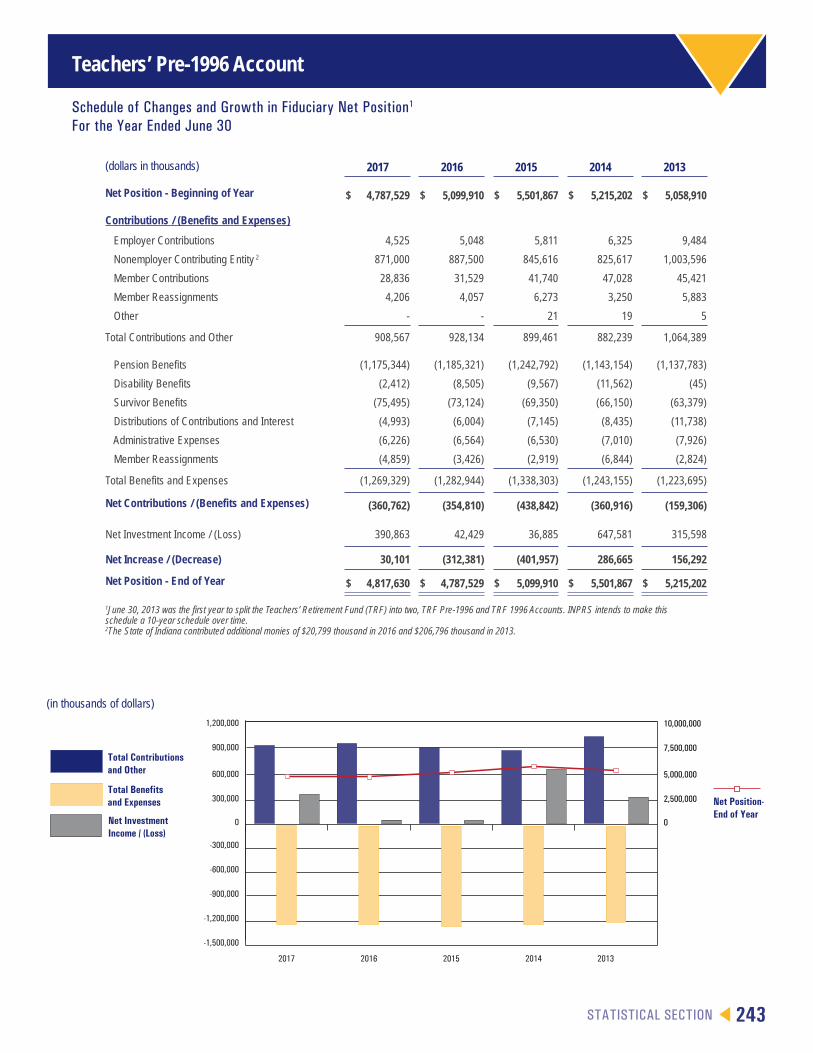
Schedule of Changes and Growth in Fiduciary Net Position1
For the Year Ended June 30
-1,500,000
-1,200,000
-900,000
-600,000
-300,000
0
300,000
600,000
900,000
2013
Net Position-End of Year
Net InvestmentIncome / (Loss)
Total Benefitsand Expenses
Total Contributionsand Other
1,200,000
2014201520162017
0
2,500,000
5,000,000
7,500,000
10,000,000
(dollars in thousands) 2017 2016 2015 2014 2013
Net Position - Beginning of Year $ 4,787,529 $ 5,099,910 $ 5,501,867 $ 5,215,202 $ 5,058,910
Contributions / (Benefits and Expenses)
Employer Contributions 4,525 5,048 5,811 6,325 9,484
Nonemployer Contributing Entity 2 871,000 887,500 845,616 825,617 1,003,596
Member Contributions 28,836 31,529 41,740 47,028 45,421
Member Reassignments 4,206 4,057 6,273 3,250 5,883
Other - - 21 19 5
Total Contributions and Other 908,567 928,134 899,461 882,239 1,064,389
Pension Benefits (1,175,344) (1,185,321) (1,242,792) (1,143,154) (1,137,783)
Disability Benefits (2,412) (8,505) (9,567) (11,562) (45)
Survivor Benefits (75,495) (73,124) (69,350) (66,150) (63,379)
Distributions of Contributions and Interest (4,993) (6,004) (7,145) (8,435) (11,738)
Administrative Expenses (6,226) (6,564) (6,530) (7,010) (7,926)
Member Reassignments (4,859) (3,426) (2,919) (6,844) (2,824)
Total Benefits and Expenses (1,269,329) (1,282,944) (1,338,303) (1,243,155) (1,223,695)
Net Contributions / (Benefits and Expenses) (360,762) (354,810) (438,842) (360,916) (159,306)
Net Investment Income / (Loss) 390,863 42,429 36,885 647,581 315,598
Net Increase / (Decrease) 30,101 (312,381) (401,957) 286,665 156,292
Net Position - End of Year $ 4,817,630 $ 4,787,529 $ 5,099,910 $ 5,501,867 $ 5,215,202
1June 30, 2013 was the first year to split the Teachers’ Retirement Fund (TRF) into two, TRF Pre-1996 and TRF 1996 Accounts. INPRS intends to make this schedule a 10-year schedule over time.2The State of Indiana contributed additional monies of $20,799 thousand in 2016 and $206,796 thousand in 2013.
(in thousands of dollars)

244 STATISTICAL SECTION
Teachers’ Pre-1996 Account
Ratio of Active Members to AnnuitantsFor the Year Ended June 30
0
10,000
20,000
30,000
40,000
50,000
60,000
2008200920102011201220132014201520162017
Ratio Active Members to Annuitants
AnnuitantsActive Members
0.00
0.25
0.50
0.75
1.00
1.25
1.50
Active Members Annuitants1
Ratio Active Members to Annuitants
20172 13,128 53,240 0.2
20162 14,327 52,575 0.3
20152 16,310 50,214 0.3
20142 19,210 49,345 0.4
2013 19,210 49,345 0.4
2012 22,688 47,000 0.5
2011 24,710 45,421 0.5
2010 26,439 43,478 0.6
2009 29,297 42,548 0.7
2008 34,628 40,554 0.9
1Annuitants includes retirees, beneficiaries and disabled members.2Calculated using the prior year census data, adjusted for certain activity during the fiscal year.
Mem
bers
Ratio
STATISTICAL SECTION 245
Teachers’ Pre-1996 Account
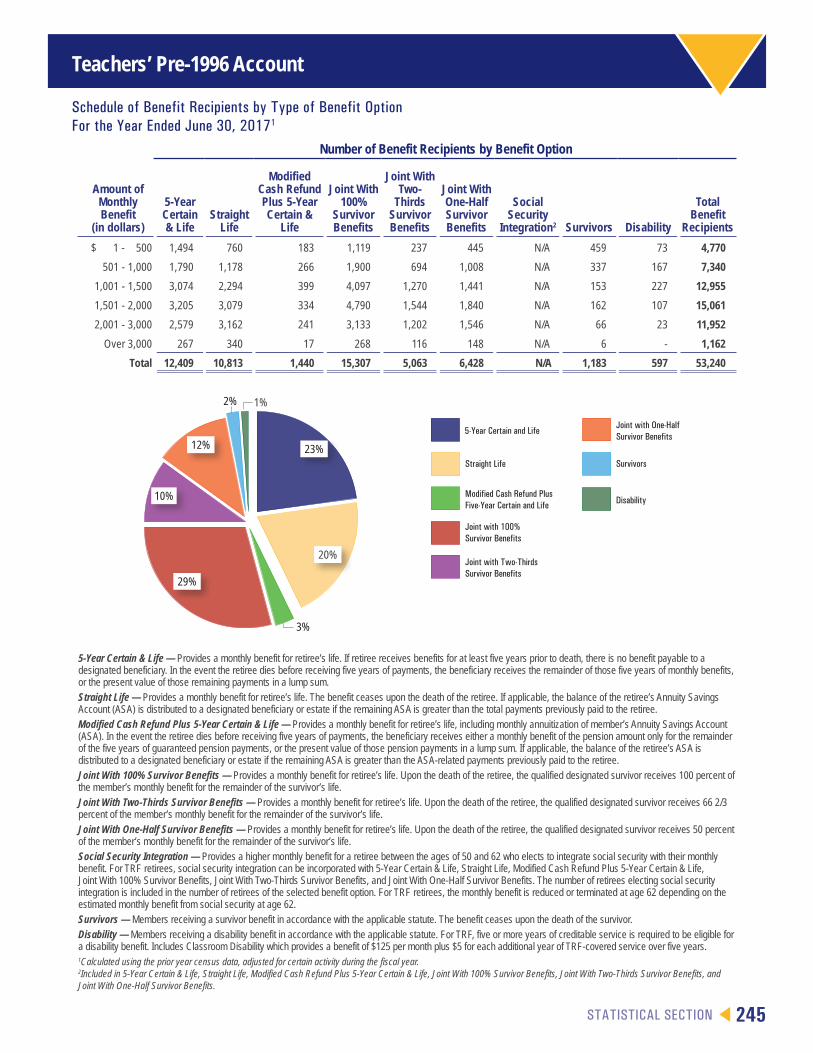
Schedule of Benefit Recipients by Type of Benefit OptionFor the Year Ended June 30, 20171
Number of Benefit Recipients by Benefit Option
Amount of Monthly Benefit
(in dollars)
5-Year Certain & Life
Straight Life
Modified Cash Refund Plus 5-Year Certain &
Life
Joint With 100%
Survivor Benefits
Joint With Two-
Thirds Survivor Benefits
Joint With One-Half Survivor Benefits
Social Security
Integration2 Survivors Disability
Total Benefit
Recipients
$ 1 - 500 1,494 760 183 1,119 237 445 N/A 459 73 4,770
501 - 1,000 1,790 1,178 266 1,900 694 1,008 N/A 337 167 7,340
1,001 - 1,500 3,074 2,294 399 4,097 1,270 1,441 N/A 153 227 12,955
1,501 - 2,000 3,205 3,079 334 4,790 1,544 1,840 N/A 162 107 15,061
2,001 - 3,000 2,579 3,162 241 3,133 1,202 1,546 N/A 66 23 11,952
Over 3,000 267 340 17 268 116 148 N/A 6 - 1,162
Total 12,409 10,813 1,440 15,307 5,063 6,428 N/A 1,183 597 53,240
5-Year Certain & Life — Provides a monthly benefit for retiree’s life. If retiree receives benefits for at least five years prior to death, there is no benefit payable to a designated beneficiary. In the event the retiree dies before receiving five years of payments, the beneficiary receives the remainder of those five years of monthly benefits, or the present value of those remaining payments in a lump sum.
Straight Life — Provides a monthly benefit for retiree’s life. The benefit ceases upon the death of the retiree. If applicable, the balance of the retiree’s Annuity Savings Account (ASA) is distributed to a designated beneficiary or estate if the remaining ASA is greater than the total payments previously paid to the retiree.
Modified Cash Refund Plus 5-Year Certain & Life — Provides a monthly benefit for retiree’s life, including monthly annuitization of member’s Annuity Savings Account (ASA). In the event the retiree dies before receiving five years of payments, the beneficiary receives either a monthly benefit of the pension amount only for the remainder of the five years of guaranteed pension payments, or the present value of those pension payments in a lump sum. If applicable, the balance of the retiree’s ASA is distributed to a designated beneficiary or estate if the remaining ASA is greater than the ASA-related payments previously paid to the retiree.
Joint With 100% Survivor Benefits — Provides a monthly benefit for retiree’s life. Upon the death of the retiree, the qualified designated survivor receives 100 percent of the member’s monthly benefit for the remainder of the survivor’s life.
Joint With Two-Thirds Survivor Benefits — Provides a monthly benefit for retiree’s life. Upon the death of the retiree, the qualified designated survivor receives 66 2/3 percent of the member’s monthly benefit for the remainder of the survivor’s life.
Joint With One-Half Survivor Benefits — Provides a monthly benefit for retiree’s life. Upon the death of the retiree, the qualified designated survivor receives 50 percent of the member’s monthly benefit for the remainder of the survivor’s life.
Social Security Integration — Provides a higher monthly benefit for a retiree between the ages of 50 and 62 who elects to integrate social security with their monthly benefit. For TRF retirees, social security integration can be incorporated with 5-Year Certain & Life, Straight Life, Modified Cash Refund Plus 5-Year Certain & Life, Joint With 100% Survivor Benefits, Joint With Two-Thirds Survivor Benefits, and Joint With One-Half Survivor Benefits. The number of retirees electing social security integration is included in the number of retirees of the selected benefit option. For TRF retirees, the monthly benefit is reduced or terminated at age 62 depending on the estimated monthly benefit from social security at age 62.
Survivors — Members receiving a survivor benefit in accordance with the applicable statute. The benefit ceases upon the death of the survivor.
Disability — Members receiving a disability benefit in accordance with the applicable statute. For TRF, five or more years of creditable service is required to be eligible for a disability benefit. Includes Classroom Disability which provides a benefit of $125 per month plus $5 for each additional year of TRF-covered service over five years.1Calculated using the prior year census data, adjusted for certain activity during the fiscal year.2Included in 5-Year Certain & Life, Straight Life, Modified Cash Refund Plus 5-Year Certain & Life, Joint With 100% Survivor Benefits, Joint With Two-Thirds Survivor Benefits, and Joint With One-Half Survivor Benefits.
Disability
Survivors
Joint with One-Half Survivor Benefits
Joint with Two-Thirds Survivor Benefits
Joint with 100% Survivor Benefits
Modified Cash Refund Plus Five-Year Certain and Life
Straight Life
5-Year Certain and Life
23%
20%
29%
10%
12%
1%
3%
2%

246 STATISTICAL SECTION
Teachers’ Pre-1996 Account
Schedule of Average Benefit Payments1
Years of Credited Service
< 102 10 - 14 15 - 19 20 - 24 25 - 29 30+ Total
For the Year Ended June 30, 20173
Average Monthly Defined Benefit $ 122 $ 270 $ 542 $ 897 $ 1,270 $ 1,869 $ 1,532
Average Monthly ASA Annuity4 $ 31 $ 198 $ 196 $ 270 $ 366 $ 604 $ 468
Average Final Average Salary $ 28,702 $ 23,692 $ 38,245 $ 47,641 $ 53,051 $ 59,073 $ 54,482
Number of Benefit Recipients 160 1,291 3,648 5,769 8,630 33,742 53,240
For the Year Ended June 30, 20163
Average Monthly Defined Benefit $ 577 $ 268 $ 539 $ 884 $ 1,247 $ 1,849 $ 1,512
Average Monthly ASA Annuity4 $ 249 $ 190 $ 191 $ 263 $ 357 $ 592 $ 458
Average Final Average Salary $ 23,593 $ 23,432 $ 37,605 $ 46,482 $ 51,701 $ 58,014 $ 53,393
Number of Benefit Recipients 49 1,279 3,755 5,766 8,540 33,186 52,575
For the Year Ended June 30, 20153
Average Monthly Defined Benefit $ 449 $ 263 $ 530 $ 854 $ 1,214 $ 1,811 $ 1,471
Average Monthly ASA Annuity5 $ 73 $ 113 $ 106 $ 133 $ 163 $ 228 $ 195
Average Final Average Salary $ 37,993 $ 23,424 $ 37,281 $ 45,256 $ 50,441 $ 56,938 $ 52,253
Number of Benefit Recipients 42 1,238 3,779 5,610 8,175 31,370 50,214
For the Year Ended June 30, 20143
Average Monthly Defined Benefit $ 405 $ 258 $ 517 $ 834 $ 1,187 $ 1,793 $ 1,453
Average Monthly ASA Annuity5 $ 57 $ 108 $ 104 $ 128 $ 159 $ 225 $ 191
Average Final Average Salary $ 24,193 $ 22,426 $ 35,702 $ 43,604 $ 48,801 $ 55,636 $ 50,855
Number of Benefit Recipients 36 1,185 3,720 5,541 7,987 30,876 49,345
For the Year Ended June 30, 2013
Average Monthly Defined Benefit $ 405 $ 258 $ 517 $ 834 $ 1,187 $ 1,793 $ 1,453
Average Monthly ASA Annuity5 $ 57 $ 108 $ 104 $ 128 $ 159 $ 225 $ 191
Average Final Average Salary $ 24,193 $ 22,426 $ 35,702 $ 43,604 $ 48,801 $ 55,636 $ 50,855
Number of Benefit Recipients 36 1,185 3,720 5,541 7,987 30,876 49,345
For the Year Ended June 30, 2012
Average Monthly Defined Benefit $ 311 $ 252 $ 503 $ 804 $ 1,150 $ 1,747 $ 1,405
Average Monthly ASA Annuity5 $ 14 $ 101 $ 101 $ 126 $ 156 $ 222 $ 187
Average Final Average Salary $ 23,116 $ 21,575 $ 34,714 $ 41,788 $ 47,172 $ 54,014 $ 49,136
Number of Benefit Recipients 39 1,178 3,719 5,366 7,672 29,026 47,000
For the Year Ended June 30, 2011
Average Monthly Defined Benefit $ 239 $ 250 $ 493 $ 785 $ 1,130 $ 1,722 $ 1,376
Average Monthly ASA Annuity5 $ 15 $ 99 $ 96 $ 125 $ 154 $ 220 $ 185
Average Final Average Salary $ 20,085 $ 21,205 $ 33,684 $ 40,472 $ 45,837 $ 52,751 $ 47,787
Number of Benefit Recipients 37 1,170 3,735 5,252 7,467 27,760 45,421
1INPRS intends to make this schedule a 10-year schedule over time.2Members with less than 10 years of service are primarily members receiving a disability benefit.3Calculated using the prior year census data, adjusted for certain activity during the fiscal year.4Represents the average of only the retirees who elected to receive their ASA as a supplemental monthly payment in addition to the monthly Defined Benefit payment.5Represents the average of all retirees, regardless if they elected to receive their ASA as a supplemental monthly payment in addition to the monthly Defined Benefit payment.
STATISTICAL SECTION 247
Teachers’ Pre-1996 Account
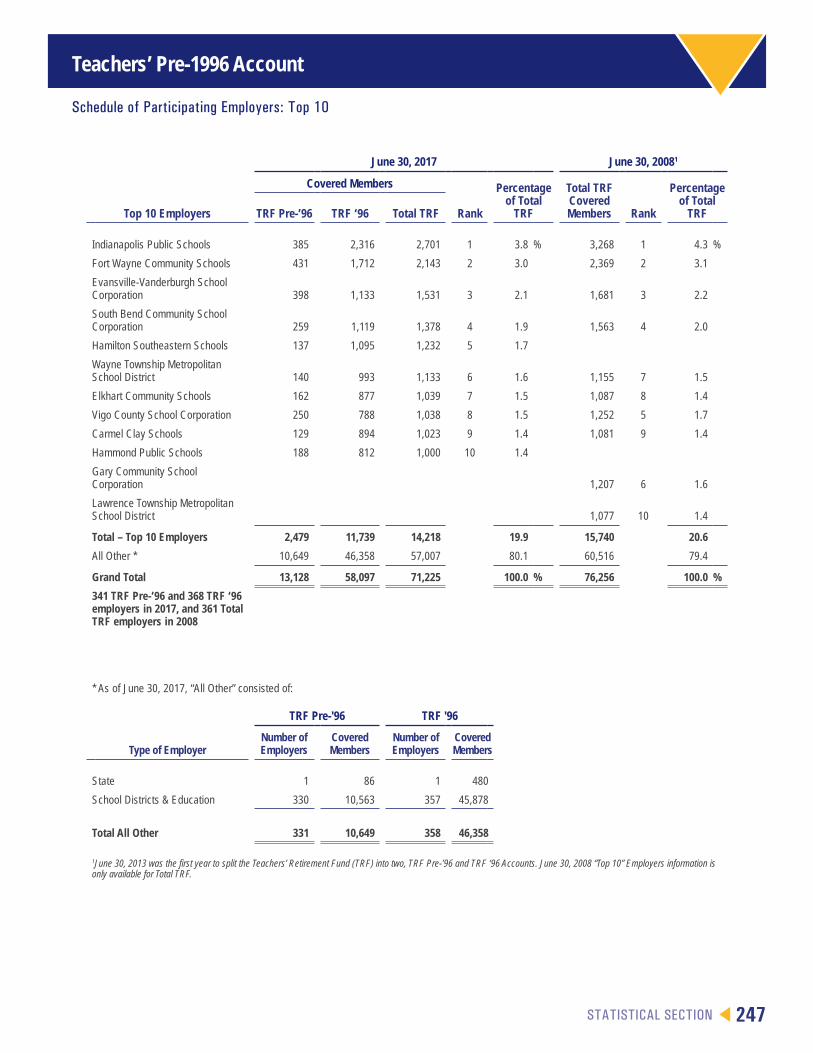
Schedule of Participating Employers: Top 10
June 30, 2017 June 30, 20081
Covered Members Percentage of Total
TRF
Total TRF Covered Members Rank
Percentage of Total
TRFTop 10 Employers TRF Pre-’96 TRF ‘96 Total TRF Rank
Indianapolis Public Schools 385 2,316 2,701 1 3.8 % 3,268 1 4.3 %
Fort Wayne Community Schools 431 1,712 2,143 2 3.0 2,369 2 3.1
Evansville-Vanderburgh School Corporation 398 1,133 1,531 3 2.1 1,681 3 2.2
South Bend Community School Corporation 259 1,119 1,378 4 1.9 1,563 4 2.0
Hamilton Southeastern Schools 137 1,095 1,232 5 1.7
Wayne Township Metropolitan School District 140 993 1,133 6 1.6 1,155 7 1.5
Elkhart Community Schools 162 877 1,039 7 1.5 1,087 8 1.4
Vigo County School Corporation 250 788 1,038 8 1.5 1,252 5 1.7
Carmel Clay Schools 129 894 1,023 9 1.4 1,081 9 1.4
Hammond Public Schools 188 812 1,000 10 1.4
Gary Community School Corporation 1,207 6 1.6
Lawrence Township Metropolitan School District 1,077 10 1.4
Total – Top 10 Employers 2,479 11,739 14,218 19.9 15,740 20.6
All Other * 10,649 46,358 57,007 80.1 60,516 79.4
Grand Total 13,128 58,097 71,225 100.0 % 76,256 100.0 %
341 TRF Pre-’96 and 368 TRF ‘96 employers in 2017, and 361 Total TRF employers in 2008
* As of June 30, 2017, “All Other” consisted of:
TRF Pre-'96 TRF '96
Type of EmployerNumber of Employers
Covered Members
Number of Employers
Covered Members
State 1 86 1 480
School Districts & Education 330 10,563 357 45,878
Total All Other 331 10,649 358 46,358
1June 30, 2013 was the first year to split the Teachers’ Retirement Fund (TRF) into two, TRF Pre-’96 and TRF ‘96 Accounts. June 30, 2008 “Top 10” Employers information is only available for Total TRF.

248 STATISTICAL SECTION
Teachers’ 1996 Account
Schedule of Changes and Growth in Fiduciary Net Position1
For the Year Ended June 30
-200,000
-100,000
0
100,000
200,000
300,000
400,000
500,000
600,000
700,000
20132014201520162017
Net Position-End of Year
0
1,000,000
2,000,000
3,000,000
4,000,000
5,000,000
6,000,000
7,000,000
Net InvestmentIncome / (Loss)
Total Benefitsand Expenses
Total Contributionsand Other
(dollars in thousands) 2017 2016 2015 2014 2013
Net Position - Beginning of Year $ 5,611,230 $ 5,379,113 $ 5,189,442 $ 4,433,677 $ 4,018,149
Contributions / (Benefits and Expenses)
Employer Contributions 227,207 215,626 205,763 194,751 180,714
Member Contributions 92,838 88,430 86,515 81,802 77,532
Member Reassignments 6,345 6,587 7,134 8,884 4,322
Other 34 16 24 21 4
Total Contributions and Other 326,424 310,659 299,436 285,458 262,572
Pension Benefits (127,618) (119,754) (112,533) (94,615) (84,814)
Disability Benefits (1,717) (1,942) (1,692) (1,790) (6)
Survivor Benefits (3,257) (2,606) (1,962) (1,581) (1,412)
Distributions of Contributions and Interest (11,133) (10,988) (11,712) (10,734) (10,925)
Administrative Expenses (5,553) (5,603) (6,184) (6,707) (6,482)
Member Reassignments (1,229) (1,852) (1,269) (1,048) (1,516)
Total Benefits and Expenses (150,507) (142,745) (135,352) (116,475) (105,155)
Net Contributions / (Benefits and Expenses) 175,917 167,914 164,084 168,983 157,417
Net Investment Income / (Loss) 464,893 64,203 25,587 586,782 258,111
Net Increase / (Decrease) 640,810 232,117 189,671 755,765 415,528
Net Position - End of Year $ 6,252,040 $ 5,611,230 $ 5,379,113 $ 5,189,442 $ 4,433,677
1June 30, 2013 was the first year to split the Teachers’ Retirement Fund (TRF) into two, TRF Pre-1996 and TRF 1996 Accounts. INPRS intends to make this schedule a 10-year schedule over time.
(in thousands of dollars)
STATISTICAL SECTION 249
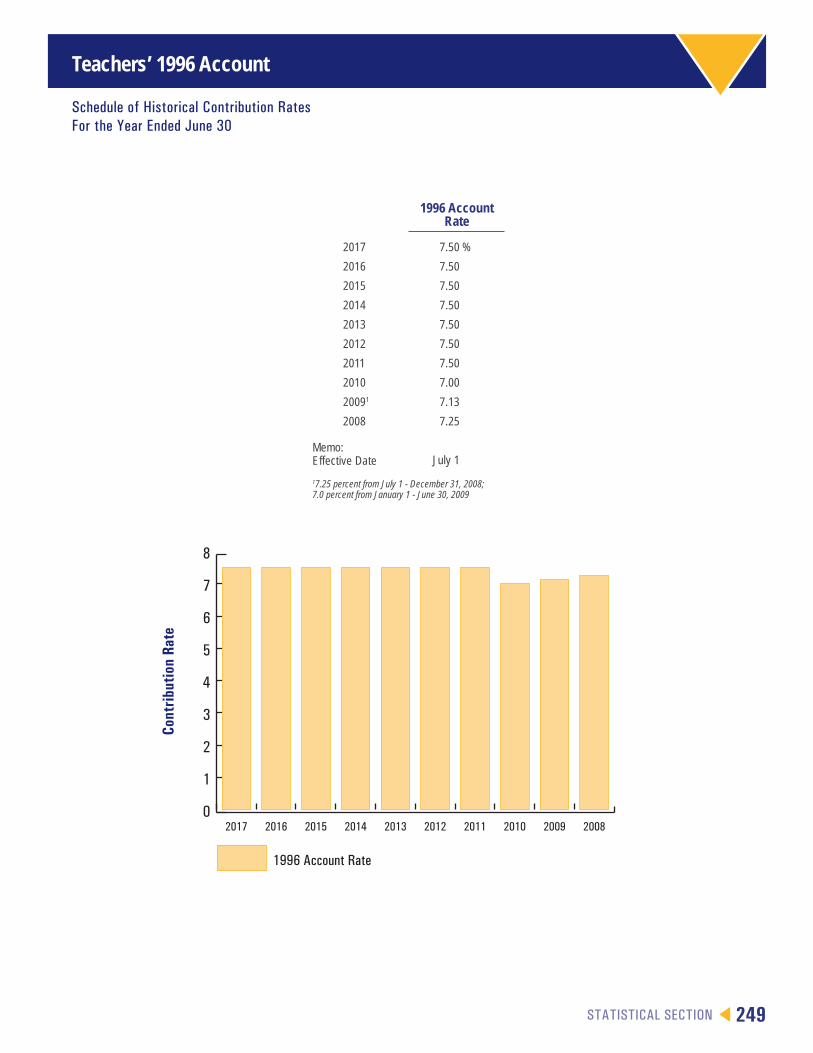
Teachers’ 1996 Account
Schedule of Historical Contribution RatesFor the Year Ended June 30
0
1
2
3
4
5
6
7
8
1996 Account Rate
2008200920102011201220132014201520162017
Cont
ribut
ion
Rate
1996 Account Rate
2017 7.50 %
2016 7.50
2015 7.50
2014 7.50
2013 7.50
2012 7.50
2011 7.50
2010 7.00
20091 7.13
2008 7.25
Memo:Effective Date July 1
17.25 percent from July 1 - December 31, 2008;7.0 percent from January 1 - June 30, 2009

250 STATISTICAL SECTION
Teachers’ 1996 Account
Ratio of Active Members to AnnuitantsFor the Year Ended June 30
0
10,000
20,000
30,000
40,000
50,000
60,000
20082009201020112012201320142015201620170
10
20
30
40
50
60
Ratio Active Members to Annuitants
AnnuitantsActive Members
Active Members Annuitants1
Ratio Active Members to Annuitants
20172 58,097 5,796 10.0
20162 55,265 4,977 11.1
20152 52,424 4,136 12.7
20142 51,204 3,665 14.0
2013 51,204 3,665 14.0
2012 47,885 2,971 16.1
2011 46,633 2,554 18.3
2010 46,433 2,181 21.3
2009 45,046 1,944 23.2
2008 41,628 2,263 18.4
1Annuitants includes retirees, beneficiaries and disabled members.2Calculated using the prior year census data, adjusted for certain activity during the fiscal year.
Mem
bers
Ratio

STATISTICAL SECTION 251
Teachers’ 1996 Account
Number of Benefit Recipients by Benefit Option
Amount of Monthly Benefit
(in dollars)
5-Year Certain & Life
Straight Life
Modified Cash Refund Plus 5-Year Certain &
Life
Joint With 100%
Survivor Benefits
Joint With Two-
Thirds Survivor Benefits
Joint With One-Half Survivor Benefits
Social Security
Integration2 Survivors Disability
Total Benefit
Recipients
$ 1 - 500 283 207 24 187 35 62 N/A 50 66 914
501 - 1,000 454 369 52 414 88 165 N/A 55 66 1,663
1,001 - 1,500 304 300 41 312 97 126 N/A 10 23 1,213
1,501 - 2,000 225 193 24 243 69 110 N/A 7 10 881
2,001 - 3,000 165 180 18 289 86 124 N/A 4 6 872
Over 3,000 52 58 1 69 37 35 N/A 1 - 253
Total 1,483 1,307 160 1,514 412 622 N/A 127 171 5,796
5-Year Certain & Life — Provides a monthly benefit for retiree’s life. If retiree receives benefits for at least five years prior to death, there is no benefit payable to a designated beneficiary. In the event the retiree dies before receiving five years of payments, the beneficiary receives the remainder of those five years of monthly benefits, or the present value of those remaining payments in a lump sum.
Straight Life — Provides a monthly benefit for retiree’s life. The benefit ceases upon the death of the retiree. If applicable, the balance of the retiree’s Annuity Savings Account (ASA) is distributed to a designated beneficiary or estate if the remaining ASA is greater than the total payments previously paid to the retiree.
Modified Cash Refund Plus 5-Year Certain & Life — Provides a monthly benefit for retiree’s life, including monthly annuitization of member’s Annuity Savings Account (ASA). In the event the retiree dies before receiving five years of payments, the beneficiary receives either a monthly benefit of the pension amount only for the remainder of the five years of guaranteed pension payments, or the present value of those pension payments in a lump sum. If applicable, the balance of the retiree’s ASA is distributed to a designated beneficiary or estate if the remaining ASA is greater than the ASA-related payments previously paid to the retiree.
Joint With 100% Survivor Benefits — Provides a monthly benefit for retiree’s life. Upon the death of the retiree, the qualified designated survivor receives 100 percent of the member’s monthly benefit for the remainder of the survivor’s life.
Joint With Two-Thirds Survivor Benefits — Provides a monthly benefit for retiree’s life. Upon the death of the retiree, the qualified designated survivor receives 66 2/3 percent of the member’s monthly benefit for the remainder of the survivor’s life.
Joint With One-Half Survivor Benefits — Provides a monthly benefit for retiree’s life. Upon the death of the retiree, the qualified designated survivor receives 50 percent of the member’s monthly benefit for the remainder of the survivor’s life.
Social Security Integration — Provides a higher monthly benefit for a retiree between the ages of 50 and 62 who elects to integrate social security with their monthly benefit. For TRF retirees, social security integration can be incorporated with 5-Year Certain & Life, Straight Life, Modified Cash Refund Plus 5-Year Certain & Life, Joint With 100% Survivor Benefits, Joint With Two-Thirds Survivor Benefits, and Joint With One-Half Survivor Benefits. The number of retirees electing social security integration is included in the number of retirees of the selected benefit option. For TRF retirees, the monthly benefit is reduced or terminated at age 62 depending on the estimated monthly benefit from social security at age 62.
Survivors — Members receiving a survivor benefit in accordance with the applicable statute. The benefit ceases upon the death of the survivor.
Disability — Members receiving a disability benefit in accordance with the applicable statute. For TRF, five or more years of creditable service is required to be eligible for a disability benefit. Includes Classroom Disability which provides a benefit of $125 per month plus $5 for each additional year of TRF-covered service over five years.1Calculated using the prior year census data, adjusted for certain activity during the fiscal year.2Included in 5-Year Certain & Life, Straight Life, Modified Cash Refund Plus 5-Year Certain & Life, Joint With 100% Survivor Benefits, Joint With Two-Thirds Survivor Benefits, and Joint With One-Half Survivor Benefits.
Schedule of Benefit Recipients by Type of Benefit OptionFor the Year Ended June 30, 20171
Disability
Survivors
Joint with One-HalfSurvivor Benefits
Joint with Two-ThirdsSurvivor Benefits
Joint with 100%Survivor Benefits
Modified Cash Refund PlusFive-Year Certain and Life
Straight Life
5-Year Certain and Life
26%
23%
3%
26%
11%
7%
2% 2%
252 STATISTICAL SECTION
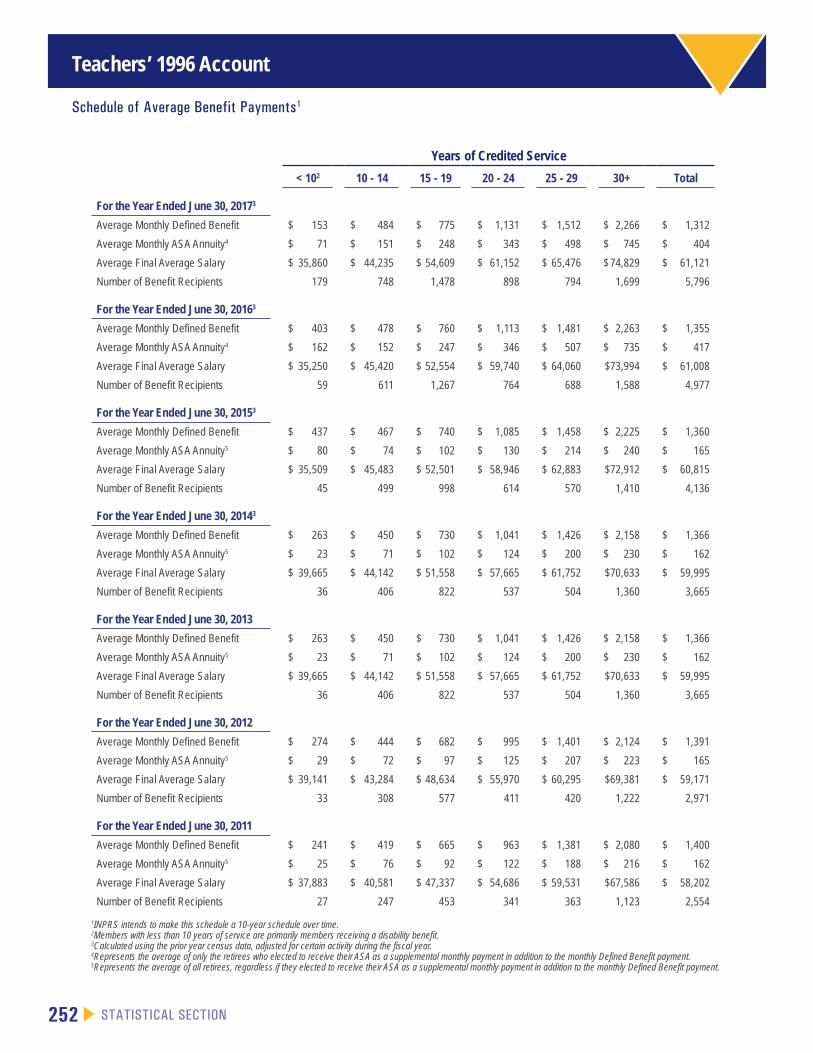
Teachers’ 1996 Account
Schedule of Average Benefit Payments1
Years of Credited Service
< 102 10 - 14 15 - 19 20 - 24 25 - 29 30+ Total
For the Year Ended June 30, 20173
Average Monthly Defined Benefit $ 153 $ 484 $ 775 $ 1,131 $ 1,512 $ 2,266 $ 1,312
Average Monthly ASA Annuity4 $ 71 $ 151 $ 248 $ 343 $ 498 $ 745 $ 404
Average Final Average Salary $ 35,860 $ 44,235 $ 54,609 $ 61,152 $ 65,476 $ 74,829 $ 61,121
Number of Benefit Recipients 179 748 1,478 898 794 1,699 5,796
For the Year Ended June 30, 20163
Average Monthly Defined Benefit $ 403 $ 478 $ 760 $ 1,113 $ 1,481 $ 2,263 $ 1,355
Average Monthly ASA Annuity4 $ 162 $ 152 $ 247 $ 346 $ 507 $ 735 $ 417
Average Final Average Salary $ 35,250 $ 45,420 $ 52,554 $ 59,740 $ 64,060 $73,994 $ 61,008
Number of Benefit Recipients 59 611 1,267 764 688 1,588 4,977
For the Year Ended June 30, 20153
Average Monthly Defined Benefit $ 437 $ 467 $ 740 $ 1,085 $ 1,458 $ 2,225 $ 1,360
Average Monthly ASA Annuity5 $ 80 $ 74 $ 102 $ 130 $ 214 $ 240 $ 165
Average Final Average Salary $ 35,509 $ 45,483 $ 52,501 $ 58,946 $ 62,883 $72,912 $ 60,815
Number of Benefit Recipients 45 499 998 614 570 1,410 4,136
For the Year Ended June 30, 20143
Average Monthly Defined Benefit $ 263 $ 450 $ 730 $ 1,041 $ 1,426 $ 2,158 $ 1,366
Average Monthly ASA Annuity5 $ 23 $ 71 $ 102 $ 124 $ 200 $ 230 $ 162
Average Final Average Salary $ 39,665 $ 44,142 $ 51,558 $ 57,665 $ 61,752 $70,633 $ 59,995
Number of Benefit Recipients 36 406 822 537 504 1,360 3,665
For the Year Ended June 30, 2013
Average Monthly Defined Benefit $ 263 $ 450 $ 730 $ 1,041 $ 1,426 $ 2,158 $ 1,366
Average Monthly ASA Annuity5 $ 23 $ 71 $ 102 $ 124 $ 200 $ 230 $ 162
Average Final Average Salary $ 39,665 $ 44,142 $ 51,558 $ 57,665 $ 61,752 $70,633 $ 59,995
Number of Benefit Recipients 36 406 822 537 504 1,360 3,665
For the Year Ended June 30, 2012
Average Monthly Defined Benefit $ 274 $ 444 $ 682 $ 995 $ 1,401 $ 2,124 $ 1,391
Average Monthly ASA Annuity5 $ 29 $ 72 $ 97 $ 125 $ 207 $ 223 $ 165
Average Final Average Salary $ 39,141 $ 43,284 $ 48,634 $ 55,970 $ 60,295 $69,381 $ 59,171
Number of Benefit Recipients 33 308 577 411 420 1,222 2,971
For the Year Ended June 30, 2011
Average Monthly Defined Benefit $ 241 $ 419 $ 665 $ 963 $ 1,381 $ 2,080 $ 1,400
Average Monthly ASA Annuity5 $ 25 $ 76 $ 92 $ 122 $ 188 $ 216 $ 162
Average Final Average Salary $ 37,883 $ 40,581 $ 47,337 $ 54,686 $ 59,531 $67,586 $ 58,202
Number of Benefit Recipients 27 247 453 341 363 1,123 2,554
1INPRS intends to make this schedule a 10-year schedule over time.2Members with less than 10 years of service are primarily members receiving a disability benefit.3Calculated using the prior year census data, adjusted for certain activity during the fiscal year.4Represents the average of only the retirees who elected to receive their ASA as a supplemental monthly payment in addition to the monthly Defined Benefit payment.5Represents the average of all retirees, regardless if they elected to receive their ASA as a supplemental monthly payment in addition to the monthly Defined Benefit payment.
STATISTICAL SECTION 253
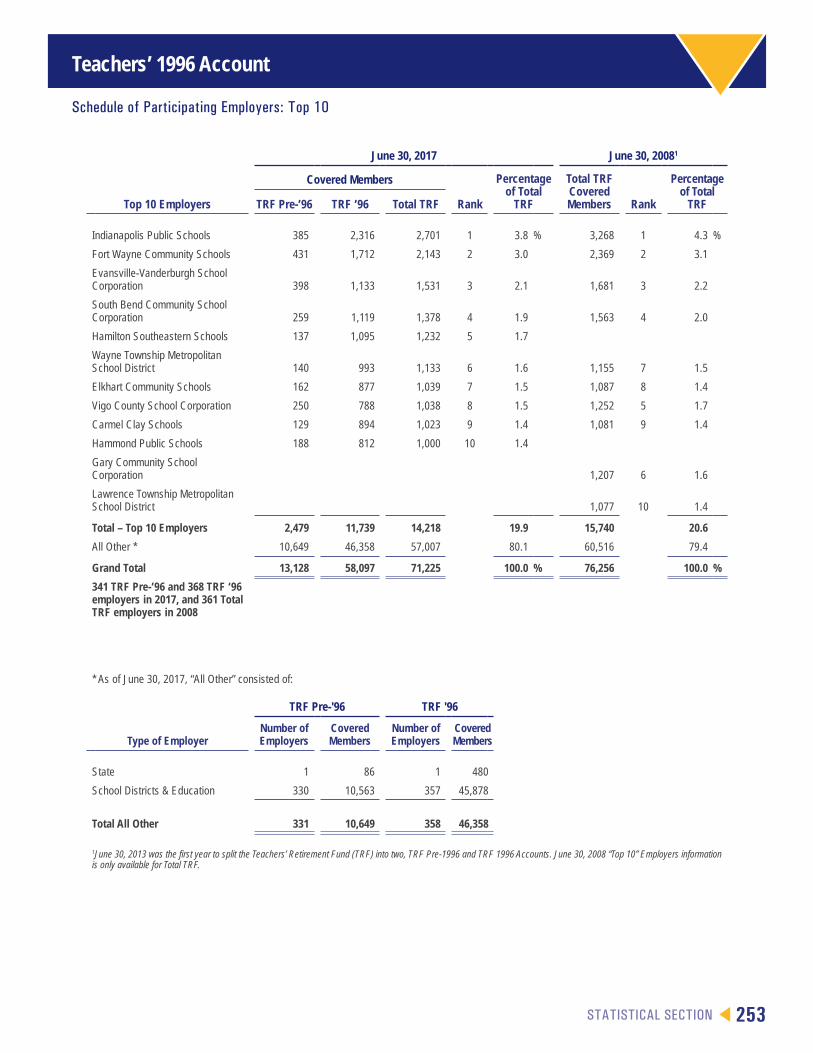
Teachers’ 1996 Account
Schedule of Participating Employers: Top 10
June 30, 2017 June 30, 20081
Covered Members
Rank
Percentage of Total
TRF
Total TRF Covered Members Rank
Percentage of Total
TRFTop 10 Employers TRF Pre-’96 TRF ’96 Total TRF
Indianapolis Public Schools 385 2,316 2,701 1 3.8 % 3,268 1 4.3 %
Fort Wayne Community Schools 431 1,712 2,143 2 3.0 2,369 2 3.1
Evansville-Vanderburgh School Corporation 398 1,133 1,531 3 2.1 1,681 3 2.2
South Bend Community School Corporation 259 1,119 1,378 4 1.9 1,563 4 2.0
Hamilton Southeastern Schools 137 1,095 1,232 5 1.7
Wayne Township Metropolitan School District 140 993 1,133 6 1.6 1,155 7 1.5
Elkhart Community Schools 162 877 1,039 7 1.5 1,087 8 1.4
Vigo County School Corporation 250 788 1,038 8 1.5 1,252 5 1.7
Carmel Clay Schools 129 894 1,023 9 1.4 1,081 9 1.4
Hammond Public Schools 188 812 1,000 10 1.4
Gary Community School Corporation 1,207 6 1.6
Lawrence Township Metropolitan School District 1,077 10 1.4
Total – Top 10 Employers 2,479 11,739 14,218 19.9 15,740 20.6
All Other * 10,649 46,358 57,007 80.1 60,516 79.4
Grand Total 13,128 58,097 71,225 100.0 % 76,256 100.0 %
341 TRF Pre-’96 and 368 TRF ‘96 employers in 2017, and 361 Total TRF employers in 2008
* As of June 30, 2017, “All Other” consisted of:
TRF Pre-'96 TRF '96
Type of EmployerNumber of Employers
Covered Members
Number of Employers
Covered Members
State 1 86 1 480
School Districts & Education 330 10,563 357 45,878
Total All Other 331 10,649 358 46,358
1June 30, 2013 was the first year to split the Teachers’ Retirement Fund (TRF) into two, TRF Pre-1996 and TRF 1996 Accounts. June 30, 2008 “Top 10” Employers information is only available for Total TRF.
254 STATISTICAL SECTION
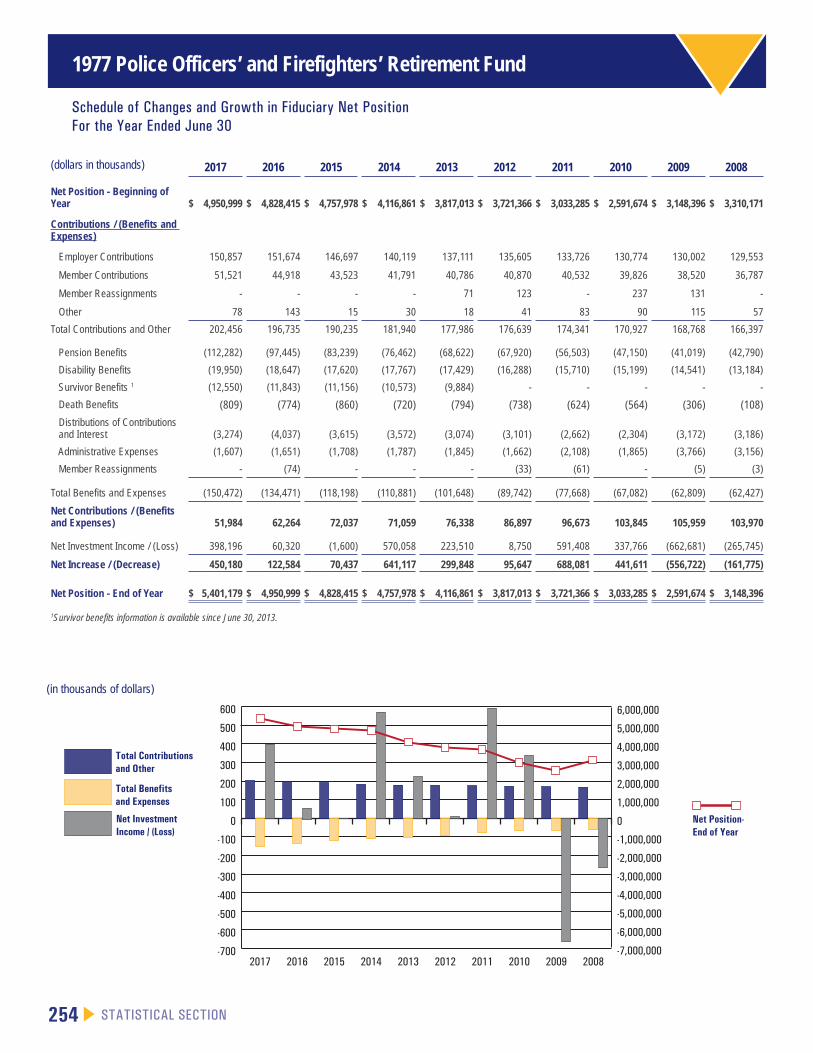
1977 Police Officers’ and Firefighters’ Retirement Fund
Schedule of Changes and Growth in Fiduciary Net PositionFor the Year Ended June 30
-700
-600
-500
-400
-300
-200
-100
0
100
200
300
400
500
600
2008200920102011201220132014201520162017-7,000,000
-6,000,000
-5,000,000
-4,000,000
-3,000,000
-2,000,000
-1,000,000
0
1,000,000
2,000,000
3,000,000
4,000,000
5,000,000
6,000,000
Net Position-End of Year
Net InvestmentIncome / (Loss)
Total Benefitsand Expenses
Total Contributionsand Other
(dollars in thousands) 2017 2016 2015 2014 2013 2012 2011 2010 2009 2008
Net Position - Beginning of Year $ 4,950,999 $ 4,828,415 $ 4,757,978 $ 4,116,861 $ 3,817,013 $ 3,721,366 $ 3,033,285 $ 2,591,674 $ 3,148,396 $ 3,310,171
Contributions / (Benefits and Expenses)
Employer Contributions 150,857 151,674 146,697 140,119 137,111 135,605 133,726 130,774 130,002 129,553
Member Contributions 51,521 44,918 43,523 41,791 40,786 40,870 40,532 39,826 38,520 36,787
Member Reassignments - - - - 71 123 - 237 131 -
Other 78 143 15 30 18 41 83 90 115 57
Total Contributions and Other 202,456 196,735 190,235 181,940 177,986 176,639 174,341 170,927 168,768 166,397
Pension Benefits (112,282) (97,445) (83,239) (76,462) (68,622) (67,920) (56,503) (47,150) (41,019) (42,790)
Disability Benefits (19,950) (18,647) (17,620) (17,767) (17,429) (16,288) (15,710) (15,199) (14,541) (13,184)
Survivor Benefits 1 (12,550) (11,843) (11,156) (10,573) (9,884) - - - - -
Death Benefits (809) (774) (860) (720) (794) (738) (624) (564) (306) (108)
Distributions of Contributions and Interest (3,274) (4,037) (3,615) (3,572) (3,074) (3,101) (2,662) (2,304) (3,172) (3,186)
Administrative Expenses (1,607) (1,651) (1,708) (1,787) (1,845) (1,662) (2,108) (1,865) (3,766) (3,156)
Member Reassignments - (74) - - - (33) (61) - (5) (3)
Total Benefits and Expenses (150,472) (134,471) (118,198) (110,881) (101,648) (89,742) (77,668) (67,082) (62,809) (62,427)
Net Contributions / (Benefits and Expenses) 51,984 62,264 72,037 71,059 76,338 86,897 96,673 103,845 105,959 103,970
Net Investment Income / (Loss) 398,196 60,320 (1,600) 570,058 223,510 8,750 591,408 337,766 (662,681) (265,745)
Net Increase / (Decrease) 450,180 122,584 70,437 641,117 299,848 95,647 688,081 441,611 (556,722) (161,775)
Net Position - End of Year $ 5,401,179 $ 4,950,999 $ 4,828,415 $ 4,757,978 $ 4,116,861 $ 3,817,013 $ 3,721,366 $ 3,033,285 $ 2,591,674 $ 3,148,396
1Survivor benefits information is available since June 30, 2013.
(in thousands of dollars)
STATISTICAL SECTION 255
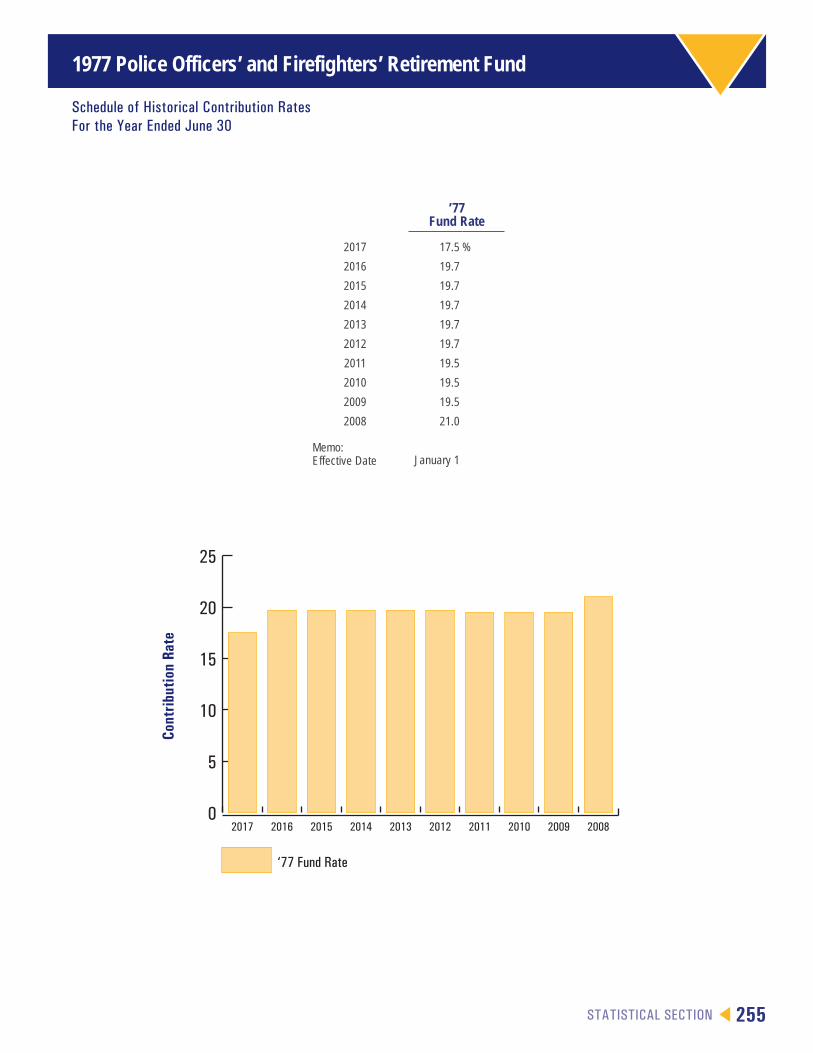
1977 Police Officers’ and Firefighters’ Retirement Fund
Schedule of Historical Contribution RatesFor the Year Ended June 30
0
5
10
15
20
25
‘77 Fund Rate
2008200920102011201220132014201520162017
Cont
ribut
ion
Rate
’77 Fund Rate
2017 17.5 %
2016 19.7
2015 19.7
2014 19.7
2013 19.7
2012 19.7
2011 19.5
2010 19.5
2009 19.5
2008 21.0
Memo:Effective Date January 1
256 STATISTICAL SECTION
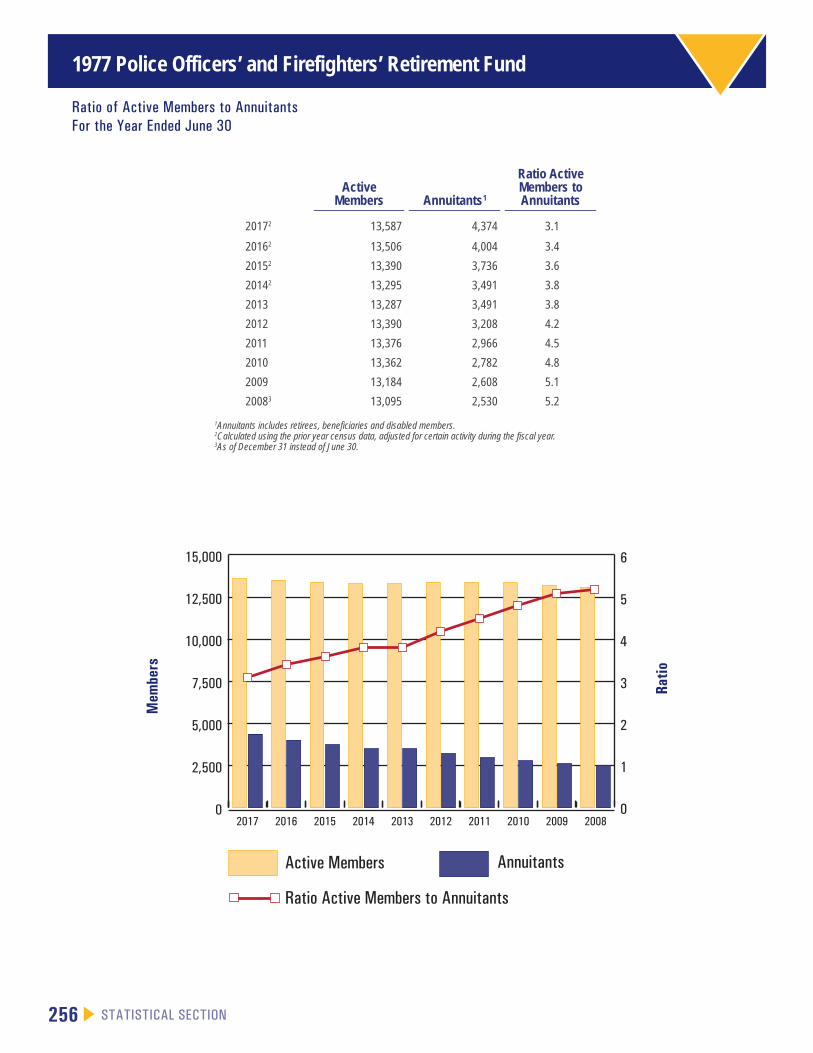
1977 Police Officers’ and Firefighters’ Retirement Fund
Ratio of Active Members to AnnuitantsFor the Year Ended June 30
0
2,500
5,000
7,500
10,000
12,500
15,000
20082009201020112012201320142015201620170
1
2
3
4
5
6
Ratio Active Members to Annuitants
AnnuitantsActive Members
Mem
bers
Ratio
Active Members Annuitants1
Ratio Active Members to Annuitants
20172 13,587 4,374 3.1
20162 13,506 4,004 3.4
20152 13,390 3,736 3.6
20142 13,295 3,491 3.8
2013 13,287 3,491 3.8
2012 13,390 3,208 4.2
2011 13,376 2,966 4.5
2010 13,362 2,782 4.8
2009 13,184 2,608 5.1
20083 13,095 2,530 5.2
1Annuitants includes retirees, beneficiaries and disabled members.2Calculated using the prior year census data, adjusted for certain activity during the fiscal year.3As of December 31 instead of June 30.
STATISTICAL SECTION 257
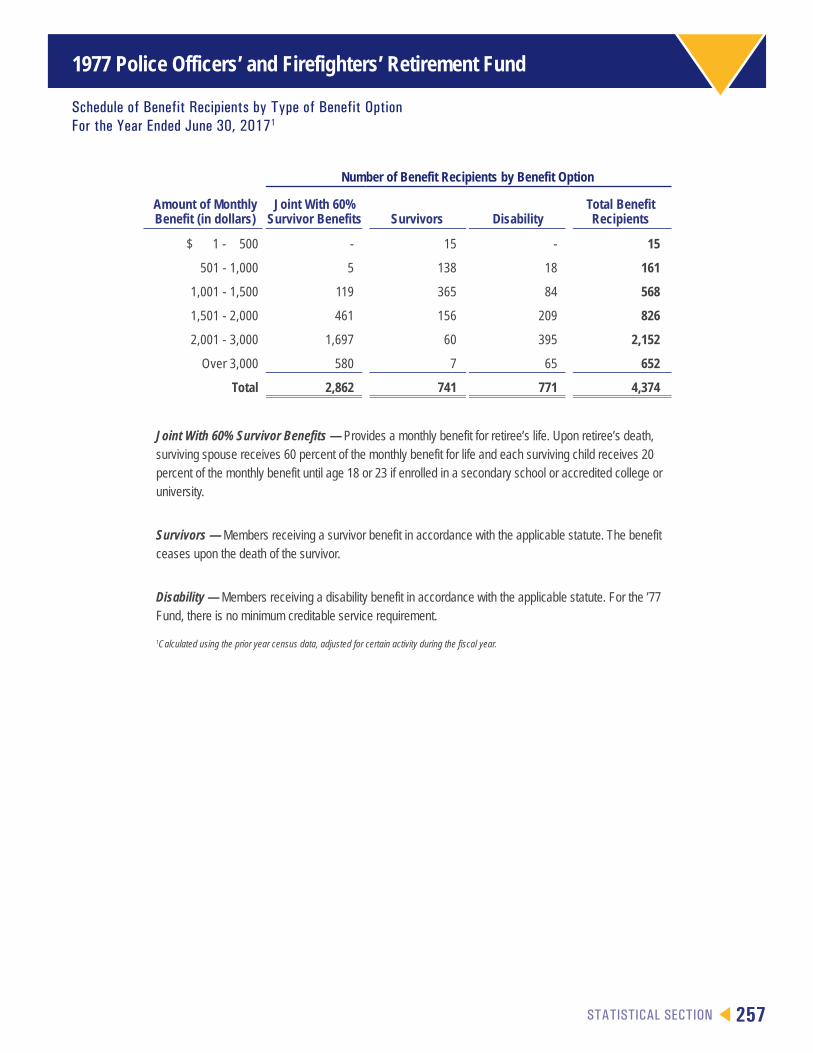
1977 Police Officers’ and Firefighters’ Retirement Fund
Schedule of Benefit Recipients by Type of Benefit OptionFor the Year Ended June 30, 20171
Number of Benefit Recipients by Benefit Option
Amount of Monthly Benefit (in dollars)
Joint With 60% Survivor Benefits Survivors Disability
Total Benefit Recipients
$ 1 - 500 - 15 - 15
501 - 1,000 5 138 18 161
1,001 - 1,500 119 365 84 568
1,501 - 2,000 461 156 209 826
2,001 - 3,000 1,697 60 395 2,152
Over 3,000 580 7 65 652
Total 2,862 741 771 4,374
Joint With 60% Survivor Benefits — Provides a monthly benefit for retiree’s life. Upon retiree’s death, surviving spouse receives 60 percent of the monthly benefit for life and each surviving child receives 20 percent of the monthly benefit until age 18 or 23 if enrolled in a secondary school or accredited college or university.
Survivors — Members receiving a survivor benefit in accordance with the applicable statute. The benefit ceases upon the death of the survivor.
Disability — Members receiving a disability benefit in accordance with the applicable statute. For the ’77 Fund, there is no minimum creditable service requirement.
1Calculated using the prior year census data, adjusted for certain activity during the fiscal year.
258 STATISTICAL SECTION
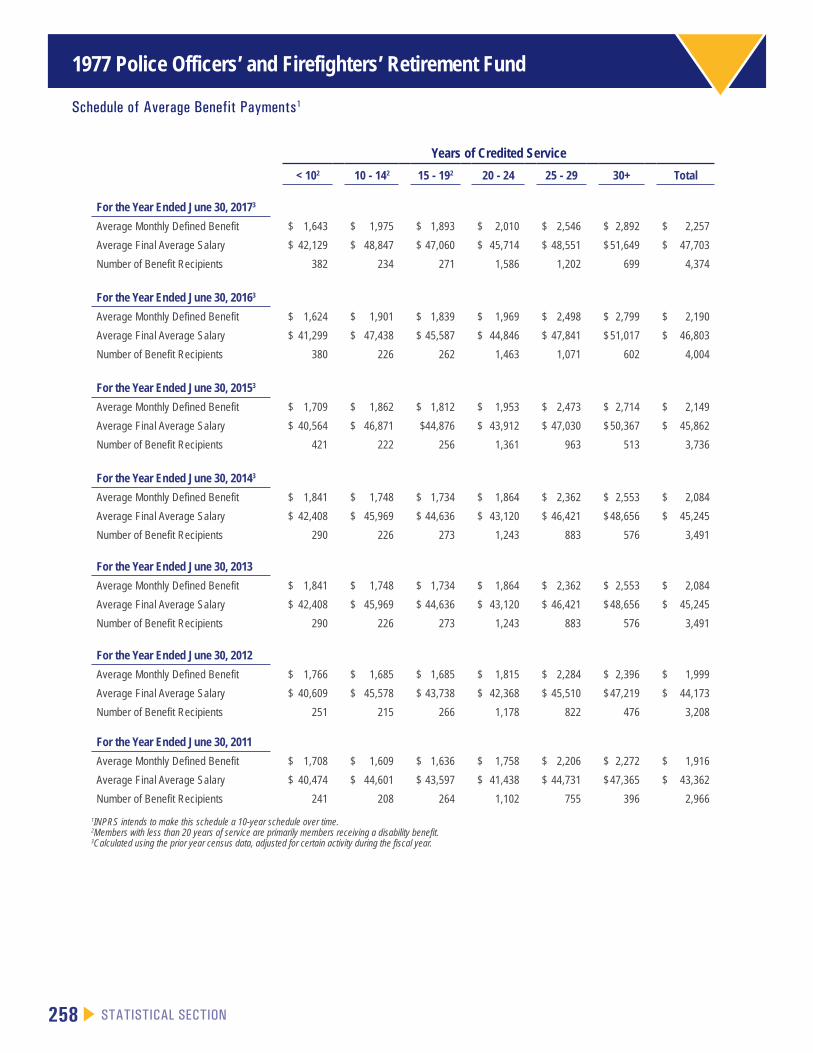
1977 Police Officers’ and Firefighters’ Retirement Fund
Schedule of Average Benefit Payments1
Years of Credited Service
< 102 10 - 142 15 - 192 20 - 24 25 - 29 30+ Total
For the Year Ended June 30, 20173
Average Monthly Defined Benefit $ 1,643 $ 1,975 $ 1,893 $ 2,010 $ 2,546 $ 2,892 $ 2,257
Average Final Average Salary $ 42,129 $ 48,847 $ 47,060 $ 45,714 $ 48,551 $ 51,649 $ 47,703
Number of Benefit Recipients 382 234 271 1,586 1,202 699 4,374
For the Year Ended June 30, 20163
Average Monthly Defined Benefit $ 1,624 $ 1,901 $ 1,839 $ 1,969 $ 2,498 $ 2,799 $ 2,190
Average Final Average Salary $ 41,299 $ 47,438 $ 45,587 $ 44,846 $ 47,841 $ 51,017 $ 46,803
Number of Benefit Recipients 380 226 262 1,463 1,071 602 4,004
For the Year Ended June 30, 20153
Average Monthly Defined Benefit $ 1,709 $ 1,862 $ 1,812 $ 1,953 $ 2,473 $ 2,714 $ 2,149
Average Final Average Salary $ 40,564 $ 46,871 $44,876 $ 43,912 $ 47,030 $ 50,367 $ 45,862
Number of Benefit Recipients 421 222 256 1,361 963 513 3,736
For the Year Ended June 30, 20143
Average Monthly Defined Benefit $ 1,841 $ 1,748 $ 1,734 $ 1,864 $ 2,362 $ 2,553 $ 2,084
Average Final Average Salary $ 42,408 $ 45,969 $ 44,636 $ 43,120 $ 46,421 $ 48,656 $ 45,245
Number of Benefit Recipients 290 226 273 1,243 883 576 3,491
For the Year Ended June 30, 2013
Average Monthly Defined Benefit $ 1,841 $ 1,748 $ 1,734 $ 1,864 $ 2,362 $ 2,553 $ 2,084
Average Final Average Salary $ 42,408 $ 45,969 $ 44,636 $ 43,120 $ 46,421 $ 48,656 $ 45,245
Number of Benefit Recipients 290 226 273 1,243 883 576 3,491
For the Year Ended June 30, 2012
Average Monthly Defined Benefit $ 1,766 $ 1,685 $ 1,685 $ 1,815 $ 2,284 $ 2,396 $ 1,999
Average Final Average Salary $ 40,609 $ 45,578 $ 43,738 $ 42,368 $ 45,510 $ 47,219 $ 44,173
Number of Benefit Recipients 251 215 266 1,178 822 476 3,208
For the Year Ended June 30, 2011
Average Monthly Defined Benefit $ 1,708 $ 1,609 $ 1,636 $ 1,758 $ 2,206 $ 2,272 $ 1,916
Average Final Average Salary $ 40,474 $ 44,601 $ 43,597 $ 41,438 $ 44,731 $ 47,365 $ 43,362
Number of Benefit Recipients 241 208 264 1,102 755 396 2,966
1INPRS intends to make this schedule a 10-year schedule over time.2Members with less than 20 years of service are primarily members receiving a disability benefit.3Calculated using the prior year census data, adjusted for certain activity during the fiscal year.
STATISTICAL SECTION 259
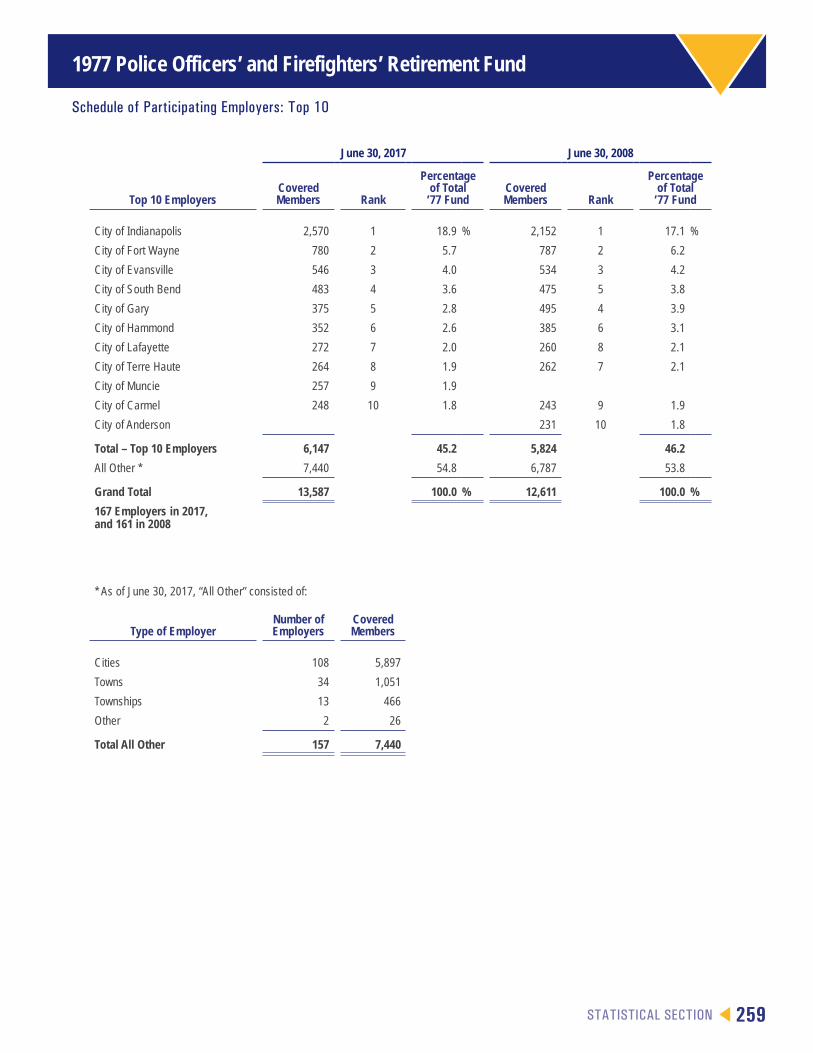
1977 Police Officers’ and Firefighters’ Retirement Fund
Schedule of Participating Employers: Top 10
June 30, 2017 June 30, 2008
Top 10 EmployersCovered Members Rank
Percentage of Total
’77 FundCovered Members Rank
Percentage of Total
’77 Fund
City of Indianapolis 2,570 1 18.9 % 2,152 1 17.1 %
City of Fort Wayne 780 2 5.7 787 2 6.2
City of Evansville 546 3 4.0 534 3 4.2
City of South Bend 483 4 3.6 475 5 3.8
City of Gary 375 5 2.8 495 4 3.9
City of Hammond 352 6 2.6 385 6 3.1
City of Lafayette 272 7 2.0 260 8 2.1
City of Terre Haute 264 8 1.9 262 7 2.1
City of Muncie 257 9 1.9
City of Carmel 248 10 1.8 243 9 1.9
City of Anderson 231 10 1.8
Total – Top 10 Employers 6,147 45.2 5,824 46.2
All Other * 7,440 54.8 6,787 53.8
Grand Total 13,587 100.0 % 12,611 100.0 %
167 Employers in 2017, and 161 in 2008
* As of June 30, 2017, “All Other” consisted of:
Type of EmployerNumber of Employers
Covered Members
Cities 108 5,897
Towns 34 1,051
Townships 13 466
Other 2 26
Total All Other 157 7,440

260 STATISTICAL SECTION
Judges’ Retirement System
Schedule of Changes and Growth in Fiduciary Net Position For the Year Ended June 30
-60,000
-40,000
-20,000
0
20,000
40,000
60,000
80,000
100,000
120,000
2008200920102011201220132014201520162017-300,000
-200,000
-100,000
0
100,000
200,000
300,000
400,000
500,000
600,000
Net Position-End of Year
Net InvestmentIncome / (Loss)
Total Benefitsand Expenses
Total Contributionsand Other
(dollars in thousands) 2017 2016 2015 2014 2013 2012 2011 2010 2009 2008
Net Position - Beginning of Year $ 441,790 $ 437,352 $ 432,730 $ 375,752 $ 262,326 $ 256,986 $ 208,395 $ 179,428 $ 219,426 $ 233,386
Contributions / (Benefits and Expenses)
Employer Contributions1 16,824 16,946 21,020 20,895 111,419 18,896 19,200 18,631 20,861 15,920
Member Contributions 3,468 3,239 3,292 2,856 2,631 2,468 3,492 2,229 2,196 2,062
Member Reassignments - - - 4 121 257 1,281 59 151 64
Other - - 9 6 5 2 - - - -
Total Contributions and Other 20,292 20,185 24,321 23,761 114,176 21,623 23,973 20,919 23,208 18,046
Pension Benefits (19,223) (18,194) (16,613) (15,819) (15,115) (16,569) (15,996) (15,441) (14,595) (12,514)
Disability Benefits (136) (90) (230) (134) (193) (158) (92) (29) (54) (65)
Survivor Benefits2 (2,696) (2,627) (2,578) (2,574) (2,218) - - - - -
Distributions of Contributions and Interest (44) (11) (11) - (53) (19) (5) - (55) (50)
Administrative Expenses (124) (148) (165) (146) (126) (132) (160) (104) (308) (244)
Total Benefits and Expenses (22,223) (21,070) (19,597) (18,673) (17,705) (16,878) (16,253) (15,574) (15,012) (12,873)
Net Contributions / (Benefits and Expenses) (1,931) (885) 4,724 5,088 96,471 4,745 7,720 5,345 8,196 5,173
Net Investment Income / (Loss) 35,196 5,323 (102) 51,890 16,955 595 40,871 23,622 (48,194) (19,133)
Net Increase / (Decrease) 33,265 4,438 4,622 56,978 113,426 5,340 48,591 28,967 (39,998) (13,960)
Net Position - End of Year $ 475,055 $ 441,790 $ 437,352 $ 432,730 $ 375,752 $ 262,326 $ 256,986 $ 208,395 $ 179,428 $ 219,426
1In 2013, the State of Indiana contributed additional monies of $90,187 thousand.2Survivor benefit information is available since June 30, 2013.
(in thousands of dollars)
STATISTICAL SECTION 261
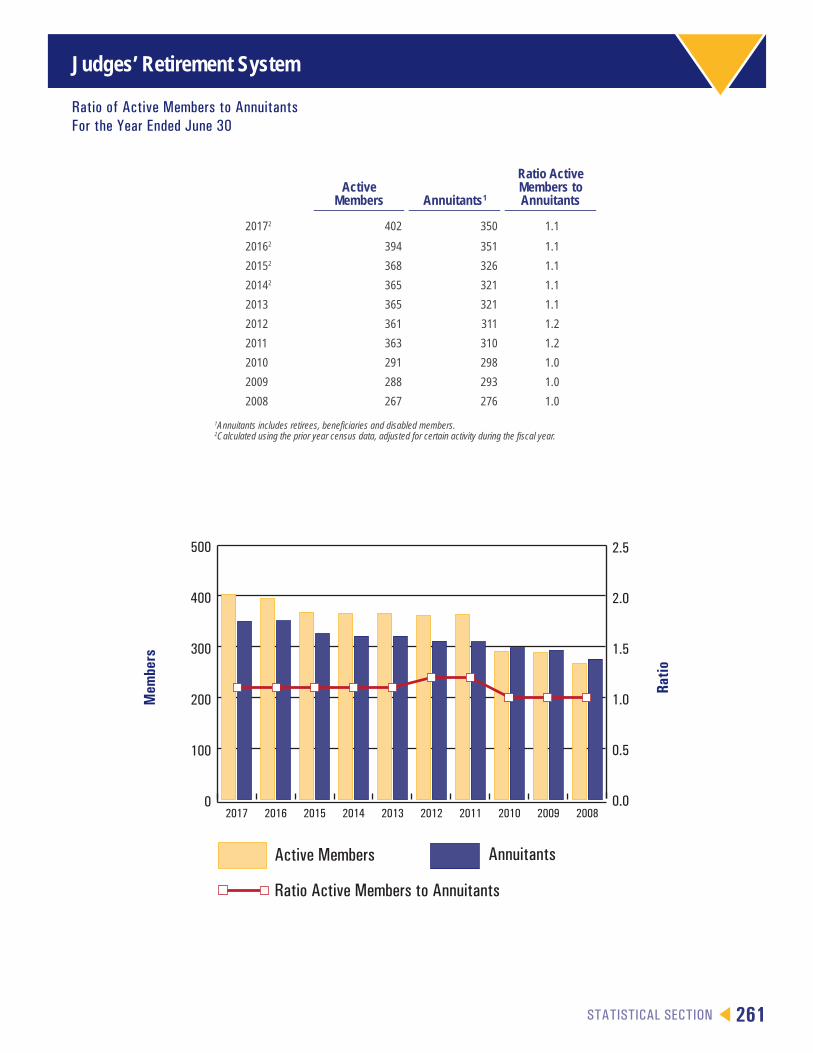
Judges’ Retirement System
Ratio of Active Members to AnnuitantsFor the Year Ended June 30
0
100
200
300
400
500
2008200920102011201220132014201520162017
Ratio Active Members to Annuitants
AnnuitantsActive Members
0.0
0.5
1.0
1.5
2.0
2.5
Mem
bers
Ratio
Active Members Annuitants1
Ratio Active Members to Annuitants
20172 402 350 1.1
20162 394 351 1.1
20152 368 326 1.1
20142 365 321 1.1
2013 365 321 1.1
2012 361 311 1.2
2011 363 310 1.2
2010 291 298 1.0
2009 288 293 1.0
2008 267 276 1.0
1Annuitants includes retirees, beneficiaries and disabled members.2Calculated using the prior year census data, adjusted for certain activity during the fiscal year.
262 STATISTICAL SECTION
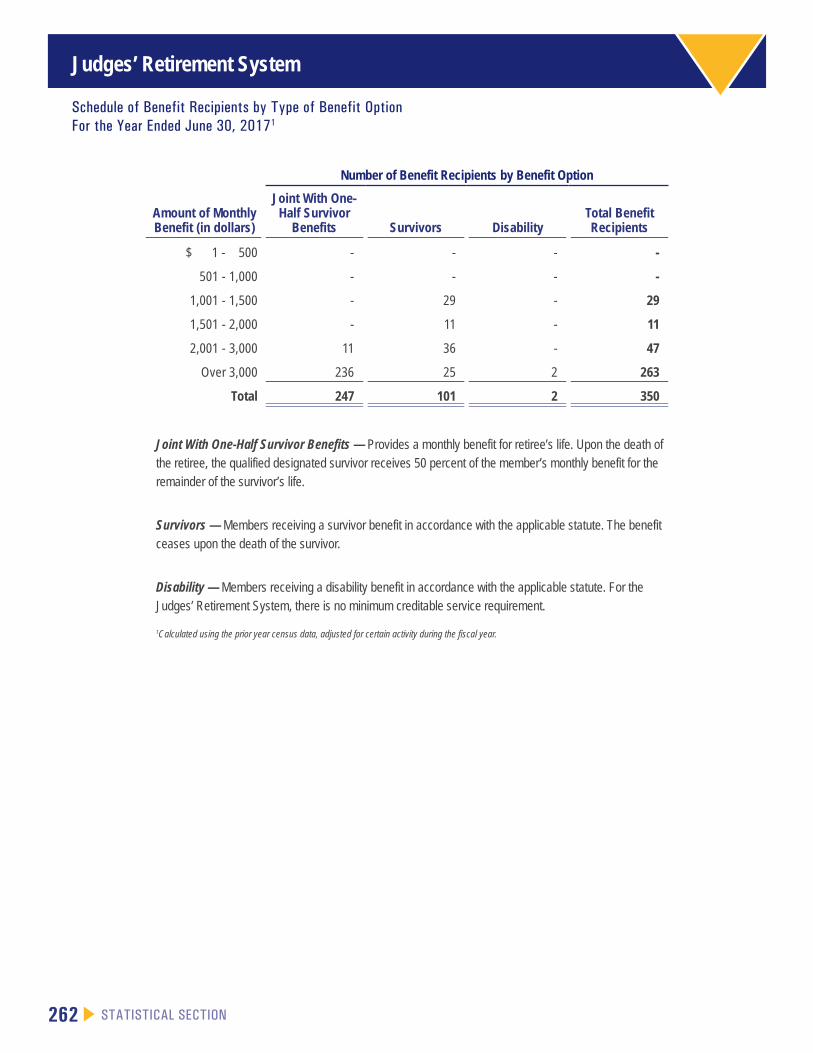
Judges’ Retirement System
Schedule of Benefit Recipients by Type of Benefit OptionFor the Year Ended June 30, 20171
Number of Benefit Recipients by Benefit Option
Amount of Monthly Benefit (in dollars)
Joint With One-Half Survivor
Benefits Survivors DisabilityTotal Benefit Recipients
$ 1 - 500 - - - -
501 - 1,000 - - - -
1,001 - 1,500 - 29 - 29
1,501 - 2,000 - 11 - 11
2,001 - 3,000 11 36 - 47
Over 3,000 236 25 2 263
Total 247 101 2 350
Joint With One-Half Survivor Benefits — Provides a monthly benefit for retiree’s life. Upon the death of the retiree, the qualified designated survivor receives 50 percent of the member’s monthly benefit for the remainder of the survivor’s life.
Survivors — Members receiving a survivor benefit in accordance with the applicable statute. The benefit ceases upon the death of the survivor.
Disability — Members receiving a disability benefit in accordance with the applicable statute. For the Judges’ Retirement System, there is no minimum creditable service requirement.
1Calculated using the prior year census data, adjusted for certain activity during the fiscal year.

STATISTICAL SECTION 263
Judges’ Retirement System
Schedule of Average Benefit Payments1
Years of Credited Service
< 10 10 - 14 15 - 19 20 - 24 25 - 29 30+ Total
For the Year Ended June 30, 20172
Average Monthly Defined Benefit $ 2,095 $ 4,416 $ 5,589 $ 5,945 $ 6,804 $ 6,788 $ 5,130
Average Final Average Salary $ 98,954 $ 117,996 $ 120,010 $ 121,926 $ 113,184 $ 124,489 $ 117,814
Number of Benefit Recipients 52 81 72 81 37 27 350
For the Year Ended June 30, 20162
Average Monthly Defined Benefit $ 2,158 $ 4,308 $ 5,125 $ 5,959 $ 6,695 $ 6,707 $ 4,989
Average Final Average Salary $ 98,226 $ 117,568 $ 119,378 $ 120,551 $ 113,184 $ 123,658 $ 117,193
Number of Benefit Recipients 57 79 71 80 37 27 351
For the Year Ended June 30, 20152
Average Monthly Defined Benefit $ 2,046 $ 4,145 $ 5,297 $ 5,479 $ 6,555 $ 6,558 $ 4,749
Average Final Average Salary $ 59,251 $ 116,014 $ 117,354 $ 114,577 $ 112,207 $ 122,815 $ 114,494
Number of Benefit Recipients 57 75 61 69 38 26 326
For the Year Ended June 30, 20142
Average Monthly Defined Benefit $ 3,519 $ 4,090 $ 5,039 $ 5,544 $ 6,538 $ 6,545 $ 4,796
Average Final Average Salary $ 108,307 $ 113,994 $ 113,254 $ 114,783 $ 111,708 $ 122,579 $ 114,885
Number of Benefit Recipients 88 66 47 62 34 24 321
For the Year Ended June 30, 2013
Average Monthly Defined Benefit $ 3,519 $ 4,090 $ 5,039 $ 5,544 $ 6,538 $ 6,545 $ 4,796
Average Final Average Salary $ 108,307 $ 113,994 $ 113,254 $ 114,783 $ 111,708 $ 122,579 $ 114,885
Number of Benefit Recipients 88 66 47 62 34 24 321
For the Year Ended June 30, 2012
Average Monthly Defined Benefit $ 2,508 $ 4,006 $ 4,999 $ 5,265 $ 6,212 $ 6,230 $ 4,478
Average Final Average Salary $ 73,561 $ 114,043 $ 112,826 $ 114,625 $ 111,708 $ 122,579 $ 112,885
Number of Benefit Recipients 74 67 48 63 34 25 311
For the Year Ended June 30, 2011
Average Monthly Defined Benefit $ 2,495 $ 4,104 $ 5,043 $ 5,317 $ 6,337 $ 6,162 $ 4,513
Average Final Average Salary $ 57,717 $ 113,387 $ 112,461 $ 113,606 $ 111,708 $ 120,715 $ 111,151
Number of Benefit Recipients 75 66 47 64 35 23 310
1INPRS intends to make this schedule a 10-year schedule over time.2Calculated using the prior year census data, adjusted for certain activity during the fiscal year.
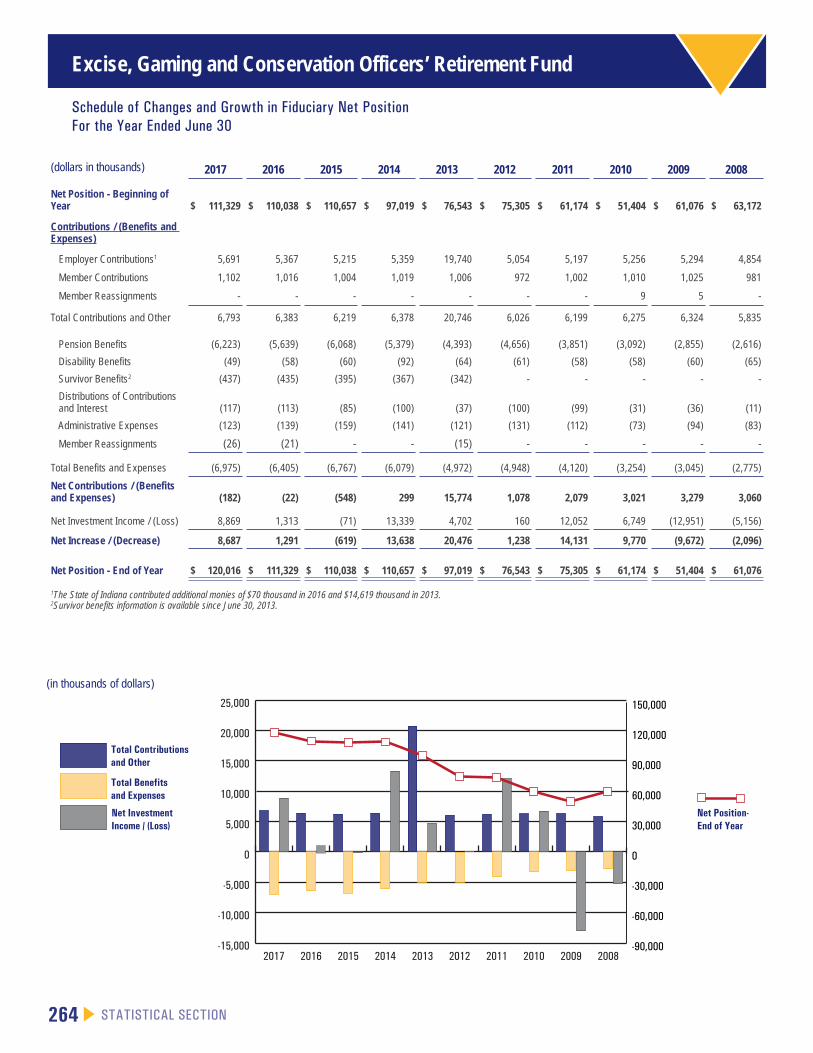
264 STATISTICAL SECTION
Excise, Gaming and Conservation Officers’ Retirement Fund
Schedule of Changes and Growth in Fiduciary Net PositionFor the Year Ended June 30
-15,000
-10,000
-5,000
0
5,000
10,000
15,000
20,000
25,000
2008200920102011201220132014201520162017-90,000
-60,000
-30,000
0
30,000
60,000
90,000
120,000
150,000
Net Position-End of Year
Net InvestmentIncome / (Loss)
Total Benefitsand Expenses
Total Contributionsand Other
(dollars in thousands) 2017 2016 2015 2014 2013 2012 2011 2010 2009 2008
Net Position - Beginning of Year $ 111,329 $ 110,038 $ 110,657 $ 97,019 $ 76,543 $ 75,305 $ 61,174 $ 51,404 $ 61,076 $ 63,172
Contributions / (Benefits and Expenses)
Employer Contributions1 5,691 5,367 5,215 5,359 19,740 5,054 5,197 5,256 5,294 4,854
Member Contributions 1,102 1,016 1,004 1,019 1,006 972 1,002 1,010 1,025 981
Member Reassignments - - - - - - - 9 5 -
Total Contributions and Other 6,793 6,383 6,219 6,378 20,746 6,026 6,199 6,275 6,324 5,835
Pension Benefits (6,223) (5,639) (6,068) (5,379) (4,393) (4,656) (3,851) (3,092) (2,855) (2,616)
Disability Benefits (49) (58) (60) (92) (64) (61) (58) (58) (60) (65)
Survivor Benefits2 (437) (435) (395) (367) (342) - - - - -
Distributions of Contributions and Interest (117) (113) (85) (100) (37) (100) (99) (31) (36) (11)
Administrative Expenses (123) (139) (159) (141) (121) (131) (112) (73) (94) (83)
Member Reassignments (26) (21) - - (15) - - - - -
Total Benefits and Expenses (6,975) (6,405) (6,767) (6,079) (4,972) (4,948) (4,120) (3,254) (3,045) (2,775)
Net Contributions / (Benefits and Expenses) (182) (22) (548) 299 15,774 1,078 2,079 3,021 3,279 3,060
Net Investment Income / (Loss) 8,869 1,313 (71) 13,339 4,702 160 12,052 6,749 (12,951) (5,156)
Net Increase / (Decrease) 8,687 1,291 (619) 13,638 20,476 1,238 14,131 9,770 (9,672) (2,096)
Net Position - End of Year $ 120,016 $ 111,329 $ 110,038 $ 110,657 $ 97,019 $ 76,543 $ 75,305 $ 61,174 $ 51,404 $ 61,076
1The State of Indiana contributed additional monies of $70 thousand in 2016 and $14,619 thousand in 2013.2Survivor benefits information is available since June 30, 2013.
(in thousands of dollars)
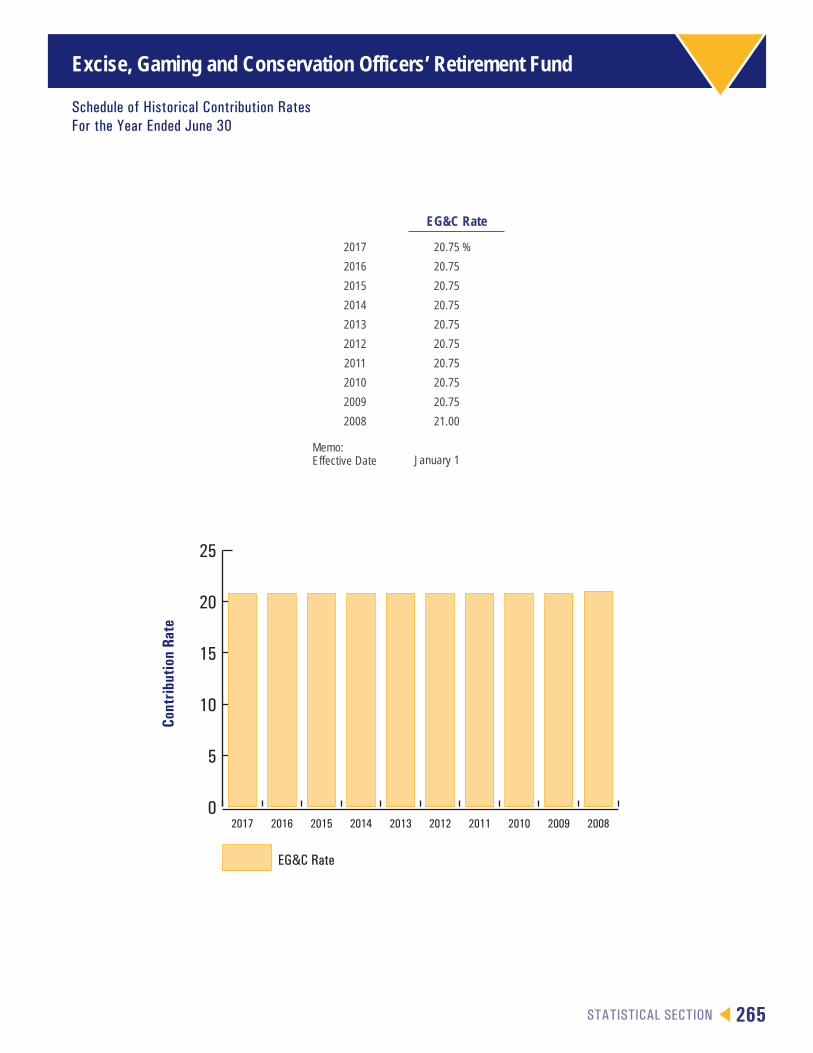
STATISTICAL SECTION 265
Excise, Gaming and Conservation Officers’ Retirement Fund
Schedule of Historical Contribution RatesFor the Year Ended June 30
0
5
10
15
20
25
EG&C Rate
2008200920102011201220132014201520162017
Cont
ribut
ion
Rate
EG&C Rate
2017 20.75 %
2016 20.75
2015 20.75
2014 20.75
2013 20.75
2012 20.75
2011 20.75
2010 20.75
2009 20.75
2008 21.00
Memo:Effective Date January 1
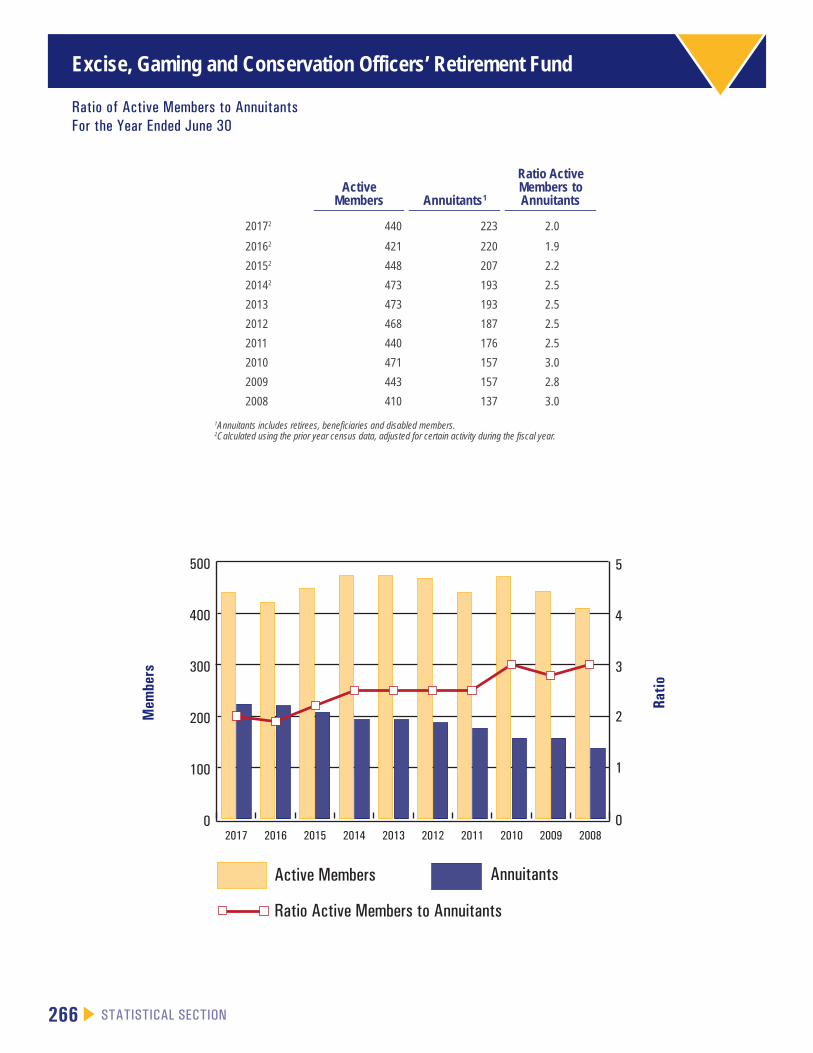
266 STATISTICAL SECTION
Excise, Gaming and Conservation Officers’ Retirement Fund
Ratio of Active Members to AnnuitantsFor the Year Ended June 30
0
100
200
300
400
500
20082009201020112012201320142015201620170
1
2
3
4
5
Ratio Active Members to Annuitants
AnnuitantsActive Members
Mem
bers
Ratio
Active Members Annuitants1
Ratio Active Members to Annuitants
20172 440 223 2.0
20162 421 220 1.9
20152 448 207 2.2
20142 473 193 2.5
2013 473 193 2.5
2012 468 187 2.5
2011 440 176 2.5
2010 471 157 3.0
2009 443 157 2.8
2008 410 137 3.0
1Annuitants includes retirees, beneficiaries and disabled members.2Calculated using the prior year census data, adjusted for certain activity during the fiscal year.

STATISTICAL SECTION 267
Excise, Gaming and Conservation Officers’ Retirement Fund
Schedule of Benefit Recipients by Type of Benefit OptionFor the Year Ended June 30, 20171
Number of Benefit Recipients by Benefit Option
Amount of Monthly Benefit (in dollars)
Joint With One-Half Survivor
Benefits Survivors DisabilityTotal Benefit Recipients
$ 1 - 500 2 12 1 15
501 - 1,000 11 19 - 30
1,001 - 1,500 15 10 1 26
1,501 - 2,000 12 2 - 14
2,001 - 3,000 81 - 1 82
Over 3,000 56 - - 56
Total 177 43 3 223
Joint With One-Half Survivor Benefits — Provides a monthly benefit for retiree’s life. Upon the death of the retiree, the qualified designated survivor receives 50 percent of the member’s monthly benefit for the remainder of the survivor’s life.
Survivors — Members receiving a survivor benefit in accordance with the applicable statute. The benefit ceases upon the death of the survivor.
Disability — Members receiving a disability benefit in accordance with the applicable statute. For EG&C, there is no minimum creditable service requirement.
1Calculated using the prior year census data, adjusted for certain activity during the fiscal year.
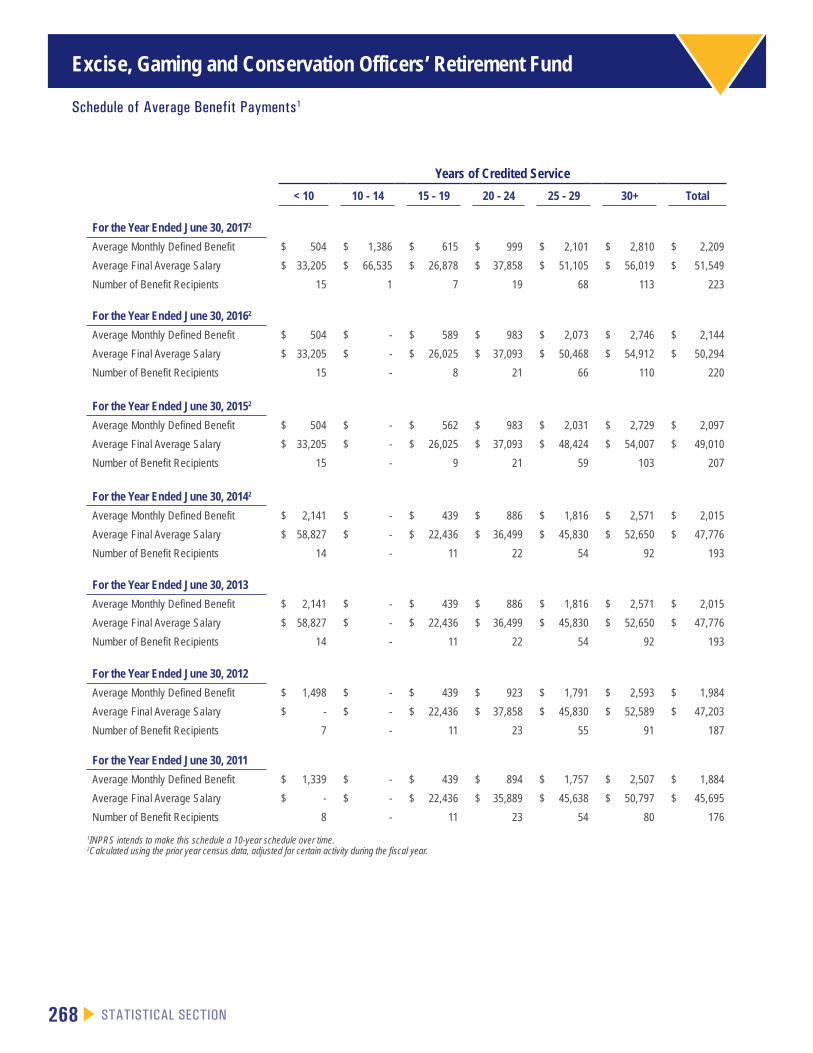
268 STATISTICAL SECTION
Excise, Gaming and Conservation Officers’ Retirement Fund
Schedule of Average Benefit Payments1
Years of Credited Service
< 10 10 - 14 15 - 19 20 - 24 25 - 29 30+ Total
For the Year Ended June 30, 20172
Average Monthly Defined Benefit $ 504 $ 1,386 $ 615 $ 999 $ 2,101 $ 2,810 $ 2,209
Average Final Average Salary $ 33,205 $ 66,535 $ 26,878 $ 37,858 $ 51,105 $ 56,019 $ 51,549
Number of Benefit Recipients 15 1 7 19 68 113 223
For the Year Ended June 30, 20162
Average Monthly Defined Benefit $ 504 $ - $ 589 $ 983 $ 2,073 $ 2,746 $ 2,144
Average Final Average Salary $ 33,205 $ - $ 26,025 $ 37,093 $ 50,468 $ 54,912 $ 50,294
Number of Benefit Recipients 15 - 8 21 66 110 220
For the Year Ended June 30, 20152
Average Monthly Defined Benefit $ 504 $ - $ 562 $ 983 $ 2,031 $ 2,729 $ 2,097
Average Final Average Salary $ 33,205 $ - $ 26,025 $ 37,093 $ 48,424 $ 54,007 $ 49,010
Number of Benefit Recipients 15 - 9 21 59 103 207
For the Year Ended June 30, 20142
Average Monthly Defined Benefit $ 2,141 $ - $ 439 $ 886 $ 1,816 $ 2,571 $ 2,015
Average Final Average Salary $ 58,827 $ - $ 22,436 $ 36,499 $ 45,830 $ 52,650 $ 47,776
Number of Benefit Recipients 14 - 11 22 54 92 193
For the Year Ended June 30, 2013
Average Monthly Defined Benefit $ 2,141 $ - $ 439 $ 886 $ 1,816 $ 2,571 $ 2,015
Average Final Average Salary $ 58,827 $ - $ 22,436 $ 36,499 $ 45,830 $ 52,650 $ 47,776
Number of Benefit Recipients 14 - 11 22 54 92 193
For the Year Ended June 30, 2012
Average Monthly Defined Benefit $ 1,498 $ - $ 439 $ 923 $ 1,791 $ 2,593 $ 1,984
Average Final Average Salary $ - $ - $ 22,436 $ 37,858 $ 45,830 $ 52,589 $ 47,203
Number of Benefit Recipients 7 - 11 23 55 91 187
For the Year Ended June 30, 2011
Average Monthly Defined Benefit $ 1,339 $ - $ 439 $ 894 $ 1,757 $ 2,507 $ 1,884
Average Final Average Salary $ - $ - $ 22,436 $ 35,889 $ 45,638 $ 50,797 $ 45,695
Number of Benefit Recipients 8 - 11 23 54 80 176
1INPRS intends to make this schedule a 10-year schedule over time.2Calculated using the prior year census data, adjusted for certain activity during the fiscal year.
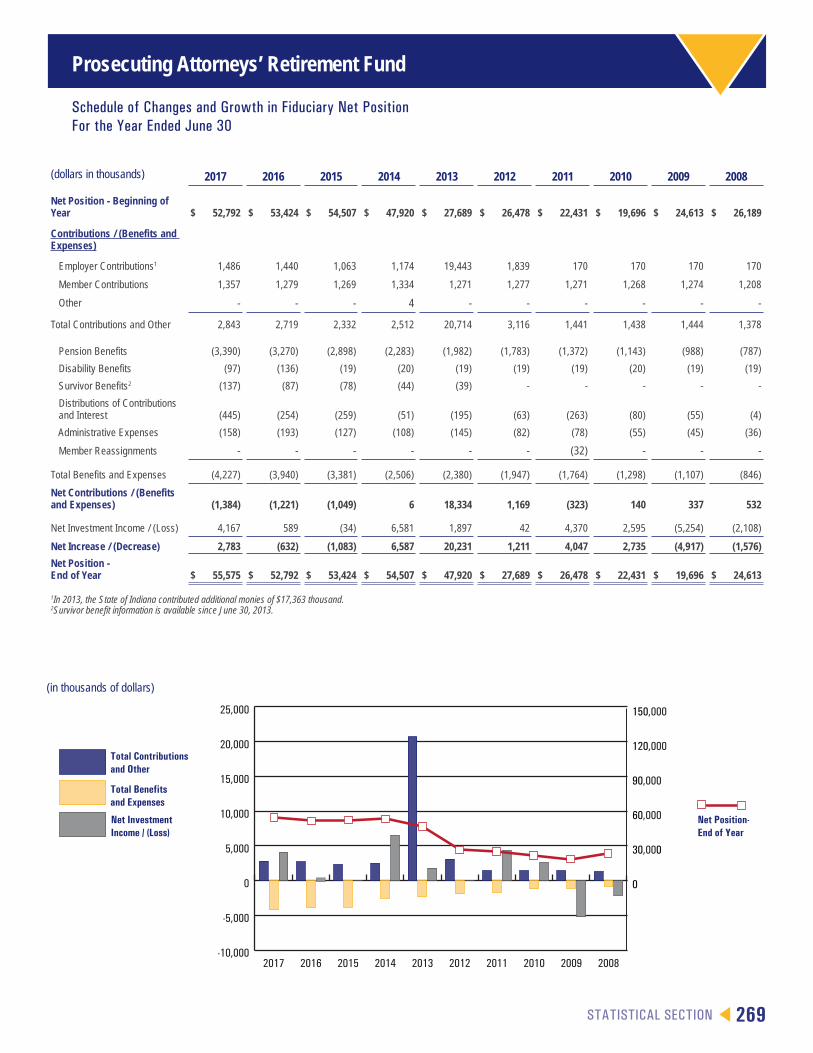
Prosecuting Attorneys’ Retirement Fund
STATISTICAL SECTION 269
Schedule of Changes and Growth in Fiduciary Net PositionFor the Year Ended June 30
-10,000
-5,000
0
5,000
10,000
15,000
20,000
25,000
2008200920102011201220132014201520162017
0
30,000
60,000
90,000
120,000
150,000
Net Position-End of Year
Net InvestmentIncome / (Loss)
Total Benefitsand Expenses
Total Contributionsand Other
(dollars in thousands) 2017 2016 2015 2014 2013 2012 2011 2010 2009 2008
Net Position - Beginning of Year $ 52,792 $ 53,424 $ 54,507 $ 47,920 $ 27,689 $ 26,478 $ 22,431 $ 19,696 $ 24,613 $ 26,189
Contributions / (Benefits and Expenses)
Employer Contributions1 1,486 1,440 1,063 1,174 19,443 1,839 170 170 170 170
Member Contributions 1,357 1,279 1,269 1,334 1,271 1,277 1,271 1,268 1,274 1,208
Other - - - 4 - - - - - -
Total Contributions and Other 2,843 2,719 2,332 2,512 20,714 3,116 1,441 1,438 1,444 1,378
Pension Benefits (3,390) (3,270) (2,898) (2,283) (1,982) (1,783) (1,372) (1,143) (988) (787)
Disability Benefits (97) (136) (19) (20) (19) (19) (19) (20) (19) (19)
Survivor Benefits2 (137) (87) (78) (44) (39) - - - - -
Distributions of Contributions and Interest (445) (254) (259) (51) (195) (63) (263) (80) (55) (4)
Administrative Expenses (158) (193) (127) (108) (145) (82) (78) (55) (45) (36)
Member Reassignments - - - - - - (32) - - -
Total Benefits and Expenses (4,227) (3,940) (3,381) (2,506) (2,380) (1,947) (1,764) (1,298) (1,107) (846)
Net Contributions / (Benefits and Expenses) (1,384) (1,221) (1,049) 6 18,334 1,169 (323) 140 337 532
Net Investment Income / (Loss) 4,167 589 (34) 6,581 1,897 42 4,370 2,595 (5,254) (2,108)
Net Increase / (Decrease) 2,783 (632) (1,083) 6,587 20,231 1,211 4,047 2,735 (4,917) (1,576)
Net Position - End of Year $ 55,575 $ 52,792 $ 53,424 $ 54,507 $ 47,920 $ 27,689 $ 26,478 $ 22,431 $ 19,696 $ 24,613
1In 2013, the State of Indiana contributed additional monies of $17,363 thousand.2Survivor benefit information is available since June 30, 2013.
(in thousands of dollars)
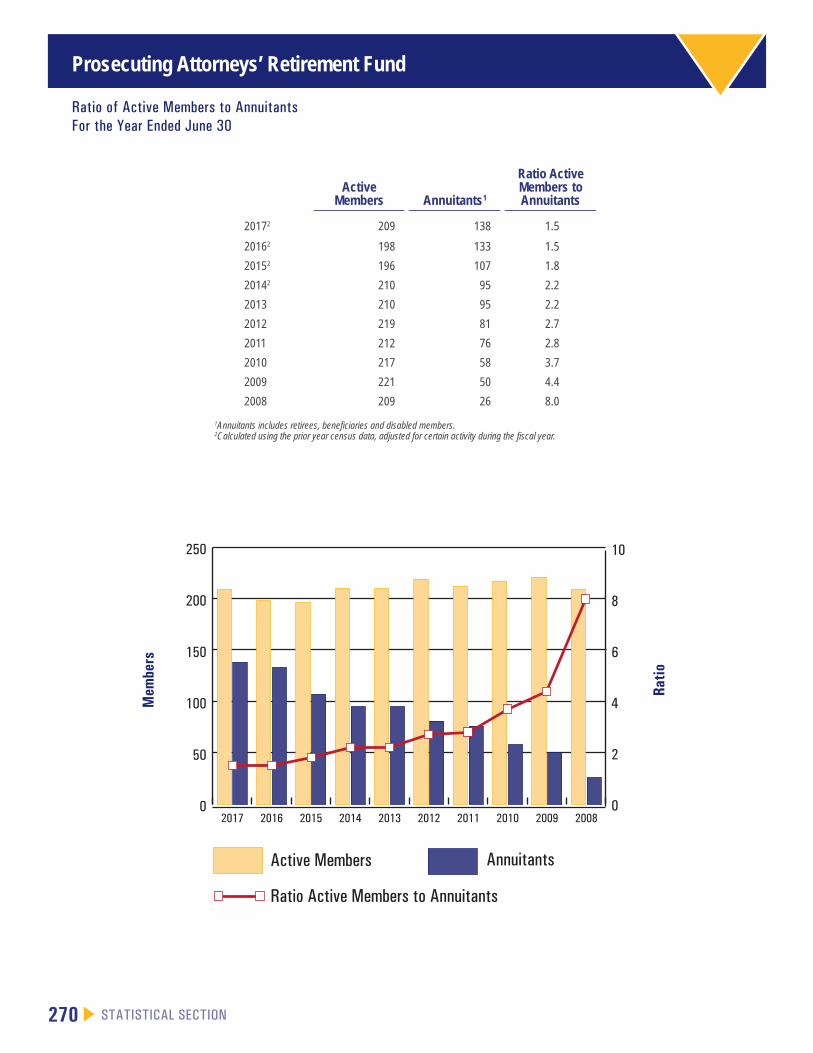
Prosecuting Attorneys’ Retirement Fund
270 STATISTICAL SECTION
Ratio of Active Members to AnnuitantsFor the Year Ended June 30
0
50
100
150
200
250
20082009201020112012201320142015201620170
2
4
6
8
10
Ratio Active Members to Annuitants
AnnuitantsActive Members
Mem
bers
Ratio
Active Members Annuitants1
Ratio Active Members to Annuitants
20172 209 138 1.5
20162 198 133 1.5
20152 196 107 1.8
20142 210 95 2.2
2013 210 95 2.2
2012 219 81 2.7
2011 212 76 2.8
2010 217 58 3.7
2009 221 50 4.4
2008 209 26 8.0
1Annuitants includes retirees, beneficiaries and disabled members.2Calculated using the prior year census data, adjusted for certain activity during the fiscal year.
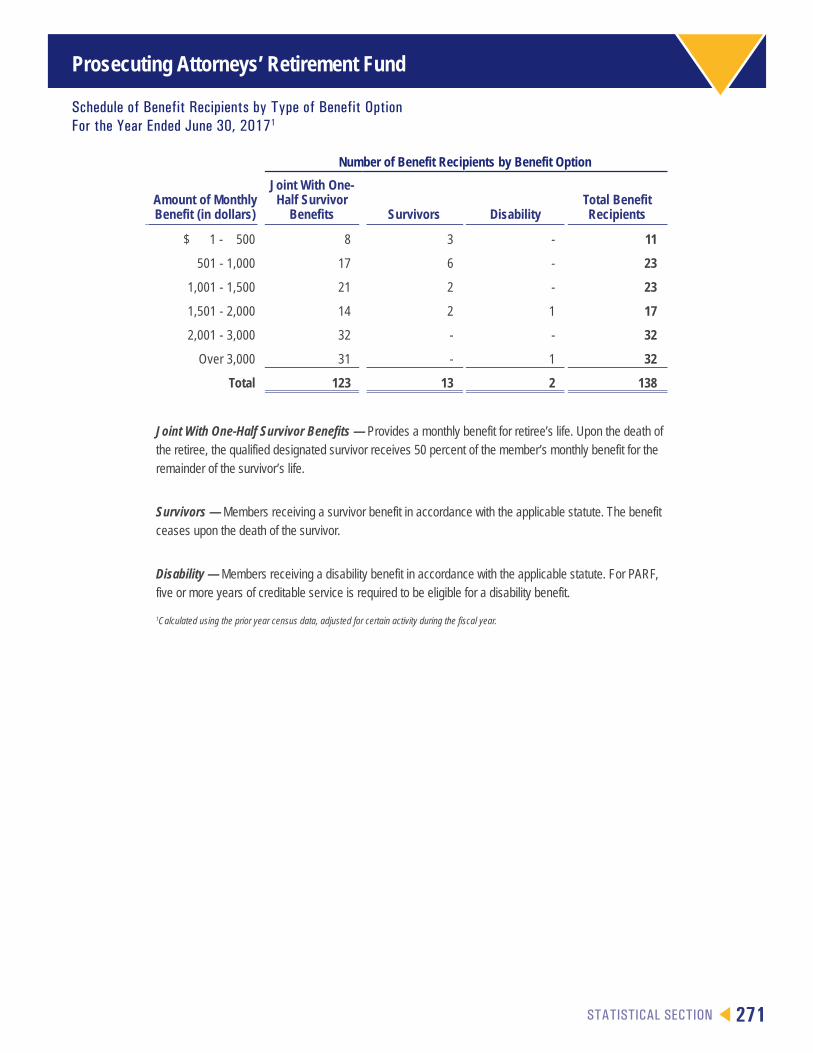
Prosecuting Attorneys’ Retirement Fund
STATISTICAL SECTION 271
Schedule of Benefit Recipients by Type of Benefit OptionFor the Year Ended June 30, 20171
Number of Benefit Recipients by Benefit Option
Amount of Monthly Benefit (in dollars)
Joint With One-Half Survivor
Benefits Survivors DisabilityTotal Benefit Recipients
$ 1 - 500 8 3 - 11
501 - 1,000 17 6 - 23
1,001 - 1,500 21 2 - 23
1,501 - 2,000 14 2 1 17
2,001 - 3,000 32 - - 32
Over 3,000 31 - 1 32
Total 123 13 2 138
Joint With One-Half Survivor Benefits — Provides a monthly benefit for retiree’s life. Upon the death of the retiree, the qualified designated survivor receives 50 percent of the member’s monthly benefit for the remainder of the survivor’s life.
Survivors — Members receiving a survivor benefit in accordance with the applicable statute. The benefit ceases upon the death of the survivor.
Disability — Members receiving a disability benefit in accordance with the applicable statute. For PARF, five or more years of creditable service is required to be eligible for a disability benefit.
1Calculated using the prior year census data, adjusted for certain activity during the fiscal year.

Prosecuting Attorneys’ Retirement Fund
272 STATISTICAL SECTION
Schedule of Average Benefit Payments1
Years of Credited Service
< 10 10 - 14 15 - 19 20 - 24 25 - 29 30+ Total
For the Year Ended June 30, 20172
Average Monthly Defined Benefit $ 1,013 $ 1,735 $ 2,128 $ 2,704 $ 2,977 $ 2,423 $ 2,098
Average Final Average Salary $ 64,922 $ 69,798 $ 77,790 $ 91,342 $ 108,040 $ 126,756 $ 81,499
Number of Benefit Recipients 10 50 32 25 11 10 138
For the Year Ended June 30, 20162
Average Monthly Defined Benefit $ 1,013 $ 1,729 $ 2,136 $ 2,665 $ 2,901 $ 2,423 $ 2,088
Average Final Average Salary $ 64,922 $ 68,303 $ 77,439 $ 90,943 $ 108,734 $ 126,756 $ 80,869
Number of Benefit Recipients 10 47 31 24 11 10 133
For the Year Ended June 30, 20152
Average Monthly Defined Benefit $ 1,163 $ 1,498 $ 1,969 $ 2,467 $ 2,589 $ 1,693 $ 1,865
Average Final Average Salary $ 83,896 $ 62,194 $ 73,614 $ 86,752 $ 99,686 $ 113,499 $ 76,315
Number of Benefit Recipients 8 38 27 20 8 6 107
For the Year Ended June 30, 20142
Average Monthly Defined Benefit $ 1,694 $ 1,445 $ 1,875 $ 2,340 $ 2,626 $ 2,187 $ 1,843
Average Final Average Salary $ 77,001 $ 54,908 $ 71,821 $ 83,707 $ 103,220 $ 110,167 $ 72,709
Number of Benefit Recipients 28 22 22 14 5 4 95
For the Year Ended June 30, 2013
Average Monthly Defined Benefit $ 1,694 $ 1,445 $ 1,875 $ 2,340 $ 2,626 $ 2,187 $ 1,843
Average Final Average Salary $ 77,001 $ 54,908 $ 71,821 $ 83,707 $ 103,220 $ 110,167 $ 72,709
Number of Benefit Recipients 28 22 22 14 5 4 95
For the Year Ended June 30, 2012
Average Monthly Defined Benefit $ 1,541 $ 1,421 $ 1,874 $ 2,283 $ 2,488 $ 2,496 $ 1,821
Average Final Average Salary $ 63,714 $ 54,908 $ 72,709 $ 83,534 $ 103,220 $ 110,167 $ 72,130
Number of Benefit Recipients 17 21 21 13 5 4 81
For the Year Ended June 30, 2011
Average Monthly Defined Benefit $ 1,541 $ 1,413 $ 1,831 $ 2,252 $ 2,219 $ 2,615 $ 1,774
Average Final Average Salary $ 58,939 $ 55,721 $ 69,668 $ 79,113 $ 95,745 $ 101,967 $ 68,573
Number of Benefit Recipients 17 20 20 12 4 3 76
1INPRS intends to make this schedule a 10-year schedule over time.2Calculated using the prior year census data, adjusted for certain activity during the fiscal year.
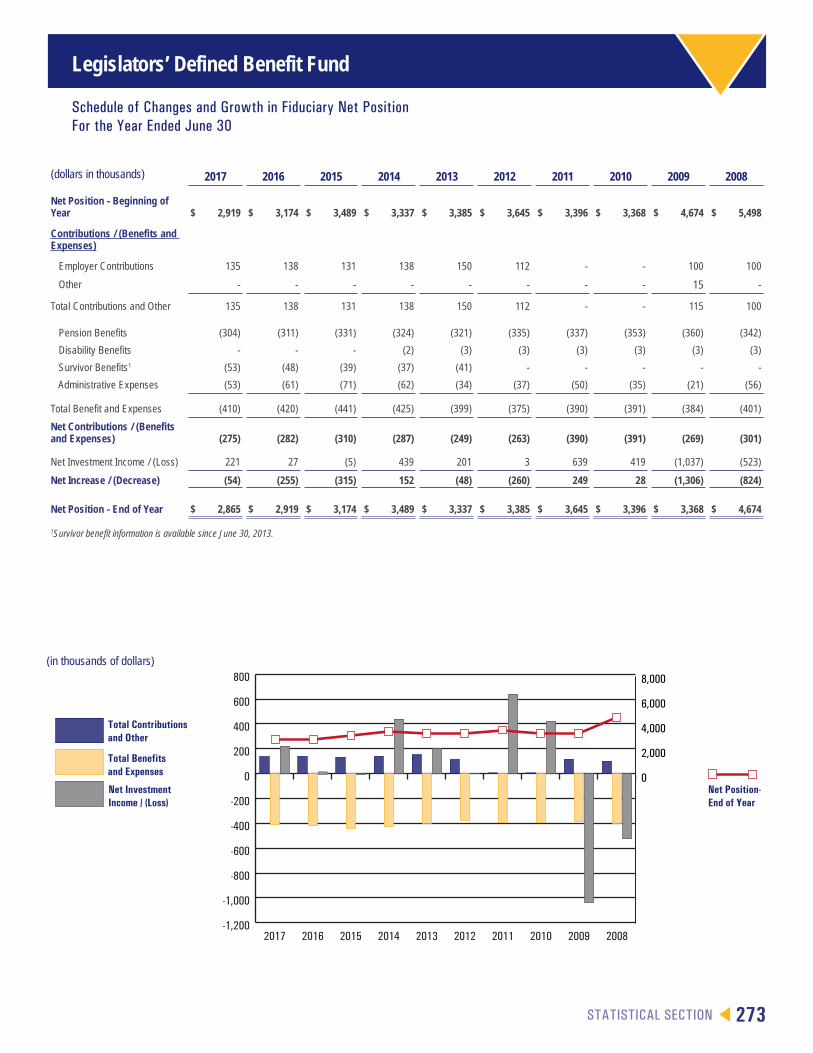
Legislators’ Defined Benefit Fund
STATISTICAL SECTION 273
Schedule of Changes and Growth in Fiduciary Net PositionFor the Year Ended June 30
-1,200
-1,000
-800
-600
-400
-200
0
200
400
600
800
2008200920102011201220132014201520162017
0
2,000
4,000
6,000
8,000
Net Position-End of Year
Net InvestmentIncome / (Loss)
Total Benefitsand Expenses
Total Contributionsand Other
(dollars in thousands) 2017 2016 2015 2014 2013 2012 2011 2010 2009 2008
Net Position - Beginning of Year $ 2,919 $ 3,174 $ 3,489 $ 3,337 $ 3,385 $ 3,645 $ 3,396 $ 3,368 $ 4,674 $ 5,498
Contributions / (Benefits and Expenses)
Employer Contributions 135 138 131 138 150 112 - - 100 100
Other - - - - - - - - 15 -
Total Contributions and Other 135 138 131 138 150 112 - - 115 100
Pension Benefits (304) (311) (331) (324) (321) (335) (337) (353) (360) (342)
Disability Benefits - - - (2) (3) (3) (3) (3) (3) (3)
Survivor Benefits1 (53) (48) (39) (37) (41) - - - - -
Administrative Expenses (53) (61) (71) (62) (34) (37) (50) (35) (21) (56)
Total Benefit and Expenses (410) (420) (441) (425) (399) (375) (390) (391) (384) (401)
Net Contributions / (Benefits and Expenses) (275) (282) (310) (287) (249) (263) (390) (391) (269) (301)
Net Investment Income / (Loss) 221 27 (5) 439 201 3 639 419 (1,037) (523)
Net Increase / (Decrease) (54) (255) (315) 152 (48) (260) 249 28 (1,306) (824)
Net Position - End of Year $ 2,865 $ 2,919 $ 3,174 $ 3,489 $ 3,337 $ 3,385 $ 3,645 $ 3,396 $ 3,368 $ 4,674
1Survivor benefit information is available since June 30, 2013.
(in thousands of dollars)

Legislators’ Defined Benefit Fund
274 STATISTICAL SECTION
Ratio of Active Members to AnnuitantsFor the Year Ended June 30
0
20
40
60
80
20082009201020112012201320142015201620170.00
0.25
0.50
0.75
1.00
Ratio Active Members to Annuitants
AnnuitantsActive Members
Mem
bers
Ratio
Active Members1 Annuitants2
Ratio Active Members to Annuitants
20173 11 72 0.2
20163 11 74 0.1
20153 17 68 0.3
20143 24 68 0.4
2013 24 68 0.4
2012 6 63 0.1
2011 7 65 0.1
2010 20 61 0.3
2009 33 59 0.6
2008 34 44 0.8
1Active Members exclude Legislators’ Defined Contribution Fund. 2Annuitants includes retirees, beneficiaries and disabled members.3Calculated using the prior year census data, adjusted for certain activity during the fiscal year.
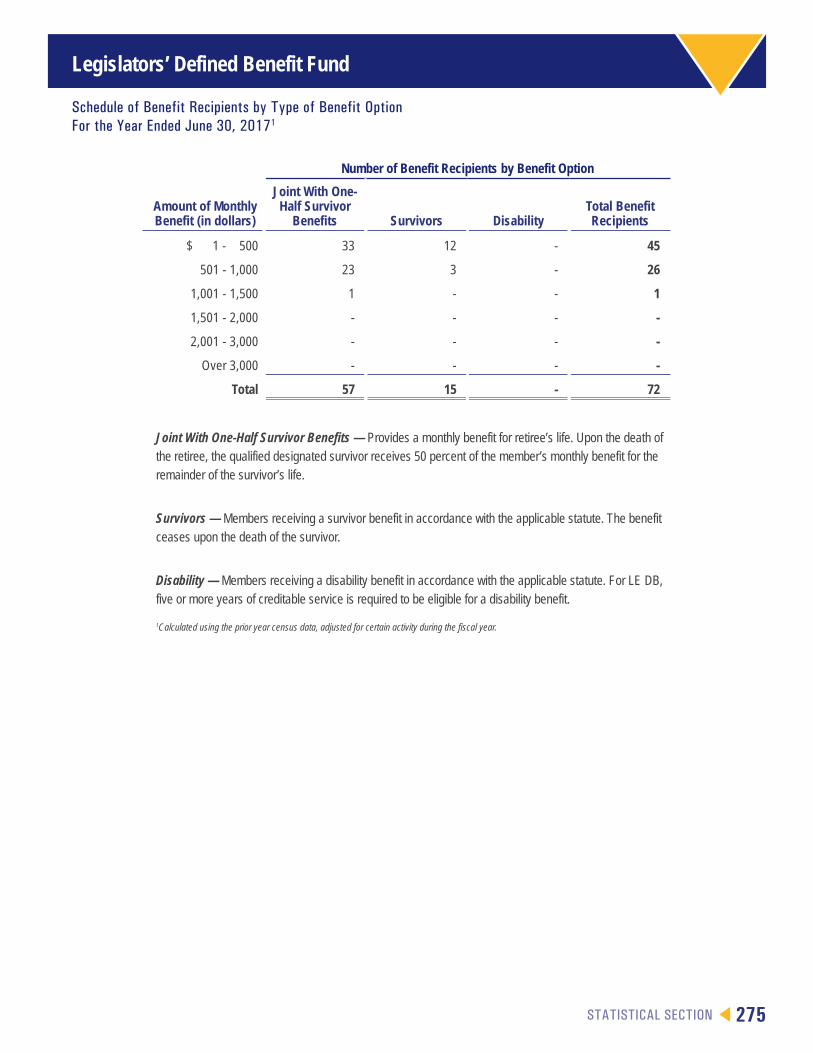
Legislators’ Defined Benefit Fund
STATISTICAL SECTION 275
Schedule of Benefit Recipients by Type of Benefit OptionFor the Year Ended June 30, 20171
Number of Benefit Recipients by Benefit Option
Amount of Monthly Benefit (in dollars)
Joint With One-Half Survivor
Benefits Survivors DisabilityTotal Benefit Recipients
$ 1 - 500 33 12 - 45
501 - 1,000 23 3 - 26
1,001 - 1,500 1 - - 1
1,501 - 2,000 - - - -
2,001 - 3,000 - - - -
Over 3,000 - - - -
Total 57 15 - 72
Joint With One-Half Survivor Benefits — Provides a monthly benefit for retiree’s life. Upon the death of the retiree, the qualified designated survivor receives 50 percent of the member’s monthly benefit for the remainder of the survivor’s life.
Survivors — Members receiving a survivor benefit in accordance with the applicable statute. The benefit ceases upon the death of the survivor.
Disability — Members receiving a disability benefit in accordance with the applicable statute. For LE DB, five or more years of creditable service is required to be eligible for a disability benefit.
1Calculated using the prior year census data, adjusted for certain activity during the fiscal year.
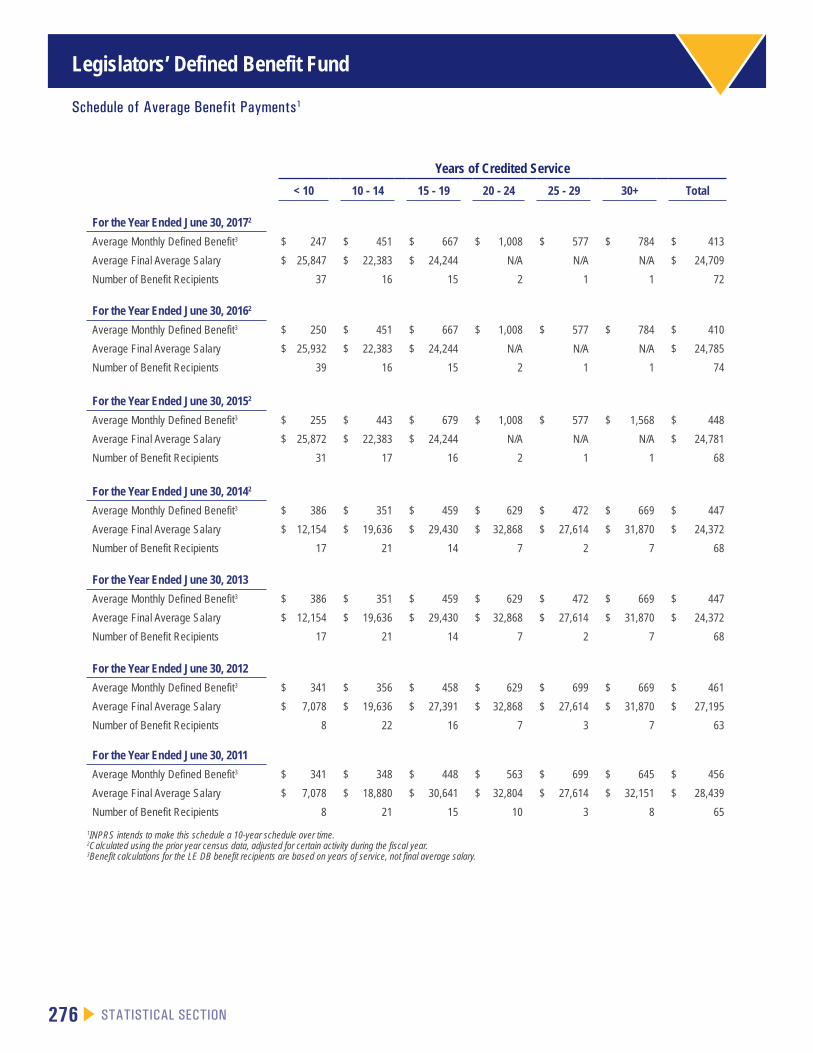
Legislators’ Defined Benefit Fund
276 STATISTICAL SECTION
Schedule of Average Benefit Payments1
Years of Credited Service
< 10 10 - 14 15 - 19 20 - 24 25 - 29 30+ Total
For the Year Ended June 30, 20172
Average Monthly Defined Benefit3 $ 247 $ 451 $ 667 $ 1,008 $ 577 $ 784 $ 413
Average Final Average Salary $ 25,847 $ 22,383 $ 24,244 N/A N/A N/A $ 24,709
Number of Benefit Recipients 37 16 15 2 1 1 72
For the Year Ended June 30, 20162
Average Monthly Defined Benefit3 $ 250 $ 451 $ 667 $ 1,008 $ 577 $ 784 $ 410
Average Final Average Salary $ 25,932 $ 22,383 $ 24,244 N/A N/A N/A $ 24,785
Number of Benefit Recipients 39 16 15 2 1 1 74
For the Year Ended June 30, 20152
Average Monthly Defined Benefit3 $ 255 $ 443 $ 679 $ 1,008 $ 577 $ 1,568 $ 448
Average Final Average Salary $ 25,872 $ 22,383 $ 24,244 N/A N/A N/A $ 24,781
Number of Benefit Recipients 31 17 16 2 1 1 68
For the Year Ended June 30, 20142
Average Monthly Defined Benefit3 $ 386 $ 351 $ 459 $ 629 $ 472 $ 669 $ 447
Average Final Average Salary $ 12,154 $ 19,636 $ 29,430 $ 32,868 $ 27,614 $ 31,870 $ 24,372
Number of Benefit Recipients 17 21 14 7 2 7 68
For the Year Ended June 30, 2013
Average Monthly Defined Benefit3 $ 386 $ 351 $ 459 $ 629 $ 472 $ 669 $ 447
Average Final Average Salary $ 12,154 $ 19,636 $ 29,430 $ 32,868 $ 27,614 $ 31,870 $ 24,372
Number of Benefit Recipients 17 21 14 7 2 7 68
For the Year Ended June 30, 2012
Average Monthly Defined Benefit3 $ 341 $ 356 $ 458 $ 629 $ 699 $ 669 $ 461
Average Final Average Salary $ 7,078 $ 19,636 $ 27,391 $ 32,868 $ 27,614 $ 31,870 $ 27,195
Number of Benefit Recipients 8 22 16 7 3 7 63
For the Year Ended June 30, 2011
Average Monthly Defined Benefit3 $ 341 $ 348 $ 448 $ 563 $ 699 $ 645 $ 456
Average Final Average Salary $ 7,078 $ 18,880 $ 30,641 $ 32,804 $ 27,614 $ 32,151 $ 28,439
Number of Benefit Recipients 8 21 15 10 3 8 65
1INPRS intends to make this schedule a 10-year schedule over time.2Calculated using the prior year census data, adjusted for certain activity during the fiscal year. 3Benefit calculations for the LE DB benefit recipients are based on years of service, not final average salary.
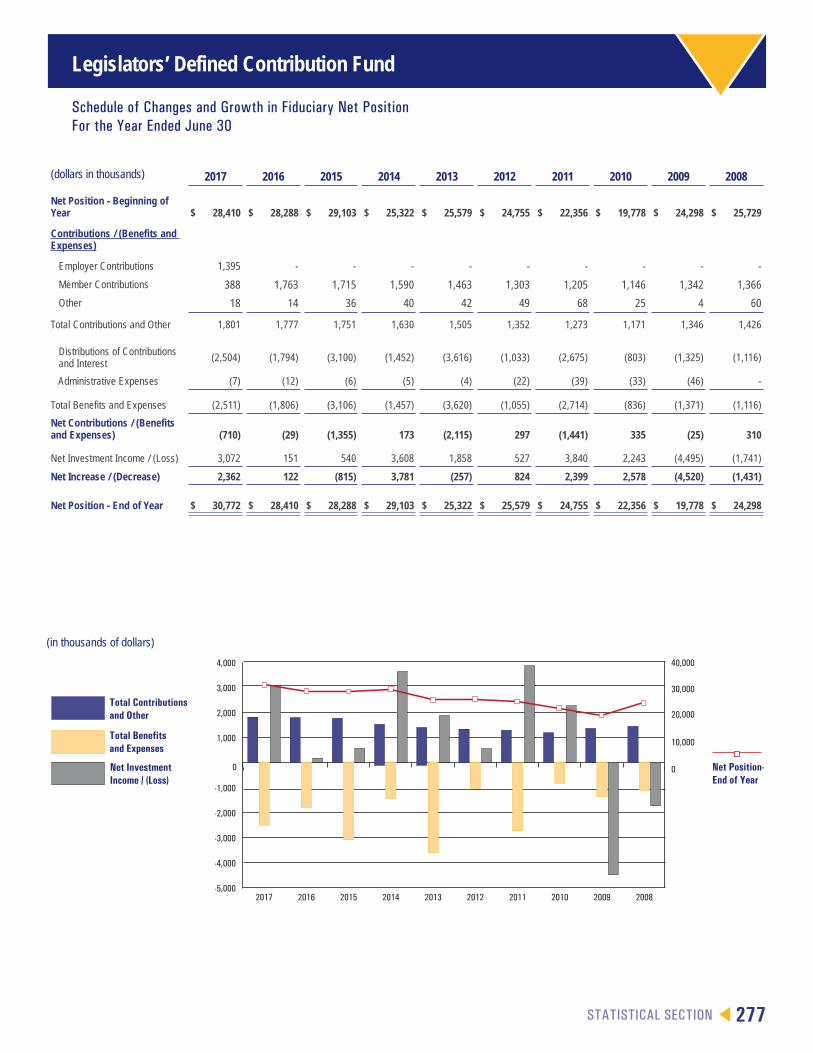
Legislators’ Defined Contribution Fund
STATISTICAL SECTION 277
Schedule of Changes and Growth in Fiduciary Net PositionFor the Year Ended June 30
Net Investment
Total Bene�ts
Total Contributions
2008200920102011201220132014201520162017
Net Position-End of Year
Net InvestmentIncome / (Loss)
Total Benefitsand Expenses
Total Contributionsand Other
0
10,000
20,000
30,000
40,000
-5,000
-4,000
-3,000
-2,000
-1,000
0
1,000
2,000
3,000
4,000
(dollars in thousands) 2017 2016 2015 2014 2013 2012 2011 2010 2009 2008
Net Position - Beginning of Year $ 28,410 $ 28,288 $ 29,103 $ 25,322 $ 25,579 $ 24,755 $ 22,356 $ 19,778 $ 24,298 $ 25,729
Contributions / (Benefits and Expenses)
Employer Contributions 1,395 - - - - - - - - -
Member Contributions 388 1,763 1,715 1,590 1,463 1,303 1,205 1,146 1,342 1,366
Other 18 14 36 40 42 49 68 25 4 60
Total Contributions and Other 1,801 1,777 1,751 1,630 1,505 1,352 1,273 1,171 1,346 1,426
Distributions of Contributions and Interest (2,504) (1,794) (3,100) (1,452) (3,616) (1,033) (2,675) (803) (1,325) (1,116)
Administrative Expenses (7) (12) (6) (5) (4) (22) (39) (33) (46) -
Total Benefits and Expenses (2,511) (1,806) (3,106) (1,457) (3,620) (1,055) (2,714) (836) (1,371) (1,116)
Net Contributions / (Benefits and Expenses) (710) (29) (1,355) 173 (2,115) 297 (1,441) 335 (25) 310
Net Investment Income / (Loss) 3,072 151 540 3,608 1,858 527 3,840 2,243 (4,495) (1,741)
Net Increase / (Decrease) 2,362 122 (815) 3,781 (257) 824 2,399 2,578 (4,520) (1,431)
Net Position - End of Year $ 30,772 $ 28,410 $ 28,288 $ 29,103 $ 25,322 $ 25,579 $ 24,755 $ 22,356 $ 19,778 $ 24,298
(in thousands of dollars)
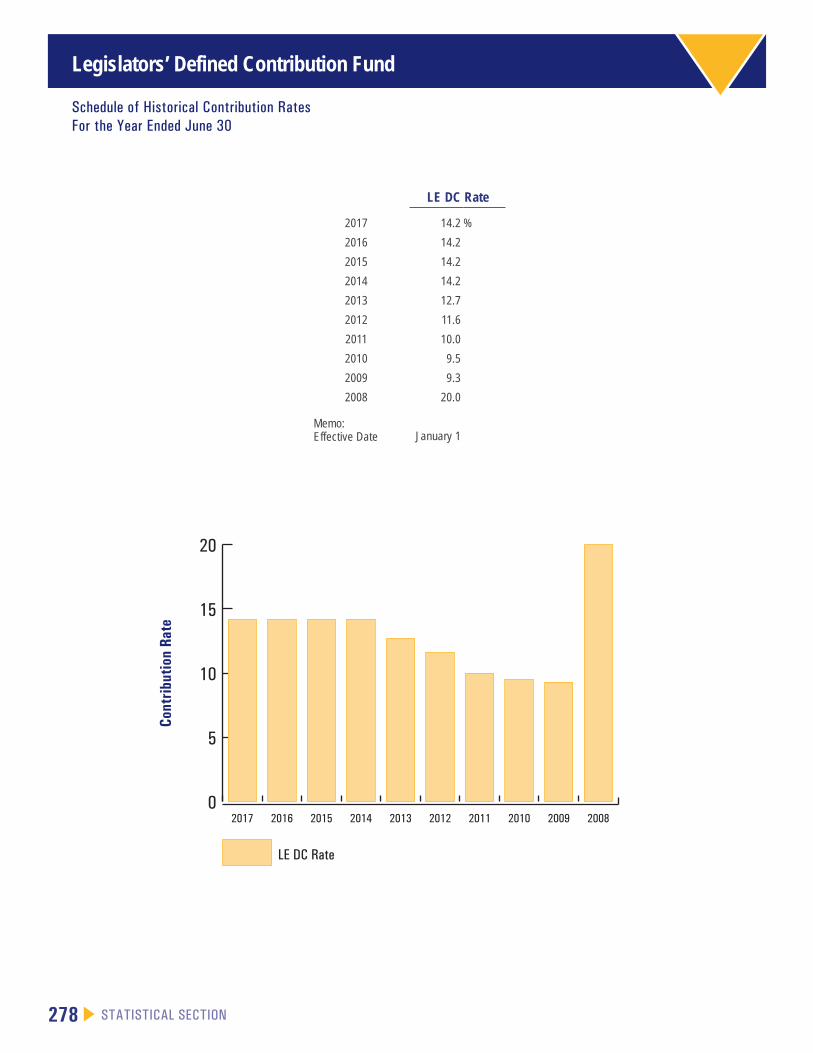
Legislators’ Defined Contribution Fund
278 STATISTICAL SECTION
Schedule of Historical Contribution RatesFor the Year Ended June 30
0
5
10
15
20
LE DC Rate
2008200920102011201220132014201520162017
Cont
ribut
ion
Rate
LE DC Rate
2017 14.2 %
2016 14.2
2015 14.2
2014 14.2
2013 12.7
2012 11.6
2011 10.0
2010 9.5
2009 9.3
2008 20.0
Memo:Effective Date January 1
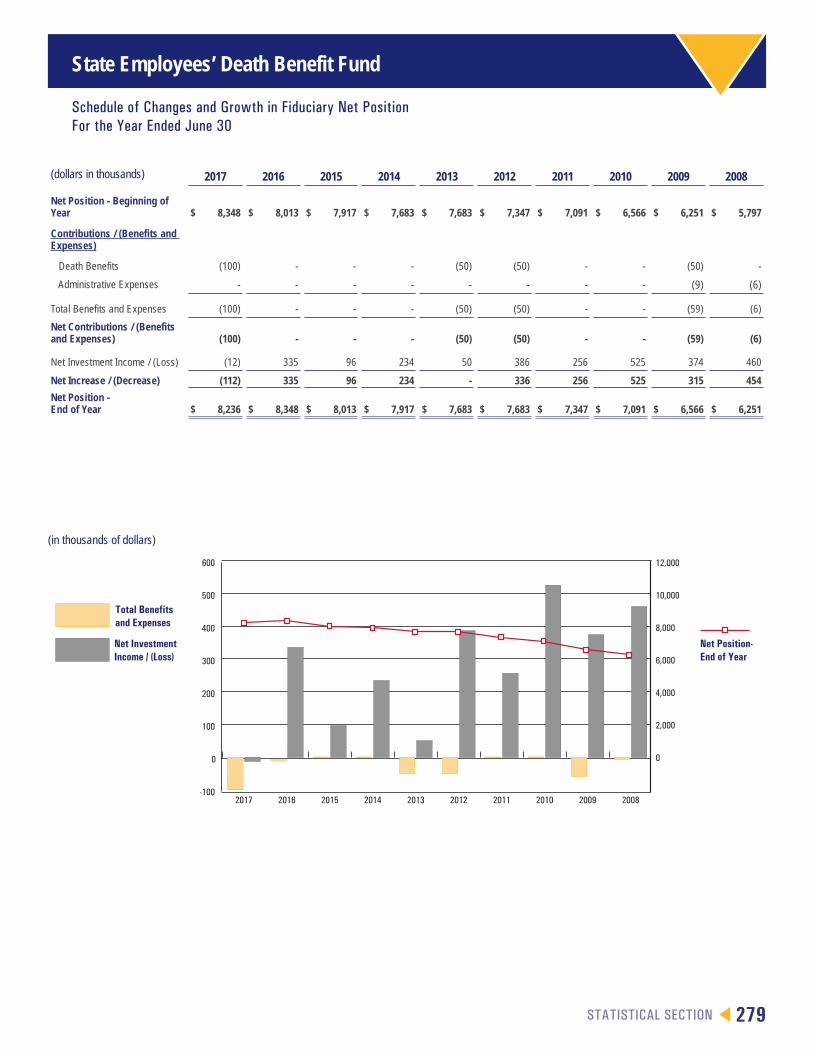
State Employees’ Death Benefit Fund
STATISTICAL SECTION 279
Schedule of Changes and Growth in Fiduciary Net PositionFor the Year Ended June 30
-100
0
100
200
300
400
500
600
2008200920102011201220132014201520162017
0
2,000
4,000
6,000
8,000
10,000
12,000
Total Benefitsand Expenses
Net Position-End of Year
Net InvestmentIncome / (Loss)
(dollars in thousands) 2017 2016 2015 2014 2013 2012 2011 2010 2009 2008
Net Position - Beginning of Year $ 8,348 $ 8,013 $ 7,917 $ 7,683 $ 7,683 $ 7,347 $ 7,091 $ 6,566 $ 6,251 $ 5,797
Contributions / (Benefits and Expenses)
Death Benefits (100) - - - (50) (50) - - (50) -
Administrative Expenses - - - - - - - - (9) (6)
Total Benefits and Expenses (100) - - - (50) (50) - - (59) (6)
Net Contributions / (Benefits and Expenses) (100) - - - (50) (50) - - (59) (6)
Net Investment Income / (Loss) (12) 335 96 234 50 386 256 525 374 460
Net Increase / (Decrease) (112) 335 96 234 - 336 256 525 315 454
Net Position - End of Year $ 8,236 $ 8,348 $ 8,013 $ 7,917 $ 7,683 $ 7,683 $ 7,347 $ 7,091 $ 6,566 $ 6,251
(in thousands of dollars)

State Employees’ Death Benefit Fund
280 STATISTICAL SECTION
Schedule of Average Death Benefit Payments1
For the Year Ended June 30, 2017Average Death Benefit $ 100,000
Average Final Average Salary N/A
Number of Benefit Recipients 1
For the Year Ended June 30, 2016Average Death Benefit $ -
Average Final Average Salary N/A
Number of Benefit Recipients -
For the Year Ended June 30, 2015Average Death Benefit $ -
Average Final Average Salary N/A
Number of Benefit Recipients -
For the Year Ended June 30, 2014Average Death Benefit $ -
Average Final Average Salary N/A
Number of Benefit Recipients -
For the Year Ended June 30, 2013Average Death Benefit $ 50,000
Average Final Average Salary N/A
Number of Benefit Recipients 1
For the Year Ended June 30, 2012Average Death Benefit $ 50,000
Average Final Average Salary N/A
Number of Benefit Recipients 1
For the Year Ended June 30, 2011Average Death Benefit $ -
Average Final Average Salary N/A
Number of Benefit Recipients -
For the Year Ended June 30, 2010Average Death Benefit $ -
Average Final Average Salary N/A
Number of Benefit Recipients -
For the Year Ended June 30, 2009Average Death Benefit $ 50,000
Average Final Average Salary N/A
Number of Benefit Recipients 1
For the Year Ended June 30, 2008Average Death Benefit $ -
Average Final Average Salary N/A
Number of Benefit Recipients -
0
1
2
State Employees' Death Benefit Fund
2008200920102011201220132014201520162017
Number of Benefit Recipients
1Lump sum death benefit of $100,000 paid to the surviving spouse or child(ren) of a state employee who dies in the line of duty as defined in statute (IC 5-10-11). Prior to 2014, the death benefit was $50,000.

Public Safety Officers’ Special Death Benefit Fund
STATISTICAL SECTION 281
Schedule of Changes and Growth in Fiduciary Net PositionFor the Year Ended June 30
-600
-500
-400
-300
-200
-100
0
100
200
300
400
500
600
700
800
2008200920102011201220132014201520162017-6,000
-5,000
-4,000
-3,000
-2,000
-1,000
0
1,000
2,000
3,000
4,000
5,000
6,000
7,000
8,000
Net Position-End of Year
Net InvestmentIncome / (Loss)
Total Benefitsand Expenses
Total Contributionsand Other
(dollars in thousands) 2017 2016 2015 2014 2013 2012 2011 2010 2009 2008
Net Position - Beginning of Year $ 6,303 $ 5,596 $ 5,174 $ 4,653 $ 4,683 $ 3,758 $ 3,244 $ 2,842 $ 2,459 $ 2,232
Contributions / (Benefits and Expenses)
Nonemployer Contributing Entity 564 611 506 525 544 716 548 626 539 517
Total Contributions and Other 564 611 506 525 544 716 548 626 539 517
Death Benefits - (150) (150) (150) (600) - (150) (450) (300) (450)
Administrative Expenses - - - - - - - - (3) (2)
Total Benefits and Expenses - (150) (150) (150) (600) - (150) (450) (303) (452)
Net Contributions / (Benefits and Expenses) 564 461 356 375 (56) 716 398 176 236 65
Net Investment Income / (Loss) (5) 246 66 146 26 209 116 226 147 162
Net Increase / (Decrease) 559 707 422 521 (30) 925 514 402 383 227
Net Position - End of Year $ 6,862 $ 6,303 $ 5,596 $ 5,174 $ 4,653 $ 4,683 $ 3,758 $ 3,244 $ 2,842 $ 2,459
(in thousands of dollars)

Public Safety Officers’ Special Death Benefit Fund
282 STATISTICAL SECTION
Schedule of Average Death Benefit Payments1
0
1
2
3
4
Public Safety Officers’ Special Death Benefit Fund
2008200920102011201220132014201520162017
Number of Benefit Recipients
For the Year Ended June 30, 2017Average Death Benefit $ -
Average Final Average Salary N/A
Number of Benefit Recipients -
For the Year Ended June 30, 2016Average Death Benefit $ 150,000
Average Final Average Salary N/A
Number of Benefit Recipients 1
For the Year Ended June 30, 2015Average Death Benefit $ 150,000
Average Final Average Salary N/A
Number of Benefit Recipients 1
For the Year Ended June 30, 2014Average Death Benefit $ 150,000
Average Final Average Salary N/A
Number of Benefit Recipients 1
For the Year Ended June 30, 2013Average Death Benefit $ 150,000
Average Final Average Salary N/A
Number of Benefit Recipients 4
For the Year Ended June 30, 2012Average Death Benefit $ -
Average Final Average Salary N/A
Number of Benefit Recipients -
For the Year Ended June 30, 2011Average Death Benefit $ 150,000
Average Final Average Salary N/A
Number of Benefit Recipients 1
For the Year Ended June 30, 2010Average Death Benefit $ 150,000
Average Final Average Salary N/A
Number of Benefit Recipients 3
For the Year Ended June 30, 2009Average Death Benefit $ 150,000
Average Final Average Salary N/A
Number of Benefit Recipients 2
For the Year Ended June 30, 2008Average Death Benefit $ 150,000
Average Final Average Salary N/A
Number of Benefit Recipients 3
1Lump sum death benefit of $150,000 paid to the surviving spouse or child(ren) of a public safety officer who dies in the line of duty as defined in statute (IC 5-10-10). If there is no surviving spouse or child(ren), the benefit is paid to the parent(s).
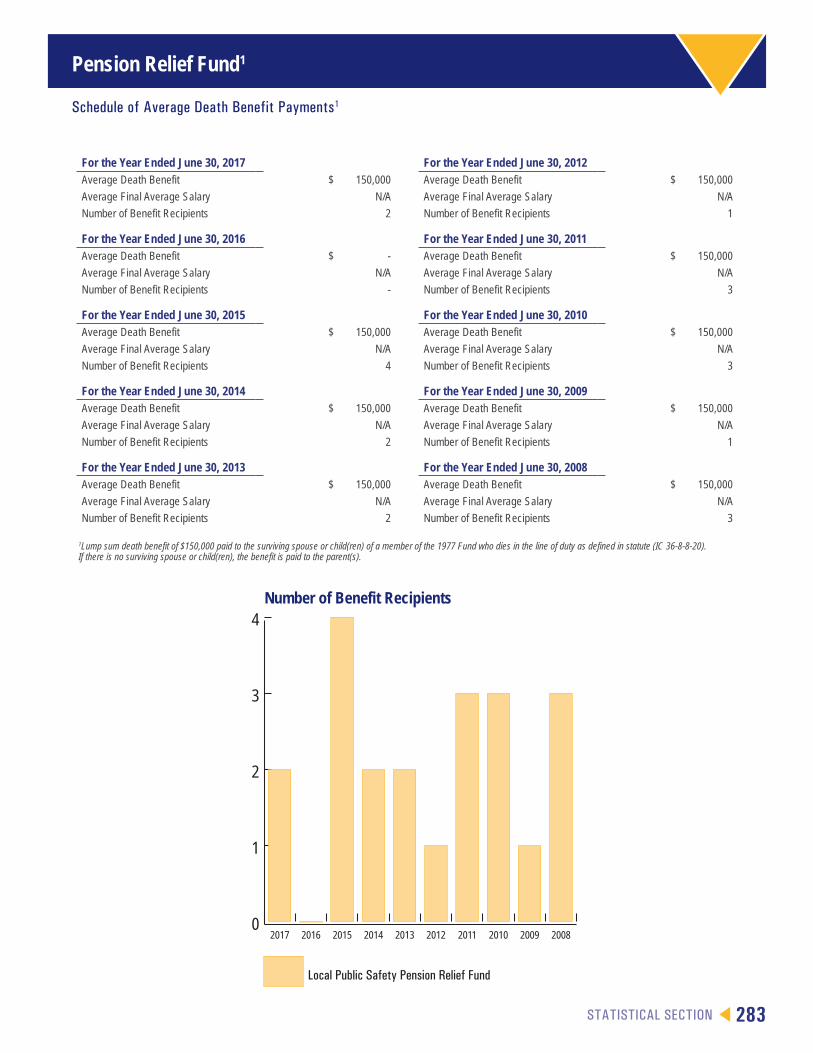
STATISTICAL SECTION 283
Pension Relief Fund1
Schedule of Average Death Benefit Payments1
0
1
2
3
4
Local Public Safety Pension Relief Fund
2008200920102011201220132014201520162017
Number of Benefit Recipients
For the Year Ended June 30, 2017Average Death Benefit $ 150,000
Average Final Average Salary N/A
Number of Benefit Recipients 2
For the Year Ended June 30, 2016Average Death Benefit $ -
Average Final Average Salary N/A
Number of Benefit Recipients -
For the Year Ended June 30, 2015Average Death Benefit $ 150,000
Average Final Average Salary N/A
Number of Benefit Recipients 4
For the Year Ended June 30, 2014Average Death Benefit $ 150,000
Average Final Average Salary N/A
Number of Benefit Recipients 2
For the Year Ended June 30, 2013Average Death Benefit $ 150,000
Average Final Average Salary N/A
Number of Benefit Recipients 2
For the Year Ended June 30, 2012Average Death Benefit $ 150,000
Average Final Average Salary N/A
Number of Benefit Recipients 1
For the Year Ended June 30, 2011Average Death Benefit $ 150,000
Average Final Average Salary N/A
Number of Benefit Recipients 3
For the Year Ended June 30, 2010Average Death Benefit $ 150,000
Average Final Average Salary N/A
Number of Benefit Recipients 3
For the Year Ended June 30, 2009Average Death Benefit $ 150,000
Average Final Average Salary N/A
Number of Benefit Recipients 1
For the Year Ended June 30, 2008Average Death Benefit $ 150,000
Average Final Average Salary N/A
Number of Benefit Recipients 3
1Lump sum death benefit of $150,000 paid to the surviving spouse or child(ren) of a member of the 1977 Fund who dies in the line of duty as defined in statute (IC 36-8-8-20). If there is no surviving spouse or child(ren), the benefit is paid to the parent(s).
