comparison of the validity of smear and culture conversion
TRANSCRIPT

RESEARCH ARTICLE
Comparison of the validity of smear and
culture conversion as a prognostic marker of
treatment outcome in patients with
multidrug-resistant tuberculosis
Kefyalew Addis Alene1,2*, Kerri Viney1,3, Hengzhong Yi4, Emma S. McBryde5,
Kunyun Yang4, Liqiong Bai6, Darren J. Gray1, Zuhui Xu7, Archie C. A. Clements1
1 Research School of Population Health, College of Health and Medicine, The Australian National University,
Canberra, Australian Capital Territory, Australia, 2 Institute of Public Health, College of Medicine and Health
Sciences, University of Gondar, Gondar, Ethiopia, 3 Department of Public Health Sciences, Karolinska
Institutet, Stockholm, Sweden, 4 Department of MDR-TB, Internal Medicine, Hunan Chest hospital,
Changsha city, Hunan Province, China, 5 Australian Institute of Tropical Health and Medicine, James Cook
University, Townsville, Queensland, Australia, 6 Department of Director’s Office, Tuberculosis Control
Institute of Hunan Province, Changsha city, Hunan Province, China, 7 Department of Tuberculosis Control,
Tuberculosis Control Institute of Hunan Province, Changsha city, Hunan Province, China
Abstract
Background
The World Health Organization (WHO) has conditionally recommended the use of sputum
smear microscopy and culture examination for the monitoring of multidrug-resistant tubercu-
losis (MDR-TB) treatment. We aimed to assess and compare the validity of smear and cul-
ture conversion at different time points during treatment for MDR-TB, as a prognostic
marker for end-of-treatment outcomes.
Methods
We undertook a retrospective observational cohort study using data obtained from Hunan
Chest Hospital, China and Gondar University Hospital, Ethiopia. The sensitivity and specific-
ity of culture and sputum smear conversion for predicting treatment outcomes were ana-
lysed using a random-effects generalized linear mixed model.
Results
A total of 429 bacteriologically confirmed MDR-TB patients with a culture and smear positive
result were included. Overall, 345 (80%) patients had a successful treatment outcome, and 84
(20%) patients had poor treatment outcomes. The sensitivity of smear and culture conversion
to predict a successful treatment outcome were: 77.9% and 68.9% at 2 months after starting
treatment (difference between tests, p = 0.007); 95.9% and 92.7% at 4 months (p = 0.06);
97.4% and 96.2% at 6 months (p = 0.386); and 99.4% and 98.9% at 12 months (p = 0.412),
respectively. The specificity of smear and culture non-conversion to predict a poor treatment
outcome were: 41.6% and 60.7% at 2 months (p = 0.012); 23.8% and 48.8% at 4 months
PLOS ONE | https://doi.org/10.1371/journal.pone.0197880 May 23, 2018 1 / 17
a1111111111
a1111111111
a1111111111
a1111111111
a1111111111
OPENACCESS
Citation: Alene KA, Viney K, Yi H, McBryde ES,
Yang K, Bai L, et al. (2018) Comparison of the
validity of smear and culture conversion as a
prognostic marker of treatment outcome in
patients with multidrug-resistant tuberculosis.
PLoS ONE 13(5): e0197880. https://doi.org/
10.1371/journal.pone.0197880
Editor: Seyed Ehtesham Hasnain, Indian Institute
of Technology Delhi, INDIA
Received: February 13, 2018
Accepted: May 10, 2018
Published: May 23, 2018
Copyright: © 2018 Alene et al. This is an open
access article distributed under the terms of the
Creative Commons Attribution License, which
permits unrestricted use, distribution, and
reproduction in any medium, provided the original
author and source are credited.
Data Availability Statement: All relevant data are
within the paper and its Supporting Information
files.
Funding: The authors received no specific funding
for this work.
Competing interests: The authors have declared
that no competing interests exist.

(p<0.001); and 20.2% and 42.8% at 6 months (p<0.001); and 15.4% and 32.1% (p<0.001) at
12 months, respectively. The sensitivity of culture and smear conversion increased as the
month of conversion increased but at the cost of decreased specificity. The optimum time
points after conversion to provide the best prognostic marker of a successful treatment out-
come were between two and four months after treatment commencement for smear, and
between four and six months for culture. The common optimum time point for smear and cul-
ture conversion was four months. At this time point, culture conversion (AUROC curve = 0.71)
was significantly better than smear conversion (AUROC curve = 0.6) in predicting successful
treatment outcomes (p < 0.001). However, the validity of smear conversion (AUROC curve =
0.7) was equivalent to culture conversion (AUROC curve = 0.71) in predicting treatment out-
comes when demographic and clinical factors were included in the model. The positive and
negative predictive values for smear conversion were: 57.3% and 65.7% at two months,
55.7% and 85.4% at four months, and 55.0% and 88.6% at six months; and for culture conver-
sions it was: 63.7% and 66.2% at two months, 64.4% and 87.1% at four months, and 62.7%
and 91.9% at six months, respectively.
Conclusions
The validity of smear conversion is significantly lower than culture conversion in predicting
MDR-TB treatment outcomes. We support the WHO recommendation of using both smear
and culture examination rather than smear alone for the monitoring of MDR-TB patients for
a better prediction of successful treatment outcomes. The optimum time points to predict a
future successful treatment outcome were between two and four months after treatment
commencement for sputum smear conversion and between four and six months for culture
conversion. The common optimum times for culture and smear conversion together was
four months.
Introduction
Multidrug-resistant tuberculosis (MDR-TB) is a public health crisis that is a threat to tubercu-
losis (TB) control programs in several parts of the world [1]. The number of patients being
enrolled onto MDR-TB treatment has been increasing globally, from 45,881 in 2010 to 125,000
in 2015 [2, 3]. Treatment for MDR-TB takes from nine to 24 months and the response to
MDR-TB treatment is often slow [4]. An outcome of treatment is assigned to each patient at
the end of each treatment course; these outcomes are usually aligned with recommendations
from the World Health Organization (WHO) [5]. Globally, only, half (52%) of the MDR-TB
patients who started treatment in 2013 were successfully treated [2]. Patients with MDR-TB
are monitored during the course of treatment by monthly laboratory tests (usually by provid-
ing sputum, which is used to assess smear and culture status, aiming for conversion to negative
for confirmed pulmonary cases). Based on published evidence this is viewed as being the best
strategy to evaluate interim and final responses to treatment, determine infectiousness, provide
information for clinicians who may be considering a change in or adjustment to the treatment
regimen, and is also used to assign final treatment outcomes [6].
Despite major recent developments in TB diagnostic tests, including the introduction of an
automated molecular test, MDR-TB treatment response is still evaluated using microbiological
techniques such as sputum smear examination and culture [7, 8]. The new WHO MDR-TB treat-
ment guideline, released in October 2016, recommends the use of sputum smear microscopy and
Comparison of the validity of smear and culture conversion as a prognostic marker of MDR-TB treatment outcome
PLOS ONE | https://doi.org/10.1371/journal.pone.0197880 May 23, 2018 2 / 17

culture rather than sputum smear microscopy alone for the monitoring of patients with MDR-TB
during treatment [5]. This recommendation has been described as a conditional recommendation
with very low quality evidence; and it will be revised based on future available evidence [5].
Sputum culture is resource intensive, requires specialised laboratories, equipment and tra-
ined staff, takes time to obtain a result and is costly [9, 10]. Therefore, it is not readily available
in resource constrained settings, or if it is, it may only be available at reference laboratories, at
referral hospitals or in capital cities [9, 11]. On the other hand, sputum smear microscopy is rel-
atively inexpensive, provides rapid results, is easy to perform, does not require complex labora-
tory equipment and is therefore very suitable for peripheral health centres and low-resource
settings [9, 12–14]. However, the validity (i.e. the sensitivity, specificity) and the predictive value
(i.e. the positive and negative predictive value) of sputum smear conversion (from positive to
negative) at different time points has not been systematically studied as a proxy marker for a
successful MDR-TB treatment outcome, as compared to culture conversion. In addition, the
optimum times of both culture and smear conversion to predict a final successful TB treatment
outcome is not well known. There are few studies that have examined the validity of culture
conversion at different time-points to predict end of treatment outcomes [15–17]. The studies
that have been identified report that culture conversion at six months is better than culture con-
version at two months in predicting successful MDR-TB treatment outcomes [16, 17]. A limita-
tion of the current studies is that they have not assessed and compared the validity of culture
and smear conversion as prognostic markers of MDR-TB treatment outcomes at different time-
points. Thus, we used data from two high MDR-TB burden countries, China and Ethiopia, to
assess and to compare the validity and predictive value of culture and smear conversion status
at different time points as prognostic markers for a successful MDR-TB treatment outcome.
Methods
Study design and settings
A retrospective observational cohort study was conducted using data obtained from Hunan
Chest Hospital, China and Gondar University Hospital, Ethiopia. Hunan Chest Hospital is
located in Changsha, the capital city of Hunan province, and Gondar University Hospital is
located in Northwest Ethiopia. The Hunan Chest Hospital and the Gondar University Hospital
established MDR-TB treatment centers in 2011 and 2010, respectively. These hospitals provide
comprehensive diagnostic and treatment services for all persons with presumptive drug resistant
TB who live in their catchment area. As part of routine care, sputum smear microscopy and cul-
ture are performed monthly for the first six months of treatment, and thereafter every second
month until the end of the treatment. At Gondar University Hospital, sputum specimens are
sent to the national or regional laboratory for culture; whereas at the Hunan Chest Hospital,
solid and liquid culture is performed in the hospital’s laboratory. The treatment regimens and
the diagnostic procedures of MDR-TB patients in Hunan Chest Hospital and in Gondar Univer-
sity Hospital have been described in detail elsewhere [18, 19]. Smear microscopy with Ziehl-
Neelsen staining and fluorescence microscopy are used in both Hunan Chest Hospital and Gon-
dar University Hospital (1, 2) for both the diagnosis and monitoring of TB. Since culture is not
available at Gondar University Hospital, sputum specimens are sent to the national or regional
laboratories for culture and drug susceptibility testing (DST). Solid (Lowenstein-Jensen) and liq-
uid culture (BACTEC 460, MGIT 960) are performed at the national and regional laboratories.
All MDR-TB patients included in our study were diagnosed and monitored using solid culture.
Whereas, at the Hunan Chest Hospital, liquid (BACTEC 460, MGIT 960) and solid cultures
(Lowenstein-Jensen) are performed in the hospital’s laboratory. In our study, almost all cases
(98%) from Honan Chest Hospital were diagnosed and monitored using solid culture.
Comparison of the validity of smear and culture conversion as a prognostic marker of MDR-TB treatment outcome
PLOS ONE | https://doi.org/10.1371/journal.pone.0197880 May 23, 2018 3 / 17

Inclusion and exclusion criteria
This study included all MDR-TB patients who were registered at both Hospitals since the estab-
lishment of their MDR-TB treatment centres through until 31st of December, 2014. This period
was purposely selected in order to obtain treatment outcomes of the patients (as treatment is 24
months in duration). All bacteriologically confirmed MDR-TB patients (i.e. sputum smear and
culture positive) at the commencement of the treatment were eligible. Patients who were diag-
nosed with MDR-TB but who did not start treatment were excluded. In addition, patients who
were lost to follow-up and patients who were diagnosed with XDR-TB were excluded.
Definitions
We referred to WHO guidelines when defining smear and culture conversion and treatment
outcomes [7, 8]. We defined culture conversion as two consecutive negative sputum cultures
taken at least 30 days apart following an initial positive culture [7]. Similarly, we defined smear
conversion as two consecutive negative sputum smears taken at least 30 days apart following an
initial positive sputum smear [7]. We defined time to initial sputum smear conversion as the
time in months from the date of start of MDR-TB treatment to the date of specimen collection
for the first of two consecutive negative sputum smear results, irrespective of whether there was
a subsequent sputum smear positive result. We defined smear reversion to positive when at
least one subsequent positive sputum smear was recorded after initial conversion. We defined
sustained sputum smear conversion as an absence of any subsequent positive sputum smear
after conversion. We also defined persistent sputum smear positivity as no sputum smear con-
version in patients with a baseline positive sputum smear. We used similar definitions for time
to initial culture conversion, culture reversion and persistent culture positivity (S1 Table).
All confirmed MDR-TB patients are assigned a mutually exclusive treatment outcome at the
end of their therapy, by a health professional, based on the WHO definitions [8]. Specifically,
cure was defined as someone who completed treatment without evidence of treatment failure and
who had three or more consecutive negative cultures taken at least 30 days apart, after the inten-
sive phase [8]. Treatment completion was defined as someone who completed treatment, without
evidence of failure but with no record that three or more consecutive negative cultures taken at
least 30 days apart after the intensive phase. Treatment failure was defined as treatment termi-
nated or a need for permanent regimen change of at least two anti-TB drugs due to lack of culture
conversion by the end of the intensive phase, or bacteriological reversion in the continuation
phase after conversion to negative after the intensive phase, or evidence of additional acquired
resistance to fluoroquinolones or second-line injectable drugs. Lost to follow-up was defined as a
patient whose treatment was interrupted for two consecutive months or more. Death was defined
as someone who died for any reason during the course of treatment. Treatment success was
defined as the sum of those who were cured and who completed treatment. A poor treatment out-
come was defined as the sum of the treatment outcomes: treatment failure or death.
We calculated the sensitivity and specificity of conversion to predict a successful and poor
treatment outcome. In our study, sensitivity refers to the proportion of MDR-TB patients with
a successful treatment outcome who had sputum conversion at a given month. Specificity
refers to the proportion of MDR-TB patients with a poor treatment outcome who did not have
sputum conversion at a given month. We defined positive predictive value (PPV) as the pro-
portion of MDR-TB patients in whom treatment was successful among all those with sputum
conversion at a given month. Negative predictive value (NPV) was defined as the proportion
of MDR-TB patients in whom treatment outcome was poor among all those with no sputum
conversion at a given month. A more detailed definition of variables included in this study is
presented in the supplementary information (S1Table).
Comparison of the validity of smear and culture conversion as a prognostic marker of MDR-TB treatment outcome
PLOS ONE | https://doi.org/10.1371/journal.pone.0197880 May 23, 2018 4 / 17

Statistical analysis
Time to initial sputum culture and smear conversion was analysed using the Kaplan-Meier
estimate and differences between groups were compared using the log-rank test. For patients
whose sputum culture or smear result did not convert at all, time to initial conversion was con-
sidered to be censored one month before their last sputum specimen date.
We used bivariate and multivariate random-effects logistic regression models to determine
the association between sputum conversion and treatment outcome at different months (i.e. at
2, 4, 6, and 12 months), and odds ratios with their 95% confidence intervals (CI) were calcu-
lated. Sputum conversion was included in the model as the main independent variable; and
demographic variables such as age, sex and occupation, as well as clinical variables such as
HIV status, history of previous treatment with second line TB drugs, resistance to a fluoro-
quinolone or second line injectable TB drugs, and study setting, were included in the adjusted
models as cofounding factors. Significance was determined at 5%.
We calculated sensitivity and specificity along with their 95% CIs at different months since
commencement of treatment (i.e. 2, 4, 6, and 12 months) using a bivariate random-effects gen-
eralized linear mixed model. We preferred this model because it can handle correlations that
occur as a result of repeated observations in each individual and it can accommodate heteroge-
neity between study settings and groups[20]. We calculated coefficients that demonstrated the
magnitude and significance of association between each factor and the probability of correct
prediction of treatment success (i.e. sensitivity) and poor treatment outcome (i.e. specificity)
by conversion status.
Since positive and negative predictive values depends on the prevalence of the events, we
assumed that the overall prevalence of MDR-TB treatment success is 50% (based on the
MDR-TB treatment success rate reported in WHO’s Global TB Report 2015) [21]. We per-
formed a series of sensitivity analyses for positive and negative predictive values of sputum con-
version in which we considered successful treatment outcomes of 40%, 60% and 80% (S2 Table).
We used receiver operating characteristic (ROC) curves to present the sensitivity and speci-
ficity of sputum conversion at different months. The Area under the ROC curve (AUC) and
Youden’s index (i.e. sensitivity + specificity-1) were used to determine the optimal time points
of sputum conversion as a marker of a successful MDR-TB treatment outcome. The index
closest to one was used as the criterion for determining the best predictor of treatment out-
comes. All analyses were performed using STATA version 14.1 [22].
Ethics clearance
Ethics approval was obtained from the Australian National University Human Research Ethics
Committee (protocol number 2016/218) and from the Institutional Review Board of the Uni-
versity of Gondar. Permission was granted to access the secondary data from Tuberculosis
Control Institute of Hunan Province and this was documented in a letter. The study was con-
ducted in collaboration with researchers from Gondar University and Hunan Chest Hospital.
Results
Demographic and clinical characteristics
A total of 721 patients were diagnosed with MDR- TB in the two hospitals, 490 from Hunan
Chest Hospital, China and 231 from Gondar University Hospital, Ethiopia, for the period
2011–2014 for Hunan Chest Hospital and 2010–2014 for Gondar University Hospital. Of
these, 120 were culture or sputum smear negative at the commencement of treatment and 12
were diagnosed with extensively drug resistant (XDR)-TB, and they were excluded from the
Comparison of the validity of smear and culture conversion as a prognostic marker of MDR-TB treatment outcome
PLOS ONE | https://doi.org/10.1371/journal.pone.0197880 May 23, 2018 5 / 17

study. There were an additional 19 cases who were excluded from the study (i.e. 10 patients
who were diagnosed with MDR-TB but did not start treatment, and 9 patients whose treat-
ment outcomes were not recorded). From a total of 570 bacteriologically confirmed MDR-TB
patients who had a treatment outcome recorded, 92 (16%) were from Gondar University Hos-
pital and 478 (84%) were from Hunan Chest Hospital. More than two thirds, (239; 69%) were
male, and 407 (71%) were farmers. The median age was 38 years (range, 15 to 87 years). A
total of 539 (94%) patients had a history of previous TB treatment, and 138 (24%) had received
second-line TB drugs before the initiation of the current MDR-TB treatment. The baseline
demographic and clinical characteristics of the patients are presented in supplementary infor-
mation (S3 Table).
Smear and culture conversion and treatment outcomes
Overall, 325 (57%) patients were cured, 20 (3%) patients completed treatment, 18 (3%) died
during the treatment, 66 (12%) experienced treatment failure, and 141 (25%) patients were
lost to follow-up. After excluding the 141 patients who were lost to follow up, there were 429
patients with MDR-TB. Among this patient group, 345 (80%) had a successful treatment out-
come and 84 (20%) had a poor outcome (Fig 1).
The probability of a poor treatment outcome (i.e. death or treatment failure) by the end of 6
months was 4%, by the end of one year was 7%, and by the end of three years was 30% (Fig 2).
The time to initial culture conversion was shorter in those who had a successful treatment
outcome when compared to those who had a poor treatment outcome (p<0.001, Fig 3).
Similarly, the time to initial smear conversion was shorter in those who had a successful
treatment outcome compared to patients with a poor treatment outcome (p<0.001, Fig 1). Ini-
tial smear conversion occurred for 417 (97%) patients. Of those with a successful treatment
outcome, 345 (99%) experienced initial smear conversion; this figure was 84% among those
with a poor treatment outcome. A total of 76% of initial smear conversions occurred within
two months of treatment commencement. Initial culture conversion occurred in 401 patients
(93%); one third (67%) of culture conversions occurred within two months of treatment com-
mencement (Fig 1).
Fig 1. Number of patients with sputum smear and culture conversion after 2, 4, 6, and 12 months of treatment for multidrug resistant tuberculosis, among patients
from Hunan Chest and Gondar University Hospitals, 2010 to 2014, stratified by successful and poor treatment outcomes.
https://doi.org/10.1371/journal.pone.0197880.g001
Comparison of the validity of smear and culture conversion as a prognostic marker of MDR-TB treatment outcome
PLOS ONE | https://doi.org/10.1371/journal.pone.0197880 May 23, 2018 6 / 17

Among those patients who had an initial smear conversion, 75 patients (18%) subsequently
had at least one positive smear result (i.e. smear reversion). The median time of smear rever-
sion from the date of treatment commencement was 6.5 months (IQR: 5–12 months). Among
patients who had had an initial culture reversion, 72 patients (17%) had culture reversion, at a
median time of 8 months (IQR: 5–12 months) after the commencement of treatment.
Association between culture and smear conversion, and MDR-TB treatment out-
comes. Patients who had initial smear conversion at two months had a higher odds of treat-
ment success compared to those with no smear conversion at two months (crude odds ratio
(COR): 2.53; 95%CI: 1.53–4.18) (Table 1). Similarly, patients who had initial culture conver-
sion at two months had a higher odds of treatment success than those without evidence of cul-
ture conversion at two months (COR: 3.43; 95%CI: 2.09–5.63). When we compared the
strength of association between treatment succuss and culture conversion with that of treat-
ment success and smear conversion at each month in the adjusted models, the odds of treat-
ment success was higher for culture conversion than for smear conversion (Table 2). The
strength of association between successful treatment outcome and culture and smear conver-
sion increased with increased months of conversion (Table 2). Having a history of previous,
second-line TB treatment and having baseline resistance to a fluoroquinolone were signifi-
cantly associated with poor treatment outcomes (Table 2).
Fig 2. Overall probability of a poor treatment outcome, and number of correct sputum smear and culture results at time-points in
patients with multidrug resistant tuberculosis in Hunan Chest and Gondar University Hospital, 2010 to 2014.
https://doi.org/10.1371/journal.pone.0197880.g002
Comparison of the validity of smear and culture conversion as a prognostic marker of MDR-TB treatment outcome
PLOS ONE | https://doi.org/10.1371/journal.pone.0197880 May 23, 2018 7 / 17

Validity of culture and smear conversion. For the prediction of a successful treatment
outcome, the overall sensitivity of smear conversion at two months was 77.9% (95%CI: 73.3–82.6)
with a statistically significant difference (i.e. p<0.05) across the two study settings (86.8% in
Hunan Chest Hospital vs 46.6% in Gondar University Hospital), age group (72.7% among pati-
ents aged less than 35 years vs 82.5% in people aged 35 years and above), history of previous, sec-
ond-line TB-treatment (86.6% with history of previous, second-line TB treatment vs 75.3% with
no history of previous, second-line TB treatment), and resistance to any injectable second-line TB
Fig 3. Time to initial sputum smear and culture conversion in patients with multidrug resistant tuberculosis by treatment outcomes from Hunan Chest and
Gondar University Hospitals, 2010–2014.
https://doi.org/10.1371/journal.pone.0197880.g003
Table 1. Association of sputum smear and culture conversion status at different months with treatment outcome in patients with multidrug resistant tuberculosis
from Hunan Chest and Gondar University Hospitals, 2010–2014.
Months on treatment Sputum smear Sputum culture
Successful outcome Poor
outcome
Crude odds ratio Successful outcome Poor
outcome
Crude odds ratio
2 months
Converted 269 35 2.53 (1.53, 4.18) 238 33 3.43 (2.09, 5.63)
Did not convert 76 49 1.00 107 52 1.00
4 months
Converted 331 64 7.39 (3.55, 15.38) 320 43 12.20 (6.76, 22.03)
Did not convert 14 20 1.00 25 41 1.00
6 months
Converted 336 67 9.47 (4.05, 22.15) 332 48 19.15 (9.48, 38.67)
Did not convert 9 17 1.00 13 36 1.00
12 months
Converted 343 71 31.4 (6.93, 142.21) 341 57 40.38 (13.62, 119.73)
Did not convert 2 13 1.00 4 27 1.00
Successful outcome: The sum of the treatment outcomes cured and treatment completed. Poor outcome: The sum of the treatment outcomes death and treatment
failure.
https://doi.org/10.1371/journal.pone.0197880.t001
Comparison of the validity of smear and culture conversion as a prognostic marker of MDR-TB treatment outcome
PLOS ONE | https://doi.org/10.1371/journal.pone.0197880 May 23, 2018 8 / 17

drug (82.5% for baseline resistance to any second-line injectable TB drug vs 72.4% with no base-
line resistance to any second line injectable TB drug).
The overall sensitivity of smear conversion at six months was 97.3% (95%CI: 95.5–99.2),
with significant variation across the two hospitals only (p<0.05; Table 3). The overall sensitiv-
ity of culture conversion at two months was 68.9% (95%CI: 64.3–73.6), with significant
Table 2. Association of initial sputum smear and culture conversion at different months with treatment success in patients with multidrug resistant tuberculosis
from Gondar University and Hunan Chest Hospital, 2010–2014, and adjusted odds ration with 95% confidence interval.
Initial smear conversion Initial culture conversion
2 months 4 months 6 months 12 months 2 months 4 months 6 months 12 months
2 months 3.54 (1.96,
6.38)
. . . . . . . . . 5.55 (3.06,
10.07)
. . . . . . . . .
4 months . . . 9.84 (4.25,
22.83)
. . . . . . . . . 32.19 (13.36,
77.52)
. . . . . .
6 months . . . . . . 13.56 (5.06,
36.30)
. . . . . . . . . 34.57 (13.79,
86.70)
. . ..
12 months . . . . . . . . . 37.03(7.75,
176.88)
. . . . . . . . .. 55.56 (17.34,
177.94)
Age (in years)
< 35 1.83 (1.03,
3.26)
1.74 (0.97,
3.14)
1.84 (1.02,
3.33)
1.72 (0.95,
3.10)
1.92 (1.06,
3.49)
1.91 (0.98, 3.69) 1.98 (1.03,
3.81)
1.87 (0.98,
3.56)
> = 35 1.00 1.00 1.00 1.00 1.00 1.00 1.00 1.00
Male sex 0.83 (0.46,
1.49)
0.84 (0.46,
1.53)
0.85 0.47,
1.56)
0.87 (0.48,
1.58)
0.81 (0.44,
1.47)
0.83 (0.43, 1.63) 0.86 (0.44,
1.66)
0.86 (0.45,
1.65)
Occupation
Farmer 1.00 1.00 1.00 1.00 1.00 1.00 1.00 1.00
Employed� 1.52 (0.58,
3.99)
1.97 0.70,
5.52)
1.84 (0.66,
5.13)
2.05 (0.72,
5.88)
1.69 (0.63,
4.56)
1.74 (0.58, 5.25) 1.90 (0.64,
5.66)
1.93 (0.63,
5.87)
Other^ 0.69 (0.33,
1.44)
0.65 (0.31,
1.36)
0.65 (0.31,
1.35)
0.71 (0.34,
1.49)
0.73 (0.34,
1.54)
0.48 (0.22, 1.07) 0.59 (0.27,
1.33)
0.52 (0.24,
1.12)
Year of enrolment
2010–2011 1.00 1.00 1.00 1.00 1.00 1.00 1.00 1.00
2012 0.73 (0.13,
3.95)
1.45 (0.25,
8.30)
1.69 (0.29,
9.83)
1.18 (0.21,
6.61)
0.54 (0.09,
3.07)
1.15 (0.18, 7.06) 2.01 (0.32,
12.73)
1.55 (0.27,
8.93)
2013 0.83 (0.15,
4.62)
1.39 (0.24,
8.09)
1.61 (0.27,
9.39)
2.25 (0.23,
7.62)
0.89 (0.15,
5.15)
1.83 (0.28,11.71) 2.89 (0.44,
18.94)
2.28 (0.38,
13.59)
2014 1.40 (0.24,
8.02)
2.24 (0.37,
13.31)
2.75 (0.46,
16.46)
2.25 (0.38,
13.13)
1.32 (0.22,
7.83)
2.41 (0.37,
15.55)
4.58 (0.68,
30.72)
3.12 (0.52,
18.93)
Enrolled in Gondar University
Hospital
2.37 (0.76,
7.39)
2.11 (0.66,
6.71)
2.15 0.67,
6.90)
1.27 (0.42,
3.85)
3.06 (0.99,
9.44)
9.47 (2.44,
36.72)
4.94 (1.26,
19.29)
1.51 (0.46,
4.98)
HIV positive 0.83 (0.14,
4.94)
0.60 (0.09,
3.92)
0.71 (0.10,
4.73)
1.28 (0.17,
9.40)
1.06 (0.17,
6.29)
0.41 (0.05, 3.08) 0.43 (0.05,
3.39)
1.07 (0.13,
8.56)
History of previous second-line
TB treatment
0.48 (0.27,
0.85)
0.48 (0.27,
0.87)
0.49 (0.28,
0.88)
0.50 0.27,
0.90)
0.54 (0.30,
0.98)
0.63 (0.33, 1.23) 0.69 0.36, 1.34) 0.55 (0.29,
1.05)
Resistance to ethambutol 0.71 (0.41,
1.23)
0.81 (0.46,
1.43)
0.78 (0.44,
1.37)
0.75 (0.42,
1.34)
0.85 (0.48,
1.50)
0.89 (0.46, 1.68) 0.96 (0.51,
1.82)
0.91 (0.49,
1.72)
Resistance to fluoroquinolones 0.32 (0.14,
0.73)
0.22 (0.09,
0.49)
0.24 (0.11,
0.52)
0.20 (0.09,
0.45)
0.36 (0.16,
0.83)
0.27 (0.10, 0.67) 0.24 (0.09,
0.59)
0.17 (0.08,
0.41)
Resistance to any 2nd line
injectable drugs
0.88 (0.50,
1.55)
0.92 (0.51,
1.65)
0.88 (0.49,
1.58)
0.93 (0.518,
1.68)
0.85 (0.48,
1.53)
0.99 (0.52, 1.90) 0.87 (0.45,
1.65)
0.82 (0.43,
1.56)
�Employed includes private and government employees as well as daily labourers;
^other incudes people who are unemployed and unknown occupations; the reference group for sputum conversion at each months is “did not convers sputum”
https://doi.org/10.1371/journal.pone.0197880.t002
Comparison of the validity of smear and culture conversion as a prognostic marker of MDR-TB treatment outcome
PLOS ONE | https://doi.org/10.1371/journal.pone.0197880 May 23, 2018 9 / 17

Ta
ble
3.
Th
ev
ali
dit
y(i
.e.
sen
siti
vit
y,
spec
ific
ity
)o
fsm
ear
an
dcu
ltu
reco
nv
ersi
on
at
dif
fere
nt
mo
nth
sa
sp
rog
no
stic
ma
rker
sfo
rtr
eatm
ent
ou
tco
mes
inp
ati
ents
wit
hm
ult
idru
gre
sist
an
ttu
ber
-
culo
sis
fro
mH
un
an
Ch
est
an
dG
on
da
rU
niv
ersi
tyH
osp
ita
ls,
20
10
–2
01
4.
Init
ial
spu
tum
smea
rco
nv
ersi
on
Init
ial
spu
tum
cult
ure
con
ver
sio
n
2m
on
ths
4m
on
ths
6m
on
ths
2m
on
ths
4m
on
ths
6m
on
ths
Sen
siti
vit
y%
(95
%C
I)
Sp
ecif
icit
y
%(9
5%
CI)
Sen
siti
vit
y%
(95
%C
I)
Sp
ecif
icit
y
%(9
5%
CI)
Sen
siti
vit
y%
(95
%C
I)
Sp
ecif
icit
y
%(9
5%
CI)
Sen
siti
vit
y%
(95
%
CI)
Sp
ecif
icit
y%
(95
%C
I)
Sen
siti
vit
y%
(95
%C
I)
Sp
ecif
icit
y
%(9
5%
CI)
Sen
siti
vit
y%
(95
%C
I)
Sp
ecif
icit
y
%(9
5%
CI)
Ov
era
ll7
7.9
(73
.3–
82
.6)
41
.6(3
1.1
–2
9.8
)9
5.9
(93
.5–
98
.3)
23
.8(1
3.8
–3
3.7
)9
7.4
(95
.5–
99
.2)
20
.2(1
0.5
–2
5.6
)6
8.9
(64
.3–
73
.6)
60
.7(5
0.2
–7
1.2
)9
2.7
(90
.3–
95
.1)
48
.8(3
8.8
–5
8.7
)9
6.2
(94
.3–
98
.0)
42
.8(3
3.2
–5
2.4
)
Stu
dy
are
a
Ch
ina
86
.8(8
2.1
–9
1.2
)�3
8.1
(27
.3–
48
.9)
97
.0(9
4.6
–9
9.3
)�2
1.0
(11
.6–
30
.4)
98
.5(9
6.6
–1
00
)�1
8.4
(9.4
–2
7.3
)8
0.7
(75
.9–
85
.5)��
56
.5(4
5.9
–6
7.1
)9
7.7
(94
.9–
10
0)��
46
.0(3
4.9
–5
7.1
)9
8.1
(95
.9–
10
0)��
40
.7(2
9.7
–5
1.8
)
Eth
iop
ia4
6.6
(38
.0–
55
.2)
75
.0(4
1.6
–1
00
)�9
2.0
(87
.5–
96
.4)
50
.0(2
1.0
–7
8.9
)9
3.3
(89
.7–
96
.9)
37
.5(9
.9–
65
.0)
26
.6(1
7.4
–3
5.8
)1
00
(67
.3–
10
0)�
74
.6(6
9.2
–8
0.1
)7
5.0
(40
.8–
10
0)
89
.3(8
5.1
–9
3.5
)6
2.5
(28
.4–
96
.5)
Sex M
ale
76
.7(7
1.3
–8
2.1
)4
0.9
(28
.6–
53
.3)
95
.6(9
3.0
–9
8.1
)2
6.2
(15
.5–
36
.8)
97
.3(9
5.2
–9
9.4
)2
2.9
(12
.9–
32
.9)
67
.9(6
1.9
–7
3.9
)5
5.7
(43
.6–
67
.8)
92
.5(8
9.1
–9
5.9
)4
7.5
(35
.0–
60
.0)
96
.4(9
4.0
–9
8.9
)4
4.2
(31
.8–
56
.6)
Fem
ale
80
.3(7
2.8
–8
7.8
)4
3.4
(23
.3–
63
.6)
96
.5(9
3.0
–1
00
)1
7.3
(0.5
–3
4.3
)9
7.4
(94
.5–
10
0)
13
.0(3
.2–
29
.3)
70
.9(6
2.5
–7
9.3
)7
3.9
(54
.2–
93
.5)
93
.1(8
8.4
–9
7.8
)5
2.1
(31
.7–
72
.5)
95
.7(9
2.2
–9
9.1
)3
9.1
(18
.9–
59
.3)
Ag
e(i
ny
ears
)
<3
57
2.8
(66
.5–
72
.1)�
36
.0(1
6.7
–5
5.2
)9
6.9
(93
.8–
99
.9)
24
.0(7
.3–
40
.6)
97
.5(9
5.0
–9
9.9
)2
0.0
(4.2
–3
5.7
)6
2.3
(55
.2–
69
.4)
64
.0(4
4.8
–8
3.1
)8
9.5
(85
.5–
93
.4)�
48
.0(2
8.4
–6
7.5
)9
5.0
(92
.1–
97
.9)
44
.0(2
4.6
–6
3.3
)
>=
35
82
.5(7
6.5
–8
8.4
)4
4.0
(31
.5–
55
.6)
95
.0(9
2.2
–9
7.9
)2
3.7
(12
.8–
34
.5)
97
.2(9
4.9
–9
9.5
)2
0.3
(10
.0–
30
.5)
74
.8(6
8.2
–8
1.5
)�5
9.3
(46
.8–
71
.7)
95
.6(9
1.8
–9
9.3
)4
9.1
(36
.3–
61
.9)
97
.2(9
4.5
–1
00
)4
2.3
(29
.7–
54
.9)
Occ
up
ati
on
Far
mer
Ƨ8
2.4
(77
.1–
87
.6)
40
.9(2
8.7
–5
3.2
)9
6.1
(93
.6–
98
.6)
22
.9(1
2.8
–3
3.0
)9
7.4
(95
.3–
99
.4)
19
.6(9
.9–
29
.3)
75
.9(7
0.2
–8
1.6
)6
0.6
(48
.6–
72
.6)
93
.5(9
0.2
–9
6.8
)4
9.1
(37
.2–
61
.1)
96
.9(9
4.5
–9
9.4
)4
4.2
(32
.3–
56
.1)
Em
plo
yed
69
.6(4
4.9
–7
7.3
)�6
1.9
(14
.3–
10
0)
95
.0(8
7.0
–1
00
)6
2.9
(22
.7–
99
.1)�
96
.7(9
0.1
–9
5.6
)4
9.9
(11
.7–
88
.2)�
42
.6(2
4.3
–6
0.9
)��
87
.4(4
0.3
–1
00
)�8
8.5
(77
.9–
98
.2)
87
.4(3
9.4
–1
00
)�9
5.0
(87
.2–
10
0)
74
.9(2
8.0
–1
00
)
Oth
ers
78
.4(6
0.9
–9
5.9
)3
3.3
(8.6
–5
8.0
)9
6.0
(90
.6–
10
0)
6.6
(1.3
–2
7.0
)9
8.0
(93
.6–
10
0)
6.6
(1.2
–2
6.2
)6
8.6
(56
.4–
80
.8)
46
.6(2
2.4
–7
0.8
)9
4.1
(87
.0–
10
0)
26
.6(2
.5–
50
.7)
94
.1(8
8.9
–9
9.3
)2
0(0
.4–
44
.0)
HIV
sta
tus
Neg
ativ
e7
8.6
(74
.1–
83
.1)
40
.2(2
9.7
–5
0.7
)9
5.7
(93
.5–
97
.8)
23
.1(1
3.9
–3
2.2
)9
7.2
(95
.5–
98
.9)
19
.5(1
0.8
–2
8.1
)7
1.3
(66
.4–
76
.2)��
59
.7(4
9.2
–7
0.2
)9
3.3
(90
.4–
96
.0)
48
.7(3
9.9
–5
9.5
)9
6.3
(94
.2–
98
.4)
42
.6(3
1.9
–5
3.3
)
Po
siti
ve
64
.7(4
5.0
–8
4.3
)1
00
(32
.8–
10
0)
10
0(9
0.6
–1
00
)5
0.0
(8.5
–1
00
)1
00
(92
.4–
10
0)
50
.0(5
.3–
10
0)
23
.5(2
0.0
–4
4.9
)1
00
(32
.8–
10
0)
82
.3(7
0.0
–9
4.2
)5
0.0
(19
.0–
10
0)
94
.1(8
5.0
–1
00
)5
0.0
(18
.5–
10
0)
His
tory
of
pre
vio
us
trea
tmen
t
Yes
77
.5(7
3.0
–8
2.0
)4
2.1
(31
.6–
52
.7)
95
.6(9
3.5
–9
7.8
)2
4.0
(14
.95
–3
3.2
)9
7.2
(95
.4–
98
.9)
20
.4(1
1.8
–2
9.1
)6
8.3
(63
.3–
73
.3)
60
.2(4
9.7
–7
0.7
)9
2.3
(89
.4–
95
.1)
49
.3(3
8.7
–6
0.0
)9
6.0
(93
.9–
98
.0)
43
.3(3
2.7
–5
3.9
)
No
85
.0(6
6.8
–1
00
)0
.00
5(0
.01
–9
6.2
)1
00
(91
.3–
10
0)
0.0
1(0
.00
8–
83
.3)
10
0(9
3.0
–1
00
)0
.06
(0.0
07
78
.6)
80
.0(5
9.7
–1
00
)1
00
(4.6
–1
00
))1
00
(88
.6–
10
0)
0.0
8(0
.00
9–
97
.4)
10
0(9
1.6
–1
00
)0
.9(0
.00
9–
96
.5)
His
tory
of
pre
vio
us
seco
nd
lin
eT
B-
trea
tmen
t
Yes
86
.6(7
8.2
–9
7.1
)4
1.1
(24
.6–
57
.7)
95
.8(9
1.3
–1
00
)2
0.5
(6.2
–3
4.8
)1
00
(93
.0–
10
0)
20
.5(7
.0–
34
.0)
79
.4(6
8.9
–8
9.9
)7
3.5
(57
.5–
89
.5)�
95
.8(8
9.9
–1
00
)5
5.8
(39
.1–
72
.5)
95
.8(9
1.5
–1
00
)5
2.9
(36
.5–
69
.3)
No
75
.3(7
0.4
–8
0.2
)�4
2.0
(28
.3–
55
.6)
95
.9(9
3.6
–9
8.3
)2
6.0
(14
.2–
37
.7)
98
.6(9
4.9
–1
00
)2
0.0
(8.8
–3
1.1
)6
6.1
(60
.7–
71
.6)
52
.0(3
8.7
–3
0.7
)9
1.9
(88
.8–
94
.9)
44
.0(3
0.2
–5
7.7
)9
6.3
(94
.0–
98
.5)
36
.0(2
2.4
–4
9.5
)
Res
ista
nce
toa
seco
nd
lin
e
inje
cta
ble
dru
g
Yes
82
.5(7
6.6
–8
8.4
)�4
2.5
(29
.4–
55
.7)
95
.7(9
2.9
–9
8.5
)2
2.2
(10
.8–
33
.5)
97
.8(9
5.6
–1
00
)1
8.5
(7.8
–2
9.2
)7
4.6
(68
.0–
81
.1)�
61
.1(4
8.0
–7
4.1
)9
5.2
(91
.5–
98
.9)
50
.0(3
6.6
–6
3.3
)9
8.4
(95
.7–
10
0)
44
.4(3
1.2
–5
7.6
)
No
72
.4(6
5.9
–7
8.8
)4
0.0
(22
.3–
57
.6)
96
.1(9
3.0
–9
9.2
)2
6.6
(11
.4–
41
.8)
96
.7(9
4.2
–9
9.2
)2
3.3
(8.9
–3
7.6
)6
2.1
(59
.9–
69
.3)
60
.0(4
2.5
–7
7.4
)8
9.7
(85
.6–
93
.7)
46
.6(2
8.7
–6
4.5
)9
3.5
(90
.6–
96
.5)
40
.0(2
2.3
–5
7.6
)
Res
ista
nce
to
eth
am
bu
tol
Yes
76
.4(6
8.5
–8
4.3
)3
3.3
(16
.6–
49
.9)
92
.4(8
8.7
–9
6.1
)�2
4.2
(9.7
–3
8.7
)9
5.2
(92
.2–
98
.3)
18
.1(4
.4–
31
.8)
65
.0(5
6.3
–7
3.8
)6
3.6
(46
.9–
80
.2)
91
.5(8
6.5
–9
6.4
)5
4.5
(37
.5–
71
.5)
95
.2(9
1.6
–9
8.9
)5
1.5
(34
.7–
68
.2)
No
78
.6(7
3.4
–8
3.9
)4
7.0
(33
.6–
60
.4)
97
.4(9
5.0
–9
9.9
)2
3.5
(11
.8–
35
.2)
98
.3(9
6.3
–1
00
)2
1.5
(10
.5–
32
.5)
70
.7(6
4.8
–7
6.5
)5
8.8
(45
.4–
72
.2)
93
.3(9
0.0
–9
6.5
)4
5.0
(31
.4–
58
.7)
96
.6(9
4.2
–9
9.0
)3
7.2
(23
.8–
50
.7)
Res
ista
nce
toa
flu
oro
qu
ino
lon
e
Yes
76
.4(5
8.7
–9
6.1
)5
2.9
(29
.6–
76
.2)
10
0(9
0.6
–1
00
)1
1.7
(0.8
–3
1.8
)1
00
(92
.4–
10
0)
11
.7(7
.2–
30
.5)
58
.8(3
6.8
–8
0.7
)6
4.7
(41
.5–
87
.9)
94
.1(8
1.7
–1
00
)4
7.0
(23
.3–
70
.8)
94
.1(8
5.0
–1
00
)3
5.2
(11
.8–
58
.7)
No
78
.0(7
3.5
–8
2.5
)3
8.8
(27
.0–
50
.5)
95
.7(9
3.5
–9
7.8
)2
6.8
(16
.7–
26
.9)
97
.2(9
5.5
–9
8.9
)2
2.3
(12
.8–
31
.95
)6
9.5
(64
.5–
74
.5)
59
.7(4
8.0
–7
1.3
)9
2.6
(89
.8–
95
.4)
49
.2(3
7.2
–6
1.2
)9
6.3
(94
.2–
98
.4)
44
.7(3
2.9
–5
6.5
)
�P
-val
ue<
0.0
5;
��p
-val
ue<
0.0
01
;Ƨ
Ref
eren
ceg
rou
p
htt
ps:
//doi.o
rg/1
0.1
371/jo
urn
al.p
one.
0197880.t003
Comparison of the validity of smear and culture conversion as a prognostic marker of MDR-TB treatment outcome
PLOS ONE | https://doi.org/10.1371/journal.pone.0197880 May 23, 2018 10 / 17

variation across the two hospitals, age, occupation, year of enrolment, HIV status, and baseline
resistance to any second-line injectable TB drug (Table 3). For example, among HIV-positive
patients with MDR-TB, the sensitivity of culture conversion at two months was 23.5%, as com-
pared with 71.3% among HIV-negative patients (p< 0.001). In contrast, there was no signifi-
cant difference in the sensitivity of smear conversion at any time-point when comparing HIV-
positive and HIV-negative patients (p>0.5, Table 3). The overall sensitivity of culture conver-
sion (77.9%) and smear conversion (68.9%) at two months was significantly different
(p = 0.007). However, the overall sensitivities of culture conversion and smear conversion at
four months were not significantly different (p>0.05; Table 3).
For the prediction of a poor treatment outcome, the specificity of sputum smear conversion
was significantly lower than culture conversion at all time-points (i.e. 41.6% vs 60.7% at 2
months; 23.8% vs 48.8% at four months; 20.2% vs 42.8% at six months; and 15.4% vs 32.1% at 12
months; Table 3). The specificity of culture conversion at two months varied by study setting (i.e.
hospitals) and by history of previous treatment with second-line TB drugs; whereas the specificity
of sputum smear conversion at two months varied only by study setting (Table 4).
Positive and negative predictive values
The positive and negative predictive values for smear conversion were: 57.3% and 65.7% at
two months, 55.7% and 85.4% at four months, and 55.0% and 88.6% at six months; and for cul-
ture conversions it was: 63.7% and 66.2% at two months, 64.4% and 87.1% at four months, and
62.7% and 91.9% at six months, respectively (Table 4).
If the patient converted their smear from positive to negative by two months, the probabil-
ity of a successful treatment outcome was 57.3%. If a patient converted from culture positive to
negative by two months, the probability of a successful treatment outcome was 63.7%. The
positive predictive values of culture conversion were higher than the positive predictive values
of sputum smear conversion at all time-points (S2 Table). The negative predictive values of
sputum smear conversion were similar to culture conversion at all time-points (Table 4).
Optimal time of culture and sputum smear conversion
The sensitivity of both culture and sputum smear conversion increased over time, whereas
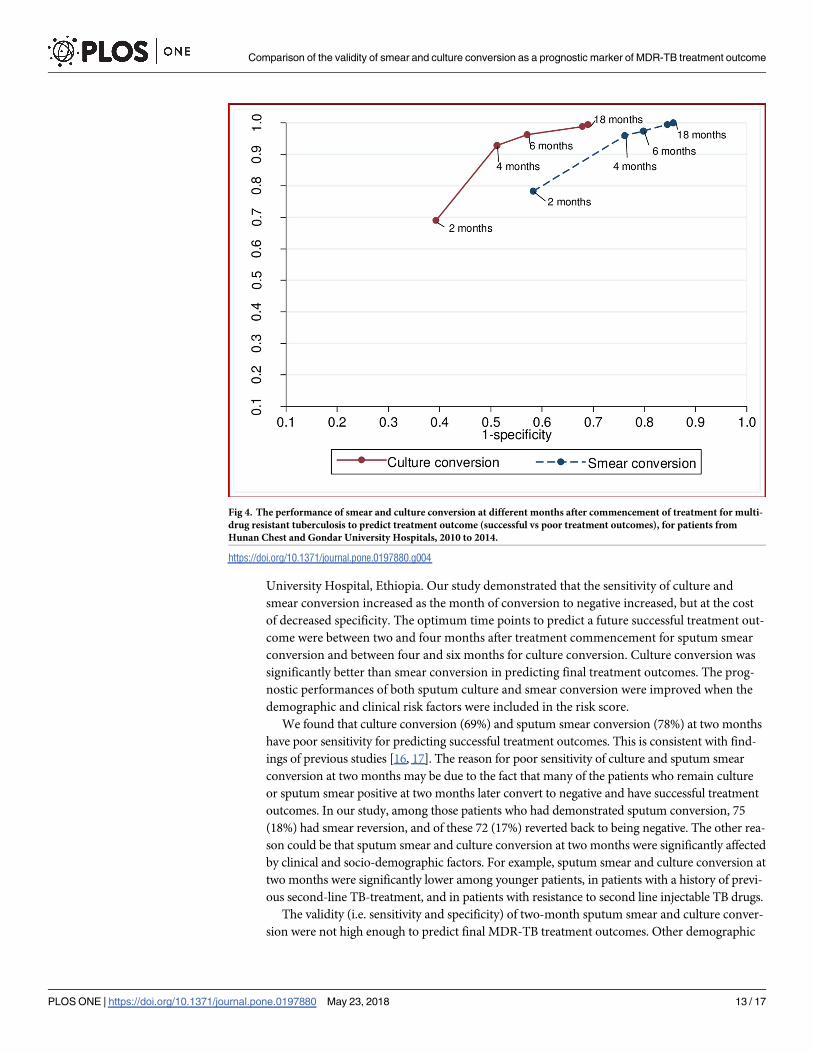
specificity decreased (Fig 2). The combined sensitivity and specificity to predict a successful
treatment outcome peaked between two and four months for sputum smear conversion, and
between four and six months for culture conversion (Fig 4).
The overall prognostic performance of culture conversion at two months in predicting suc-
cessful MDR-TB treatment outcomes was not significantly differ to that of sputum smear con-
version at two months (p = 0.86). However, the prognostic performance of culture conversion
at four, six, and 12 months was significantly higher than the performance of sputum smear
conversion at the respective months (p<0.05; Table 3). The common optimum time point for
sputum smear and culture conversion was 4 months; at this time-point, culture conversion
(AUROC curve = 0.71) was significantly better than sputum smear conversion (AUROC
curve = 0.6) in predicting successful MDR-TB treatment outcomes (p< 0.001).
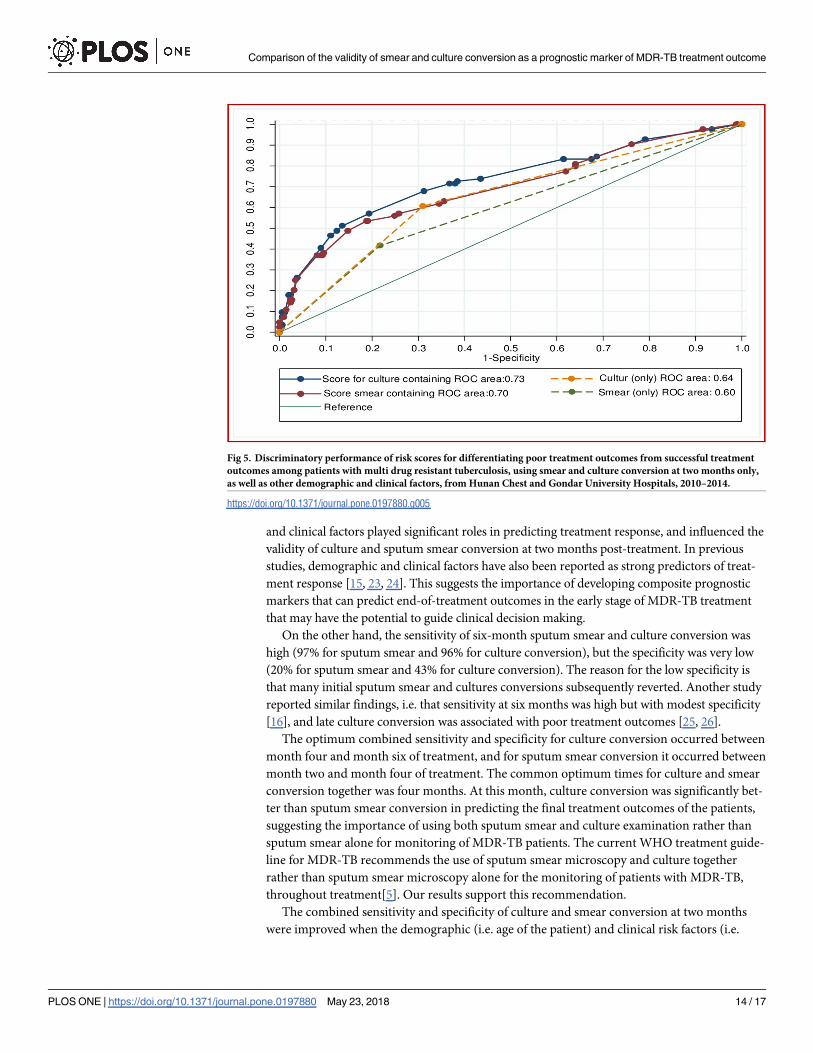
Fig 5 showed the AUROC curve for differentiating poor treatment outcomes using smear
and culture conversion at two months, with and without the inclusion of other demographic
and clinical factors. The AUROC curve increased from 0.6 for smear conversion (only) to 0.7
when other significant variables (i.e. age of the patient, resistance to fluoroquinolones, a his-
tory of second-line, injectable TB treatment) were included in the score. Similarly, the AUROC
curve for culture conversion (AUROC curve = 0.64) increased when significant variables were
included in the model (AUROC curve = 0.73) (Fig 5).
Comparison of the validity of smear and culture conversion as a prognostic marker of MDR-TB treatment outcome
PLOS ONE | https://doi.org/10.1371/journal.pone.0197880 May 23, 2018 11 / 17

Discussion
We assessed and compared the validity and predictive value of sputum smear and culture con-
version at different months since treatment commenced as prognostic markers for end-of-
treatment outcomes among MDR-TB patients from Hunan Chest Hospital, China and Gondar
Table 4. The validity of sputum smear and culture conversion at different months as prognostic markers for
treatment success in patients with multidrug resistant tuberculosis, from Hunan Chest and Gondar University
Hospitals, 2010–2014.
Sputum smear conversion % (95% CI) Sputum culture conversion
% (95% CI)
P-value
2 months
Sensitivity 77.9 (73.6–82.3) 68.9 (64.1–73.8) 0.007
Specificity 41.6 (31.1–52.2) 60.7 (50.3–71.1) 0.012
Area under ROC� curve 0.60 (0.54–0.65) 0.64 (0.59–0.71) 0.086
Positive likelihood ratio 1.34 (1.11–1.62) 1.76 (1.33–2.31) N/A
Negative likelihood ratio 0.52 (0.38–0.72) 0.51 (0.40–0.64) N/A
Positive predictive value 57.3 (52.6, 61.8) 63.7 (57.1–69.8) N/A
Negative predictive value 65.7 (58.1, 72.6) 66.2 (60.8–71.2) N/A
Youden-index 19.5 29.6 NA
4 months
Sensitivity 95.9 (93.8–98.0) 92.7 (90.0–95.5) 0.069
Specificity 23.8 (14.7–32.9) 48.8 (38.1–59.5) < 0.0001
Area under ROC� curve 0.60 (0.55–0.64) 0.71 (0.65–0.76) < 0.0001
Positive likelihood ratio 1.26 (1.12–1.42) 1.81(1.47–2.24) N/A
Negative likelihood ratio 0.17 (0.09–0.32) 0.15(0.10–0.23) N/A
Positive predictive value 55.7 (52.7–58.7) 64.4 (59.5–69.1) N/A
Negative predictive value 85.4 (75.6–91.8) 87.1 81.3–91.2) N/A
Youden-index 19.7 41.5 NA
6 months
Sensitivity 97.4 (95.7–99.0) 96.2 (94.2–98.2) 0.386
Specificity 20.2 (11.6–28.8) 42.8 (32.2–53.4) 0.001
Area under ROC� curve 0.59 (0.54–0.63) 0.69 (0.64–0.75) <0.0001
Positive likelihood ratio 1.22(1.09–1.36) 1.68 (1.40–2.03) N/A
Negative likelihood ratio 0.13(0.06–0.28) 0.09 (0.05–0.16) N/A
Positive predictive value 55.0 (52.3–57.7) 62.7 58.3–67.0) N/A
Negative predictive value 88.6 (78.2–94.4) 91.9 86.3–95.3) N/A
Youden-index 17.6 39 NA
12 months
Sensitivity 99.4 98.6–99.9) 98.9 (97.7–99.7) 0.412
Specificity 15.4 (7.7–23.2) 32.1 (22.1–42.1) 0.01
Area under ROC� curve 0.57 (0.53–0.61) 0.65 (0.60–0.70) 0.0001
Positive likelihood ratio 1.18 (1.07–1.29) 1.46 (1.26–1.69) N/A
Negative likelihood ratio 0.04 (0.01–0.16) 0.04 (0.01–0.10) N/A
Positive predictive value 54.0 (51.8–56.3) 59.3 (55.7–62.8) N/A
Negative predictive value 96.4 (86.0–99.1) 96.5 90.9–98.7) N/A
Youden-index 14.8 30.9 NA
�ROC: Receiver operating characteristic;
N/A: Not Applicable. To calculate the positive and negative predictive values we assumed that the overall prevalence
of MDR-TB treatment success is 50%.
https://doi.org/10.1371/journal.pone.0197880.t004
Comparison of the validity of smear and culture conversion as a prognostic marker of MDR-TB treatment outcome
PLOS ONE | https://doi.org/10.1371/journal.pone.0197880 May 23, 2018 12 / 17
University Hospital, Ethiopia. Our study demonstrated that the sensitivity of culture and
smear conversion increased as the month of conversion to negative increased, but at the cost
of decreased specificity. The optimum time points to predict a future successful treatment out-
come were between two and four months after treatment commencement for sputum smear
conversion and between four and six months for culture conversion. Culture conversion was
significantly better than smear conversion in predicting final treatment outcomes. The prog-
nostic performances of both sputum culture and smear conversion were improved when the
demographic and clinical risk factors were included in the risk score.
We found that culture conversion (69%) and sputum smear conversion (78%) at two months
have poor sensitivity for predicting successful treatment outcomes. This is consistent with find-
ings of previous studies [16, 17]. The reason for poor sensitivity of culture and sputum smear
conversion at two months may be due to the fact that many of the patients who remain culture
or sputum smear positive at two months later convert to negative and have successful treatment
outcomes. In our study, among those patients who had demonstrated sputum conversion, 75
(18%) had smear reversion, and of these 72 (17%) reverted back to being negative. The other rea-
son could be that sputum smear and culture conversion at two months were significantly affected
by clinical and socio-demographic factors. For example, sputum smear and culture conversion at
two months were significantly lower among younger patients, in patients with a history of previ-
ous second-line TB-treatment, and in patients with resistance to second line injectable TB drugs.
The validity (i.e. sensitivity and specificity) of two-month sputum smear and culture conver-
sion were not high enough to predict final MDR-TB treatment outcomes. Other demographic
Fig 4. The performance of smear and culture conversion at different months after commencement of treatment for multi-
drug resistant tuberculosis to predict treatment outcome (successful vs poor treatment outcomes), for patients from
Hunan Chest and Gondar University Hospitals, 2010 to 2014.
https://doi.org/10.1371/journal.pone.0197880.g004
Comparison of the validity of smear and culture conversion as a prognostic marker of MDR-TB treatment outcome
PLOS ONE | https://doi.org/10.1371/journal.pone.0197880 May 23, 2018 13 / 17
and clinical factors played significant roles in predicting treatment response, and influenced the
validity of culture and sputum smear conversion at two months post-treatment. In previous
studies, demographic and clinical factors have also been reported as strong predictors of treat-
ment response [15, 23, 24]. This suggests the importance of developing composite prognostic
markers that can predict end-of-treatment outcomes in the early stage of MDR-TB treatment
that may have the potential to guide clinical decision making.
On the other hand, the sensitivity of six-month sputum smear and culture conversion was
high (97% for sputum smear and 96% for culture conversion), but the specificity was very low
(20% for sputum smear and 43% for culture conversion). The reason for the low specificity is
that many initial sputum smear and cultures conversions subsequently reverted. Another study
reported similar findings, i.e. that sensitivity at six months was high but with modest specificity
[16], and late culture conversion was associated with poor treatment outcomes [25, 26].
The optimum combined sensitivity and specificity for culture conversion occurred between
month four and month six of treatment, and for sputum smear conversion it occurred between
month two and month four of treatment. The common optimum times for culture and smear
conversion together was four months. At this month, culture conversion was significantly bet-
ter than sputum smear conversion in predicting the final treatment outcomes of the patients,
suggesting the importance of using both sputum smear and culture examination rather than
sputum smear alone for monitoring of MDR-TB patients. The current WHO treatment guide-
line for MDR-TB recommends the use of sputum smear microscopy and culture together
rather than sputum smear microscopy alone for the monitoring of patients with MDR-TB,
throughout treatment[5]. Our results support this recommendation.
The combined sensitivity and specificity of culture and smear conversion at two months
were improved when the demographic (i.e. age of the patient) and clinical risk factors (i.e.
Fig 5. Discriminatory performance of risk scores for differentiating poor treatment outcomes from successful treatment
outcomes among patients with multi drug resistant tuberculosis, using smear and culture conversion at two months only,
as well as other demographic and clinical factors, from Hunan Chest and Gondar University Hospitals, 2010–2014.
https://doi.org/10.1371/journal.pone.0197880.g005
Comparison of the validity of smear and culture conversion as a prognostic marker of MDR-TB treatment outcome
PLOS ONE | https://doi.org/10.1371/journal.pone.0197880 May 23, 2018 14 / 17

resistant to fluoroquinolones, history of second-line injectable TB treatment) were included in
the risk score. When the clinical and demographic variables were included in the score, the
AUROC curve of the two month smear conversion (0.7) was almost equal to the AUROC curve
of culture conversion at four months (0.71). This indicated that developing a comprehensive
clinical risk score and validating the score in a prospective cohort study will improve the prog-
nostic capacity of smear and culture conversion in patients with MDR-TB.
Predictive values were used to estimate the probability that the outcome will occur on a sputum
conversion. We found high NPVs for sputum smear and culture conversion after four months of
treatment. This indicates that if a patient did not convert to sputum smear and culture negative by
four months, the probability of a poor treatment outcome was high (85% - 87%). On the other
hand, we found relatively high PPVs for culture conversion at four months, compared to smear
conversion at four months. This implies that the patients will have a high probability of treatment
success if they have experienced culture conversion at four months. However, sputum smear con-
version at four months is not a good prognostic marker of a successful treatment outcome.
The notable limitation associated with the present study is its retrospective design and inabil-
ity to identify the actual days of culture and smear conversion, as sputum examinations were
carried out at a certain month after treatment commencement. The other limitation of the
study is that it might not be generalizable to patients with MDR-TB who are enrolled in other
MDR-TB programs. We observed that there are differences in the validity of culture and spu-
tum smear conversion between the two settings, suggesting that our results may not be general-
izable. For example, the sensitivity of smear conversion, for the prediction of a successful
treatment outcome, at two months was significantly higher in Hunan Chest Hospital (86.8%)
than in Gondar University Hospital (46.6%) (i.e. p<0.05). Thus, the validity of sputum smear
and culture conversion to predict treatment outcomes might be dependent on several factors
relating to the study context, including the level of socioeconomic development of the country,
health systems factors and or other factors that we were not able to account for in our study [17,
27, 28]. A multicentre prospective cohort study conducted by Kurbatova et al showed that the
validity of initial sputum culture conversion to predict MDR-TB treatment outcome varied by
country; at two months the sensitivity was 9% in South Africa and 66% in Taiwan, and the spec-
ificity was 94% in South Africa and 75% Taiwan [28]. Another study conducted in urban set-
tings in Jiangsu province, China showed that the sensitivity and specificity of culture conversion
were 33.3% and 80.0% at two months, and 90.5% and 56.4% at six months, respectively [17].
Conclusion
The validity of smear conversion is significantly lower than culture conversion in predicting
successful TB treatment outcomes for patients with MDR-TB. We support the WHO recom-
mendation of using both smear and culture examination rather than smear alone for the moni-
toring of MDR-TB patients for a better prediction of successful treatment outcomes. The
optimum time points to predict a future successful treatment outcome were between two and
four months after treatment commencement for sputum smear conversion and between four
and six months for culture conversion. The common optimum times for culture and smear
conversion together was four months. Demographic and clinical factors played significant
roles in predicting treatment outcomes, and influenced the validity of culture and smear con-
version at two months post-treatment.
Supporting information
S1 Table. Definition of variables which were used in this study.
(DOCX)
Comparison of the validity of smear and culture conversion as a prognostic marker of MDR-TB treatment outcome
PLOS ONE | https://doi.org/10.1371/journal.pone.0197880 May 23, 2018 15 / 17

S2 Table. Positive and negative predictive value of initial sputum smear and culture con-
version in predicting treatment outcome (successful versus poor treatment outcomes)
from Hunan Chest Hospital, China and University of Gondar, Ethiopia: 2010–2014.
(DOCX)
S3 Table. Baseline demographic and clinical characteristics of patients with multidrug
resistant tuberculosis from Hunan Chest Hospital, China and University of Gondar, Ethio-
pia: 2010–2014.
(DOCX)
Acknowledgments
We thank all those who participated in extraction of data from patient’s records.
Author Contributions
Conceptualization: Kefyalew Addis Alene.
Data curation: Hengzhong Yi, Kunyun Yang, Liqiong Bai, Zuhui Xu.
Formal analysis: Kefyalew Addis Alene.
Methodology: Kefyalew Addis Alene.
Resources: Hengzhong Yi, Kunyun Yang, Liqiong Bai, Zuhui Xu.
Supervision: Kerri Viney, Emma S. McBryde, Archie C. A. Clements.
Writing – original draft: Kefyalew Addis Alene.
Writing – review & editing: Kefyalew Addis Alene, Kerri Viney, Hengzhong Yi, Emma S.
McBryde, Kunyun Yang, Liqiong Bai, Darren J. Gray, Zuhui Xu, Archie C. A. Clements.
References1. Gandhi NR, Nunn P, Dheda K, Schaaf HS, Zignol M, Van Soolingen D, et al. Multidrug-resistant and
extensively drug-resistant tuberculosis: a threat to global control of tuberculosis. The Lancet. 2010; 375
(9728):1830–43.
2. WHO. Global tuberculosis report 2016. Geneva, Switzerland World Health Organization 2016.
3. WHO. Global Tuberculosis Report 2012. Geneva, Switzerland: World Health Organization, 2012.
4. Lange C, Abubakar I, Alffenaar J-WC, Bothamley G, Caminero JA, Carvalho ACC, et al. Management
of patients with multidrug-resistant/extensively drug-resistant tuberculosis in Europe: a TBNET consen-
sus statement. European Respiratory Journal. 2014; 44(1):23–63. https://doi.org/10.1183/09031936.
00188313 PMID: 24659544
5. WHO. WHO treatment guidelines for drugresistant tuberculosis. 2016 update. Geneva: World Health
Organization, 2016
6. Dheda K, Gumbo T, Maartens G, Dooley KE, McNerney R, Murray M, et al. The epidemiology, patho-
genesis, transmission, diagnosis, and management of multidrug-resistant, extensively drug-resistant,
and incurable tuberculosis. The lancet Respiratory medicine. 2017; 5(4):291–360.
7. WHO. Companion handbook to the WHO guidelines for the programmatic management of drug-resis-
tant tuberculosis. Geneva, Switzerland2014.
8. WHO. Definitions and reporting framework for tuberculosis– 2013 revision (updated 2014) Geneva,
Switzerland World Health Organization 2013.
9. Lu C, Liu Q, Sarma A, Fitzpatrick C, Falzon D, Mitnick CD. A systematic review of reported cost for
smear and culture tests during multidrug-resistant tuberculosis treatment. PLoS One. 2013; 8(2):
e56074. https://doi.org/10.1371/journal.pone.0056074 PMID: 23457502
Comparison of the validity of smear and culture conversion as a prognostic marker of MDR-TB treatment outcome
PLOS ONE | https://doi.org/10.1371/journal.pone.0197880 May 23, 2018 16 / 17

10. Shah M, Chihota V, Coetzee G, Churchyard G, Dorman SE. Comparison of laboratory costs of rapid
molecular tests and conventional diagnostics for detection of tuberculosis and drug-resistant tuberculo-
sis in South Africa. BMC infectious diseases. 2013; 13(1):352.
11. Parsons LM, Somoskovi A, Gutierrez C, Lee E, Paramasivan C, Abimiku Al, et al. Laboratory diagnosis
of tuberculosis in resource-poor countries: challenges and opportunities. Clinical microbiology reviews.
2011; 24(2):314–50. https://doi.org/10.1128/CMR.00059-10 PMID: 21482728
12. Caviedes L, Lee T-S, Gilman RH, Sheen P, Spellman E, Lee EH, et al. Rapid, efficient detection and
drug susceptibility testing of Mycobacterium tuberculosis in sputum by microscopic observation of broth
cultures. Journal of clinical microbiology. 2000; 38(3):1203–8. PMID: 10699023
13. Steingart KR, Henry M, Ng V, Hopewell PC, Ramsay A, Cunningham J, et al. Fluorescence versus con-
ventional sputum smear microscopy for tuberculosis: a systematic review. The Lancet infectious dis-
eases. 2006; 6(9):570–81. https://doi.org/10.1016/S1473-3099(06)70578-3 PMID: 16931408
14. Steingart KR, Ng V, Henry M, Hopewell PC, Ramsay A, Cunningham J, et al. Sputum processing meth-
ods to improve the sensitivity of smear microscopy for tuberculosis: a systematic review. The Lancet
infectious diseases. 2006; 6(10):664–74. https://doi.org/10.1016/S1473-3099(06)70602-8 PMID:
17008175
15. Holtz TH, Sternberg M, Kammerer S, Laserson KF, Riekstina V, Zarovska E, et al. Time to Sputum Cul-
ture Conversion in Multidrug-Resistant Tuberculosis: Predictors and Relationship to Treatment Outcome-
Multidrug-Resistant TB Sputum Culture Conversion. Annals of internal medicine. 2006; 144(9):650–9.
PMID: 16670134
16. Kurbatova EV, Cegielski JP, Lienhardt C, Akksilp R, Bayona J, Becerra MC, et al. Sputum culture con-
version as a prognostic marker for end-of-treatment outcome in patients with multidrug-resistant tuber-
culosis: a secondary analysis of data from two observational cohort studies. Lancet Respir Med. 2015;
3(3):201–9. https://doi.org/10.1016/S2213-2600(15)00036-3 PMID: 25726085
17. Lu P, Liu Q, Martinez L, Yang H, Lu W, Ding X, et al. Time to sputum culture conversion and treatment
outcome of patients with multidrug-resistant tuberculosis: a prospective cohort study from urban China.
European Respiratory Journal. 2017; 49(3):1601558. https://doi.org/10.1183/13993003.01558-2016
PMID: 28331033
18. Alene KA, Viney K, McBryde ES, Tsegaye AT, Clements AC. Treatment outcomes in patients with mul-
tidrug-resistant tuberculosis in north-west Ethiopia. Tropical Medicine & International Health. 2017.
19. Alene KA, Yi H, Viney K, McBryde ES, Yang K, Bai L, et al. Treatment outcomes of patients with multi-
drug-resistant and extensively drug resistant tuberculosis in Hunan Province, China. BMC Infectious
Diseases. 2017; 17(1). https://doi.org/10.1186/s12879-017-2662-8 PMID: 28814276
20. Zeger SL, Karim MR. Generalized linear models with random effects; a Gibbs sampling approach. Jour-
nal of the American statistical association. 1991; 86(413):79–86.
21. WHO. Global tuberculosis report 2015. Geneva, Switzerland: World Health Organization 2015.
22. StataCorp. Stata Statistical Software: Release 15. College Station, Texas 77845 USA LP S,
editor2015.
23. Kliiman K, Altraja A. Predictors of poor treatment outcome in multi-and extensively drug-resistant pul-
monary TB. European Respiratory Journal. 2009; 33(5):1085–94. https://doi.org/10.1183/09031936.
00155708 PMID: 19164345
24. Kim H-R, Hwang SS, Kim HJ, Lee SM, Yoo C-G, Kim YW, et al. Impact of extensive drug resistance on
treatment outcomes in non-HIV-infected patients with multidrug-resistant tuberculosis. Clinical Infec-
tious Diseases. 2007; 45(10):1290–5. https://doi.org/10.1086/522537 PMID: 17968823
25. Horne DJ, Royce SE, Gooze L, Narita M, Hopewell PC, Nahid P, et al. Sputum monitoring during tuber-
culosis treatment for predicting outcome: systematic review and meta-analysis. The Lancet infectious
diseases. 2010; 10(6):387–94. https://doi.org/10.1016/S1473-3099(10)70071-2 PMID: 20510279
26. Sloan DJ, Mwandumba HC, Garton NJ, Khoo SH, Butterworth AE, Allain TJ, et al. Pharmacodynamic
modelling of bacillary elimination rates and detection of bacterial lipid bodies in sputum to predict and
understand outcomes in treatment of pulmonary tuberculosis. Clinical infectious diseases. 2015:civ195.
27. Holtz TH, Sternberg M, Kammerer S, Laserson KF, Riekstina V, Zarovska E, et al. Time to sputum cul-
ture conversion in multidrug-resistant tuberculosis: predictors and relationship to treatment outcome.
Annals of internal medicine. 2006; 144(9):650–9. PMID: 16670134
28. Kurbatova EV, Cegielski JP, Lienhardt C, Akksilp R, Bayona J, Becerra MC, et al. Sputum culture con-
version as a prognostic marker for end-of-treatment outcome in patients with multidrug-resistant tuber-
culosis: a secondary analysis of data from two observational cohort studies. Lancet Respir Med. 2015;
3(3):201–9. Epub 2015/03/03. https://doi.org/10.1016/S2213-2600(15)00036-3 PMID: 25726085;
PubMed Central PMCID: PMCPmc4401426.
Comparison of the validity of smear and culture conversion as a prognostic marker of MDR-TB treatment outcome
PLOS ONE | https://doi.org/10.1371/journal.pone.0197880 May 23, 2018 17 / 17