comparison of protein coding gene contents of the fungal phyla pezizomycotina and
TRANSCRIPT

BioMed CentralBMC Genomics
ss
Open AcceResearch articleComparison of protein coding gene contents of the fungal phyla Pezizomycotina and SaccharomycotinaMikko Arvas*1, Teemu Kivioja2, Alex Mitchell3, Markku Saloheimo1, David Ussery4, Merja Penttila1 and Stephen Oliver5Address: 1VTT, Tietotie 2, Espoo, P.O. Box 1500, 02044 VTT, Finland, 2Biomedicum, P.O. Box 63 (Haartmaninkatu 8), FI-00014 University of Helsinki, Finland, 3EMBL Outstation – Hinxton, European Bioinformatics Institute, Welcome Trust Genome Campus, Hinxton, Cambridge, CB10 1SD, UK, 4Center for Biological Sequence Analysis BioCentrum-DTU The Technical University of Denmark DK-2800 Kgs. Lyngby, Denmark and 5University of Manchester, Michael Smith Building, Oxford Road, Manchester, M13 9PT, UK
Email: Mikko Arvas* - [email protected]; Teemu Kivioja - [email protected]; Alex Mitchell - [email protected]; Markku Saloheimo - [email protected]; David Ussery - [email protected]; Merja Penttila - [email protected]; Stephen Oliver - [email protected]
* Corresponding author
AbstractBackground: Several dozen fungi encompassing traditional model organisms, industrial production organismsand human and plant pathogens have been sequenced recently and their particular genomic features analysed indetail. In addition comparative genomics has been used to analyse specific sub groups of fungi. Notably, analysisof the phylum Saccharomycotina has revealed major events of evolution such as the recent genome duplicationand subsequent gene loss. However, little has been done to gain a comprehensive comparative view to the fungalkingdom. We have carried out a computational genome wide comparison of protein coding gene content ofSaccharomycotina and Pezizomycotina, which include industrially important yeasts and filamentous fungi,respectively.
Results: Our analysis shows that based on genome redundancy, the traditional model organisms Saccharomycescerevisiae and Neurospora crassa are exceptional among fungi. This can be explained by the recent genomeduplication in S. cerevisiae and the repeat induced point mutation mechanism in N. crassa.
Interestingly in Pezizomycotina a subset of protein families related to plant biomass degradation and secondarymetabolism are the only ones showing signs of recent expansion. In addition, Pezizomycotina have a wealth ofphylum specific poorly characterised genes with a wide variety of predicted functions. These genes are wellconserved in Pezizomycotina, but show no signs of recent expansion. The genes found in all fungi exceptSaccharomycotina are slightly better characterised and predicted to encode mainly enzymes. The genes specificto Saccharomycotina are enriched in transcription and mitochondrion related functions. Especially mitochondrialribosomal proteins seem to have diverged from those of Pezizomycotina. In addition, we highlight severalindividual gene families with interesting phylogenetic distributions.
Conclusion: Our analysis predicts that all Pezizomycotina unlike Saccharomycotina can potentially produce awide variety of secondary metabolites and secreted enzymes and that the responsible gene families are likely toevolve fast. Both types of fungal products can be of commercial value, or on the other hand cause harm to humans.In addition, a great number of novel predicted and known enzymes are found from all fungi exceptSaccharomycotina. Therefore further studies and exploitation of fungal metabolism appears very promising.
Published: 17 September 2007
BMC Genomics 2007, 8:325 doi:10.1186/1471-2164-8-325
Received: 23 April 2007Accepted: 17 September 2007
This article is available from: http://www.biomedcentral.com/1471-2164/8/325
© 2007 Arvas et al; licensee BioMed Central Ltd. This is an Open Access article distributed under the terms of the Creative Commons Attribution License (http://creativecommons.org/licenses/by/2.0), which permits unrestricted use, distribution, and reproduction in any medium, provided the original work is properly cited.
Page 1 of 23(page number not for citation purposes)

BMC Genomics 2007, 8:325 http://www.biomedcentral.com/1471-2164/8/325
BackgroundAt least 36 fungal genomes are already available at publicdatabases and several more are being sequenced. Ofeukaryotes, Fungi is the kingdom with most sequencedspecies. The sequenced genomes cover fungal speciesbroadly and include industrially, medically and agricul-turally important species with very diverse genomes. Forthese reasons fungal genomes form one of the most attrac-tive eukaryotic datasets for comparative genomicsresearch and method development. Moreover, the possi-bilities for in silico exploration of the diversity of biologi-cal functions in these organisms have beenrevolutionized.
The fungal kingdom is divided in Chytridiomycota, Zygo-mycota, Glomeromycota, Ascomycota, Basidiomycotaand Deuteromycota. Most sequenced fungi belong toAscomycota, which is again divided in Pezizomycotina,Saccharomycotina and Taphrinomycotina. Pezizomy-cotina, commonly referred to as filamentous fungi, growmostly in a filamentous form and degrade biomass to freesugars to be used as source of carbon and energy. In con-trast, Saccharomycotina, commonly referred to as yeasts,grow mostly in a unicellular form. They have generally nocapability to degrade biomass and accordingly live on freesugars.
Comparative genomics has been applied extensivelywithin the phylum Saccharomycotina (for review see [1]),where a whole genome duplication followed by massivegene loss and specialization has been shown to haveoccurred [2]. This has been further confirmed by a broaderanalysis of differential genome evolution in Saccharomy-cotina species [3] that also demonstrated the usefulness ofmulti-species protein clustering.
Studies of Pezizomycotina have concentrated on descrip-tions of individual genomes or comparisons inside a classsuch as the Eurotiales genomes of Aspergillus fumigatus [4],oryzae [5] and nidulans [6]. A. fumigatus and oryzae hadbeen previously considered as asexual organisms, butcomparative analysis showed that their genomes have thesame potential for sexual reproduction as A. nidulans.Sequencing of the Neurospora crassa genome [7] revealedthe full effect of the mechanism called Repeat InducedPoint mutations (RIP). RIP specifically mutates duplica-tions that are longer than 400 bp and more identical than80%, thus effectively preventing gene duplications andkeeping the genome extremely non-redundant (for reviewsee [8]).
Extensive comparative genomic databases for somegroups of eukaryotic species are available such as theEnsembl for mammals [9]. Several comparative databasesexist also for fungi such as MIPS [10], CBS Genome
Atlases [11], e-Fungi [12], but none offers a level of detailcomparable to Ensembl. However, high quality softwareto set up such a database is freely available from theGeneric Genome Browser (GBrowse) [13] and Ensemblprojects. Most importantly, these support interfaces toBioPerl [14], which offers currently the most extensivesequence analysis programming library.
Our goal is to explain differences in phenotypes of fungithrough differences in their genotypes and to deduce evo-lutionary processes that have shaped fungi. To this end wehave used TRIBE-MCL [15] protein clustering and Inter-ProScan [16] protein domain analysis to comparegenome open reading frame (ORF) contents of Pezizomy-cotina and Saccharomycotina species in a large data set of33 fungal genomes. TRIBE-MCL divides the genomescomprehensively into protein clusters, while InterProScandetects known protein domains. We have also set up aGBrowse based comparative genomics web interface thatenables easy browsing of our data. We detected proteinclusters specific to Pezizomycotina, other fungi than Sac-charomycotina and Saccharomycotina, and characterisedthem with Funcat gene classifications [17-19] and Protfunprotein function predictions [20].
We found that in Pezizomycotina protein clusters relatedto plant biomass degradation and secondary metabolismare the only ones with multiple proteins in each species.Pezizomycotina have also an interesting expansion of atranscription factor protein family and a wealth ofenzymes and subsequent metabolic capabilities notfound in Saccharomycotina. In contrast, Saccharomy-cotina specific protein clusters are enriched in transcrip-tion and mitochondrion related functions.
ResultsOverview of clustering resultsTo compare the ORF content of Pezizomycotina and Sac-charomycotina we selected a set of 33 species shown inTable 1. 14 of them are Pezizomycotina and 13 Saccharo-mycotina. In addition one Archeascomycota, four Basidi-omycota and one Zygomycota were included as referencespecies outside the two phyla.
To compare the ORF content systematically, we firstdivided all the ORFs in groups related by sequence simi-larity. For this we used a protein clustering softwareTRIBE-MCL [15]. It uses a graph clustering algorithm tocluster proteins based on the results of an all-against-allBLASTP [21]. The results have been shown to correlatewell with manual family classifications [15]. The sizes ofTRIBE-MCL clusters are influenced by the parameter infla-tion value (r), which is limited to values between 1.1 and4.5. Subsequently, it effects also the sensitivity, specificity,total count of clusters and count of orphan clusters (i.e.
Page 2 of 23(page number not for citation purposes)
BM
C G
enom
ics
2007
, 8:3
25ht
tp://
ww
w.b
iom
edce
ntra
l.com
/147
1-21
64/8
/325
Page
3 o
f 23
(pag
e nu
mbe
r not
for c
itatio
n pu
rpos
es)
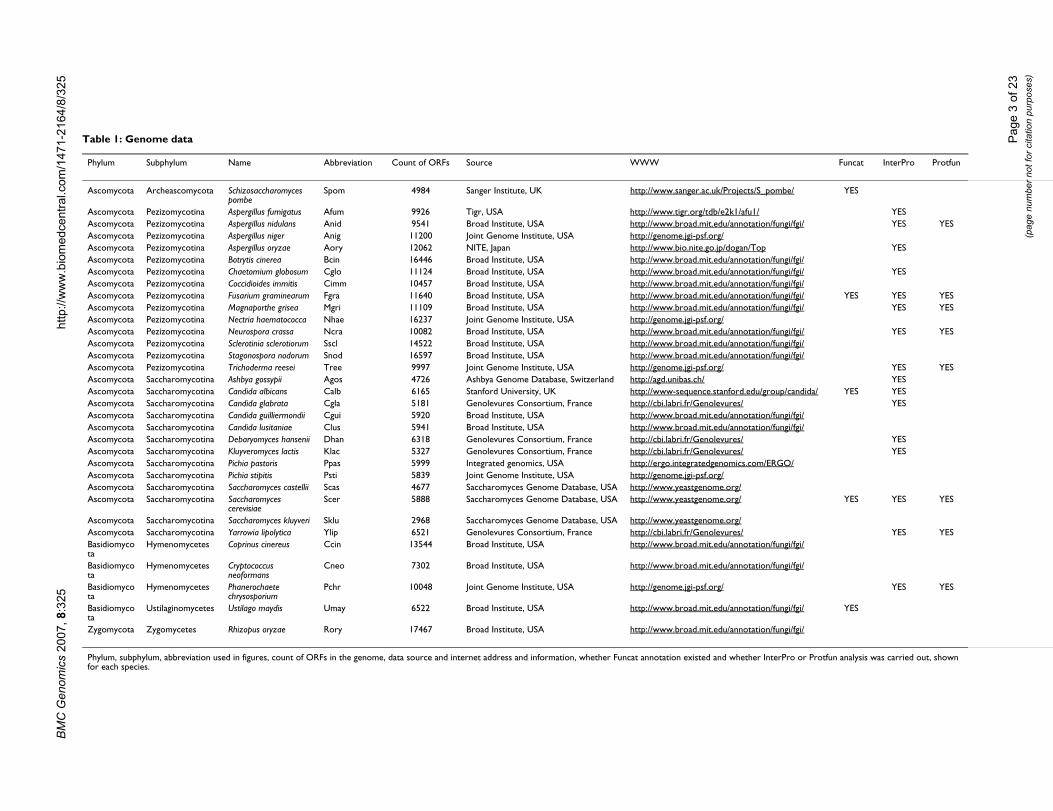
Table 1: Genome data
Phylum Subphylum Name Abbreviation Count of ORFs Source WWW Funcat InterPro Protfun
Ascomycota Archeascomycota Schizosaccharomyces pombe
Spom 4984 Sanger Institute, UK http://www.sanger.ac.uk/Projects/S_pombe/ YES
Ascomycota Pezizomycotina Aspergillus fumigatus Afum 9926 Tigr, USA http://www.tigr.org/tdb/e2k1/afu1/ YESAscomycota Pezizomycotina Aspergillus nidulans Anid 9541 Broad Institute, USA http://www.broad.mit.edu/annotation/fungi/fgi/ YES YESAscomycota Pezizomycotina Aspergillus niger Anig 11200 Joint Genome Institute, USA http://genome.jgi-psf.org/Ascomycota Pezizomycotina Aspergillus oryzae Aory 12062 NITE, Japan http://www.bio.nite.go.jp/dogan/Top YESAscomycota Pezizomycotina Botrytis cinerea Bcin 16446 Broad Institute, USA http://www.broad.mit.edu/annotation/fungi/fgi/Ascomycota Pezizomycotina Chaetomium globosum Cglo 11124 Broad Institute, USA http://www.broad.mit.edu/annotation/fungi/fgi/ YESAscomycota Pezizomycotina Coccidioides immitis Cimm 10457 Broad Institute, USA http://www.broad.mit.edu/annotation/fungi/fgi/Ascomycota Pezizomycotina Fusarium graminearum Fgra 11640 Broad Institute, USA http://www.broad.mit.edu/annotation/fungi/fgi/ YES YES YESAscomycota Pezizomycotina Magnaporthe grisea Mgri 11109 Broad Institute, USA http://www.broad.mit.edu/annotation/fungi/fgi/ YES YESAscomycota Pezizomycotina Nectria haematococca Nhae 16237 Joint Genome Institute, USA http://genome.jgi-psf.org/Ascomycota Pezizomycotina Neurospora crassa Ncra 10082 Broad Institute, USA http://www.broad.mit.edu/annotation/fungi/fgi/ YES YESAscomycota Pezizomycotina Sclerotinia sclerotiorum Sscl 14522 Broad Institute, USA http://www.broad.mit.edu/annotation/fungi/fgi/Ascomycota Pezizomycotina Stagonospora nodorum Snod 16597 Broad Institute, USA http://www.broad.mit.edu/annotation/fungi/fgi/Ascomycota Pezizomycotina Trichoderma reesei Tree 9997 Joint Genome Institute, USA http://genome.jgi-psf.org/ YES YESAscomycota Saccharomycotina Ashbya gossypii Agos 4726 Ashbya Genome Database, Switzerland http://agd.unibas.ch/ YESAscomycota Saccharomycotina Candida albicans Calb 6165 Stanford University, UK http://www-sequence.stanford.edu/group/candida/ YES YESAscomycota Saccharomycotina Candida glabrata Cgla 5181 Genolevures Consortium, France http://cbi.labri.fr/Genolevures/ YESAscomycota Saccharomycotina Candida guilliermondii Cgui 5920 Broad Institute, USA http://www.broad.mit.edu/annotation/fungi/fgi/Ascomycota Saccharomycotina Candida lusitaniae Clus 5941 Broad Institute, USA http://www.broad.mit.edu/annotation/fungi/fgi/Ascomycota Saccharomycotina Debaryomyces hansenii Dhan 6318 Genolevures Consortium, France http://cbi.labri.fr/Genolevures/ YESAscomycota Saccharomycotina Kluyveromyces lactis Klac 5327 Genolevures Consortium, France http://cbi.labri.fr/Genolevures/ YESAscomycota Saccharomycotina Pichia pastoris Ppas 5999 Integrated genomics, USA http://ergo.integratedgenomics.com/ERGO/Ascomycota Saccharomycotina Pichia stipitis Psti 5839 Joint Genome Institute, USA http://genome.jgi-psf.org/Ascomycota Saccharomycotina Saccharomyces castellii Scas 4677 Saccharomyces Genome Database, USA http://www.yeastgenome.org/Ascomycota Saccharomycotina Saccharomyces
cerevisiaeScer 5888 Saccharomyces Genome Database, USA http://www.yeastgenome.org/ YES YES YES
Ascomycota Saccharomycotina Saccharomyces kluyveri Sklu 2968 Saccharomyces Genome Database, USA http://www.yeastgenome.org/Ascomycota Saccharomycotina Yarrowia lipolytica Ylip 6521 Genolevures Consortium, France http://cbi.labri.fr/Genolevures/ YES YESBasidiomycota
Hymenomycetes Coprinus cinereus Ccin 13544 Broad Institute, USA http://www.broad.mit.edu/annotation/fungi/fgi/
Basidiomycota
Hymenomycetes Cryptococcus neoformans
Cneo 7302 Broad Institute, USA http://www.broad.mit.edu/annotation/fungi/fgi/
Basidiomycota
Hymenomycetes Phanerochaete chrysosporium
Pchr 10048 Joint Genome Institute, USA http://genome.jgi-psf.org/ YES YES
Basidiomycota
Ustilaginomycetes Ustilago maydis Umay 6522 Broad Institute, USA http://www.broad.mit.edu/annotation/fungi/fgi/ YES
Zygomycota Zygomycetes Rhizopus oryzae Rory 17467 Broad Institute, USA http://www.broad.mit.edu/annotation/fungi/fgi/
Phylum, subphylum, abbreviation used in figures, count of ORFs in the genome, data source and internet address and information, whether Funcat annotation existed and whether InterPro or Protfun analysis was carried out, shown for each species.

BMC Genomics 2007, 8:325 http://www.biomedcentral.com/1471-2164/8/325
clusters with only one member), which are shown in Fig-ure 1 for different inflation values. We defined sensitivityas the average percentage of how many of the proteinswith same InterPro domain structure (see below) are con-tained in a single cluster. In parallel, specificity wasdefined as the average percentage of how many of the pro-teins in a cluster have the same InterPro domain structure[22]. We selected for further analysis a clustering where r= 3.1, as a good compromise between sensitivity and spe-cificity.
We used the program InterProScan [23] to detect if pro-teins from a sub set of genomes (Table 1) had a sequencefeature corresponding to an InterPro entry. InterPro is adatabase of known protein sequence features such asdomains, families and active sites, i.e. InterPro entries. Incontrast to TRIBE-MCL clustering, InterProScan is notcomprehensive as it is limited to known entries acceptedto the InterPro database and not uniform because an entrymight represent a completely different evolutionary orfunctional level such as superfamily, subfamily or proteinsequence feature such as domain or active site. Thus,TRIBE-MCL clustering allows us to compare genomes in acomprehensive and uniform way, while InterProScananalysis allows a comparison of distributions of specificknown sequence features.
In order to elucidate how well our analysis covers thegenomes studied we counted, for the species analysedwith InterProScan, the percentage of ORFs in orphan clus-ters and the percentage of ORFs without any InterProentries (Figure 2). The Ascomycota genomes with particu-larly high percentage of orphan clusters in relation to theirgenome size are N. crassa and Yarrowia lipolytica. N. crassahas also a particularly high percentage of InterProScanunrecognised ORFs. In contrast, the data set includes sev-eral closely related members of the Eurotiales; A. nidulans,A. fumigatus, A. oryzae and A. niger, which have a particu-larly low percentage of orphan clusters and InterProScanunrecognised ORFs.
To find out how redundant the ORF contents of thegenomes studied are, we counted genomic ORF redun-dancy in each genome (Figure 3). This was defined as thepercentage of ORFs in a genome found in clusters withmore than one ORF from the same species [3]. Particularlyhigh values of redundancy in relation to their genomesizes are found in the Saccharomycotina species that haveundergone a recent genome duplication [2,3] (S. cerevisiaeand S. castellii), while Candida glabrata, which alsobelongs to the genome duplication lineage has an averagevalue. N. crassa genome has been shown to have an
Unrecognised by InterPro or clusteringFigure 2Unrecognised by InterPro or clustering. Percentage of ORFs in orphan clusters (y-axis) versus the percentage of ORFs unrecognised by InterPro (x-axis) for species which were analysed with InterProScan. Species are coloured by phyla. Names of the species, plotted as abbreviations beside the data points, are explained in Table 1.
Selection of the protein clustering parameter "inflation value" (r)Figure 1Selection of the protein clustering parameter "infla-tion value" (r). Average sensitivity and specificity percent-ages (left y-axis) and total count and count of orphan clusters i.e. clusters with only a single member ORF (right y-axis) for clusterings made with different inflation values (x-axis).
Page 4 of 23(page number not for citation purposes)

BMC Genomics 2007, 8:325 http://www.biomedcentral.com/1471-2164/8/325
extremely low level of paralogy due to the RIP mechanism[7], and in accordance it has a particularly low value ofredundancy in relation to its genome size. Due to theincomplete state of S. kluyveri genome sequence [24] itsredundancy is likely to be underestimated.
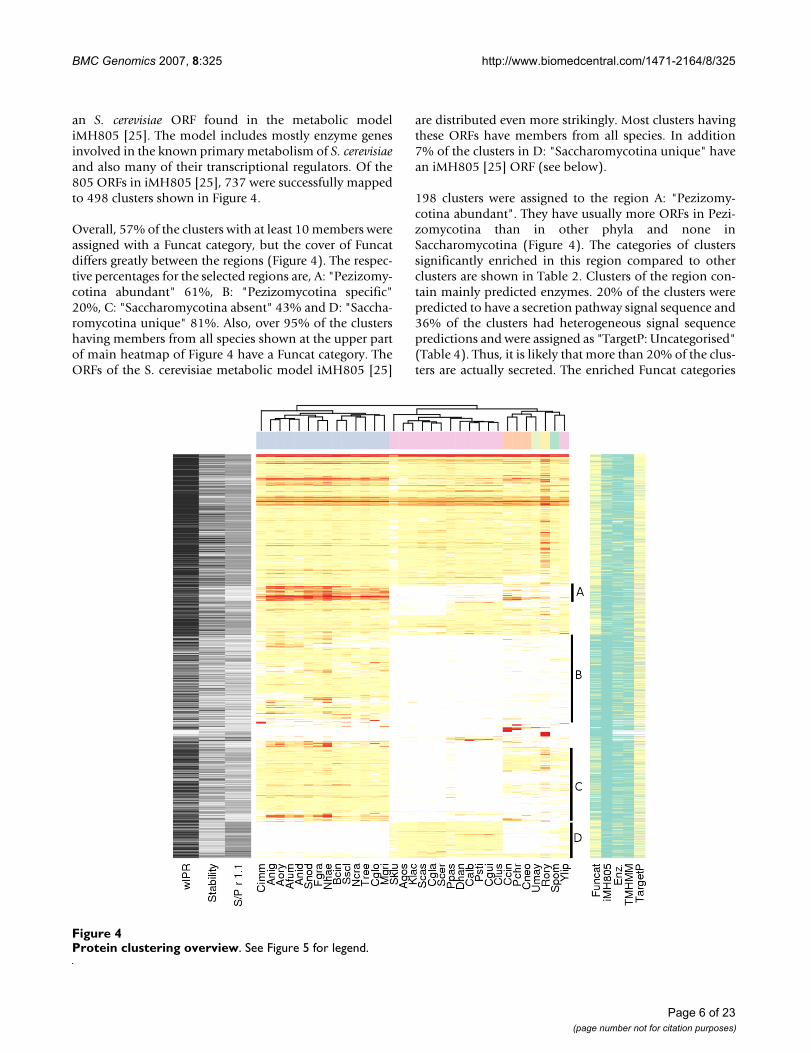
Characterization of clustersIn order to divide the clusters obtained in our analysis tophylogenetically interesting groups, clusters with at least10 member ORFs, were ordered by hierarchical clusteringbased on how many proteins of each species wereincluded in each cluster (Figure 4 and 5 or an excel version[see additional file 1]). We selected four regions withinteresting ORF contents for further analysis, A: "Pezizo-mycotina abundant", B: "Pezizomycotina specific", C:"Saccharomycotina absent" and D: "Saccharomycotinaunique". To characterise the content of the regions, they
were analysed for enrichment of Funcat categories, Prot-fun categories and InterPro entries (Tables 2, 3, 4 and 5).Funcat is a hierarchical protein function classification sys-tem based on extensive manual annotation [17]. Protfunintegrates results from several other protein feature pre-diction programmes to predict characteristics and func-tions of a protein based on its sequence [20]. However,Protfun does not use any sequence similarity information,which is essential in attempting to characterise novel pro-tein families unique to fungi. Each cluster's member ORFswere checked for Funcat, InterPro and Protfun assign-ments and when at least 75% (ProtFun and InterPro) orall (Funcat) ORFs of those for which data was availablehad the same assignment, it was given to the cluster. Ifassignments were more heterogeneous, the cluster wasassigned as uncategorised for the particular type of assign-ment. In addition, we checked which clusters contained
Genomic ORF redundancyFigure 3Genomic ORF redundancy. Percentage of ORFs in clusters containing more than one ORF from the species in question i.e. genomic ORF redundancy (y-axis) versus the size of the genome in ORFs (x-axis) for each species. See Figure 2 for further details.
Page 5 of 23(page number not for citation purposes)
BMC Genomics 2007, 8:325 http://www.biomedcentral.com/1471-2164/8/325
an S. cerevisiae ORF found in the metabolic modeliMH805 [25]. The model includes mostly enzyme genesinvolved in the known primary metabolism of S. cerevisiaeand also many of their transcriptional regulators. Of the805 ORFs in iMH805 [25], 737 were successfully mappedto 498 clusters shown in Figure 4.
Overall, 57% of the clusters with at least 10 members wereassigned with a Funcat category, but the cover of Funcatdiffers greatly between the regions (Figure 4). The respec-tive percentages for the selected regions are, A: "Pezizomy-cotina abundant" 61%, B: "Pezizomycotina specific"20%, C: "Saccharomycotina absent" 43% and D: "Saccha-romycotina unique" 81%. Also, over 95% of the clustershaving members from all species shown at the upper partof main heatmap of Figure 4 have a Funcat category. TheORFs of the S. cerevisiae metabolic model iMH805 [25]
are distributed even more strikingly. Most clusters havingthese ORFs have members from all species. In addition7% of the clusters in D: "Saccharomycotina unique" havean iMH805 [25] ORF (see below).
198 clusters were assigned to the region A: "Pezizomy-cotina abundant". They have usually more ORFs in Pezi-zomycotina than in other phyla and none inSaccharomycotina (Figure 4). The categories of clusterssignificantly enriched in this region compared to otherclusters are shown in Table 2. Clusters of the region con-tain mainly predicted enzymes. 20% of the clusters werepredicted to have a secretion pathway signal sequence and36% of the clusters had heterogeneous signal sequencepredictions and were assigned as "TargetP: Uncategorised"(Table 4). Thus, it is likely that more than 20% of the clus-ters are actually secreted. The enriched Funcat categories
Protein clustering overviewFigure 4Protein clustering overview. See Figure 5 for legend.
Page 6 of 23(page number not for citation purposes)

BMC Genomics 2007, 8:325 http://www.biomedcentral.com/1471-2164/8/325
of the clusters are mainly related to plant biomass degra-dation and secondary metabolism (Table 2). EnrichedInterPro entries of the clusters are also mainly in catego-ries connected to secondary metabolism and plant bio-mass degradation. However, proteins with domainsrelated to secondary metabolism might also have otherfunctions. For example, the methylation carried out by"IPR01077: O-methyltransferases family 2" domains canfunction in transcription regulation or aflatoxin biosyn-thesis [26].
The 1130 clusters of the region B: "Pezizomycotina spe-cific" have usually just one ORF in each Pezizomycotinaspecies and none in the other phyla (Figure 4). Most pro-teins in these clusters were predicted not to have trans-
membrane regions and 16% of them were predicted notto be enzymes. 11% of the clusters were predicted to havea secretion pathway signal sequence. The cellular role pre-dictions "Cell envelope", "Regulatory functions", "Centralintermediary metabolism" "Purines and pyrimidines"show significant enrichment. The Funcat classificationcategory "response to environmental stimuli" is the onlyone significantly enriched (Table 3). Enriched InterProentries IPR001138 and IPR007219 (Table 5), are tran-scription factor domains that commonly occur together(see chapter "PCA of InterPro entry counts" below). Oth-erwise the enriched entries are functionally diverse.
The 1010 clusters of the region C: "Saccharomycotinaabsent" have usually just one ORF in each Pezizomy-
Legend for figure 4Figure 5Legend for figure 4. A heatmap of clusters with at least ten ORFs. In the main heatmap colour intensity of a cell shows the number of ORFs shown by clusters (rows) and by species (columns). Both rows and columns are ordered by hierarchical clus-tering to group similar rows or columns together. The dendrogram from hierarchical clustering is shown for columns and the phylum of species is indicated by a column colour bar between the heatmap and the dendrogram. Under the heatmap each spe-cies is specified by an abbreviation explained in Table 1. On the left side of the main heatmap a black and white side heatmap shows the percentage of ORFs in a cluster that have an InterPro entry of all cluster's ORFs analysed with InterProScan ("wIPR"), cluster's stability and cluster's Saccharomycotina to Pezizomycotina ratio in a clustering where inflation value (r) was 1.1 ("S/P r 1.1"). Stability reflects the ratio of cluster size between a clustering where r = 3.1 to that where r = 1.1. As Figure 1 shows, when r is set to its minimum value (1.1), TRIBE-MCL clustering produces a minimum amount of clusters and orphan clusters. In consequence the clusters are on average larger when r = 1.1. The ratio between cluster size r = 3.1 and r = 1.1 is shown as a percentage. "S/P r 1.1" reflects the ratio of count of Saccharomycotina ORFs to Pezizomycotina ORFs in a cluster when r = 1.1. By comparing "S/P r 1.1" to the species distribution of a cluster shown on the main heatmap one can see if a clus-ter retains the Saccharomycotina to Pezizomycotina ratio when r = 1.1. On the right side of the main heatmap, a side heatmap shows various functional classifications for the clusters. Whether or not the cluster has a Funcat classification ("Funcat") or has an ORF found in S. cerevisiae metabolic model iMH805 is shown ("iMH805"). Whether the proteins in the cluster are predicted by Protfun to have a signal sequence directing them into either mitochondrion or secretion pathway ("TargetP"), have trans-membrane domains ("TMHMM") or are predicted to be enzymes is shown ("Enz."). Clusters belonging to regions A: "Pezizo-mycotina abundant", B: "Pezizomycotina specific", C: "Saccharomycotina absent" and D: "Saccharomycotina unique" are specified by a vertical bar between main and right heatmap.
Page 7 of 23(page number not for citation purposes)

BMC Genomics 2007, 8:325 http://www.biomedcentral.com/1471-2164/8/325
Table 2: Enriched cluster categories in region A: "Pezizomycotina abundant"
Software or database
Database identifier
Category Count of clusters in region
% of clusters in region
% of all clusters
with category
P-value Author assignment Figure 13
ProtFun - Enzyme/nonenzyme: Enzyme 180 91.0 5 1.60E-11 - -ProtFun - Enzyme class: Uncategorised 147 74.0 6 1.60E-17 - -ProtFun - Cellular role: Uncategorised 143 72.0 4 2.10E-02 - -Funcat 01 Metabolism 81 41.0 6 8.00E-06 Metabolism -ProtFun - TargetP: Uncategorised 71 36.0 5 1.40E-04 - -Funcat 01.05 C-compound and carbohydrate
metabolism41 21.0 10 1.30E-07 Plant biomass degradation -
ProtFun - TargetP: Secretion 39 20.0 9 1.30E-07 - -ProtFun - Cellular role: Cell envelope 30 15.0 11 1.20E-08 - -Funcat 01.05.01 C-compound and carbohydrate
utilization29 15.0 10 1.30E-05 Plant biomass degradation -
Funcat 32 Cell rescue, defence and virulence 24 12.0 7 6.50E-03 Virulence/Defence -Funcat 01.05.01.01 C-compound, carbohydrate
catabolism22 11.0 22 4.40E-11 Plant biomass degradation -
ProtFun - TMHMM: Uncategorised 20 10.0 7 3.70E-03 - -Funcat 01.20 Secondary metabolism 19 10.0 22 1.40E-09 2ary metabolism -Funcat 32.05 Disease, virulence and defence 14 7.0 23 1.00E-07 Virulence/Defence -Funcat 01.05.01.01.02 Polysaccharide degradation 13 7.0 27 3.50E-08 Plant biomass degradation -Funcat 32.05.05 Virulence, disease factors 9 5.0 45 3.20E-08 Virulence/Defence -Interpro IPR001128 Cytochrome P450 8 4.0 42 1.30E-07 2ary metabolism YESInterpro IPR002347 Glucose/ribitol dehydrogenase 8 4.0 21 4.60E-05 2ary metabolism YESFuncat 32.07 Detoxification 7 4.0 10 2.20E-02 2ary metabolism -Interpro IPR002198 Short-chain dehydrogenase/
reductase SDR7 3.5 21 1.60E-04 2ary metabolism YES
Interpro IPR006094 FAD linked oxidase, N-terminal 5 2.5 56 6.30E-06 2ary metabolism YESInterpro IPR003042 Aromatic-ring hydroxylase 5 2.5 36 8.60E-05 2ary metabolism YESFuncat 01.25 Extracellular metabolism 4 2.0 36 7.30E-04 Plant biomass degradation -Funcat 02.16 Fermentation 4 2.0 20 8.00E-03 Metabolism -Funcat 01.05.01.01.01 Sugar, glucoside, polyol and
carboxylate catabolism4 2.0 19 9.50E-03 Plant biomass degradation -
Funcat 30.05 Transmembrane signal transduction 4 2.0 12 4.50E-02 Signalling -Interpro IPR011050 Pectin lyase fold/virulence factor 4 2.0 27 1.60E-03 Plant biomass degradation NOInterpro IPR000873 AMP-dependent synthetase and
ligase4 2.0 25 2.10E-03 2ary metabolism YES
Interpro IPR008985 Concanavalin A-like lectin/glucanase 4 2.0 24 2.60E-03 Plant biomass degradation NOFuncat 32.10.07 Degradation of foreign (exogenous)
polysaccharides3 2.0 50 1.20E-03 Plant biomass degradation -
Funcat 01.01.09.05 Metabolism of tyrosine 3 2.0 43 2.10E-03 2ary metabolism -Funcat 01.05.01.01.09 Aerobic aromate catabolism 3 2.0 43 2.10E-03 Metabolism -Funcat 32.10 Degradation of foreign (exogenous)
compounds3 2.0 38 3.30E-03 Plant biomass degradation -
Funcat 02.25 Oxidation of fatty acids 3 2.0 27 8.80E-03 2ary metabolism -Interpro IPR010730 Heterokaryon incompatibility 3 1.5 75 1.80E-04 Mating YESInterpro IPR003661 Histidine kinase A, N-terminal 3 1.5 43 1.40E-03 Signalling NOInterpro IPR006163 Phosphopantetheine-binding 3 1.5 43 1.40E-03 2ary metabolism YESInterpro IPR005467 Histidine kinase 3 1.5 38 2.20E-03 Signalling NOInterpro IPR001789 Response regulator receiver 3 1.5 33 3.20E-03 Signalling NOFuncat 30.05.01.10 Two-component signal transduction
system2 1.0 67 4.90E-03 Signalling -
Funcat 32.05.05.01 Toxins 2 1.0 50 9.50E-03 2ary metabolism -Funcat 01.01.09.05.02 Degradation of tyrosine 2 1.0 40 1.50E-02 2ary metabolism -Funcat 01.20.37 Biosynthesis of peptide derived
compounds2 1.0 40 1.50E-02 2ary metabolism -
Funcat 34.11.11 Rhythm (e.g. circadian, ultradian) 2 1.0 40 1.50E-02 Other -Funcat 01.01.09.04 Metabolism of phenylalanine 2 1.0 33 2.30E-02 2ary metabolism -Funcat 01.25.01 Extracellular polysaccharide
degradation2 1.0 33 2.30E-02 Plant biomass degradation -
Funcat 16.05 Polysaccharide binding 2 1.0 33 2.30E-02 Plant biomass degradation -Funcat 16.21.05 FAD/FMN binding 2 1.0 33 2.30E-02 2ary metabolism -Funcat 01.01.11.03.02 Degradation of valine 2 1.0 29 3.10E-02 2ary metabolism -Funcat 30.05.01 Receptor enzyme mediated
signalling2 1.0 25 4.00E-02 Signalling -
Funcat 01.20.35.01 Biosynthesis of phenylpropanoids 2 1.0 22 5.00E-02 2ary metabolism -Interpro IPR000675 Cutinase 2 1.0 100 1.30E-03 Plant biomass degradation NOInterpro IPR001077 O-methyltransferase, family 2 2 1.0 100 1.30E-03 Regulation NOInterpro IPR002227 Tyrosinase 2 1.0 100 1.30E-03 2ary metabolism NOInterpro IPR008922 Di-copper centre-containing 2 1.0 100 1.30E-03 Dubious NOInterpro IPR012951 Berberine/berberine-like 2 1.0 100 1.30E-03 2ary metabolism NO
Page 8 of 23(page number not for citation purposes)

BMC Genomics 2007, 8:325 http://www.biomedcentral.com/1471-2164/8/325
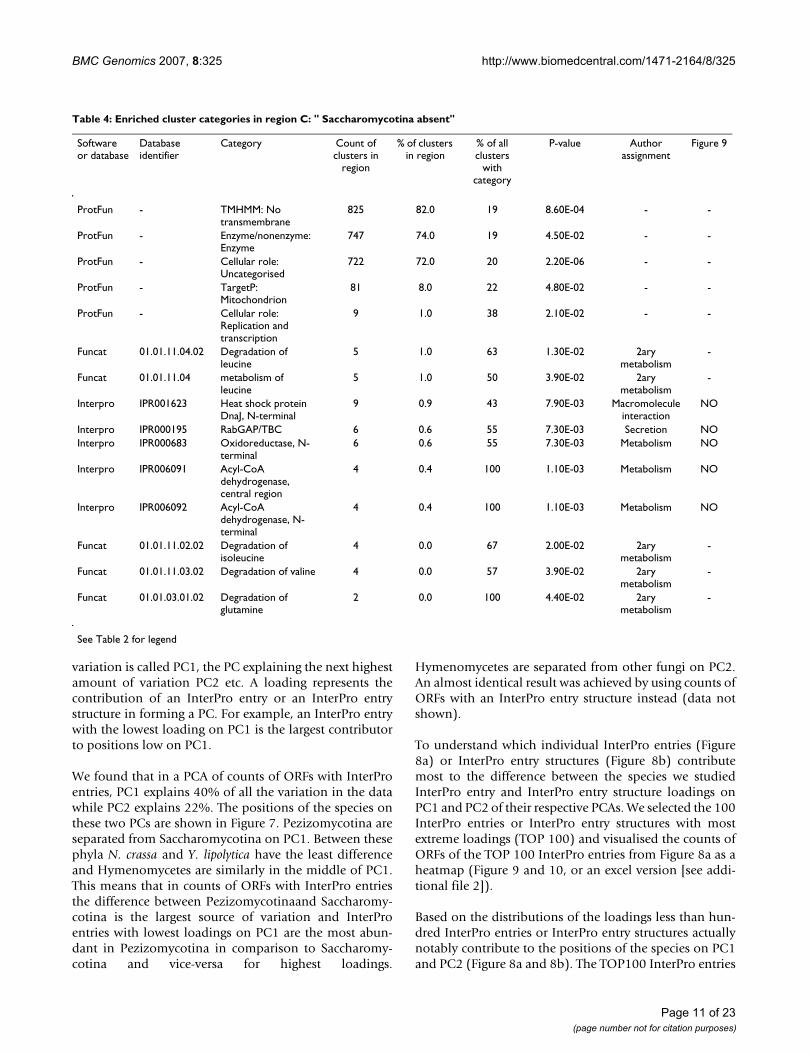
cotina species and none in Saccharomycotina (Figure 4).They were predicted mainly not to have transmembraneregions and 74% were predicted to be enzymes. No cellu-lar role could be predicted for 72% of the clusters (Table4). Several Funcat amino acid degradation categories areenriched in these clusters (Table 4). However, all thesecases correspond to only five clusters that have differentoverlapping categories. The Enzyme Commission (EC)numbers found in Funcat for the proteins in these clustersall map to the KEGG [27] pathway "Valine, leucine andisoleucine degradation" (Figure 6). According to SGD andKEGG S. cerevisiae has only few of the enzymes in thispathway, while M. griseae has most of them. InterProentries enriched in the clusters of the region are mainlyrelated to metabolism (Table 4). The two Acyl-CoA dehy-drogenase entries are in the same clusters and correspondto proteins with EC: 1.3.99.3. shown in Figure 6.
The 466 clusters of the region D: "Saccharomycotinaunique" have usually just one ORF in each Saccharomy-cotina species and none in the other phyla (Figure 4).These clusters were mainly predicted not to have trans-membrane regions, and 66% were predicted not to haveany signal sequence. 20% of the clusters were predictednot to contain enzymes, while 15% were predicted to beligases. Several predicted cellular roles were also enriched(Table 4). Two of the four InterPro entries enriched in theclusters of this region are related to nucleotide binding(Table 5).
The Funcat categories enriched are either related to mito-chondrion, transcription or translation (Table 3). Catego-ries "Biogenesis of cellular components: mitochondrion"and "Ribosomal proteins" overlap. Of the 34 clusters in"Biogenesis of cellular components: mitochondrion", 28contain an S. cerevisiae ORF described by SaccharomycesGenome Database (SGD) [28] as mitochondrial ribos-omal component of the small or large subunit. Of these
ORFs, 26 are found in clusters with the category "Ribos-omal proteins".
In contrast, five clusters with the category "Subcellularlocalisation: mitochondrion" contain S. cerevisiae pro-teins not related to ribosomes that have been localised tomitochondrion in a genome wide analysis [29]. For theother clusters with "Subcellular localisation: mitochon-drion" Funcat proposes, based on sequence similarity,that they could be localised to mitochondrion. The func-tion of the ORFs found in the clusters with this enrichedcategory is not known. However, YJL082w (IML2) foundin the clusters has been shown to have a physical interac-tion with YLR014c (PPR1) [30], a positive transcriptionalregulator of the pyrimidine biosynthesis pathway [31].Also, according to InterProScan YHF198c (FMP22) foundin the clusters is a member of the "Purine/pyrimidinephosphoribosyl transferase" family (IPR002375), like theYML106W (URA5) and YMR271C (URA10) genesinvolved in the actual pyrimidine biosynthesis pathway.This evidence suggests that Saccharomycotina could havea novel mitochondrial pyrimidine related pathway notfound in Pezizomycotina.
In addition to enriched cluster categories, the region D:"Saccharomycotina unique" is characterised by 34 clus-ters, which have a gene found in the S. cerevisiae metabolicmodel iMH805 [25]. Interestingly, instead of actual met-abolic enzymes, 13 of these are transcription factors.Besides "01 Metabolism", the Funcat category mostenriched among these clusters in comparison to all otherclusters is "01.07.01 biosynthesis of vitamins, cofactorsand prosthetic groups" (p < 2,2*10e-6, 7 clusters).
PCA of InterPro entry countsThe analysis of the TRIBE-MCL clusters presented abovedealt only with clusters of at least ten member ORFs.However, the clustering produced 77.278 clusters with
Interpro IPR000743 Glycoside hydrolase, family 28 2 1.0 67 3.70E-03 Plant biomass degradation NOFuncat 01.05.01.01.11 Anaerobic aromate catabolism 1 1.0 100 4.10E-02 Metabolism -Funcat 01.20.01.09 Biosynthesis of aminoglycoside
antibiotics1 1.0 100 4.10E-02 2ary metabolism -
Funcat 01.20.23 Biosynthesis of secondary products derived from L-methionine
1 1.0 100 4.10E-02 2ary metabolism -
Funcat 01.20.36 Non-ribosomal peptide synthesis 1 1.0 100 4.10E-02 2ary metabolism -Funcat 01.20.37.05 Biosynthesis of beta-lactams 1 1.0 100 4.10E-02 2ary metabolism -Funcat 02.16.03.03 Heterofermentative pathway and
fermentation of other saccharides1 1.0 100 4.10E-02 Metabolism -
Funcat 32.05.05.03 Bacteriocins 1 1.0 100 4.10E-02 2ary metabolism -Funcat 32.07.09 Detoxification by degradation 1 1.0 100 4.10E-02 2ary metabolism -Funcat 34.11.01.01 Light environment response 1 1.0 100 4.10E-02 Signalling -Funcat 36.20.18 Plant hormonal regulation 1 1.0 100 4.10E-02 Signalling -
Software or database that the categories were derived from, category database identifier, category name, count of clusters with the category, percentage of all clusters in this region, percentage of all clusters with the category and significance of enrichment are shown for categories which are enriched in the region (Figure 4) with a p < 0.01. Column "Author assignment" shows an assignment to general themes, based on the respective database, that summarise the InterPro and Funcat categories. While the other assignments are directly based on the databases, "Secondary metabolism" covers entries which are known to participate also in secondary metabolism ([61, 62], Funcat and InterPro). For InterPro entries whether the entry is found from Figure 9 is specified in column "Figure 9". InterPro entries assigned to "Dubious" are entries that InterPro itself considers unreliable.
Table 2: Enriched cluster categories in region A: "Pezizomycotina abundant" (Continued)
Page 9 of 23(page number not for citation purposes)

BMC Genomics 2007, 8:325 http://www.biomedcentral.com/1471-2164/8/325
Table 3: Enriched cluster categories in region B: "Pezizomycotina specific"
Software or database
Database identifier
Category Count of clusters in region
% of clusters in region
% of all clusters with
category
P-value Author assignment
Figure 9
ProtFun - TMHMM: No transmembrane
913 81.0 21 5.60E-03 - -
ProtFun - Enzyme/nonenzyme: Nonenzyme
175 16.0 25 1.30E-03 - -
ProtFun - TargetP: Secretion
128 11.0 28 1.90E-05 - -
ProtFun - Cellular role: Cell envelope
93 8.0 35 9.50E-09 - -
ProtFun - Cellular role: Central intermediary metabolism
84 7.0 26 1.20E-02 - -
Interpro IPR001138 Fungal transcriptional regulatory protein, N-terminal
41 3.6 51 7.10E-10 Transcription regulation
YES
ProtFun - Cellular role: Regulatory functions
37 3.0 39 1.80E-05 - -
Interpro IPR007219 Fungal specific transcription factor
25 2.2 37 1.30E-03 Transcription regulation
YES
ProtFun - Cellular role: Purines and pyrimidines
27 2.0 28 4.30E-02 - -
Interpro IPR001810 Cyclin-like F-box
13 1.2 62 4.00E-05 Macromolecule interaction
YES
Interpro IPR000637 HMG-I and HMG-Y, DNA-binding
7 0.6 88 9.70E-05 Chromatin NO
Interpro IPR001087 Lipolytic enzyme, G-D-S-L
6 0.5 75 1.40E-03 Metabolism NO
Interpro IPR006710 Glycoside hydrolase, family 43
6 0.5 75 1.40E-03 Plant biomass degradation
NO
Interpro IPR005302 MOCO sulphurase C-terminal
3 0.3 100 8.50E-03 Metabolism NO
Interpro IPR006209 EGF-like 3 0.3 100 8.50E-03 Extracellular NOFuncat 36.20.35 Response to
environmental stimuli
3 0.0 75 4.20E-02 Signalling -
See Table 2 for legend
only a single member and 11.727 of these had InterProentries (Figure 2). In order to find differences in counts ofORFs with InterPro entries or InterPro entry structuresbetween the species, independently of TRIBE-MCL clus-ters, we carried out a Principal Component Analysis(PCA). InterPro entry structures were constructed to eachORF by reducing overlapping and redundant InterProentries into a single most specific one and concatenatingthese in the order they appear in the protein sequence.
This enabled us to differentiate between InterPro entriesappearing alone in an ORF from those that commonlyappear together in an ORF.
PCA finds principal components (PC), i.e. major sourcesof variation between the species and positions of the orig-inal samples and the loadings of individual InterProentries or InterPro entry structures on the PCs. The PCs arenamed so that the PC explaining the highest amount of
Page 10 of 23(page number not for citation purposes)
BMC Genomics 2007, 8:325 http://www.biomedcentral.com/1471-2164/8/325
variation is called PC1, the PC explaining the next highestamount of variation PC2 etc. A loading represents thecontribution of an InterPro entry or an InterPro entrystructure in forming a PC. For example, an InterPro entrywith the lowest loading on PC1 is the largest contributorto positions low on PC1.
We found that in a PCA of counts of ORFs with InterProentries, PC1 explains 40% of all the variation in the datawhile PC2 explains 22%. The positions of the species onthese two PCs are shown in Figure 7. Pezizomycotina areseparated from Saccharomycotina on PC1. Between thesephyla N. crassa and Y. lipolytica have the least differenceand Hymenomycetes are similarly in the middle of PC1.This means that in counts of ORFs with InterPro entriesthe difference between Pezizomycotinaand Saccharomy-cotina is the largest source of variation and InterProentries with lowest loadings on PC1 are the most abun-dant in Pezizomycotina in comparison to Saccharomy-cotina and vice-versa for highest loadings.
Hymenomycetes are separated from other fungi on PC2.An almost identical result was achieved by using counts ofORFs with an InterPro entry structure instead (data notshown).
To understand which individual InterPro entries (Figure8a) or InterPro entry structures (Figure 8b) contributemost to the difference between the species we studiedInterPro entry and InterPro entry structure loadings onPC1 and PC2 of their respective PCAs. We selected the 100InterPro entries or InterPro entry structures with mostextreme loadings (TOP 100) and visualised the counts ofORFs of the TOP 100 InterPro entries from Figure 8a as aheatmap (Figure 9 and 10, or an excel version [see addi-tional file 2]).
Based on the distributions of the loadings less than hun-dred InterPro entries or InterPro entry structures actuallynotably contribute to the positions of the species on PC1and PC2 (Figure 8a and 8b). The TOP100 InterPro entries
Table 4: Enriched cluster categories in region C: " Saccharomycotina absent"
Software or database
Database identifier
Category Count of clusters in
region
% of clusters in region
% of all clusters
with category
P-value Author assignment
Figure 9
ProtFun - TMHMM: No transmembrane
825 82.0 19 8.60E-04 - -
ProtFun - Enzyme/nonenzyme: Enzyme
747 74.0 19 4.50E-02 - -
ProtFun - Cellular role: Uncategorised
722 72.0 20 2.20E-06 - -
ProtFun - TargetP: Mitochondrion
81 8.0 22 4.80E-02 - -
ProtFun - Cellular role: Replication and transcription
9 1.0 38 2.10E-02 - -
Funcat 01.01.11.04.02 Degradation of leucine
5 1.0 63 1.30E-02 2ary metabolism
-
Funcat 01.01.11.04 metabolism of leucine
5 1.0 50 3.90E-02 2ary metabolism
-
Interpro IPR001623 Heat shock protein DnaJ, N-terminal
9 0.9 43 7.90E-03 Macromolecule interaction
NO
Interpro IPR000195 RabGAP/TBC 6 0.6 55 7.30E-03 Secretion NOInterpro IPR000683 Oxidoreductase, N-
terminal6 0.6 55 7.30E-03 Metabolism NO
Interpro IPR006091 Acyl-CoA dehydrogenase, central region
4 0.4 100 1.10E-03 Metabolism NO
Interpro IPR006092 Acyl-CoA dehydrogenase, N-terminal
4 0.4 100 1.10E-03 Metabolism NO
Funcat 01.01.11.02.02 Degradation of isoleucine
4 0.0 67 2.00E-02 2ary metabolism
-
Funcat 01.01.11.03.02 Degradation of valine 4 0.0 57 3.90E-02 2ary metabolism
-
Funcat 01.01.03.01.02 Degradation of glutamine
2 0.0 100 4.40E-02 2ary metabolism
-
See Table 2 for legend
Page 11 of 23(page number not for citation purposes)

BM
C G
enom
ics
2007
, 8:3
25ht
tp://
ww
w.b
iom
edce
ntra
l.com
/147
1-21
64/8
/325
Page
12
of 2
3(p
age
num
ber n
ot fo
r cita
tion
purp
oses
)
Table 5: Enriched cluster categories in region C: "Saccharomycotina unique"
Software or database
Database identifier
Category Count of clusters in region
% of clusters in region
% of all clusters with category
P-value Author assignment
Figure 9
ProtFun - TMHMM: No transmembrane 380 82.0 9 2.90E-02 - -ProtFun - TargetP: No splice site 306 66.0 10 1.30E-04 - -Funcat 11 Transcription 105 23.0 11 2.60E-02 Transcription -ProtFun - Enzyme/nonenzyme: Nonenzyme 95 20.0 13 7.80E-07 - -ProtFun - Cellular role: Translation 87 19.0 23 6.20E-20 - -Funcat 11.02 RNA synthesis 70 15.0 12 4.70E-02 Transcription -ProtFun - Enzyme class: Ligase (EC 6.-.-.-) 68 15.0 15 2.40E-06 - -ProtFun - TargetP: Mitochondrion 54 12.0 14 4.20E-05 - -ProtFun - Cellular role: Central intermediary
metabolism43 9.0 13 2.00E-03 - -
ProtFun - Cellular role: Amino acid biosynthesis 37 8.0 35 6.80E-15 - -Funcat 42.16 Biogenesis of cellular compartment:
mitochondrion34 7.0 21 5.30E-06 Mitochondrion -
Funcat 12.01.01 Ribosomal proteins 27 6.0 14 3.80E-02 Protein translation
-
ProtFun - Cellular role: Energy metabolism 20 4.0 17 1.80E-03 - -Funcat 70.16 Subcellular localisation: mitochondrion 18 4.0 16 2.40E-02 Mitochondrion -Funcat 11.04.01 rRNA processing 17 4.0 15 3.90E-02 Transcription -ProtFun - Cellular role: Regulatory functions 15 3.0 16 1.10E-02 - -Interpro IPR011046 WD40-like 14 3.0 18 5.70E-03 Dubious YESProtFun - Enzyme class: Isomerase (EC 5. -. -.-) 14 3.0 45 5.30E-08 - -Funcat 11.02.01 rRNA synthesis 11 2.0 19 2.40E-02 Transcription -ProtFun - Cellular role: Biosynthesis of cofactors 7 2.0 37 6.00E-04 - -ProtFun - Cellular role: Replication and transcription 7 2.0 29 2.80E-03 - -Funcat 18.02.09 Regulator of transcription factor 5 1.0 31 1.50E-02 Transcription
regulation-
Interpro IPR006596 Nucleotide binding protein, PINc 3 0.6 60 5.20E-03 Nucleotide binding
NO
Interpro IPR000992 Stress-induced protein SRP1/TIP1 2 0.4 100 7.10E-03 Stress response NOInterpro IPR007757 MT-A70 2 0.4 100 7.10E-03 Nucleotide
bindingNO
See Table 2 for legend

BMC Genomics 2007, 8:325 http://www.biomedcentral.com/1471-2164/8/325
Page 13 of 23(page number not for citation purposes)
The KEGG metabolic pathway "Valine, leucine and isoleucine degradation"Figure 6The KEGG metabolic pathway "Valine, leucine and isoleucine degradation". Enzymes found in S. cerevisiae according to SGD and KEGG are filled with green and in M. grisea according to KEGG circled in orange. Enzymes found in clusters cor-responding to Funcat categories 01.01.11.02 -01.01.11.04 enriched in the region C: "Saccharomycotina absent" in Table 3 are filled with pink.

BMC Genomics 2007, 8:325 http://www.biomedcentral.com/1471-2164/8/325
are related to a wide variety of biological functions, butthe five most common, with their counts, are: "Macromol-ecule interaction, 19", "Secondary metabolism, 18","Dubious, 9", "Protein modification, 8" and "Transporter,7". InterPro entries assigned to "Dubious" are entries thatInterPro itself considers unreliable.
The InterPro entry structures contributing most to PC1and PC2 and having several InterPro entries that appeartogether are "IPR001138: Fungal transcriptional regula-tory protein, N-terminal, IPR007219: Fungal specific tran-scription factor", "IPR000719: Protein kinase,IPR008271: Serine/threonine protein kinase, active site","IPR011046: WD40-like, IPR001680: WD40 repeat" and"IPR002290: Serine/threonine protein kinase,IPR008271: Serine/threonine protein kinase, active site"(Figure 8b). These seven InterPro entries belong also tothe TOP100 individual entries shown on Figure 8a and 8.
IPR001138 is a DNA binding N-terminal zinc binuclearcluster (Zn2Cys6) domain and IPR007219 a C-terminaldomain commonly found in proteins with IPR001138.Both are found in many fungal transcription factors suchas S. cerevisiae GAL4 [32], A. niger xlnR [33] and Aspergillusflavus aflR [34]. Of proteins with IPR001138, 39% havealso an IPR007219. On the average a Pezizomycotina hasthree times more ORFs with IPR001138 than a Saccharo-mycotina.
PCA loadings of InterPro entries and InterPro entry struc-turesFigure 8PCA loadings of InterPro entries and InterPro entry structures. PCA loadings of InterPro entries (a) or InterPro entry structures (b) of the two PCs that explain the largest amount of variation in the counts of ORFs with an InterPro entry. The PCA for InterPro entries (a) is shown in picture 11, for InterPro entry structures (b) data not shown. 100 InterPro entries or InterPro entry structures having the most extreme PCA loadings on the two PCs shown are coloured with orange (TOP 100), while the rest are 4373 InterPro entries and 16319 InterPro structures are in blue. InterPro entries identifiers are shown for 20 most extreme PCA load-ings.
PCA of counts of ORFs with an InterPro entryFigure 7PCA of counts of ORFs with an InterPro entry. Posi-tions of species analysed with InterProScan on the two PCs that explain the largest amount of variation in the counts of ORFs with an InterPro entry. Species abbreviations are explained in Table 1 and data points are coloured by phyla.
Page 14 of 23(page number not for citation purposes)

BMC Genomics 2007, 8:325 http://www.biomedcentral.com/1471-2164/8/325
Page 15 of 23(page number not for citation purposes)
TOP 100 InterPro entriesFigure 9TOP 100 InterPro entries. See Figure 10 for legend.

BMC Genomics 2007, 8:325 http://www.biomedcentral.com/1471-2164/8/325
Browsable fungal comparative genomics databaseAutomatic classifications of translated ORFs to familiesbased on similarity to known families or de novo classifi-cations by translated ORF clustering are not perfect. Wehave used InterProScan [16] to find out if an ORF is amember of a known family or has some known sequencefeature like a domain or an active site i.e. has an InterProentry. We also used TRIBE-MCL [15] to cluster ORFs basedpurely on sequence similarity. Our database aims to inte-grate these two classifications in the context of fungalcomparative genomics and to allow easy browser access tothe data.
Figure 11 shows a schematic of browser views and thelinks between them and example screenshots. "Proteinview" shows an individual ORF with its InterPro entries. Itis mainly used to access "Protein cluster view" that showsall the member ORFs of a cluster with InterPro entries
found in them. "InterPro entry view" is identical to "Pro-tein cluster view", except that it shows all ORFs with agiven InterPro entry. "Protein cluster overview" and"InterPro entry overview" show a heatmap where clustersor InterPro entries are rows, and the columns show thecount of ORFs in each species. The two overviews are usedto find clusters or InterPro entries with similar phyloge-netic profiles. "InterPro cluster overlap view" shows for agiven InterPro entry a table of all clusters whose membershave the entry.
The sizes of the TRIBE-MCL [15] clusters are influenced bythe parameter inflation value. For an overall comparisonof genomes we selected the inflation value 3.1, because itgives a good compromise between clustering sensitivityand specificity (Figure 1). However in individual cases thismight not be the best value. Users can specify differentinflation values while browsing the database.
DiscussionOverview of clustering resultsWe have analysed the ORF content of Pezizomycotina andSaccharomycotina species with sequence similarity basedprotein clustering. The main clustering parameter, infla-tion value (r), was selected as a compromise between sen-sitivity and specificity of clustering. Consequently, thenumber of ORFs in clusters with only a single member(orphan clusters) is twice as large with the selected (r =3.1) than with the lowest (r = 1.1) inflation value (Figure1). The clusters were then divided in phylum specificgroups for further analysis. The column "S/P r 1.1" in Fig-ure 4 shows that the ratio of Saccharomycotina to Pezizo-mycotina ORF counts, i.e. the phylum specificity, islargely maintained in the clusters even in r = 1.1 cluster-ing. This holds especially well for A: "Pezizomycotinaabundant" and D: "Saccharomycotina unique" clusters,while other regions have more variation.
As expected, N. crassa due to its extreme RIP mechanism,has the lowest genomic ORF redundancy among Pezizo-mycotina (Figure 3) [7]. Variable RIP activity could alsoexplain the separation of Sordariomycetes species (T. ree-sei, F. graminerum, C. globosum, M. grisea and N. crassa) into two groups in regard to counts of unrecognised ORFs(Figure 2). It has been proposed that Aspergillus speciesand M. grisea could have a milder RIP like mechanism[35,36]. Our analysis does not exclude this possibility, butit is clear that the N. crassa genome is particular amongfungi. N. crassa and S. cerevisiae are probably the mostcommonly used fungal model organisms and thus it isnotable that with regard to genomic ORF redundancy theyhave the most exceptional genomes within the analysedlarge fungal genome set.
Legend for figure 9Figure 10Legend for figure 9. A heatmap of counts of ORFs with an InterPro entry for the TOP 100 entries from Figure 8a. In the main heatmap colour intensity of a cell shows the number of ORFs with an InterPro entry shown by entries (rows) and by species (columns). Both rows and columns are ordered by hierarchical clustering to group similar rows or columns together. Columns were clustered with counts of ORFs while rows were clustered with the entry PCA loadings (Left side heatmap and Figure 8a). The dendrogram from hierar-chical clustering is shown for columns and the phylum of spe-cies is indicated by a column colour bar between the heatmap and the dendrogram. Under the heatmap each spe-cies is specified by an abbreviation explained in Table 1. Left side heatmap shows the loading of the entry as in Figure 8a. Interpro entry identifier ("IPR id.", "IPR0" removed from beginning), name ("IPR name") and "Author assignment" are shown for each entry. The "Author assignment" is an assign-ment to general themes that summarise the individual cate-gories based on the InterPro database. While the other assignments are directly based on the InterPro, "Secondary metabolism" covers entries which are known to participate also in secondary metabolism ([61, 62] and InterPro). Inter-Pro entries assigned to "Dubious" are entries that InterPro itself considers unreliable.
Page 16 of 23(page number not for citation purposes)

BMC Genomics 2007, 8:325 http://www.biomedcentral.com/1471-2164/8/325
Characterisation of cluster regionsFrom the protein clustering results presented in Figure 4we selected four interesting regions containing clusterswith particular phylogenetic distributions. The clusters inthese regions were then searched for enrichment of Prot-fun and Funcat category and InterPro entry annotations.
Clusters in the region A: "Pezizomycotina abundant" haveusually more ORFs in Pezizomycotina than in other phylaand none in Saccharomycotina(Figure 6). The results ofall three annotation analyses of these clusters agree well(Table 2). This region contains relatively well character-ised enzymes involved either in secondary metabolism orin extracellular plant biomass degradation machinery, butFuncat analysis finds far more clusters involved in plantbiomass degradation than InterPro analysis. However,InterPro provides much less detail on glycosyl hydrolasesinvolved in lignocellulose degradation, than for examplethe specialised Carbohydrate-active enzymes (CAZY)database [37].
Many of the enzymes in clusters of this region, such ascytochrome P450s, glycoside hydrolases and tyrosinasesare at the edge of the metabolic network involved in syn-thesis of the final secreted metabolites or degradation ofthe external sources of carbon. Consequently, the highsequence homology and the resulting larger clusters of A:"Pezizomycotina abundant" proteins could be due torecent protein family expansions to give more possibilitiesfor the fungi to interact with the environment.
Clusters in the region B: "Pezizomycotina specific" haveusually just one ORF in each Pezizomycotina species andnone in the other phyla (Figure 4). In comparison to A:"Pezizomycotina abundant" clusters, far fewer memberORFs have any InterPro entries (Figure 4, column "wIPR")and very few InterPro or Funcat annotations show enrich-ment (Tables 3). The significant enrichment of the Prot-fun "Cellular role: Regulatory functions" and InterProentries "IPR001138: Fungal transcriptional regulatory
Schema and screenshots of the browsable fungal comparative genomics databaseFigure 11Schema and screenshots of the browsable fungal comparative genomics database. The schema on the upper right corner shows links between different browser views to the database. Additionally two example screenshots are shown. See text for further details.
Page 17 of 23(page number not for citation purposes)

BMC Genomics 2007, 8:325 http://www.biomedcentral.com/1471-2164/8/325
protein, N-terminal" and "IPR007219: Fungal specifictranscription factor" coincide well.
Clusters in the region C: "Saccharomycotina absent" haveusually just one ORF in each Pezizomycotina species andnone in Saccharomycotina (Figure 4). According to Prot-fun predictions these are mostly enzymes. In comparisonto B: "Pezizomycotina specific" clusters, more memberORFs have some InterPro entries (Figure 4, column"wIPR"), but still neither InterPro entry nor Funcat cate-gory enrichment provide much detail, except for proteinsfound in the KEGG pathway "Valine, leucine and isoleu-cine degradation" (Figure 6). The "EC: 1.3.99.3" acyl-CoAdehydrogenase, detected by InterPro and Funcat enrich-ment analysis, is a key enzyme for fatty acid β-oxidationin mitochondria. The capability for fatty acid β-oxidationin mitochondria has been shown experimentally for A.nidulans [38] and proposed by genome analysis for severalother Pezizomycotina species [6,38]. However, Saccharo-mycotina can apparently only carry out fatty acid β-oxida-tion in peroxisomes [39-42]. The proteins detected byFuncat enrichment analysis and found in M. grisea areaccording to KEGG linked to polyketide synthesis (Figure6). A reason for the other fungi than Saccharomycotina tohave this capability while the Saccharomycotina can dowithout, could be the ability to provide precursors fromthe fatty acid and amino acid metabolism to thepolyketide synthesis.
B: "Pezizomycotina specific" and C: "Saccharomycotinaabsent" clusters contain proteins of low homology thatsubsequently divide into small equally sized clusters. Theyseem to contain proteins more connected in cellularmetabolism and regulation networks than the clusters inthe region A: "Pezizomycotina abundant" and thus beunder more pressure not to expand to keep the topologyof the networks conserved. This would allow thesequences to diverge in time without simultaneous expan-sion of the families and result into small clusters broadlyconserved over Pezizomycotina.
In addition, based on the distribution of the clusters withORFs found in S. cerevisiae metabolic model iMH805[25], it is clear that over 90% of these ORFs are well con-served in all fungal species. These form the conserved coreof the fungal metabolic network. Metabolism relatedORFs in B: "Pezizomycotina specific" and C: "Saccharo-mycotina absent" could then represent a mid layer aroundthe core such as the ORFs shown in Figure 6, that link pri-mary metabolism to secondary metabolism and biomassdegradation machinery. However, Protfun predicts thatmost B: "Pezizomycotina specific" ORFs are not related tometabolism (Table 4), rather they could be involved forexample in Pezizomycotina specific morphology. Actualbiomass degradation and secondary metabolism machin-
eries, i.e. A: "Pezizomycotina abundant" ORFs, could thenform the edges of the network. Being on the outer rim ofthe metabolic network they could be subjected to mini-mal evolutionary constraints for conserving networktopology and could be directly subjected to various evolu-tionary pressures by the changing environments and thusevolve fast.
Proteins involved in secondary metabolism, glycosidehydrolases and predicted secreted uncharacterised ORFsare found in for example subtelomeric regions of Mag-naporthe oryzae [43]. Subtelomeric regions appear to havea potential for faster evolution than many other chromo-somal regions [43-45]. Consequently, subtelomeric posi-tioning could provide a mechanism to explain expansionof A: "Pezizomycotina abundant" like protein families.
Clusters in the region D: "Saccharomycotina unique" haveusually just one ORF in each Saccharomycotina speciesand none in the other phyla (Figure 4). Various Protfuncellular role predictions are enriched in these clusters,among them translation, transcription and mitochon-drion related, found also in Funcat enrichment analysis.Strikingly, clusters with the Funcat category "42.16: Bio-genesis of cellular components: Mitochondrion" corre-spond to at least 28 different components ofmitochondrial ribosomal protein complexes. However,homologous Pezizomycotina ORFs are found in theregion "B: Pezizomycotina specific". The proteinsequences in different families of mitochondrial ribos-omal proteins have diverged so much between Pezizomy-cotina and Saccharomycotina that TRIBE-MCL splits thefamilies in different clusters. This implies that these com-plexes have diverged significantly between Pezizomy-cotina and Saccharomycotina.
Comparison of clustering and PCA resultsIn addition to clustering, a PCA of counts of ORFs with anInterPro entry was done. We searched for known proteinsequence features (domains, families, and active sites etc.,i.e. InterPro entries) with the program InterProScan froma subset of genomes in our data set (Table 1), countedORFs having an entry and analysed the counts with PCA.The function of the 100 InterPro entries with most differ-ences between the species analysed (TOP 100) was stud-ied in detail.
TRIBE-MCL clustering and InterPro analyses comple-mented each other well. Proteins that are conserved inseveral species could be studied comprehensively regard-less of how well they have previously been described inInterPro by clustering (Figure 4). However, the TOP 100InterPro entries contain interesting details not detected byclustering, such as the expansion of major facilitatorsuperfamilies (MFS) and macromolecule interaction
Page 18 of 23(page number not for citation purposes)

BMC Genomics 2007, 8:325 http://www.biomedcentral.com/1471-2164/8/325
related protein families in Pezizomycotina and the distri-bution of transposon related proteins among Pezizomy-cotina (Figure 9). MFS transporters lie in clusters withORFs from all species and due to this their expansion wasnot detected clearly by the clustering analysis (Figure 4).In contrast, enrichment of "IPR001138: Fungal transcrip-tional regulatory protein, N-terminal" was detected. How-ever, the full importance of this expansion was onlyrevealed by PCA, because there are 614 clusters with lessthan 10 members that have an IPR001138. As InterProdomain analysis uses searches optimised for individualprotein families or domains, it can detect well both fami-lies with high internal sequence similarity such as MFStransporters and with low internal sequence similaritysuch as IPR001138, if the family has been previously wellcharacterised.
The InterPro entries among the TOP 100 with the lowestvalues on PC1, thus most abundant in Pezizomycotina incomparison to Saccharomycotina (Figures 8 and 9), over-lap with cluster InterPro entry enrichment of A: "Pezizo-mycotina abundant" and B: "Pezizomycotina specific"clusters (Tables 2 and 3). The major difference betweenclustering and PCA results is that in clustering transcrip-tion factors belong to B: "Pezizomycotina specific", andsecondary metabolism related clusters fall into A: "Pezizo-mycotina abundant", while PCA makes no such distinc-tion. MFS transporters have also very negative values onPC1 (Figure 9). They are transporters found for examplein fungal secondary metabolite clusters for gliotoxin [46]or trichothecene [47] synthesis. As secondary metabolismseems to be the major function connecting InterProentries with most negative values on PC1, it could beexpected that "IPR001138: Fungal transcriptional regula-tory protein, N-terminal" family has expanded to controlsecondary metabolism and that MFS transporters wouldhave expanded to export the produced metabolites. How-ever, likely targets are also the many plant biomass degra-dation related clusters found in A: "Pezizomycotinaabundant", for example IPR001138 transcription factor A.niger xlnR [33] is known to regulate cellulase and hemicel-lulase genes and A. flavus aflR [34] regulates a secondarymetabolism pathway. Furthermore, Pezizomycotina spe-cific features like ascocarp formation or other yet incom-pletely described processes could involve thesetranscription factors.
Hierarchical clustering of species' cluster ORF (Figure 4)or InterPro entry (Figure 9) counts produce different spe-cies similarity dendrograms (shown on top of the heat-map in both figures). In Figure 4, the tree constructedfrom clusters with at least ten ORFs, resembles closely theone presented by NCBI Taxonomy database [48]. How-ever, Y. lipolytica, expected to be the first species to divergefrom the Saccharomycotina lineage (for review see [1]), is
separated from other yeasts. This could imply that Y. lipo-lytica ORFs and ORF content of conserved cellular func-tions resemble more those of other fungi thanSaccharomycotina. In the tree constructed from the TOP100 InterPro entries Saccharomycotina are groupedtogether while Pezizomycotina are not divided asexpected (Figure 9). For example, the Eurotiales aregrouped together in Figure 4, although they are separatedin Figure 9. This could mean that even though the ORFcontents among Eurotiales are very similar at large, inregard to protein families contributing most to the differ-ences between the fungi studied, individual Eurotiales canresemble more other less related species. For example thehuman pathogen A. fumigatus is more similar to the plantpathogen M. griseae than to other Eurotiales.
ConclusionIn conclusion we have carried out a detailed comparisonof the ORF content of Pezizomycotina and Saccharomy-cotina species and found previously well described andnovel interesting differences. Our analysis includes funda-mentally different but complementary databases andmethods. Due to this we are able to support our conclu-sions with results from independent analysis. The use of alarge multi genome dataset further emphasises the credi-bility of the results.
We highlight promising targets for future experimentalstudies such as the expanded transcription factor familyand potential novel secreted protein families in Pezizo-mycotina. In general the proteins specific to and well con-served in Pezizomycotina should be studied further asthey are largely unknown. We propose an evolutionaryexplanation for the discovered Pezizomycotina genomefeatures. However, confirmation of this requires detailedcomparisons of the chromosomal localisations of thegenes in question and of the fungal metabolic and regula-tory network.
MethodsSequence and cluster analyses and annotation, databaseconstruction and interactions and usage of various bioin-formatics software was done with custom Perl scriptsusing when possible the BioPerl [14] libraries. Final dataanalysis and visualisation of results was done with customR scripts using the Bioconductor libraries [49] when pos-sible.
Retrieval and analysis of sequence dataProtein sequences of predicted open reading frames(ORF), in fasta format, were retrieved from varioussequencing centres as indicated in Table 1. They have beenpublished in the following articles: S. pombe [50], A. fumi-gatus [4], A. nidulans [6], A. oryzae [5], M. grisea [36], N.crassa [7], A. gossypii [51], C. albicans [52], C. glabrata [3],
Page 19 of 23(page number not for citation purposes)

BMC Genomics 2007, 8:325 http://www.biomedcentral.com/1471-2164/8/325
D. hansenii [3], K. lactis [3], S. castellii [53], S. cerevisiae[54], S. kluyveri [53], Y. lipolytica [3], P. chrysosporium [55],U. maydis [56], in addition P. pastoris was purchased fromERGO [57]. Sequences were inserted to Oracle database(Oracle) according to the BioPerlDB schema. The Addi-tional file 3 maps each sequence identifier to its speciesenabling the use of other Additional files [see additionalfile 3].
To find functional and pathway annotations for proteinsFuncat [17-19] annotations were downloaded from MIPS[58] for genomes indicated in Table 1.
Proteins from a subset of genomes (Table 1) were ana-lysed with InterProScan [16] to find features from theirsequence, i.e. InterPro [59] entries. InterPro entries canhave hierarchical parent-child relationship. For exampleIPR001236 "Lactate/malate dehydrogenase " is a parent ofIPR010097 "Malate dehydrogenase, NAD-dependent".For each protein an InterPro entry structure, i.e. a vector ofInterPro entry identifiers in the order they appear on thesequence, was constructed. From non-identical entriesoverlapping along protein sequence only the most specificwas selected in case a parent-child relationship existedbetween them. Next, any overlapping or sequential dupli-cates of the same entry were removed and the longestentry in amino acids was used to define the entries loca-tion. InterPro entries found in the ORFs are provided [seeadditional file 4].
Proteins from a subset of genomes (Table 1) were ana-lysed also with Protfun [60] to predict their function andlocalisation. Protfun categories of proteins are provided[see additional file 5].
Protein clustering and cluster annotationProteins were clustered with the graph clustering softwareTRIBE-MCL [15]. Briefly, TRIBE-MCL identifies proteinfamily like protein clusters using a Markov Clustering pro-cedure operating on a matrix of expectation values com-puted from an all-versus-all BLASTP [21] search of proteinsequences. TRIBE-MCL requires one major user definedparameter, the inflation value (r), which influences thesize of the clusters. To define a suitable r the InterPro entrystructures were used. Each cluster's InterPro entry struc-ture was defined as the most common InterPro entrystructure found in its member proteins. Subsequently, foreach tested r specificity and sensitivity of the clustering(Figure 1) were counted as proposed in [22]. A cluster'sspecificity was defined as the percentage of proteins in acluster having the same structure as the cluster's structure.A cluster's sensitivity was defined as the percentage of pro-teins with the same structure as the cluster in question ofall proteins with this structure. Sensitivity and specificityof a clustering were defined as the respective averages of
all cluster's sensitivities and specificities in a clustering.Clusters and their members are provided [see additionalfile 6].
We defined two indexes to describe the differencebetween clustering with r = 1.1 and r = 3.1, Stability and"S/P r 1.1" (Figure 4). The Stability of a cluster is the ratioof cluster sizes between r = 3.1 and r = 1.1. The cluster sizein r = 1.1 is the average of the sizes of clusters to which themembers of the r = 3.1 cluster belong to. "S/P r 1.1" of acluster is the ratio between counts of ORFs from Saccharo-mycotina and Pezizomycotina species. Similarly as Stabil-ity, it was counted for an r = 3.1 cluster by taking theaverage of Saccharomycotina – Pezizomycotina ratios ofall the clusters to which the members of an r = 3.1 clusterbelong to in an r = 1.1 clustering.
As well as an InterPro entry structure, we assigned individ-ual InterPro entries and Funcat and Protfun categories forclusters to enable analysis of sets of clusters. In additionclusters were checked for presence of proteins found in theS. cerevisiae metabolic model iMH805 [25].
Browsing of protein clustersTo view and browse sequences, their features and proteinclusters, a Generic Genome Browser (GBrowse) [13] wasset up. Normally GBrowse is used to view individual scaf-folds with features i.e. genes. We modified it to show pro-tein sequences with features i.e. domains etc. detectedwith InterProScan [16] and to display a cluster view whereall proteins of a cluster are shown along with their fea-tures.
Data analysis and visualisationSignificance of enrichment of a category in a set of clusterswas tested using the hypergeometric distribution with Rfunction "phyper" with default settings i.e. by countingthe probability of the number of successes (number ofclusters with a certain category) in a sequence of n drawsfrom a finite population (total number of clusters, uni-verse) without replacement. Because of the differentnature of the cluster annotation data, different universeswere used. For Funcat categories all clusters which had anyassigned category or entry were used as the universe. ForProtfun and Interpro data all clusters having at least 10members (Figure 4), were used as the universe.
Principal Component Analysis (PCA) was used to findmajor sources of variation in counts of ORFs having eitherindividual InterPro entries or InterPro entry structures.Counts of ORFs with InterPro entries or InterPro entrystructures were normalised with the count of ORFs in agenome. PCA was done with R function "prcomp" withoption "retx" set to true.
Page 20 of 23(page number not for citation purposes)

BMC Genomics 2007, 8:325 http://www.biomedcentral.com/1471-2164/8/325
Heatmaps of ORF counts in clusters or having certainInterPro entries were plotted with modified version of"heatmap.2" from R library "grecmisc". Complete linkagehierarchical clustering with Euclidian distance was used toorder rows and columns separately. Prior to clustering onewas added to each count, natural logarithm taken anddata was mean centred and standard deviation scaled, rowor column wise for either clustering respectively.
Authors' contributionsMA carried out data analysis and drafted the manuscript.TK and MA designed and setup the database and the data-base browser interface and TK participated in the design ofthe study. AM carried out InterProScan analysis. MS par-ticipated in the design of the study. DU participated in thedesign of the study. MP and SO conceived the study andparticipated in the design of the study. All authors haveparticipated in drafting the manuscript and approved thefinal manuscript.
Additional filesNo data is included for yet unpublished genomes, nor forthe P. pastoris purchased from ERGO. To find actualsequences search corresponding sequencing centre inter-net site with the protein sequence identifier.
Additional material AcknowledgementsWe thank Marko Sysi-Aho for help in data analysis, Kristoffer Kiil for help with Protfun, Luke Hakes, Thomas Grotkjaer and Balázs Papp for a lot of useful discussions in bioinformatics and Esko Ukkonen and Liisa Holm for giving great ideas.
This work was supported by the European Union 6th Framework Collab-oration Action Yeast Systems Biology Network LSHG-CT-2005-018942 and by the European Union 5th Framework Marie Curie Training Site for Bioinformatics Education and Research at the Faculty of Life Sciences, Uni-versity of Manchester HPMT-CT-2001-00285. This work was also part of the research programme "VTT Industrial Biotechnology" (Academy of Fin-land; Finnish Centre of Excellence programme 2000 – 2005, project no. 64330).
References1. Dujon B: Yeasts illustrate the molecular mechanisms of
eukaryotic genome evolution. Trends Genet 2006, 22:375-387.2. Kellis M, Birren BW, Lander ES: Proof and evolutionary analysis
of ancient genome duplication in the yeast Saccharomycescerevisiae. Nature 2004, 428:617-624.
3. Dujon B, Sherman D, Fischer G, Durrens P, Casaregola S, LafontaineI, De Montigny J, Marck C, Neuveglise C, Talla E, Goffard N, FrangeulL, Aigle M, Anthouard V, Babour A, Barbe V, Barnay S, Blanchin S,Beckerich JM, Beyne E, Bleykasten C, Boisrame A, Boyer J, CattolicoL, Confanioleri F, De Daruvar A, Despons L, Fabre E, Fairhead C,Ferry-Dumazet H, Groppi A, Hantraye F, Hennequin C, Jauniaux N,Joyet P, Kachouri R, Kerrest A, Koszul R, Lemaire M, Lesur I, Ma L,Muller H, Nicaud JM, Nikolski M, Oztas S, Ozier-Kalogeropoulos O,Pellenz S, Potier S, Richard GF, Straub ML, Suleau A, Swennen D,Tekaia F, Wesolowski-Louvel M, Westhof E, Wirth B, Zeniou-MeyerM, Zivanovic I, Bolotin-Fukuhara M, Thierry A, Bouchier C, CaudronB, Scarpelli C, Gaillardin C, Weissenbach J, Wincker P, Souciet JL:Genome evolution in yeasts. Nature 2004, 430:35-44.
4. Nierman WC, Pain A, Anderson MJ, Wortman JR, Kim HS, Arroyo J,Berriman M, Abe K, Archer DB, Bermejo C, Bennett J, Bowyer P,Chen D, Collins M, Coulsen R, Davies R, Dyer PS, Farman M, Fedor-
Additional file 1Figure 4 as table. An excel version of Figure 4. First sheet contains column title explanations, second sheet the numbers for Figure 4 with cluster iden-tifiers, InterPro structures and Protfun assignments. Last sheet contains Funcat annotations for the clusters in Figure 4.Click here for file[http://www.biomedcentral.com/content/supplementary/1471-2164-8-325-S1.xls]
Additional file 2Figure 9 as table. An excel version of Figure 9. First sheet contains column title explanations, second sheet the numbers for Figure 9 with InterPro identifiers, InterPro names and "Author assingments".Click here for file[http://www.biomedcentral.com/content/supplementary/1471-2164-8-325-S2.xls]
Additional file 3Sequence identifier to species mappings. A text file with species for each protein sequence identifier. First column contains the ORF identifier as provided by the sequencing centre and second column the species.Click here for file[http://www.biomedcentral.com/content/supplementary/1471-2164-8-325-S3.zip]
Additional file 4Sequence indentifier to InterPro identifier mappings. A text file with the Interpro entry identifiers found in each protein sequence. First column contains the ORF identifier as provided by the sequencing centre and sec-ond column the identifier for InterPro domain found in the ORF.Click here for file[http://www.biomedcentral.com/content/supplementary/1471-2164-8-325-S4.zip]
Additional file 5Sequence indentifier to ProtFun category mappings. A text file with the Protfun categories found for each protein sequence. First column contains the ORF identifier as provided by the sequencing centre and following col-umns the ProtFun categories found for the ORF.Click here for file[http://www.biomedcentral.com/content/supplementary/1471-2164-8-325-S5.zip]
Additional file 6Sequence indentifier to cluster identifier mappings. A text file with clusters and their members. First column contains the ORF identifier as provided by the sequencing centre and second column the respective protein cluster.Click here for file[http://www.biomedcentral.com/content/supplementary/1471-2164-8-325-S6.zip]
Page 21 of 23(page number not for citation purposes)
BMC Genomics 2007, 8:325 http://www.biomedcentral.com/1471-2164/8/325
ova N, Fedorova N, Feldblyum TV, Fischer R, Fosker N, Fraser A,Garcia JL, Garcia MJ, Goble A, Goldman GH, Gomi K, Griffith-JonesS, Gwilliam R, Haas B, Haas H, Harris D, Horiuchi H, Huang J, Hum-phray S, Jimenez J, Keller N, Khouri H, Kitamoto K, Kobayashi T,Konzack S, Kulkarni R, Kumagai T, Lafon A, Latge JP, Li W, Lord A,Lu C, Majoros WH, May GS, Miller BL, Mohamoud Y, Molina M,Monod M, Mouyna I, Mulligan S, Murphy L, O'Neil S, Paulsen I, PenalvaMA, Pertea M, Price C, Pritchard BL, Quail MA, Rabbinowitsch E,Rawlins N, Rajandream MA, Reichard U, Renauld H, Robson GD,Rodriguez de Cordoba S, Rodriguez-Pena JM, Ronning CM, Rutter S,Salzberg SL, Sanchez M, Sanchez-Ferrero JC, Saunders D, Seeger K,Squares R, Squares S, Takeuchi M, Tekaia F, Turner G, Vazquez deAldana CR, Weidman J, White O, Woodward J, Yu JH, Fraser C,Galagan JE, Asai K, Machida M, Hall N, Barrell B, Denning DW:Genomic sequence of the pathogenic and allergenic filamen-tous fungus Aspergillus fumigatus. Nature 2005, 438:1151-1156.
5. Machida M, Asai K, Sano M, Tanaka T, Kumagai T, Terai G, KusumotoK, Arima T, Akita O, Kashiwagi Y, Abe K, Gomi K, Horiuchi H, Kita-moto K, Kobayashi T, Takeuchi M, Denning DW, Galagan JE, NiermanWC, Yu J, Archer DB, Bennett JW, Bhatnagar D, Cleveland TE,Fedorova ND, Gotoh O, Horikawa H, Hosoyama A, Ichinomiya M,Igarashi R, Iwashita K, Juvvadi PR, Kato M, Kato Y, Kin T, Kokubun A,Maeda H, Maeyama N, Maruyama J, Nagasaki H, Nakajima T, Oda K,Okada K, Paulsen I, Sakamoto K, Sawano T, Takahashi M, Takase K,Terabayashi Y, Wortman JR, Yamada O, Yamagata Y, Anazawa H,Hata Y, Koide Y, Komori T, Koyama Y, Minetoki T, Suharnan S, Tan-aka A, Isono K, Kuhara S, Ogasawara N, Kikuchi H: Genomesequencing and analysis of Aspergillus oryzae. Nature 2005,438:1157-1161.
6. Galagan JE, Calvo SE, Cuomo C, Ma LJ, Wortman JR, Batzoglou S, LeeSI, Basturkmen M, Spevak CC, Clutterbuck J, Kapitonov V, Jurka J,Scazzocchio C, Farman M, Butler J, Purcell S, Harris S, Braus GH,Draht O, Busch S, D'Enfert C, Bouchier C, Goldman GH, Bell-Peder-sen D, Griffiths-Jones S, Doonan JH, Yu J, Vienken K, Pain A, FreitagM, Selker EU, Archer DB, Penalva MA, Oakley BR, Momany M, Tan-aka T, Kumagai T, Asai K, Machida M, Nierman WC, Denning DW,Caddick M, Hynes M, Paoletti M, Fischer R, Miller B, Dyer P, Sachs MS,Osmani SA, Birren BW: Sequencing of Aspergillus nidulans andcomparative analysis with A. fumigatus and A. oryzae. Nature2005, 438:1105-1115.
7. Galagan JE, Calvo SE, Borkovich KA, Selker EU, Read ND, Jaffe D, Fit-zHugh W, Ma LJ, Smirnov S, Purcell S, Rehman B, Elkins T, Engels R,Wang S, Nielsen CB, Butler J, Endrizzi M, Qui D, Ianakiev P, Bell-Ped-ersen D, Nelson MA, Werner-Washburne M, Selitrennikoff CP, Kin-sey JA, Braun EL, Zelter A, Schulte U, Kothe GO, Jedd G, Mewes W,Staben C, Marcotte E, Greenberg D, Roy A, Foley K, Naylor J, Stange-Thomann N, Barrett R, Gnerre S, Kamal M, Kamvysselis M, MauceliE, Bielke C, Rudd S, Frishman D, Krystofova S, Rasmussen C, Metzen-berg RL, Perkins DD, Kroken S, Cogoni C, Macino G, Catcheside D,Li W, Pratt RJ, Osmani SA, DeSouza CP, Glass L, Orbach MJ, BerglundJA, Voelker R, Yarden O, Plamann M, Seiler S, Dunlap J, Radford A,Aramayo R, Natvig DO, Alex LA, Mannhaupt G, Ebbole DJ, Freitag M,Paulsen I, Sachs MS, Lander ES, Nusbaum C, Birren B: The genomesequence of the filamentous fungus Neurospora crassa. Nature2003, 422:859-868.
8. Galagan JE, Selker EU: RIP: The evolutionary cost of genomedefense. Trends Genet 2004, 20:417-423.
9. Birney E, Andrews D, Caccamo M, Chen Y, Clarke L, Coates G, CoxT, Cunningham F, Curwen V, Cutts T, Down T, Durbin R, Fernandez-Suarez XM, Flicek P, Graf S, Hammond M, Herrero J, Howe K, Iyer V,Jekosch K, Kahari A, Kasprzyk A, Keefe D, Kokocinski F, Kulesha E,London D, Longden I, Melsopp C, Meidl P, Overduin B, Parker A,Proctor G, Prlic A, Rae M, Rios D, Redmond S, Schuster M, Sealy I,Searle S, Severin J, Slater G, Smedley D, Smith J, Stabenau A, StalkerJ, Trevanion S, Ureta-Vidal A, Vogel J, White S, Woodwark C, Hub-bard TJ: Ensembl 2006. Nucleic Acids Res 2006, 34:D556-61.
10. Mewes HW, Amid C, Arnold R, Frishman D, Guldener U, MannhauptG, Munsterkotter M, Pagel P, Strack N, Stumpflen V, Warfsmann J,Ruepp A: MIPS: Analysis and annotation of proteins fromwhole genomes. Nucleic Acids Res 2004:D41-4.
11. Pedersen AG, Jensen LJ, Brunak S, Staerfeldt HH, Ussery DW: ADNA structural atlas for escherichia coli. J Mol Biol 2000,299:907-930.
12. E-fungi [http://www.e-fungi.org.uk/index.html]13. Stein LD, Mungall C, Shu S, Caudy M, Mangone M, Day A, Nickerson
E, Stajich JE, Harris TW, Arva A, Lewis S: The generic genome
browser: A building block for a model organism system data-base. Genome Res 2002, 12:1599-1610.
14. Stajich JE, Block D, Boulez K, Brenner SE, Chervitz SA, Dagdigian C,Fuellen G, Gilbert JG, Korf I, Lapp H, Lehvaslaiho H, Matsalla C, Mun-gall CJ, Osborne BI, Pocock MR, Schattner P, Senger M, Stein LD,Stupka E, Wilkinson MD, Birney E: The bioperl toolkit: Perl mod-ules for the life sciences. Genome Res 2002, 12:1611-1618.
15. Enright AJ, Van Dongen S, Ouzounis CA: An efficient algorithmfor large-scale detection of protein families. Nucleic Acids Res2002, 30:1575-1584.
16. Quevillon E, Silventoinen V, Pillai S, Harte N, Mulder N, Apweiler R,Lopez R: InterProScan: Protein domains identifier. NucleicAcids Res 2005, 33:W116-20.
17. Ruepp A, Zollner A, Maier D, Albermann K, Hani J, Mokrejs M, TetkoI, Guldener U, Mannhaupt G, Munsterkotter M, Mewes HW: TheFunCat, a functional annotation scheme for systematic clas-sification of proteins from whole genomes. Nucleic Acids Res2004, 32:5539-5545.
18. Guldener U, Munsterkotter M, Kastenmuller G, Strack N, van HeldenJ, Lemer C, Richelles J, Wodak SJ, Garcia-Martinez J, Perez-Ortin JE,Michael H, Kaps A, Talla E, Dujon B, Andre B, Souciet JL, De MontignyJ, Bon E, Gaillardin C, Mewes HW: CYGD: The comprehensiveyeast genome database. Nucleic Acids Res 2005, 33:D364-8.
19. Guldener U, Mannhaupt G, Munsterkotter M, Haase D, OesterheldM, Stumpflen V, Mewes HW, Adam G: FGDB: A comprehensivefungal genome resource on the plant pathogen fusariumgraminearum. Nucleic Acids Res 2006, 34:D456-8.
20. Jensen LJ, Ussery DW, Brunak S: Functionality of system compo-nents: Conservation of protein function in protein featurespace. Genome Res 2003, 13:2444-2449.
21. Altschul SF, Gish W, Miller W, Myers EW, Lipman DJ: Basic localalignment search tool. J Mol Biol 1990, 215:403-410.
22. Veeramachaneni V, Makalowski W: Visualizing sequence similar-ity of protein families. Genome Res 2004, 14:1160-1169.
23. Zdobnov EM, Apweiler R: InterProScan–an integration plat-form for the signature-recognition methods in InterPro. Bio-informatics 2001, 17:847-848.
24. Cliften P, Sudarsanam P, Desikan A, Fulton L, Fulton B, Majors J,Waterston R, Cohen BA, Johnston M: Finding functional featuresin Saccharomyces genomes by phylogenetic footprinting. Sci-ence 2003, 301:71-76.
25. S. cerevisiae iMH805/775 [http://gcrg.ucsd.edu/organisms/yeast.html]
26. Yu J, Chang PK, Ehrlich KC, Cary JW, Bhatnagar D, Cleveland TE,Payne GA, Linz JE, Woloshuk CP, Bennett JW: Clustered pathwaygenes in aflatoxin biosynthesis. Appl Environ Microbiol 2004,70:1253-1262.
27. Kanehisa M, Goto S: KEGG: Kyoto encyclopedia of genes andgenomes. Nucleic Acids Res 2000, 28:27-30.
28. Saccharomyces genome database [http://www.yeastgenome.org/]
29. Reinders J, Zahedi RP, Pfanner N, Meisinger C, Sickmann A: Towardthe complete yeast mitochondrial proteome: Multidimen-sional separation techniques for mitochondrial proteomics.J Proteome Res 2006, 5:1543-1554.
30. Ito T, Chiba T, Ozawa R, Yoshida M, Hattori M, Sakaki Y: A compre-hensive two-hybrid analysis to explore the yeast proteininteractome. Proc Natl Acad Sci USA 2001, 98:4569-4574.
31. Losson R, Lacroute F: Cloning of a eukaryotic regulatory gene.Mol Gen Genet 1981, 184:394-399.
32. Hashimoto H, Kikuchi Y, Nogi Y, Fukasawa T: Regulation ofexpression of the galactose gene cluster in Saccharomycescerevisiae. isolation and characterization of the regulatorygene GAL4. Mol Gen Genet 1983, 191:31-38.
33. van Peij NN, Visser J, de Graaff LH: Isolation and analysis of xlnR,encoding a transcriptional activator co-ordinating xylano-lytic expression in Aspergillus niger. Mol Microbiol 1998,27:131-142.
34. Woloshuk CP, Foutz KR, Brewer JF, Bhatnagar D, Cleveland TE,Payne GA: Molecular characterization of aflR, a regulatorylocus for aflatoxin biosynthesis. Appl Environ Microbiol 1994,60:2408-2414.
35. Montiel MD, Lee HA, Archer DB: Evidence of RIP (repeat-induced point mutation) in transposase sequences ofAspergillus oryzae. Fungal Genet Biol 2006, 43:439-445.
Page 22 of 23(page number not for citation purposes)

BMC Genomics 2007, 8:325 http://www.biomedcentral.com/1471-2164/8/325
36. Dean RA, Talbot NJ, Ebbole DJ, Farman ML, Mitchell TK, Orbach MJ,Thon M, Kulkarni R, Xu JR, Pan H, Read ND, Lee YH, Carbone I,Brown D, Oh YY, Donofrio N, Jeong JS, Soanes DM, Djonovic S,Kolomiets E, Rehmeyer C, Li W, Harding M, Kim S, Lebrun MH,Bohnert H, Coughlan S, Butler J, Calvo S, Ma LJ, Nicol R, Purcell S,Nusbaum C, Galagan JE, Birren BW: The genome sequence of therice blast fungus Magnaporthe grisea. Nature 2005, 434:980-986.
37. Coutinho PM, Henrissat B: Carbohydrate-active enzymes: Anintegrated database approach. In Recent Advances in CarbohydrateBioengineering Edited by: Gilbert HJ, Davies G, Henrissat B, SvenssonB. Cambridge: The Royal Society of Chemistry; 1999:3-12.
38. Maggio-Hall LA, Keller NP: Mitochondrial beta-oxidation inAspergillus nidulans. Mol Microbiol 2004, 54:1173-1185.
39. Kunau WH, Buhne S, de la Garza M, Kionka C, Mateblowski M,Schultz-Borchard U, Thieringer R: Comparative enzymology ofbeta-oxidation. Biochem Soc Trans 1988, 16:418-420.
40. Hiltunen JK, Wenzel B, Beyer A, Erdmann R, Fossa A, Kunau WH:Peroxisomal multifunctional beta-oxidation protein of Sac-charomyces cerevisiae. molecular analysis of the fox2 geneand gene product. J Biol Chem 1992, 267:6646-6653.
41. Kurihara T, Ueda M, Okada H, Kamasawa N, Naito N, Osumi M, Tan-aka A: Beta-oxidation of butyrate, the short-chain-lengthfatty acid, occurs in peroxisomes in the yeast Candida tropi-calis. J Biochem (Tokyo) 1992, 111:783-787.
42. Smith JJ, Brown TW, Eitzen GA, Rachubinski RA: Regulation of per-oxisome size and number by fatty acid beta -oxidation in theyeast Yarrowia lipolytica. J Biol Chem 2000, 275:20168-20178.
43. Rehmeyer C, Li W, Kusaba M, Kim YS, Brown D, Staben C, Dean R,Farman M: Organization of chromosome ends in the rice blastfungus, Magnaporthe oryzae. Nucleic Acids Res 2006,34:4685-4701.
44. Freitas-Junior LH, Bottius E, Pirrit LA, Deitsch KW, Scheidig C, Gui-net F, Nehrbass U, Wellems TE, Scherf A: Frequent ectopicrecombination of virulence factor genes in telomeric chro-mosome clusters of P. falciparum. Nature 2000, 407:1018-1022.
45. Naumov GI, Naumova ES, Sancho ED, Korhola MP: Polymeric SUCgenes in natural populations of Saccharomyces cerevisiae.FEMS Microbiol Lett 1996, 135:31-35.
46. Gardiner DM, Waring P, Howlett BJ: The epipolythiodioxopiper-azine (ETP) class of fungal toxins: Distribution, mode ofaction, functions and biosynthesis. Microbiology 2005,151:1021-1032.
47. Alexander NJ, McCormick SP, Hohn TM: TRI12, a trichotheceneefflux pump from Fusarium sporotrichioides : Gene isolationand expression in yeast. Mol Gen Genet 1999, 261:977-984.
48. Wheeler DL, Chappey C, Lash AE, Leipe DD, Madden TL, SchulerGD, Tatusova TA, Rapp BA: Database resources of the nationalcenter for biotechnology information. Nucleic Acids Res 2000,28:10-14.
49. Gentleman RC, Carey VJ, Bates DM, Bolstad B, Dettling M, Dudoit S,Ellis B, Gautier L, Ge Y, Gentry J, Hornik K, Hothorn T, Huber W,Iacus S, Irizarry R, Leisch F, Li C, Maechler M, Rossini AJ, Sawitzki G,Smith C, Smyth G, Tierney L, Yang JY, Zhang J: Bioconductor:Open software development for computational biology andbioinformatics. Genome Biol 2004, 5:R80.
50. Wood V, Gwilliam R, Rajandream MA, Lyne M, Lyne R, Stewart A,Sgouros J, Peat N, Hayles J, Baker S, Basham D, Bowman S, Brooks K,Brown D, Brown S, Chillingworth T, Churcher C, Collins M, ConnorR, Cronin A, Davis P, Feltwell T, Fraser A, Gentles S, Goble A, HamlinN, Harris D, Hidalgo J, Hodgson G, Holroyd S, Hornsby T, HowarthS, Huckle EJ, Hunt S, Jagels K, James K, Jones L, Jones M, Leather S,McDonald S, McLean J, Mooney P, Moule S, Mungall K, Murphy L, Nib-lett D, Odell C, Oliver K, O'Neil S, Pearson D, Quail MA, Rabbinow-itsch E, Rutherford K, Rutter S, Saunders D, Seeger K, Sharp S,Skelton J, Simmonds M, Squares R, Squares S, Stevens K, Taylor K,Taylor RG, Tivey A, Walsh S, Warren T, Whitehead S, Woodward J,Volckaert G, Aert R, Robben J, Grymonprez B, Weltjens I, VanstreelsE, Rieger M, Schafer M, Muller-Auer S, Gabel C, Fuchs M, DusterhoftA, Fritzc C, Holzer E, Moestl D, Hilbert H, Borzym K, Langer I, BeckA, Lehrach H, Reinhardt R, Pohl TM, Eger P, Zimmermann W,Wedler H, Wambutt R, Purnelle B, Goffeau A, Cadieu E, Dreano S,Gloux S, et al.: The genome sequence of Schizosaccharomycespombe. Nature 2002, 415:871-880.
51. Dietrich FS, Voegeli S, Brachat S, Lerch A, Gates K, Steiner S, MohrC, Pohlmann R, Luedi P, Choi S, Wing RA, Flavier A, Gaffney TD,Philippsen P: The Ashbya gossypii genome as a tool for mapping
the ancient Saccharomyces cerevisiae genome. Science 2004,304:304-307.
52. Jones T, Federspiel NA, Chibana H, Dungan J, Kalman S, Magee BB,Newport G, Thorstenson YR, Agabian N, Magee PT, Davis RW,Scherer S: The diploid genome sequence of Candida albicans.Proc Natl Acad Sci USA 2004, 101:7329-7334.
53. Cliften P, Sudarsanam P, Desikan A, Fulton L, Fulton B, Majors J,Waterston R, Cohen BA, Johnston M: Finding functional featuresin Saccharomyces genomes by phylogenetic footprinting. Sci-ence 2003, 301:71-76.
54. Goffeau A, Barrell BG, Bussey H, Davis RW, Dujon B, Feldmann H,Galibert F, Hoheisel JD, Jacq C, Johnston M, Louis EJ, Mewes HW,Murakami Y, Philippsen P, Tettelin H, Oliver SG: Life with 6000genes. Science 1996, 274:563-7.
55. Martinez D, Larrondo LF, Putnam N, Gelpke MD, Huang K, ChapmanJ, Helfenbein KG, Ramaiya P, Detter JC, Larimer F, Coutinho PM,Henrissat B, Berka R, Cullen D, Rokhsar D: Genome sequence ofthe lignocellulose degrading fungus Phanerochaete chrysospo-rium strain RP78. Nat Biotechnol 2004, 22:695-700.
56. Kamper J, Kahmann R, Bolker M, Ma LJ, Brefort T, Saville BJ, BanuettF, Kronstad JW, Gold SE, Muller O, Perlin MH, Wosten HA, de VriesR, Ruiz-Herrera J, Reynaga-Pena CG, Snetselaar K, McCann M, Perez-Martin J, Feldbrugge M, Basse CW, Steinberg G, Ibeas JI, Holloman W,Guzman P, Farman M, Stajich JE, Sentandreu R, Gonzalez-Prieto JM,Kennell JC, Molina L, Schirawski J, Mendoza-Mendoza A, Greilinger D,Munch K, Rossel N, Scherer M, Vranes M, Ladendorf O, Vincon V,Fuchs U, Sandrock B, Meng S, Ho EC, Cahill MJ, Boyce KJ, Klose J,Klosterman SJ, Deelstra HJ, Ortiz-Castellanos L, Li W, Sanchez-Alonso P, Schreier PH, Hauser-Hahn I, Vaupel M, Koopmann E, Frie-drich G, Voss H, Schluter T, Margolis J, Platt D, Swimmer C, GnirkeA, Chen F, Vysotskaia V, Mannhaupt G, Guldener U, MunsterkotterM, Haase D, Oesterheld M, Mewes HW, Mauceli EW, DeCaprio D,Wade CM, Butler J, Young S, Jaffe DB, Calvo S, Nusbaum C, GalaganJ, Birren BW: Insights from the genome of the biotrophic fun-gal plant pathogen Ustilago maydis. Nature 2006, 444:97-101.
57. Overbeek R, Larsen N, Walunas T, D'Souza M, Pusch G, Selkov E Jr,Liolios K, Joukov V, Kaznadzey D, Anderson I, Bhattacharyya A, BurdH, Gardner W, Hanke P, Kapatral V, Mikhailova N, Vasieva O, Oster-man A, Vonstein V, Fonstein M, Ivanova N, Kyrpides N: The ERGOgenome analysis and discovery system. Nucleic Acids Res 2003,31:164-171.
58. Mewes HW, Albermann K, Heumann K, Liebl S, Pfeiffer F: MIPS: Adatabase for protein sequences, homology data and yeastgenome information. Nucleic Acids Res 1997, 25:28-30.
59. Mulder NJ, Apweiler R, Attwood TK, Bairoch A, Bateman A, Binns D,Bradley P, Bork P, Bucher P, Cerutti L, Copley R, Courcelle E, Das U,Durbin R, Fleischmann W, Gough J, Haft D, Harte N, Hulo N, KahnD, Kanapin A, Krestyaninova M, Lonsdale D, Lopez R, Letunic I, Mad-era M, Maslen J, McDowall J, Mitchell A, Nikolskaya AN, Orchard S,Pagni M, Ponting CP, Quevillon E, Selengut J, Sigrist CJ, SilventoinenV, Studholme DJ, Vaughan R, Wu CH: InterPro, progress and sta-tus in 2005. Nucleic Acids Res 2005, 33:D201-5.
60. Jensen LJ, Gupta R, Staerfeldt HH, Brunak S: Prediction of humanprotein function according to gene ontology categories. Bio-informatics 2003, 19:635-642.
61. Mannhaupt G, Montrone C, Haase D, Mewes HW, Aign V, HoheiselJD, Fartmann B, Nyakatura G, Kempken F, Maier J, Schulte U: What'sin the genome of a filamentous fungus? analysis of the Neu-rospora genome sequence. Nucleic Acids Res 2003, 31:1944-1954.
62. Keller NP, Hohn TM: Metabolic pathway gene clusters in fila-mentous fungi. Fungal Genet Biol 1997, 21:17-29.
Page 23 of 23(page number not for citation purposes)