comparison of an electron transport system (ets) enzyme
TRANSCRIPT
Lawrence UniversityLux
Lawrence University Honors Projects
5-29-2019
Comparison of an Electron Transport System(ETS) enzyme-mediated reduction assay andrespiration rate of the invasive copepod Eurytemoracarolleeae in Green Bay, WI, USAAlexander TimpeLawrence University
Follow this and additional works at: https://lux.lawrence.edu/luhp
Part of the Integrative Biology Commons, and the Other Ecology and Evolutionary BiologyCommons© Copyright is owned by the author of this document.
This Honors Project is brought to you for free and open access by Lux. It has been accepted for inclusion in Lawrence University Honors Projects by anauthorized administrator of Lux. For more information, please contact [email protected].
Recommended CitationTimpe, Alexander, "Comparison of an Electron Transport System (ETS) enzyme-mediated reduction assay and respiration rate of theinvasive copepod Eurytemora carolleeae in Green Bay, WI, USA" (2019). Lawrence University Honors Projects. 145.https://lux.lawrence.edu/luhp/145
Comparison of an Electron Transport System (ETS) enzyme-mediated reduction
assay and respiration rate of the invasive copepod Eurytemora carolleeae in
Green Bay, WI, USA
By Alexander W. Timpe
May 2019
A Thesis Submitted in Candidacy for Honors at Graduation
ii
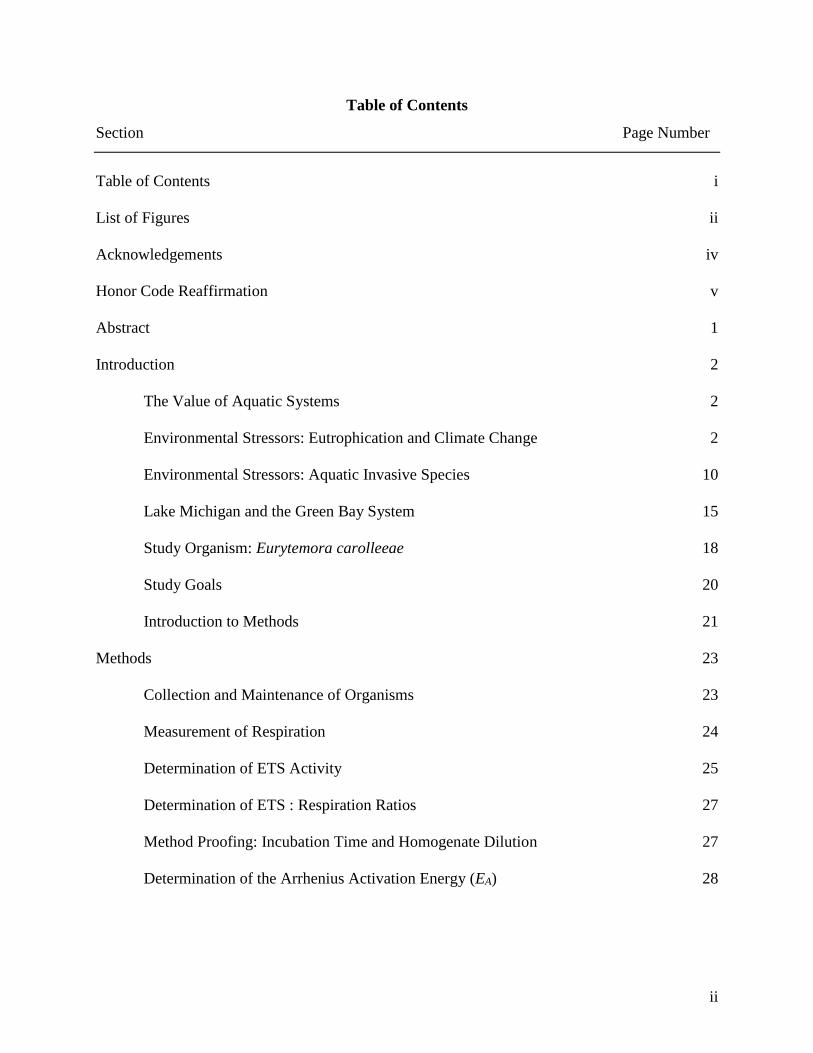
Table of Contents
Section Page Number
Table of Contents
List of Figures
Acknowledgements
Honor Code Reaffirmation
Abstract
Introduction
The Value of Aquatic Systems
Environmental Stressors: Eutrophication and Climate Change
Environmental Stressors: Aquatic Invasive Species
Lake Michigan and the Green Bay System
Study Organism: Eurytemora carolleeae
Study Goals
Introduction to Methods
Methods
Collection and Maintenance of Organisms
Measurement of Respiration
Determination of ETS Activity
Determination of ETS : Respiration Ratios
Method Proofing: Incubation Time and Homogenate Dilution
Determination of the Arrhenius Activation Energy (EA)
i
ii
iv
v
1
2
2
2
10
15
18
20
21
23
23
24
25
27
27
28
iii
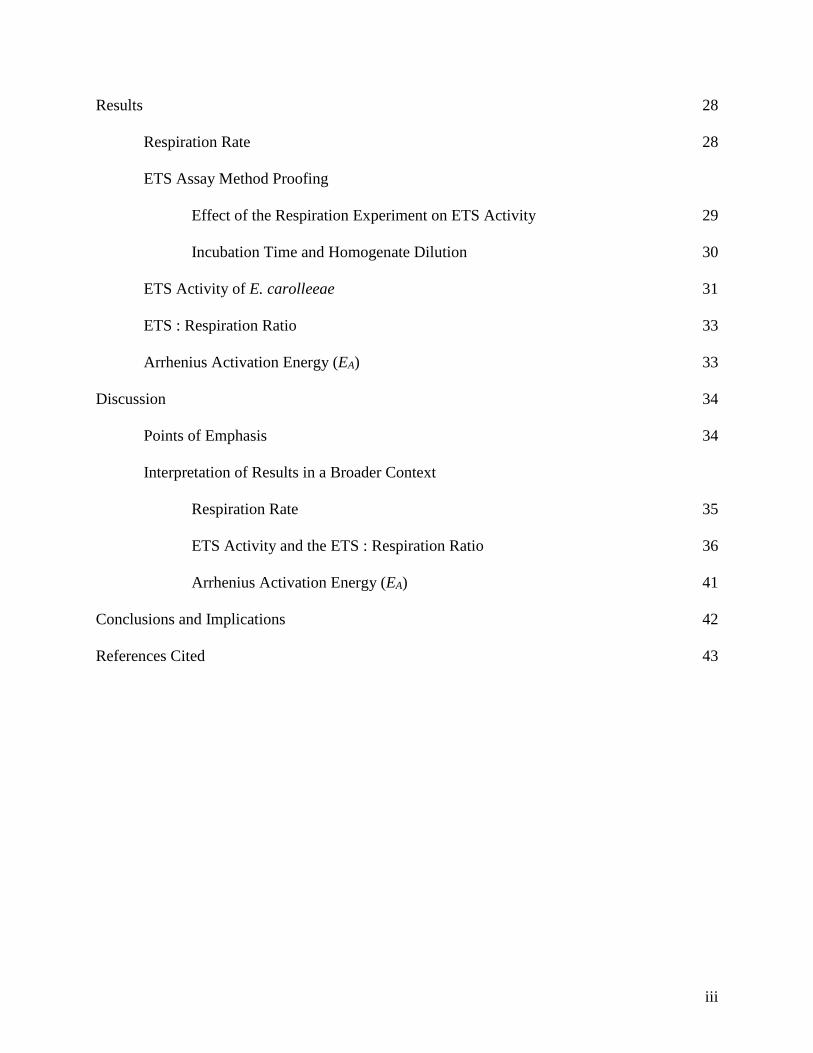
Results
Respiration Rate
ETS Assay Method Proofing
Effect of the Respiration Experiment on ETS Activity
Incubation Time and Homogenate Dilution
ETS Activity of E. carolleeae
ETS : Respiration Ratio
Arrhenius Activation Energy (EA)
Discussion
Points of Emphasis
Interpretation of Results in a Broader Context
Respiration Rate
ETS Activity and the ETS : Respiration Ratio
Arrhenius Activation Energy (EA)
Conclusions and Implications
References Cited
28
28
29
30
31
33
33
34
34
35
36
41
42
43
iv
List of Figures
Figure Description Page Number
Fig. 1 Respiration Rate of E. carolleeae and S. oregonensis
Fig. 2 Effect of the Respiration Experiments on ETS Activity
Fig. 3 Corrected Optical Density (COD) Over Incubation Time
Fig. 4 Calculated ETS Over Incubation Time
Fig. 5 Calculated ETS Activity for E. carolleeae
Fig. 6 ETS : Respiration Ratio for E. carolleeae
Fig. 7 Arrhenius Plot for E. carolleeae metabolic enzymes
29
30
31
32
32
33
34
v
Acknowledgements
I would first and foremost like to thank my academic and summer research advisor Bart
De Stasio. He has been an invaluable mentor and has provided me with incredible opportunities
to do research and has pushed me to be the best scientist that I can be. I would also like to
acknowledge my lab partner Sydney De Mets who spent many hours on the microscope sorting
plankton and driving back and forth to Little Sturgeon Bay to sample. I would also like to thank
Wayne Kreuger and JoAnn Stamm for their assistance with experimental materials. I would
finally like to thank Molly Doruska and Bart De Stasio for their comments on earlier drafts of
this manuscript.

vi
I hereby reaffirm the Lawrence University Honor Code
1
Abstract
The use of aquatic resources for agriculture, trade, and recreation adds stress to water-
dwelling organisms. Rapid changes in abiotic conditions, such as warming due to climate change
and nutrient loading from agricultural runoff and urban areas, threaten to induce profound
alterations to aquatic environments. These changes affect interspecific community interactions
and may cause an aquatic resource to lose its functionality that is valuable to humans. Studying
organisms such as plankton that form an ecosystem’s foundation is an important step towards
understanding the entire food web and predicting how it may or may not be able to respond to a
changing environment. One important planktonic species in the Laurentian Great Lakes is the
invasive calanoid copepod Eurytemora carolleeae (formerly considered part of the Eurytemora
affinis species complex). This study analyzes the metabolic activity of E. carolleeae in Little
Sturgeon Bay, WI, USA using two different methods, over a range of temperatures from 9º to
26ºC. Total oxygen consumption was measured directly using a micropulse oxygen probe, and
the activity of aerobic metabolic enzymes in the electron transport system (ETS) was quantified
using the in vitro reduction of iodonitrotetrazolium chloride (INT). We find that the respiration
rate of E. carolleeae increases linearly from 9º to 26ºC. We also find that the copepod’s
metabolic enzymes have an Arrhenius activation energy of 11.1 ± 3.7 kJ/mole and experience a
thermal maximum between 22º and 26ºC. This thermal limit has implications for the future
success of this species, as the combination of warmer temperatures and the disappearance of
oxygenated colder-water refuges may limit E. carolleeae’s success in the Green Bay system.
2
Introduction
The Value of Aquatic Systems
The use of aquatic resources for agriculture, trade, and recreation adds stress to water-
dwelling organisms. Rapid changes in abiotic conditions, such as warming due to climate change
and nutrient loading from agricultural runoff and urban areas, threaten to induce profound
alterations to aquatic environments. These changes affect interspecific community interactions
and may cause an aquatic resource to lose its functionality that is valuable to humans. Studying
organisms such as plankton that form an ecosystem’s foundation is an important step towards
understanding the entire food web and predicting how it may or may not be able to respond to a
changing environment. One important planktonic species in the Laurentian Great Lakes is the
invasive zooplankton Eurytemora carolleeae (formerly considered part of the Eurytemora affinis
species complex). My study of this calanoid copepod’s metabolic activity in Little Sturgeon Bay,
WI, USA, analyzes the organism’s response to some of these anthropogenic perturbations –
particularly the consequences of nutrient loading and climate change – as a model system to
illustrate how similar organisms may or may not be able to respond to a rapidly changing
environment.
Environmental Stressors: Eutrophication and Climate Change
Eutrophication, or the increased productivity and simplification of biotic communities as
a result of nutrient loading, is one of the most common and well-documented effects that humans
have on aquatic environments (Wetzel, 2001 and Carlson, 1977). Although lentic systems (still,
fresh water such as lakes) undergo a natural process of eutrophication as the community matures,
increased rates of change in most areas are the direct result of the addition of byproducts from
3
human industrial and agricultural practices into aquatic systems. Phosphorous- and nitrogen-rich
waste from manufacturing, wastewater treatment, agriculture, and urban areas, act as fertilizer
for primary producers such as phytoplankton (free-floating microscopic plants and bacteria) and
macrophytes (macroscopic, usually rooted aquatic plants). This fertilization increases the
productivity (amount of atmospheric carbon fixed into sugars per area or volume) of the
photosynthesizing community, which in turn increases the potential food availability for
organisms that occupy higher trophic levels. However, despite the fact that there may be more
reduced organic carbon available for heterotroph consumption, eutrophied areas are
characterized by a reduction in the diversity and overall complexity of the aquatic communities
at every level, starting at phytoplankton and then propagating into higher trophic levels.
The dominant effect of eutrophication on phytoplankton communities is a shift in
community structure. All other factors being equal, in low-nutrient, or “oligotrophic”
environments, there is a much greater diversity of phytoplankton phyla. Watson et. al. (1997)
found that when the amount of phosphorous is low, there is a near equal distribution in plankton
biomass between six major phylogenetic groups: green algae (Chlorophyta), blue-green algae
(cyanobacteria), diatoms (Bacillariophyceae), golden algae (Chrysophyceae), Dinophyta
(dinoflagellates), and Cryptophyta (a polyphyletic group that employ multiple methods of
gaining energy, collectively known as cryptophytes). However, when phosphorous
concentrations increase (also known as “phosphorous loading”), the community becomes
dominated by blue-green cyanobacteria.
This shift can be explained in part by an important theoretical framework in plant ecology
known as Liebig’s Law of the Minimum, which postulates that the growth rate of plants and
algae is determined by the scarcest resource relative to need. Because the ratio of major nutrients
4
in algae (also known as the Redfield ratio: somatic carbon:nitrogen:phosphorus (C:N:P) =
106:16:1) does not change appreciably due to environmental conditions, it is the ratio of those
important nutrients that matters as well as their absolute abundance. Phosphorous is typically the
limiting nutrient in freshwater systems because, unlike C or N, it does not have a volatile or
gaseous phase that allow is to be replenished from the atmosphere into terrestrial or non-marine
aquatic systems. Therefore, the only appreciable natural source of P is the erosion of bedrock on
geological timescales (Schindler et. al., 1974). When anthropogenic phosphorous loading does
occur the N:P ratio typically decreases, and the phytoplankton community is released from
phosphorous limitation, with nitrogen becoming the limiting nutrient.
To cope with low-nitrogen environments, many species of cyanobacteria have specialized
cells called heterocysts that can fix nitrogen from its gaseous form (NN) to ammonium (NH4+).
Ammonium is known as a “bioavailable compound,” meaning it can be directly metabolized and
incorporated into nitrogen-rich macromolecules such as DNA or the amino acids that make up
proteins. Since those cyanobacteria can avoid being nitrogen-limited by producing their own,
they can out-compete other types of phytoplankton and become the dominant type.
This change in phytoplankton structure is critically important to most heterotrophic
planktonic organisms (collectively known as zooplankton). Many common cyanobacteria,
including species in the phyla Dolichospermum (formerly classified as Anabaena), Nodularia
and Microcystis, can create a variety of toxins that can be incredibly harmful to animals. They
also typically display a variety of anti-predator morphologies, such as colonial forms or mucus
sheaths, that make them harder to ingest. For an herbivorous zooplankton, this has two major
implications. First, the food that is available takes more energy to consume and second, unless
the organism has developed an immunity to the cyanotoxins, much if not all of the energy that
5
may be gained by eating the cyanobacteria is immediately expended in the metabolism of the
toxins or the repair of damaged cells. This affects the zooplankton community by selecting for
only those species that can avoid consuming the cyanobacteria (which excludes many passive
filter feeders) or that are not affected by the cyanobacteria’s defenses. Eurytemora is an example
of such an organism.
Copepods such as Eurytemora are more selective in their prey choice and are able to
better manipulate prey that they capture as compared to common filter feeders such as the water
flea Daphnia. The long filamentous chains of Dolichospermum and Nodularia physically
interfere with the feeding structures of Daphnia, and therefore the animal has to expend much
more energy mechanically cleaning its feeding combs and rejecting those prey items that it
cannot ingest. Copepods, on the other hand, are much more dexterous, selective feeders that can
manipulate the strands such that they become much more economical (i.e. less energy intensive)
to consume. Additionally, when comparing the response of Eurytemora and Daphnia to the
toxins produced by these cyanobacteria, it has been observed that the copepod is not nearly as
affected. Lampert (1985) found that Daphnia mortality rate increased when a population was fed
the toxic cyanobacteria Microcystis as compared to a control group that was starved, indicating
that the zooplankton would be “better off” not eating the food source as opposed to poisoning
itself while consuming food. When Engström-Öst et al. (2017) studied the response of
Eurytemora to cyanotoxins in a similar experiment, they found that as long as the copepods
could consume the cyanobacteria during exposure to the toxins, they were able to compensate for
the energy loss and showed no significant changes in survivorship as compared to a diet of
easily-consumed, nontoxic green algae. Together, these two case studies illustrate how the
effects of anthropogenic eutrophication resonate throughout the food web, and how the
6
phytoplankton community changes can affect the entire aquatic community. A change in the wild
that reproduced the effects of those two studies would result in a community shift towards
copepods and away from Daphnia.
Another important result of eutrophication can be “boom-bust” productivity cycles that
are typified by a sequence of phytoplankton blooms, nutrient depletion, mass die-offs, and
intense microbial decomposition leading to oxygen reduction. Algal blooms occur when a large
amount of excess nutrients allow for exponential growth without a proportional increase in
predation from herbivores. When this happens, a large amount of photosynthetic biomass
accumulates in the water, effectively shrinking the photic zone (the portion of the water column
extending downward from the surface with enough light to support photosynthesis). Large mats
of phytoplankton at the surface can shade out other photosynthesizing organisms that are
suspended in the water column. This process has two main mechanisms that lead to the same
outcome: oxygen depletion.
The first factor leading to oxygen depletion during algal blooms is the conversion of
algae that would normally be oxygen producers when light is available into oxygen consumers in
low-light conditions. Algae have a basal metabolic rate (amount of reduced organic carbon
oxidized per time that is used to maintain cellular processes) that is negative, signifying net
oxygen production when photosynthesis is happening. However, when those cells are shaded,
they become an oxygen sink that can deplete the water column and cause a hypoxic (low-
oxygen) or anoxic (no-oxygen) state. The second mechanism occurs during mass die-off stage of
a phytoplankton bloom when the large number of cells deplete the water of nutrients and begin to
die as a result. Microbial decomposition of the dying algae increases and can contribute to
establishing and maintaining a hypoxic or anoxic state, especially near the sediment-water
7
interface (Klump et. al., 2018). Since zooplankton and nekton (larger animals such as fish) are
obligate aerobes (require oxygen for aerobic metabolism), they will suffocate and die under
prolonged exposure to hypoxic or anoxic conditions.
Climate change can alter the niche space available for organisms by pushing water
temperatures above some species’ thermal tolerances and exacerbate low-oxygen conditions by
increasing the severity and duration of stratified conditions in aquatic ecosystems. Stratification
of a water body means that there is a physical barrier, usually driven by density differences, that
separates the water column into three sections, each with distinct biological, chemical, and
biogeochemical characteristics that are heavily influenced by seasonality and trophic status.
From the surface to the bottom, these sections are known as the epilimnion (“top water”),
metalimnion (“middle water”; transition zone between the epi- and hypolimnion), and
hypolimnion (“bottom water”).
For temperate regions in the northern hemisphere (such as in Little Sturgeon Bay), the
winter months are characterized by cold temperatures and permanent or semi-permanent ice
cover. During this period, the water column is known as “inversely stratified,” where the coldest
water is found in the epilimnion directly underneath the ice, with the rest of the water column
stable around 4ºC (the temperature at which water is the densest in the liquid phase). During the
winter months, oxygen and other nutrient concentrations usually remain high, as microbial
decomposition, respiration rates of plankton, and poikilotherm growth rates are depressed due to
the low temperatures. Additionally, since oxygen solubility increases in water with decreasing
temperature, water oxygen concentrations in cold water can be higher than in warm water. At
4ºC, Benson and Krause (1980) found that the oxygen saturation point (the point at which the
maximum amount of O2 is dissolved in water) is 13.107 mg/L. During the summer, when the
8
surface waters can reach 22ºC or higher, the saturation point drops by nearly one third to 8.743
mg/L.
After the ice melts in the spring, the inverse stratification is broken by a process called
“spring mixis,” during which mechanical energy derived from wind can circulate the entire (or a
large part of) the water column. As the water mixes, oxygen is replenished at the surface and
nutrients are circulated at every depth, leading to intense phytoplankton growth (especially green
algae and diatoms) that is spurred by the warming temperatures and increased light availability.
Nutrient-rich terrestrial runoff can also contribute to the nutrient pool. This explosion in
productivity is followed by a corresponding increase in zooplankton, especially large filter
feeders such as Daphnia that can quickly grow and reproduce in the food-rich and predator-poor
environment. However, in mid- to late spring during a time known as the “spring clearwater
phase,” algae populations crash due to a combination of nutrient limitation and intense predation
from zooplankton. A reduction in zooplankton population directly follows this precipitous drop
in algae abundance as a result of a lack of food and increased predation pressure from
planktivores (heterotrophs that consume plankton). In Green Bay and Little Sturgeon Bay these
include larval fish, large predatory zooplankton (such as Leptodora kindtii or Bytotrephes
longimanus) and filter-feeding fish (De Stasio, unpublished data).
In the late spring to early summer, stratification is reestablished as solar radiation heats
the surface water. The summertime characteristics of the stratification are heavily dependent on
the trophic status of the water body (Wetzel, 2001). In oligotrophic lakes where microbial
decomposition is not as intense, the hypolimnion remains cold and well-oxygenated from its
saturation during spring mixis. In contrast, the oxygen in the hypolimnion of eutrophic (lakes
with high nutrient concentrations and a productive plant community) and hypereutrophic
9
(extremely eutrophic) lakes becomes depleted in a matter of weeks by intense microbial
decomposition of organic matter (Seto et. al, 1982, in Wetzel, 2001). This structure, typified by
an oxic epilimnion and an anoxic hypolimnion, is known as “clinograde.” During the summer,
nutrient limitation (especially P) and high temperatures drive the community to be mainly
dominated by cyanobacteria, which, coupled with high predation pressure from planktivores,
causes a shift in the zooplankton community towards smaller-bodied animals that are more
successful at escaping predators.
Stratification is broken during “fall mixis” when the surface waters cool enough such that
the density difference between the epilimnion and hypolimnion can be overcome by wind
energy. This mixing allows recycled nutrients that were trapped in the hypolimnion to be
recirculated into the photic zone. The colder temperatures and water replete with nutrients
(especially P and Si) allow the community composition to shift away from cyanobacteria and
towards dominance by diatoms. One effect of climate change would be the delay of fall mixis,
which would extend the period of dominance by cyanobacteria and prolong the low-oxygen state
in the hypolimnion of eutrophic water bodies. Because water becomes stratified in the summer,
there are disparate effects of eutrophication and climate change depending on the position in the
water column that an organism usually inhabits. Sessile benthic (bottom-dwelling organisms
such as macrophytes and mollusks), and epibenthic (organisms that live just above the sediment-
water interface such as some fish and zooplankton, including Eurytemora) species are much
more susceptible to habitat change than organisms that inhabit the continuously-oxygenated
surface waters. For those organisms that live in the epilimnion, light limitation and nutrient
depletion will be less likely. Additionally, shallower water near the shoreline that is perturbed by
10
wave action will also be less affected, as the moving water will help to circulate oxygen-enriched
water towards the sediment.
Environmental Stressors: Aquatic Invasive Species
The success of aquatic invasive species is corollary to the increased productivity and
community simplification that is brought about by anthropogenic eutrophication of aquatic
resources. Those stressors reduce an ecosystem’s resilience against invasion by opening up
potential niche space and selecting for generalist species that may be out-competed by a
nonnative specialist. The term “invasive species” has two distinct definitions. The biological
definition defines an invasive species as one that is expanding outside its native range (usually
mediated by humans), establishing populations in new locales, and disrupting that area’s
ecosystem. Under this definition, not all invasive species are non-native (i.e. come from a
different place), and not all non-native species are invasive. A native species may become
invasive in its native ecosystem if its function in that ecosystem (i.e. its niche space) changes.
For example, gut bacteria in humans could be considered invasive if they develop pathogenic
qualities or toxins that harm other microorganisms or their host. Additionally, a non-native
species may not develop invasive qualities if it assumes a function in the ecosystem that was not
previously performed, such as using an unused energy source or habitat, or if it never gains a
competitive advantage over established native species. The second, political definition of an
invasive species is one that is non-native and harms the environment, economy, or human health.
This definition stresses the importance of functionality in determining the invasive status of a
species.
11
A good case study to illustrate the difference between the political and the biological
definitions is the invasion of zebra mussel (Dreissena polymorpha) into Lake Winnebago, USA.
In other places in the Great Lakes and their watershed (such as Green Bay), this mollusk has
induced drastic changes to the benthic and planktonic community structure by out-competing
native mollusks for space and by removing an incredible volume of food from the water column
(e.g. De Stasio et. al., 2014). Because the mollusk is a voracious phytoplanktivore and because it
selects for green algae, it has heavily biased the phytoplankton community towards diatoms and
cyanobacteria, which, as discussed earlier, has implications for higher trophic levels. It also
causes millions of dollars per year in damages to human infrastructure (O’Neil, 1997). In such a
case, it would be classified as invasive under both the biological and political definitions.
However, in the case of Lake Winnebago, a longitudinal study by De Stasio (unpublished data)
found that there was no significant change in water clarity, phytoplankton biomass, or Daphnia
abundance after its introduction. Due to the lake’s soft, mucky bottom (which is not habitable by
Dreissena as the species needs a solid holdfast) and hypereutrophic status, the small population
that has been established there has not been able to establish a top-down control on the
phytoplankton population and therefore may not be considered “invasive” under the biological
definition. However, because many of the surfaces colonized are docks, water intake and outlet
pipes and boat hulls, they can significantly impair the human economy around Lake Winnebago
by fouling human structures. Due to this economic impairment, they would be considered
invasive using the political definition. Because the focus of my study is on the species
Eurytemora carolleeae and how it will interact with its biological community in the face of
environmental perturbation, I will primarily consider the status of this invasive species using the
biological definition, as it prioritizes ecosystem function over human impact.
12
A useful conceptual framework for thinking about the likelihood of invasion is the “tens
rule” (Jarić and Gorčin, 2012). This describes the general trend where for every 100 foreign
species that escape into the wild, 10 will become naturalized in their new environment and create
self-sustaining populations. Then, out of those 10 naturalized species, one will become invasive.
The success rate of invasive species is also modulated by factors in the environment, principally
native species diversity and environmental conditions. First, the abiotic conditions such as
salinity, temperature, light and nutrient availability, and seasonal changes, need to be compatible
with the invading species. For example, if a species is transported from the arctic to the tropics, it
may not be able to survive due to a limited thermal tolerance. Second, it is generally easier to
invade “simple” ecosystems, in which there is a small number of species that occupy each
trophic level (also known as low diversity). When this is the case, such as in many northern-
latitude climates, there is a lower chance of competition with native species. Additionally, simple
ecosystems are more subject to damage from anthropogenic disturbance, and that lack of
resilience makes potential openings in the environment more common. Physiological aspects
such as earlier spawning times, more efficient resource use, ability to exploit an uncontested food
source, and faster growth and reproduction are all common traits that invasive species have that
allow them to have a competitive advantage and exploit openings in the existing trophic structure
and niche space. On a more ecological level, the Enemy Release Hypothesis (ERH) (Keane and
Crawley, 2002) posits that a species may become invasive when there are no predators in the
introduced area to keep the population in check. When a species experiences low or no predation
pressure, it can more efficiently grow, forage, and reproduce, all of which give it a competitive
advantage over native species that are subjected to predation pressure.
13
Once established in an area, invasive species are incredibly costly in both time and
capital to remove. This is complicated in aquatic systems by the relatively rapid and wide-
ranging dispersal of planktonic larvae. A planktonic stage is an important life history feature of
many organisms, including those that are normally stationary as adults (such as mollusks). While
it may be possible to remove all of the adults from an area, filtering all of the viable eggs and
juveniles out of the water is generally not feasible. Additionally, the biological factors that allow
a species to become invasive can inhibit efforts to remove it. If the invasive species became
established in a new area despite competition or predation from native species, it is unlikely that,
once dominant, those native species will be able to drive it from the system.
To combat invasive species, there are several common methods whose success is
dependent on the features of the species being targeted. One of the most common ways to
remove a problem species is culling, either manually or chemically (Carlton, 2003; Pyšek and
Richardson, 2010). This is much more effective when the population is small, or when the
species’ range is limited. However, due to physical constraints of working in aquatic systems,
direct, specific attacks are often not as effective. For example, only a single example of
successful eradication of zebra mussels in an invaded lake has occurred (Wimbush et al., 2009).
This was possible because the initial colonization was detected early by SCUBA diving clubs
and massive culling efforts by divers were able to stop the invasion. In comparison to terrestrial
systems, species must be trapped using “blind” techniques such as fishing or trapping, as
compared to visual techniques such as hunting or specific removal of a certain plant, which can
result in heavy damage to non-target species. The use of pesticides, toxins, or other chemicals
similarly affects non-target species, since dispersion of toxic compounds is much more rapid in
water than over land of through soil, and since the range of that dispersal is much more
14
challenging to control. However, if a chemical is developed that is specific to the invasive
species but unharmful to native ones, that increased dispersal by water could help facilitate
culling by expediting its diffusion.
Other more “experimental” methods in invasive species mitigation include biological
control (biocontrol for short) and altering the abiotic environment (such as removing habitat) to
make it incompatible with the target species. Biocontrol is the process by which the natural
predator or a natural competitor to a problem species is introduced into an area to control it. One
of the most successful implementations of biocontrol is the mitigation of the prickly pear cactus
(Opuntia stricta) in Australia by introduction of its natural predator the Cactoblastis moth
(Cactoblastis cactorum) (Hosking et. al., 1988). In the Great Lakes, predatory fish such as
salmon, walleye, bass, and northern pike have been stocked or introduced to control booming
populations of invasive fish including rainbow smelt and alewife (USACE, 2012 and references
therein). However, there is always the risk that the biocontrol species can itself become invasive
by either competing with, displacing, or preying upon native species.
In the North American Great Lakes, the most common source of invasive species is
ballast water from transoceanic vessels. In order to maintain their stability when not carrying
cargo, large ships such as tankers, cargo ships, or ocean liners intake large quantities of ballast,
usually water, from their port of departure. This volume of water is carried thousands of miles
and then discharged in a new location when the ship is loaded with new cargo. During this
process, a large variety of aquatic hitchhikers such as plankton, larval fish and crustacea, or
benthic species such as macrophytes or mollusks are also transported from their native range and
injected into foreign, but potentially suitable habitats. In addition to those species carried in the
ballast water, biofouling organisms (those organisms that grow on top of human substrate such
15
as ship hulls or pipes) including mollusks such as Dreissena or barnacles can be carried long
distances and then re-establish themselves in a foreign body of water. Over the course of a year,
a single ship typically takes in and discharges water multiple times in multiple continents
(Holeck et. al., 2004). Another important source of invasive species is fishing equipment or lines,
which can snag certain types of voracious planktonic predators, such as fishhook and spiny water
fleas. Once across the ocean, secondary dispersal of non-native species across the continent
occurs via similar vectors, although overland dispersal on boat trailers, fishing equipment, bait
buckers, or in bilge water are also concerns. Many of the most important Great Lakes invasive
species, including Eurytemora, have native ranges in Asia or Europe. The large volume of
intercontinental shipping, especially in the wake of the collapse of the Soviet Union in 1991,
helps explain the high species exchange rate between those two continents and freshwater ports
in the Great Lakes.
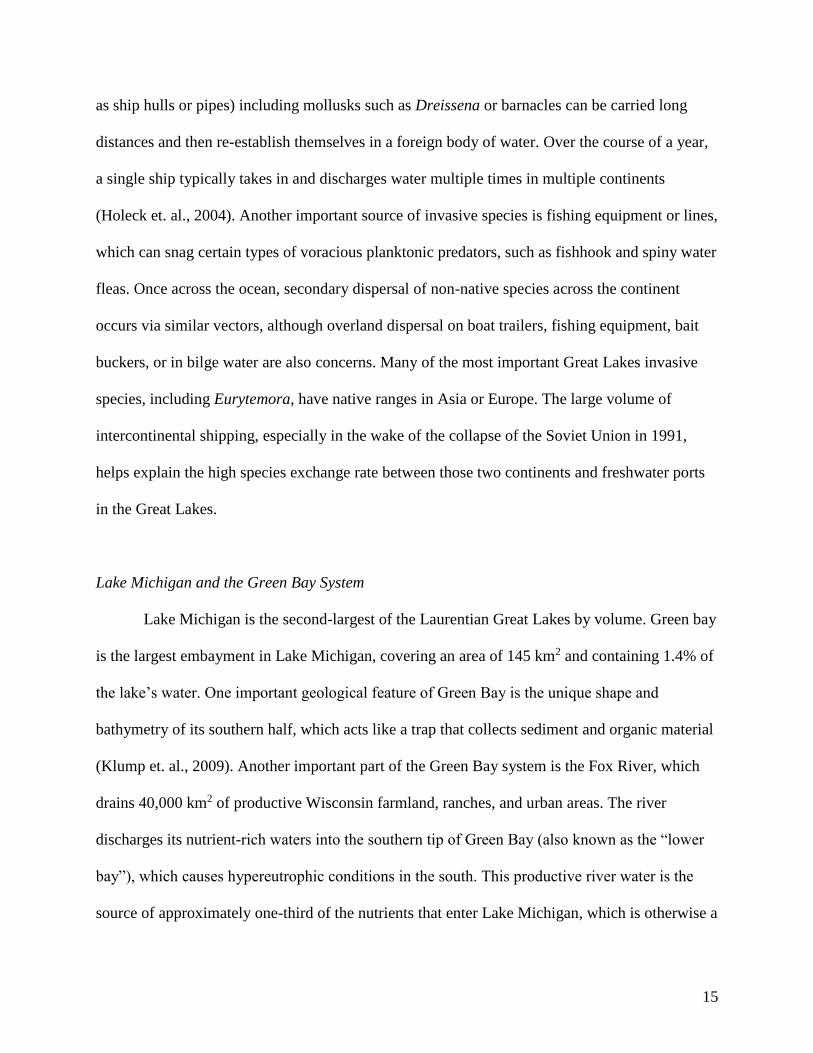
Lake Michigan and the Green Bay System
Lake Michigan is the second-largest of the Laurentian Great Lakes by volume. Green bay
is the largest embayment in Lake Michigan, covering an area of 145 km2 and containing 1.4% of
the lake’s water. One important geological feature of Green Bay is the unique shape and
bathymetry of its southern half, which acts like a trap that collects sediment and organic material
(Klump et. al., 2009). Another important part of the Green Bay system is the Fox River, which
drains 40,000 km2 of productive Wisconsin farmland, ranches, and urban areas. The river
discharges its nutrient-rich waters into the southern tip of Green Bay (also known as the “lower
bay”), which causes hypereutrophic conditions in the south. This productive river water is the
source of approximately one-third of the nutrients that enter Lake Michigan, which is otherwise a
16
mesotrophic (moderately productive) or oligotrophic system. Mixing of the nutrient-rich Fox
River water and the relatively depleted Lake Michigan water at the Bay’s northern extent creates
a steep trophic gradient from south to north, which provides a wide range of different habitats for
fish and plankton in a relatively small geographic area (De Stasio et. al. 2018 and citations
within).
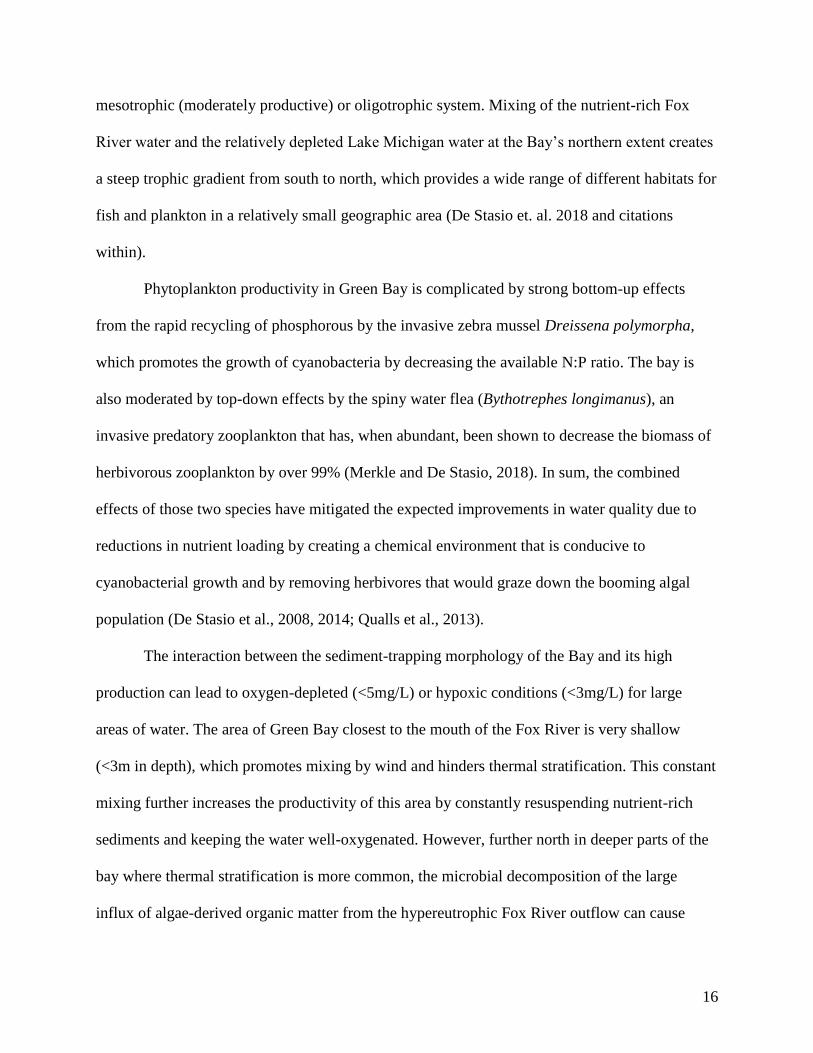
Phytoplankton productivity in Green Bay is complicated by strong bottom-up effects
from the rapid recycling of phosphorous by the invasive zebra mussel Dreissena polymorpha,
which promotes the growth of cyanobacteria by decreasing the available N:P ratio. The bay is
also moderated by top-down effects by the spiny water flea (Bythotrephes longimanus), an
invasive predatory zooplankton that has, when abundant, been shown to decrease the biomass of
herbivorous zooplankton by over 99% (Merkle and De Stasio, 2018). In sum, the combined
effects of those two species have mitigated the expected improvements in water quality due to
reductions in nutrient loading by creating a chemical environment that is conducive to
cyanobacterial growth and by removing herbivores that would graze down the booming algal
population (De Stasio et al., 2008, 2014; Qualls et al., 2013).
The interaction between the sediment-trapping morphology of the Bay and its high
production can lead to oxygen-depleted (<5mg/L) or hypoxic conditions (<3mg/L) for large
areas of water. The area of Green Bay closest to the mouth of the Fox River is very shallow
(<3m in depth), which promotes mixing by wind and hinders thermal stratification. This constant
mixing further increases the productivity of this area by constantly resuspending nutrient-rich
sediments and keeping the water well-oxygenated. However, further north in deeper parts of the
bay where thermal stratification is more common, the microbial decomposition of the large
influx of algae-derived organic matter from the hypereutrophic Fox River outflow can cause
17
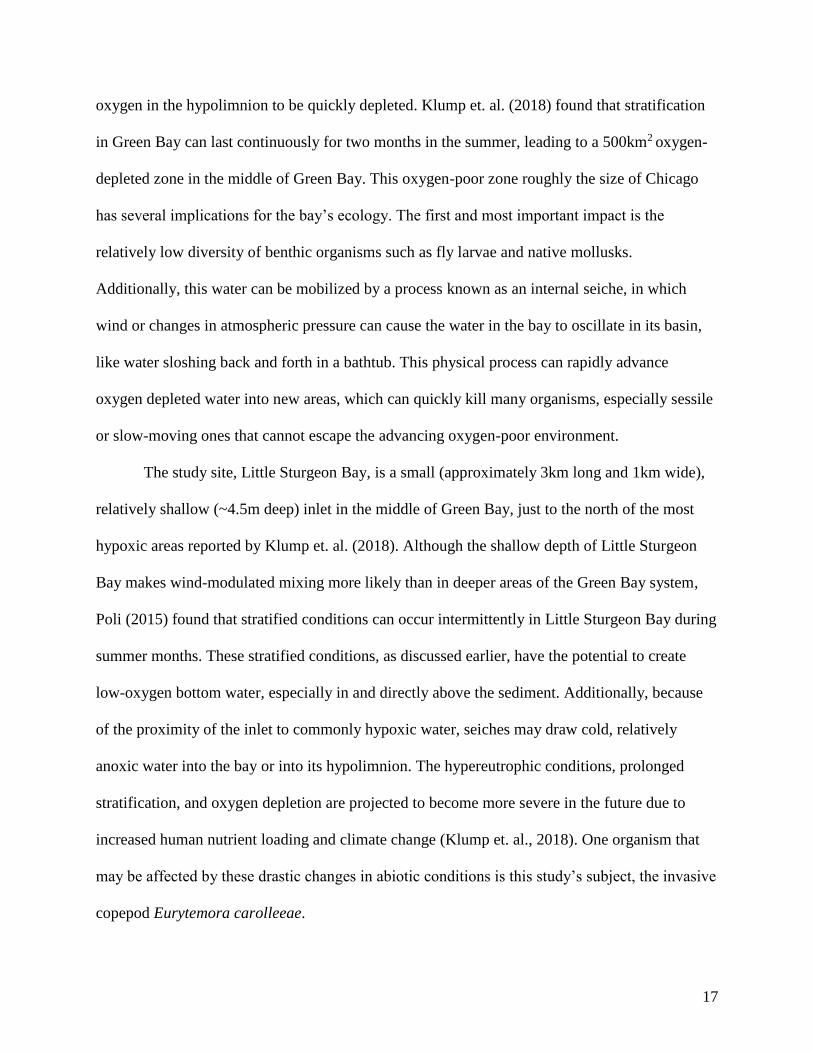
oxygen in the hypolimnion to be quickly depleted. Klump et. al. (2018) found that stratification
in Green Bay can last continuously for two months in the summer, leading to a 500km2 oxygen-
depleted zone in the middle of Green Bay. This oxygen-poor zone roughly the size of Chicago
has several implications for the bay’s ecology. The first and most important impact is the
relatively low diversity of benthic organisms such as fly larvae and native mollusks.
Additionally, this water can be mobilized by a process known as an internal seiche, in which
wind or changes in atmospheric pressure can cause the water in the bay to oscillate in its basin,
like water sloshing back and forth in a bathtub. This physical process can rapidly advance
oxygen depleted water into new areas, which can quickly kill many organisms, especially sessile
or slow-moving ones that cannot escape the advancing oxygen-poor environment.
The study site, Little Sturgeon Bay, is a small (approximately 3km long and 1km wide),
relatively shallow (~4.5m deep) inlet in the middle of Green Bay, just to the north of the most
hypoxic areas reported by Klump et. al. (2018). Although the shallow depth of Little Sturgeon
Bay makes wind-modulated mixing more likely than in deeper areas of the Green Bay system,
Poli (2015) found that stratified conditions can occur intermittently in Little Sturgeon Bay during
summer months. These stratified conditions, as discussed earlier, have the potential to create
low-oxygen bottom water, especially in and directly above the sediment. Additionally, because
of the proximity of the inlet to commonly hypoxic water, seiches may draw cold, relatively
anoxic water into the bay or into its hypolimnion. The hypereutrophic conditions, prolonged
stratification, and oxygen depletion are projected to become more severe in the future due to
increased human nutrient loading and climate change (Klump et. al., 2018). One organism that
may be affected by these drastic changes in abiotic conditions is this study’s subject, the invasive
copepod Eurytemora carolleeae.
18
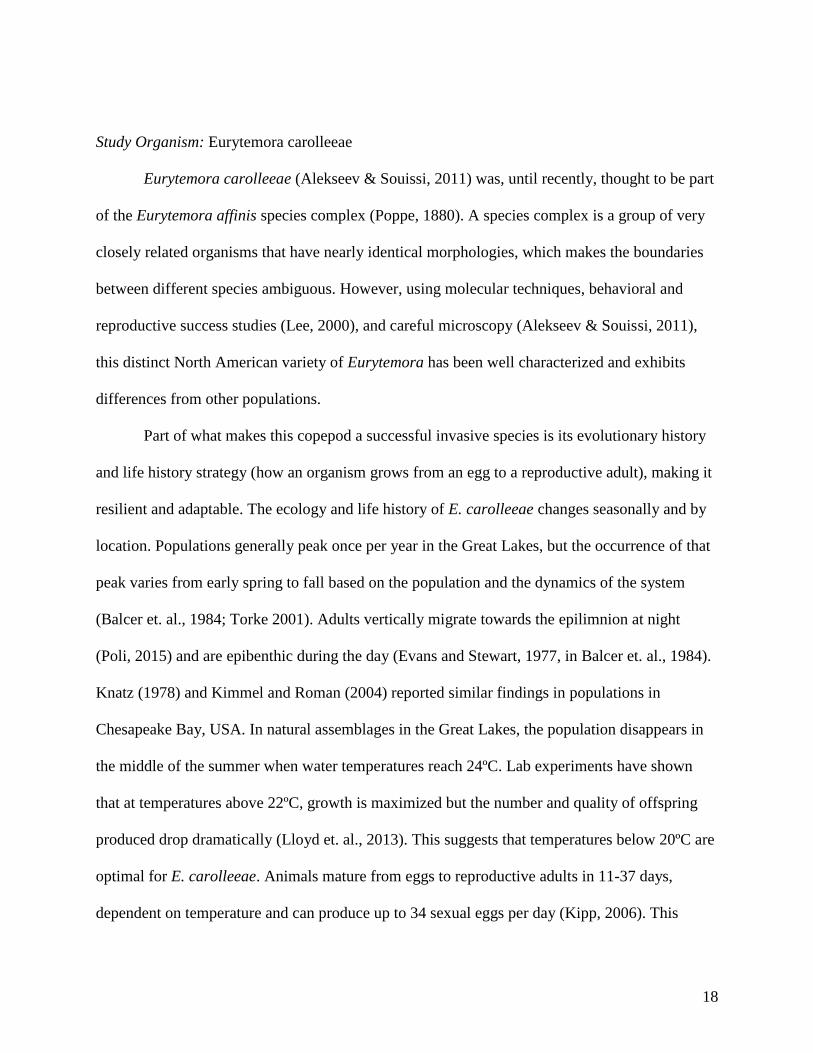
Study Organism: Eurytemora carolleeae
Eurytemora carolleeae (Alekseev & Souissi, 2011) was, until recently, thought to be part
of the Eurytemora affinis species complex (Poppe, 1880). A species complex is a group of very
closely related organisms that have nearly identical morphologies, which makes the boundaries
between different species ambiguous. However, using molecular techniques, behavioral and
reproductive success studies (Lee, 2000), and careful microscopy (Alekseev & Souissi, 2011),
this distinct North American variety of Eurytemora has been well characterized and exhibits
differences from other populations.
Part of what makes this copepod a successful invasive species is its evolutionary history
and life history strategy (how an organism grows from an egg to a reproductive adult), making it
resilient and adaptable. The ecology and life history of E. carolleeae changes seasonally and by
location. Populations generally peak once per year in the Great Lakes, but the occurrence of that
peak varies from early spring to fall based on the population and the dynamics of the system
(Balcer et. al., 1984; Torke 2001). Adults vertically migrate towards the epilimnion at night
(Poli, 2015) and are epibenthic during the day (Evans and Stewart, 1977, in Balcer et. al., 1984).
Knatz (1978) and Kimmel and Roman (2004) reported similar findings in populations in
Chesapeake Bay, USA. In natural assemblages in the Great Lakes, the population disappears in
the middle of the summer when water temperatures reach 24ºC. Lab experiments have shown
that at temperatures above 22ºC, growth is maximized but the number and quality of offspring
produced drop dramatically (Lloyd et. al., 2013). This suggests that temperatures below 20ºC are
optimal for E. carolleeae. Animals mature from eggs to reproductive adults in 11-37 days,
dependent on temperature and can produce up to 34 sexual eggs per day (Kipp, 2006). This
19
species produces diapausing (“resting eggs”) in the fall. These robust eggs can survive digestion
by fish and can remain viable in the sediment for 10-18 years, even in anoxic conditions.
Research on the diet of planktivorous fish by Faber and Jermolojev (1966, in Balcer et.
al., 1984) suggest that E. carolleeae is an important or possibly even a preferred food source for
many species. Qualitative observations during this study suggested that E. carolleeae were also
popular food sources for predatory or omnivorous copepods such as Macrocyclops, sp.,
Mesocyclops edax, and Acanthocyclops vernalis. Those species were observed directly feeding
on live Eurytemora, and Eurytemora populations decreased much more rapidly than other small
calanoid species such as Skistodiaptomus oregonensis or cladocerans such as Ceriodaphnia, spp.
E. carolleeae were easier to catch using a pipette (which can be used as a proxy for fish
predation success), swam more slowly and were considerably less transparent than other species
of copepods enumerated above.
In addition to their introduction to the Great Lakes in the 1950s, there have been many
recent successful invasions of Eurytemora into freshwater areas in Europe, Japan, the Mississippi
River System, and landlocked reservoirs in the United States (Lee, 1999 and Kipp, 2006).
Eurytemora is what is known as a “euryhaline” species, meaning that it can inhabit a wide
variety of salinities (Lee et. al., 2003). In its native environment in brackish coastal estuaries and
salt marshes (Lee 1999), salinity may change rapidly over the course of the day according to
tides, or seasonally with changing fluxes of freshwater from the land. Lee and Peterson (2003)
found that individuals were able to acclimate to gradual increases in salinity but were unable to
cope with a freshwater environment unless they were genetically predisposed to do so. The
consequence of this finding is that invading populations of Eurytemora represent a small genetic
subset of the greater population that can become isolated in their new habitat and may be
20
pressured to diverge into a new species or become reproductively isolated. This hypothesis was
supported by previous genetic work by Lee (1999) that indicated that invading populations were
genetically distinct from each other, further suggesting that it is the wide adaptability intrinsic to
Eurytemora that makes it a successful invader instead of the happenstance adaptation of one
isolated population.
Study Goals
This study’s primary concern is the respiration rate of Eurytemora. Respiration rate is one
of the most important ecological measurements, as it is a proxy for the organism’s energy needs
(i.e. how much food is required to maintain body mass, growth, and reproduction). Because
metabolic rates in poikilotherms (“cold-blooded” creatures including plankton, algae, and fish)
are heavily dependent on temperature, changes in seasonal patterns of warming and cooling by
perturbations such as anthropogenic climate change may result in direct impacts on every level
of aquatic communities. These perturbations can change the competitive balance of some
creatures for a shared resource or cause a physical barrier (such as water temperatures above a
creature’s thermal tolerance) that prevents a species from inhabiting a certain area. By measuring
Eurytemora’s metabolic activity at a variety of temperatures and comparing it to a competitor
species, we can predict how its potential range and population size may change in a warming
future. A long-term goal of this work is assessing how other human-caused abiotic changes such
as eutrophication may work in conjunction with metabolic thermal responses in Eurytemora to
alter its functionality in the Little Sturgeon Bay system.
21
Introduction to Methods
Respiration rate is one of the most important ecological measurements, since it is a direct
measurement of an organism’s metabolic activity. Metabolic activity is a useful measure because
it can help determine an organism’s temperature tolerances and provide an estimate for that
organism’s optimal temperature where it has the best relative competitive advantage. The vast
majority of animals on Earth (including Eurytemora) perform aerobic respiration, which means
that they use oxygen to convert organic molecules such as sugars and fats into carbon dioxide,
water, and energy (stored as the chemicals ATP, NADPH, or NADH). That energy is then used
(i.e. those chemicals are broken down) to perform a wide variety of important functions
including movement, growth, cellular maintenance, and reproduction. By measuring how much
oxygen an organism consumes we can determine how much energy it is using at any given time.
To measure oxygen consumption, organisms are placed in a closed chamber and the oxygen
content of the air or water that they are in is measured using an oxygen probe over a length of
time. The respiration rate (in units of oxygen consumed per unit of time) is calculated by
comparing the amount of oxygen that was present at the start of the experiment to the amount
present at the end and dividing the difference by the duration of the experiment.
While measuring oxygen consumption is a relatively simple and robust method, there are
some complications that can make the data hard to interpret and limit its applications to “real-
world” scenarios that occur outside of the lab (Cammen et. al., 1990). First, the laboratory
environment is not the same as the field. Differences in temperature, stimuli, light, movement,
water chemistry, etc. that affect an organism’s activity may not be replicated ex situ. Second,
organisms are starved before and during the experiment to eliminate confounding variables such
as the respiration rate of the prey (which may result in a net increase in oxygen if the prey
22
photosynthesizes), or the bacterial decomposition of waste or decaying materials produced
during feeding. Finally, respiration experiments have to be performed over a long enough period
of time to obtain a measurable change in oxygen concentration using oxygen sensors. Moving
organisms into and out of the closed chamber is stressful and may affect how animals initially
react, so short-term experiments may provide an unreliable measure of oxygen consumption.
Because of the unpredictability of the laboratory stressors and starvation, measured respiration
rate may not provide an accurate estimate of an animal’s energy requirements in nature.
One alternative to direct respiration measurement is a biochemical assay that tests the
activity of an organism’s metabolic enzymes. Enzymes are large biological molecules that
catalyze reactions by making them more energy efficient. Many enzymes that are important in an
organism’s metabolism are part of the Electron Transport System (ETS), in which electrons are
removed from organic carbon (such as sugars) and given to O2, the “terminal electron acceptor.”
In this experiment, Eurytemora were homogenized in a buffer solution in order to lyse their cells
and release the enzymes that are normally constrained in the interior mitochondria and
microsomes. The enzymes in question remove electrons from the energy storage molecules
NADPH and NADH and transfer them onto oxygen. However, in the presence of the chemical
salt INT (iodonitrotetrazolium chloride), the enzymes work in the same manner but shuttle
electrons to the chemical, which then changes color from a light yellow to a deep pink. The
development of the pink color can be quantified using spectrophotometry and is a direct measure
of how much INT was reduced by the enzymes. Since we know the duration of time the enzymes
were active and the amount of product produced, we can then calculate the amount of activity in
oxygen consumed per unit time; the same units as respiration.
23
Methods
Collection and Maintenance of Organisms
The experimental organisms used in this study were the calanoid copepod species
Eurytemora carolleeae (Alekseev & Souissi, 2011) and Skistodiaptomus oregonensis (Lilljeborg,
1889). A total of 1,326 individual copepods were used in the respiration and ETS experiments.
Method-proofing and some preliminary tests of the ETS and respiration procedure were
performed on other organisms including Macrocyclops sp., Acanthocyclops vernalis,
Bythotrephes longimanus, and Ceriodaphnia, spp. Animals were collected between July 25th and
October 19th, 2018 in their natural assemblage from Little Sturgeon Bay (LSB) using a 0.5m-
diameter plankton net with 250µm mesh. Previous work (Poli, 2004) found the highest
concentration of Eurytemora in the shallow area surrounding a municipal boat dock, so that area
was sampled. The net was towed by hand in duplicate for the length of the dock (~100m) and
rinsed into a 5-gallon (18.9L) bucket using either aged tap water or water from LSB. Water from
LSB was added so the total sample volume was approximately 4 gallons (15L). Any visible
juvenile fish and large clumps of macrophytes that were collected from the sample were
removed. The buckets were sealed with a lid and transported back to the lab. Live animals from
LSB were identified and sorted manually under 10-40x magnification within 48 hours of
transport back to the lab and placed into monospecific containers containing aged tap water.
Dichotomous keys and illustrations from Balcer et. al. (1984) were used as morphological and
taxonomic guides. Animals were handled using disposable, wide-mouthed plastic or glass
pipettes to avoid injury.
24
Measurement of Respiration
The respiration rate of E. carolleeae and S. oregonensis was measured. The copepods
used in respiration experiments were incubated in the dark for at least 48 hours at the given
experimental temperature (9, 14, 18, and 22ºC for E. carolleeae and 14º and 22º for S.
oregonensis). They were provided the green algae Scenedesmus, which was determined by
previous authors to be a good food source (Engstrom-Ost et al., 2017, Barrett 2014, Simčič and
Brancelj 2004). After the incubation period, an average of 23 healthy, adult copepods were
rinsed with aged tap water [oxygen-saturated, filtered through a GF/C filter (47mm diameter)] to
remove any attached algae. The animals were then placed in 55mL glass chambers and sealed
with an oxygen probe (Clarke-type micropulse sensor, Endeco, Inc.) secured into the bottle’s
ground-glass opening. Respiration experiments included two or three experimental bottles (and
two or one control bottles, respectively, containing aged tap water) that ran concurrently. All
bottles were submerged in a 4L bucket that contained water at the incubation temperature.
Experiments conducted at 9º, 14º, and 18ºC were placed in an incubator in the dark while
experiments run at 22ºC were placed on the lab bench at the lab’s 22º room temperature
underneath an opaque cover. Experiments were conducted for 12-24 hours and were terminated
once the oxygen concentration in one experimental bottle reached 80% of the starting value.
After each experiment, the respiration chambers were dried and cleaned with 95% ethanol to
prevent bacterial growth.
Data was exported into Microsoft Excel, and the respiration rate was determined using a
least-squares linear best fit regression over time. The average R2 for all regressions was >0.97.
Initial readings for all bottles often fluctuated (and even occasionally increased), so data that did
not show a unidirectional trend were discarded. The respiration rate (oxygen consumption rate) R
25
was determined by subtracting the control slope (mgO2 /L/ min.) from the experimental slope and
transformed appropriately to obtain R in the units µL O2/animal/hour. Statistical tests were
performed in PAST3. Non-parametric tests were used if assumptions of normality were not met.
Determination of ETS activity
ETS measurement procedure was determined following Simčič and Brancelj (2004) and
Hernández-Léon (2000) but modified such that the homogenization and centrifugation steps
were not performed between 0º and 4ºC. During these steps, refrigerated reagents were used, but
the specific actions were performed at room temperature. Additionally, the Hernández-Léon
(2000) procedure recommends diluting the homogenate to maintain activity within the sensitivity
level of the experiment, but we found (in experiments described below) that this was not
necessary for the activity found in this system.
In sum, the procedure had three principal steps:
1) Obtaining a cell-free homogenate: A group of heathy-looking copepods (average
N=23; combined to constitute one “sample”) was rinsed in aged tap water to remove any
attached algae and placed into Teflon glass grinders containing a homogenization buffer [0.1M
sodium phosphate buffer pH 8.4, 75 mMMgSO4, 0.15% (w/v) polyvinyl pyrrolidone, 0.2% (v/v)
Triton-X- 100]. Organisms were manually crushed for 2 minutes, then transferred to a 4mL
screw-top plastic centrifuge tube and placed on ice. The homogenate was then sonicated using a
Branson ultrasonic tissue disrupter 20 seconds at 40W (20% amplitude) and centrifuged for 4
minutes at 10,000rpm.
2) Incubation: Each sample was prepared in triplicate or tetraplicate and incubated for 40
to 60 minutes at the experimental temperature along with a substrate blank and triplicate reagent
26
blanks. Each sample combined 0.5mL supernatant, 1.5mL substrate solution, and 0.5mL from a
frozen stock of INT solution (2.5mM 2-p-iodo-phenyl 3-p-nitrophenyl 5-phenyl tetrazolium
chloride [Cayman Chemical Company] in milli-Q H2O). The substrate solution was prepared
daily by combining stock buffer [0.1 M sodium phosphate buffer pH 8.4, 0.2% (v/v) Triton-X-
100; kept frozen at -20ºC] with NADH and NADPH (Cayman Chemical Company) to achieve
molar concentrations of 1.7 mM and 0.25 mM, respectively. The substrate blank (0.5mL
supernatant and 1.5mL homogenization buffer) was prepared for each sample, and the triplicate
reagent blanks (0.5mL homogenization buffer, 1.5mL substrate daily substrate buffer, and 0.5mL
INT) were prepared for each incubation. Each incubation contained between 2 and 4 samples.
After the incubation period, 0.5mL quench solution [equal parts formalin (36%, aqueous) and
H3PO4 (concentrated)] was added to each sample and reagent blank to cease enzymatic activity
and stop the abiotic reduction of INT.
3) Determination of potential oxygen consumption: The amount of INT-formazan was
determined by spectrophotometry (Varian 50 Scan spectrophotometer) immediately after the
addition of the quench solution. The absorbance was measured at 450nm, and the absorbance at
750nm was subtracted from that value as a turbidity blank. ETS activity (µL O2/hour) is
calculated as follows from Hernández-Léon (2000):
ETS =60 * H * AV * COD
INT * T * L * F
COD=(AOD * AV)-(BOD * BV)-(ROD * RV)
AV
where H is the homogenization volume (4mL), AV is the assay volume (3mL), BV is the
substrate blank volume (2mL), RV is the reagent blank volume (3mL), AOD is the difference
between the absorbance of the assay at 450 and 750 nm (BOD and ROD are the same differences
27
for the substrate blank and reagent blank, respectively), INT is the conversion factor to volume
of O2 (1.42), T is the incubation time in minutes, L is the path length of the spectrophotometer
cuvette (1cm), and F is the volume of homogenate used in each assay (0.5mL).
Determination of ETS:R ratios
In order to obtain the most reliable comparison and to eliminate some of the potential
variation in ETS activity between individuals, we also performed ETS assays on individuals that
were used in the respiration measurement experiments. After each respiration experiment was
completed, the copepods in that experiment were re-counted and washed with fresh, filtered aged
tap water. Any copepods that had died in the respiration experiment or those that looked sickly
were excluded from the subsequent ETS analysis. Excess water was removed using a paper filter,
and the total wet weight of each batch of copepods was measured using a microbalance (Cahn C-
35 ultra-microbalance, Thermo Electron Corp, Beverly, MA.). Animals were stored on pieces of
aluminum foil at -20ºC immediately after weighing. The ETS activity of those animals was
determined as described above but were not re-rinsed with aged tap water. Instead, the frozen
mass of copepods was removed from the foil added directly to the homogenization buffer in step
one.
Method Proofing: Incubation time and Dilution
In order to determine the effect of ETS experiment incubation time and determine if
homogenate dilution would produce reliable results, we tested the effect of dramatically
increasing the amount of ETS enzymes present. For this test we prepared triplicate assays of a
comparable number (N = 16) of the much larger predatory zooplankton Bythotrephes
longimanus. The absorbance at 450 and 750 of each of the assays and a reagent blank was
28
measured every minute for one hour, and again at 76 and 105 minutes. The ETS value was
calculated for each observation of each replicate for the duration of the experiment.
Determination of the Arrhenius Activation energy (EA)
The results of the ETS:R ratio experiments were used to determine the Arrhenius
activation energy (EA; expressed in kcal/mole) for Eurytemora carolleeae according to the
calculations in Packard et. al. (1975). The EA relationship can be expressed as:
EA = -RS
where R is the gas constant (1.987 kcal/mole) and S is the slope of a linear least-squares
regression. An Arrhenius plot with a linear least-squares regression was created in Microsoft
Excel that graphed the natural log (ln) of ETS activity against the reciprocal of absolute
temperature (ºK). The ETS value used for each temperature was the average of the replicate ETS
activities used to determine the ETS:R ratio at that temperature. 95% confidence intervals of the
slope (and by consequence the 95% confidence intervals [95% CI] for EA) were determined
using a bivariate ordinary least-squares regression in PAST3.
Results
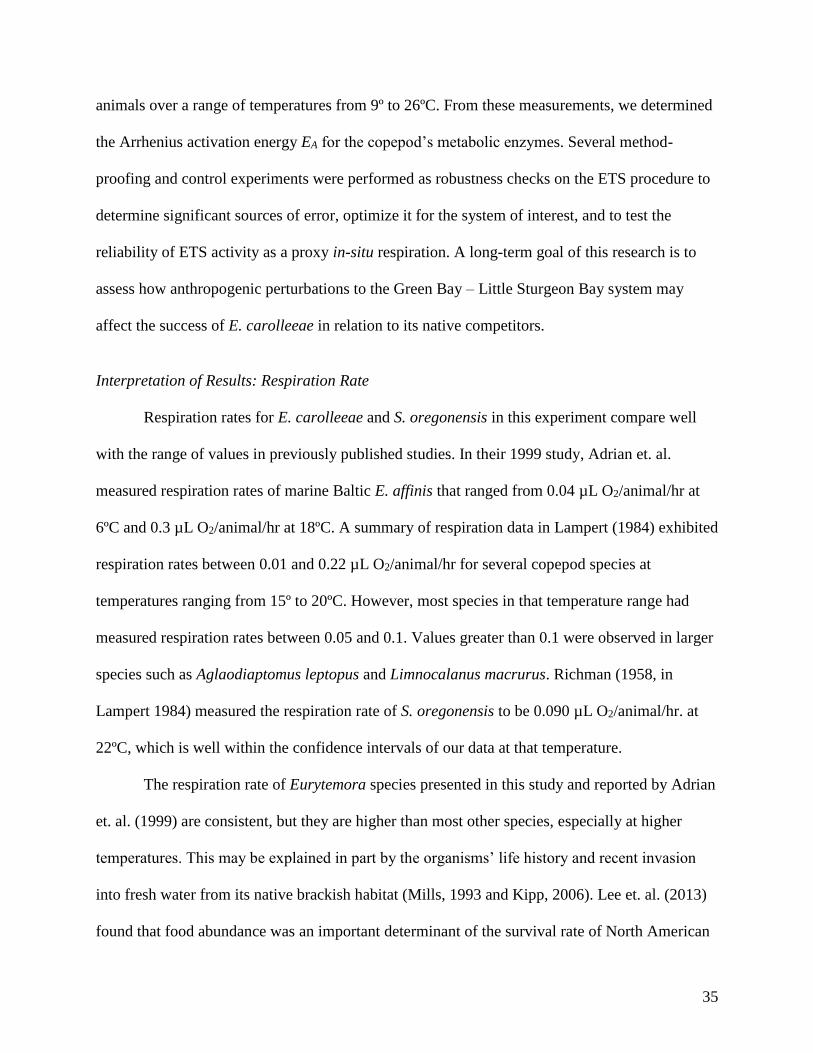
Respiration Rates
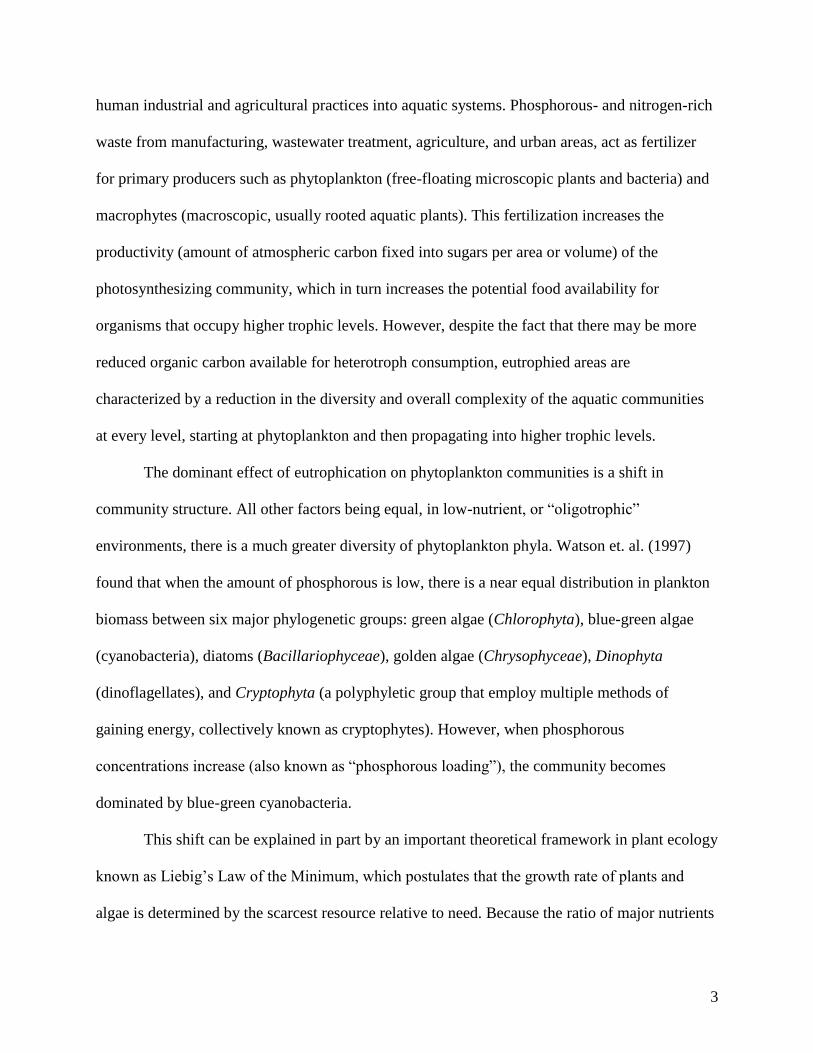
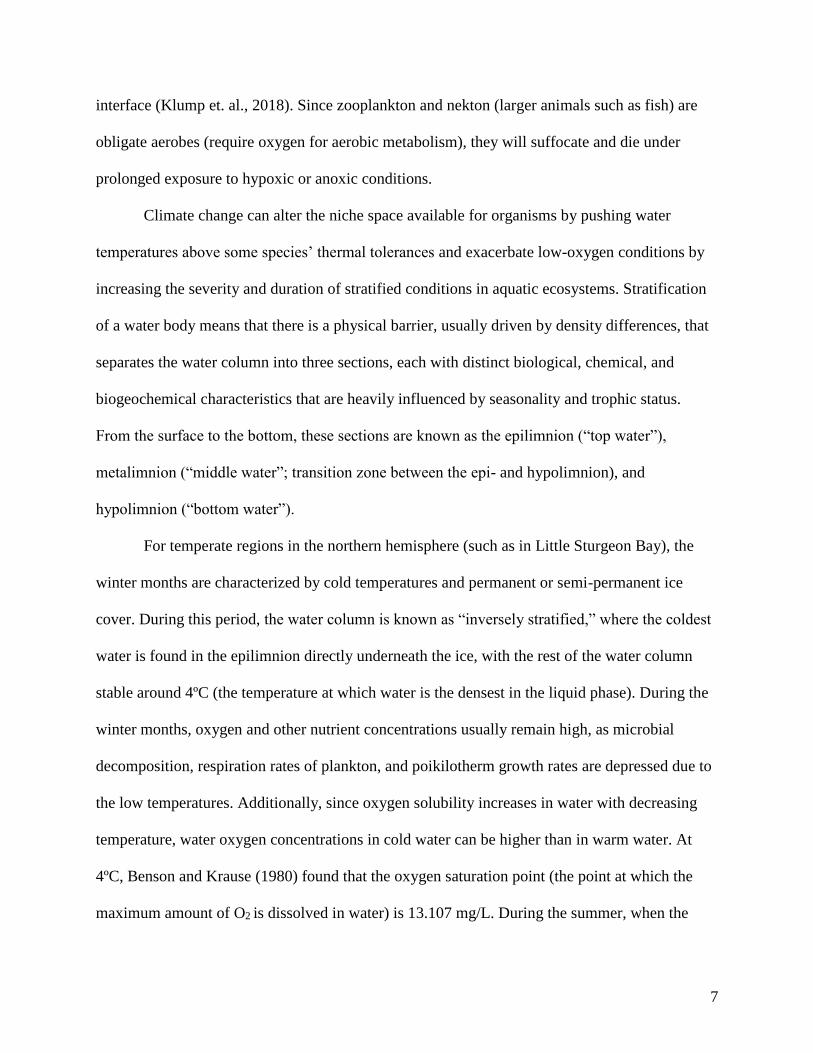
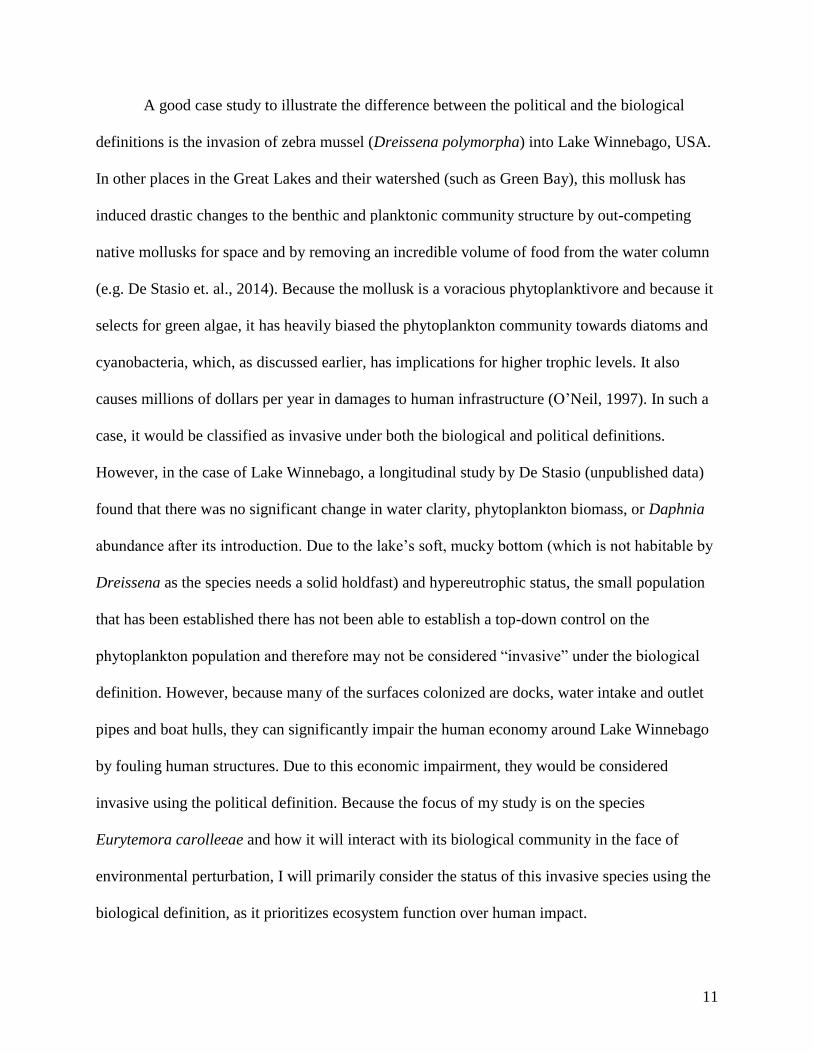
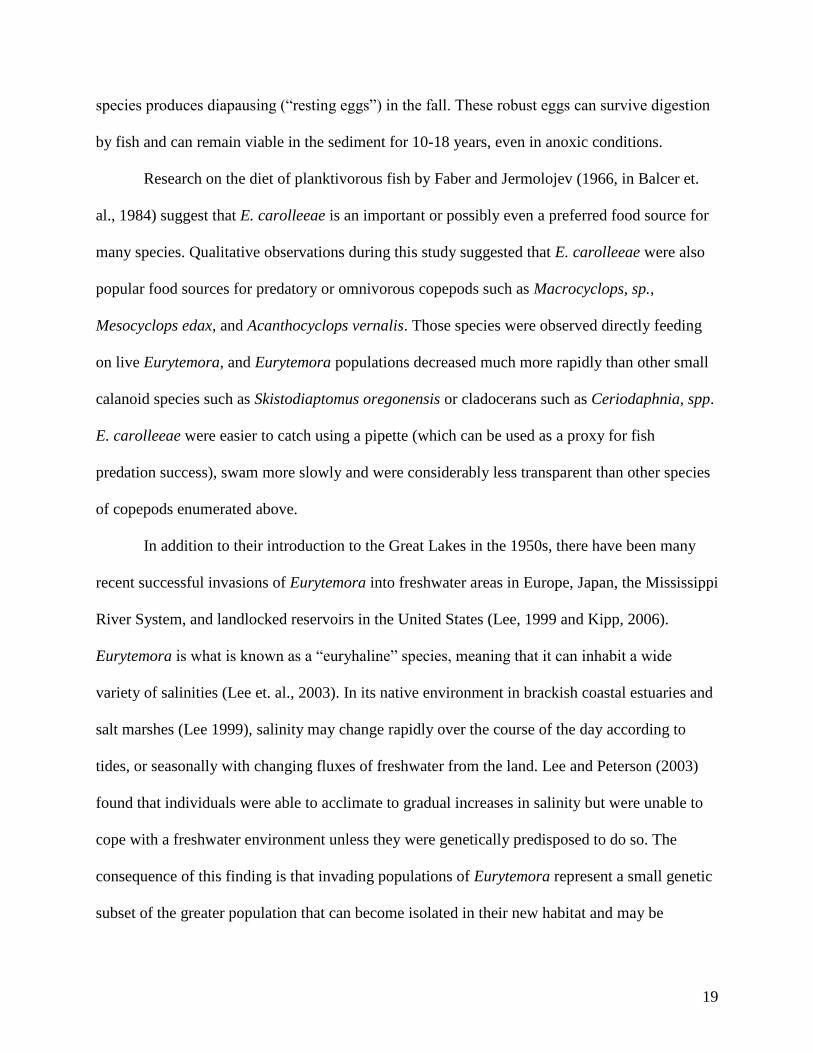
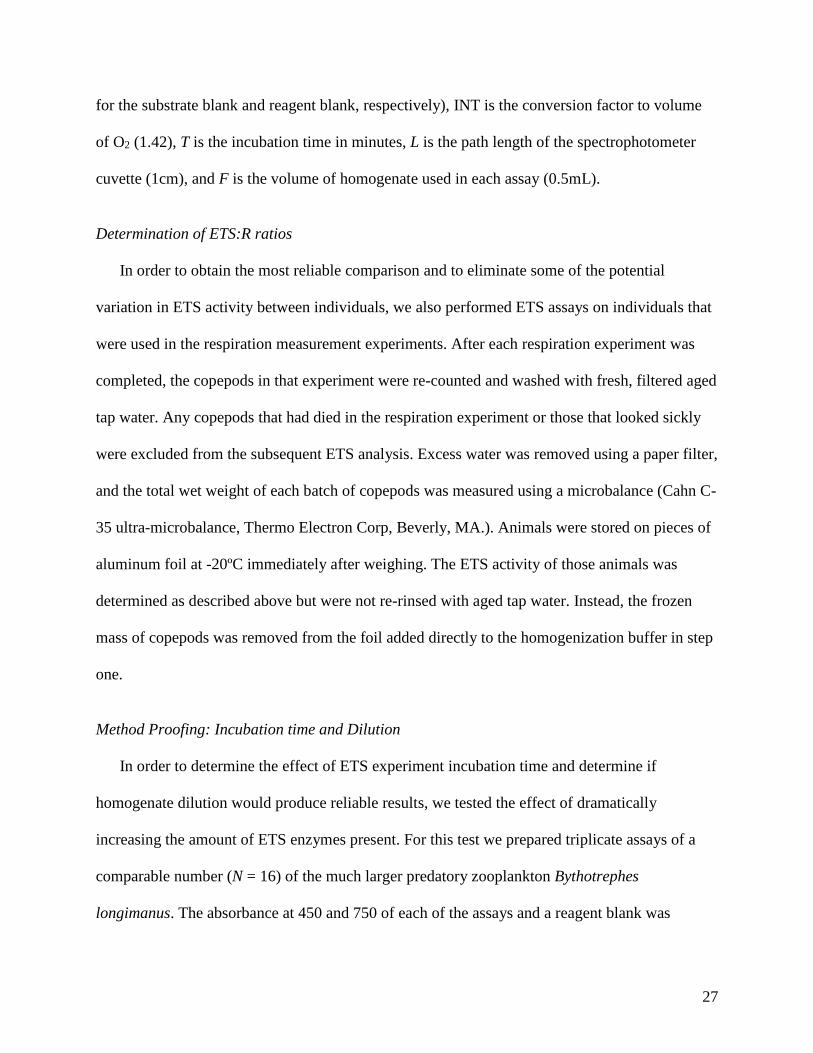
The measured respiration rate of E. carolleeae increased from 0.025 ± 0.011 µL
O2/animal/hr at 9ºC (mean ± 95% CI, n= 4) to 0.238 ± 0.088 µL/animal/hr at 26ºC (n = 3) (Fig.
1). The data can be best modeled by the linear least-squares regression R = 0.0128 *
Temperature[ºC] – 0.0897 (R2=0.996; p = 0.007). The respiration rates of S. oregonensis at the
two temperatures measured did not differ significantly, with a value of 0.083± 0.035 µL
O2/animal/hr at 14º (n = 3) and 0.052± 0.027 µL O2/animal/hr at 22ºC (n = 2; t-test, p>0.3). The
29
respiration rate of S. oregonensis was not significantly different from that of E. carolleeae at
14ºC (t-test; p>0.8) but was significantly lower at 22º (t-test; p<0.05).
Figure 1. Measured respiration rate of E. carolleeae and S. oregonensis at different temperatures.
Individuals were acclimated to the experimental temperature for at least 48 hours before the start of the
experiment. Error bars represent 95% confidence intervals.
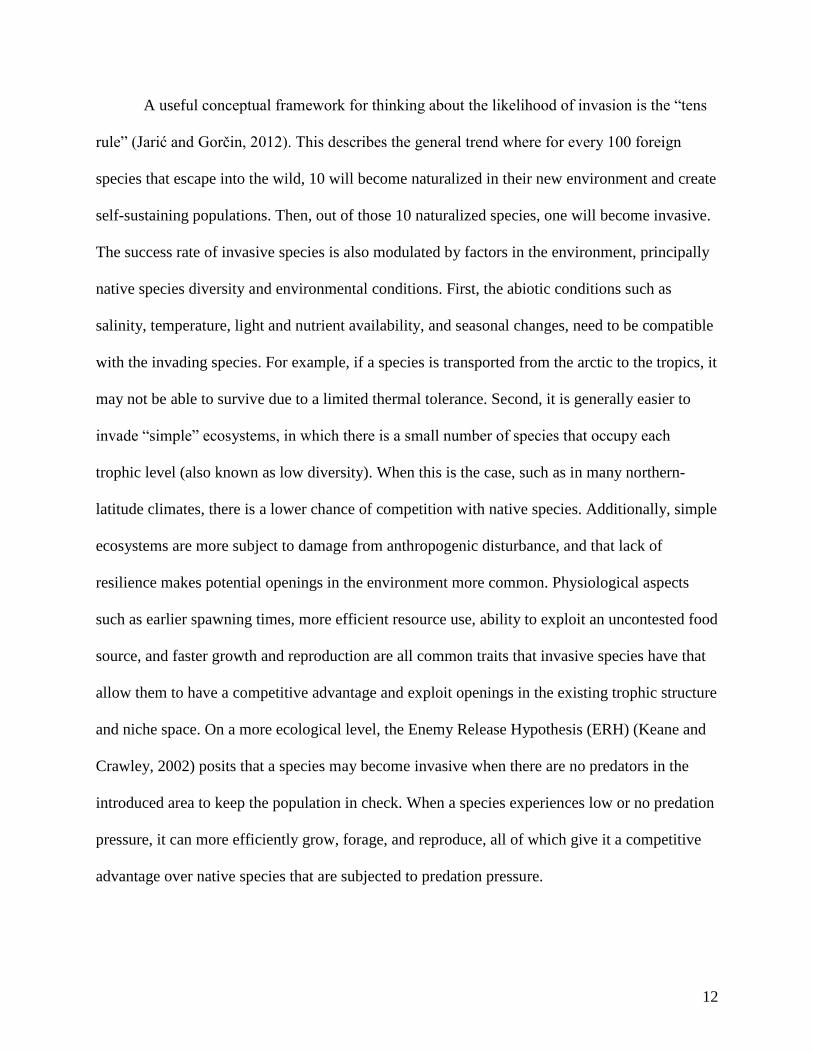
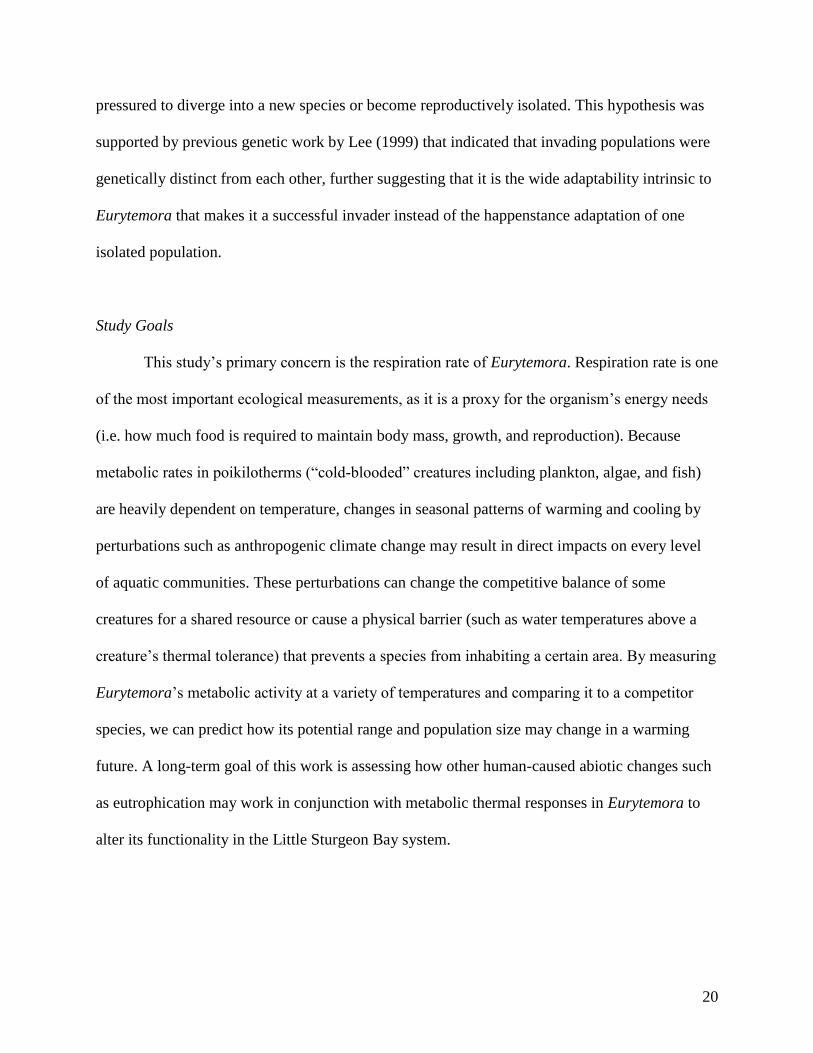
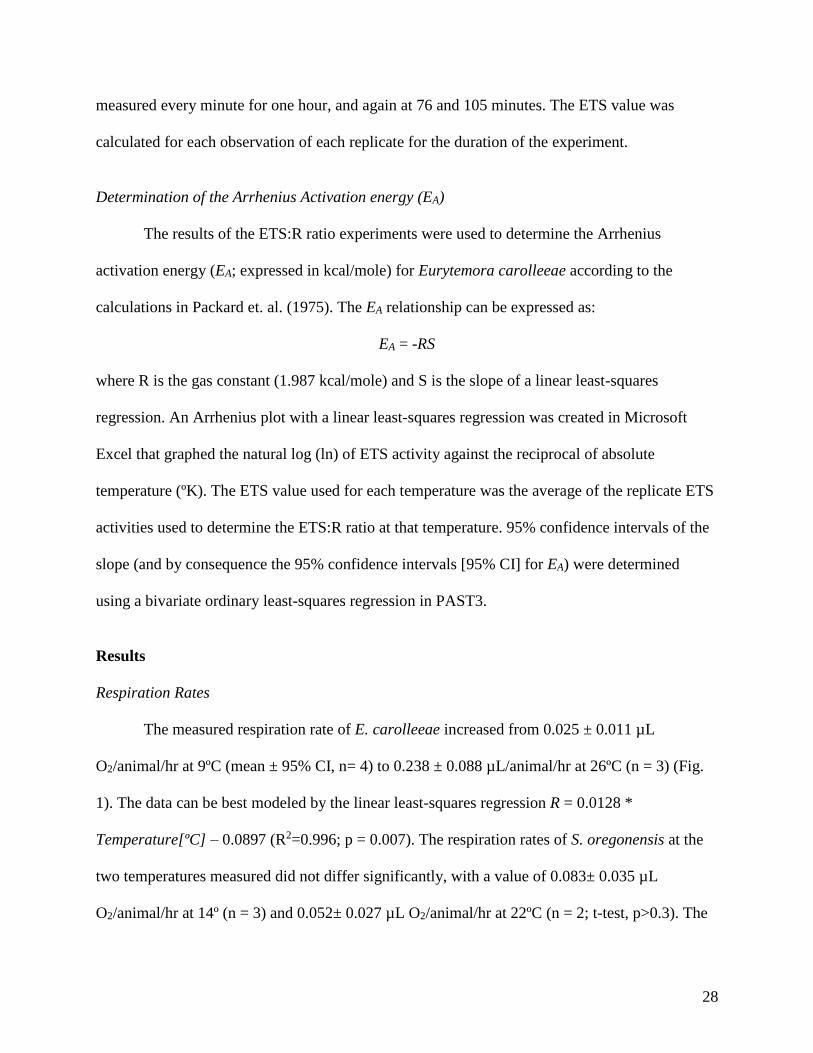
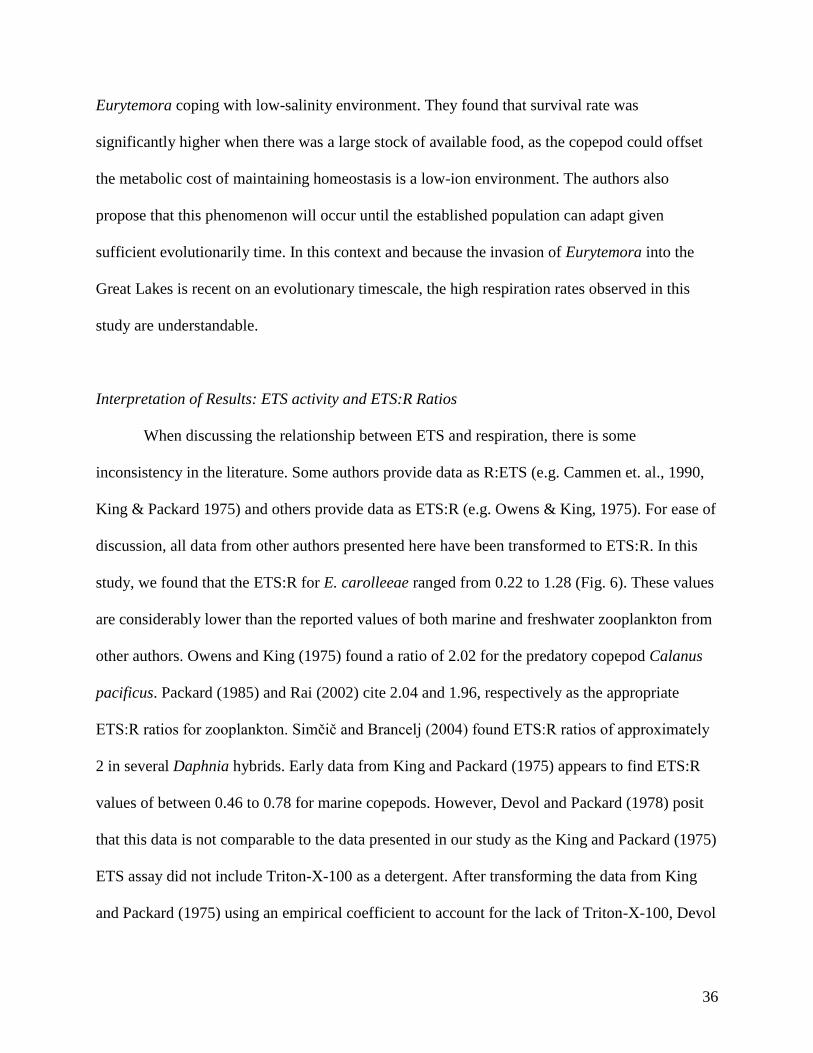
Effect of the respiration experiment on ETS activity
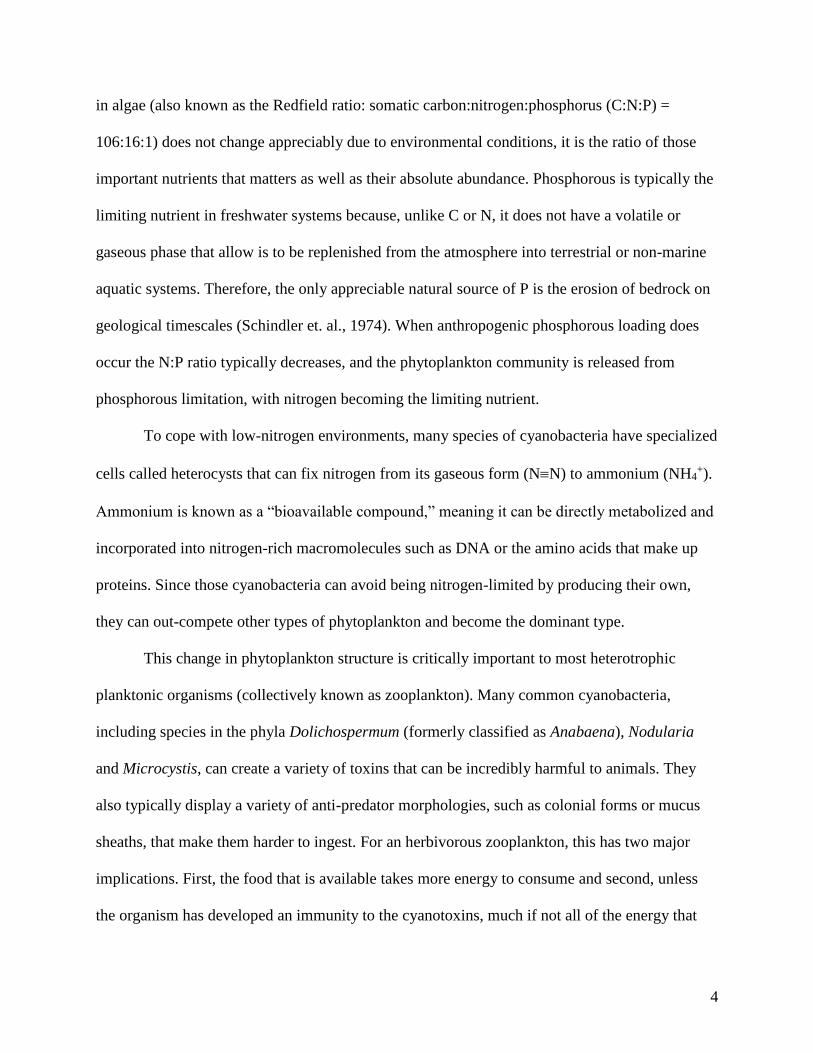
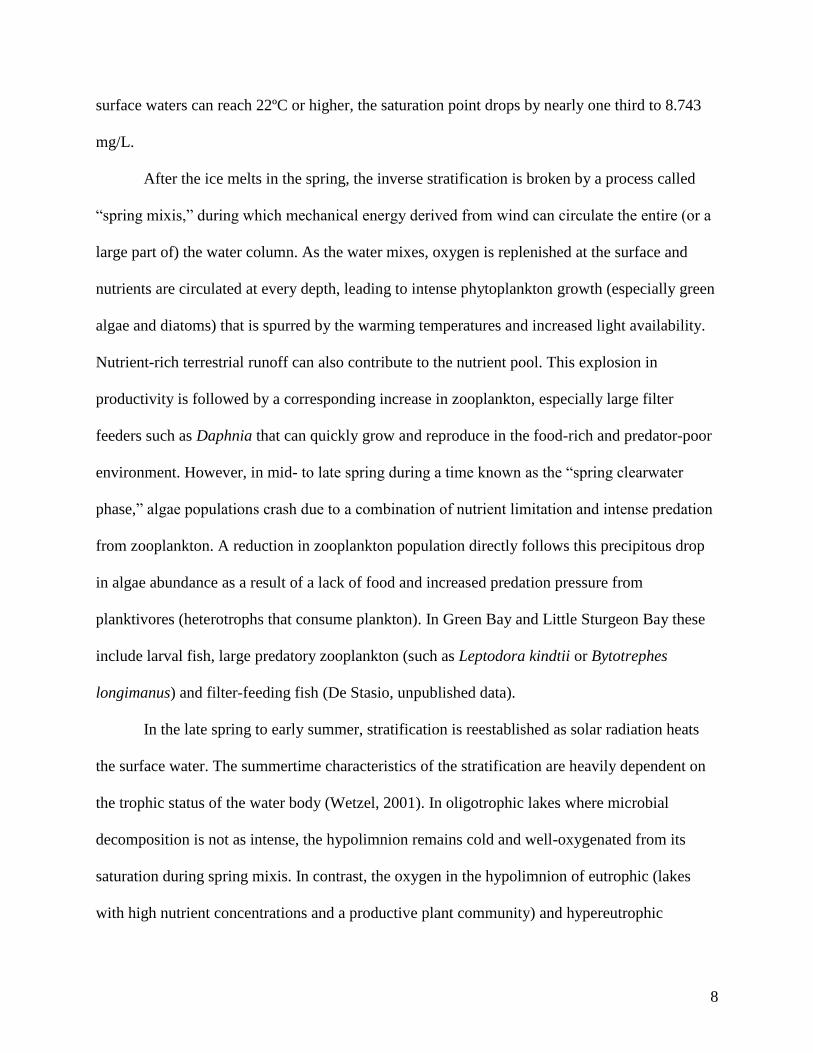
To determine the effect (if any) of the respiration experiment on calculated ETS activity
in E. carolleeae, the ETS activity of animals used in respiration experiments was compared to
those animals that had not been used in respiration experiments (Fig. 2). There was no significant
difference between groups at either temperature (t-tests; both p>0.05).
0
0.05
0.1
0.15
0.2
0.25
0.3
0.35
0 5 10 15 20 25 30
Res
pir
atio
n
(µL
O2/a
nim
al/h
r)
Temperature (ºC)
E. carolleeae S. oregonensis
30
Figure 2. Calculated ETS activity in E. carolleeae for batches of individuals (N = 23 individuals per
sample) that were used in respiration experiments (xº Resp) compared to those not used in respiration
experiments (xº No Resp) at 18º and 22ºC. Error bars represent 95% confidence intervals (sample n > 4).
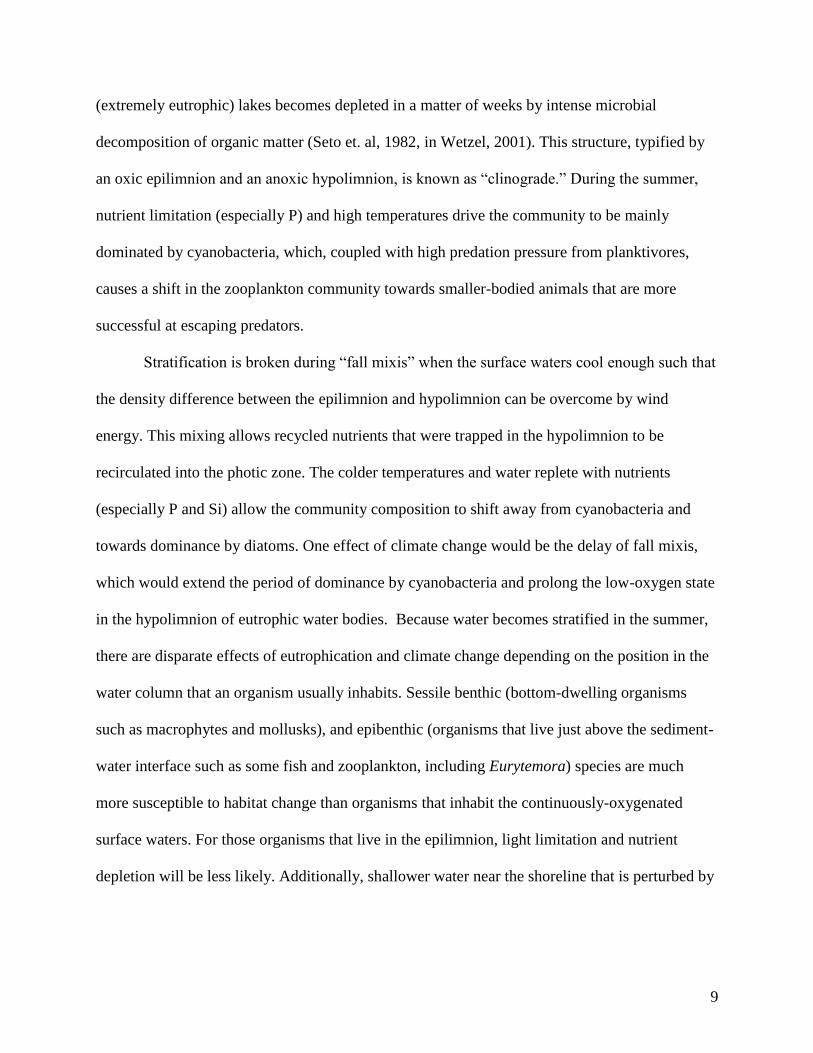
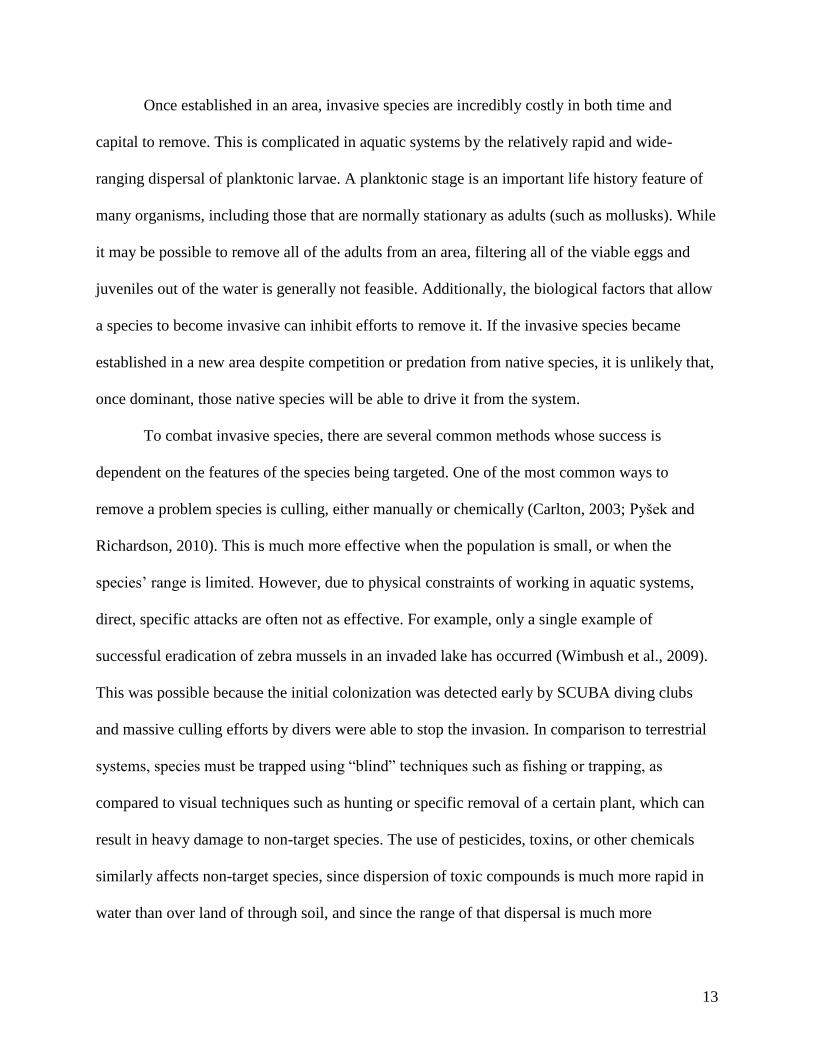
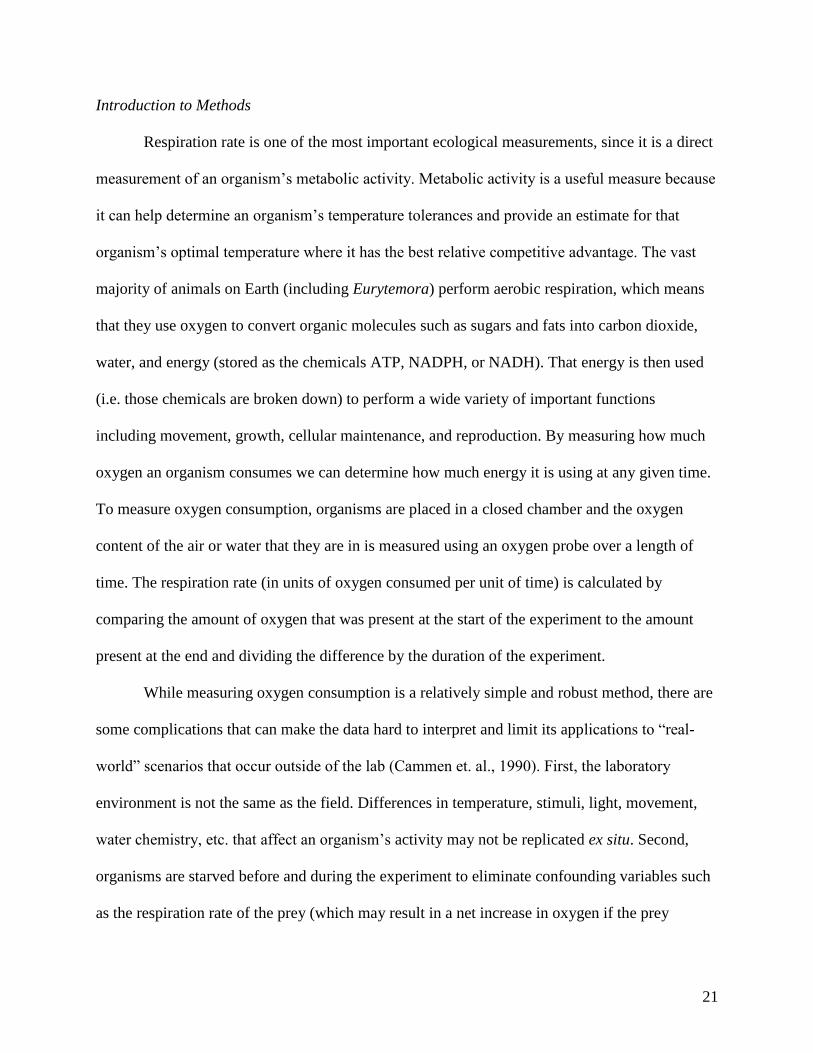
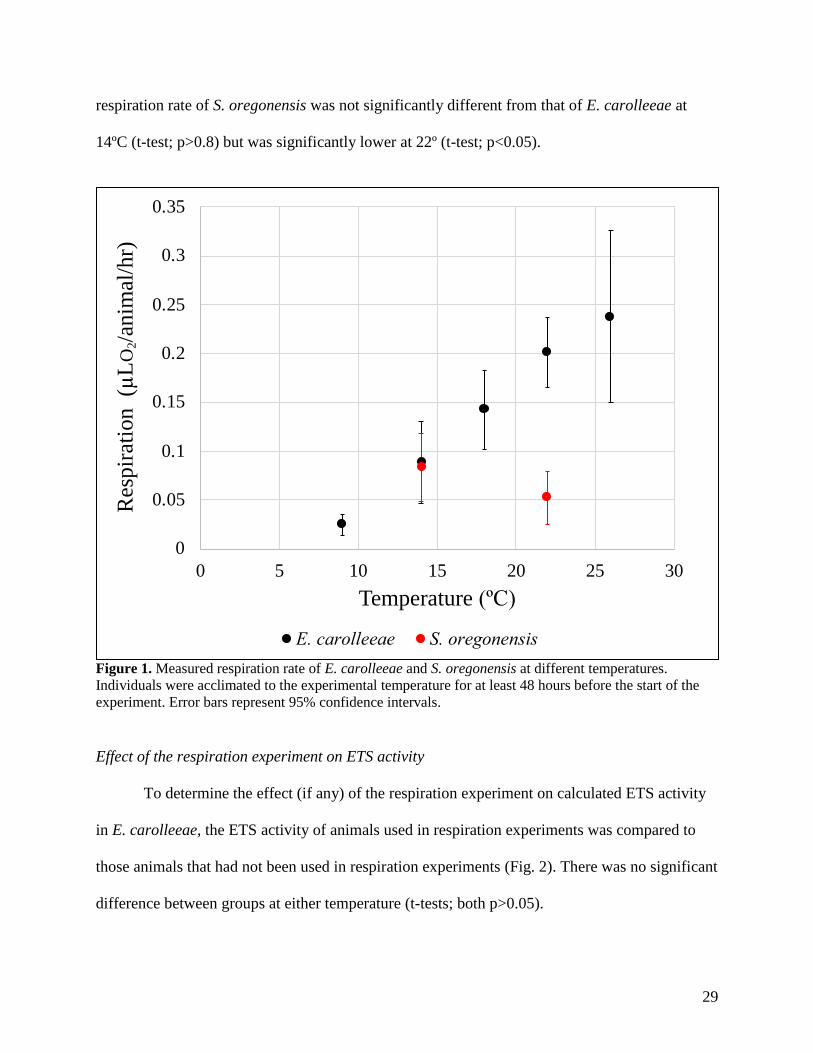
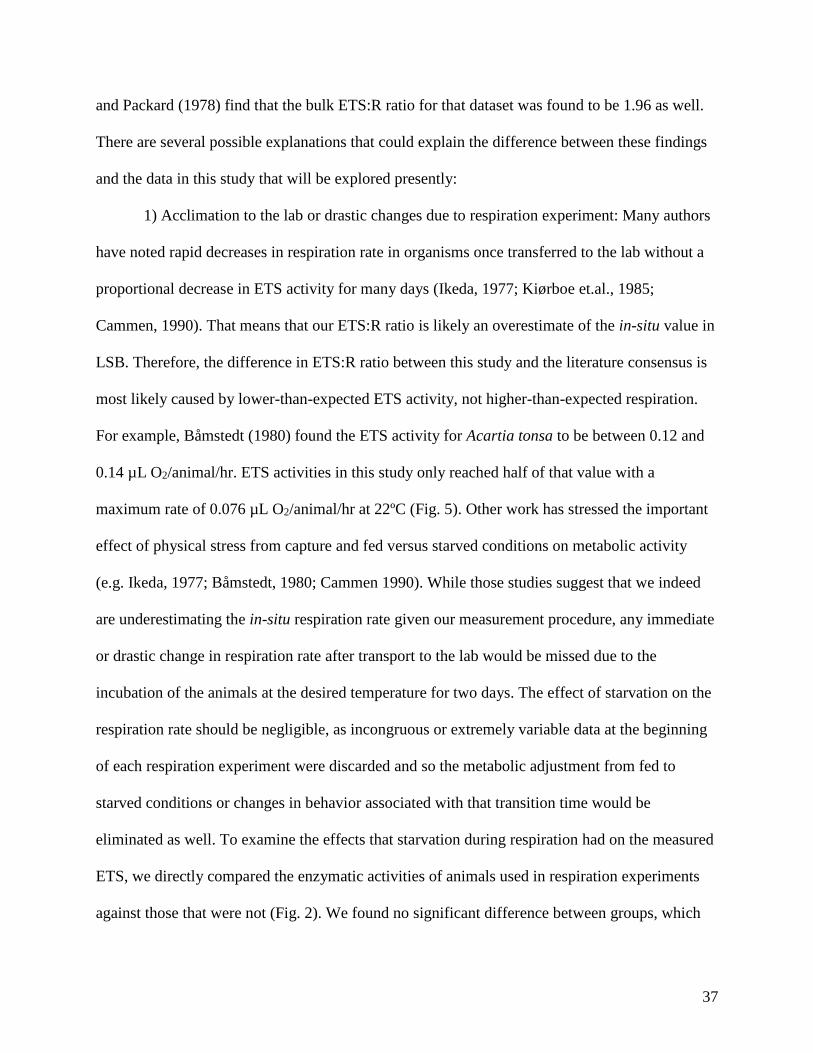
Incubation time and dilution
To determine if homogenate dilution was necessary (i.e. if the ETS enzymes consumed
enough NADH, NADPH, or INT to become unsaturated during the course of the experiment),
we drastically increased the amount of ETS enzymes above any reasonable experimental value
for 20-30 copepods and allowed the experiment to progress for much longer than suggested by
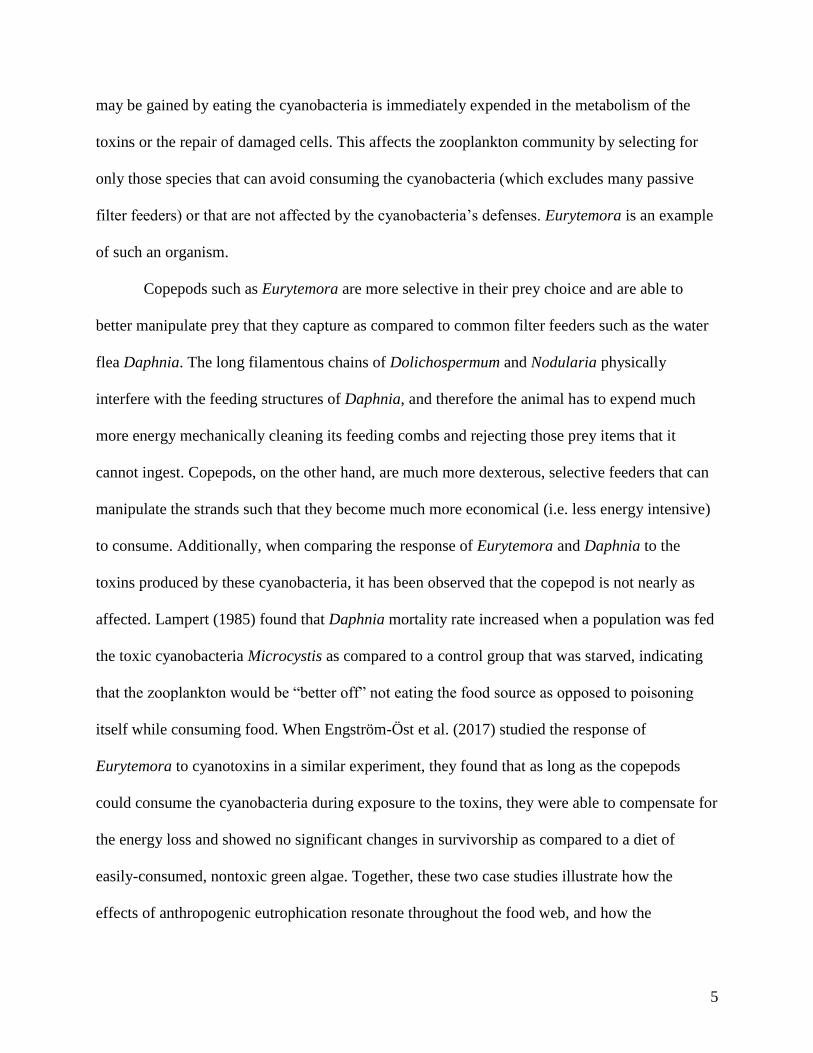
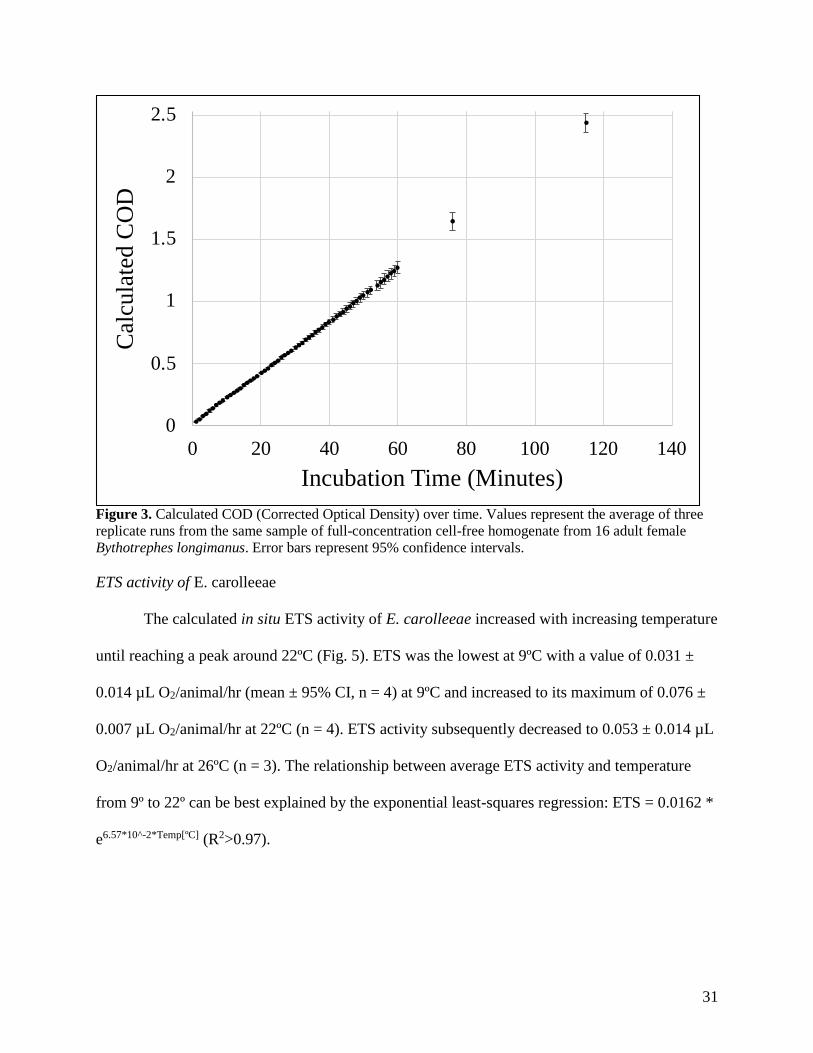
other authors. The calculated COD (corrected optical density) increased with time (Fig. 3) and
can be most accurately described by a linear least-squares regression (R2=0.9995). The
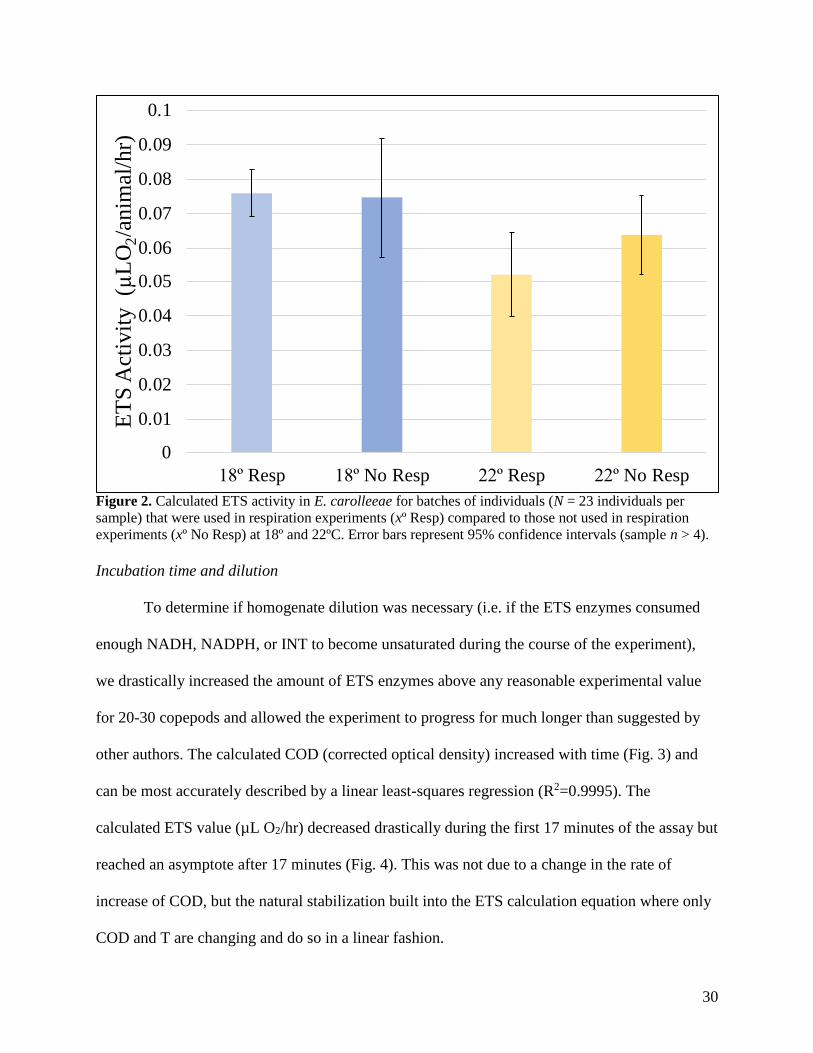
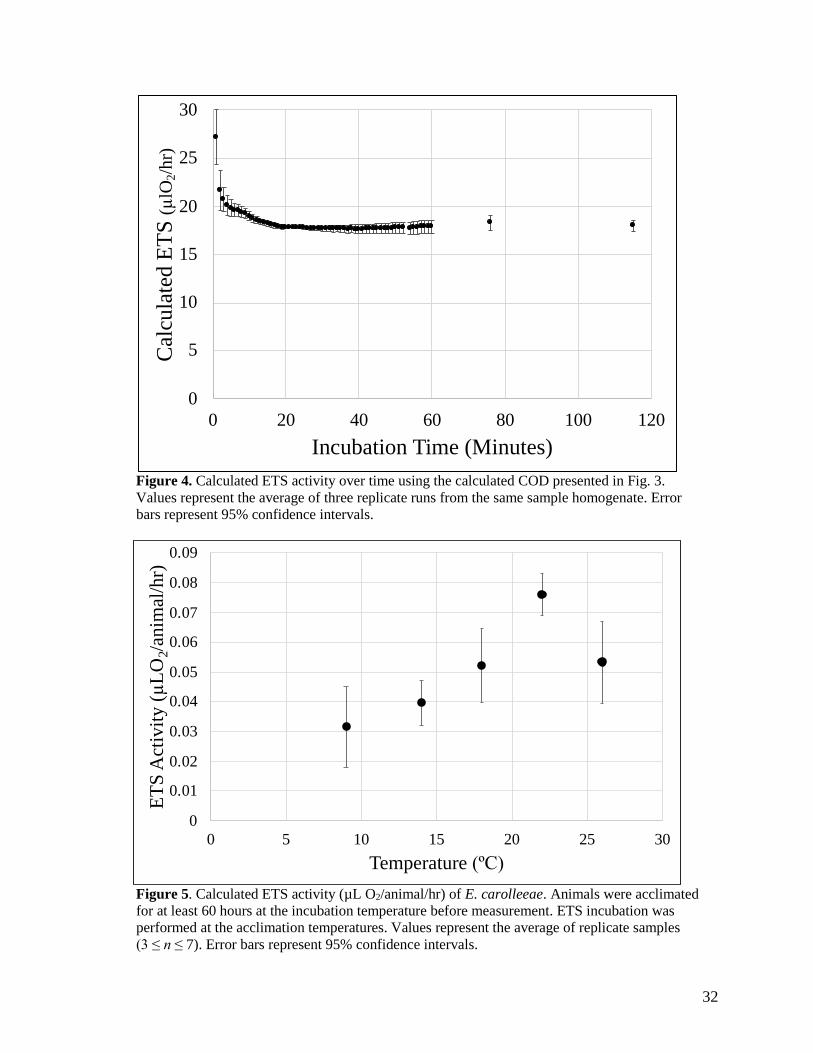
calculated ETS value (µL O2/hr) decreased drastically during the first 17 minutes of the assay but
reached an asymptote after 17 minutes (Fig. 4). This was not due to a change in the rate of
increase of COD, but the natural stabilization built into the ETS calculation equation where only
COD and T are changing and do so in a linear fashion.
0
0.01
0.02
0.03
0.04
0.05
0.06
0.07
0.08
0.09
0.1
18º Resp 18º No Resp 22º Resp 22º No Resp
ET
S A
ctiv
ity
(µ
LO
2/a
nim
al/h
r)
31
Figure 3. Calculated COD (Corrected Optical Density) over time. Values represent the average of three
replicate runs from the same sample of full-concentration cell-free homogenate from 16 adult female
Bythotrephes longimanus. Error bars represent 95% confidence intervals.
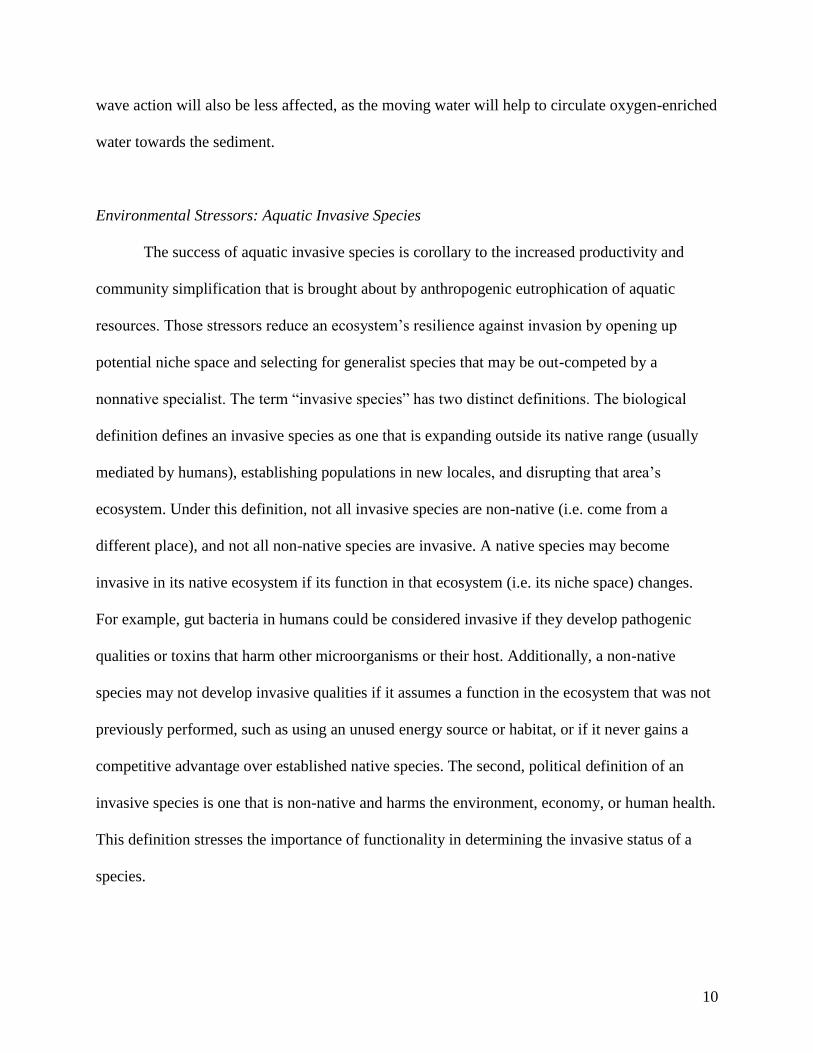
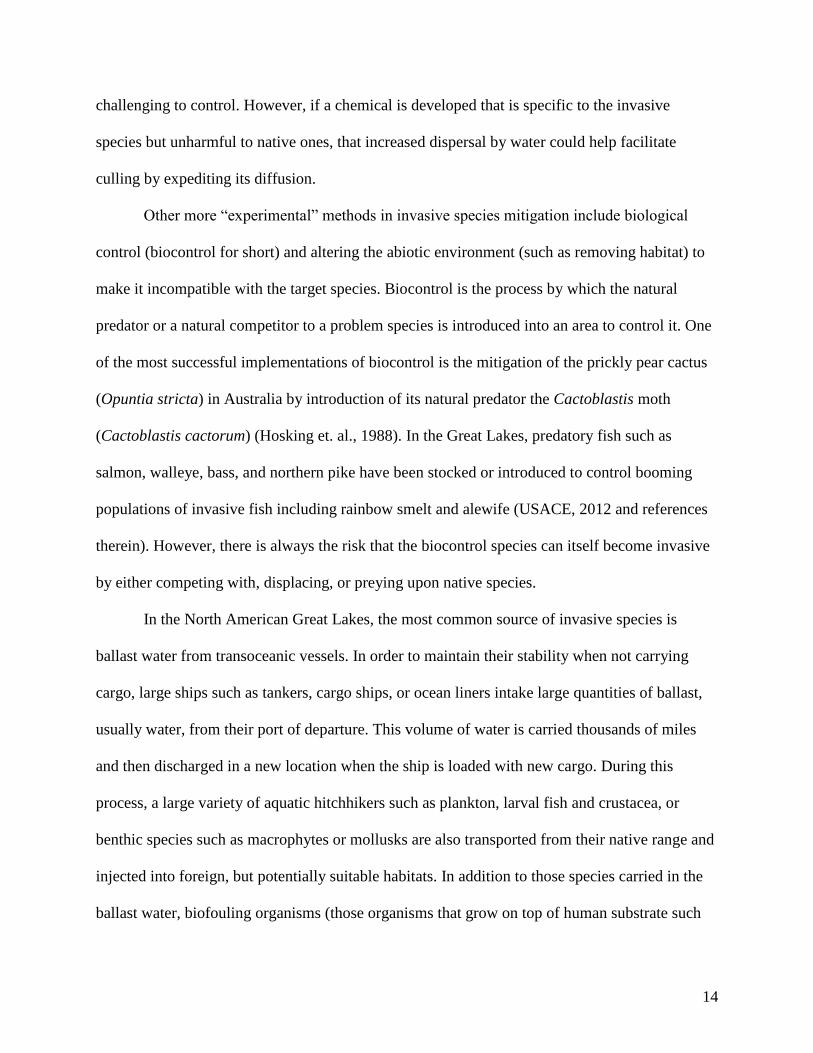
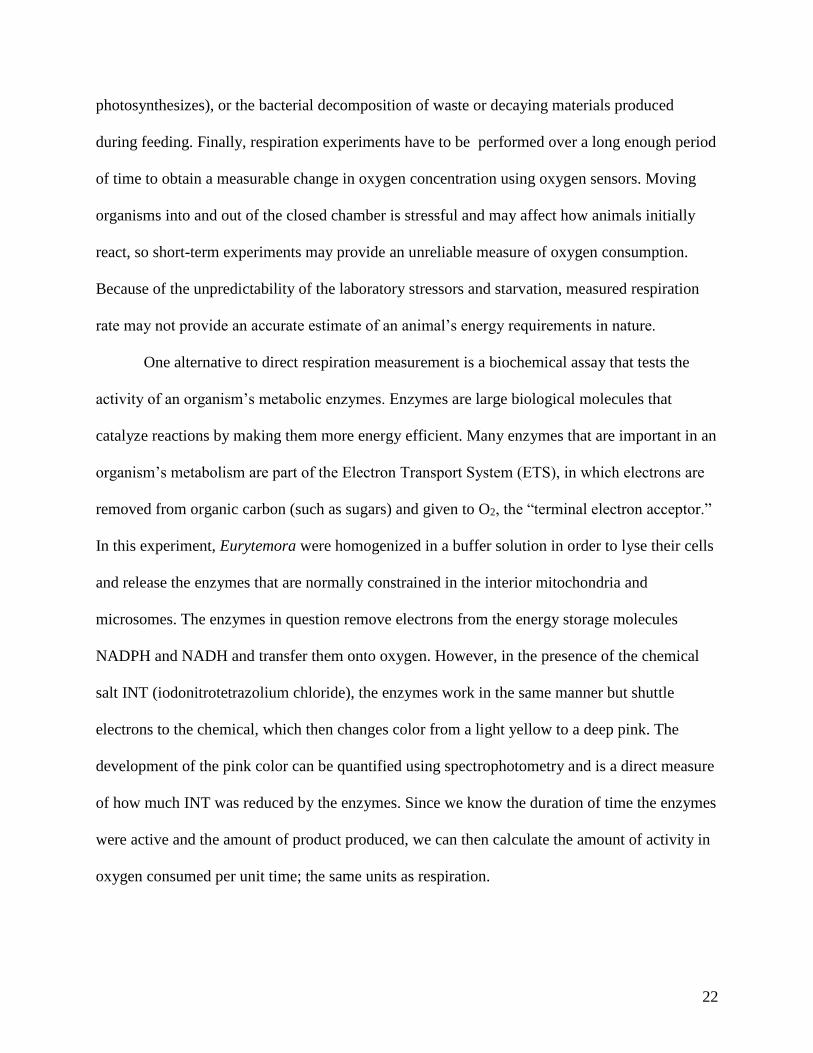
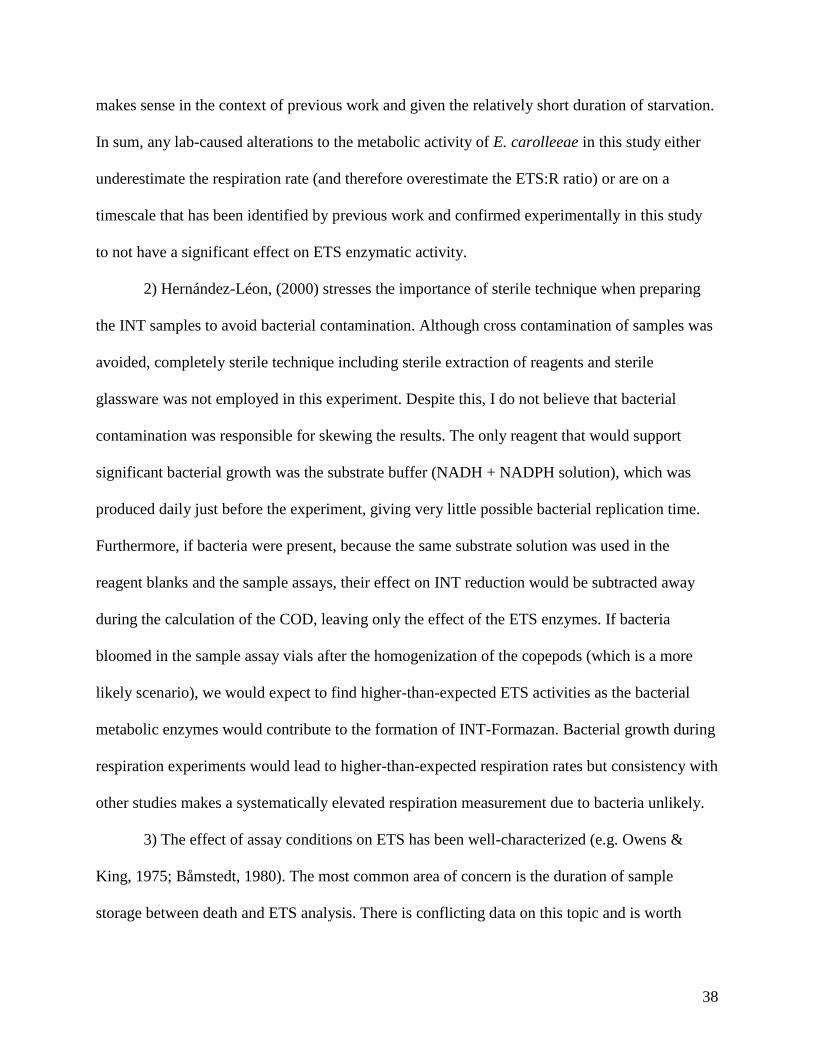
ETS activity of E. carolleeae
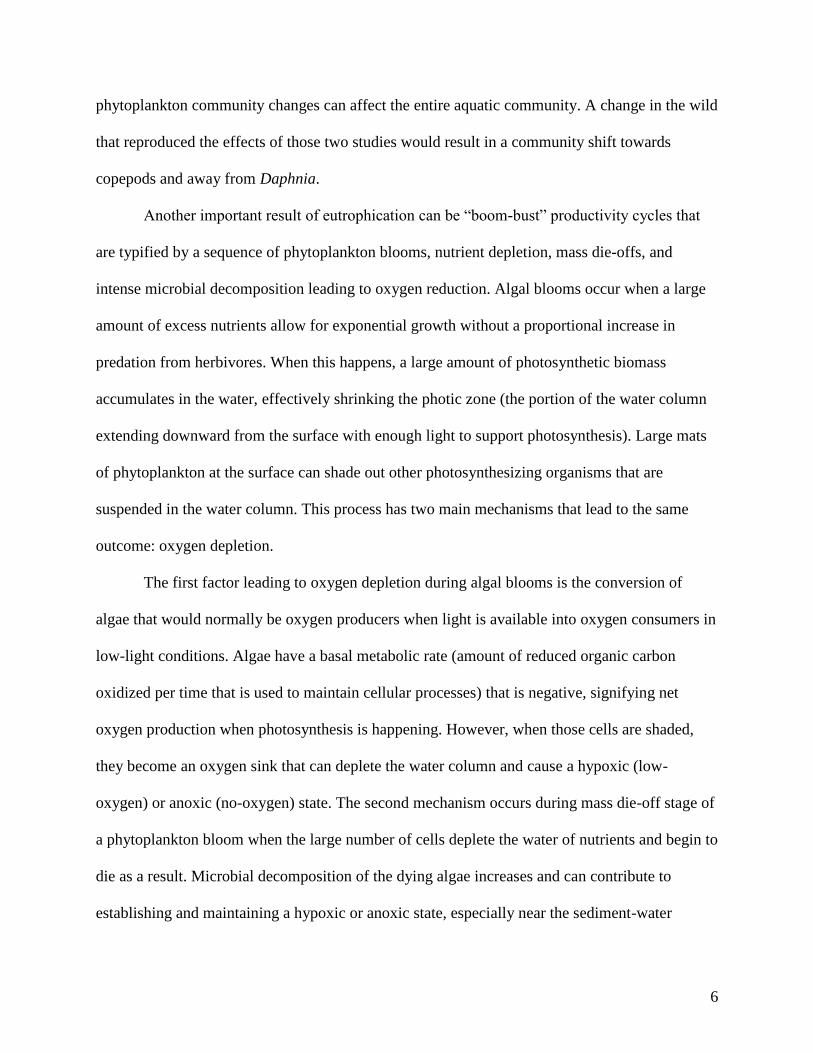
The calculated in situ ETS activity of E. carolleeae increased with increasing temperature
until reaching a peak around 22ºC (Fig. 5). ETS was the lowest at 9ºC with a value of 0.031 ±
0.014 µL O2/animal/hr (mean ± 95% CI, n = 4) at 9ºC and increased to its maximum of 0.076 ±
0.007 µL O2/animal/hr at 22ºC (n = 4). ETS activity subsequently decreased to 0.053 ± 0.014 µL
O2/animal/hr at 26ºC (n = 3). The relationship between average ETS activity and temperature
from 9º to 22º can be best explained by the exponential least-squares regression: ETS = 0.0162 *
e6.57*10^-2*Temp[ºC] (R2>0.97).
0
0.5
1
1.5
2
2.5
0 20 40 60 80 100 120 140
Cal
cula
ted C
OD
Incubation Time (Minutes)
32
Figure 4. Calculated ETS activity over time using the calculated COD presented in Fig. 3.
Values represent the average of three replicate runs from the same sample homogenate. Error
bars represent 95% confidence intervals.
Figure 5. Calculated ETS activity (µL O2/animal/hr) of E. carolleeae. Animals were acclimated
for at least 60 hours at the incubation temperature before measurement. ETS incubation was
performed at the acclimation temperatures. Values represent the average of replicate samples
(3 ≤ n ≤ 7). Error bars represent 95% confidence intervals.
0
5
10
15
20
25
30
0 20 40 60 80 100 120
Cal
cula
ted
ET
S (
µlO
2/h
r)
Incubation Time (Minutes)
0
0.01
0.02
0.03
0.04
0.05
0.06
0.07
0.08
0.09
0 5 10 15 20 25 30
ET
S A
ctiv
ity
(µ
LO
2/a
nim
al/h
r)
Temperature (ºC)
33
Calculation of the ETS:Respiration Ratio
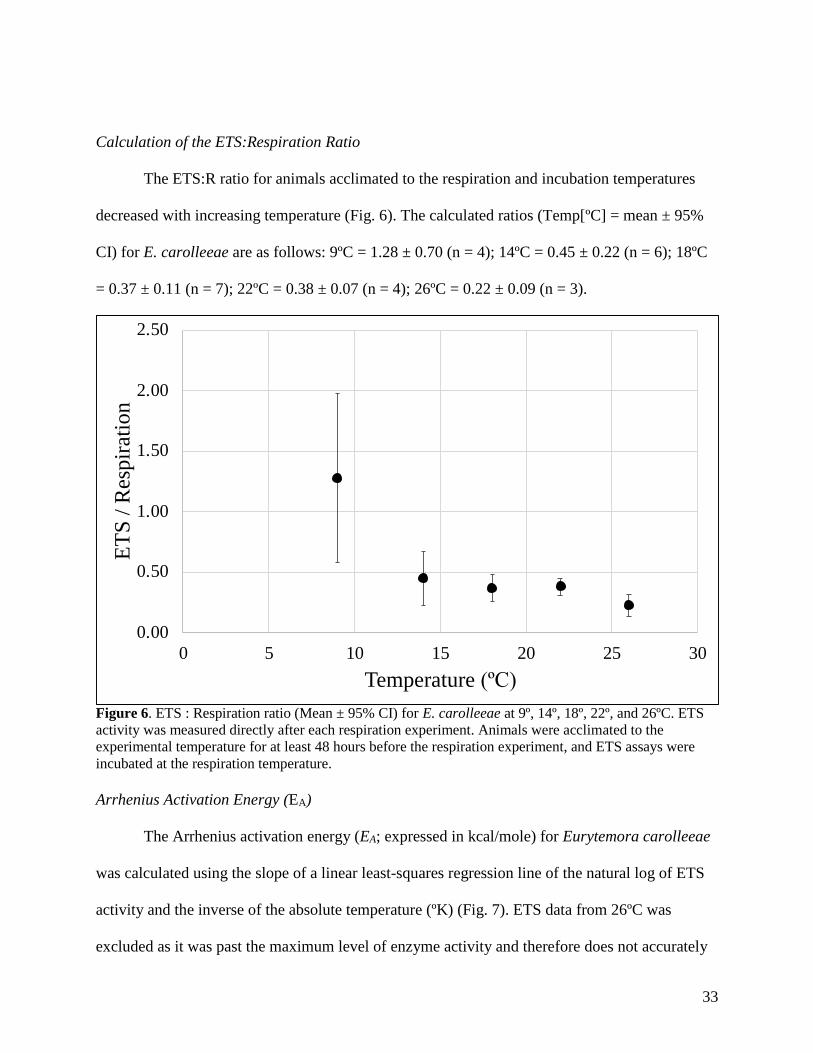
The ETS:R ratio for animals acclimated to the respiration and incubation temperatures
decreased with increasing temperature (Fig. 6). The calculated ratios (Temp[ºC] = mean ± 95%
CI) for E. carolleeae are as follows: 9ºC = 1.28 ± 0.70 (n = 4); 14ºC = 0.45 ± 0.22 (n = 6); 18ºC
= 0.37 ± 0.11 (n = 7); 22ºC = 0.38 ± 0.07 (n = 4); 26ºC = 0.22 ± 0.09 (n = 3).
Figure 6. ETS : Respiration ratio (Mean ± 95% CI) for E. carolleeae at 9º, 14º, 18º, 22º, and 26ºC. ETS
activity was measured directly after each respiration experiment. Animals were acclimated to the
experimental temperature for at least 48 hours before the respiration experiment, and ETS assays were
incubated at the respiration temperature.
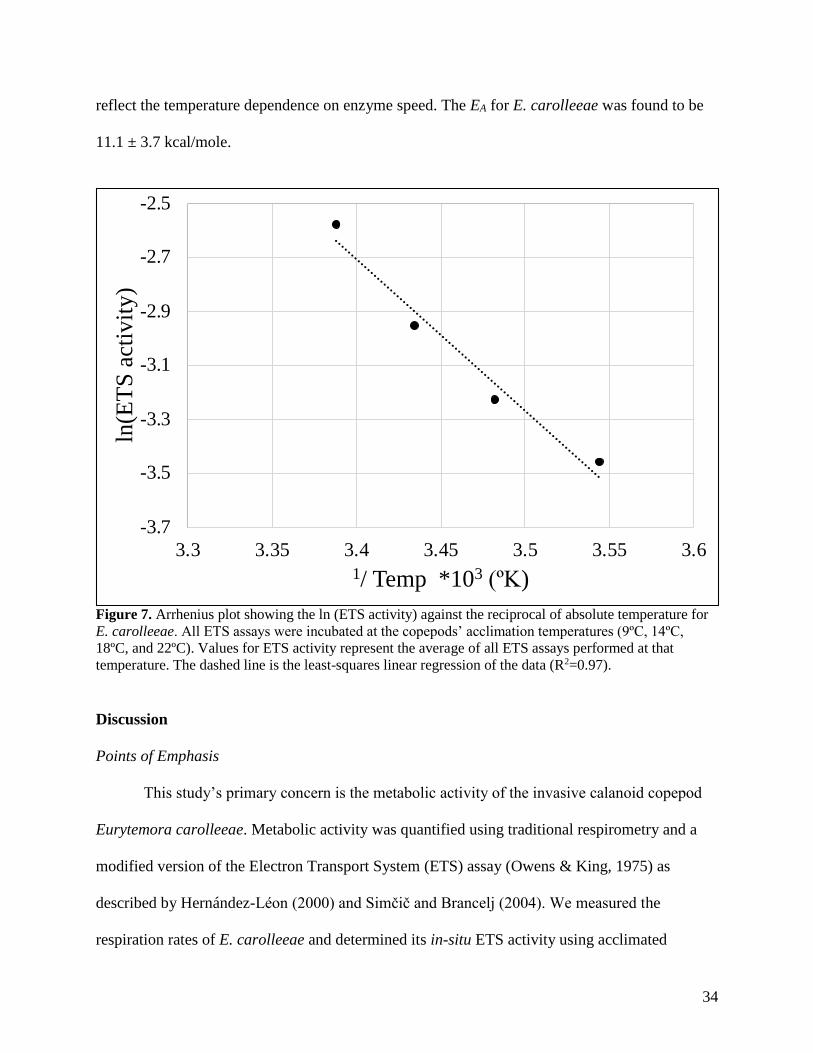
Arrhenius Activation Energy (EA)
The Arrhenius activation energy (EA; expressed in kcal/mole) for Eurytemora carolleeae
was calculated using the slope of a linear least-squares regression line of the natural log of ETS
activity and the inverse of the absolute temperature (ºK) (Fig. 7). ETS data from 26ºC was
excluded as it was past the maximum level of enzyme activity and therefore does not accurately
0.00
0.50
1.00
1.50
2.00
2.50
0 5 10 15 20 25 30
ET
S /
Res
pir
atio
n
Temperature (ºC)
34
reflect the temperature dependence on enzyme speed. The EA for E. carolleeae was found to be
11.1 ± 3.7 kcal/mole.
Figure 7. Arrhenius plot showing the ln (ETS activity) against the reciprocal of absolute temperature for
E. carolleeae. All ETS assays were incubated at the copepods’ acclimation temperatures (9ºC, 14ºC,
18ºC, and 22ºC). Values for ETS activity represent the average of all ETS assays performed at that
temperature. The dashed line is the least-squares linear regression of the data (R2=0.97).
Discussion
Points of Emphasis
This study’s primary concern is the metabolic activity of the invasive calanoid copepod
Eurytemora carolleeae. Metabolic activity was quantified using traditional respirometry and a
modified version of the Electron Transport System (ETS) assay (Owens & King, 1975) as
described by Hernández-Léon (2000) and Simčič and Brancelj (2004). We measured the
respiration rates of E. carolleeae and determined its in-situ ETS activity using acclimated
-3.7
-3.5
-3.3
-3.1
-2.9
-2.7
-2.5
3.3 3.35 3.4 3.45 3.5 3.55 3.6
ln(E
TS
act
ivit
y)
1/ Temp *103 (ºK)
35
animals over a range of temperatures from 9º to 26ºC. From these measurements, we determined
the Arrhenius activation energy EA for the copepod’s metabolic enzymes. Several method-
proofing and control experiments were performed as robustness checks on the ETS procedure to
determine significant sources of error, optimize it for the system of interest, and to test the
reliability of ETS activity as a proxy in-situ respiration. A long-term goal of this research is to
assess how anthropogenic perturbations to the Green Bay – Little Sturgeon Bay system may
affect the success of E. carolleeae in relation to its native competitors.
Interpretation of Results: Respiration Rate
Respiration rates for E. carolleeae and S. oregonensis in this experiment compare well
with the range of values in previously published studies. In their 1999 study, Adrian et. al.
measured respiration rates of marine Baltic E. affinis that ranged from 0.04 µL O2/animal/hr at
6ºC and 0.3 µL O2/animal/hr at 18ºC. A summary of respiration data in Lampert (1984) exhibited
respiration rates between 0.01 and 0.22 µL O2/animal/hr for several copepod species at
temperatures ranging from 15º to 20ºC. However, most species in that temperature range had
measured respiration rates between 0.05 and 0.1. Values greater than 0.1 were observed in larger
species such as Aglaodiaptomus leptopus and Limnocalanus macrurus. Richman (1958, in
Lampert 1984) measured the respiration rate of S. oregonensis to be 0.090 µL O2/animal/hr. at
22ºC, which is well within the confidence intervals of our data at that temperature.
The respiration rate of Eurytemora species presented in this study and reported by Adrian
et. al. (1999) are consistent, but they are higher than most other species, especially at higher
temperatures. This may be explained in part by the organisms’ life history and recent invasion
into fresh water from its native brackish habitat (Mills, 1993 and Kipp, 2006). Lee et. al. (2013)
found that food abundance was an important determinant of the survival rate of North American
36
Eurytemora coping with low-salinity environment. They found that survival rate was
significantly higher when there was a large stock of available food, as the copepod could offset
the metabolic cost of maintaining homeostasis is a low-ion environment. The authors also
propose that this phenomenon will occur until the established population can adapt given
sufficient evolutionarily time. In this context and because the invasion of Eurytemora into the
Great Lakes is recent on an evolutionary timescale, the high respiration rates observed in this
study are understandable.
Interpretation of Results: ETS activity and ETS:R Ratios
When discussing the relationship between ETS and respiration, there is some
inconsistency in the literature. Some authors provide data as R:ETS (e.g. Cammen et. al., 1990,
King & Packard 1975) and others provide data as ETS:R (e.g. Owens & King, 1975). For ease of
discussion, all data from other authors presented here have been transformed to ETS:R. In this
study, we found that the ETS:R for E. carolleeae ranged from 0.22 to 1.28 (Fig. 6). These values
are considerably lower than the reported values of both marine and freshwater zooplankton from
other authors. Owens and King (1975) found a ratio of 2.02 for the predatory copepod Calanus
pacificus. Packard (1985) and Rai (2002) cite 2.04 and 1.96, respectively as the appropriate
ETS:R ratios for zooplankton. Simčič and Brancelj (2004) found ETS:R ratios of approximately
2 in several Daphnia hybrids. Early data from King and Packard (1975) appears to find ETS:R
values of between 0.46 to 0.78 for marine copepods. However, Devol and Packard (1978) posit
that this data is not comparable to the data presented in our study as the King and Packard (1975)
ETS assay did not include Triton-X-100 as a detergent. After transforming the data from King
and Packard (1975) using an empirical coefficient to account for the lack of Triton-X-100, Devol
37
and Packard (1978) find that the bulk ETS:R ratio for that dataset was found to be 1.96 as well.
There are several possible explanations that could explain the difference between these findings
and the data in this study that will be explored presently:
1) Acclimation to the lab or drastic changes due to respiration experiment: Many authors
have noted rapid decreases in respiration rate in organisms once transferred to the lab without a
proportional decrease in ETS activity for many days (Ikeda, 1977; Kiørboe et.al., 1985;
Cammen, 1990). That means that our ETS:R ratio is likely an overestimate of the in-situ value in
LSB. Therefore, the difference in ETS:R ratio between this study and the literature consensus is
most likely caused by lower-than-expected ETS activity, not higher-than-expected respiration.
For example, Båmstedt (1980) found the ETS activity for Acartia tonsa to be between 0.12 and
0.14 µL O2/animal/hr. ETS activities in this study only reached half of that value with a
maximum rate of 0.076 µL O2/animal/hr at 22ºC (Fig. 5). Other work has stressed the important
effect of physical stress from capture and fed versus starved conditions on metabolic activity
(e.g. Ikeda, 1977; Båmstedt, 1980; Cammen 1990). While those studies suggest that we indeed
are underestimating the in-situ respiration rate given our measurement procedure, any immediate
or drastic change in respiration rate after transport to the lab would be missed due to the
incubation of the animals at the desired temperature for two days. The effect of starvation on the
respiration rate should be negligible, as incongruous or extremely variable data at the beginning
of each respiration experiment were discarded and so the metabolic adjustment from fed to
starved conditions or changes in behavior associated with that transition time would be
eliminated as well. To examine the effects that starvation during respiration had on the measured
ETS, we directly compared the enzymatic activities of animals used in respiration experiments
against those that were not (Fig. 2). We found no significant difference between groups, which
38
makes sense in the context of previous work and given the relatively short duration of starvation.
In sum, any lab-caused alterations to the metabolic activity of E. carolleeae in this study either
underestimate the respiration rate (and therefore overestimate the ETS:R ratio) or are on a
timescale that has been identified by previous work and confirmed experimentally in this study
to not have a significant effect on ETS enzymatic activity.
2) Hernández-Léon, (2000) stresses the importance of sterile technique when preparing
the INT samples to avoid bacterial contamination. Although cross contamination of samples was
avoided, completely sterile technique including sterile extraction of reagents and sterile
glassware was not employed in this experiment. Despite this, I do not believe that bacterial
contamination was responsible for skewing the results. The only reagent that would support
significant bacterial growth was the substrate buffer (NADH + NADPH solution), which was
produced daily just before the experiment, giving very little possible bacterial replication time.
Furthermore, if bacteria were present, because the same substrate solution was used in the
reagent blanks and the sample assays, their effect on INT reduction would be subtracted away
during the calculation of the COD, leaving only the effect of the ETS enzymes. If bacteria
bloomed in the sample assay vials after the homogenization of the copepods (which is a more
likely scenario), we would expect to find higher-than-expected ETS activities as the bacterial
metabolic enzymes would contribute to the formation of INT-Formazan. Bacterial growth during
respiration experiments would lead to higher-than-expected respiration rates but consistency with
other studies makes a systematically elevated respiration measurement due to bacteria unlikely.
3) The effect of assay conditions on ETS has been well-characterized (e.g. Owens &
King, 1975; Båmstedt, 1980). The most common area of concern is the duration of sample
storage between death and ETS analysis. There is conflicting data on this topic and is worth
39
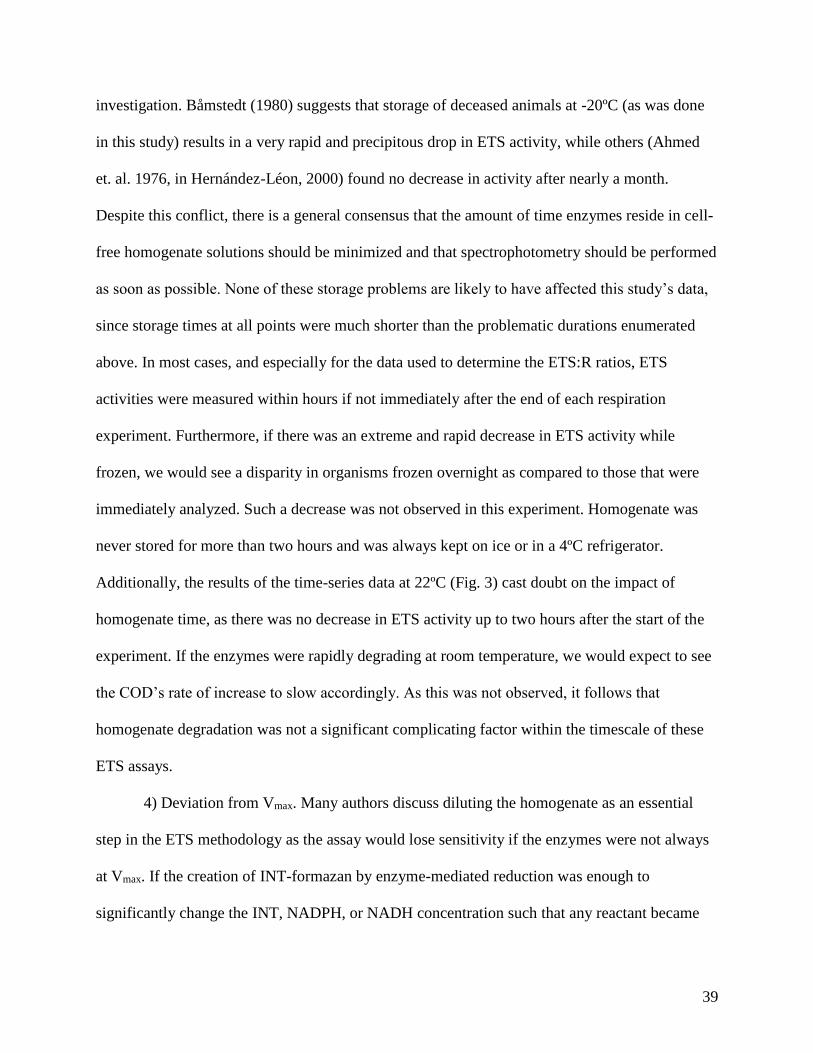
investigation. Båmstedt (1980) suggests that storage of deceased animals at -20ºC (as was done
in this study) results in a very rapid and precipitous drop in ETS activity, while others (Ahmed
et. al. 1976, in Hernández-Léon, 2000) found no decrease in activity after nearly a month.
Despite this conflict, there is a general consensus that the amount of time enzymes reside in cell-
free homogenate solutions should be minimized and that spectrophotometry should be performed
as soon as possible. None of these storage problems are likely to have affected this study’s data,
since storage times at all points were much shorter than the problematic durations enumerated
above. In most cases, and especially for the data used to determine the ETS:R ratios, ETS
activities were measured within hours if not immediately after the end of each respiration
experiment. Furthermore, if there was an extreme and rapid decrease in ETS activity while
frozen, we would see a disparity in organisms frozen overnight as compared to those that were
immediately analyzed. Such a decrease was not observed in this experiment. Homogenate was
never stored for more than two hours and was always kept on ice or in a 4ºC refrigerator.
Additionally, the results of the time-series data at 22ºC (Fig. 3) cast doubt on the impact of
homogenate time, as there was no decrease in ETS activity up to two hours after the start of the
experiment. If the enzymes were rapidly degrading at room temperature, we would expect to see
the COD’s rate of increase to slow accordingly. As this was not observed, it follows that
homogenate degradation was not a significant complicating factor within the timescale of these
ETS assays.
4) Deviation from Vmax. Many authors discuss diluting the homogenate as an essential
step in the ETS methodology as the assay would lose sensitivity if the enzymes were not always
at Vmax. If the creation of INT-formazan by enzyme-mediated reduction was enough to
significantly change the INT, NADPH, or NADH concentration such that any reactant became
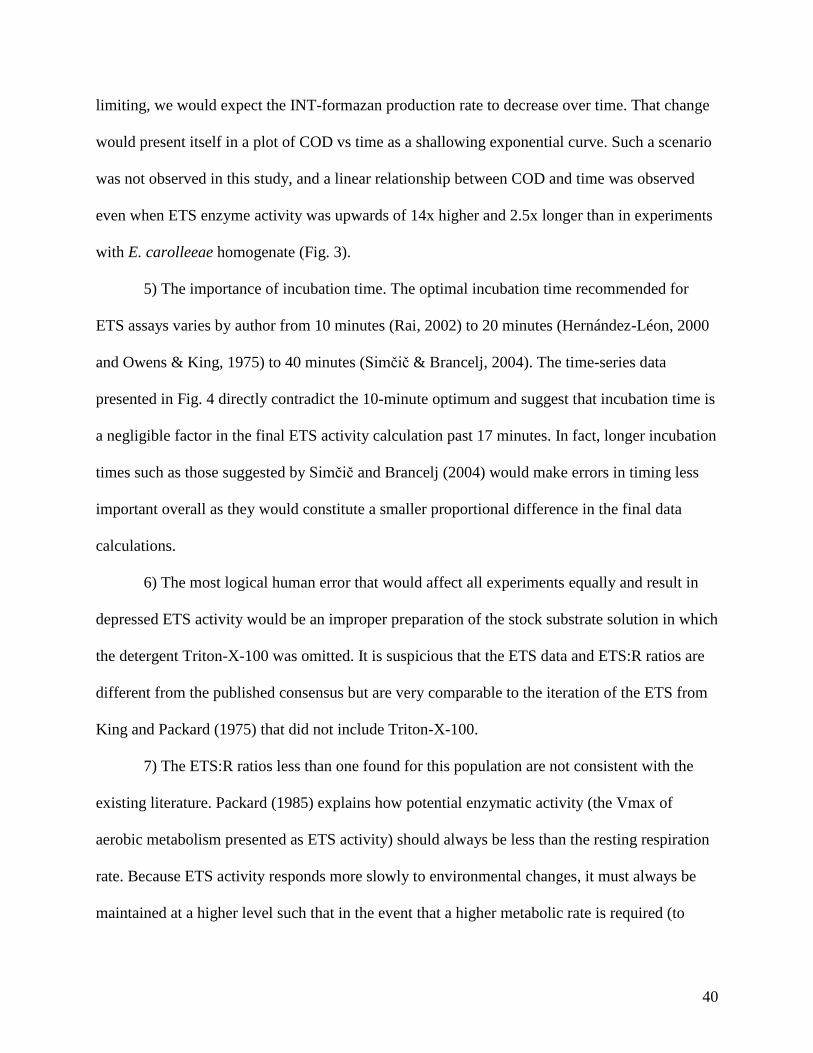
40
limiting, we would expect the INT-formazan production rate to decrease over time. That change
would present itself in a plot of COD vs time as a shallowing exponential curve. Such a scenario
was not observed in this study, and a linear relationship between COD and time was observed
even when ETS enzyme activity was upwards of 14x higher and 2.5x longer than in experiments
with E. carolleeae homogenate (Fig. 3).
5) The importance of incubation time. The optimal incubation time recommended for
ETS assays varies by author from 10 minutes (Rai, 2002) to 20 minutes (Hernández-Léon, 2000
and Owens & King, 1975) to 40 minutes (Simčič & Brancelj, 2004). The time-series data
presented in Fig. 4 directly contradict the 10-minute optimum and suggest that incubation time is
a negligible factor in the final ETS activity calculation past 17 minutes. In fact, longer incubation
times such as those suggested by Simčič and Brancelj (2004) would make errors in timing less
important overall as they would constitute a smaller proportional difference in the final data
calculations.
6) The most logical human error that would affect all experiments equally and result in
depressed ETS activity would be an improper preparation of the stock substrate solution in which
the detergent Triton-X-100 was omitted. It is suspicious that the ETS data and ETS:R ratios are
different from the published consensus but are very comparable to the iteration of the ETS from
King and Packard (1975) that did not include Triton-X-100.
7) The ETS:R ratios less than one found for this population are not consistent with the
existing literature. Packard (1985) explains how potential enzymatic activity (the Vmax of
aerobic metabolism presented as ETS activity) should always be less than the resting respiration
rate. Because ETS activity responds more slowly to environmental changes, it must always be
maintained at a higher level such that in the event that a higher metabolic rate is required (to
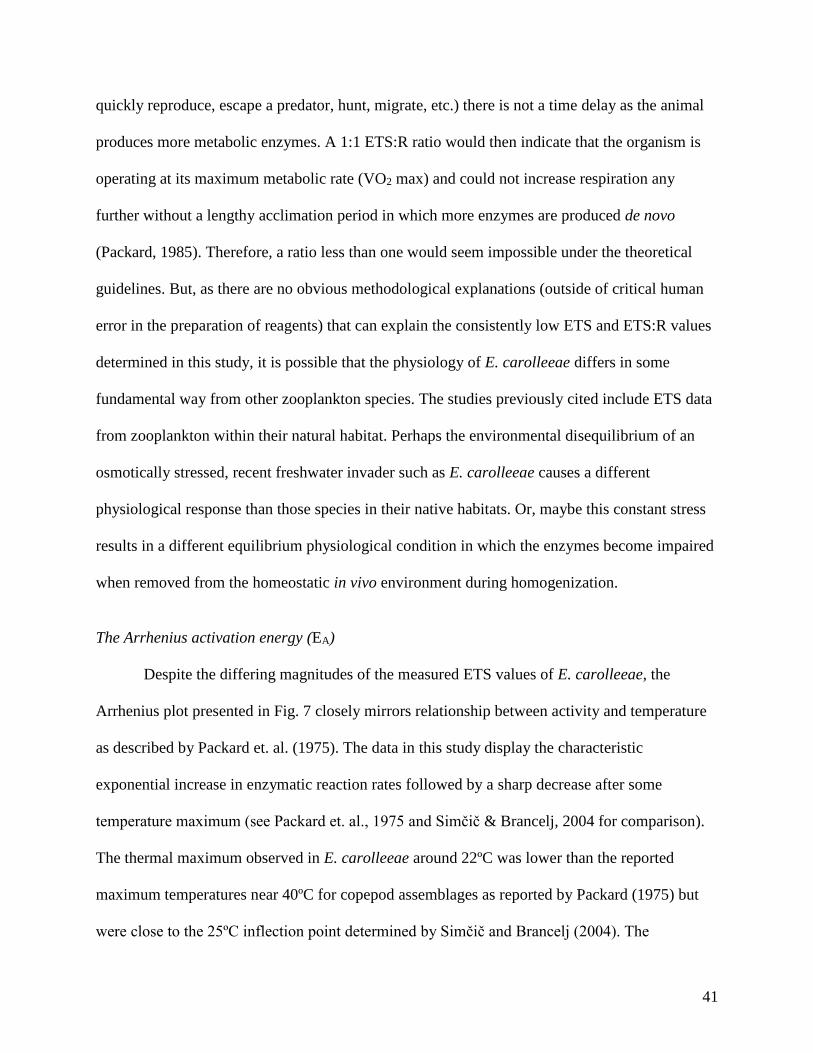
41
quickly reproduce, escape a predator, hunt, migrate, etc.) there is not a time delay as the animal
produces more metabolic enzymes. A 1:1 ETS:R ratio would then indicate that the organism is
operating at its maximum metabolic rate (VO2 max) and could not increase respiration any
further without a lengthy acclimation period in which more enzymes are produced de novo
(Packard, 1985). Therefore, a ratio less than one would seem impossible under the theoretical
guidelines. But, as there are no obvious methodological explanations (outside of critical human
error in the preparation of reagents) that can explain the consistently low ETS and ETS:R values
determined in this study, it is possible that the physiology of E. carolleeae differs in some
fundamental way from other zooplankton species. The studies previously cited include ETS data
from zooplankton within their natural habitat. Perhaps the environmental disequilibrium of an
osmotically stressed, recent freshwater invader such as E. carolleeae causes a different
physiological response than those species in their native habitats. Or, maybe this constant stress
results in a different equilibrium physiological condition in which the enzymes become impaired
when removed from the homeostatic in vivo environment during homogenization.
The Arrhenius activation energy (EA)
Despite the differing magnitudes of the measured ETS values of E. carolleeae, the
Arrhenius plot presented in Fig. 7 closely mirrors relationship between activity and temperature
as described by Packard et. al. (1975). The data in this study display the characteristic
exponential increase in enzymatic reaction rates followed by a sharp decrease after some
temperature maximum (see Packard et. al., 1975 and Simčič & Brancelj, 2004 for comparison).
The thermal maximum observed in E. carolleeae around 22ºC was lower than the reported
maximum temperatures near 40ºC for copepod assemblages as reported by Packard (1975) but
were close to the 25ºC inflection point determined by Simčič and Brancelj (2004). The
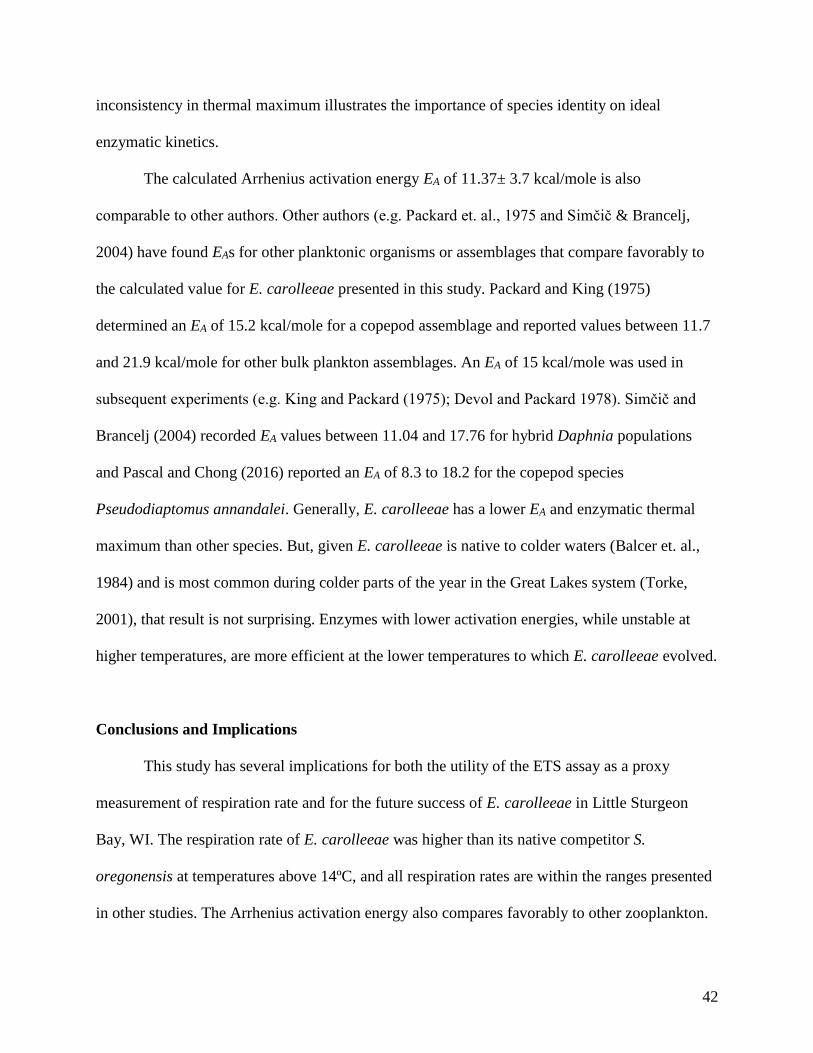
42
inconsistency in thermal maximum illustrates the importance of species identity on ideal
enzymatic kinetics.
The calculated Arrhenius activation energy EA of 11.37± 3.7 kcal/mole is also
comparable to other authors. Other authors (e.g. Packard et. al., 1975 and Simčič & Brancelj,
2004) have found EAs for other planktonic organisms or assemblages that compare favorably to
the calculated value for E. carolleeae presented in this study. Packard and King (1975)
determined an EA of 15.2 kcal/mole for a copepod assemblage and reported values between 11.7
and 21.9 kcal/mole for other bulk plankton assemblages. An EA of 15 kcal/mole was used in
subsequent experiments (e.g. King and Packard (1975); Devol and Packard 1978). Simčič and
Brancelj (2004) recorded EA values between 11.04 and 17.76 for hybrid Daphnia populations
and Pascal and Chong (2016) reported an EA of 8.3 to 18.2 for the copepod species
Pseudodiaptomus annandalei. Generally, E. carolleeae has a lower EA and enzymatic thermal
maximum than other species. But, given E. carolleeae is native to colder waters (Balcer et. al.,
1984) and is most common during colder parts of the year in the Great Lakes system (Torke,
2001), that result is not surprising. Enzymes with lower activation energies, while unstable at
higher temperatures, are more efficient at the lower temperatures to which E. carolleeae evolved.
Conclusions and Implications
This study has several implications for both the utility of the ETS assay as a proxy
measurement of respiration rate and for the future success of E. carolleeae in Little Sturgeon
Bay, WI. The respiration rate of E. carolleeae was higher than its native competitor S.
oregonensis at temperatures above 14ºC, and all respiration rates are within the ranges presented
in other studies. The Arrhenius activation energy also compares favorably to other zooplankton.
43
ETS data suggests that the thermal limit of E. carolleeae is around 22ºC, which supports
previous findings. Although the ETS values and the ETS:R rates determined in this experiment
differ considerably from previously published values, robustness checks in this procedure
eliminate common sources of reduced enzymatic activity, principally activity lost during storage
or during starvation, that were well characterized by other authors. Because E. carolleeae is
native to and most common in colder, brackish environments, the warming trends associated
with climate change may make the copepod less competitive in warm, fresh water due to higher
ambient levels of stress. However, due to the copepod’s ability to consume the toxic
cyanobacteria that are associated with eutrophication, those deficits and extra metabolic
expenditures may be overcome.
References Cited
Adrian, R., Hansson, S., Sandin, B., De Stasio, B., & Larsson, U. (1999). Effects of food
availability and predation on a marine zooplankton community - A study on copepods in the
Baltic Sea. International Review of Hydrobiology, 84(6), 609–626.
Alekseev, V. R., & Souissi, A. (2011). Article A new species within the Eurytemora affinis
complex ( Copepoda : Calanoida ) from the Atlantic Coast of USA ... Zootaxa, 2767(July),
41–56. Retrieved from www.mapress.com/zootaxa/
Balcer, M. D., Korda, N. L., & Dodson, S. I. (1984). Zooplankton of the Great Lakes. Madison,
WI: The University of Wisconsin Press.
Båmstedt, U. (1980). ETS Activity as an Estimator of Respiratory Rate of Zooplankton
Populations. the Significance of Variations in Environmental Factors. Journal of
Experimental Marine Biology and Ecology, 42(1979), 267–283.
Barrett, N. (2014). Effects of toxic cyanobacteria (Microcystis aeruginosa) on the feeding and
reproduction ecology of the copepod Eurytemora affinis from Green Bay, Lake Michigan.
Lawrence University Honors Projects. 60. Retrieved from https://lux.lawrence.edu/luhp/60
44
Benson, B. B., & Daniel Krause, J. (1980). The concentration and isotopic fractionation of gases
dissolved in freshwater in equilibrium with the atmosphere. Limnology and Oceanography.
https://doi.org/10.4319/lo.1980.25.4.0662
Cammen, L. M., Corwin, S., & Christensen, J. P. (1990). Electron transport system (ETS
activity) as a measure of benthic macrofaunal metabolism. Marine Ecology Progress Series,
65(1), 171–182.
Carlson, R. E. (1977). A Trophic State Index for Lakes A trophic state index for lakes.
Limnology, 22(2), 361–369. Retrieved from
https://aslopubs.onlinelibrary.wiley.com/doi/pdf/10.4319/lo.1977.22.2.0361
Carlton, J. (2003). Invasive Species: Vectors and Management Strategies. (G. M. Ruiz, Ed.).
Island Press.
De Stasio, B. T., Schrimpf, M. B., Beranek, A. E., & Daniels, W. C. (2008). Increased
chlorophyll a, phytoplankton abundance, and cyanobacteria occurrence following invasion
of Green Bay, Lake Michigan by dreissenid mussels. Aquatic Invasions, 3(1), 21–27.
https://doi.org/10.3391/ai.2008.3.1.5
De Stasio, B., Schrimpf, M., & Cornwell, B. (2014). Phytoplankton communities in Green Bay,
Lake Michigan after invasion by Dreissenid mussels: increased dominance by
cyanobacteria. Diversity, 6(4), 681–704. https://doi.org/10.3390/d6040681
De Stasio, B. T., Beranek, A. E., & Schrimpf, M. B. (2018). Zooplankton-phytoplankton
interactions in Green Bay, Lake Michigan: Lower food web responses to biological
invasions. Journal of Great Lakes Research, 44(5), 910–923.
https://doi.org/10.1016/j.jglr.2018.05.020
Devol, A. H., & Packard, T. T. (1978). Seasonal Changes in Respiratory Enzyme Activity and
Productivity in Lake. Limnology and Oceanography, 23(1), 104–111. Retrieved from
https://aslopubs.onlinelibrary.wiley.com/doi/pdf/10.4319/lo.1978.23.1.0104
Engström-Öst, J., Barrett, N., Brutemark, A., Vehmaa, A., Dwyer, A., Almén, A. K., & De
Stasio, B. T. (2017). Feeding, survival, and reproduction of two populations of Eurytemora
(Copepoda) exposed to local toxic cyanobacteria. Journal of Great Lakes Research, 43(6),
1091–1100. https://doi.org/10.1016/j.jglr.2017.09.009
Hernández-Léon, S. (2000). ICES Zooplankton Methodology Manual. ICES Zooplankton
Methodology Manual. Elsevier. https://doi.org/10.1016/B978-012327645-2/50008-6
Holeck, K. T., Mills, E. L., MacIsaac, H. J., Dochoda, M. R., Colautti, R. I., & Riccardi, A.
(2006). Bridging Troubled Waters: Biological Invasions, Transoceanic Shipping, and the
Laurentian Great Lakes. BioScience, 54(10), 919. https://doi.org/10.1641/0006-
3568(2004)054[0919:btwbit]2.0.co;2
45
Hosking, J. R., McFadyen, R. E., & Murray, N. D. (1988). Distribution and biological control of
cactus species in eastern Australia. Plant Protection Quarterly, 3(3), 115–123. Retrieved
from https://www.cabdirect.org/cabdirect/abstract/19891124518
Ikeda, T. (1977). experimental measurements to the ecology of marine zooplankton. IV. Changes
in respiration and excretion rates of boreal zooplankton species maintained under fed.
Marine Biology, 252, 241–252. Retrieved from
http://link.springer.com/article/10.1007/BF00394910
Jarić, I., & Gorčin, C. (2012). The Tens Rule in Invasion Biology: Measure of a True Impact or
Our Lack of Knowledge and Understanding? Environmental Management, 50(6), 979–981.
Keane, R. M., & Crawley, M. J. (2002). Exotic plant invasions and the enemy release hypothesis.
Trends in Ecology & Evolution, 17(4), 164–170. https://doi.org/10.1016/S0169-
5347(02)02499-0
Kimmel, D. G., & Roman, M. R. (2004). Long-term trends in mesozooplankton abundance in
Chesapeake Bay, USA: influence of freshwater input. Marine Ecology Progress Series,
267, 71–83. Retrieved from http://www.chesapeakebay.net/data/index.htm
King, F. D., & Packard, T. T. (1975). Respiration and the Activity of the Respiratory Electron
Transport System in Marine Zooplankton. Limnology and Oceanography, 20(5), 849–854.
Kiørboe, T., Møhlenberg, F., & Hamburger, K. (1985). Bioenergetics of the planktonic copepod
Acartia tonsa: relation between feeding, egg production and respiration, and composition of
specific dynamic action. Marine Ecology Progress Series, 26, 85–97. Retrieved from
https://www.int-res.com/articles/meps/26/m026p085.pdf
Kipp, R. M. (2006). Eurytemora affinis. GLANSIS. Retrieved from
https://www.glerl.noaa.gov/glansis/
Klump, J. V., Brunner, S. L., Grunert, B. K., Kaster, J. L., Weckerly, K., Houghton, E. M., …
Valenta, T. J. (2018). Evidence of persistent, recurring summertime hypoxia in Green Bay,
Lake Michigan. Journal of Great Lakes Research, 44(5), 841–850.
https://doi.org/10.1016/j.jglr.2018.07.012
Klump, J. V., Fitzgerald, S. A., & Waplesa, J. T. (2009). Benthic biogeochemical cycling,
nutrient stoichiometry, and carbon and nitrogen mass balances in a eutrophic freshwater
bay. Limnology and Oceanography, 54(3), 692–712.
https://doi.org/10.4319/lo.2009.54.3.0692
Knatz, G. (1978). Succession of Copepod Species in a Middle Atlantic Estuary. Estuaries, 1(1),
68–71. Retrieved from https://www.jstor.org/stable/pdf/1351655.pdf?refreqid=excelsior
%3A1bf16481418b4abadef931cb85b9a9ac
46
Lampert, W. (1984). The measurement of respiration. In J. A. Downing & F. H. Rigler (Eds.), A
Manual on Methods for the Assessment of secondary Productivity in Fresh Waters (2nd ed.,
Vol. 15, pp. 413–468). https://doi.org/10.1016/0022-1694(72)90028-5
Lampert, W. (1985). Food limitation and the structure of zooplankton communities. Advances in
Limnology, 21(497).
Lee, C. E. (1999). Rapid and Repeated Invasions of Fresh Water by the Copepod Eurytemora
affinis. Society for the Study of Evolution, 53(5), 1423–1434.
Lee, C. E. (2010). Global Phylogeography of a Cryptic Copepod Species Complex and
Reproductive Isolation between Genetically Proximate " Populations ". Evolution, 54(6),
2014–2027.
Lee, C. E., Moss, W. E., Olson, N., Chau, K. F., Chang, Y. M., & Johnson, K. E. (2013).
Feasting in fresh water: Impacts of food concentration on freshwater tolerance and the
evolution of food × salinity response during the expansion from saline into fresh water
habitats. Evolutionary Applications, 6(4), 673–689. https://doi.org/10.1111/eva.12054
Lee, C. E., Remfert, J. L., & Gelembiuk, G. W. (2003). Evolution of Physiological Tolerance
and Performance during Freshwater Invasions. Integrative and Comparative Biology, 43(3),
439–449. https://doi.org/10.1093/icb/43.3.439
Lloyd, S. S., Elliott, D. T., & Roman, M. R. (2013). Egg production by the copepod, Eurytemora
affinis, in Chesapeake Bay turbidity maximum regions. Journal of Plankton Research,
35(2), 299–308. https://doi.org/10.1093/plankt/fbt003
Merkle, C. A., & De Stasio, B. T. (2018). Bythotrephes longimanus in shallow, nearshore
waters: Interactions with Leptodora kindtii, impacts on zooplankton, and implications for
secondary dispersal from southern Green Bay, Lake Michigan. Journal of Great Lakes
Research, 44(5), 934–942. https://doi.org/10.1016/j.jglr.2018.02.013
Mills, E. L., J. H. Leach, J. T. Carlton, and C. L. Secor. 1993. Exotic Species in the Great Lakes:
A History of Biotic Crises and Anthropogenic Introductions. Journal of Great Lakes
Research 19(1):1-54.
O’Neill, C. R. (New Y. S. G. (1997). Economic Impact of Zebra Mussels - Results of the 1995
National Zebra Mussel Information Clearinghouse Study. Great Lakes Research Review,
3(1), 35–44. Retrieved from https://cybercemetery.unt.edu/archive/nisic/20110630015418/
http:/www.aguadelastrobrasil.org.br/arquivos/31.pdf
Owens, T. G., & King, F. D. (1975). The measurement of respiratory electron-transport-system
activity in marine zooplankton. Marine Biology, 30(1), 27–36.
https://doi.org/10.1007/BF00393750
47
Packard, T. T., Devol, A. H., & King, F. D. (1975). The effect of temperature on the respiratory
electron transport system in marine plankton. Deep-Sea Research and Oceanographic
Abstracts, 22(4), 237–249. https://doi.org/10.1016/0011-7471(75)90029-7
Packard, T. (1985). Measurement of electron transport activity of marine microplankton.
Advances in Aquatic Microbiology, 3, 208–235. Retrieved from
https://www.researchgate.net/publication/233843739_Packard_TT_Measurement_of_electr
on_transport_activity_of_marine_microplankton_In_Advances_in_Aquatic_Microbiology_
PJ_LeB_Williams_and_HW_Jannasch_eds_Academic_Press_New_York_pp_207-
261_1985
Pascal, L., & Chong, V. C. (2016). Does developmental temperature modulate copepods
respiratory activity through adult life? Journal of Plankton Research, 38(5), 1215–1224.
https://doi.org/10.1093/plankt/fbw058
Poli, A. N. (2015). Diel Vertical Migration of an Invasive Calanoid Copepod , Eurytemora
affinis , in Little Sturgeon Bay , Wisconsin. Lawrence University Honors Projects, 78.
Retrieved from https://lux.lawrence.edu/luhp/78
Pyšek, P., & Richardson, D. M. (2010). Invasive Species, Environmental Change and
Management, and Health Plants and insects across scales in the Cape Floristic Regions
View project Impacts of alien species View project. Annual Review of Environmental
Resources, 35, 25–55. https://doi.org/10.1146/annurev-environ-033009-095548
Qualls, T., Harris, H. J., & Harris, V. (2013). The State of the Bay. Retrieved from
https://www.seagrant.wisc.edu/wp-content/uploads/2018/11/State-of-the-Bay-Report-
2013.pdf
Rai, H. (2002). Electron transport system (ETS activity) as a measure of respiratory activity of
microorganisms. Pelagic Ecol. Methodol., (1), 169–175.
Richman, S., Bohon, S. A., & Robbins, S. E. (1980). Grazing interactions among freshwater
calanoid copepods. In Evolution and Ecology of Zooplankton Communities (pp. 219–233).
https://doi.org/10.1021/acschembio.7b01019
Schalk, P. H. (1988). Respiratory electron transport system (ETS) activities in zooplankton and
micronekton of the Indo-Pacific region. Marine Ecology Progress Series, 44, 25–35.
Retrieved from https://www.int-res.com/articles/meps/44/m044p025.pdf
Schindler, D. W. (1974). Eutrophication and Recovery in Experimental Lakes: Implications for
Lake Management. Science, 184(4139), 897 LP-899.
https://doi.org/10.1126/science.184.4139.897
Simčič, T., & Brancelj, A. (2004). Respiratory electron transport system (ETS) activity as an
estimator of the thermal tolerance of two Daphnia hybrids. Journal of Plankton Research,
26(5), 525–534. https://doi.org/10.1093/plankt/fbh056
48
Torke, B. (2011). The distribution of calanoid copepods in the plankton of Wisconsin Lakes.
Hydrobiologia, 453/454, 351–365.
USACE (United States Army Corps of Engineers) (2012). Biological Controls. Retrieved from
http://glmris.anl.gov/documents/docs/anscontrol/BiologicalControls.pdf
Vasquez, A. A., Hudson, P. L., Fujimoto, M., Keeler, K., Armenio, P. M., & Ram, J. L. (2016).
Eurytemora carolleeae in the Laurentian Great Lakes revealed by phylogenetic and
morphological analysis. Journal of Great Lakes Research, 42(4), 802–811.
https://doi.org/10.1016/j.jglr.2016.04.001
Watson, S. B. et al. (1997). Patterns in phytoplankton taxonomic composition across temperate
lakes of different trophic status. Limnol. Oceanogr. 42: 487-94, 42(3), 487–49. Retrieved
from https://aslopubs.onlinelibrary.wiley.com/doi/pdf/10.4319/lo.1997.42.3.0487
Wetzel, R. G. (2001). Limnology, 3 E. Lake and River Ecosystems. Academic Press, 525 B
Street, Ste. 1900, San Diego, CA 92101, USA. 850. Elsevier.
Wimbush, J., Frischer, M. E., Zarzynski, J. W., & Nierzwicki-Bauer, S. A. (2009). Subtidal
macrobenthic structure in the lower lima estuary, NW of Iberian Peninsula. Aquatic
Conservation: Marine and Freshwater Ecosystems, 19, 703–713.
https://doi.org/10.1002/aqc