comparing the use of dorsal fin spines with scales to back- … vs spines.pdf · · 2015-08-26two...
TRANSCRIPT

Comparing the Use of Dorsal Fin Spines with Scales to Back-
Calculate Length-at-Age Estimates in Walleyes
Brian D. Borkholder*
Fond du Lac Band of Lake Superior Chippewa, Division of Resource
Management, 1720 Big Lake Road, Cloquet, Minnesota 55720, USA
Andrew J. Edwards
1854 Authority, Airpark Square, 4428 Haines Road, Duluth, Minne-
sota 55811, USA
Reference: Borkholder, B.D., and A.J. Edwards. 2001. North American Journal of Fisheries Management 21:935—942.
Abstract � The use of scales to age and back-calculate previous
lengths has long been used as a management tool in fisheries.
However difficulties with using scales to interpret ages in
older fish have led managers to investigate other bony struc-
tures. Dorsal fin spines have been used and evaluated for aging
fishes, but their utility for back-calculation estimates is
largely unknown. We compared back-calculation estimates along
two different scale transects and three dorsal fin spine tran-
sects in walleyes Stizostedion vitreum. Back-calculation esti-
mates were obtained using the standard Fraser-Lee proportional
method and a regression equation derived from the body length /
spine radius relationship. Dorsal spines were easier to inter-
pret than were scales, especially for older-aged walleye. Back-
calculated lengths among transects both within the two struc-
tures and between the two structures agreed quite favorably.
Our data suggest that the Fraser-Lee proportional method applied
to dorsal fin spines closely approximates the back-calculated
lengths obtained from scales. While differences in back-
calculated lengths estimated from each structure were observed
among individual walleye, reliable estimates of back-calculated
lengths for a walleye population, as compared with scale esti-
mates, were obtained from dorsal fin spines. Scales are much
easier to prepare, however, and have a longer history of use for
back-calculating lengths at age. The use of scales for aging
and back-calculating length-at-age estimates in younger fish is
recommended, but managers may wish to consider the use of spines
for obtaining length-at-age estimates from older individuals.

Introduction
Age and growth information are valuable management data
used by fisheries biologists to monitor populations. While
scales have been the most common structure used for aging fresh-
water fish, other structures have been used, including otoliths,
fin rays, opercles, and vertebrae. As managers continue to seek
structures that provide accurate age estimates, each new struc-
ture should be validated using fish of known age (Beamish and
McFarlane 1983). Often, however, new structures are simply com-
pared to current techniques, as validation is not always possi-
ble (Belanger and Hogler 1982). Several studies have focused on
comparing ages enumerated from different bony structures in an
attempt to quantify the precision and to identify possible bias
associated with each structure. Eight different structures have
been compared for aging walleyes Stizostedion vitreum, including
pectoral rays, scales, otoliths, vertebrae, opercles, pelvic
rays, brachiostegal rays, and dorsal spines (Campbell and Ba-
baluk 1979; Olson 1980; Belanger and Hogler 1982; Erickson 1983;
and Heidinger and Clodfelter 1987; Kocovsky and Carline 2000).
Comparisons have been made between scales and pectoral fin rays
in white sucker Catostomus commersoni (Beamish 1973), and be-
tween scales and pelvic fin rays in whitefish Coregonus clupea-
formis (Mills and Beamish 1980). Ages determined from scales
and otoliths have been compared in alewives Alosa pseudoharengus
(O�Gorman et al. 1987) and in striped bass Morone saxatilis and
smallmouth bass Micropterus dolomieui (Heidinger and Clodfelter
1987). Scales have generally been found to underestimate ages
relative to other structures, especially for older individuals
and in slow-growing populations (Campbell and Babaluk 1979;
Mills and Beamish 1980; Erickson 1983; Kocovsky and Carline
2000). Since scale growth is assumed to be proportional to body
growth (Whitney and Carlander 1956; Hile 1970; Bagenal 1974; and
Erickson 1983), annuli become crowded on the scale edges in
slow-growing populations and in older fish, making scale inter-
pretation difficult. Because this crowding effect does not cre-
ate as many difficulties in aging dorsal spines, Campbell and
Babaluk (1979) and Olson (1980) both recommended dorsal spines
for determining age in walleyes when non-invasive techniques are
required.
Often associated with aging fish is the use of bony struc-
tures to back-calculate length-at-age estimates to examine
growth rates. Scales were the first structure used to back-
calculate lengths (Lea 1910; Fraser 1916; Lee 1920), and have
been widely used since (Carlander 1982; Jearld 1983; Carlander
1987; Busacker et al. 1990; Ricker 1992; Pierce et al. 1996;
Hurley et al. 1997; Klumb et al. 1999). Francis (1990) provides
a comprehensive review of the various back-calculation tech-
niques. Essentially, there are two methods of back-calculating
lengths at age: 1) proportional methods, where the length of the
individual and the size of the bony structure at time of capture
are taken into account in the model, and 2) regression methods,
which largely ignore fish length and bony structure size at cap-
ture (Francis 1990). The Fraser-Lee equation has been widely
used and recommended (Carlander 1981, 1982; Ricker 1992; Klumb
et al. 1999), and is the proportional method formula used by the
widely-distributed computer program DisBCal (Frie 1982).
Studies have demonstrated that otoliths can also be used
for back-calculating lengths at age (Erickson 1983; Heidinger
and Clodfelter 1987; Campana 1990; and Schramm et al. 1992).
The potential of using dorsal fin spines to back-calculate
lengths at age in walleyes is unknown. Dorsal fin spines have
been shown to be easier to use when interpreting ages than are
scales, especially in slower-growing populations and older indi-
viduals (Campbell and Babaluk 1979; and Olson 1980). We com-
pared back-calculated length-at-age estimates (BCLs), using both
the Fraser-Lee and regression methods, of three walleye popula-
tions using scales and dorsal fin spines.
Methods
Walleyes were collected from three lakes within Minnesota.
Green Lake is located in Chisago County north of Minneapolis /
St. Paul, Mille Lacs Lake is located in Mille Lacs County near
the center of the state, and Island Lake is located in St. Louis
County north of Duluth. Samples were taken from walleyes har-
vested by Tribal fishermen from Green and Mille Lacs Lakes, and
by electrofishing in Island Lake. Samples were collected during
April of 1998, immediately following ice-out.
Each walleye was measured to the nearest millimeter. A
sample of scales was collected from the region immediately above
the lateral line and even with the end of the pectoral fin. A
pair of side cutters was used to clip the second full dorsal fin
spine at the point of attachment.
Scale samples were cleaned in warm water and impressions
made in acetate slides. Scale impressions were viewed using a
microfiche viewer at 24X. Dorsal fin spines were first soaked
in bleach to remove the layer of skin on the bone. Spines were
set in two-part epoxy resin, and 0.3 to 0.5 mm thin sections
were cut using a Buehler IsometTM low speed bone saw. The use
of this bone saw and a diamond wafering blade allowed us to get
clean, readable cuts without the need to polish them as in Ko-
covsky and Carline (2000). Three sections were cut near the
base for viewing. Spines were examined using a microfiche
viewer at 60X.
Scales and spine sections were aged independently by two
different readers for 266 walleyes. A virtual annulus was as-
signed to the spine and scale edges since these were early
spring samples (Klumb et al. 1999). Individual walleye where
scale and spine ages differed by one year were viewed again in-
dependently by both readers. If perfect agreement was achieved,
these fish were also used for back-calculations. When ages be-
tween scales and spines were in disagreement by more than 2
years, these fish were excluded from additional analysis.
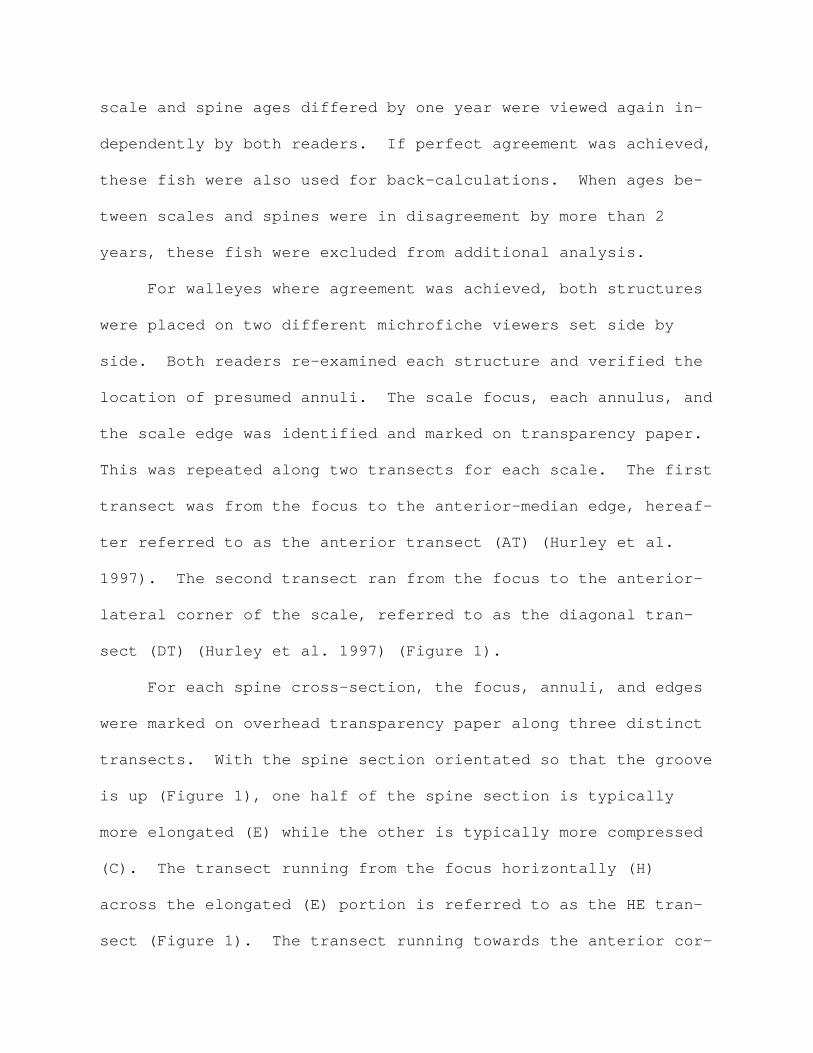
For walleyes where agreement was achieved, both structures
were placed on two different michrofiche viewers set side by
side. Both readers re-examined each structure and verified the
location of presumed annuli. The scale focus, each annulus, and
the scale edge was identified and marked on transparency paper.
This was repeated along two transects for each scale. The first
transect was from the focus to the anterior-median edge, hereaf-
ter referred to as the anterior transect (AT) (Hurley et al.
1997). The second transect ran from the focus to the anterior-
lateral corner of the scale, referred to as the diagonal tran-
sect (DT) (Hurley et al. 1997) (Figure 1).
For each spine cross-section, the focus, annuli, and edges
were marked on overhead transparency paper along three distinct
transects. With the spine section orientated so that the groove
is up (Figure 1), one half of the spine section is typically
more elongated (E) while the other is typically more compressed
(C). The transect running from the focus horizontally (H)
across the elongated (E) portion is referred to as the HE tran-
sect (Figure 1). The transect running towards the anterior cor-

ner of the elongated plane is referred to as the AE transect.
Along the compressed plane, the horizontal transect is referred
to as the HC transect.
Regression analysis was used to create a model to back-
calculate length-at-age. Analysis used fish total length (Lc)
and the radius of the spine (Sc) along the HE transect for 1177
walleyes collected from the study lakes. The relationship be-
tween fish length at capture and spine radius was found to be
curvilinear, therefore the data were loge transformed (Ln). The
regression coefficients from least-squares analysis were back-
transformed (ex) to develop an equation which was used to back-
calculate lengths at age in the 1998 collections.
The computer program DisBCal (Frie 1982) was used to com-
pute BCLs for both the scale and spine data using the Fraser-
Lee (FL) formula (Fraser 1916; and Lee 1920):
Li = K + (Lc - K)*(Si/Sc), where
Li is the back calculated length at age i (BCL),
Si is the distance between the focus and annulus i,
Lc is the length at capture,
Sc is the radius of the scale along the transect, and
K is the standard intercept value of 55 mm (Carlander
1982). Wilcoxin signed-rank tests were used to check for sig-
nificant differences between the mean BCLs from the scale AT
transect and the BCLs from the other transects. The AT transect

was chosen as the benchmark for comparisons, as this has been
the transect recommended for standard use (Jearld 1983).
Results
Perfect agreement between structures after the initial ag-
ing occurred for 127 of the fish. Interpreted ages between
structures were off by � 1 year for 98 of the fish and by � 2
years for 21 individuals (Figure 2). The largest discrepancy
between structures was from a 660 mm individual aged to 11 years
on the spine and to 5 years on the scale. In all instances
where disagreement in assigned ages was •�3 years, the spine as-
signed an age of 8 years or older. Twenty-seven fish were added
after a second reading, giving us 154 individuals ranging from 3
to 10 years in age to be used for calculating BCLs.
Back-calculated lengths obtained using the Fraser-Lee for-
mula along the three spine transects compared much more favora-
bly to the BCLs obtained using the scale transects than did the
spine BCLs obtained using a regression equation. Francis (1990)
reported that the problem with using regression models to com-
pute BCLs is that they do not take into account the length of
the fish and the radius of the structure at the time of capture.
Results and discussions of spine BCLs will be only for those ob-
tained using the Fraser-Lee formula.
Regression analysis was used to compare BCLs within each
structure (Table 1). Back-calculated lengths between the two

scale transects showed a relationship close to 1:1 with an in-
tercept of 0 (slope = 1.0078, intercept = -4.858 mm). Back-
calculated lengths from the three spine transects were also
close to a 1:1 relationship (slope range 0.9895 - 1.0050, inter-
cept range -13.154 to 1.538 mm) (Table 1). Back-calculated
lengths between the two structures were also compared (Table 1,
Figure 3), and were found to be significant (F range 9,743 -
13,149, R2 range 0.9156 to 0.9361).
Mean BCLs for each lake�s walleye population were estimated
(Table 2). Comparisons were made between the scale AT transect
and each of the other transects. For the Green Lake population,
no significant differences were observed between the mean BCLs
along the AT transect and between those along the DT or HC tran-
sects (Table 2). The spine HE transect underestimated length-
at-age relative to the scale AT transect for ages 3 and 4 by 12
mm, or 3.2% and 2.7%, respectively. For the Island Lake popula-
tion, no differences were obdddserved between the mean BCLs
along the AT transect and the spine transects HE and HC (Table
2). For both the Green and Island Lake populations, when sig-
nificant differences were observed, the BCLs along the spine AE
transect overestimated length-at-age relative to the scale AT
transect by 0.8% to 11.4% (4 mm to 20 mm). In the Mille Lacs
Lake population, mean BCLs calculated using the two spine tran-
sects HE and HC underestimated length-at-age relative to the

scale for ages 1 to 4 along the HE transect, and for ages 1 to 5
along the HC transect. Differences ranged from 3.3% to 8.6% (11
mm to 28 mm) along the HE transect, and from 1.3% to 8.9% (6 mm
to 24 mm) along the HC transect. Length-at-age estimates along
the AE transect for the Mille Lacs population only differed at
ages 2 and 3, and were 10 mm and 16 mm, respectively.
Discussion
In general, ages interpreted from dorsal spines and scales
agreed favorably through age 5, after which scales appeared to
underestimate the age of walleyes in these three lakes (Figure
2). Schram (1989) reported that scale analysis was unreliable
for older walleyes, and that compressed outer annuli caused un-
derestimates of the true age. Kocovsky and Carline (2000) dem-
onstrated that ages from spines more closely agreed with oto-
liths than did scales in older walleye, and that scales underes-
timated age with respect to otoliths. An inability to identify
outer annuli on the scales from the older aged individuals would
explain the discrepancies observed in this study. Annuli crowd-
ing was observed in spines from older fish, presumably after in-
dividuals reached sexual maturity. However, though crowded, an-
nuli appeared to be distinguishable upon close examination.
Comparing age-frequency distributions from our spine data with
those from otoliths for Mille Lacs Lake walleye, spines have
proven effective at identifying strong and weak year classes,

although they have tended to underestimate the abundance of the
oldest year classes (Richard Bruesewitz, MNDNR, personal commu-
nication).
Schram (1989) verified the formation of annuli in dorsal
spines for marked, and later recaptured, walleyes. Known years
at large corresponded to changes in annuli counts for between
48% and 55% of the walleyes, and were within 2 years in 79% of
the walleyes (Schram 1989). This population was characterized
by older individuals, up to 20 years. Slow growth and com-
pressed annuli at the edges may have accounted for such low per-
cent agreement. Schram (1989) reported that annuli in scales
from this population are severely crowded at the edge, making
scale interpretation unreliable. The relationship between years
at large and annuli counts in dorsal fin spines should be inves-
tigated in younger walleyes, where annuli crowding should not be
a problem. Despite these limitations, dorsal spines can still
be sampled from live fish, unlike otoliths, and do seem to be
more accurate for age determination than scales for older wall-
eyes.
Most fisheries managers are generally not interested in the
BCLs of individual fish, but rather of populations so that
growth rates can be inferred. Hurley et al. (1997) found that,
except for ages 1, 2, and 3, BCLs in walleyes were identical us-
ing transects AT and DT on the scale. Significant differences

observed in their study were generally small (0.1 - 6.3mm). We
also found that mean BCLs between AT and DT were generally the
same, and only observed significant differences at age 1 on Is-
land Lake, and age 2 on Mille Lacs (Table 2), which were also
small, 4mm and 7mm, respectively. In the Green and Island Lake
walleye populations, mean length-at-age estimates using the
spine data were generally not different from the mean values us-
ing scales measured along the AT transect. In the Mille Lacs
Lake walleye population, the AE transect provided the best
length-at-age estimates compared to the scale AT transect. We
suggest managers report the transects used both in scale and
spine studies. The spine HE transect appears to correspond bet-
ter with the scale DT transect, i.e. growth stanzas are widest
between successive annuli. The HC transect appears to physi-
cally correspond best with the AT transect, and is the transect
preferred in our aging studies. The HC transect provided accu-
rate length-at-age estimates relative to the scale AT transect
in two of the populations. Managers interested in intensively
managing specific populations may need to investigate which
spine transects provide BCLs that more closely approximate those
obtained from scales, as the HE and HC transects provided
equivalent estimates on two of the lakes, whereas the AE tran-
sect provided better estimates for the Mille Lacs Lake popula-
tion.
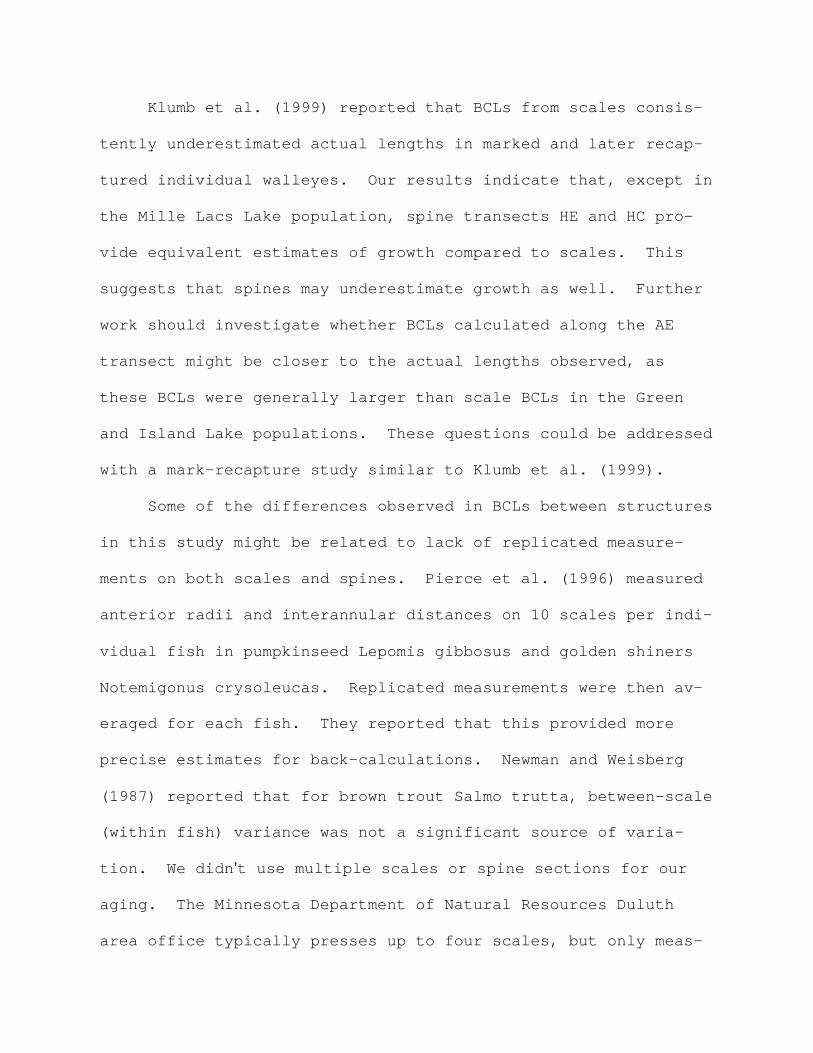
Klumb et al. (1999) reported that BCLs from scales consis-
tently underestimated actual lengths in marked and later recap-
tured individual walleyes. Our results indicate that, except in
the Mille Lacs Lake population, spine transects HE and HC pro-
vide equivalent estimates of growth compared to scales. This
suggests that spines may underestimate growth as well. Further
work should investigate whether BCLs calculated along the AE
transect might be closer to the actual lengths observed, as
these BCLs were generally larger than scale BCLs in the Green
and Island Lake populations. These questions could be addressed
with a mark-recapture study similar to Klumb et al. (1999).
Some of the differences observed in BCLs between structures
in this study might be related to lack of replicated measure-
ments on both scales and spines. Pierce et al. (1996) measured
anterior radii and interannular distances on 10 scales per indi-
vidual fish in pumpkinseed Lepomis gibbosus and golden shiners
Notemigonus crysoleucas. Replicated measurements were then av-
eraged for each fish. They reported that this provided more
precise estimates for back-calculations. Newman and Weisberg
(1987) reported that for brown trout Salmo trutta, between-scale
(within fish) variance was not a significant source of varia-
tion. We didn�t use multiple scales or spine sections for our
aging. The Minnesota Department of Natural Resources Duluth
area office typically presses up to four scales, but only meas-

ures and back-calculates lengths from a single scale (John
Lindgren, MNDNR, personal communication). Managers and techni-
cians generally do not have time to age and measure multiple
samples for each individual, especially when several thousand
fish are aged each sampling season. Future studies might ad-
dress whether between-scale or between-spine differences are
evident in walleyes, and if this variation is significant.
Another source of variation not addressed in this study is
the variation in measuring and marking the annuli for digitiz-
ing. In an inter-office investigation, MNDNR personnel demon-
strated that where the mark is digitized will lead to differ-
ences in BCLs (John Lindgren, MNDNR, personal communication).
They tested differences in digitizing each mark (each annulus)
at the mark�s front, middle, and back on the transparency paper.
While we attempted to be consistent in the actual digitizing
process, digitizing the center of each mark, this might be a
source of variability not addressed in our study. We recommend
that consistency be maintained when digitizing marks to minimize
this source of variation.
Our results indicate that there is good agreement between
scale and spine BCLs in those fish within the 0 to 10 age range
that we were able to accurately age. We did not address the
problem of length-at-age estimates from incorrectly-aged indi-
viduals. This will obviously affect estimates, leading to less

accurate BCLs. Presumably, since dorsal fin spines appear to be
easier to interpret when aging older fish, BCLs may be more ac-
curate for fish at ages greater than 5 years. Managers inter-
ested in age structure and growth rates of walleye populations
may benefit from using spines collected from older individuals.
In our spring sampling, adult spawning walleye are targeted.
Spine-interpreted ages range from 4 to 22, averaging in the age
5 to 9 year range. This is in the range where spine / scale age
agreement breaks down (Figure 2), with scales showing a consis-
tent bias towards underestimating ages. In our sampling, spines
are collected for aging and obtaining BCLs from individuals lar-
ger than 300 mm (age 3+), while scales are collected for aging
and back-calculating length-at-age estimates from the smaller
individuals. Managers interested in growth for younger indi-
viduals, e.g., age 5 or less, would not gain much by using dor-
sal spines. Scales are much easier to prepare, and have a
longer history of use for back-calculating lengths at age. We
still advocate the use of scales for aging younger fish, but
recommend managers consider the use of spines for obtaining BCLs
from older individuals.
Acknowledgments
The Fond du Lac Division of Resource Management thanks Fond
du Lac tribal bandmembers who patiently waited and allowed our
field staff to measure and obtain bony structures from harvested

walleye. Assistance for the field and lab portions of this
study was received from Sean Thompson, Gary Martineau, and Terry
Perrault (Fond du Lac); and Sonny Myers, Darren Vogt, and Carlye
Gunderson (1854 Authority). Tom Jones, Rick Bruesewitz, John
Lindgren, Pete Rust, Neil Kmiecik, Joe Dan Rose, Nancy Costa,
Rick Gitar, Jeff Schuldt, and Frank Stone provided comments as
the manuscript evolved. Greg Busacker, Keith Hurley, and Rich-
ard Zweifel provided insightful reviews on an earlier draft that
greatly improved the manuscript.
Literature Cited
Bagenal, T., editor. 1974. The aging of fish. Unwin Brothers,
Old Woking, England.
Beamish, R. J. 1973. Determination of age and growth of popu-
lations of the white sucker (Catostomus commersoni) exhib-
iting a wide range in size at maturity. Journal of the
Fisheries Research Board of Canada 30:607-616.
Beamish, R.J., and G. A. McFarlane. 1983. The forgotten age
requirement in fisheries biology. Transactions of the
American Fisheries Society 112:735-743.
Belanger, S. E., and S. R. Hogler. 1982. Comparison of five
ageing methodologies applied to walleye (Stizostedion
vitreum) in Burt Lake, Michigan. Journal of Great Lakes
Research 8:666-671.
Busacker, G. P., I. A. Adelman, and E. M. Goolish. 1990.

Growth. Pages 363-377 in C. B. Schreck and P. B. Moyle,
editors. Methods for fish biology. American Fisheries So-
ciety, Bethesda, Maryland.
Campana, S. E. 1990. How reliable are growth back-calculations
based on otoliths? Canadian Journal of Fisheries and
Aquatic Sciences 47:2219-2227.
Campbell, J. S., and J. A. Babaluk. 1979. Age determination of
walleye, Stizostedion vitreum vitreum, based on the exami-
nation of eight structures. Fisheries and Marine Services
Technical Report, Number 849.
Carlander, K. D. 1981. Caution on the use of the regression
method of back-calculating lengths from scale measurements.
Fisheries 6:2-4.
Carlander, K. D. 1982. Standard intercepts for calculating
lengths from scale measurements from some centrarchid and
percid fishes. Transactions of the American Fisheries So-
ciety 111:332-336.
Carlander, K. D. 1987. A history of scale age and growth stud-
ies in North American freshwater fish. Pages 3-14 in R. C.
Summerfelt and G. E. Hall, editors. Age and growth of
fish. Iowa State University Press, Ames.
Erickson, C. M. 1983. Age determination of Manitoban walleyes
using otoliths, dorsal spines, and scales. North American
Journal of Fisheries Management 3:176-181.

Francis, R. I. C. C. 1990. Back-calculation of fish length: a
critical review. Journal of Fish Biology 36:883-902.
Fraser, C. M. 1916. Growth of the spring salmon. Transactions
of the Pacific Fisheries Society 1916:29-39.
Frie, R. V. 1982. Measurements of fish scales and back-
calculation of body lengths using a digitizing pad and mi-
crocomputer. Fisheries 7(5):5-8.
Heidinger, R. C., and K. Clodfelter. 1987. Validity of the
otolith for determining age and growth of walleye, striped
bass, and smallmouth bass in power cooling plants. Pages
241-251 in R. C. Summerfelt and G. E. Hall, editors. Age
and growth of fish. Iowa State University Press, Ames.
Hile, R. 1970. Body-scale relation and calculation of growth
in fishes. Transactions of the American Fisheries Society
99:468-474.
Hurley, K. L., K. L. Pope, and D. W. Willis. 1997. Back-
calculated length-at-age estimates from two scale radii.
The Prairie Naturalist 29:229-236.
Jearld, A., Jr. 1983. Age determination. Pages 301-324 in L.
A. Nielsen and D. L. Johnson, editors. Fisheries tech-
niques. American Fisheries Society, Bethesda, Maryland.
Klumb, R. A., M. A. Bozek, and R. V. Frie. 1999. Proportional-
ity of body to scale growth: Validation of two back-
calculation models with individually tagged and recaptured

smallmouth bass and walleyes. Transactions of the American
Fisheries Society 128:815-831.
Kocovsky, P. M., and R. F. Carline. 2000. A comparison
of methods for estimating ages of unexploited walleyes.
North American Journal of Fisheries Management 20:1044-
1048.
Lea, E. 1910. On the methods used in the herring investiga-
tions. Publications de Circonstance, Conseil Permanent In-
ternational pour l�Exploration de la Mer 53.
Lee, R. 1920. A review of the methods of age and growth deter-
mination in fishes by means of scales. Fishery Investiga-
tions, Series 2, Marine Fisheries, Great Britain Ministry
of Agriculture, Fisheries and Food 4(2).
Mills, K. H., and R. J. Beamish. 1980. Comparison of fin-ray
and scale age determinations for lake whitefish (Coregonus
clupeaformis) and their implications for estimates of
growth and annual survival. Canadian Journal of Fisheries
and Aquatic Sciences 37:534-544.
Newman, R. M., and S. Weisberg. 1987. Among- and within-fish
variation of scale growth increments in brown trout. Pages
159-166 in R. C. Summerfelt and G. E. Hall, eds. Age and
Growth of Fish. Iowa State University Press, Ames.
O�Gorman, R., D. H. Barwick, and C. A. Bowan. 1987. Discrepen-
cies between ages determined from scales and otoliths for

alewives from the Great Lakes. Pages 203-210 in R. C. Sum-
merfelt and G. E. Hall, eds. Age and growth of fish. Iowa
State University Press, Ames.
Olson, D. E. 1980. Comparison of marks on scales and dorsal
spine sections as indicators of walleye age. Minnesota De-
partment of Natural Resources, Investigational Report 371,
St. Paul.
Pierce, C. L., J. B. Rasmussen, and W. C. Leggett. 1996. Back-
calculation of fish length from scales: empirical compari-
son of proportional methods. Transactions of the American
Fisheries Society 125:889-898.
Ricker, W. E. 1992. Back-calculation of fish lengths based on
proportionality between scales and length increments. Ca-
nadian Journal of Fisheries and Aquatic Sciences 49:1018-
1026.
Schram, S. T. 1989. Validating dorsal spine readings of wall-
eye age. Wisconsin Department of Natural Resources, Fish
Management Report 138, Madison.
Schramm, H. L., Jr., S. P. Malvestuto, and W. A. Hubert. 1992.
Evaluation of procedures for back-calculation of lengths of
largemouth bass aged by otoliths. North American Journal
of Fisheries Management 12:604-608.
Whitney, R. R., and K. D. Carlander. 1956. Interpretation of
body-scale regression for computing body length of fish.

Journal of Wildlife Management 20:21-27.
Table 1. Results of the regression analysis comparing back-calculated lengths (BCLs) at age along three spine transects, HE, HC, and AE, and two scale transects, AT, and DT, showing the slope of the regression line, intercept (Intcpt), the F - ratio, and R2 value. The Fraser-Lee model was used to calculate BCLs using both the spine and scale data. A standard intercept of 55 mm was used for all Fraser-Lee calculations. For all compari-sons, the degrees of freedom were 890 and the P < 0.00001. Comparison Slope Intcpt F R2
Between scale transects
AT - DT 1.0078 -4.858 35,877 0.9756
Between spine transects
HE - HC 0.9895 1.538 12,083 0.9308
HE - AE 0.9924 -6.844 24,706 0.9649
HC - AE 1.0050 -13.154 14,331 0.9414
Between spine and scale transects
HE - AT 0.9685 3.463 10,619 0.9220
HE - DT 0.9957 -7.957 13,149 0.9361
HC - AT 0.9899 -5.741 9,743 0.9156
HC - DT 1.0104 -14.924 9,831 0.9163
AE - AT 0.9649 9.761 11,608 0.9282
AE - DT 0.9839 5.547 12,456 0.9327

Table 2. Mean back-calculated lengths (BCLs) at age in mm for walleye collected from Green, Island, and Mille Lacs Lakes, Min-nesota. Length-at-age estimates were calculated along two scale transects, AT and DT, and along three spine transects, HE, HC, and AE using the Fraser-Lee formula. The number of fish aged in each population is indicated. Wilcoxin signed-rank tests were used to compare mean BCLs along the AT transect with the BCLs calculated along the other transects, with significant differ-ences noted with an * (� = 0.05).
Lake Age AT DT HE HC AE
Green Lake
N = 35 1 155 159 155 155 175*
2 256 260 255 261 275*
3 369 366 357* 365 372
4 445 439 433* 440 449
5 500 495 490 495 504*
6 523 521 515 516 517
7 491 495 493 496 498
Island Lake
N = 30 1 137 141* 143 127 151*
2 207 214 222 199 229
3 281 286 288 271 294
4 340 341 344 332 351*
5 381 381 388 386 394
6 412 411 414 416 419
7 443 442 443 444 443
8 470 470 470 469 469
Mille Lacs
N = 89 1 153 156 144* 140* 152
2 235 242* 219* 214* 225*
3 325 327 297* 301* 309*
4 398 401 385* 385* 398
5 452 454 447 446* 456
6 492 493 486 487 494
7 521 521 519 518 523
8 552 550 551 552 553
9 568 563 570 569 572

Figure 1. Scale showing the anterior transect AT and the diago-nal transect DT used for aging and back-calculation, and a cross section of a dorsal fin spine showing the horizontal elongated transect HE, the horizontal compressed transect HC, and the an-terior elongated transect AE used for aging and back-calculation estimates in walleye. Both the scale and spine cross section are from a 665 mm female walleye taken from Mille Lacs Lake, Minnesota. NOT DISPLAYED DUE TO SIZE OF IMAGE.
Figure 2. Age assigned using scales versus age assigned using dorsal fin spines from individual walleye sampled from Green Lake, Chisago County; Island Lake, St. Louis County; and Mille Lacs Lake, Mille Lacs County, Minnesota. The 1:1 line is in-cluded for reference. N = 266 walleye aged. NOT DISPLAYED DUE TO SIZE OF IMAGE.

Figure 3. Back-calculation estimates using the Fraser-Lee pro-portional method between the dorsal fin spine horizontal elon-gated transect HE and the scale anterior transect AT, and be-tween the spine horizontal compressed transect HC and the scale anterior transect AT. N = 154 walleye. Ages assigned ranged from 3 to 10 years. The 1:1 line is included for reference.
0
100
200
300
400
500
600
700
HE
0 100 200 300 400 500 600 700
AT
0
100
200
300
400
500
600
700
HE
0 100 200 300 400 500 600 700
DT

