company overview - eurotech this presentation has been prepared by eurotech s.p.a. (or...
TRANSCRIPT
Company Overview
GlobalInnovativeSustainable

DISCLAIMER
This presentation has been prepared by Eurotech S.p .A. (or “Eurotech”) and has to be read in conjunction with its oral presentation.
The information contained in this presentation does nor purport to be comprehensive. Neither Eurotech nor any of its officers, employees, advisers or agents accepts any responsibility for/or makes any representation or warranty, express or implied, as to the truth, fullness, accuracy or com pleteness of the information in this presentation ( or whether any information has been omitted from the presentation) or any other information relating to Eurotech, its subsidiaries or associated companies, whether written, oral or in a visual or electric form, transmitted or made avail able.
This document is confidential and is being provided to you solely for your information and may not be reproduced, further distributed to any other person or published, in wh ole or in part, for any purpose.
The distribution of this document in other jurisdic tions may be restricted by law, and persons into wh ose possession this document comes should inform themselves about, and observe, any such restrictions.
This document is directed only at relevant persons. Other persons should not act or rely on this docu ment or any of its contents.
No reliance may be placed for any purposes whatsoev er on the information contained in this document or any other material discussed during this presentation, or on its completeness, accuracy or fairness.
The information in this document and any other mate rial discussed at this presentation is subject to v erification, completion and change.
The information and opinions contained in this docu ment are provided as at the date of the presentatio n and are subject to change without notice.
Some of the information is still in draft form and will only be finalized.
By attending the presentation you agree to be bound by the foregoing terms.
Trademarks or Registered Trademarks are the propert y of their respective owners.
2

Quick Facts Sheet
(as at October 1st, 2013)
Founded in 1992
Public Listing on November 30th, 2005
Stock Tickers Bloomberg: ETM:IM; Reuters: E5T.MI
Sales FY 2012 93.6 M€
President & CEO Roberto Siagri
Headquarters Amaro (UD) - Italy
Global Presence Italy, United Kingdom, France, Singap ore, India, China, Japan, USA
Development & Engineering Locations
Amaro (Italy), Brescia (Italy),Cambridge (UK), Columb ia (MD,USA), Huntsville (AL, USA), Kansas City (KS, US A),Mission Viejo (CA,USA), Okayama (Japan)
Manufacturing Locations Amaro (Italy), Okayama (Japan), Columbia (MD, USA)
Worldwide Employees 366
3
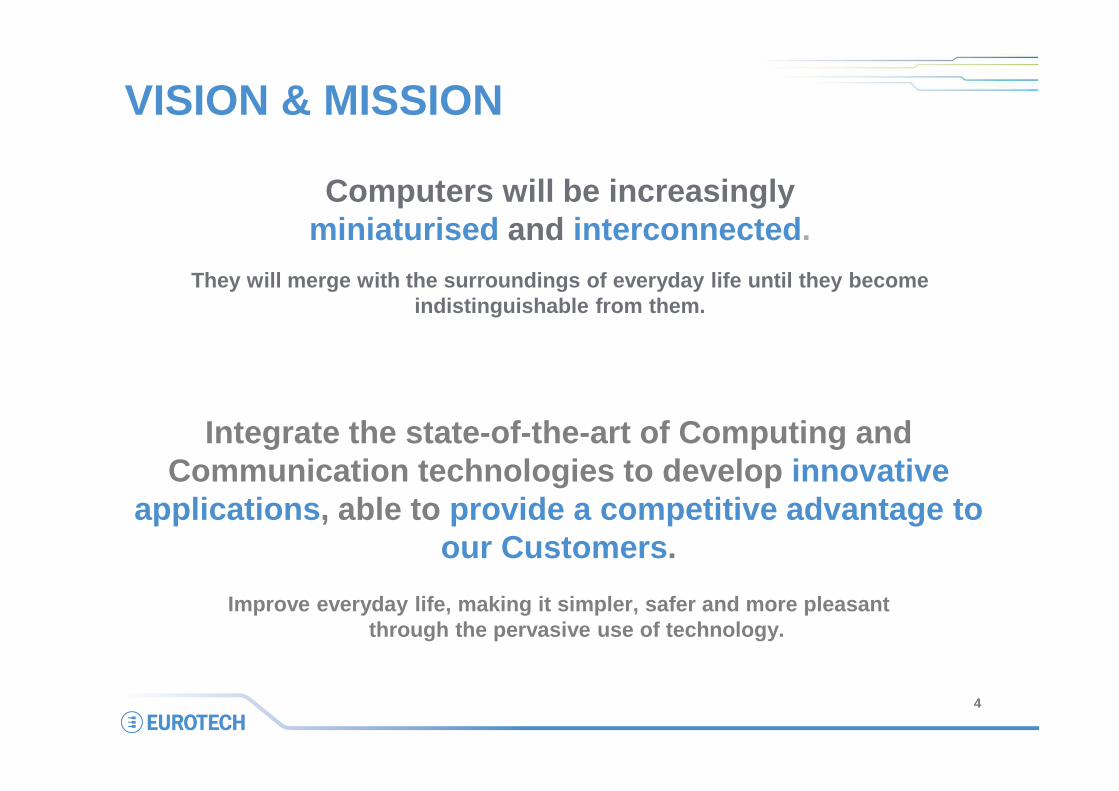
VISION & MISSION
Computers will be increasingly miniaturised and interconnected .
They will merge with the surroundings of everyday l ife until they become indistinguishable from them.
4
Integrate the state-of-the-art of Computing and Communication technologies to develop innovative
applications , able to provide a competitive advantage to our Customers .
Improve everyday life, making it simpler, safer and more pleasant through the pervasive use of technology.

The Eurotech Engine
Addressing the needs of an Interconnected Planet full of Distributed Intelligence.Leveraging Cloud Computing on-demand Infrastructure to enable the Internet of Things era
5
CUSTOMER
Competitive advantage
RUGGED Tough
ReliableLong-lasting
CUTTING-EDGE
TECHNOLOGYMiniaturized
High performanceLow power
Simplifying Complex Distributed Systems through HW and SW componentization

Eurotech's Essence
• Behind the products of more than 20 Global 500
• World top 10 player in the Embedded Computers market
• One of two European producers of High Performance Compu ters
• True global footprint spanning over 3 continents
• Public Company, in the STAR segment of Borsa Italian a
• Member of the UN Global Compact
• Core competences: Miniaturization & Interconnection of computing devices
• 2 Strategic Business Units:
– NanoPC SBU: Pervasive Computing Devices & Device Data Management
– HPC SBU: Green Petascale Supercomputers6

Eurotech's Main Shareholders
7
7.07%
11.08%
4.43%
2.31%
75.11%
Eurotech Management
Finmeccanica S.p.A.
Dino Paladin
Rollo Capital
Free float
Management

Global FootprintEurotech is a global company with operations in Eur ope, Asia and North America.
The Group is led by an industrial holding located i n the Northeast of Italy.
JAPAN
SINGAPOREITALYFRANCEUSA
USA
USA
UK
INDIA
Development & Engineering ProductionMarketing & Sales
USAHC 125
EUROPEHC 119
ASIAHC 176
Rev 44.6%
RoWRev. 2.0%
Rev 18.7%
Rev 34.7%
(as at 31 Dec 2012)
8

Eurotech’s Pillars
• Technological background: Pervasive Computing
• Core competences: Miniaturization & Interconnection of computers
• Focus on higher value-add for Customers
���� Selling enabling platforms, not just components
���� Eurotech as Partner for Innovation rather than just Supplier
• Fabless:
���� no constraints on product development
���� no inertia on business development
9

Value PropositionWe help Customers focus on their core competencies
Competitive Advantage
Dramatic reduction of time, cost and risk
� Shorter time to market� More deterministic development� Lower barrier to entry� Future proof� Cloud ready
10
Higher value-add for Customers
�Providing enabling platforms, not just components
More than excellent hardware

Product PortfolioHorizontal Product Lines. Vertical Industry Solution s.
High PerformanceComputing
Boards &Modules
Devices &Systems
Software & Services
Transportation & Mobility
Defence &Aerospace
Medical &Healthcare
Industrial & Commercial
Logistics &Networking
Security &Surveillance
11
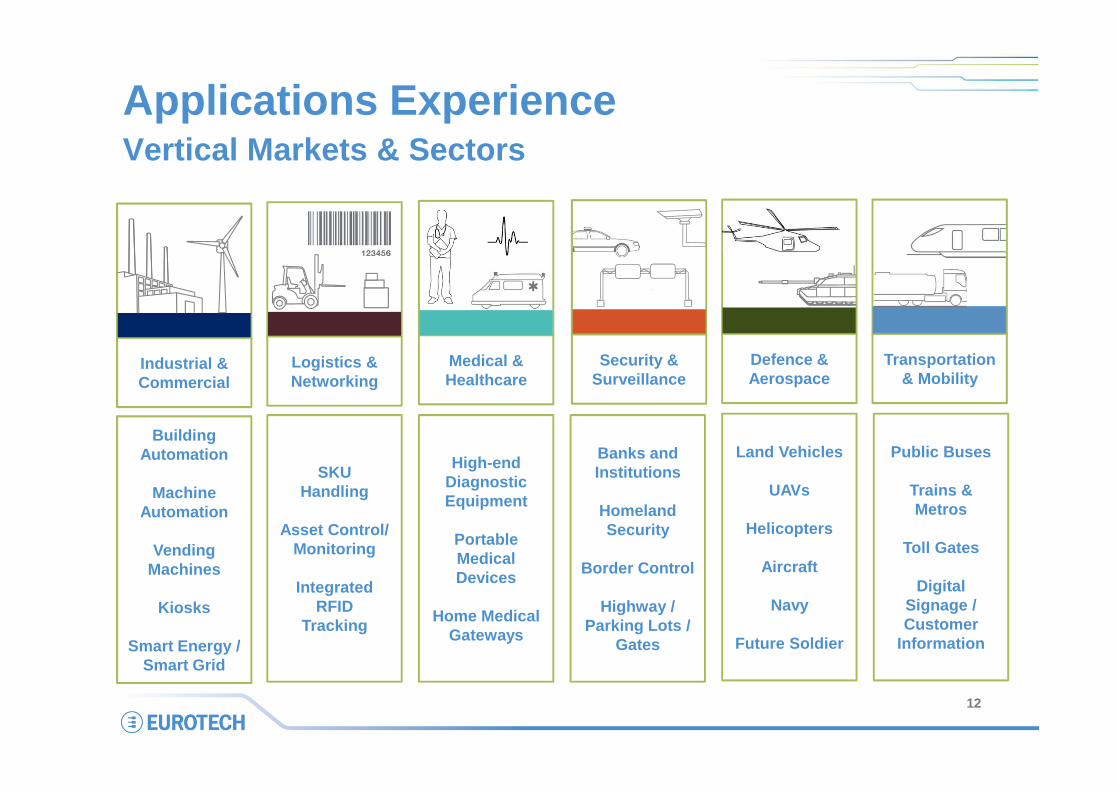
Applications ExperienceVertical Markets & Sectors
Transportation & Mobility
Defence &Aerospace
Medical &Healthcare
Industrial & Commercial
Logistics &Networking
Security &Surveillance
Building Automation
Machine Automation
Vending Machines
Kiosks
Smart Energy /Smart Grid
SKU Handling
Asset Control/ Monitoring
Integrated RFID
Tracking
Banks and Institutions
Homeland Security
Border Control
Highway / Parking Lots /
Gates
Land Vehicles
UAVs
Helicopters
Aircraft
Navy
Future Soldier
Public Buses
Trains & Metros
Toll Gates
Digital Signage / Customer
Information
High-end Diagnostic Equipment
Portable Medical Devices
Home MedicalGateways
12

13
Industry Diversification
50.4%
13
Transportation & Mobility
Defence &Aerospace
Medical &Healthcare
Industrial & Commercial
Logistics &Networking
Security &Surveillance
0.5% 9.8% 0.5% 17.3% 17.8%
(as at 31 Dec 2012)
3.6%HPC
Nano PC

Some of our typical Customers
Industrial & Commercial
Transportation & Mobility
14
Medical & Healthcare
Defence & Aerospace
(as at 31 Dec 2012)
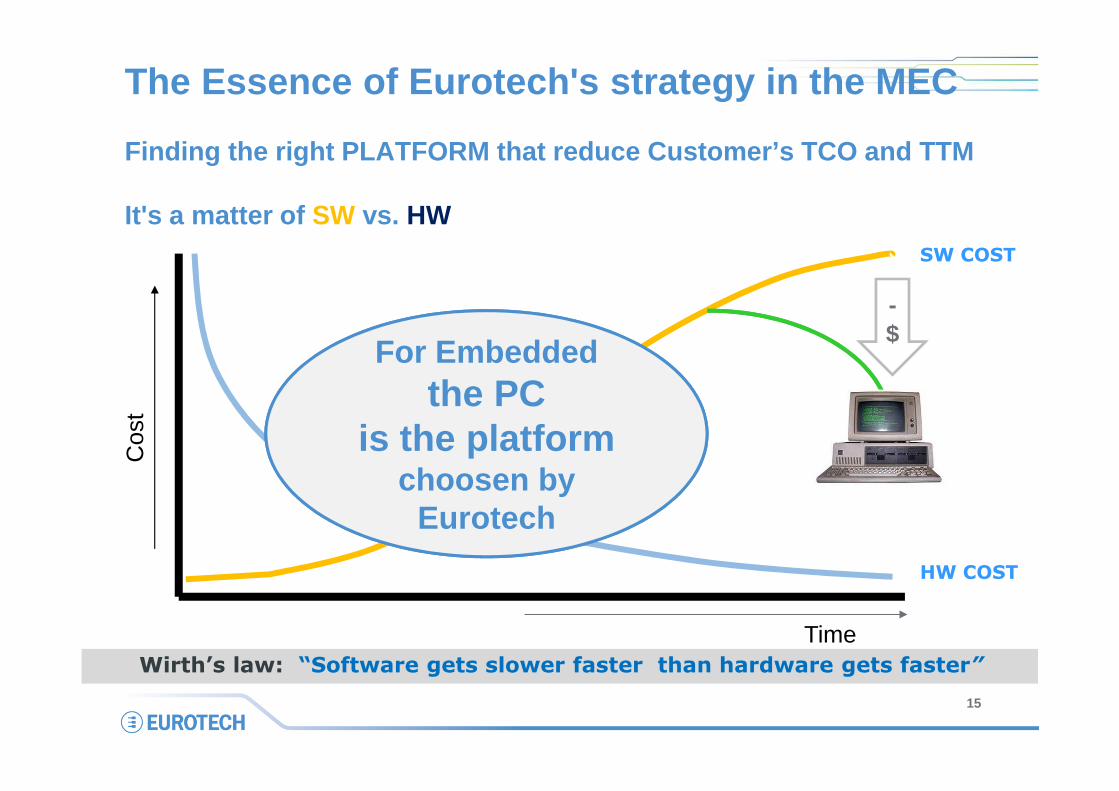
The Essence of Eurotech's strategy in the MEC
Finding the right PLATFORM that reduce Customer’s T CO and TTM
It's a matter of SW vs. HW
Cos
t
Time
HW COST
SW COST
-$
Wirth’s law: “Software gets slower faster than hardware gets faster”
15
For Embedded the PC
is the platformchoosen by
Eurotech
16
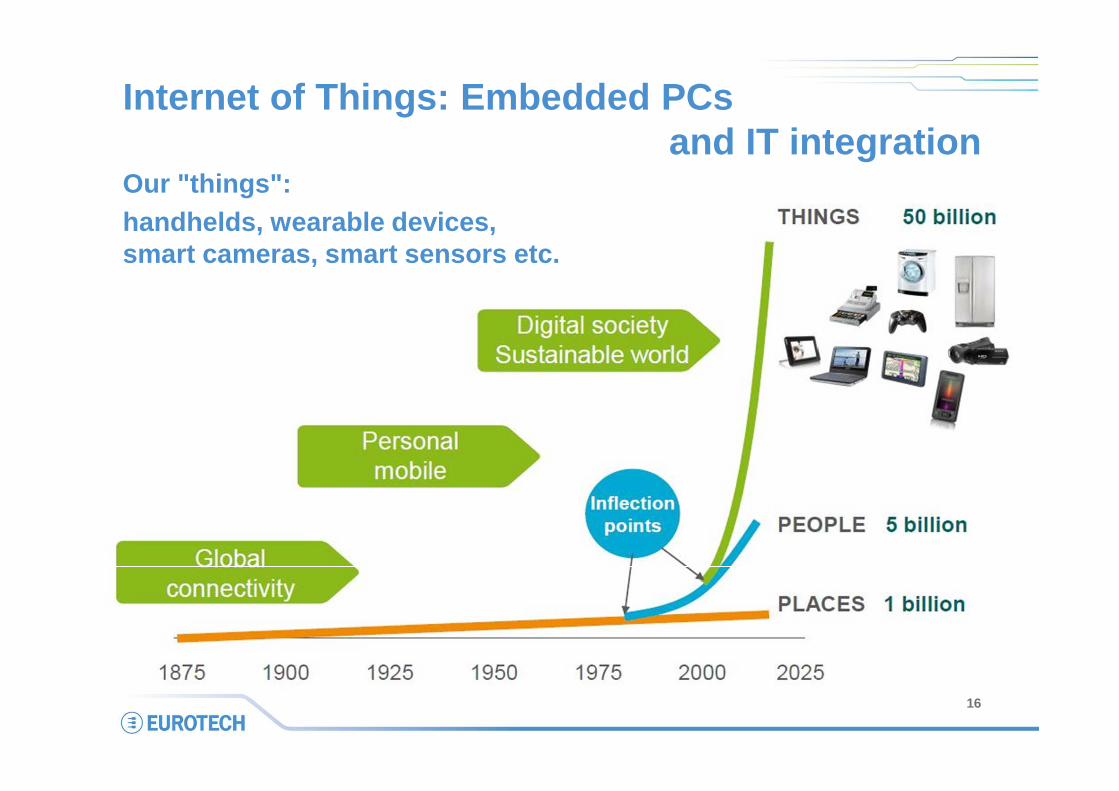
Internet of Things: Embedded PCsand IT integration
Our "things": handhelds, wearable devices, smart cameras, smart sensors etc.
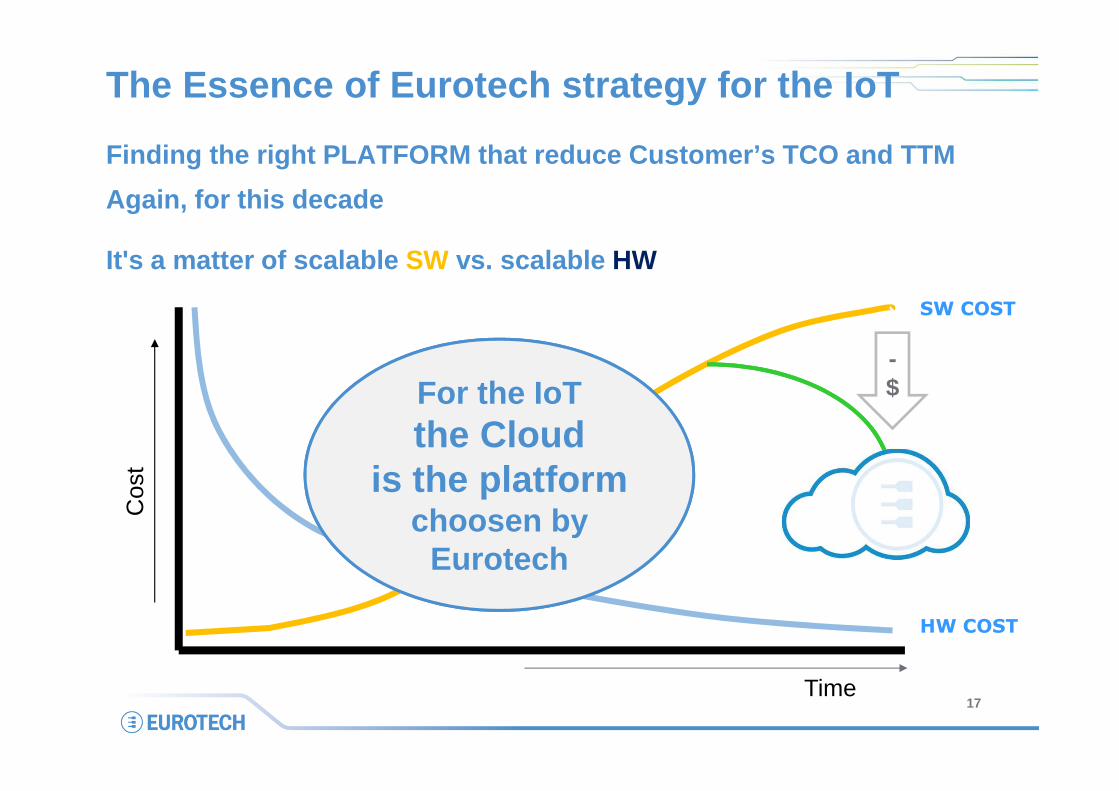
The Essence of Eurotech strategy for the IoT
Finding the right PLATFORM that reduce Customer’s T CO and TTM
Again, for this decade
It's a matter of scalable SW vs. scalable HW
Cos
t
Time
HW COST
SW COST
-$For the IoT
the Cloud is the platform
choosen by Eurotech
17

The Embedded world: i.e. the small world
18
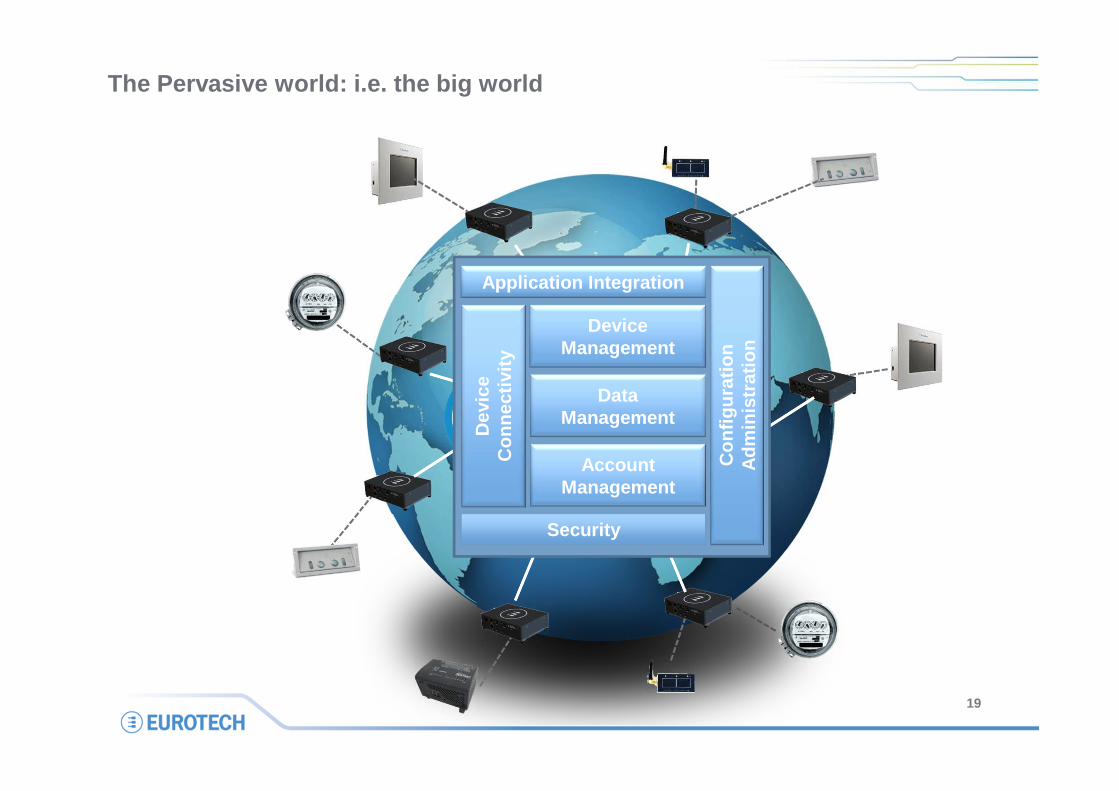
The Pervasive world: i.e. the big world
Application Integration
Dev
ice
Con
nect
ivity
Con
figur
atio
n A
dmin
istr
atio
n
Account Management
Security
Data Management
Device Management
19

Architecture Comparison
SAAS
@
Planetary Computer Embedd ed Computer
iPAAS
IAAS Hardware
Edge Controllers Edge Connectors
BIOS
OS
LocalApplications
PAAS
20

Where are we going?
Enabling our Pervasive Computing offer
through a New Infrastructure
that decouples
distributed data Producers (the "Things")
and
distributed data Consumers (the Business Apps, …and ultimately Human Beings)
21

The “Internet of Things”Reports & Predictions show large numbers...
Prediction for 2020
The connected device market will grow at more than 50% CAGR from 2015 to 2020.
… forecast of 28 billion internet connected devices by the end of 2020.
15 billion connected devices by 2015 (2009 estimate)
15 billion connected devices by 2019 (2011 estimate)
The total number of mobile connected devices will double from 6 billion today to 12 billion by 2020… … a revenue opportunity for mobile operators of nearly $1.2 trillion by 2020
22

Expanding the Total Addressable Market
From:$8B TAM of Embedded ComputersTo: $86B TAM of IoT / M2M Devices (Hardware a Platform S ervices)
In fact:
• IoT & M2M Device market is expected to grow to $85.9 B by 2017
• It is expected to have a CAGR of 26.1% from 2012 to 2017.
• The winner will be the one that will be able to of fer an integration
Platform.
• This is expected to help companies to address the n eed of the
customers more effectively.
23

Expanding the Total Addressable Market
From:$8B TAM of Embedded ComputersTo: $290B TAM of IoT / M2M Communication (Traffic & Servic es)
In fact:
• IoT & M2M Communication market is expected to grow from $44.0B in
2011 to $290.0B by 2017
• It is expected to have a CAGR of 30.1% from 2012 to 2017.
• Europe is expected to grow at a CAGR of 27.4% from 2012 to 2017.
• APAC and North America are estimated to grow at a C AGR of 33.2% and
28.3%, respectively, from 2012 to 2017.
24
Data StoreBroker

Strategic evolution of our Offering : Custom ���� Standard ���� as-a-Service
25
Ready-2-Use Devices
+ QUALIFIEDENCLOSURE
+ MIDDLEWARE
Boards & Modules
Today
Sub-Systems &ARP- Application Ready Platforms
Device To Cloud
+ CLOUD AGGREGATOR
SOFTWARE/SERVICES
+ MORE SOFTWARE
FRAMEWORKS
1992
2001 2005

Data Ready for Business
Applications
Eurotech Revolution : Towards Actionable Data
26
Real World
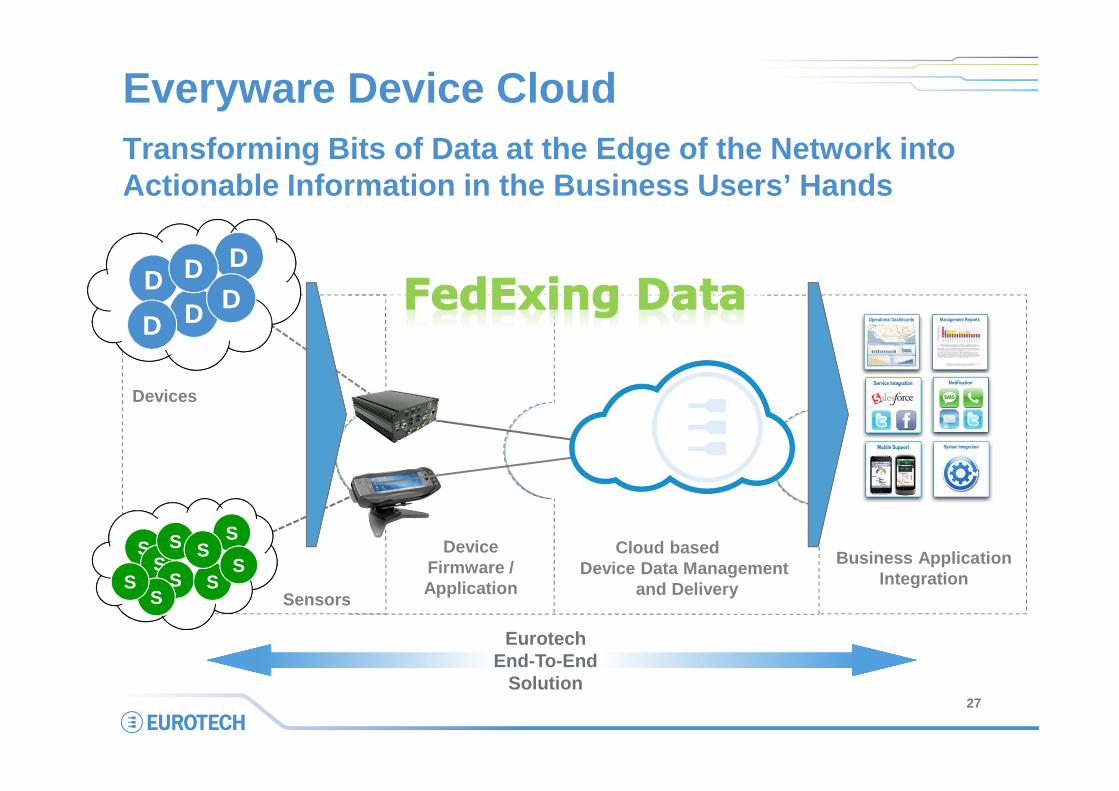
Everyware Device CloudTransforming Bits of Data at the Edge of the Networ k into Actionable Information in the Business Users’ Hands
Cloud based Device Data Management
and Delivery
Device Firmware /Application
Sensors
Business ApplicationIntegration
EurotechEnd-To-End
Solution
DD
DDD
D
SS
S S
S S
SS
SS
Devices
27

www.eurotech.com
Whosoever desires constant success must change his conduct with the times.
Niccolò Machiavelli
ANNEX A: FINANCIAL HIGHLIGHTS,
30 JUNE 2013
29 29

CONSOLIDATED INCOME STATEMENT
30
OPERATING RESULTS €'000
1H 2013 %1H 2012
Restaded^%
1H 2013
adjusted%
1H 2012
Restaded^
adjusted
%
SALES REVENUES 33,058 100.0% 42,176 100.0% 33,058 100.0% 42,176 100.0%
GROSS PROFIT 17,399 52.6% 20,728 49.1% 17,399 52.6% 20,728 49.1%
EBITDA (1,948) -5.9% (425) -1.0% (1,948) -5.9% (425) -1.0%
EBIT (5,378) -16.3% (4,202) -10.0% (3,757) -11.4% (2,322) -5.5%
PROFIT (LOSS) BEFORE TAXES (4,563) -13.8% (4,753) -11.3% (2,942) -8.9% (2,873) -6.8%
GROUP NET PROFIT (LOSS) FOR THE PERIOD (4,560) -13.8% (4,448) -10.5% (3,578) -10.8% (3,343) -7.9%
(^) Some of the amounts shown in this column do not correspond to those shown in the consolidated half-year financial statements at 30 June 2012, since they reflect the adjustments related to the IAS 19 revised.
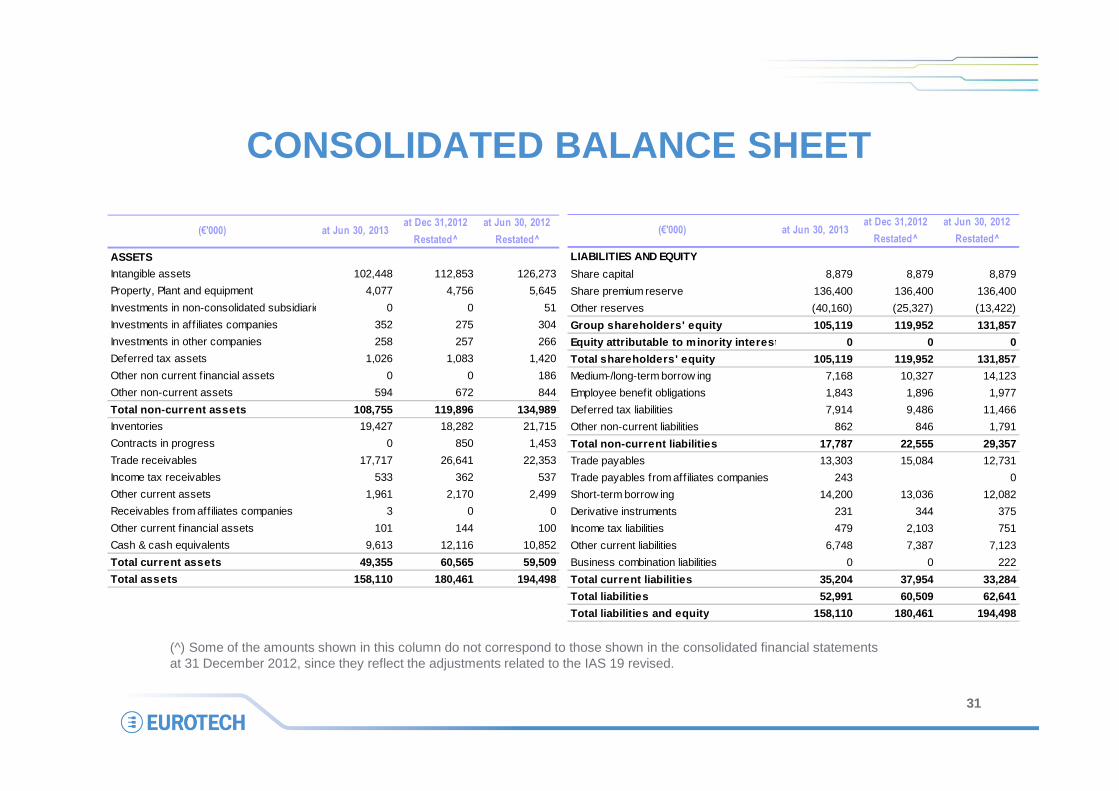
CONSOLIDATED BALANCE SHEET
31
(€'000) at Jun 30, 2013at Dec 31,2012
Restated^
at Jun 30, 2012
Restated^
ASSETS
Intangible assets 102,448 112,853 126,273
Property, Plant and equipment 4,077 4,756 5,645
Investments in non-consolidated subsidiaries 0 0 51
Investments in aff iliates companies 352 275 304
Investments in other companies 258 257 266
Deferred tax assets 1,026 1,083 1,420
Other non current f inancial assets 0 0 186
Other non-current assets 594 672 844
Total non-current assets 108,755 119,896 134,989
Inventories 19,427 18,282 21,715
Contracts in progress 0 850 1,453
Trade receivables 17,717 26,641 22,353
Income tax receivables 533 362 537
Other current assets 1,961 2,170 2,499
Receivables from aff iliates companies 3 0 0
Other current f inancial assets 101 144 100
Cash & cash equivalents 9,613 12,116 10,852
Total current assets 49,355 60,565 59,509
Total assets 158,110 180,461 194,498
(€'000) at Jun 30, 2013at Dec 31,2012
Restated^
at Jun 30, 2012
Restated^
LIABILITIES AND EQUITY
Share capital 8,879 8,879 8,879
Share premium reserve 136,400 136,400 136,400
Other reserves (40,160) (25,327) (13,422)
Group shareholders' equity 105,119 119,952 131,857
Equity attributable to minority interest 0 0 0
Total shareholders' equity 105,119 119,952 131,857
Medium-/long-term borrow ing 7,168 10,327 14,123
Employee benefit obligations 1,843 1,896 1,977
Deferred tax liabilities 7,914 9,486 11,466
Other non-current liabilities 862 846 1,791
Total non-current liabilities 17,787 22,555 29,357
Trade payables 13,303 15,084 12,731
Trade payables from aff iliates companies 243 0
Short-term borrow ing 14,200 13,036 12,082
Derivative instruments 231 344 375
Income tax liabilities 479 2,103 751
Other current liabilities 6,748 7,387 7,123
Business combination liabilities 0 0 222
Total current liabilities 35,204 37,954 33,284
Total liabilities 52,991 60,509 62,641
Total liabilities and equity 158,110 180,461 194,498
(^) Some of the amounts shown in this column do not correspond to those shown in the consolidated financial statements at 31 December 2012, since they reflect the adjustments related to the IAS 19 revised.

-35.000
-15.000
5.000
25.000
45.000
65.000
85.000
105.000
125.000
at Dec 31,2012 Restated^ at Jun 30, 2013
SHEREOLDERS' EQUITY
NET DEBT
CASH & CASH EQUIVALENTS
EQUITY, CASH AND NET DEBTCASH AND NET DEBT , 31 December 2012 and 30 June 2013 (€/000)
105,119
119,952
9,613
12,116
-11,885
32-11,447
(^) Some of the amounts shown in this graph do not correspond to those shown in the consolidated financial statements at 31 December 2012, since they reflect the adjustments related to the IAS 19 revised.

at Jun 30, 2012 at Dec 31,2012 at Jun 30, 2013
NET WORKING CAPITALNWC at the end of each period (€/000)
23,731 18,868
33
27,952

0
0
0
0
0
1
at Jun 30, 2012 at Dec 31,2012 at Jun 30, 2013
EMPLOYEESHeadcount at the end of each period
429
34
420 416

ANNEX B: FINANCIAL HIGHLIGHTS,
31 DECEMBER 2012
35 35

CONSOLIDATED INCOME STATEMENT
36
OPERATING RESULTS €'00031 Dec '12 % 31 Dec '11 %
31 Dec '12
adjusted%
31 Dec '11
adjusted%
SALES REVENUES 93,627 100.0% 93,806 100.0% 93,627 100.0% 93,806 100.0%
GROSS PROFIT 48,983 52.3% 47,292 50.4% 48,983 52.3% 47,292 50.4%
EBITDA 8,003 8.5% 3,090 3.3% 8,003 8.5% 4,000 4.3%
EBIT (34) 0.0% (4,875) -5.2% 3,760 4.0% (520) -0.6%
PROFIT (LOSS) BEFORE TAXES (271) -0.3% (6,613) -7.0% 3,523 3.8% (2,258) -2.4%
GROUP NET PROFIT (LOSS) FOR THE PERIOD (2,783) -3.0% (7,246) -7.7% (551) -0.6% (5,498) -5.9%

CONSOLIDATED BALANCE SHEET
37
(€'000) at Dec 31, 2012 at Dec 31,2011
ASSETS
Intangible assets 112,853 125,922
Property, Plant and equipment 4,756 5,897
Investments in aff iliates companies 275 278
Investments in other companies 257 270
Deferred tax assets 1,083 1,439
Other non current f inancial assets 0 226
Other non-current assets 672 843
Total non-current assets 119,896 134,875
Inventories 18,282 23,734
Contracts in progress 850 2,356
Trade receivables 26,641 26,724
Income tax receivables 362 938
Other current assets 2,170 2,569
Receivables from aff iliates companies 0 1,163
Short term borrow ing allow ed to affiliates companies and other Group companies
0 178
Other current financial assets 144 0
Cash & cash equivalents 12,116 13,596
Total current assets 60,565 71,258
Total assets 180,461 206,133
(€'000) at Dec 31, 2012 at Dec 31,2011
LIABILITIES AND EQUITY
Share capital 8,879 8,879
Share premium reserve 136,400 136,400
Other reserves (25,107) (10,236)
Group shareholders' equity 120,172 135,043
Equity attributable to minority interest 0 0
Total shareholders' equity 120,172 135,043
Medium-/long-term borrow ing 10,327 10,482
Employee benefit obligations 1,676 1,718
Deferred tax liabilities 9,486 12,111
Other non-current liabilities 846 1,586
Total non-current liabilities 22,335 25,897
Trade payables 15,084 18,388
Short-term borrow ing 13,036 17,253
Derivative instruments 344 376
Income tax liabilities 2,103 1,731
Other current liabilities 7,387 7,229
Business combination liabilities 0 216
Total current liabilities 37,954 45,193
Total liabilities 60,289 71,090
Total liabilities and equity 180,461 206,133