common pitfalls for your drupal site, and how to avoid them
TRANSCRIPT

Common Drupal Pitfalls...and how to avoid them.
Acquia Webinar, 18-May-2015
Common Drupal Pitfalls
● Key performance and scalability issues○ How to identify them
● What not to do
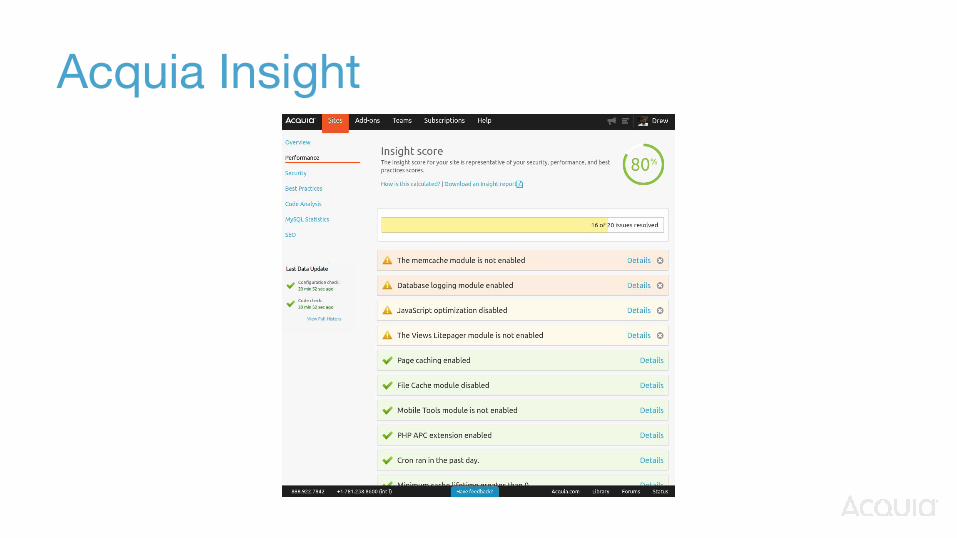
Acquia Insight
Cache
● Drupal's page cache● Keep it anonymous
○ avoid SESSions● External caching● Purging and long TTLs● Block / Views / Panels / Authcache● Drupal 8
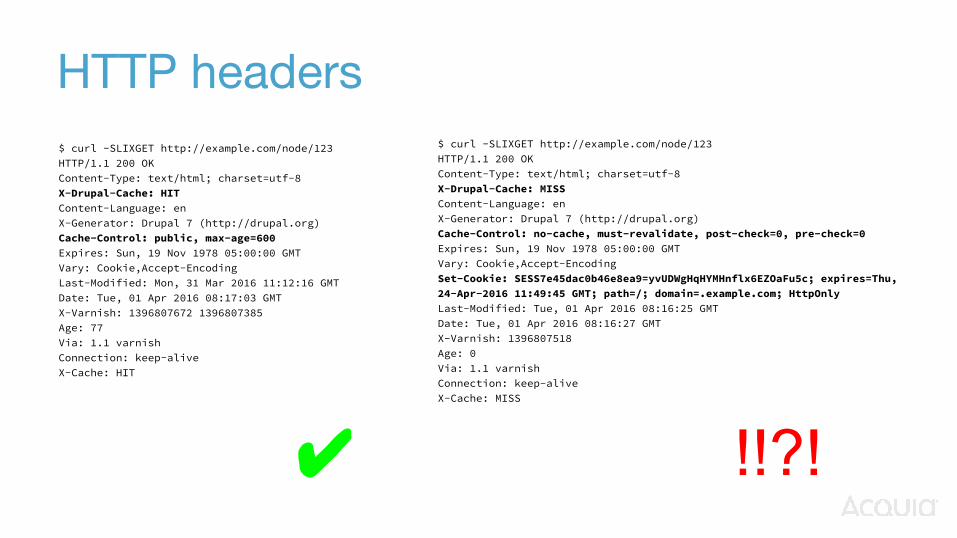
HTTP headers$ curl -SLIXGET http://example.com/node/123HTTP/1.1 200 OKContent-Type: text/html; charset=utf-8X-Drupal-Cache: HITContent-Language: enX-Generator: Drupal 7 (http://drupal.org)Cache-Control: public, max-age=600Expires: Sun, 19 Nov 1978 05:00:00 GMTVary: Cookie,Accept-EncodingLast-Modified: Mon, 31 Mar 2016 11:12:16 GMTDate: Tue, 01 Apr 2016 08:17:03 GMTX-Varnish: 1396807672 1396807385Age: 77Via: 1.1 varnishConnection: keep-aliveX-Cache: HIT
$ curl -SLIXGET http://example.com/node/123HTTP/1.1 200 OKContent-Type: text/html; charset=utf-8X-Drupal-Cache: MISSContent-Language: enX-Generator: Drupal 7 (http://drupal.org)Cache-Control: no-cache, must-revalidate, post-check=0, pre-check=0Expires: Sun, 19 Nov 1978 05:00:00 GMTVary: Cookie,Accept-EncodingSet-Cookie: SESS7e45dac0b46e8ea9=yvUDWgHqHYMHnflx6EZOaFu5c; expires=Thu, 24-Apr-2016 11:49:45 GMT; path=/; domain=.example.com; HttpOnlyLast-Modified: Tue, 01 Apr 2016 08:16:25 GMTDate: Tue, 01 Apr 2016 08:16:27 GMTX-Varnish: 1396807518Age: 0Via: 1.1 varnishConnection: keep-aliveX-Cache: MISS
✔ !!?!
Database
● Typically single-threaded● ...is a slow cache backend
○ e.g. memcache○ cache_form
● Avoid writes wherever possible○ dblog, statistics
● Slow query logging
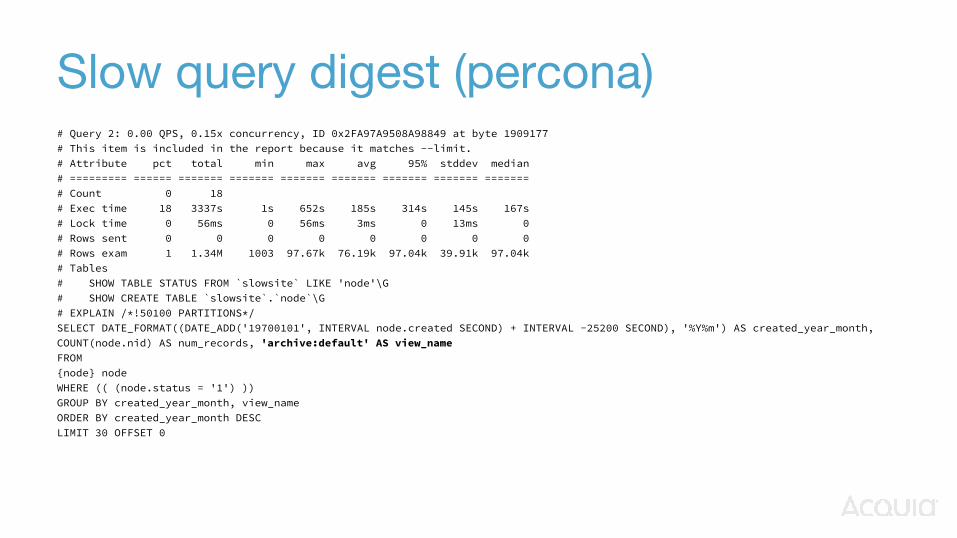
Slow query digest (percona)# Query 2: 0.00 QPS, 0.15x concurrency, ID 0x2FA97A9508A98849 at byte 1909177# This item is included in the report because it matches --limit.# Attribute pct total min max avg 95% stddev median# ========= ====== ======= ======= ======= ======= ======= ======= =======# Count 0 18# Exec time 18 3337s 1s 652s 185s 314s 145s 167s# Lock time 0 56ms 0 56ms 3ms 0 13ms 0# Rows sent 0 0 0 0 0 0 0 0# Rows exam 1 1.34M 1003 97.67k 76.19k 97.04k 39.91k 97.04k# Tables# SHOW TABLE STATUS FROM `slowsite` LIKE 'node'\G# SHOW CREATE TABLE `slowsite`.`node`\G# EXPLAIN /*!50100 PARTITIONS*/SELECT DATE_FORMAT((DATE_ADD('19700101', INTERVAL node.created SECOND) + INTERVAL -25200 SECOND), '%Y%m') AS created_year_month, COUNT(node.nid) AS num_records, 'archive:default' AS view_nameFROM{node} nodeWHERE (( (node.status = '1') ))GROUP BY created_year_month, view_nameORDER BY created_year_month DESCLIMIT 30 OFFSET 0
Resources
● PHP processes○ run cron via drush
● APC / opcode cache○ disable UI modules
● Memory / time○ bootstrap smoke test○ memory_profiler○ XHProf and / or New Relic
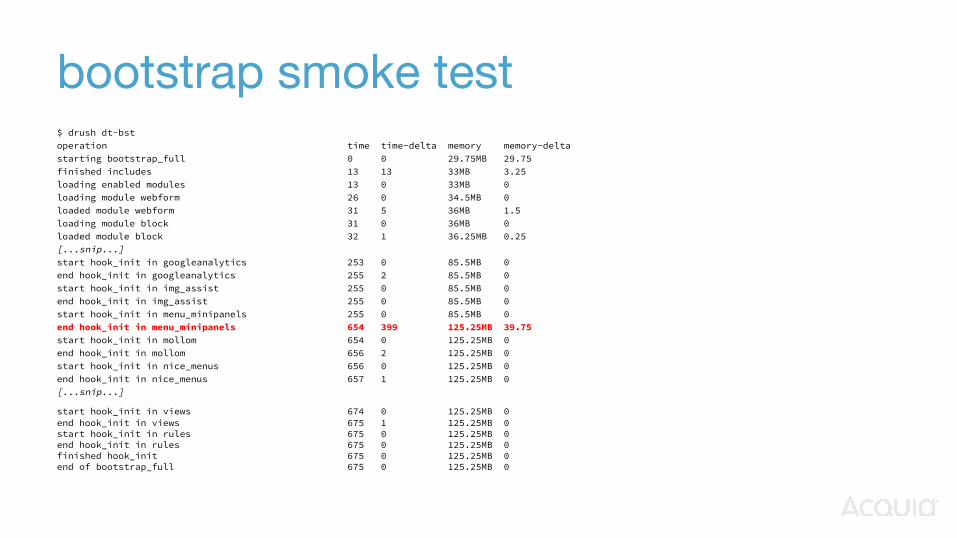
bootstrap smoke test$ drush dt-bstoperation time time-delta memory memory-deltastarting bootstrap_full 0 0 29.75MB 29.75 finished includes 13 13 33MB 3.25 loading enabled modules 13 0 33MB 0 loading module webform 26 0 34.5MB 0 loaded module webform 31 5 36MB 1.5 loading module block 31 0 36MB 0 loaded module block 32 1 36.25MB 0.25[...snip...]start hook_init in googleanalytics 253 0 85.5MB 0 end hook_init in googleanalytics 255 2 85.5MB 0 start hook_init in img_assist 255 0 85.5MB 0 end hook_init in img_assist 255 0 85.5MB 0 start hook_init in menu_minipanels 255 0 85.5MB 0 end hook_init in menu_minipanels 654 399 125.25MB 39.75 start hook_init in mollom 654 0 125.25MB 0 end hook_init in mollom 656 2 125.25MB 0 start hook_init in nice_menus 656 0 125.25MB 0 end hook_init in nice_menus 657 1 125.25MB 0[...snip...]
start hook_init in views 674 0 125.25MB 0 end hook_init in views 675 1 125.25MB 0 start hook_init in rules 675 0 125.25MB 0 end hook_init in rules 675 0 125.25MB 0 finished hook_init 675 0 125.25MB 0 end of bootstrap_full 675 0 125.25MB 0
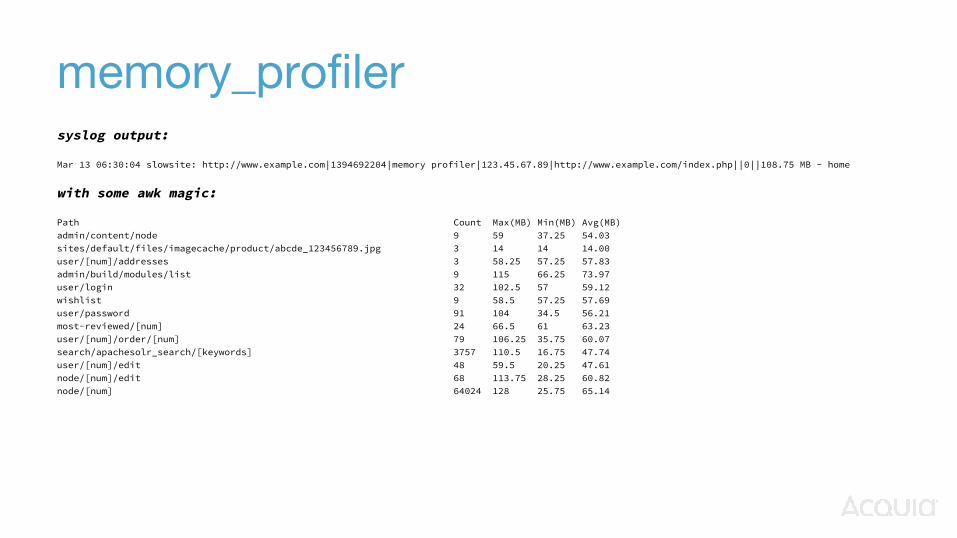
memory_profilersyslog output:
Mar 13 06:30:04 slowsite: http://www.example.com|1394692204|memory profiler|123.45.67.89|http://www.example.com/index.php||0||108.75 MB - home
with some awk magic:
Path Count Max(MB) Min(MB) Avg(MB)admin/content/node 9 59 37.25 54.03sites/default/files/imagecache/product/abcde_123456789.jpg 3 14 14 14.00user/[num]/addresses 3 58.25 57.25 57.83admin/build/modules/list 9 115 66.25 73.97user/login 32 102.5 57 59.12wishlist 9 58.5 57.25 57.69user/password 91 104 34.5 56.21most-reviewed/[num] 24 66.5 61 63.23user/[num]/order/[num] 79 106.25 35.75 60.07search/apachesolr_search/[keywords] 3757 110.5 16.75 47.74user/[num]/edit 48 59.5 20.25 47.61node/[num]/edit 68 113.75 28.25 60.82node/[num] 64024 128 25.75 65.14
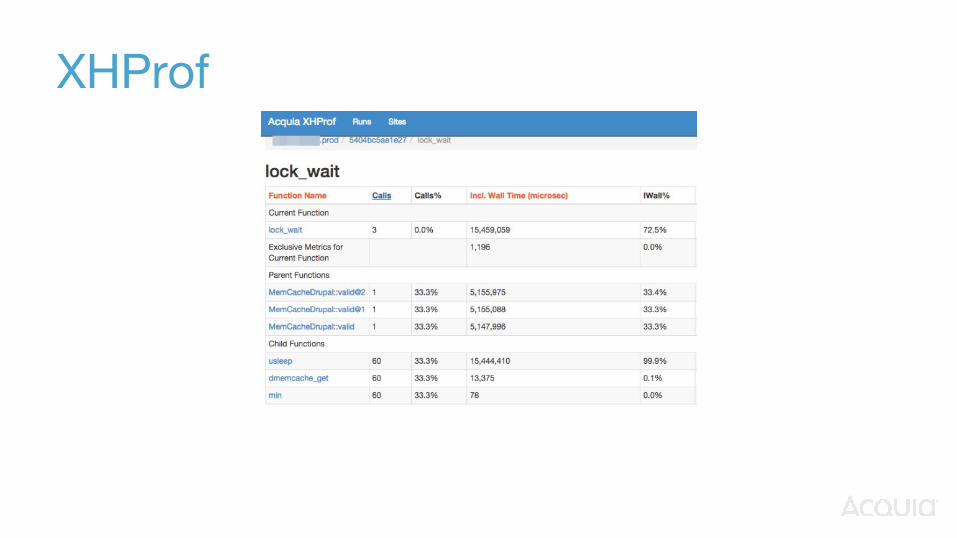
XHProf
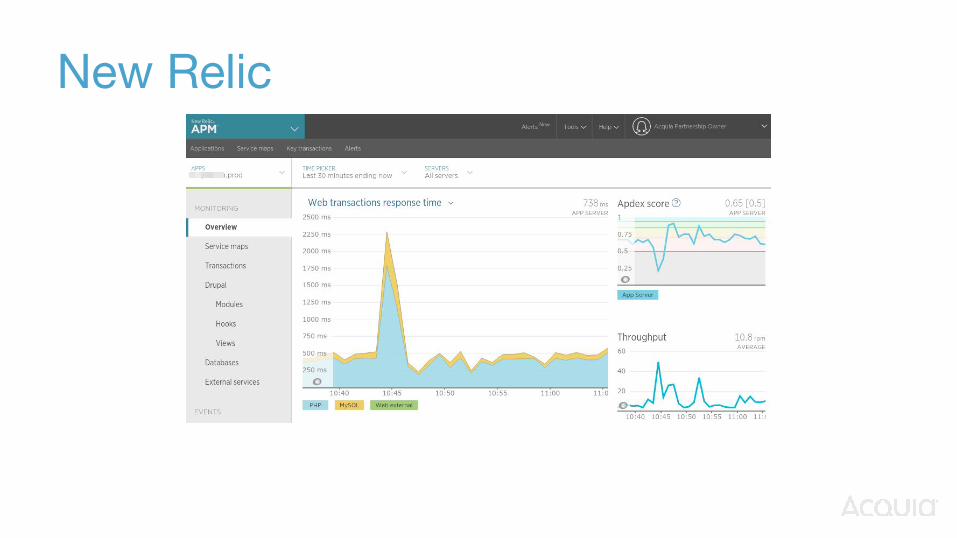
New Relic
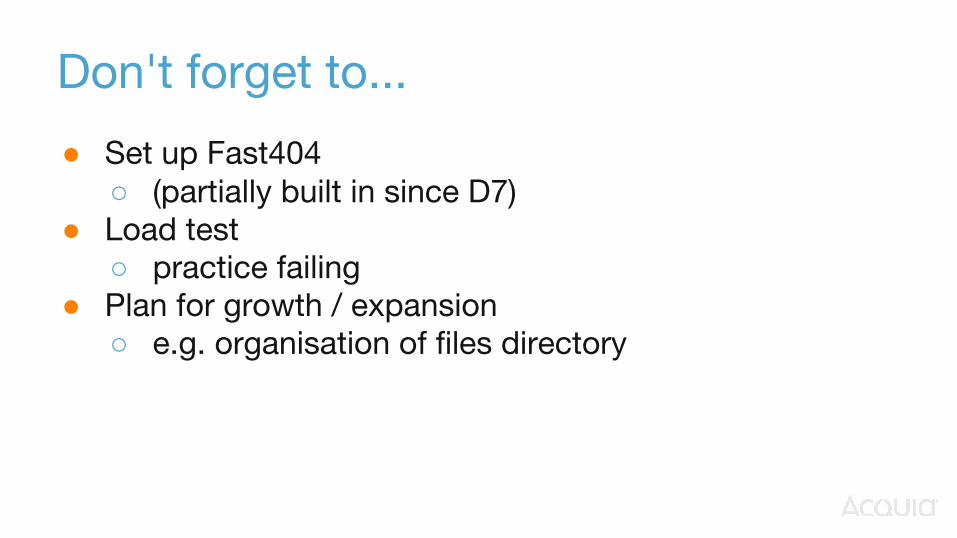
Don't forget to...
● Set up Fast404○ (partially built in since D7)
● Load test○ practice failing
● Plan for growth / expansion○ e.g. organisation of files directory
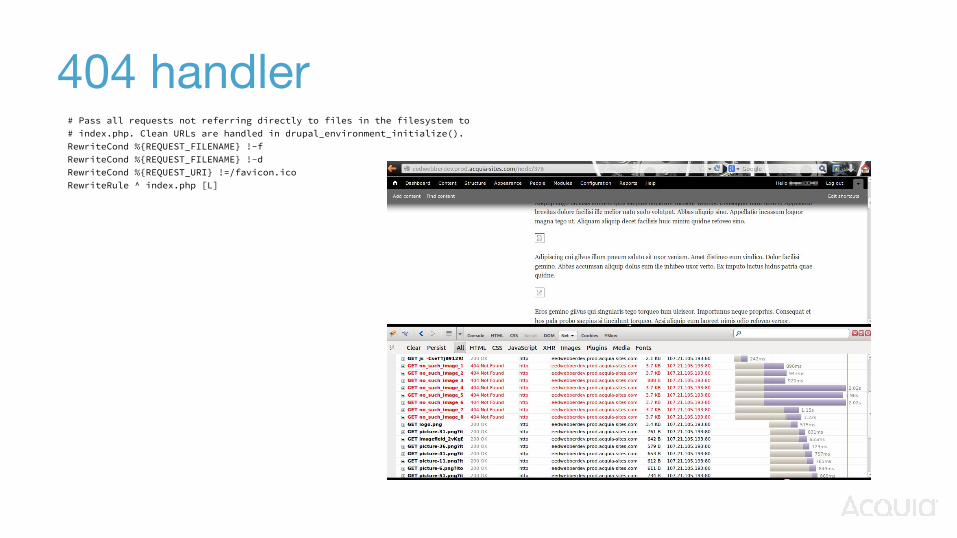
404 handler# Pass all requests not referring directly to files in the filesystem to# index.php. Clean URLs are handled in drupal_environment_initialize().RewriteCond %{REQUEST_FILENAME} !-fRewriteCond %{REQUEST_FILENAME} !-dRewriteCond %{REQUEST_URI} !=/favicon.icoRewriteRule ^ index.php [L]
What not to do
● Blocking external call (in eval’d PHP stored in the db, to a dyndns host)
● Hacking core (badly)
● variable_set (see cache_debug)
● debugging left on / error_reporting off● drupal_add_js() with a timestamp● nuke cache from orbit● expensive 404s● PHP filter for anon● one way ticket releases

Thank You - Questions?