commercial real estate outlook august 2013
TRANSCRIPT
7/30/2019 Commercial Real Estate Outlook August 2013
http://slidepdf.com/reader/full/commercial-real-estate-outlook-august-2013 1/9
COMMERCIAL REAL ESTATE
OUTLOOK
George Ratiu
Manager, Quantitative & Commercial Research
As the traditional summer vacation seasonwrapped up, it became easier to focus onthe economic performance over the first half of the year. However, the task became an
exercise in reading fortune cookies giventhe many changes in the economy, themarkets, and the legislative environment.
The main measure of economic activity—
gross domestic product—has beenredefined and revised by the Bureau of Economic Analysis during the secondquarter. It has been redefined to includebusiness investments in intellectualproperty, such as research & development,
software, and entertainment and originalartistic work. GDP has also been revised, asit normally is at regular intervals.
The results point to an economy thatnominally is much stronger than it was aquarter ago, by almost $2.0 trillion. At thesame time, the revised annual rate of growth for first quarter GDP dropped from2.7 to 1.2 percent. However, the estimatefor the second quarter growth rate is 1.7
percent, indicating an acceleratingeconomy. Of course, given the pace of acceleration, we should not expect anywhiplash, as there is no hurry in the macroadvance.
After GDP revisions, business spendingshows growing confidence in the first half of the year. The first quarter spending wasdown 4.6 percent, with a decline driven by a25.7 percent drop in spending oncommercial structures.
However, the second quarter posted a mubetter performance, with an annual growthrate of 4.6 percent. Spending on commercbuildings rose 6.8 percent. Businesses alsincreased their spending on informationprocessing and transportation equipment b11.4 percent and 5.5 percent, respectivelyThe new component of businessspending—intellectual property products—
rose 3.9 percent in the second quarter,boosted by software and R&D.
Despite slowing global economies,international trade remained brisk. Exportrose 5.4 percent in the second quarter, afta 1.3 percent decline in the first quarter.Imports increased 9.5 percent in the seconquarter, leading to a widening balance of
trade.
(continued on page 2)
Growing Economy Boosts Commercial Sales 24 Percent in 2013.H1
NATIONAL ASSOCIATION OF REALTORS ® | RESEARCH DIVISIO
2.0
1.3
3.1
0.4
2.4
2012.Q1 2012.Q2 2012.Q3 2012.Q4 2013.Q
GDP (% Annual Chg.)
Source:

7/30/2019 Commercial Real Estate Outlook August 2013
http://slidepdf.com/reader/full/commercial-real-estate-outlook-august-2013 2/9
2
ntinued from page 1)
e looming costs and uncertainty of the coming Patientotection and Affordable Care Act are certainly keepingsinesses cautious. Business savings—cash inerves—reached a record $3.5 trillion in the first
arter, as corporate real profits after tax posted $1.7ion in the first quarter. Businesses continue tockpile cash reserves as a hedge against uncertaintyd increased costs.
at uncertainty is also illustrated in the employment
mbers. Payroll employment in the second quarter ned 563,000 jobs, a lower figure than the first quarter’s
2,000. July’s employment figure of 162,000
appointed expectations and indicated a slowdown inng during the first month of the third quarter. On theside, employment remained positive and the economy
making progress toward closing the post-recessionp. The unemployment rate declined from 7.7 percent infirst quarter to 7.6 percent in the second, and then toin July. However, part of the decline is attributable to
owering of the labor force participation rate.
nsumers maintained a moderate spending pace,hough at a weaker rate of growth in the secondarter —1.8 percent compared with 2.3 percent in thet quarter. The cutbacks came in several areas—motor
hicles and parts, housing and utilities, and foodrvices and accommodations. However, consumersped their spending for furnishings, recreation andreational goods, transportation and health care.
erestingly, consumer spending on recreational vehiclesd goods rose at a 12.3 percent annual rate, signalingewed interest in leisure travel.
vernment spending—another major component of DP—shrank 0.4 percent in the second quarter, as the
questration” took effect. At the federal level, spending
clined 1.5 percent. Following three years of cuts,ending at the state and local levels is showing signs of bilization, posting a 0.3 percent increase in the secondarter.
COMMERCIAL REAL ESTAT
OUTLOOK
ATIONAL ASSOCIATION of REALTORS® | RESEARCH DIVISION | www.realtors.org/research-and-statistics
The outlook for the remainder of 2013 is for GDP to growat a 1.6 percent annual rate. Payroll employment isexpected to rise 1.5 percent, leading to a net 2.4 millionnew jobs for the year.
Commercial Real Estate
Sales of major properties (over $2M) advanced 24percent on a yearly basis during the first half of this yeartotaling $145.3 billion, based on Real Capital Analytics
(RCA) data. Most property types registered double-digigrowth rates, signaling strong investor interest incommercial assets. Based on National Association of REALTORS® data, sales of properties at the lower end the price range (mostly below $2 million) increased 12percent on a yearly basis.
Portfolio sales made up a significant part of transactionsin the first half of the year, with Archstone’s sale of apartment properties accounting for over $14 billion of thtotal. Hotels were another major component of the top
portfolio transactions. On the individual property side, thGeneral Motors building in New York ranked at the top,selling for $1.3 billion, at $1,766 per square foot. Officeproperties made up the top three, with Sony Plaza and425 Lexington Avenue, both in New York, coming insecond and third place.
In line with growing demand for properties, prices rose 8percent on a yearly basis, according to RCA’s
Commercial Property Price Index. Prices rose the mostfor apartments (15%) and retail buildings (13%). Theaverage apartment unit price reached $108.347. Retailspaces commanded $166 per square foot. Officebuildings traded for an average of $212 per square foot,up 7 percent year-over-year. Industrial properties posteaverage prices of $63 per square foot, a 5 percent declinfrom a year ago. Cap rates inched up 17 basis points, toan average 7 percent nationally across all property typeFor lower priced properties (below $2M), prices increase2 percent year-over-year, based on survey data from theNational Association of REALTORS®.
(continued on page 3)
7/30/2019 Commercial Real Estate Outlook August 2013
http://slidepdf.com/reader/full/commercial-real-estate-outlook-august-2013 3/9
3
ntinued from page 2)
estor interest in secondary and tertiary marketsntinued in the first half of the year. Markets likecksonville, Long Island, Philadelphia, Las Vegas postedle-digit growth rates in sales volume. By the year’s
dpoint, 31 markets exceeded the $1 billion mark.erms of dollar volume, Manhattan, Los Angeles and
C’s Northern Virginia suburbs rank at the top of the list.
wever, Dallas and Houston move in the top five,rpassing Atlanta, Chicago and Boston.
stressed properties accounted for $118 billion across alloperty types, with office making up $36.5 billion of theal. The workout rates have been steadily climbing,aching 66% in the first half of the year. Apartments andels recorded the highest workout rates, at 68% and%, respectively.
w commercial distress is on a downward trend, asset values continue to rise. CMBS continues to hold
largest proportion of outstanding distress—45%. U.S.
nks are the second largest holder of distressedoperties, accounting for 25%.
veral markets stand out for their rates of distressrkouts. Las Vegas retains the top spot in terms of totalrrent outstanding distress--$11.4 billion. Its workoute is 43%, a fairly low figure. Manhattan posted thecond highest current outstanding distress volume,aling $8.4 billion. However, its workout rate reached% in the first half of the year. Other markets with hightress workout rates were DC (82), San Francisco%), Pittsburgh (79%) and San Jose (76%).
COMMERCIAL REAL ESTAT
OUTLOOK
ATIONAL ASSOCIATION of REALTORS® | RESEARCH DIVISION | www.realtors.org/research-and-statistics
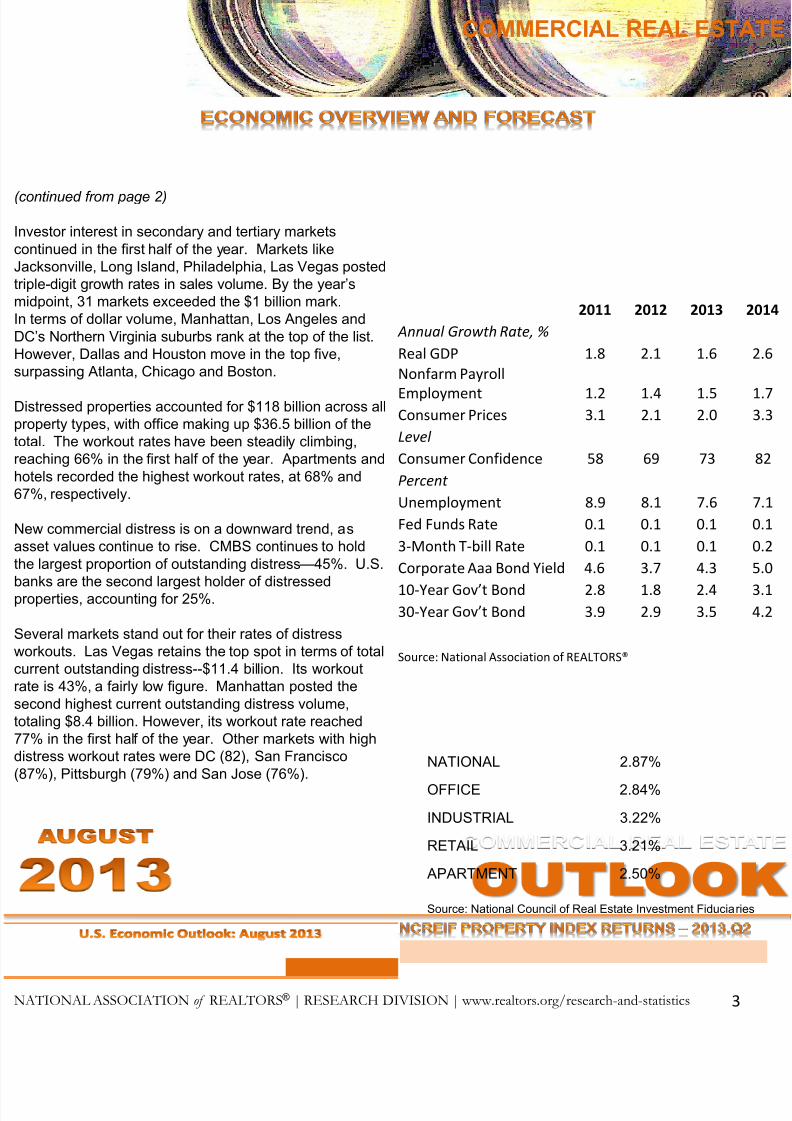
2011 2012 2013 20
Annual Growth Rate, %
Real GDP 1.8 2.1 1.6 2.
Nonfarm Payroll
Employment 1.2 1.4 1.5 1.Consumer Prices 3.1 2.1 2.0 3.
Level
Consumer Confidence 58 69 73 8
Percent
Unemployment 8.9 8.1 7.6 7.
Fed Funds Rate 0.1 0.1 0.1 0.
3-Month T-bill Rate 0.1 0.1 0.1 0.
Corporate Aaa Bond Yield 4.6 3.7 4.3 5.
10-Year Gov’t Bond 2.8 1.8 2.4 3.30-Year Gov’t Bond 3.9 2.9 3.5 4.
Source: National Association of REALTORS®
NATIONAL 2.87%
OFFICE 2.84%
INDUSTRIAL 3.22%
RETAIL 3.21%
APARTMENT 2.50%
Source: National Council of Real Estate Investment Fiduciaries
7/30/2019 Commercial Real Estate Outlook August 2013
http://slidepdf.com/reader/full/commercial-real-estate-outlook-august-2013 4/9
4
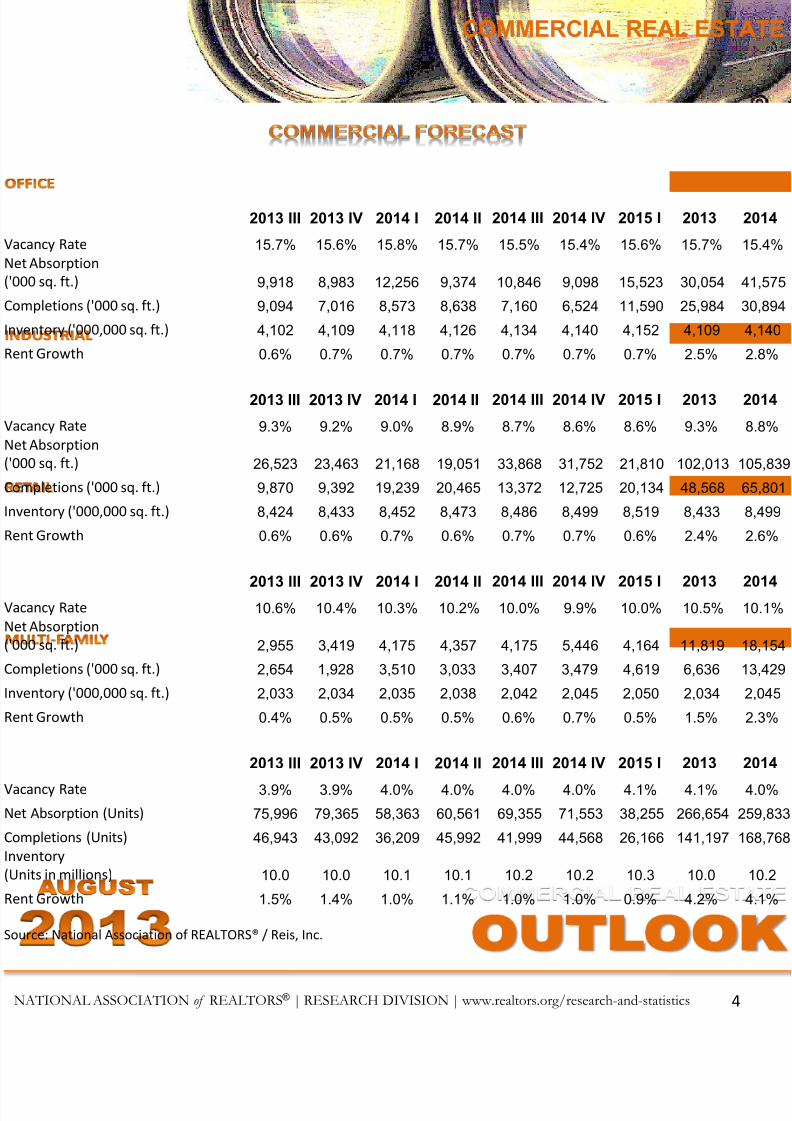
2013 III 2013 IV 2014 I 2014 II 2014 III 2014 IV 2015 I 2013 201
ncy Rate 15.7% 15.6% 15.8% 15.7% 15.5% 15.4% 15.6% 15.7% 15.4
Absorption
0 sq. ft.) 9,918 8,983 12,256 9,374 10,846 9,098 15,523 30,054 41,5
pletions ('000 sq. ft.) 9,094 7,016 8,573 8,638 7,160 6,524 11,590 25,984 30,8
ntory ('000,000 sq. ft.) 4,102 4,109 4,118 4,126 4,134 4,140 4,152 4,109 4,14
Growth 0.6% 0.7% 0.7% 0.7% 0.7% 0.7% 0.7% 2.5% 2.8
2013 III 2013 IV 2014 I 2014 II 2014 III 2014 IV 2015 I 2013 201
ncy Rate 9.3% 9.2% 9.0% 8.9% 8.7% 8.6% 8.6% 9.3% 8.8
Absorption
0 sq. ft.) 26,523 23,463 21,168 19,051 33,868 31,752 21,810 102,013 105,
pletions ('000 sq. ft.) 9,870 9,392 19,239 20,465 13,372 12,725 20,134 48,568 65,8
ntory ('000,000 sq. ft.) 8,424 8,433 8,452 8,473 8,486 8,499 8,519 8,433 8,49
Growth 0.6% 0.6% 0.7% 0.6% 0.7% 0.7% 0.6% 2.4% 2.6
2013 III 2013 IV 2014 I 2014 II 2014 III 2014 IV 2015 I 2013 201ncy Rate 10.6% 10.4% 10.3% 10.2% 10.0% 9.9% 10.0% 10.5% 10.1
Absorption
0 sq. ft.) 2,955 3,419 4,175 4,357 4,175 5,446 4,164 11,819 18,1
pletions ('000 sq. ft.) 2,654 1,928 3,510 3,033 3,407 3,479 4,619 6,636 13,4
ntory ('000,000 sq. ft.) 2,033 2,034 2,035 2,038 2,042 2,045 2,050 2,034 2,04
Growth 0.4% 0.5% 0.5% 0.5% 0.6% 0.7% 0.5% 1.5% 2.3
2013 III 2013 IV 2014 I 2014 II 2014 III 2014 IV 2015 I 2013 201
ncy Rate 3.9% 3.9% 4.0% 4.0% 4.0% 4.0% 4.1% 4.1% 4.0
Absorption (Units) 75,996 79,365 58,363 60,561 69,355 71,553 38,255 266,654 259,
pletions (Units) 46,943 43,092 36,209 45,992 41,999 44,568 26,166 141,197 168,
ntory
ts in millions) 10.0 10.0 10.1 10.1 10.2 10.2 10.3 10.0 10
Growth 1.5% 1.4% 1.0% 1.1% 1.0% 1.0% 0.9% 4.2% 4.1
ce: National Association of REALTORS® / Reis, Inc.
COMMERCIAL REAL ESTAT
OUTLOOK
ATIONAL ASSOCIATION of REALTORS® | RESEARCH DIVISION | www.realtors.org/research-and-statistics
7/30/2019 Commercial Real Estate Outlook August 2013
http://slidepdf.com/reader/full/commercial-real-estate-outlook-august-2013 5/9
5ATIONAL ASSOCIATION of REALTORS® | RESEARCH DIVISION | www.realtors.org/research-and-statistics
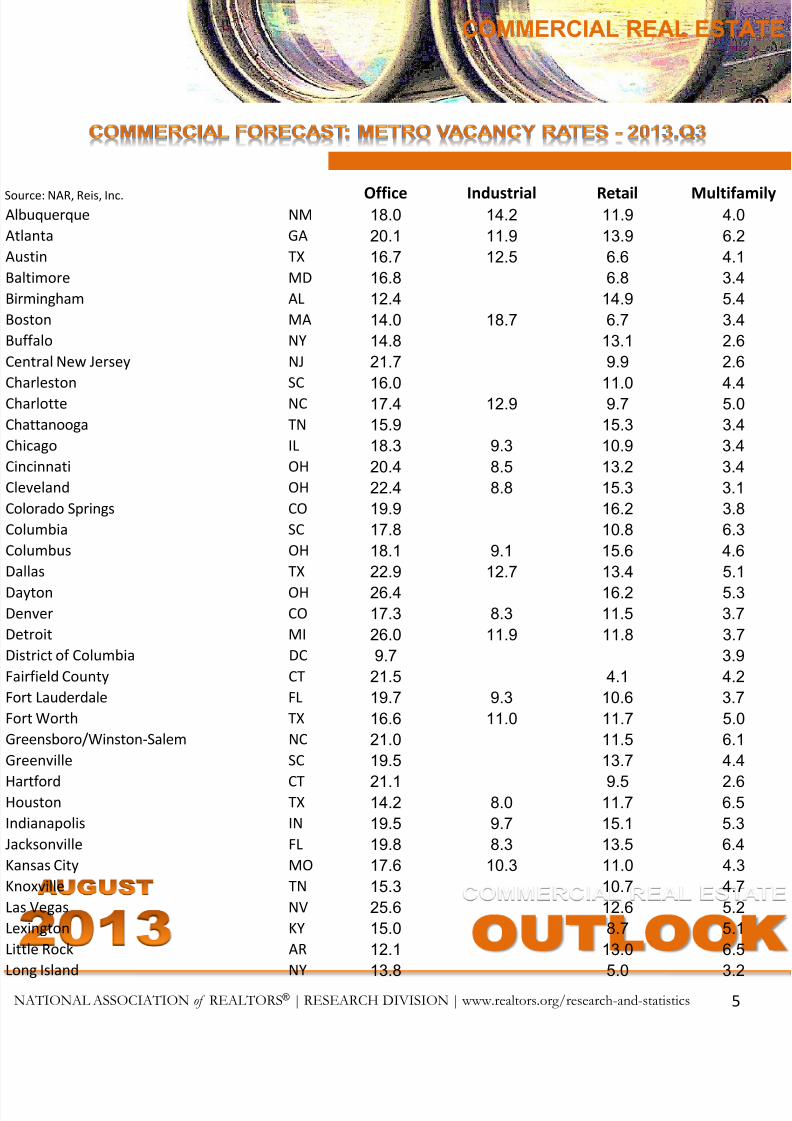
ce: NAR, Reis, Inc. Office Industrial Retail Multifamiquerque NM 18.0 14.2 11.9 4.0
nta GA 20.1 11.9 13.9 6.2
tin TX 16.7 12.5 6.6 4.1
more MD 16.8 6.8 3.4
mingham AL 12.4 14.9 5.4
on MA 14.0 18.7 6.7 3.4
alo NY 14.8 13.1 2.6
tral New Jersey NJ 21.7 9.9 2.6
rleston SC 16.0 11.0 4.4
rlotte NC 17.4 12.9 9.7 5.0
ttanooga TN 15.9 15.3 3.4
ago IL 18.3 9.3 10.9 3.4
innati OH 20.4 8.5 13.2 3.4
eland OH 22.4 8.8 15.3 3.1
rado Springs CO 19.9 16.2 3.8
mbia SC 17.8 10.8 6.3
mbus OH 18.1 9.1 15.6 4.6
as TX 22.9 12.7 13.4 5.1
ton OH 26.4 16.2 5.3ver CO 17.3 8.3 11.5 3.7
oit MI 26.0 11.9 11.8 3.7
rict of Columbia DC 9.7 3.9
field County CT 21.5 4.1 4.2
Lauderdale FL 19.7 9.3 10.6 3.7
Worth TX 16.6 11.0 11.7 5.0
ensboro/Winston-Salem NC 21.0 11.5 6.1
enville SC 19.5 13.7 4.4
ford CT 21.1 9.5 2.6ston TX 14.2 8.0 11.7 6.5
anapolis IN 19.5 9.7 15.1 5.3
sonville FL 19.8 8.3 13.5 6.4
sas City MO 17.6 10.3 11.0 4.3
xville TN 15.3 10.7 4.7
Vegas NV 25.6 12.6 5.2
ngton KY 15.0 8.7 5.1
e Rock AR 12.1 13.0 6.5
g Island NY 13.8 5.0 3.2
COMMERCIAL REAL ESTAT
OUTLOOK
7/30/2019 Commercial Real Estate Outlook August 2013
http://slidepdf.com/reader/full/commercial-real-estate-outlook-august-2013 6/9
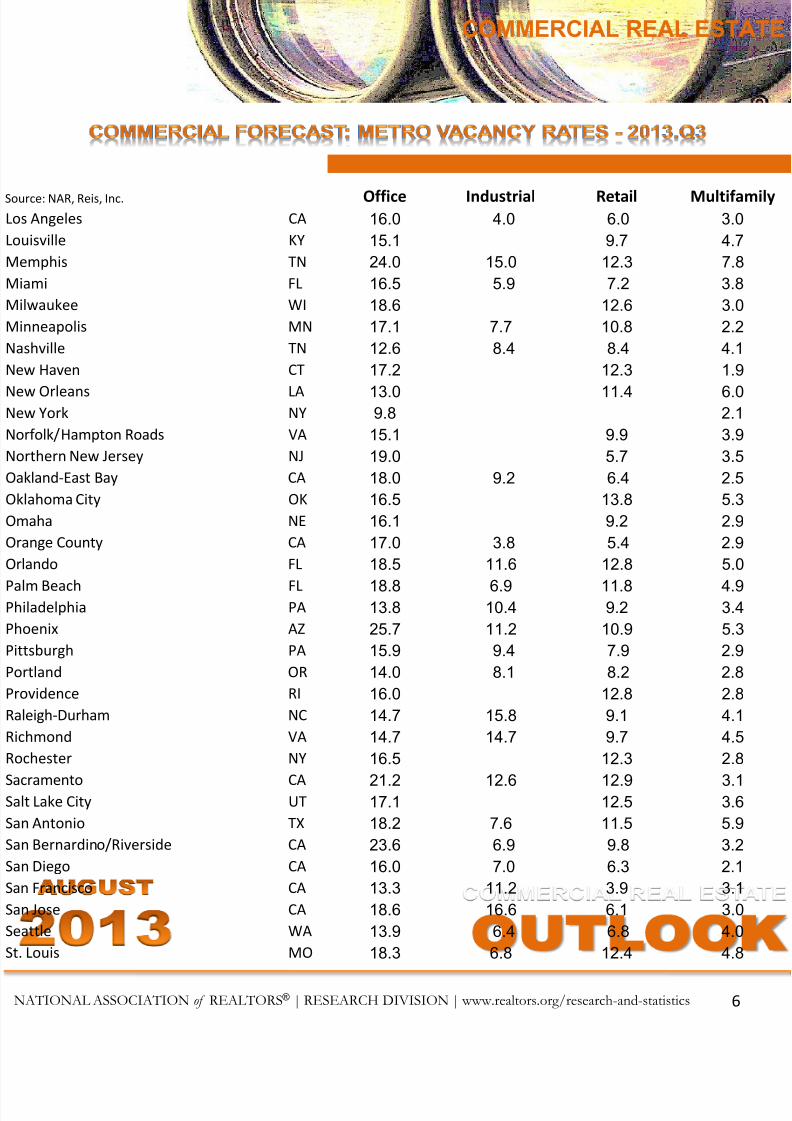
6
ce: NAR, Reis, Inc. Office Industrial Retail MultifamiAngeles CA 16.0 4.0 6.0 3.0
sville KY 15.1 9.7 4.7
mphis TN 24.0 15.0 12.3 7.8
mi FL 16.5 5.9 7.2 3.8
waukee WI 18.6 12.6 3.0
neapolis MN 17.1 7.7 10.8 2.2
hville TN 12.6 8.4 8.4 4.1
w Haven CT 17.2 12.3 1.9
w Orleans LA 13.0 11.4 6.0w York NY 9.8 2.1
folk/Hampton Roads VA 15.1 9.9 3.9
thern New Jersey NJ 19.0 5.7 3.5
and-East Bay CA 18.0 9.2 6.4 2.5
homa City OK 16.5 13.8 5.3
aha NE 16.1 9.2 2.9
nge County CA 17.0 3.8 5.4 2.9
ndo FL 18.5 11.6 12.8 5.0
m Beach FL 18.8 6.9 11.8 4.9adelphia PA 13.8 10.4 9.2 3.4
enix AZ 25.7 11.2 10.9 5.3
burgh PA 15.9 9.4 7.9 2.9
land OR 14.0 8.1 8.2 2.8
vidence RI 16.0 12.8 2.8
igh-Durham NC 14.7 15.8 9.1 4.1
mond VA 14.7 14.7 9.7 4.5
hester NY 16.5 12.3 2.8
amento CA 21.2 12.6 12.9 3.1Lake City UT 17.1 12.5 3.6
Antonio TX 18.2 7.6 11.5 5.9
Bernardino/Riverside CA 23.6 6.9 9.8 3.2
Diego CA 16.0 7.0 6.3 2.1
Francisco CA 13.3 11.2 3.9 3.1
Jose CA 18.6 16.6 6.1 3.0
tle WA 13.9 6.4 6.8 4.0
ouis MO 18.3 6.8 12.4 4.8
COMMERCIAL REAL ESTAT
OUTLOOK
ATIONAL ASSOCIATION of REALTORS® | RESEARCH DIVISION | www.realtors.org/research-and-statistics
7/30/2019 Commercial Real Estate Outlook August 2013
http://slidepdf.com/reader/full/commercial-real-estate-outlook-august-2013 7/9
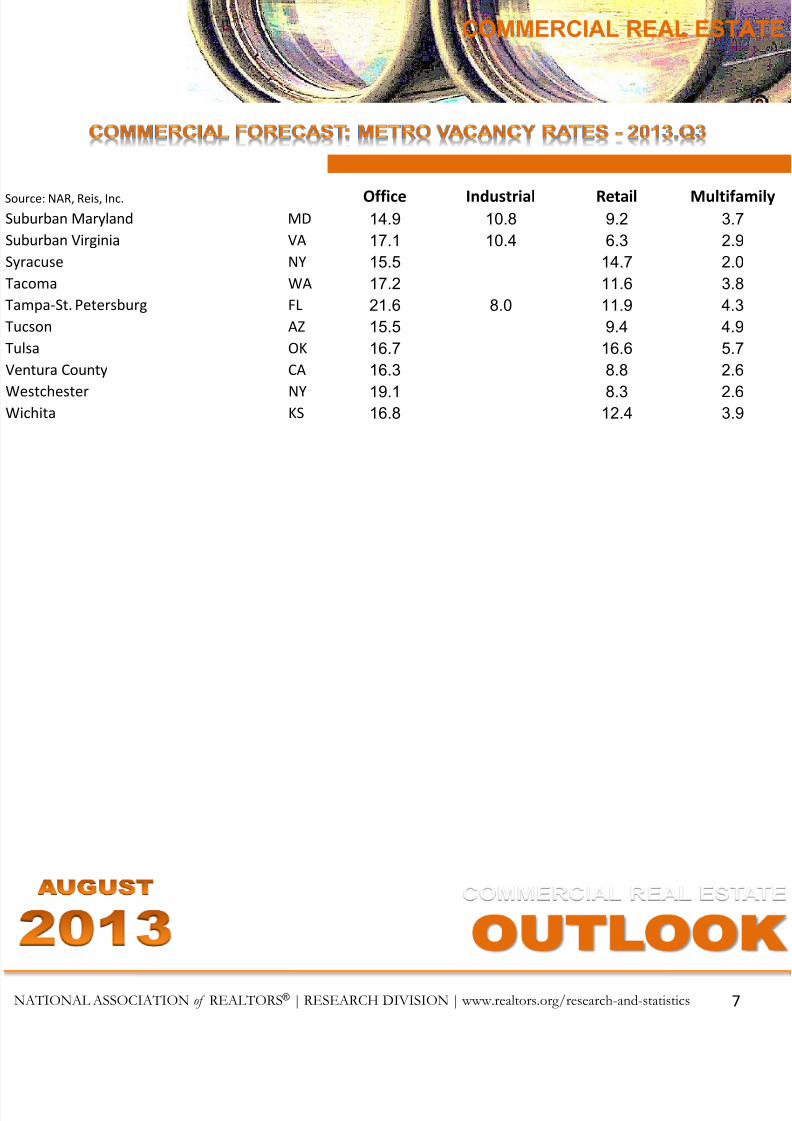
7
ce: NAR, Reis, Inc. Office Industrial Retail Multifamiurban Maryland MD 14.9 10.8 9.2 3.7
urban Virginia VA 17.1 10.4 6.3 2.9
cuse NY 15.5 14.7 2.0
oma WA 17.2 11.6 3.8
pa-St. Petersburg FL 21.6 8.0 11.9 4.3
on AZ 15.5 9.4 4.9
a OK 16.7 16.6 5.7
tura County CA 16.3 8.8 2.6
tchester NY 19.1 8.3 2.6hita KS 16.8 12.4 3.9
COMMERCIAL REAL ESTAT
OUTLOOK
ATIONAL ASSOCIATION of REALTORS® | RESEARCH DIVISION | www.realtors.org/research-and-statistics

7/30/2019 Commercial Real Estate Outlook August 2013
http://slidepdf.com/reader/full/commercial-real-estate-outlook-august-2013 8/9
8
OFFICE
Region Average Cap Rate Average Price ($/Sq. FtMid-Atlantic 7.0% $243
Midwest 7.7% $136
Northeast 6.3% $320
Southeast 8.1% $149
Southwest 7.1% $189
West 6.5% $272
INDUSTRIALRegion Average Cap Rate Average Price ($/Sq. FtMid-Atlantic 8.1% $58
Midwest 8.6% $34
Northeast 7.1% $81
Southeast 8.1% $50
Southwest 7.5% $74
West 6.7% $98
RETAIL
Region Average Cap Rate Average Price ($/Sq. FtMid-Atlantic 7.3% $154
Midwest 7.3% $126
Northeast 6.7% $257
Southeast 7.6% $146
Southwest 7.3% $149
West 6.7% $224
MULTI-FAMILY
Region Average Cap Rate Average Price ($/Unit)Mid-Atlantic 7.2% $132,996
Midwest 7.3% $77,523
Northeast 5.4% $201,320
Southeast 7.3% $73,813
Southwest 7.0% $87,915
West 5.6% $145,550
Note: Data as of 7/24/20Source: Real Capital Analyt
COMMERCIAL REAL ESTAT
OUTLOOK
ATIONAL ASSOCIATION of REALTORS® | RESEARCH DIVISION | www.realtors.org/research-and-statistics
$0
$10
$20
$30
$40
12Q2 12Q3 12Q4 13Q1 13Q2
Office Sales
$0
$5
$10
$15
$20
12Q2 12Q3 12Q4 13Q1 13Q2
Industrial Sales
$0
$5
$10
$15
$20
$25
12Q2 12Q3 12Q4 13Q1 13Q2
Retail Sales
$0
$10
$20
$30
$40
12Q2 12Q3 12Q4 13Q1 13Q2
Apartment Sales

7/30/2019 Commercial Real Estate Outlook August 2013
http://slidepdf.com/reader/full/commercial-real-estate-outlook-august-2013 9/9
9
The Research Division of the National Association of REALTORS® monitors andanalyzes monthly and quarterly economic indicators, including retail sales,industrial production, producer price index, gross domestic product andemployment data which impact commercial markets over time. In addition, theResearch Division provides several products covering commercial real estate:
• Commercial Real Estate Quarterly Market Survey
• Commercial Real Estate Lending Survey
• Commercial Member Profile
If you have questions or comments regarding this report or any other commercialreal estate research, please contact George Ratiu, Manager, Quantitative &Commercial Research, at [email protected].
Although the information presented in this report has been obtained from reliablesources, NAR does not guarantee its accuracy, and such information may beincomplete. This report is for information purposes only. All opinions, assumptionsand estimates constitute NAR’s judgment as of the date of this publication and are
subject to change and evolving events. Actual results may vary from forecastresults.
For more information, please visit us:
Copyright © 2013 NATIONAL ASSOCIATION OF REALTORS®. Reproduction,reprinting or retransmission in any form is prohibited without written permission. For questions regarding this matter please e-mail [email protected].
0 New Jersey Avenue, NW • Washington, DC 20001 – 2020
0.874.6500 • www.REALTOR.org
COMMERCIAL REAL ESTAT
OUTLOOK
www.facebook.com/narresearchgroup
twitter.com/#!/NAR_Research
REALTOR.org/research-and-statistics
economistsoutlook.blogs.realtor.org