economic and commercial real estate outlook, 2021-2022
TRANSCRIPT

Economic and Commercial Real Estate Outlook, 2021-2022
Lawrence Yun, PhDChief Economist and Senior Vice President, ResearchNATIONAL ASSOCIATION OF REALTORS®

16000.0
16500.0
17000.0
17500.0
18000.0
18500.0
19000.0
19500.0Q
1/2
01
8
Q2
/20
18
Q3
/20
18
Q4
/20
18
Q1
/20
19
Q2
/20
19
Q3
/20
19
Q4
/20
19
Q1
/20
20
Q2
/20
20
Q3
/20
20
Q4
/20
20
Q1
/20
21
Annualized GDP in $2012 Billion Dollars
Economy … swiftest decline … then fast recovery … Current at 99% of prior peak in 2021 Q1
Source: BEA

Massive Savings to be Unleashed … Revenge Spending
GDP (% change from a year ago)
Personal Income(% change from a year ago)
Savings(% change from a year ago)
2020 Q2 -9.0% +10.7% +302%
2021 Q1 +0.4% +15.6% +158%

Consumers have increasingly shopped online and not at Dept Stores
$676.4
$871.2
$0.00$100.00$200.00$300.00$400.00$500.00$600.00$700.00$800.00$900.00
$1,000.00
Jan
/20
00
Dec
/20
00
No
v/2
00
1
Oct
/20
02
Sep
/20
03
Au
g/2
00
4
Jul/
20
05
Jun
/20
06
May
/20
07
Ap
r/2
00
8
Mar
/20
09
Feb
/20
10
Jan
/20
11
Dec
/20
11
No
v/2
01
2
Oct
/20
13
Sep
/20
14
Au
g/2
01
5
Jul/
20
16
Jun
/20
17
May
/20
18
Ap
r/2
01
9
Mar
/20
20
Feb
/20
21
Bill
ion
Do
llars
Retail Sales, Dept Stores (12-Mov Total)
Retail sales, electronic and mail order (12-mov total)
Source: US Census Bureau
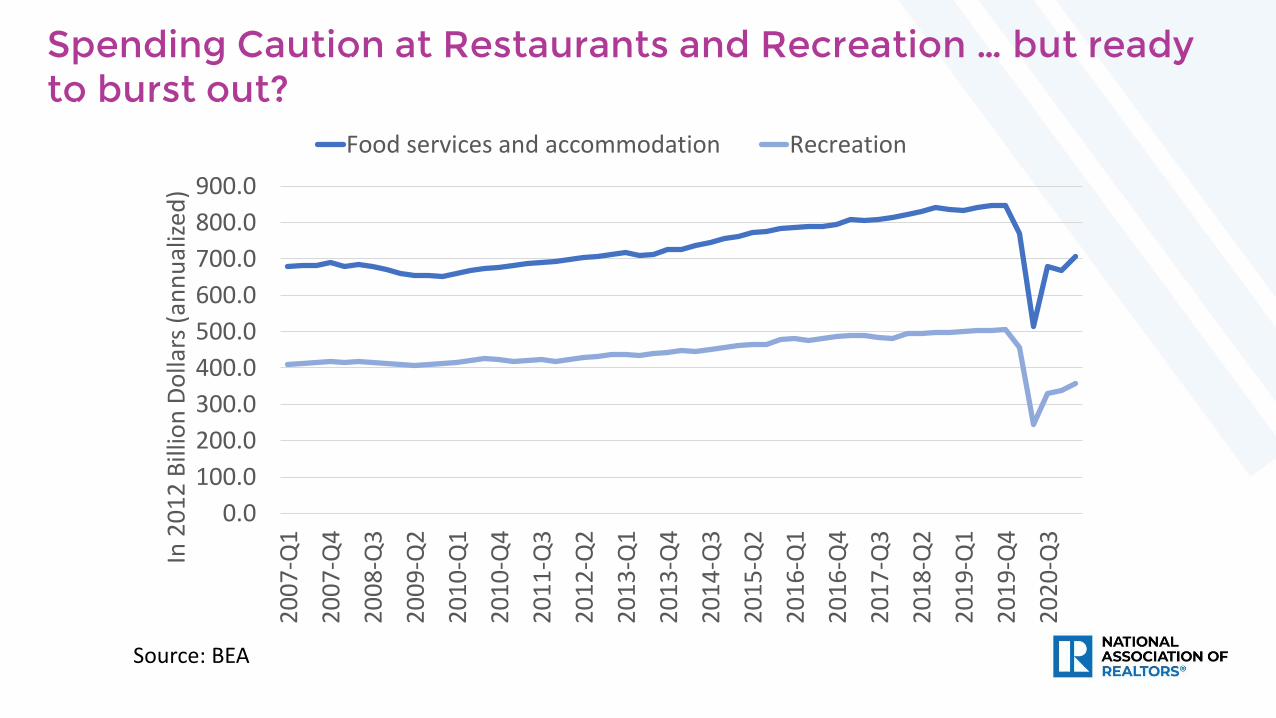
Spending Caution at Restaurants and Recreation … but ready to burst out?
0.0
100.0
200.0
300.0
400.0
500.0
600.0
700.0
800.0
900.0
20
07
-Q1
20
07
-Q4
20
08
-Q3
20
09
-Q2
20
10
-Q1
20
10
-Q4
20
11
-Q3
20
12
-Q2
20
13
-Q1
20
13
-Q4
20
14
-Q3
20
15
-Q2
20
16
-Q1
20
16
-Q4
20
17
-Q3
20
18
-Q2
20
19
-Q1
20
19
-Q4
20
20
-Q3
In 2
01
2 B
illio
n D
olla
rs (
ann
ual
ized
) Food services and accommodation Recreation
Source: BEA

Worldwide Comparisons of GDP Growth Rates
Source: The Economist Magazine
Country 2020 Q4 from a year ago
2021 Forecast
United States -2.4 +5.5
Great Britain -7.3 +5.1
Canada -3.2 +4.8
Euro Area -4.9 +4.1
Russia -1.8 +2.7
Australia -1.1 +3.1
India +0.4 ???
Japan -1.4 +2.7
Taiwan +5.1 +4.5

Global GDP Growth Rate
Source: The Economist Magazine
Country 2020 Q4 from a year ago
2021 Forecast
United States -2.4 +5.5
Great Britain -7.3 +5.1
Canada -3.2 +4.8
Euro Area -4.9 +4.1
Russia -1.8 +2.7
Australia -1.1 +3.1
India 0.4 ???
Japan -1.4 +2.7
Taiwan +5.1 +4.5
China +18.3 +8.5

GDP Comparison U.S. versus China
Source: U.S. Bureau of Economic Analysis and China National Bureau of Statistics
0
5000
10000
15000
20000
25000
19
70
19
73
19
76
19
79
19
82
19
85
19
88
19
91
19
94
19
97
20
00
20
03
20
06
20
09
20
12
20
15
20
18
20
21
$ billion

Source: BLS
115000
120000
125000
130000
135000
140000
145000
150000
155000
20
00
- J
an2
00
0 -
Ju
l2
00
1 -
Jan
20
01
- J
ul
20
02
- J
an2
00
2 -
Ju
l2
00
3 -
Jan
20
03
- J
ul
20
04
- J
an2
00
4 -
Ju
l2
00
5 -
Jan
20
05
- J
ul
20
06
- J
an2
00
6 -
Ju
l2
00
7 -
Jan
20
07
- J
ul
20
08
- J
an2
00
8 -
Ju
l2
00
9 -
Jan
20
09
- J
ul
20
10
- J
an2
01
0 -
Ju
l2
01
1 -
Jan
20
11
- J
ul
20
12
- J
an2
01
2 -
Ju
l2
01
3 -
Jan
20
13
- J
ul
20
14
- J
an2
01
4 -
Ju
l2
01
5 -
Jan
20
15
- J
ul
20
16
- J
an2
01
6 -
Ju
l2
01
7 -
Jan
20
17
- J
ul
20
18
- J
an2
01
8 -
Ju
l2
01
9 -
Jan
20
19
- J
ul
20
20
- J
an2
02
0 -
Ju
l2
02
1 -
Jan
In thousands
Economy is fully back … But not Jobs … 94% of prior peak … need 8 million more jobs to reach pre-pandemic levels

Monthly Job Additions … Stimulus Passage
Source: BLS
-25000
-20000
-15000
-10000
-5000
0
5000
10000
2020 -Jan
2020 -Feb
2020 -Mar
2020 -Apr
2020 -May
2020 -Jun
2020 -Jul
2020 -Aug
2020 -Sep
2020 -Oct
2020 -Nov
2020 -Dec
2021 -Jan
2021 -Feb
2021 -Mar
In thousands

Source: BEA

Source: BLS
-2
-1
0
1
2
3
4
20
15
- J
an
20
15
- M
ar
20
15
- M
ay
20
15
- J
ul
20
15
- S
ep
20
15
- N
ov
20
16
- J
an
20
16
- M
ar
20
16
- M
ay
20
16
- J
ul
20
16
- S
ep
20
16
- N
ov
20
17
- J
an
20
17
- M
ar
20
17
- M
ay
20
17
- J
ul
20
17
- S
ep
20
17
- N
ov
20
18
- J
an
20
18
- M
ar
20
18
- M
ay
20
18
- J
ul
20
18
- S
ep
20
18
- N
ov
20
19
- J
an
20
19
- M
ar
20
19
- M
ay
20
19
- J
ul
20
19
- S
ep
20
19
- N
ov
20
20
- J
an
20
20
- M
ar
20
20
- M
ay
20
20
- J
ul
20
20
- S
ep
20
20
- N
ov
20
21
- J
an
20
21
- M
ar
Consumer Price Inflation Crosses 2% … who cares?

Source: BLS
Gasoline Prices up 22% … 5-year high
-40-30-20-10
0102030
20
18
- J
an
20
18
- M
ar
20
18
- M
ay
20
18
- J
ul
20
18
- S
ep
20
18
- N
ov
20
19
- J
an
20
19
- M
ar
20
19
- M
ay
20
19
- J
ul
20
19
- S
ep
20
19
- N
ov
20
20
- J
an
20
20
- M
ar
20
20
- M
ay
20
20
- J
ul
20
20
- S
ep
20
20
- N
ov
20
21
- J
an
20
21
- M
ar

Source: BLS
Primary Rent (and owner’s rent) had been decelerating … but will soon pick up?
-2
-1
0
1
2
3
4
5
20
15
- J
an2
01
5 -
Mar
20
15
- M
ay2
01
5 -
Ju
l2
01
5 -
Sep
20
15
- N
ov
20
16
- J
an2
01
6 -
Mar
20
16
- M
ay2
01
6 -
Ju
l2
01
6 -
Sep
20
16
- N
ov
20
17
- J
an2
01
7 -
Mar
20
17
- M
ay2
01
7 -
Ju
l2
01
7 -
Sep
20
17
- N
ov
20
18
- J
an2
01
8 -
Mar
20
18
- M
ay2
01
8 -
Ju
l2
01
8 -
Sep
20
18
- N
ov
20
19
- J
an2
01
9 -
Mar
20
19
- M
ay2
01
9 -
Ju
l2
01
9 -
Sep
20
19
- N
ov
20
20
- J
an2
02
0 -
Mar
20
20
- M
ay2
02
0 -
Ju
l2
02
0 -
Sep
20
20
- N
ov
20
21
- J
an2
02
1 -
Mar

Source: ApartmentList.com

Source: Census
Rental Households … collapsed … now returning
39000
40000
41000
42000
43000
44000
45000
2018- Q1
2018- Q2
2018- Q3
2018- Q4
2019- Q1
2019- Q2
2019- Q3
2019- Q4
2020- Q1
2020- Q2
2020- Q3
2020- Q4
2021- Q1
In thousands

Source: BLS
Another Inflation Pressure … Producer Prices on Construction Materials
200
210
220
230
240
250
260
270
280
290
20
15
- J
an2
01
5 -
Mar
20
15
- M
ay2
01
5 -
Ju
l2
01
5 -
Sep
20
15
- N
ov
20
16
- J
an2
01
6 -
Mar
20
16
- M
ay2
01
6 -
Ju
l2
01
6 -
Sep
20
16
- N
ov
20
17
- J
an2
01
7 -
Mar
20
17
- M
ay2
01
7 -
Ju
l2
01
7 -
Sep
20
17
- N
ov
20
18
- J
an2
01
8 -
Mar
20
18
- M
ay2
01
8 -
Ju
l2
01
8 -
Sep
20
18
- N
ov
20
19
- J
an2
01
9 -
Mar
20
19
- M
ay2
01
9 -
Ju
l2
01
9 -
Sep
20
19
- N
ov
20
20
- J
an2
02
0 -
Mar
20
20
- M
ay2
02
0 -
Ju
l2
02
0 -
Sep
20
20
- N
ov
20
21
- J
an2
02
1 -
Mar

Mortgage Rates Rising … 10-year Treasury Rates Rising … Fed Funds Rate Holding
0.00
0.50
1.00
1.50
2.00
2.50
3.00
3.50
4.00
2020- Jan
2020- Feb
2020- Mar
2020- Apr
2020-
May
2020- Jun
2020- Jul
2020- Aug
2020- Sep
2020- Oct
2020- Nov
2020- Dec
2021- Jan
2021- Feb
2021- Mar
2021- Apr
2021-
May

Office Absorption
Source: Cushman-Wakefield
-50
-40
-30
-20
-10
0
10
20
2019 Q1 2019 Q2 2019 Q3 2019 Q4 2020 Q1 2020 Q2 2020 Q3 2020 Q4 2021 Q1
million square feet

Workers are slowly returning to the office
5.7
35.4
21
20
19
20
-May
20
-Ju
n
20
-Ju
l
1-A
ug
1-S
ep
1-O
ct
1-N
ov
1-D
ec
Jan
-21
Feb
-21
Mar
-21
Percent of Employed Who Teleworked
Workers 16 years old and over
Source: US Census Bureau American Community Survey and Bureau of Labor Statistics Supplemental Survey

Kastle System Key Barometer … Back to Office … Dallas 40% … SF and NY 15%

More than half of NAR commercial members reported more companies leasing smaller offices and < 2 year lease terms
Source: NAR Commercial Real Estate Quarterly Market Survey conducted in collaboration with RLI, SIOR, CCIM, IREM, CRE
62%
69%70%
2020.Q3 2020.Q4 2021.Q1
Percent of REALTOR®respondents who reported "More" companies leasing smaller square footage due
to working from home
59%
63%
57%
2020.Q3 2020.Q4 2021.Q1
Percent of REALTOR®respondents who reported "More" short-term
office leases of 2 years or less

Positive Absorption in Industrial/Warehouses
82.27
- 10 20 30 40 50 60 70 80 90
10020
19 Q
1
2019
Q2
2019
Q3
2019
Q4
2020
Q1
2020
Q2
2020
Q3
2020
Q4
2021
Q1
Net absorption in million square feet
Cushman and Wakefield

Retail Space … Surprisingly Resilient … moving around zero change
-0.74
(14) (12) (10) (8) (6) (4) (2) - 2 4 6
2019
Q1
2019
Q2
2019
Q3
2019
Q4
2020
Q1
2020
Q2
2020
Q3
2020
Q4
2021
Q1
Net absorption in million square feet
Cushman and Wakefield

Vacancy rates: High in Office … Low in Industrial … Steady in Multifamily and Retail
Cushman and Wakefield
13.5%16.4%
5.1%4.9%
0.0%2.0%4.0%6.0%8.0%
10.0%12.0%14.0%16.0%18.0%
2019
Q1
2019
Q2
2019
Q3
2019
Q4
2020
Q1
2020
Q2
2020
Q3
2020
Q4
2021
Q1
Vacancy Rates
Office IndustrialRetail (Shopping Centers) Multifamily

Commercial sales volume in 2021 Q1 down 28%
Real Capital Analytics ; NAR quarterly commercial survey conducted in collaboration with RLI, SIOR, CCIM, IREM, CRE
-80%
-60%
-40%
-20%
0%
20%
40%
2018
.Q1
2018
.Q2
2018
.Q3
2018
.Q4
2019
.Q1
2019
.Q2
2019
.Q3
2019
.Q4
2020
.Q1
2020
.Q2
2020
.Q3
2020
.Q4
2021
.Q1
Quarterly Sales Volume (YoY % Chg) as of 2021 Q1
REALTOR® CRE Markets $2.5+M Market

But strong demand for land and industrial real estate
Source: 2020 Q1 NAR Commercial Real Estate Quarterly Market Survey in collaboration with RLI, SIOR, CCIM, IREM, CRE
-4%-3% -3% -3%
-2% -2% -1%-1%
0%1% 2%
3%
YoY % Change in the Dollar Commercial Sales Volume in 2021 Q1 Among NAR Commercial Members

Commercial Properties have more Equity and less Debt … Low Interest Expense … Lower Risk of Blowups
Source: NAREIT

Economic Forecast
Source: NAR
2019 2020 2021Forecast
GDP Growth 2.3% -3.5% +4.5%
Job Gains +2 million - 9 million + 4 million
10-Year Treasury 2.1% 0.9% 1.6%
Consumer Price Inflation
1.8% 1.3% 2.7%

Commercial Real Estate Vacancy Forecast
Source: NAR
2019 2020 2021Forecast
2022Forecast
Multifamily 6.8 6.3 6.2 6.1
Industrial 4.8 5.1 4.8 4.6
Retail 10.7 12.5 13.0 11.5
Office 12.9 14.2 16.7 16.5

Pandemic … Sweeping Changes? … Repurposing Properties … Examples
Source: 2021 NAR Survey on Conversion of Hotels/Motels for Multifamily Housing
Residence Inn by Marriott in Winston Salem, NC 88-room extended-stay hotel converted into resort-style living apartments (2-bedroom unit starting at $900) in 2020 using private development financing
Days Inn in Branson, Missouri423-room converted into affordable housing (1-bedroom rent at $695) in 2020 using private development financing
Luna Lodge in Albuquerque, Mexico28-room hotel on the National Register of Historic Places converted into a low-income housing (1-bedroom rent at $535) in 2013 using Historic Tax Credit

Why Keep Section 1031 ?
Source: NAR Survey on Section 1031 Transactions of NAR Members in 2016-2019
Capital is put to its best use (example: vacant hotel/motel converted into multifamily housing)
Encourages more investment in the replacement property 89% of NAR commercial members reported that their client invested at least 10% of the fair market value of the replacement property
Supports small businesses 47% of businesses that held the property exchanged for a like-kind exchange were sole proprietorships, only 5% were C- corporations
Speed up the CRE market recovery 90% of respondents reported that commercial property values would decline if Section 1031 tax deferral were repealed

Global Capital is Going into Primary and Secondary Cities
Source: Real Capital Analytics
$3,946 $2,583
$1,686 $1,577 $1,497
$1,228 $1,149
$941 $939 $937
$775 $768 $737
$649 $623 $618 $604 $579 $572 $559 $540 $516 $495
$410 $403
ManhattanSeattle
San FranciscoDallas
AtlantaLos Angeles
ChicagoDenverBoston
PhoenixInland Empire
SacramentoAustin
Raleigh/DurhamNYC Boroughs
PhiladelphiaSan Jose
DCSan Diego
DC MD burbsDC VA burbs
Miami/Dade CoEast Bay
IndianapolisHouston
Cross-Border Flows in U.S. Commercial Real Estate in 2021 in
Million Dollars
