colloid transport and remobilization in porous media during infiltration and drainage
TRANSCRIPT
Journal of Hydrology 377 (2009) 112–119
Contents lists available at ScienceDirect
Journal of Hydrology
journal homepage: www.elsevier .com/locate / jhydrol
Colloid transport and remobilization in porous media during infiltrationand drainage
Jie Zhuang a,*, John S. Tyner b, Edmund Perfect c
a Institute for a Secure and Sustainable Environment, Center for Environmental Biotechnology, Department of Biosystems Engineering and Soil Science,The University of Tennessee, Knoxville, TN 37996, United Statesb Department of Biosystems Engineering and Soil Science, The University of Tennessee, Knoxville, TN 37996, United Statesc Department of Earth and Planetary Sciences, The University of Tennessee, Knoxville, TN 37996, United States
a r t i c l e i n f o
Article history:Received 6 November 2008Received in revised form 11 June 2009Accepted 7 August 2009
This manuscript was handled by P. Baveye,Editor-in-Chief
Keywords:Colloid transportUnsaturated flowTransient flowFlow rateIonic strengthInfiltration
0022-1694/$ - see front matter � 2009 Elsevier B.V. Adoi:10.1016/j.jhydrol.2009.08.011
* Corresponding author. Tel.: +1 865 974 1325; faxE-mail address: [email protected] (J. Zhuang).
s u m m a r y
Colloids are potential vectors of many contaminants in porous media. Understanding colloid transport iscritical for assessing the migration of contaminants (e.g., pathogens) in the vadose zone. In this study, aseries of column experiments were conducted to investigate the coupled effects of flow velocity, watercontent, and solution ionic strength on transport and remobilization of a model colloid (montmorilloniteclay) in a model porous medium (Accusand) during transient unsaturated flow and steady-state saturatedflow. The unsaturated transport experiments included a series of infiltration and drainage pulses (e.g.,infiltration with colloids, followed by drainage of colloid suspensions, followed by infiltration with a col-loid-free solution and drainage of the solution). Saturated flow experiments included only the infiltrationof the colloid and colloid-free solutions. Tests were repeated for a variety of solution ionic strengths.Results showed that colloid transport was more sensitive to changes in solution ionic strength at lowinfiltration rates, and the effect of infiltration rate was more significant at high ionic strength. As a result,increased flow velocities and water content, resulting from high infiltration rates, enhanced colloid trans-port and remobilization under ionic strength conditions (e.g., 100 mM) that would otherwise lead tostrong colloid retention. This observation conceptually suggests that chemical threshold values for pre-venting colloid movement in porous media might be larger for transient flow conditions than for uniformflow conditions. In addition, drainage was found to induce remobilization of the retained colloids, sug-gesting transport of colloids even after termination of injection. Overall, the study experimentally high-lights the complicated interdependence of the effects of water content, flow velocity, and solutionchemistry on colloid transport and remobilization.
� 2009 Elsevier B.V. All rights reserved.
Introduction
Knowledge of colloid transport and mobilization in natural andengineered systems is of primary importance for the assessmentand prediction of colloid-facilitated contaminant migration(McCarthy and Zachara, 1989; Grolimund et al., 1996; Zhuanget al., 2003). Over the past several decades, considerable advanceshave been made towards understanding the processes and corre-sponding mechanisms governing colloid deposition and transportthrough laboratory investigations, field studies, and numericalmodeling (Kretzschmar et al., 1999; DeNovio et al., 2004; McCar-thy and McKay, 2004). It has been recognized that colloid transportand mobilization is a function of many factors, including the prop-erties of colloids and porous media (Bradford et al., 2002; Zhuanget al., 2004, 2005), solution chemistry (Elimelech and O’Melia,
ll rights reserved.
: +1 865 974 1838.
1990a; Compere et al., 2001; Gamerdinger and Kaplan, 2001;Torkzaban et al., 2008), and flow conditions (Lenhart and Saiers,2002; Saiers and Lenhart, 2003a; Zhuang et al., 2007; Shanget al., 2008). The dominant mechanisms controlling colloid trans-port and remobilization in porous media have been attributed toelectrostatic, capillary, and shear forces (Ryan and Gschwend,1994; Kretzschmar et al., 1997; Saiers and Lenhart, 2003a,b; Zhu-ang et al., 2004; Gao et al., 2006; Shang et al., 2008). Electrostaticforces are an important component of the total interaction energybetween colloids and the porous medium and are impacted by fac-tors influencing the electric double layer (EDL), such as solution io-nic strength, ion composition, and pH. Capillary forces describeinteractions between individual colloids or between colloids andsurfaces wetted by fluid and are impacted by the degree of satura-tion, pore sizes, contact angles of both colloids and porous media,and surface tension (Kralchevsky et al., 1992; Kralchevsky andNagayama, 2000; Kralchevsky and Denkov, 2001). Shear force isthe shear developed on the wetted area of the pore channel. It acts
J. Zhuang et al. / Journal of Hydrology 377 (2009) 112–119 113
in the direction of flow and is impacted by the flow velocity, liquiddensity, and flow path tortuosity (Simons and Sentürk, 1992). Mostprevious colloid transport studies included only steady-state flowconditions, which do not effectively represent natural vadosezones, where transient flows (e.g., infiltration and drainage) tendto dominate.
More recently, several studies have addressed transient trans-port of colloids by studying the influence of physical and chemicalperturbations on colloid transport and mobilization. For example,Saiers and Lenhart (2003a) and Shang et al. (2008) reported thata stepwise increase in the flow rate during unsaturated flow cansubstantially increase colloid movement. A number of studies(Crist et al., 2004, 2005; Zevi et al., 2005; Lazouskaya et al., 2006)visualized the redistribution of colloids during drainage of porewater. They found that colloids responded to changes in the distri-bution, configuration, and total area of air–water menisci. Duringthe drainage process, colloids accumulate in the thin water filmspresent at air–water–solid contacts. Although there are alternativearguments in the literature describing how air–water interfacesand/or air–water–solid interfaces affect colloid retention andmobilization (Wan and Tokunaga, 2005; Steenhuis et al., 2005), itseems that changes in pore water saturation and the geometry ofcorner-water ducts in porous media can cause colloid remobiliza-tion (Gao et al., 2006).
The transient transport of colloids may also be subject to thecoupling of flow and chemical conditions. This is because, undercertain conditions, capillary and shear forces create separation dis-tances between colloids and pore walls beyond which the electricdouble layer (EDL) is ineffective in influencing the electrostaticcomponent of the total interaction energies, thus reducing theimportance of solution chemistry on colloid retention. To ourknowledge, the combined effect of transient unsaturated flow(e.g., infiltration and drainage cycles) and solution chemistry(e.g., ionic strength) on the transport of colloids remains unexam-ined. A systematic study of the interactions between these factorsis thus essential for understanding colloid transport in the vadosezone. The objective of this study was to examine the coupled ef-fects of infiltration rate, water content, and solution ionic strengthon the transport and remobilization of colloids during transientunsaturated flow within a porous medium as compared to stea-dy-state saturated flow. Drainage-induced colloid mobilizationwas also addressed.
Table 1Colloid size and zeta potential in NaNO3 solutions.
Ionic strength (mM) Effective diameter (nm) Zeta potential (mV)
2 512 ± 8 �40.3 ± 0.820 709 ± 13 �31.3 ± 4.1
100 1573 ± 75 �24.6 ± 1.0
Materials and methods
Porous medium and colloid properties
Silica sand (Accusand, grade 20/30, Unimin Corporation, LeSueur, MN) was used as the model porous medium in the transportexperiments. The sand grains had a median diameter (d50) of0.71 ± 0.02 mm and a cation exchange capacity of 0.57 cmol/kgaccording to specifications provided by Unimin Corporation. Thetotal carbon content in the original sand was measured to be0.3 g/kg using a Shimadzu TOC-V organic carbon analyzer with asolid sample module. The saturated hydraulic conductivity wasdetermined to be 784 ± 11 cm/h using the constant-head method(Klute and Dirksen, 1986). The drainage water retention curvewas measured with a Tempe pressure cell (Soil Moisture Equip-ment Inc., Model 1400B1M2-3) (Dane and Hopmans, 2002), andparameterized by fitting the van Genuchten equation (VanGenuchten, 1980) using non-linear regression, yieldingSe = [1 + (0.0744w)8.47]�0.882, where w is the absolute value of soilmatric potential (cm), and Se = (h � hr)/(hs � hr) with h the volumet-ric water content (m3/m3) and the subscripts s and r denoting thesaturated and residual water contents, respectively. The value of hs
was assumed to be equal to the total porosity of the packed sand(�0.33% m3/m3), and the value of hr was obtained by measuringthe water content of the air-dried sand (�0.027% m3/m3). Prior topacking the columns, the sand was thoroughly rinsed with parti-cle-free deionized water (5.5 � 10�7 dS/cm) to remove any sus-pended impurities and was then oven-dried at 60 �C.
Montmorillonite, a 2:1 clay that occurs widely in natural soils,was selected for the model colloid. The original Na-rich montmo-rillonite powder (SWy-2, Crook County, Wyoming) was purchasedfrom the Source Clays Repository at the University of Missouri. Toobtain particles smaller than 1-lm in diameter, the powder wasfirst dispersed in deionized water using a probe ultrasonicator at10 J/s for 10 min, and the <1-lm particles were then extractedfrom the suspension by gravity settling using a 1000-mL graduatedcylinder (Gee and Or, 2002). After being concentrated in a polypro-pylene beaker at 60 �C, the extracted montmorillonite slurry wasrefrigerated at 6 �C for subsequent preparation of the colloid inputsolutions. The montmorillonite particles aggregated and their sur-face potentials changed with solution ionic strength. We thereforemeasured their effective particle diameters and zeta potentials inall the experimental solutions (2–100 mM NaNO3) with a ZetaPalsanalyzer (Brookhaven Instrument Ltd.) (Table 1).
Column experiments
One-dimensional vertical column experiments were conductedunder transient unsaturated and steady-state saturated flow con-ditions. A summary of the experimental initial and boundary con-ditions for the different tests is provided in Table 2. The differentinfiltration rates created a broad range of pore water saturations.To facilitate comparison with different-textured porous mediafrom other studies, the infiltration rate is expressed as a percentageof the sand saturated hydraulic conductivity (Ks) (Zhuang et al.,2007). The range of selected solution ionic strengths (Table 2) con-sidered both natural salt levels in the vadose zone and the possibil-ity of chemical spills.
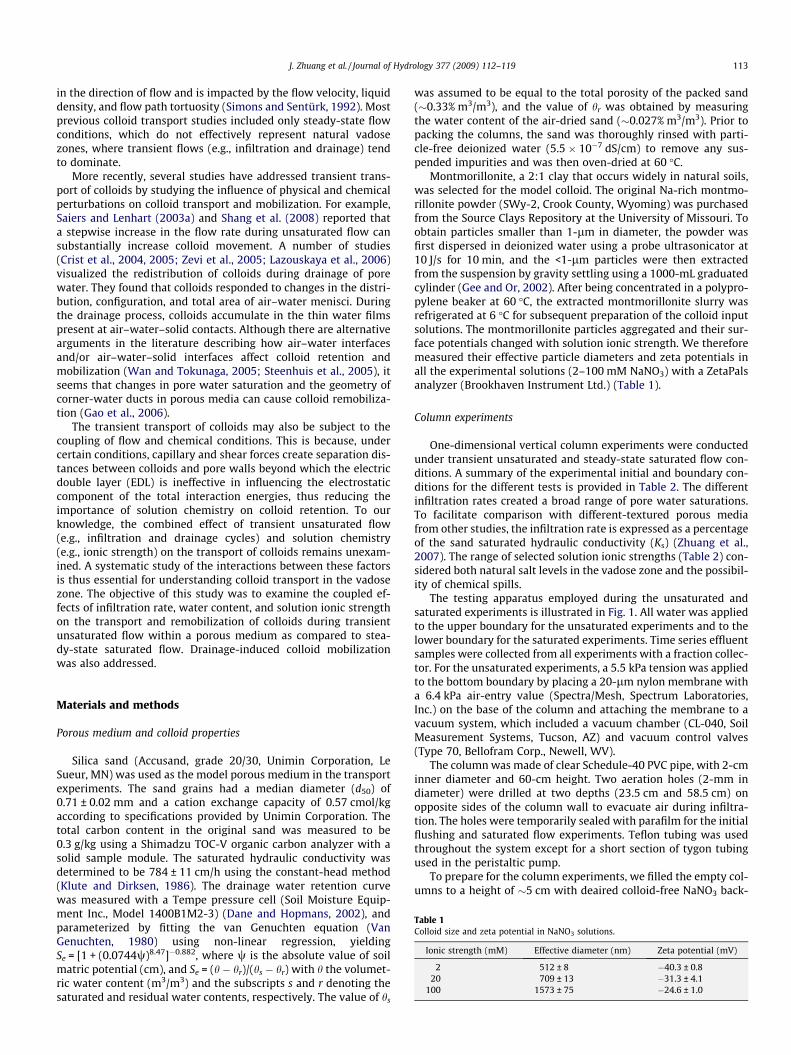
The testing apparatus employed during the unsaturated andsaturated experiments is illustrated in Fig. 1. All water was appliedto the upper boundary for the unsaturated experiments and to thelower boundary for the saturated experiments. Time series effluentsamples were collected from all experiments with a fraction collec-tor. For the unsaturated experiments, a 5.5 kPa tension was appliedto the bottom boundary by placing a 20-lm nylon membrane witha 6.4 kPa air-entry value (Spectra/Mesh, Spectrum Laboratories,Inc.) on the base of the column and attaching the membrane to avacuum system, which included a vacuum chamber (CL-040, SoilMeasurement Systems, Tucson, AZ) and vacuum control valves(Type 70, Bellofram Corp., Newell, WV).
The column was made of clear Schedule-40 PVC pipe, with 2-cminner diameter and 60-cm height. Two aeration holes (2-mm indiameter) were drilled at two depths (23.5 cm and 58.5 cm) onopposite sides of the column wall to evacuate air during infiltra-tion. The holes were temporarily sealed with parafilm for the initialflushing and saturated flow experiments. Teflon tubing was usedthroughout the system except for a short section of tygon tubingused in the peristaltic pump.
To prepare for the column experiments, we filled the empty col-umns to a height of �5 cm with deaired colloid-free NaNO3 back-
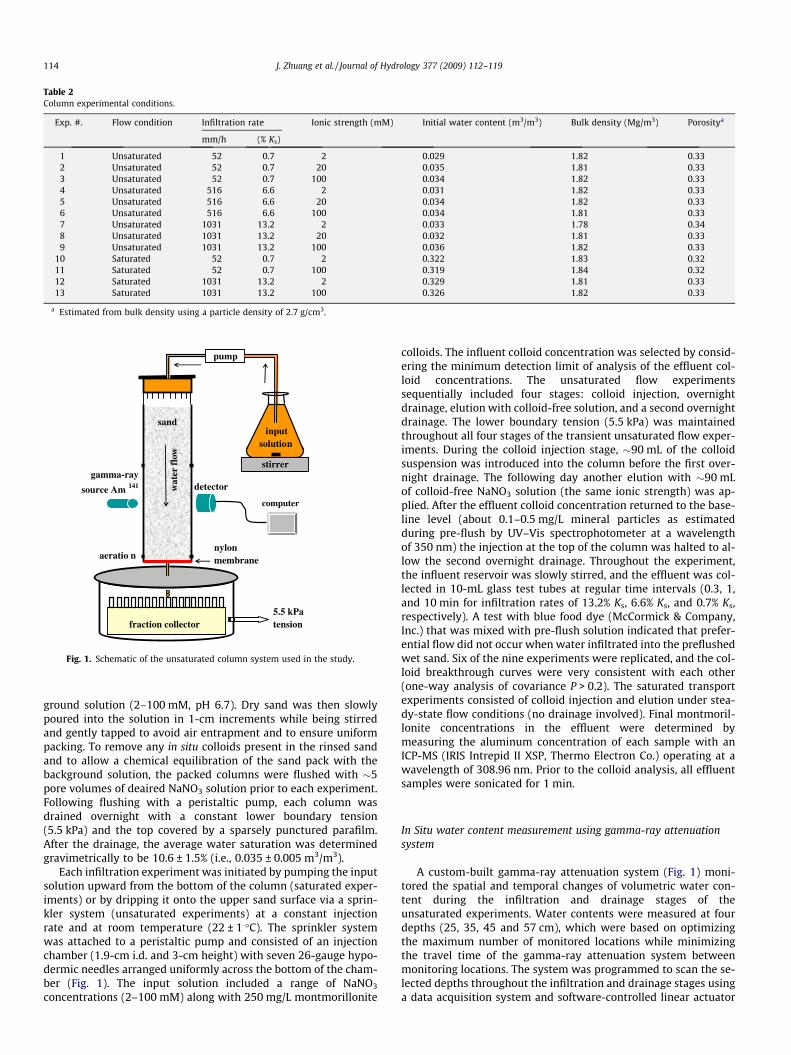
Table 2Column experimental conditions.
Exp. #. Flow condition Infiltration rate Ionic strength (mM) Initial water content (m3/m3) Bulk density (Mg/m3) Porositya
mm/h (% Ks)
1 Unsaturated 52 0.7 2 0.029 1.82 0.332 Unsaturated 52 0.7 20 0.035 1.81 0.333 Unsaturated 52 0.7 100 0.034 1.82 0.334 Unsaturated 516 6.6 2 0.031 1.82 0.335 Unsaturated 516 6.6 20 0.034 1.82 0.336 Unsaturated 516 6.6 100 0.034 1.81 0.337 Unsaturated 1031 13.2 2 0.033 1.78 0.348 Unsaturated 1031 13.2 20 0.032 1.81 0.339 Unsaturated 1031 13.2 100 0.036 1.82 0.33
10 Saturated 52 0.7 2 0.322 1.83 0.3211 Saturated 52 0.7 100 0.319 1.84 0.3212 Saturated 1031 13.2 2 0.329 1.81 0.3313 Saturated 1031 13.2 100 0.326 1.82 0.33
a Estimated from bulk density using a particle density of 2.7 g/cm3.
gamma-ray
source Am 141
fraction collector5.5 kPatension
detector
computer
wat
er f
low
pump
nylon membrane
input solution
stirrer
sand
aeratio n
Fig. 1. Schematic of the unsaturated column system used in the study.
114 J. Zhuang et al. / Journal of Hydrology 377 (2009) 112–119
ground solution (2–100 mM, pH 6.7). Dry sand was then slowlypoured into the solution in 1-cm increments while being stirredand gently tapped to avoid air entrapment and to ensure uniformpacking. To remove any in situ colloids present in the rinsed sandand to allow a chemical equilibration of the sand pack with thebackground solution, the packed columns were flushed with �5pore volumes of deaired NaNO3 solution prior to each experiment.Following flushing with a peristaltic pump, each column wasdrained overnight with a constant lower boundary tension(5.5 kPa) and the top covered by a sparsely punctured parafilm.After the drainage, the average water saturation was determinedgravimetrically to be 10.6 ± 1.5% (i.e., 0.035 ± 0.005 m3/m3).
Each infiltration experiment was initiated by pumping the inputsolution upward from the bottom of the column (saturated exper-iments) or by dripping it onto the upper sand surface via a sprin-kler system (unsaturated experiments) at a constant injectionrate and at room temperature (22 ± 1 �C). The sprinkler systemwas attached to a peristaltic pump and consisted of an injectionchamber (1.9-cm i.d. and 3-cm height) with seven 26-gauge hypo-dermic needles arranged uniformly across the bottom of the cham-ber (Fig. 1). The input solution included a range of NaNO3
concentrations (2–100 mM) along with 250 mg/L montmorillonite
colloids. The influent colloid concentration was selected by consid-ering the minimum detection limit of analysis of the effluent col-loid concentrations. The unsaturated flow experimentssequentially included four stages: colloid injection, overnightdrainage, elution with colloid-free solution, and a second overnightdrainage. The lower boundary tension (5.5 kPa) was maintainedthroughout all four stages of the transient unsaturated flow exper-iments. During the colloid injection stage, �90 mL of the colloidsuspension was introduced into the column before the first over-night drainage. The following day another elution with �90 mLof colloid-free NaNO3 solution (the same ionic strength) was ap-plied. After the effluent colloid concentration returned to the base-line level (about 0.1–0.5 mg/L mineral particles as estimatedduring pre-flush by UV–Vis spectrophotometer at a wavelengthof 350 nm) the injection at the top of the column was halted to al-low the second overnight drainage. Throughout the experiment,the influent reservoir was slowly stirred, and the effluent was col-lected in 10-mL glass test tubes at regular time intervals (0.3, 1,and 10 min for infiltration rates of 13.2% Ks, 6.6% Ks, and 0.7% Ks,respectively). A test with blue food dye (McCormick & Company,Inc.) that was mixed with pre-flush solution indicated that prefer-ential flow did not occur when water infiltrated into the preflushedwet sand. Six of the nine experiments were replicated, and the col-loid breakthrough curves were very consistent with each other(one-way analysis of covariance P > 0.2). The saturated transportexperiments consisted of colloid injection and elution under stea-dy-state flow conditions (no drainage involved). Final montmoril-lonite concentrations in the effluent were determined bymeasuring the aluminum concentration of each sample with anICP-MS (IRIS Intrepid II XSP, Thermo Electron Co.) operating at awavelength of 308.96 nm. Prior to the colloid analysis, all effluentsamples were sonicated for 1 min.
In Situ water content measurement using gamma-ray attenuationsystem
A custom-built gamma-ray attenuation system (Fig. 1) moni-tored the spatial and temporal changes of volumetric water con-tent during the infiltration and drainage stages of theunsaturated experiments. Water contents were measured at fourdepths (25, 35, 45 and 57 cm), which were based on optimizingthe maximum number of monitored locations while minimizingthe travel time of the gamma-ray attenuation system betweenmonitoring locations. The system was programmed to scan the se-lected depths throughout the infiltration and drainage stages usinga data acquisition system and software-controlled linear actuator
0.7% Ks, 52 mm/h
0.0
0.1
0.2
0.3
0.4
0.5
0.6
0.7
0 50 100 150 200 250 300 350 400 450Time (min)
Wat
er s
atur
atio
n 25-cm35-cm45-cm57-cm
infiltration drainage
colloid effluent was collected
outflow occurred
after 38 min
J. Zhuang et al. / Journal of Hydrology 377 (2009) 112–119 115
(Bislide 15 in., MN-0150-E01–21) and stepping motor. Further de-tails about the system are provided in Tyner and Brown (2004).
Prior to infiltration, the preflushed-then-drained columns werescanned vertically to determine the gamma-ray attenuation causedby the sand and initial water content. The counting live-time was10 s at each depth, which resulted in a measurement deviation of<10% compared to the actual volumetric water content. The dura-tion of one complete column scan was about 3 min including thetravel time of the detector between the four depths. Spatial andtemporal changes in water content during the flow experimentswere calculated based on the attenuation of gamma-radiation bywater using the Lambert–Beer equation (Oostrom et al., 2002)and the known mass attenuation coefficient of water, lw. Theexperimentally determined value of lw agreed well with the theo-retical value, indicating that the system was well collimated.
6.6% Ks, 516 mm/h
0.0
0.1
0.2
0.3
0.4
0.5
0.6
0.7
0 50 100 150 200 250
Time (min)
Wat
er s
atur
atio
n 25-cm35-cm45-cm57-cm
infiltration drainage
colloid effluent was collected
outflow occurred
13.2% Ks, 1031 mm/h
0.0
0.1
0.2
0.3
0.4
0.5
0.6
0.7
0 50 100 150 200 250
Wat
er s
atur
atio
n
25-cm35-cm45-cm57-cm
infiltration drainage
colloid effluent was collected
outflowoccurredafter 5 min
after 7 min
Results and discussion
Water infiltration and drainage at different infiltration rates
Fig. 2 shows the changes in water saturation during infiltrationand drainage of the sand. Only, data obtained from experimentsusing the 2 mM NaNO3 solution are representatively shown be-cause similar results were observed at 20 mM and 100 mM. In allcases, the water saturation increased very quickly during the initialinfiltration, and then stabilized at a high level through the infiltra-tion stage, followed by a decrease during drainage. The stablewater saturation during the infiltration period suggests that a stea-dy-state flow condition was maintained throughout the columnduring the period between the initial outflow and the beginningof drainage. The steady-state water saturations (0.30, 0.38, and0.47) increased with increasing infiltration rate (i.e., 0.7% Ks, 6.6%Ks, and 13.2% Ks, respectively). The travel times for the wettingfronts to reach the bottom of the column were 38, 7, and 5 minfor the infiltration rates of 0.7% Ks, 6.6% Ks, and 13.2% Ks, respec-tively. By observing the elapsed time between the end of imbibi-tion and the return of the antecedent saturation at the columnbase (57 cm depth), we observed that the desaturation front re-quired 4, 12, and 16 min to reach the bottom of the columns atinfiltration rates of 0.7% Ks, 6.6% Ks, and 13.2% Ks, respectively.These varying infiltration and drainage rates, and associatedchanges in water contents, were expected to influence colloidtransport and mobilization.
Time (min)
Fig. 2. Temporal changes in water saturation at different depths of the columnduring infiltration and drainage of 2 mM NaNO3 solution.
Effect of ionic strength on colloid transport and remobilization
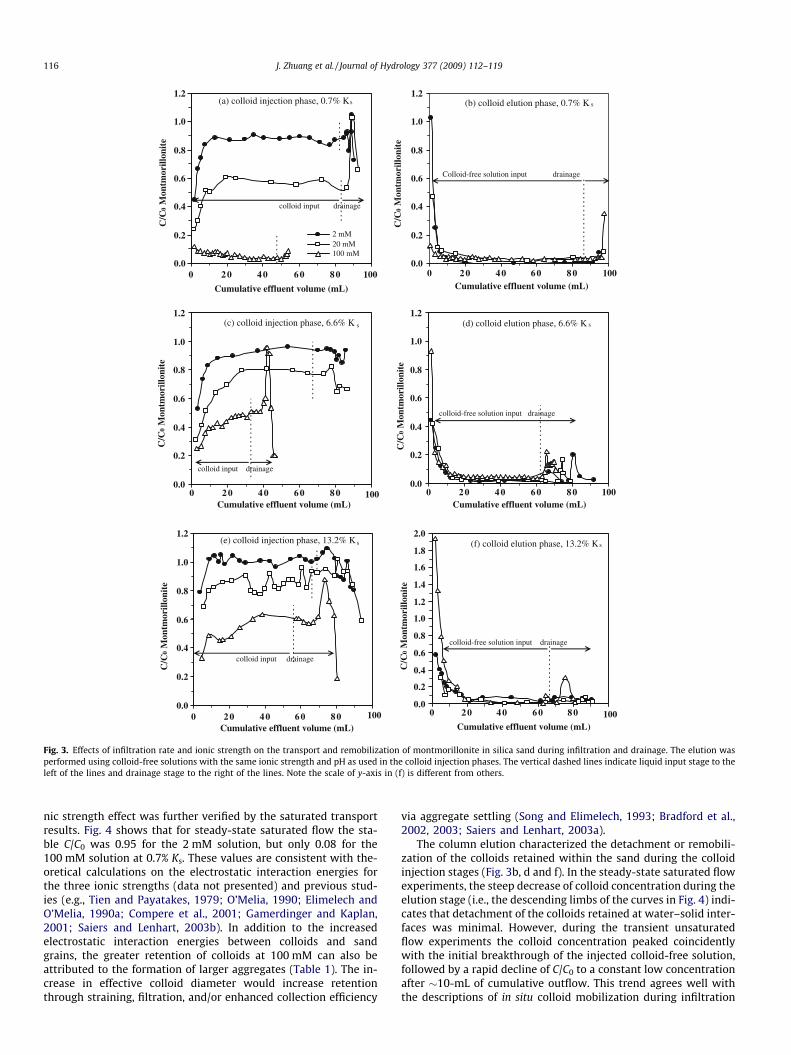
Transient infiltration, drainage, and elution of montmorillonitecolloids through the silica sand at three ionic strengths (2, 20,and 100 mM NaNO3) and three infiltration rates (0.7% Ks, 6.6% Ks,and 13.2% Ks) are compared in Fig. 3. During the colloid injectionstages (Fig. 3a, c and e), the colloid concentrations showed a risingtrend in the initial effluent, and then climbed up to a relatively sta-ble level after an outflow of �10-mL. The relative change of colloidconcentration approximated the change in saturation (an initial ra-pid increase followed by a stable value). This pattern is similar tothe colloid breakthrough curves observed in studies conductedwith partially saturated porous media under steady-state flow con-ditions (Lenhart and Saiers, 2002; Zhuang et al., 2005). Under stea-dy-state flow conditions, the relatively low colloid breakthroughconcentrations at early times were attributed primarily to colloiddispersion, attachment at solid–water interfaces, and straining bywater films or pore throats (Elimelech and O’Melia, 1990a; Wanand Tokunaga, 1997; Bradford et al., 2002; Zevi et al., 2005; Zhuanget al., 2005; Gao et al., 2006). However, when subjected to tran-sient flow conditions, these dynamic colloid concentrations appear
to be dominated by changes in water content, as noted above. Air–water interfaces were assumed not to play a significant role. Wanand Tokunaga (2002) found that Na-montmorillonite clays wereexcluded from air–water interfaces (at any pH and ionic strength)due to the high electro-negativity of the particles. However, Cristet al. (2004, 2005) reported that colloids could also be retainedat the air–water–grain interface and are thus subjected to thechange in pore water saturation and geometry.
The difference in effluent colloid concentration observed forboth the initial transient portion of the pulse and the later stea-dy-state flows (i.e., the plateau portion of the curves in Fig. 3a,c and e) among the different ionic strengths indicates a pro-nounced electrostatic effect. The lower ionic strengths favoredcolloid transport at the lowest infiltration rate (0.7% Ks). The sta-ble colloid concentrations (C/C0) reached �0.89 and �0.60 for2 mM and 20 mM solutions, respectively, in contrast to the verylow level (only �0.05–0.1) for 100 mM solution (Fig. 3a). This io-
(c) colloid injection phase, 6.6% K s
0.0
0.2
0.4
0.6
0.8
1.0
1.2
0 2 0 40 60 80Cumulative effluent volume (mL)
colloid input drainage
C/C
0 M
ontm
orill
onit
e
(f) colloid elution phase, 13.2% Ks
0.0
0.2
0.4
0.6
0.8
1.0
1.2
1.4
1.6
1.8
2.0
0 20 4 0 60 80
Cumulative effluent volume (mL)
colloid-free solution input drainage
C/C
0 M
ontm
orill
onit
e
(e) colloid injection phase, 13.2% Ks
0.0
0.2
0.4
0.6
0.8
1.0
1.2
0 20 40 60 80Cumulative effluent volume (mL)
colloid input drainage
C/C
0 M
ontm
orill
onit
e
(d) colloid elution phase, 6.6% K s
0.0
0.2
0.4
0.6
0.8
1.0
1.2
0 20 4 0 60 8 0Cumulative effluent volume (mL)
colloid-free solution input drainage
C/C
0 M
ontm
orill
onit
e
(a) colloid injection phase, 0.7% Ks
0.0
0.2
0.4
0.6
0.8
1.0
1.2
0 20 40 60 80 100
Cumulative effluent volume (mL)
2 mM20 mM100 mM
colloid input drainage
C/C
0 M
ontm
orill
onit
e
(b) colloid elution phase, 0.7% K s
0.0
0.2
0.4
0.6
0.8
1.0
1.2
0 20 40 60 8 0Cumulative effluent volume (mL)
Colloid-free solution input drainage
C/C
0 M
ontm
orill
onit
e
100
100 100
100
100
Fig. 3. Effects of infiltration rate and ionic strength on the transport and remobilization of montmorillonite in silica sand during infiltration and drainage. The elution wasperformed using colloid-free solutions with the same ionic strength and pH as used in the colloid injection phases. The vertical dashed lines indicate liquid input stage to theleft of the lines and drainage stage to the right of the lines. Note the scale of y-axis in (f) is different from others.
116 J. Zhuang et al. / Journal of Hydrology 377 (2009) 112–119
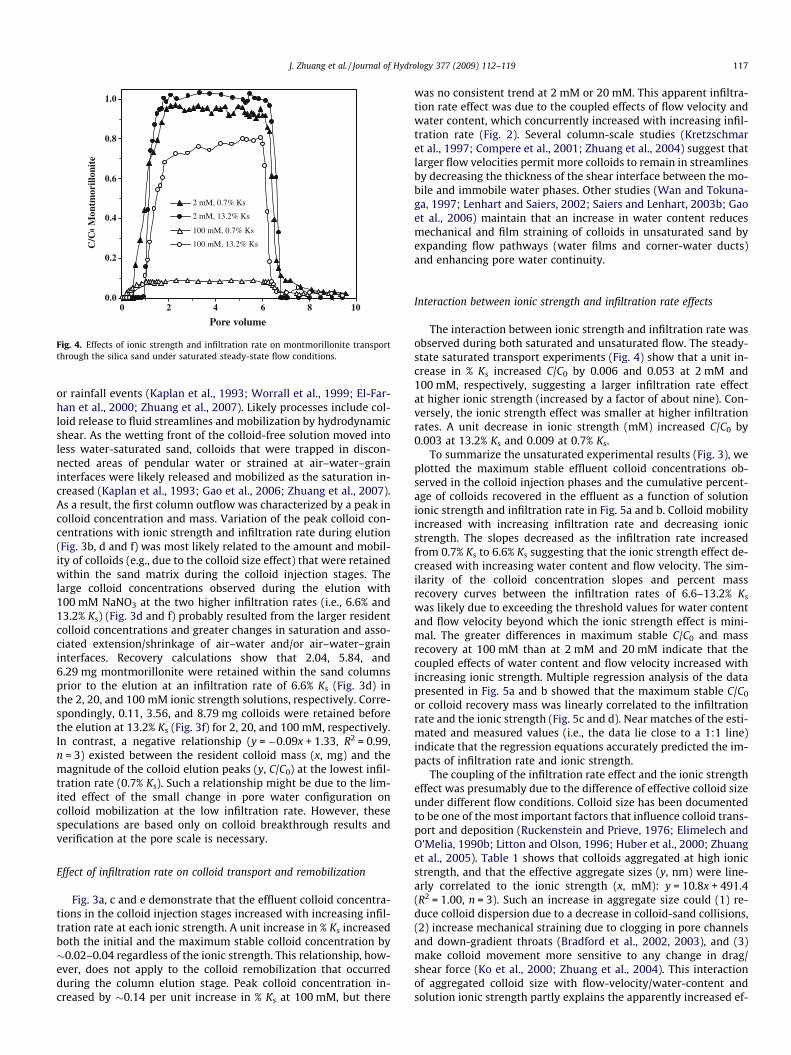
nic strength effect was further verified by the saturated transportresults. Fig. 4 shows that for steady-state saturated flow the sta-ble C/C0 was 0.95 for the 2 mM solution, but only 0.08 for the100 mM solution at 0.7% Ks. These values are consistent with the-oretical calculations on the electrostatic interaction energies forthe three ionic strengths (data not presented) and previous stud-ies (e.g., Tien and Payatakes, 1979; O’Melia, 1990; Elimelech andO’Melia, 1990a; Compere et al., 2001; Gamerdinger and Kaplan,2001; Saiers and Lenhart, 2003b). In addition to the increasedelectrostatic interaction energies between colloids and sandgrains, the greater retention of colloids at 100 mM can also beattributed to the formation of larger aggregates (Table 1). The in-crease in effective colloid diameter would increase retentionthrough straining, filtration, and/or enhanced collection efficiency
via aggregate settling (Song and Elimelech, 1993; Bradford et al.,2002, 2003; Saiers and Lenhart, 2003a).
The column elution characterized the detachment or remobili-zation of the colloids retained within the sand during the colloidinjection stages (Fig. 3b, d and f). In the steady-state saturated flowexperiments, the steep decrease of colloid concentration during theelution stage (i.e., the descending limbs of the curves in Fig. 4) indi-cates that detachment of the colloids retained at water–solid inter-faces was minimal. However, during the transient unsaturatedflow experiments the colloid concentration peaked coincidentlywith the initial breakthrough of the injected colloid-free solution,followed by a rapid decline of C/C0 to a constant low concentrationafter �10-mL of cumulative outflow. This trend agrees well withthe descriptions of in situ colloid mobilization during infiltration
0.0
0.2
0.4
0.6
0.8
1.0
0 2 4 6 8 10
Pore volume
2 mM, 0.7% Ks
2 mM, 13.2% Ks
100 mM, 0.7% Ks
100 mM, 13.2% KsC/C
0 M
ontm
orill
onit
e
Fig. 4. Effects of ionic strength and infiltration rate on montmorillonite transportthrough the silica sand under saturated steady-state flow conditions.
J. Zhuang et al. / Journal of Hydrology 377 (2009) 112–119 117
or rainfall events (Kaplan et al., 1993; Worrall et al., 1999; El-Far-han et al., 2000; Zhuang et al., 2007). Likely processes include col-loid release to fluid streamlines and mobilization by hydrodynamicshear. As the wetting front of the colloid-free solution moved intoless water-saturated sand, colloids that were trapped in discon-nected areas of pendular water or strained at air–water–graininterfaces were likely released and mobilized as the saturation in-creased (Kaplan et al., 1993; Gao et al., 2006; Zhuang et al., 2007).As a result, the first column outflow was characterized by a peak incolloid concentration and mass. Variation of the peak colloid con-centrations with ionic strength and infiltration rate during elution(Fig. 3b, d and f) was most likely related to the amount and mobil-ity of colloids (e.g., due to the colloid size effect) that were retainedwithin the sand matrix during the colloid injection stages. Thelarge colloid concentrations observed during the elution with100 mM NaNO3 at the two higher infiltration rates (i.e., 6.6% and13.2% Ks) (Fig. 3d and f) probably resulted from the larger residentcolloid concentrations and greater changes in saturation and asso-ciated extension/shrinkage of air–water and/or air–water–graininterfaces. Recovery calculations show that 2.04, 5.84, and6.29 mg montmorillonite were retained within the sand columnsprior to the elution at an infiltration rate of 6.6% Ks (Fig. 3d) inthe 2, 20, and 100 mM ionic strength solutions, respectively. Corre-spondingly, 0.11, 3.56, and 8.79 mg colloids were retained beforethe elution at 13.2% Ks (Fig. 3f) for 2, 20, and 100 mM, respectively.In contrast, a negative relationship (y = �0.09x + 1.33, R2 = 0.99,n = 3) existed between the resident colloid mass (x, mg) and themagnitude of the colloid elution peaks (y, C/C0) at the lowest infil-tration rate (0.7% Ks). Such a relationship might be due to the lim-ited effect of the small change in pore water configuration oncolloid mobilization at the low infiltration rate. However, thesespeculations are based only on colloid breakthrough results andverification at the pore scale is necessary.
Effect of infiltration rate on colloid transport and remobilization
Fig. 3a, c and e demonstrate that the effluent colloid concentra-tions in the colloid injection stages increased with increasing infil-tration rate at each ionic strength. A unit increase in % Ks increasedboth the initial and the maximum stable colloid concentration by�0.02–0.04 regardless of the ionic strength. This relationship, how-ever, does not apply to the colloid remobilization that occurredduring the column elution stage. Peak colloid concentration in-creased by �0.14 per unit increase in % Ks at 100 mM, but there
was no consistent trend at 2 mM or 20 mM. This apparent infiltra-tion rate effect was due to the coupled effects of flow velocity andwater content, which concurrently increased with increasing infil-tration rate (Fig. 2). Several column-scale studies (Kretzschmaret al., 1997; Compere et al., 2001; Zhuang et al., 2004) suggest thatlarger flow velocities permit more colloids to remain in streamlinesby decreasing the thickness of the shear interface between the mo-bile and immobile water phases. Other studies (Wan and Tokuna-ga, 1997; Lenhart and Saiers, 2002; Saiers and Lenhart, 2003b; Gaoet al., 2006) maintain that an increase in water content reducesmechanical and film straining of colloids in unsaturated sand byexpanding flow pathways (water films and corner-water ducts)and enhancing pore water continuity.
Interaction between ionic strength and infiltration rate effects
The interaction between ionic strength and infiltration rate wasobserved during both saturated and unsaturated flow. The steady-state saturated transport experiments (Fig. 4) show that a unit in-crease in % Ks increased C/C0 by 0.006 and 0.053 at 2 mM and100 mM, respectively, suggesting a larger infiltration rate effectat higher ionic strength (increased by a factor of about nine). Con-versely, the ionic strength effect was smaller at higher infiltrationrates. A unit decrease in ionic strength (mM) increased C/C0 by0.003 at 13.2% Ks and 0.009 at 0.7% Ks.
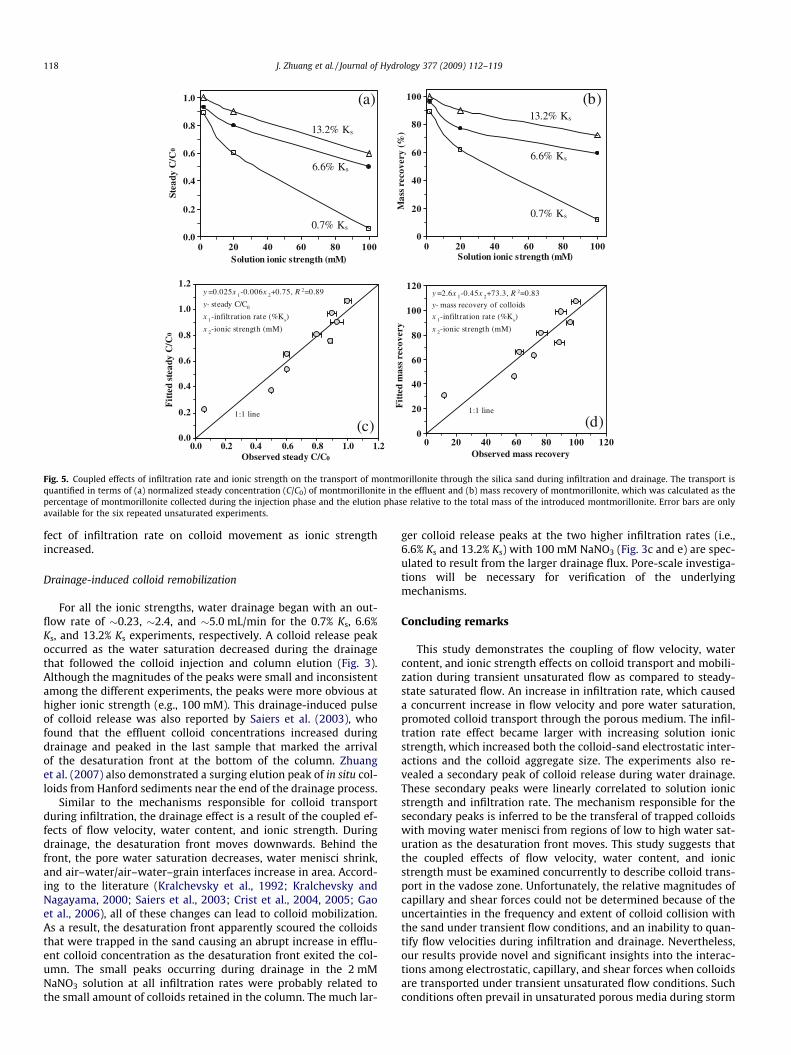
To summarize the unsaturated experimental results (Fig. 3), weplotted the maximum stable effluent colloid concentrations ob-served in the colloid injection phases and the cumulative percent-age of colloids recovered in the effluent as a function of solutionionic strength and infiltration rate in Fig. 5a and b. Colloid mobilityincreased with increasing infiltration rate and decreasing ionicstrength. The slopes decreased as the infiltration rate increasedfrom 0.7% Ks to 6.6% Ks suggesting that the ionic strength effect de-creased with increasing water content and flow velocity. The sim-ilarity of the colloid concentration slopes and percent massrecovery curves between the infiltration rates of 6.6–13.2% Ks
was likely due to exceeding the threshold values for water contentand flow velocity beyond which the ionic strength effect is mini-mal. The greater differences in maximum stable C/C0 and massrecovery at 100 mM than at 2 mM and 20 mM indicate that thecoupled effects of water content and flow velocity increased withincreasing ionic strength. Multiple regression analysis of the datapresented in Fig. 5a and b showed that the maximum stable C/C0
or colloid recovery mass was linearly correlated to the infiltrationrate and the ionic strength (Fig. 5c and d). Near matches of the esti-mated and measured values (i.e., the data lie close to a 1:1 line)indicate that the regression equations accurately predicted the im-pacts of infiltration rate and ionic strength.
The coupling of the infiltration rate effect and the ionic strengtheffect was presumably due to the difference of effective colloid sizeunder different flow conditions. Colloid size has been documentedto be one of the most important factors that influence colloid trans-port and deposition (Ruckenstein and Prieve, 1976; Elimelech andO’Melia, 1990b; Litton and Olson, 1996; Huber et al., 2000; Zhuanget al., 2005). Table 1 shows that colloids aggregated at high ionicstrength, and that the effective aggregate sizes (y, nm) were line-arly correlated to the ionic strength (x, mM): y = 10.8x + 491.4(R2 = 1.00, n = 3). Such an increase in aggregate size could (1) re-duce colloid dispersion due to a decrease in colloid-sand collisions,(2) increase mechanical straining due to clogging in pore channelsand down-gradient throats (Bradford et al., 2002, 2003), and (3)make colloid movement more sensitive to any change in drag/shear force (Ko et al., 2000; Zhuang et al., 2004). This interactionof aggregated colloid size with flow-velocity/water-content andsolution ionic strength partly explains the apparently increased ef-
0
20
40
60
80
100
0 20 40 60 80 100Solution ionic strength (mM)
Mas
s re
cove
ry (%
)
0.7% Ks
6.6% Ks
13.2% Ks
(b)(a)
0.0
0.2
0.4
0.6
0.8
1.0
0 20 40 60 80 100Solution ionic strength (mM)
Stea
dy C
/C 0
0.7% Ks
6.6% Ks
13.2% Ks
0.0
0.2
0.4
0.6
0.8
1.0
1.2
0.0 0.2 0.4 0.6 0.8 1.0 1.2
y =0.025x 1-0.006x 2+0.75, R 2=0.89
y- steady C/C0
x 1-infiltration rate (%Ks)
x 2-ionic strength (mM)
1:1 line
Observed steady C/C0
Fit
ted
stea
dy C
/C 0
(c)0
20
40
60
80
100
120
0 20 40 60 80 100 120
y =2.6x 1-0.45x 2+73.3, R 2=0.83
y- mass recovery of colloids
x 1-infiltration rate (%Ks)
x 2-ionic strength (mM)
1:1 line
Observed mass recovery
Fit
ted
mas
s re
cove
ry
(d)
Fig. 5. Coupled effects of infiltration rate and ionic strength on the transport of montmorillonite through the silica sand during infiltration and drainage. The transport isquantified in terms of (a) normalized steady concentration (C/C0) of montmorillonite in the effluent and (b) mass recovery of montmorillonite, which was calculated as thepercentage of montmorillonite collected during the injection phase and the elution phase relative to the total mass of the introduced montmorillonite. Error bars are onlyavailable for the six repeated unsaturated experiments.
118 J. Zhuang et al. / Journal of Hydrology 377 (2009) 112–119
fect of infiltration rate on colloid movement as ionic strengthincreased.
Drainage-induced colloid remobilization
For all the ionic strengths, water drainage began with an out-flow rate of �0.23, �2.4, and �5.0 mL/min for the 0.7% Ks, 6.6%Ks, and 13.2% Ks experiments, respectively. A colloid release peakoccurred as the water saturation decreased during the drainagethat followed the colloid injection and column elution (Fig. 3).Although the magnitudes of the peaks were small and inconsistentamong the different experiments, the peaks were more obvious athigher ionic strength (e.g., 100 mM). This drainage-induced pulseof colloid release was also reported by Saiers et al. (2003), whofound that the effluent colloid concentrations increased duringdrainage and peaked in the last sample that marked the arrivalof the desaturation front at the bottom of the column. Zhuanget al. (2007) also demonstrated a surging elution peak of in situ col-loids from Hanford sediments near the end of the drainage process.
Similar to the mechanisms responsible for colloid transportduring infiltration, the drainage effect is a result of the coupled ef-fects of flow velocity, water content, and ionic strength. Duringdrainage, the desaturation front moves downwards. Behind thefront, the pore water saturation decreases, water menisci shrink,and air–water/air–water–grain interfaces increase in area. Accord-ing to the literature (Kralchevsky et al., 1992; Kralchevsky andNagayama, 2000; Saiers et al., 2003; Crist et al., 2004, 2005; Gaoet al., 2006), all of these changes can lead to colloid mobilization.As a result, the desaturation front apparently scoured the colloidsthat were trapped in the sand causing an abrupt increase in efflu-ent colloid concentration as the desaturation front exited the col-umn. The small peaks occurring during drainage in the 2 mMNaNO3 solution at all infiltration rates were probably related tothe small amount of colloids retained in the column. The much lar-
ger colloid release peaks at the two higher infiltration rates (i.e.,6.6% Ks and 13.2% Ks) with 100 mM NaNO3 (Fig. 3c and e) are spec-ulated to result from the larger drainage flux. Pore-scale investiga-tions will be necessary for verification of the underlyingmechanisms.
Concluding remarks
This study demonstrates the coupling of flow velocity, watercontent, and ionic strength effects on colloid transport and mobili-zation during transient unsaturated flow as compared to steady-state saturated flow. An increase in infiltration rate, which causeda concurrent increase in flow velocity and pore water saturation,promoted colloid transport through the porous medium. The infil-tration rate effect became larger with increasing solution ionicstrength, which increased both the colloid-sand electrostatic inter-actions and the colloid aggregate size. The experiments also re-vealed a secondary peak of colloid release during water drainage.These secondary peaks were linearly correlated to solution ionicstrength and infiltration rate. The mechanism responsible for thesecondary peaks is inferred to be the transferal of trapped colloidswith moving water menisci from regions of low to high water sat-uration as the desaturation front moves. This study suggests thatthe coupled effects of flow velocity, water content, and ionicstrength must be examined concurrently to describe colloid trans-port in the vadose zone. Unfortunately, the relative magnitudes ofcapillary and shear forces could not be determined because of theuncertainties in the frequency and extent of colloid collision withthe sand under transient flow conditions, and an inability to quan-tify flow velocities during infiltration and drainage. Nevertheless,our results provide novel and significant insights into the interac-tions among electrostatic, capillary, and shear forces when colloidsare transported under transient unsaturated flow conditions. Suchconditions often prevail in unsaturated porous media during storm

J. Zhuang et al. / Journal of Hydrology 377 (2009) 112–119 119
events, snow-melt, and septic fields when water is discharged,making our findings highly relevant to the facilitated transport ofpathogens as well as toxic metal and organic contaminants withan affinity for adsorbing to colloidal particles.
Acknowledgements
The study was supported by the Environmental ManagementScience Program, US Department of Energy under Grant No. DE-FG07-02ER63496. We thank Dr. John F. McCarthy and Dr. MarkusFlury for their review and editing of an early version of the manu-script. We also thank Dr. Tammo Steenhuis and an anonymous re-viewer for their very helpful and insightful comments.
References
Bradford, S.A., Yates, S.R., Bettahar, M., Simunek, J., 2002. Physical factors affectingthe transport and fate of colloids in saturated porous media. Water Resour. Res.38, 1327. doi:10.1029/2002WR001340.
Bradford, S.A., Simunek, J., Bettahar, M., van Genuchten, M.Th., Yates, S.R., 2003.Modeling colloid attachment, straining, and exclusion in saturated porousmedia. Environ. Sci. Technol. 37, 2242–2250.
Compere, F., Porel, G., Delay, F., 2001. Transport and retention of clay particles insaturated porous media: influence of ionic strength and pore velocity. J.Contam. Hydrol. 49, 1–21.
Crist, J.T., McCarthy, J.F., Zevi, Y., Baveye, P., Throop, J.A., Steenhuis, T.S., 2004. Pore-scale visualization of colloid transport and retention in partly saturated porousmedia. Vadose Zone J. 3, 444–450.
Crist, J.T., Zevi, Y., McCarthy, J.F., Throop, J.A., Steenhuis, T.S., 2005. Transport andretention mechanisms of colloids in partially saturated porous media. VadoseZone J. 4, 184–195.
Dane, J.H., Hopmans, J.M., 2002. Pressure cell. In: Dane, J.H., Topp, G.C. (Eds.),Methods of Soil Analysis, Part 4-Physical Methods. ASA and SSSA, Madison, WI,pp. 684–688.
DeNovio, N.M., Saiers, J.M., Ryan, J.N., 2004. Colloid movement in unsaturatedporous media: recent advances and future directions. Vadose Zone J. 3, 338–351.
El-Farhan, Y.H., Denovio, N.M., Herman, J.S., Hornberger, G.M., 2000. Mobilizationand transport of soil particles during infiltration experiments in an agriculturalfield, Shenandoah Valley, Virginia. Environ. Sci. Technol. 34, 3555–3559.
Elimelech, M., O’Melia, C.R., 1990a. Kinetics of deposition of colloidal particles inporous media. Environ. Sci. Technol. 24, 1528–1536.
Elimelech, M., O’Melia, C.R., 1990b. Effect of particle-size on collision efficiency inthe deposition of Brownian particles with electrostatic energy barriers.Langmuir 6, 1153–1163.
Gamerdinger, A.P., Kaplan, D.I., 2001. Colloid transport and deposition in water-saturated Yucca Mountain tuff as determined by ionic strength. Environ. Sci.Technol. 35, 3326–3331.
Gao, B., Saiers, J.E., Ryan, J.N., 2006. Pore-scale mechanisms of colloid deposition andmobilization during steady and transient flow through unsaturated granularmedia. Water Resour. Res. 42, W01410. doi:10.1029/2005WR004233.
Gee, G.W., Or, D., 2002. Particle-size analysis. In: Dane, J.H., Topp, G.C. (Eds.),Methods of Soil Analysis, Part 4-Physical Methods. ASA and SSSA, Madison, WI,pp. 269–278.
Grolimund, D., Borkovec, M., Barmettler, K., Sticher, H., 1996. Colloid-facilitatedtransport of strongly sorbing contaminants in natural porous media: alaboratory column study. Environ. Sci. Technol. 30, 3118–3123.
Huber, N., Baumann, T., Niessner, R., 2000. Assessment of colloid filtration in naturalporous media by filtration theory. Environ. Sci. Technol. 34, 3774–3779.
Kaplan, D.I., Bertsch, P.M., Adriano, D.C., Miller, W.P., 1993. Soil-borne mobilecolloids as influenced by water flow and organic carbon. Environ. Sci. Technol.27, 1193–1200.
Klute, A., Dirksen, C., 1986. Hydraulic conductivity and diffusivity: laboratorymethods. In: Klute, A. (Ed.), Methods of Soil Analysis-Part I. ASA and SSSA,Madison, WI, pp. 687–734.
Ko, C.H., Bhattacharjee, S., Elimelech, M., 2000. Coupled influence of colloidal andhydrodynamic interactions on the RSA dynamic blocking function for particledeposition onto packed spherical collectors. J. Colloid Interf. Sci. 229, 554–567.
Kralchevsky, P.A., Denkov, N.D., 2001. Capillary forces and structuring in layers ofcolloid particles. Curr. Opin. Colloid Interf. Sci. 6, 383–401.
Kralchevsky, P.A., Nagayama, K., 2000. Capillary interactions between particlesbound to interfaces, liquid films and biomembranes. Adv. Colloid Interf. Sci. 85,145–192.
Kralchevsky, P.A., Paunov, V.N., Ivanov, I.B., Nagayama, K., 1992. Capillary meniscusinteraction between colloidal particles attached to a liquid–fluid interface. J.Colloid Interf. Sci. 151, 79–94.
Kretzschmar, R., Barmettler, K., Grolimund, D., Yan, Y.D., Borkovec, M., Sticher, H.,1997. Experimental determination of colloid deposition rates and collisionefficiencies in natural porous media. Water Resour. Res. 33, 1129–1137.
Kretzschmar, R., Borkovec, M., Grolimund, D., Elimelech, M., 1999. Mobilesubsurface colloids and their role in contaminant transport. Adv. Agron. 66,121–193.
Lazouskaya, V., Jin, Y., Or, D., 2006. Interfacial interactions and colloid retentionunder steady flows in a capillary channel. J. Interf. Colloid Sci. 303, 171–184.
Lenhart, J.J., Saiers, J.E., 2002. Transport of silica colloids through unsaturatedporous media: experimental results and model comparisons. Environ. Sci.Technol. 36, 769–777.
Litton, G.M., Olson, T.M., 1996. Particle size effects on colloid deposition kinetics:evidence of secondary minimum deposition. Colloid Surf. A 107, 273–283.
McCarthy, J.F., McKay, L.D., 2004. Colloid transport in the subsurface. past, present,and future challenges. Vadose Zone J. 3, 326–337.
McCarthy, J.F., Zachara, J.M., 1989. Subsurface transport of contaminants-mobilecolloids in the subsurface environment may alter the transport of contaminants.Environ. Sci. Technol. 23, 496–502.
O’Melia, C.R., 1990. Kinetics of colloidal chemical processes in aquatic systems. In:Stumm, W. (Ed.), Aquatic Chemical Kinetics: Reaction rates of processes innatural water. Wiley-Interscience, New York, pp. 447–474.
Oostrom, M., Dane, J.H., Lenhard, R.J., 2002. Fluid contents. In: Dane, J.H., Topp, G.C.(Eds.), Methods of Soil Analysis-Part 4 Physical Methods. ASA and SSSA,Madison, WI, pp. 1539–1563.
Ruckenstein, E., Prieve, D.C., 1976. Adsorption and desorption of particles and theirchromatographic separation. AICHE J. 22, 276–283.
Ryan, J.N., Gschwend, P.M., 1994. Effects of ionic strength and flow rate on colloidrelease: relating kinetics to intersurface potential energy. J. Colloid Interf. Sci.164, 21–34.
Saiers, J.M., Lenhart, J.J., 2003a. Colloid mobilization and transport withinunsaturated porous media under transient-flow conditions. Water Resour.Res. 39, 1019. doi:10.1029/2002WR001370.
Saiers, J.E., Lenhart, J.J., 2003b. Ionic-strength effects on colloid transport andinterfacial reactions in partially saturated porous media. Water Resour. Res. 39,1256. doi:10.1029/2002WR001887.
Saiers, J.M., Hornberger, G.M., Gower, D.B., Herman, J.S., 2003. The role of movingair–water interfaces in colloid mobilization within the vadose zone. Geophys.Res. Lett. 30, 2083. doi:10.1029/2003GL018418.
Shang, J., Flury, M., Chen, G., Zhuang, J., 2008. Impact of flow rate, water content, andcapillary forces on in situ colloid mobilization during infiltration in unsaturatedsediments. Water Resour. Res. 44, W06411. doi:10.1029/2007WR006516.
Simons, D.B., Sentürk, F., 1992. Sediment Transport and Technology: Water andSediment Dynamics. Water Resources Publication. p. 77.
Song, L.F., Elimelech, M., 1993. Dynamics of colloid deposition in porous media:Modeling the role of retained particles. Colloid Surf. A 73, 49–63.
Steenhuis, T.S., McCarthy, J.F., Crist, J.T., Zevi, Y., Baveye, P.C., Throop, J.A., Fehrman,R.L., Dathe, A., Richards, B.K., 2005. Reply to ‘‘comments on ‘pore-scalevisualization of colloid transport and retention in partly saturated porousmedia’”. Vadose Zone J. 4, 957–958.
Tien, C., Payatakes, A.C., 1979. Advances in deep-bed filtration. AIChE J. 25, 737–759.Torkzaban, S., Bradford, S.A., van Genuchten, M.T., Walker, S.L., 2008. Colloid
transport in unsaturated porous media: the role of water content and ionicstrength on particle straining. J. Contam. Hydrol. 96, 113–127.
Tyner, J.S., Brown, G.O., 2004. Improvements to estimating unsaturated soilhydraulic properties from horizontal infiltration. Soil Sci. Soc. Am. J. 68, 1–6.
van Genuchten, M.T., 1980. A closed form equation for predicting the hydraulicconductivity of unsaturated soils. Soil Sci. Soc. Am. J. 44, 892–898.
Wan, J., Tokunaga, T., 1997. Film straining of colloids in unsaturated porous media:conceptual model and experimental testing. Environ. Sci. Technol. 31, 2413–2420.
Wan, J., Tokunaga, T., 2002. Partitioning of clay colloids at air-water interfaces. J.Colloid Interf. Sci. 247, 54–61.
Wan, J., Tokunaga, T., 2005. Comments on ‘‘pore-scale visualization of colloidtransport and retention in partly saturated porous media”. Vadose Zone J. 4,954–956.
Worrall, F., Parker, A., Rae, J.E., Johnson, A.C., 1999. A study of suspended andcolloidal matter in the leachate from lysimeters and its role in pesticidetransport. J. Environ. Qual. 28, 595–604.
Zevi, Y., Dathe, A., McCarthy, J.F., Richards, B.K., Steenhuis, T.S., 2005. Distribution ofcolloid particles onto interfaces in partly saturated sand. Environ. Sci. Technol.39, 7055–7064.
Zhuang, J., Flury, M., Jin, Y., 2003. Colloid-facilitated cesium transport throughwater-saturated Hanford sediments and Ottawa sand. Environ. Sci. Technol. 37,4905–4911.
Zhuang, J., Jin, Y., Flury, M., 2004. Comparison of Hanford colloid and kaolinitetransport in porous media. Vadose Zone J. 3 (2), 395–402.
Zhuang, J., Qi, J., Jin, Y., 2005. Retention and transport of amphiphilic colloids underunsaturated flow conditions: effect of particle size and surface properties.Environ. Sci. Technol. 39, 7853–7859.
Zhuang, J., McCarthy, J.F., Tyner, J.S., Perfect, E., Flury, M., 2007. In situ colloidmobilization in Hanford sediments under transient unsaturated flowconditions: effect of irrigation pattern. Environ. Sci. Technol. 41, 3199–3204.