cognitive skills and youth labor market outcomes cognitive skills and important additional inputs...
TRANSCRIPT
Cognitive Skills and Youth Labor Market Outcomes
Jean N. Lee
David Newhouse
World Bank Human Development Network, Labor Markets and Youth Team
1818 H St. NW
Washington, D.C. 20043
2
Abstract
This paper provides new cross-country evidence on the impact of cognitive skills, as measured by
international achievement tests, on subsequent youth employment outcomes. High average scores are
strongly associated with increases in school enrollment and reductions in the incidence of
unemployment, with slightly stronger effects for women. Higher scores also correlate with a larger
share of youth working in wage and salaried employment, outside of agriculture, and to some extent in
higher status occupations, but these findings are less robust. Conditional on average test scores, greater
within-cohort dispersion lead to reduced school attendance and increased employment at young ages,
perhaps reflecting the less precise signal value of further formal educational attainment in the presence
of large quality differences. In specifications including both educational attainment and measured test
scores, test scores have stronger effects on unemployment, but attainment is also strongly predictive of
employment and some measures of job quality. We conclude that while increasing education quality can
play a central role in improving youth employment outcomes, increasing attainment remains an
important and complementary objective to foster the creation of better jobs for youth.
3
1. Introduction
Youth employment outcomes are a large and growing concern worldwide. Youth unemployment rates
are consistently greater than those of adults, reaching up to 50 percent among the poor in Latin
America.1 The issue is particularly pressing issue in the aftermath of the recent financial crisis, which
young workers bore the brunt of in both developed and developing countries.2 Rough estimates, for
example, suggest that youth aged 16 to 25 lost 17 million jobs worldwide in 2009, corresponding to a
one percent drop in the share of young people employed (ILO, 2011). Limited job opportunities for
youth, at least in OECD countries, can lead to increases in crime3, and have potentially lasting effects on
the economic well-being of the most affected cohorts.4 Moreover, youth frustration with stagnant job
opportunities is perceived to be a driving factor behind the 2011 Arab spring uprisings in Tunisia and
Egypt. In several countries, rising youth unemployment has threatened to “create a lost generation of
the disaffected, unemployed, or underemployed”.5
A growing consensus believes that a major part of the solution lies in improving the quality of education
and young people’s cognitive skills, rather than increasing the mere quantity of schooling.6 The recent
focus on cognitive skills contrasts with earlier studies’ attention to other factors that determine youth
employment outcomes, such as demographic structure, general labor market conditions, or stringent
labor regulation.7 This recent emphasis on skills and education quality is based primarily on two types of
evidence. The first is a longstanding literature that finds that individual variation in cognitive skills is a
strong determinant of positive adult outcomes in various countries.8 Partly, these relationships reflect
the role of non-cognitive skills or traits, such as motivation and conscientiousness, which are correlated
with cognitive skills and important additional inputs into both achievement test scores and labor market
outcomes.9
More recently, a second body of evidence has emerged documenting the close link between cognitive
test scores and growth outcomes at the country level. One influential set of growth estimates finds a
strong positive relationship between countries’ average test score between 1960 and 2000, and their
average rate of GDP growth during the same period, with test scores dominating measures of
educational attainment as predictors of growth (Hanushek and Kimko, 2000; Hanushek and Woessman,
1 Attanasio et. al (2008).
2 See for example OECD (2011) and Bell and Blanchflower (2010) for OECD countries, and Cho and Newhouse (
2010) for non-OECD countries. 3 See Fougere et al (2009) and Lin (2008) for evidence from France and the US.
4 See for example, Oreopoulos et al (2008), Kahn (2010), and Bell and Blanchflower (2011).
5 Coy (2011).
6 See for example Jimenez, et al (2012).
7 Korenman and Neumark (2000) and O’Higgins (2003) conclude that while the size of the youth cohort has a
substantial effect on youth unemployment rates, the effects of general labor conditions are stronger. Meanwhile, Bertola et al (2007) and Montenegro and Pages (2004) focus on the influence of institutions on youth employment. 8 These are reviewed in Hanushek and Woessman (2008).
9 Bowles, Gintis, and Osborne (2001), Borghans et al (2008), and Cunha and Heckman (2008).
4
2008).10 A comprehensive survey of both types of evidence declares that this constitutes “strong
evidence that the cognitive skills of a population have powerful effects on individual earnings, the
distribution of income, and economic growth.” As a result, improving cognitive skills is claimed to be
“THE key issue” in promoting economic development, and presumably by extension, better youth
employment outcomes.11
If cognitive skills are in fact a major constraint to improving youth employment outcomes, public
strategies to address youth unemployment should place greater emphasis on developing these skills. For
example, developing country governments may prioritize spending or technical assistance to improve
education and/or early childhood health and nutrition. Targeted second-chance interventions designed
to boost the skills and job readiness of early dropouts or working age adults also have the potential to
increase both cognitive and non-cognitive skills.
It is far from clear, however, that focusing on cognitive skills is the most effective strategy to improve
youth employment opportunities, for two reasons. First, subsequent analysis has raised doubts about
the primacy of cognitive skills and education quality over the quantity of education in driving growth
(Breton, 2011). More importantly, no analysis has directly examined directly whether youth in countries
with higher measured skills enjoy better labor market outcomes. Therefore, concluding that improving
youths’ cognitive skills is certain to improve their labor market outcomes is premature.
This paper contributes two major pieces of evidence towards better understanding the role of measured
cognitive skills in promoting economic growth and creating better jobs. First, we revisit the cross-
country analysis of growth originally presented in Hanushek and Woessman (2008). We confirm that
average test scores are highly correlated with growth in the original sample of countries. This strong
positive correlation is sharply reduced, however, when several additional countries are added and the
analysis is limited to the more recent time period from 1990 to 2010. Furthermore, faster-growing
countries in the last decade experienced faster improvements in reading scores over the past decade.
This is consistent with economic growth causing cognitive skills to improve, perhaps by providing
parents and children with stronger incentives to acquire these skills. Overall, these findings cast some
doubt on the premise that improvements in education quality and cognitive skills are sufficient to ignite
economic growth.
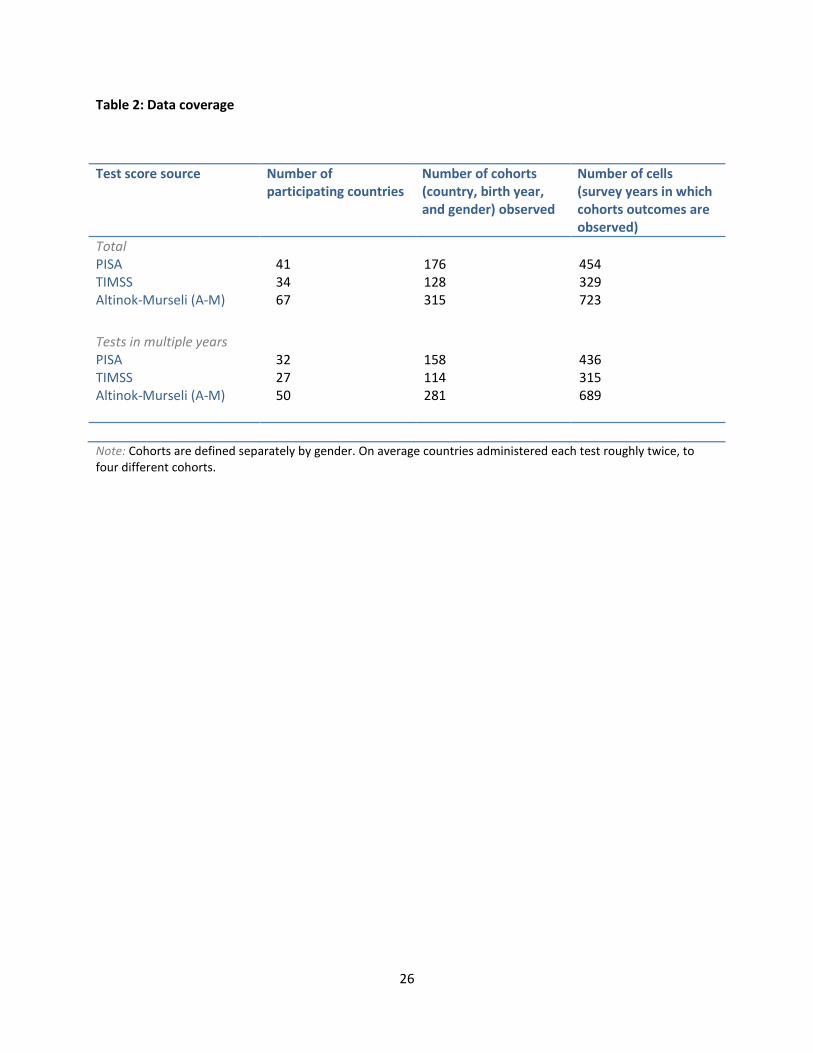
Second and more importantly, we utilize data from up to 315 tested cohorts in 67 countries to estimate
the relationship between cognitive skills and subsequent youth labor market outcomes. Average scores
on achievement tests are matched to aggregate labor market outcomes for cohorts with sufficient
education to be eligible for the test. Cohorts are matched based on country, gender, and age. Data on
test scores are taken from three main sources: First, we use data from the OECD’s Programme for
International Student Assessment (PISA) tests, administered beginning in 2000. The second source of
data is the Trends in International Math and Science Study (TIMSS), which was first administered in 1997.
Finally, we use a published meta-dataset of available test scores developed in Altinok and Murseli (2006)
10
These estimates were first presented in Hanushek and Kimko (2000) and further elaborated in Hanushek and Woessman (2008, 2011). 11
Hanushek and Woessman (2008).
5
(A-M). This meta- dataset incorporates several tests, including both the PISA and TIMSS, as well as the
International Assessment of Educational Progress (IAEP), the Analysis Programme of the CONFEMEN
Education Systems (PASEC), the International Association for the Evaluation of Educational Achievement
(IEA), those conducted by the Latin American Laboratory for the Assessment of Educational Quality
(LLECE) and those conducted by the Southern and Eastern African Consortium for the Measurement of
Educational Quality (SACMEQ). Unlike the PISA and TIMSS exams, which are administered to 9th graders,
the Altinok and Murseli aggregate contains tests administered at a variety of grade levels, and
importantly, includes a broader set of countries, including many more countries from the developing
world.
The most striking and robust finding is that, after controlling for predetermined country characteristics
such as per capita GDP, lagged youth employment outcomes, and dependence on natural resources,
cohorts with higher test scores are substantially more likely to be enrolled in school, somewhat less
likely to be working at young ages, and also significantly less likely to be unemployed. In most cases, the
inverse relationship between test scores and future unemployment is robust to the inclusion of country
fixed effects. We also find some indication of improvements in job quality with higher test scores,
conditional on working. Higher scores are associated with a significantly greater likelihood that young
workers, especially males, are employed outside the agricultural sector and in a wage job. Neither of
these findings is robust to including country effects, which suggests that it may take several years for
improvements in cognitive skills to create more productive jobs for youth. There is also some indication
that higher scores may be associated with another measure of job quality, based on occupation. Overall,
the results bolster the case that interventions that improve education quality and measured cognitive
skills would increase school enrollment at these ages, reduce unemployment, and eventually help youth
obtain better jobs, with potentially important cumulative effects on future incomes and growth.
A secondary finding considers the role of test scores relative to that of years of education in determining
labor market outcomes. Average years of education remains similarly predictive of several labor market
outcomes when including test scores as an additional regressor, in contrast to Hanushek and Kimko
(2000) and Hanushek and Woessman’s (2008) finding that only cognitive skills are predictive of growth
rates in joint regressions.12 The continued importance of years of education in the presence of test
scores is more consistent with Breton’s (2011) finding that in alternative specifications better motivated
by dynamic models of growth, both years of education and cognitive skills or test scores are predictive
of growth. We conclude that both education quality, as measured by performance on international
assessments, and average educational attainment are important determinants of youth outcomes in
labor markets.
Finally, we turn to measures of test score inequality and examine whether changes in the dispersion of
test scores, holding mean scores constant, affect youth labor market outcomes. Dispersion in test scores
may reflect the underlying degree of asymmetric information among employers and potential
employees in developing country labor markets. The results indicate that more equal PISA test scores
are associated with marginally significant but large increases in school enrollment and declines in youth
12
See Hanushek and Kimko (2000) and Hanushek and Woessman (2008).
6
employment. Reducing the variance of test score performance within cohorts would make observed
educational attainment a more informative measure to potential employers. This in turn could improve
the labor market return to additional schooling. In this case, efforts to improve poor performing schools
and to achieve more uniformity in standards may further boost incentives to attend school.
The next section revisits the analysis of growth and cognitive skills originally presented in Hanushek and
Woessman (2008), making the case that a more nuanced analysis, and an analysis of intermediate
outcomes, is needed to more convincingly make the link between cognitive skills and growth. Section 3
presents a model of job search where cognitive skills affect search parameters and job finding. Section 4
discusses the test score data and labor market outcome data used in the remainder of the paper, as well
as the empirical methods. Section 5 discusses the estimates of average effects of test scores, effects by
gender and income, and robustness checks. Section 6 examines effects of the dispersion in cognitive
skills, as measured by the dispersion in individual test scores. Section 7 concludes.
2. Growth and Cognitive Skills Revisited
This section revisits the relationship between cognitive skills and growth, by focusing on the relationship
between test scores and subsequent growth, and by looking at growth since 1990 and examining a
larger set of countries.
We use the country average cognitive skill measure from Hanushek and Woessman (2008), which is
based on 12 different exams administered between 1964 and 2003. This measure is calculated for 69
countries, and does not vary over time. This measure increases rapidly in per capita GDP (Figure 1),
although relatively few low-income countries are represented in the sample.
A central problem with this measure is that many of the tests included are administered during the
1990s and after – after growth has been realized. Therefore, the relationship between these cognitive
skill measures based on those test scores potentially reflect past growth. Given the possibility of joint
causality, it is perhaps unsurprising that, conditional on GDP and average years of schooling in 1960, that
country average growth rates between 1960 and 2000 are highly correlated with country cognitive score
measures from the same period.
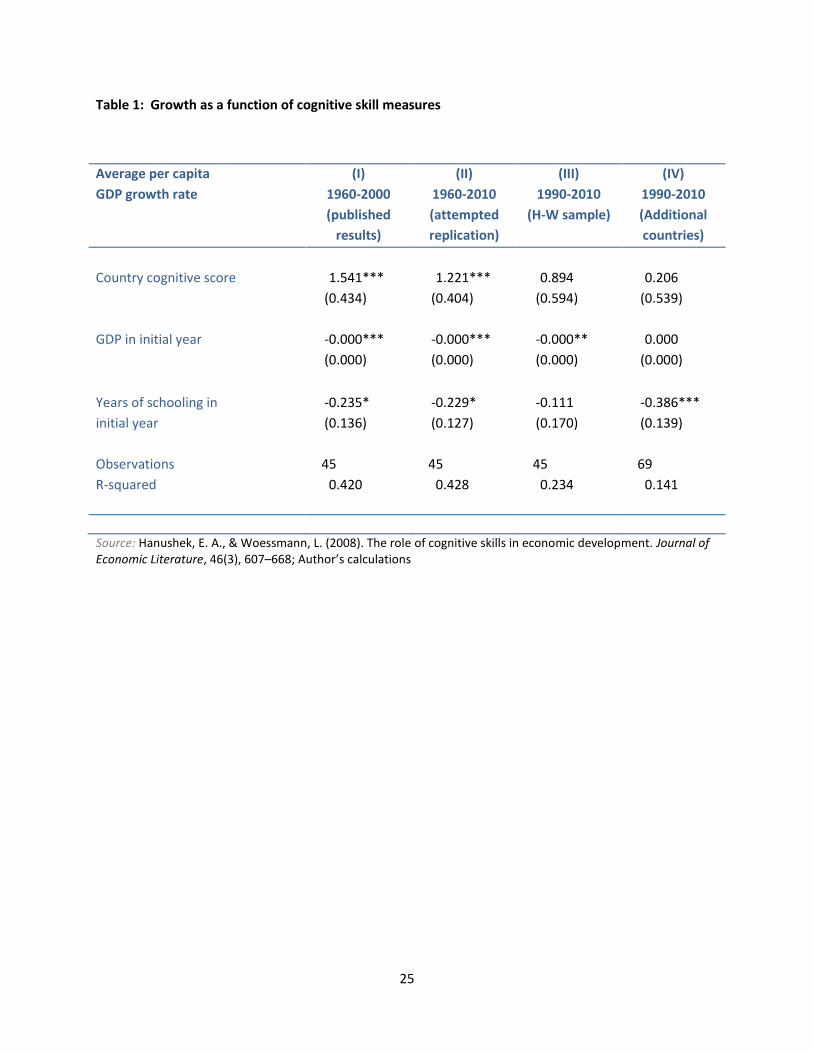
First, we replicate the strong correlation between average growth and average test score reported in
Hanushek and Woessman (2009). Because we consider extend the time period to run through 2010
instead of 2000, we find a slightly weaker relationship (Table 1, column 2). Of the 69 countries for which
cognitive skill measures are available, 24 lack GDP data from 1960, and 45 remain in the regression.
Next, in order to consider more recent changes, we narrow the window of growth that we examine to
growth between 1990 and 2010. The coefficient on country cognitive score, although still large,
becomes statistically insignificant, conditioning on GDP in 1990 and average years of schooling in 1990.
7
This largely confirms the finding that the strong relationship between growth and average skills is robust
to examining a more recent period (Hanushek and Woessman, 2009)
This strong correlation is not robust, however, to the addition of new countries. Because we consider a
more recent period, GDP data from the base year are available for 24 additional countries. These are
largely comprised of post-communist countries. We find that the point estimate on country cognitive
score drops dramatically in value upon the inclusion of these additional countries, and becomes
statistically insignificant.
In addition, looking at a specific standardized test over time, there is suggestive evidence that economic
growth improves reading scores, supporting the argument that the direction of causality runs from
growth to cognitive skills. Countries that grew faster between 2000 and 2009 improved more on their
PISA reading scores during the same period. Test participants were arguably too young to contribute to
growth over those nine years, implying that the direction of causality runs from growth to skills.
We draw two main conclusions from this. First, the strong correlation between test scores and growth
becomes significantly weaker when adding a wider set of countries. In part, this may reflect the unique
experience of Eastern Europe, in which a relatively skilled population made a sudden transition to a
market economy. Regardless, it casts some doubt on the strength of the relationship between growth
and skills. Second, there is suggestive evidence support the notion that skills increase more in faster in
rapidly growing countries. This is consistent with youth in more rapidly growing counties being more
exposed to information, and having greater financial incentive to study. Despite the strong within-
country evidence documenting individual returns to skills, the cross-country evidence is far less
convincing that interventions to increase performance on standardized tests will necessarily promote
growth.
Despite the fundamental importance of growth, it is inherently difficult to link it to improvements in
cognitive skills. This is largely because improvements in students’ test scores may not impact the overall
economy for several decades. We therefore turn our attention to youth labor market outcomes, which
tend to be realized within ten years of taking the test. Because of this relatively short lag, it is feasible to
link test scores from the 1990’s and early 2000’s to subsequent youth employment outcomes, mitigating
the possibility that skills are responding to economic growth. Linking test scores to employment
outcomes, relative to GDP growth, offers two additional advantages: First, labor market outcomes can
be observed for those youth with sufficient education to be eligible for the test. Second, effects of
cognitive skills can be separately estimated for men and women.
3. A Model of Job Search and Cognitive Skills
Before examining the empirical evidence, it is useful to set out a theoretical framework to demonstrate
how cognitive skills may affect unemployment duration and job quality. Following Rogerson, Shimer and

8
Wright (2005), we develop a continuous time search theoretic model of the labor market where the
search frictions determining job finding and the probability of separation. In our model, these search
frictions vary with , a parameter indexing cognitive skills.
As in the standard set of search models, a worker accepts a job offer if it exceeds her reservation wage
, and rejects it and remains unemployed if it does not. Once a worker has accepted a job, she
receives wage each period, discounted at rate . She faces a probability of separation each period of
, leading to an effective discount rate of . This problem can be described by the set of Bellman
equations:
where is the per period wage outside of the labor market, is the arrival rate of new offers, is
the lifetime utility of accepting the wage offer , U is the utility of rejecting the offer and continuing to
the next period, and is the probability distribution of wage offers.
To capture the effect of increase in the mean of the cognitive skills distribution, we allow both the
arrival rate of job offers as well as the probability of separation to vary with the index of cognitive
skills, :
The separation probability is decreasing in cognitive skills, because more productive workers, besides
contributing to economic growth, will be more likely to be retained during a downturn.
In this set up, it is possible to solve for the reservation wage as a function of cognitive skills :
The expression for the average duration of unemployment spells is:
The expression for the average duration of employment spells, in contrast, is:
9
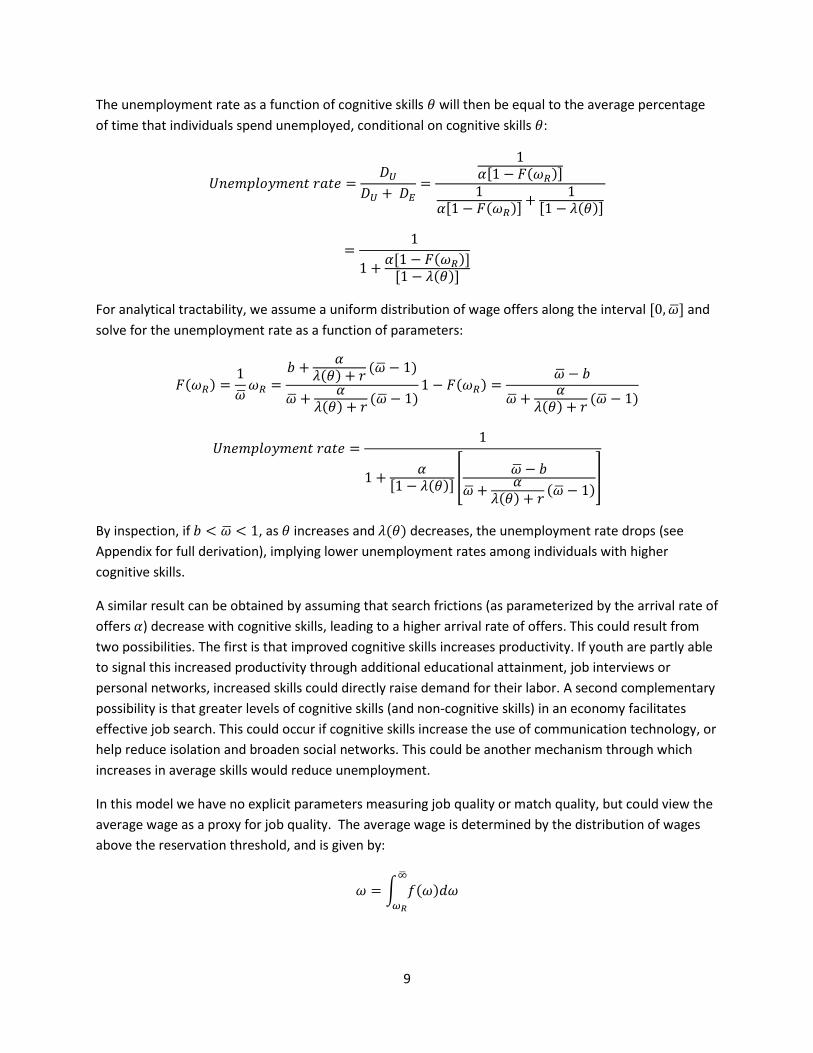
The unemployment rate as a function of cognitive skills will then be equal to the average percentage
of time that individuals spend unemployed, conditional on cognitive skills :
For analytical tractability, we assume a uniform distribution of wage offers along the interval and
solve for the unemployment rate as a function of parameters:
By inspection, if , as increases and decreases, the unemployment rate drops (see
Appendix for full derivation), implying lower unemployment rates among individuals with higher
cognitive skills.
A similar result can be obtained by assuming that search frictions (as parameterized by the arrival rate of
offers ) decrease with cognitive skills, leading to a higher arrival rate of offers. This could result from
two possibilities. The first is that improved cognitive skills increases productivity. If youth are partly able
to signal this increased productivity through additional educational attainment, job interviews or
personal networks, increased skills could directly raise demand for their labor. A second complementary
possibility is that greater levels of cognitive skills (and non-cognitive skills) in an economy facilitates
effective job search. This could occur if cognitive skills increase the use of communication technology, or
help reduce isolation and broaden social networks. This could be another mechanism through which
increases in average skills would reduce unemployment.
In this model we have no explicit parameters measuring job quality or match quality, but could view the
average wage as a proxy for job quality. The average wage is determined by the distribution of wages
above the reservation threshold, and is given by:
10
If cognitive skills increase the rate of job offers, this will increase the reservation wage and therefore job
quality. If , the average wage, the best indicator of job quality observable in this model, is
increasing in cognitive skills if either is a diminishing function of or if is increasing in
In sum, raising the mean level of cognitive skills in a standard job-search model could lower
unemployment rates and raise employment rates both by decreasing the likelihood of separation once a
job has been acquired, and by increasing either the quantity or quality of new job offers. The former
could occur as employers learn more about workers’ cognitive skills, and are less likely to separate from
more skilled workers. Meanwhile, young workers with high average skill could receive more offers,
either because they are partially able to signal their ability, or because they are more effective in
searching for jobs. In either case, skilled workers would have a greater selection of offers to choose from
and would also be expected to find a higher quality job.
4. Data and Methodology
4.1 Data
Our measures of cognitive skills in this analysis are derived from country average scores in international
assessments that are meant to be comparable across countries. Test score data analyzed in this paper
are available from two main sources.
Average test scores by country, year and grade level for the OECD’s PISA and the TIMSS are obtained
from the World Bank’s Education Statistics (Edstats) database. The PISA, which was administered in
2000, 2003, 2006 and 2009, tests skills in mathematics, reading, and science. The TIMSS, administered
in 1995, 1999, 2003, 2007 and 2011, tests skills in mathematics and sciences.
In addition, we use data from a published, standardized compilation of test scores made available by
Altinok and Murseli (2006). Their meta-dataset includes data from the PISA and TIMSS, as well as older
and more regionally focused examinations such as the International Assessment of Educational Progress
(IAEP), the Program on the Analysis of Education Systems (PASEC), the International Assessment of
Educational Progress (IEA), the Latin American Laboratory for the Evaluation of the Quality of Education

11
(LLECE), and the Southern and Eastern Africa Consortium for Monitoring Educational Quality (SACMEQ).
However, unlike the PISA and the TIMSS, the A-M data on test scores is not disaggregated by gender.
Data from national censuses and labor market surveys, compiled in the World Bank’s International
Income Distribution Database (I2D2), are used to measure labor market outcomes for the cohorts for
which we have relevant test score outcome data.13
Cohorts or cells are defined based on country, birth year, and gender. We examine average labor
market outcomes at this cell level. Outcomes are measured only for youth age 15-24 with a minimum
education level to be eligible for the test – so for the PISA and TIMSS, youth that completed the 9th
grade.
To measure cohort labor market outcomes, we also include youth that are one year older and younger
than the exact cohort that took the test. This ensures sufficient data on outcomes, as there are small
samples in which few respondents have graduated high school. Outcome data are available for
employment status, enrollment, wage, productivity, occupational status, and industry of employment.
We also examine very rough indicators of sectoral productivity data based on output and employment
numbers made available through the World Bank’s World Development Indicators database.
Productivtiy estimates are available for the agriculture, industry and service sectors. These sectoral
productivity data are available for very few countries, and thus the productivity results should be taken
with appropriate caution.
Linking the test score data to the I2D2 data on labor market outcomes, we are able to match test scores
for between 34 and 61 countries to labor market outcome data (Table 2, column 1), or for between 128
and 257 cohorts to labor market outcome data (Table 2, column 2).14 Finally, we obtain additional
controls for country characteristics from the International Labour Organization’s Key Indicators of the
Labour Market (KILM) database. We use their imputed estimates of youth labor force participation and
youth unemployment rates by gender for 1991.15 Finally, we also include a measure of natural resource
dependence, the share of gross domestic product from natural resources in 1990, from the World
Bank’s World Development Indicators database, as an additional control. This addresses potential
concerns that dependence on natural resources could lead to poor test performance and high rates of
youth unemployment.
4.2 Methodology 13
The I2D2 is a standardized collection of household and labor force surveys from a wide set of countries. An earlier version of the data is described in Montenegro and Hirn (2009). Earlier versions of these data have also been used in selected other studies (Clemens, et al, 2009, King et al, 2010) 14
Cohort in this case are defined by gender, birth year, and country. 15
The KILM contains imputed estimates using the Global Economic Trends model, which imputes labor market outcomes separately by age group and gender based on regional models with country fixed effects and GDP growth rates.
12
We divide the data into cells based on cohort and age, and in our main analysis, impose a condition for
inclusion in the sample that youth attained a sufficient amount of schooling to be eligible for the test
when it was administered.
We then estimate the relationship between average labor market outcomes and average test scores (S),
controlling for age, gender, the log of per capita GDP in 1990, youth unemployment rates by gender in
1991, youth labor force participation rates by gender in 1991, the share of GDP in natural resources in
1990, a linear time tend, and a vector of region dummies16:
Ccctctctc tXGenderAgeScoreY 3,2,1,
Where c indexes cohort, which is defined based on country, age, and gender. C indexes country and t
year that the labor market data is observed. X is a vector of the four predetermined country
characteristics from the early 1990’s.
For each of the three test score datasets (PISA, TIMSS, and Altinok-Murseli), we examine the following
employment outcomes: whether or not an individual is currently employed, whether or not an
individual is currently a student, whether or not an individual is currently a non-student, whether or not
an individual is currently employed, and whether or not an individual is unemployed, conditional on
being active in the labor force. We also examine whether or not individuals are currently working in
agriculture, a measure of occupational status, whether or not individuals are currently in wage
employment, and estimates of the productivity of individuals’ sectors of employment (based on
employment and output estimates from country-level WDI data).
As an important robustness check, we introduce country fixed effects into the specification:
CCctctctc tGenderAgeScoreY 3,2,1,
We then examine these estimates separately for men and for women. Because test scores may affect
labor market outcomes at different levels of development, test scores in another specification are
interacted with the log of GDP in 1990, to allow the effect of test scores to vary with income.
CCcCtcctctctc tXGDPLogScoreGenderAgeScoreY )( 1990,,43,2,1,
In addition, we examine the effects of test score by income level by restricting estimates to low- and
middle-income countries.
16
Countries are classified in regions according to World Bank classifications, and high-income countries comprise a separate region.
13
We then look at an expanded sample of youth – including those at all levels of education – for two
reasons. First, it allows us to check if the results are robust to the sample inclusion criteria. Second, it
allows us to compare the coefficients on test scores with those on educational attainment, as measured
by average years of schooling. We regress employment outcomes and employment quality indicators
on average test scores, cohort average educational attainment, age and age squared, the log of per
capita GDP in 1990, the log of per capita GDP in 1990 squared, a control for the year of the survey, year
of survey squared, and a vector of region dummies:
Cctcctctctc tXEducGenderAgeScoreY ,43,2,1,
We assess the robustness of our results to this alternative sample and specification and compare the
relative importance of test scores and years of schooling in these specifications.
5. Results
5.1 Average Effects
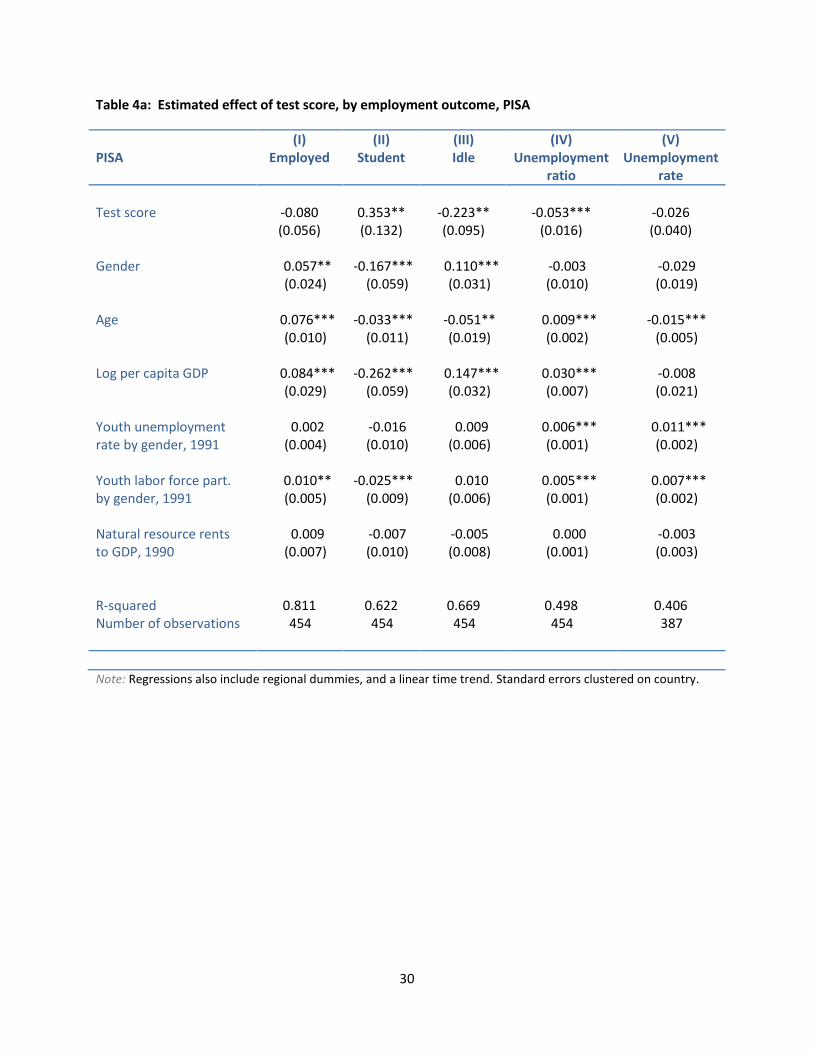
Matching labor market outcomes to the PISA, we find evidence that higher test scores not only lead to
higher rates of continued enrollment, but also improve employment outcomes by lowering
unemployment and raising employment quality, as measured by the type of employment (wage, non-
wage) and occupational status. In regressions controlling for age, the log of country GDP per capita in
1990, youth unemployment rates by gender in 1991, youth labor force participation rates by gender in
1991, the share of GDP in natural resources in 1990, the survey year, gender, and a full set of region
indicators, a one standard deviation increase in PISA test scores is associated with a 35.3 percentage
point increase in the likelihood of continued enrollment (significant at the 1 percent level), a 22.3
percentage point reduction in youth idleness (significant at the 5 percent level), and an unemployment
ratio (unemployed youth as a share of the youth population) that is 5.3 percentage points lower
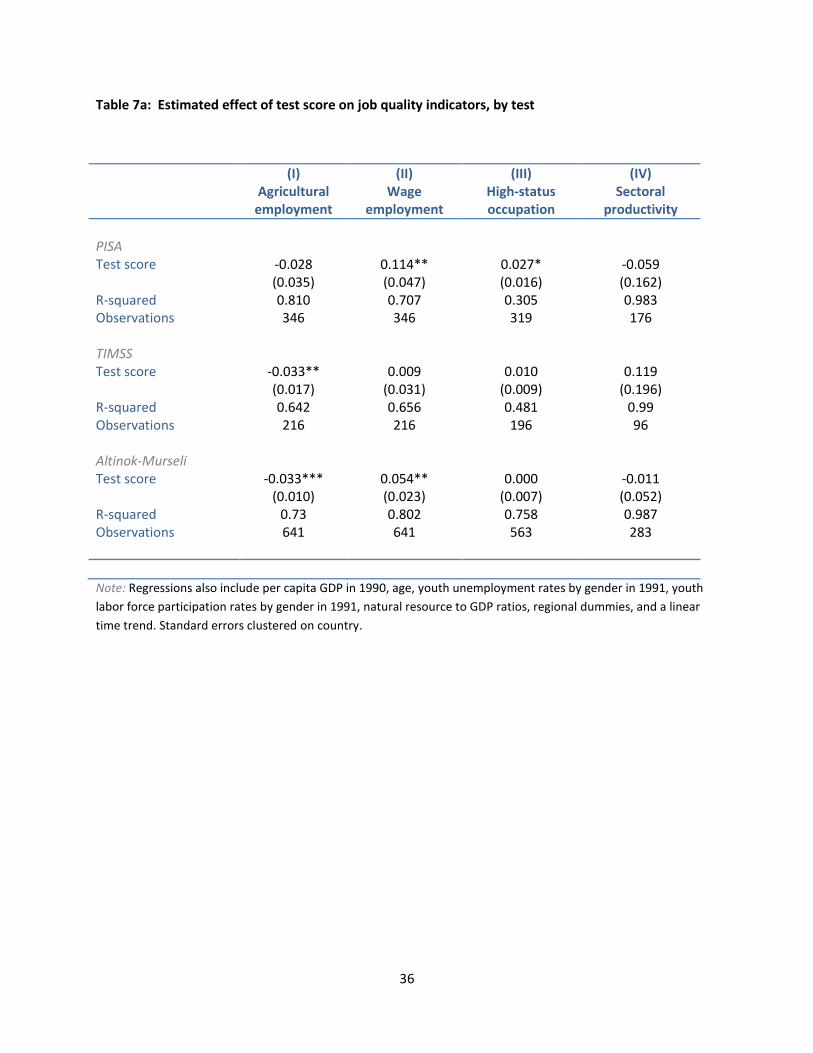
(significant at the 1 percent level). Most strikingly, we find that conditional on employment, a one
standard deviation increase in PISA test scores is associated with a 11.4 percentage point increase in the
likelihood of being in wage employment for youth (significant at the 5 percent level), and a 2.7
percentage point increase in the likelihood of being in a high-status occupation. While we do find strong
and significant effects of test scores on unemployment ratios and rates, wage employment, and the
share of youth in agricultural employment, we find no evidence for effects on the total share employed
(potentially due to prolonged school enrollment) or the remaining two indicators of employment quality,
agricultural employment and sectoral productivity.
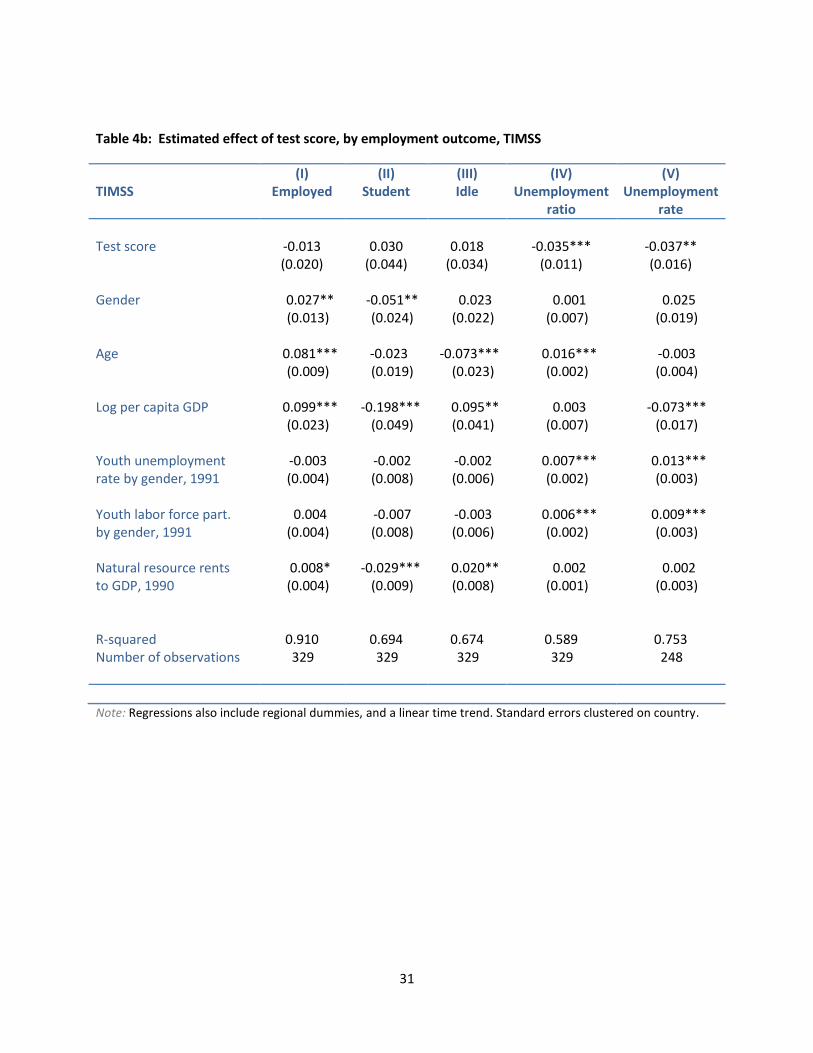
Similarly, when matching labor market outcomes to TIMSS test score data, we find evidence that higher
test scores lower unemployment ratios and rates and conditional on being employed, decrease the
14
likelihood of employment in the agricultural sector. An approximately one-standard deviation increase
in TIMSS test scores is associated with an unemployment ratio that is 3.7 percentage points lower
(marginally significant at the 5 percent level), and an unemployment ratio that is 3.5 percentage points
lower (significant at the 5 percent level), again controlling for age, the log of country GDP per capita in
1990, youth unemployment rates by gender in 1991, youth labor force participation rates by gender in
1991, the share of GDP in natural resources in 1990, the survey year, gender, and a full set of region
indicators. In similar regressions with indicators of employment quality as the outcomes, we find that
the likelihood of agricultural employment is 3.3 percentage points lower in countries with TIMSS scores
that one standard deviation higher (significant at the 5 percent level). We find no statistically significant
relationships between TIMSS scores and other measures of employment quality (wage employment
rates, estimates of sectoral productivity, and measures of occupational status).
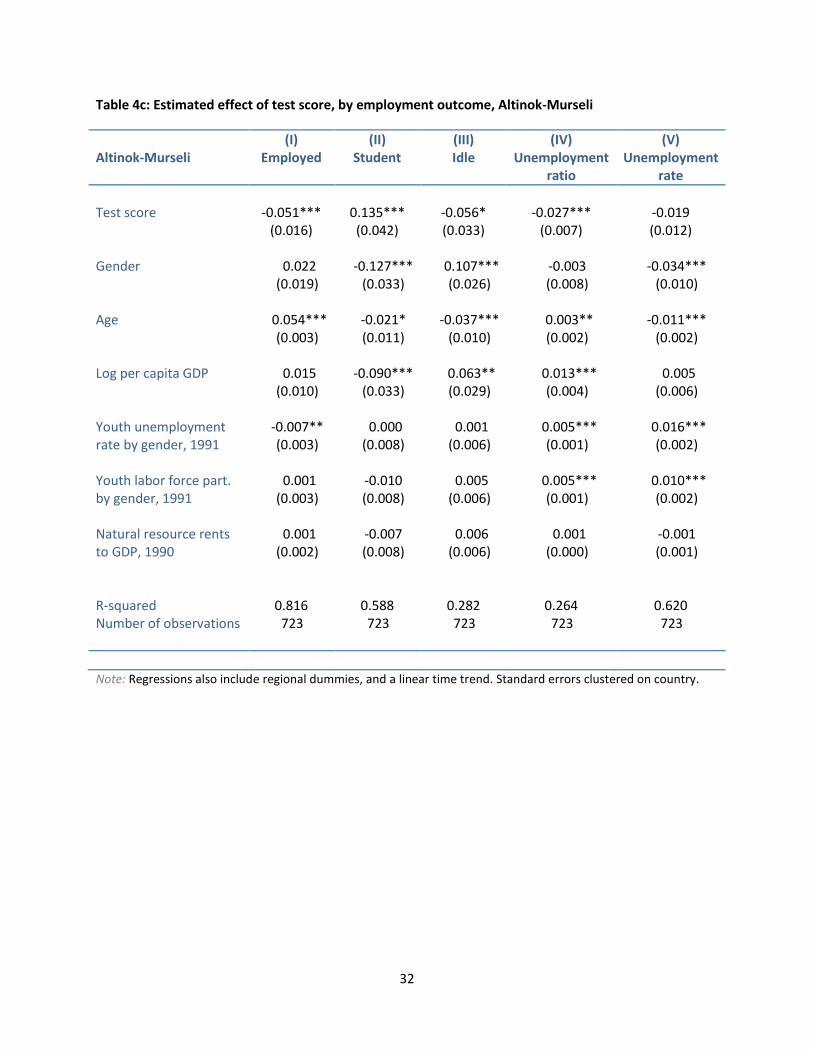
Finally, when considering the Altinok-Murseli meta-dataset of test scores, which includes the largest set
of countries but for a heterogeneous set of examinations, we find that higher test scores are associated
with a statistically significant and large increase in enrollment, coupled with a statistically significant
decline in employment, a marginally significant decrease in youth idleness, and a significant decline in
unemployment ratios. A one standard deviation increase in test scores in sample is associated with a
5.1 percentage point decline in employment at these ages (statistically significant at the 1 percent level),
which given a 13.5 percentage point increase in school enrollment (significant at the 1 percent level)and
a 5.6 percentage point decline in youth idleness (marginally significant at the 10 percent level) is
potentially a positive outcome. We also find that a one standard deviation increase in test scores is
associated with a 2.7 percentage point decrease in unemployment ratios (significant at the 1 percent
level). Increases in test scores in the Altinok-Murseli database are associated with a 3.3 percentage
point decline in the likelihood of employment in the agricultural sector (significant at the 1 percent level)
and a 5.4 percentage point increase in the likelihood of wage employment (significant at the 5 percent
level), but are not statistically significantly associated with improvements in the remaining indicators of
employment quality.
Our results, showing that increases in test scores are strongly and significantly associated with
continued enrollment, are broadly consistent with early evidence from studies tracking individual
students who were administered the PISA in Canada and elsewhere (reference from Hanushek and
Woessman handbook chapter), whose primary early conclusion is an association between higher PISA
test scores at the individual level and continued enrollment, as measured by progression into higher
education (include references from Hanushek footnote here and discuss).
5.2 Effects by Gender and Income
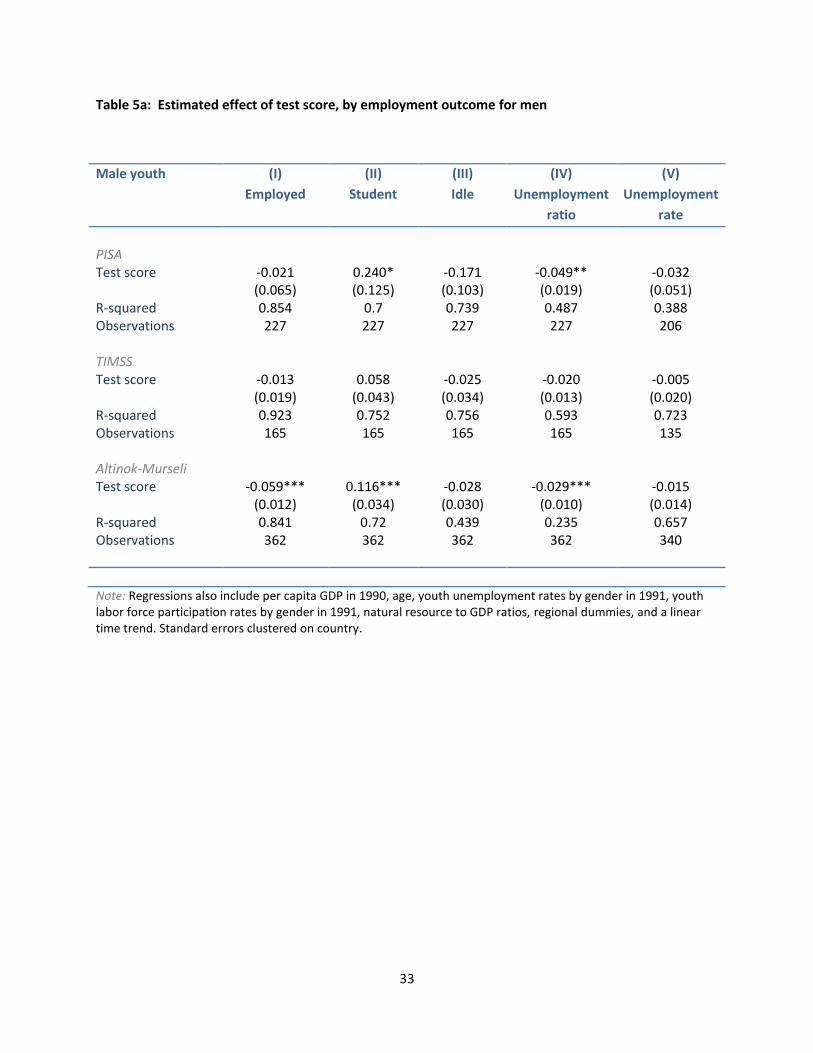
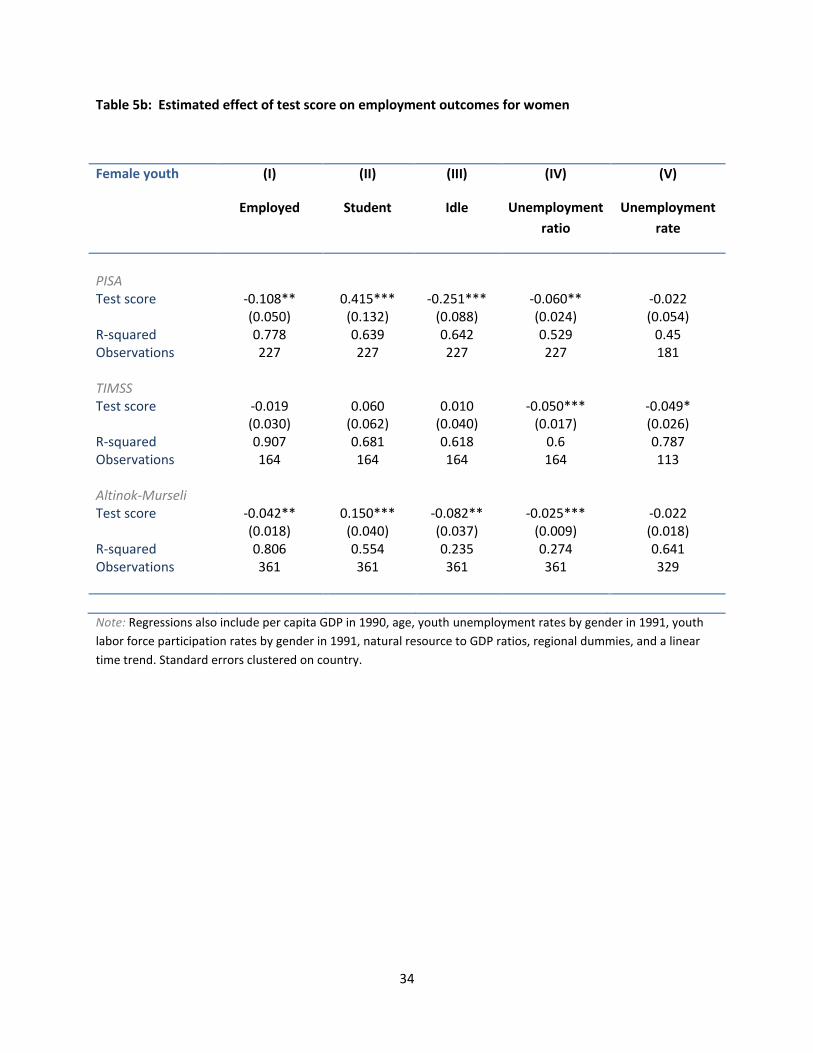
PISA scores show strong effects on employment outcomes for both men and women, with if anything
slightly stronger and more significant effects on enrollment rates and employment outcomes for women
than for the population in general, significantly raising enrollment while lowering employment rates,
15
and lowering rates of idleness and unemployment ratios among female youth. When we restrict the
analysis to girls and women, a one standard deviation increase in PISA scores among female test-takers
is associated with a large 41.5 percentage point increase in the probability of continued enrollment
(significant at the 1 percent level), and a related 10.8 percentage point decrease in the likelihood of
working (significant at the 5 percent level) at these ages. Increases in PISA scores lead to more
moderate, but still large, increases in enrollment for men, with a one standard deviation increase in test
scores associated with a 24.0 percentage point increase in school enrollment (marginally significant at
the 10 percent level). The results on reduced unemployment in the full sample appear in both the
sample of men and women as well, as a one-standard deviation increase in PISA test scores in the
sample of girls and women is associated with a 6.0 percentage point decrease in the unemployment
ratio (significant at the 5 percent level) and a 4.9 percentage point decrease (significant at the 5 percent
level) for men, perhaps partially reflecting decreases in labor force participation at these young ages. In
contrast, we find smaller point estimates on test scores in the regressions for men-only, and no
statistically significant relationships between higher PISA test scores and improved employment
outcomes or continued enrollment.
When looking at employment quality, we find reductions in the rate of agricultural employment and
increases in wage employment associated with higher PISA test scores for men. A one standard
deviation increase in test scores for men is associated with a 5.3 percentage point reduction in the
likelihood of employment in the agricultural sector conditional on employment (marginally significant at
the 10 percent level), and a large 18.1 percentage point increase in the likelihood of wage employment
conditional on being employed (significant at the 1 percent level). We find no statistically significant
relationship between PISA scores and employment quality for women.
TIMSS test scores are more strongly associated with improved employment outcomes for women than
for men. When estimating the effects of test scores on employment outcomes for women, we find that
a one standard deviation increase in test scores would lead to a 5.0 percentage point reduction in the
unemployment ratio (significant at the 1 percent level), and a 4.9 percentage point reduction in the
unemployment rate (marginally significant at the 10 percent level).
We find no results for either women or men on other measures of employment quality, using TIMSS
scores as a measure of cognitive skills or educational quality.
Results using scores from the Altinok-Murseli database are similarly strong for women and men on
enrollment and employment outcomes. A one standard deviation increase in test scores for women is
associated with a 15.0 percentage point increase in school enrollment (significant at the 1 percent level),
and a related 4.2 percentage point reduction in working (significant at the 5 percent level). Increases in
test scores in this database are also associated with significant reductions in youth idleness for women
(8.2 percentage points, significant at the 5 percent level), and reductions in the unemployment ratio for
women as well (2.5 percentage points, significant at the 1 percent level). For men, a one standard
deviation increase in scores is similarly associated with a 5.9 percentage point decrease in rates of
working (significant at the 1 percent level), a 11.6 percentage point increase in the likelihood of school
16
enrollment at these ages (significant at the 1 percent level), and a 2.9 percentage point reduction in the
unemployment ratio (significant at the 1 percent level).
Results from this database show improvements in measures of job quality for both men and women. A
one standard deviation increase in test scores is associated with a 4.9 percentage point reduction in the
likelihood of employment in agriculture for men (significant at the 1 percent level), a 6.0 percentage
point increase in the likelihood of wage employment for men (significant at the 5 percent level), and a
4.9 percentage point increase in the likelihood of wage employment for women (significant at the 5
percent level).
When analyzing the potential effects of test scores by income, we find that the estimated positive
effects of test scores on employment outcomes are spread across the income distribution. First,
restricting estimates to a sample of low- and middle-income countries, we find estimates that are largely
consistent with our previously reported results for all countries in both magnitudes and significance,
showing that the estimated positive effects of test scores on employment are not driven by the tail of
high-income countries, or by a rough comparison of high-income to lower-income countries, but also
reflected in the distribution of outcomes among low- and middle-income countries.
In the sample excluding high-income countries, according to the World Bank classification, a one
standard deviation increase in PISA test scores leads to a 28.3 percentage point increase in school
enrollment, significant at the 5 percent level, as well as a related 12.7 percentage point decrease in the
probability that youth are working at these ages, significant at the 5 percent level, and a 5.7 percentage
point reduction in unemployment ratios, likely reflecting a reduction in labor force participation at
young ages. Similarly, a one standard deviation increase in TIMSS test scores is associated with a 4.7
percentage point reduction in unemployment ratios (significant at the 1 percent level) and a 4.2
percentage point reduction in unemployment rates (marginally significant at the 10 percent level).
An exception to this general pattern of robustness is that the results using test scores from the Altinok-
Murseli database are not robust to the exclusion of high-income countries. The weak results derived
from the Altinok and Murseli (2006) database for this subsample may reflect the fact that there may be
too much heterogeneity across tests included in the database, and that scores may not be sufficiently
standardized across tests. Tests differ widely in content and difficulty, with some oriented towards
measuring specific practical competencies (such as the IALS), others more tailored to measure
achievement related to academic curricula, such as the TIMSS and the LLECE, and still others intended to
be more classic achievement tests to measure progress in basic subject areas such as math and reading,
such as the PISA. Many tests are designed to be comparable across countries within a round, but not
specifically designed to allow comparisons across administrations in different years. Differences in the
sample of countries participating in these assessments further makes the standardization of scores
across tests a challenging task, and early estimates using our own standardization of scores across tests
yielded similarly weak results. We continue to include the analysis of the Altinok and Murseli meta-
dataset of test scores here though, as it covers the largest set of countries and cohorts, and produces
results consistent with those for the PISA and TIMSS in the full sample.
17
When interacting test scores linearly with income, we find that effects on working, schooling, and
idleness are stronger for lower income countries, while effects on unemployment, especially
unemployment rates, appear to be generally stronger for higher income countries (results not shown).
Allowing effects to vary nonlinearly with income, we find suggestive evidence for a different pattern of
effects, with effects on most employment outcomes for all tests larger in high income countries, and
effects on employment quality outcomes larger in lower income countries (Figures 1a, 1b, and 1c). An
exception to this is employment and PISA test scores.
5.3 Robustness Checks and Effects on Educational Attainment
To test the robustness of our results to the construction of our sample, we then repeat our analysis
including a broader sample of youth, rather than restricting our analysis of labor market outcomes to
those youth who had completed sufficient education to be eligible for the relevant assessments. We
also use this broader sample to look at average years of education as an outcome, and furthermore to
compare the explanatory power of years of education and of test scores in regressions including both
education and test scores as right hand side variables.
We find similar effects of test scores in regressions in this broader sample, including average years of
education as an additional right hand side variable. Higher PISA and TIMSS scores are again associated
with statistically and economically significantly higher rates of school enrollment and lower rates of
working at these ages, with a one standard deviation increase in test scores associated with between a
7.3 percentage point and 19.6 percentage point decrease in employment (significant at the 1 percent
level, all three tests), and a 14.5 percentage point to 44.3 percentage point increase in school
enrollment (significant at the 1 percent level, PISA and Altinok-Murseli). Higher scores are also
associated with lower unemployment ratios and rates, with a standard deviation increase in test scores
leading to either a 8.4 percentage point reduction in unemployment ratios (PISA, significant at the 1
percent level) or a 3.3 percentage point reduction in unemployment ratios (Altinok-Murseli, significant
at the 1 percent level), and a 2.4 to 2.9 percentage point reduction in unemployment rates (TIMSS and
Altinok-Murseli, marginally significant at the 10 percent level). Higher test scores from all three sources
(PISA, TIMSS, Altinok-Murseli) are associated with a significantly lower likelihood of employment in the
agricultural sector, as before. Higher test scores from the PISA and Altinok-Murseli databases are
associated with significant increases in the likelihood of wage employment, conditional on working.
When comparing test scores and average years of education, both are similarly often predictive of labor
market outcomes, and similarly economically and statistically significant in regressions of labor market
outcomes.
Average years of education remains similarly predictive of labor market outcomes when including test
scores as an additional control variable, in contrast to Hanushek and Kimko (2000) and Hanushek and
Woessman’s (2008) specifications finding that only cognitive skills are predictive of growth rates in joint
18
regressions, and more consistent with Breton’s (2011) finding that in alternative specifications better
motivated by dynamic models of growth, both years of education and cognitive skills or test scores are
predictive of growth. We conclude that both the quality of education, as measured by students’
performance on international assessments, and average educational attainment drive cross-country
differences in youth outcomes in labor markets.
Examining average years of education as a function of test scores and other controls, we find mixed
evidence for positive impacts of test scores on educational attainment, somewhat surprising given our
earlier results on the effect of higher test scores on continued enrollment. We find that the relationship
between test scores and average years of education is only positive and significant when test scores
from the PISA database are used; in that case a one standard deviation higher test score is associated
with 2.179 additional years of schooling on average (significant at the 1 percent level).
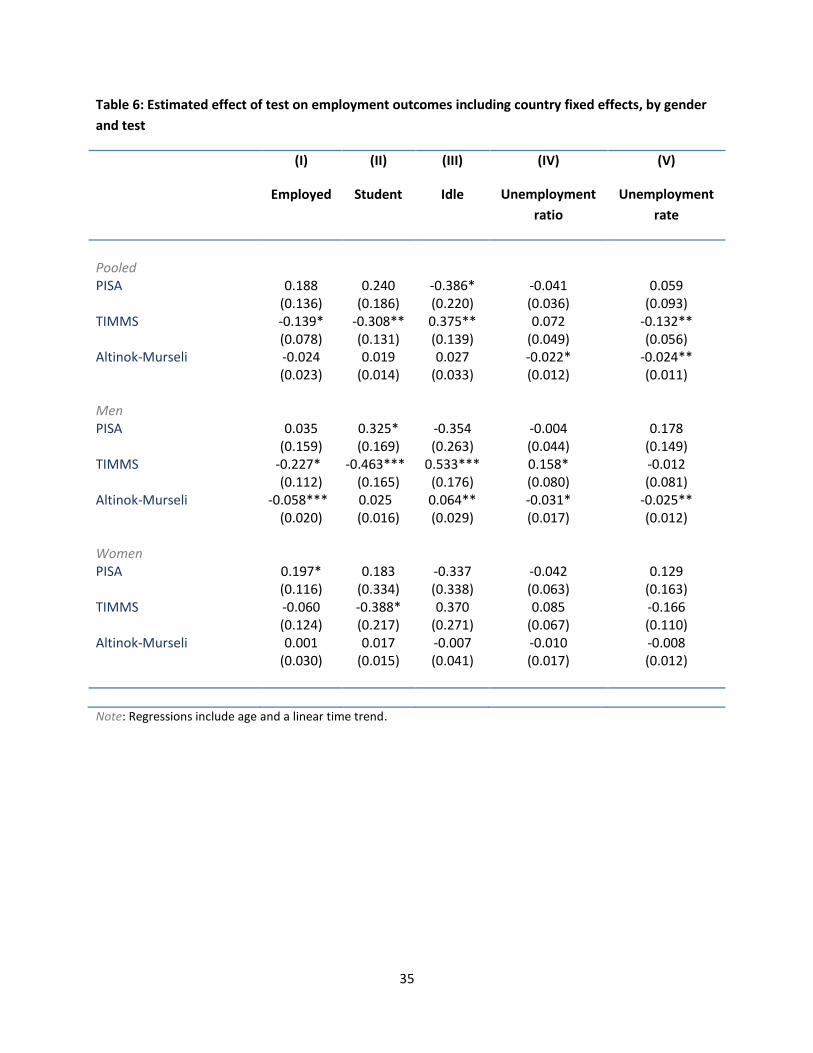
Finally, as an additional check, we test the robustness of our empirical results to the inclusion of country
fixed effects, relying on cross-birth cohort, within-country differences in test score performance and
employment outcomes to identify the effect of cognitive skills on youth labor markets. We find that the
negative and strong relationship between PISA test scores and unemployment ratios and rates is at least
partially robust to the inclusion of country fixed effects, but that our results on reductions in working,
increases in school enrollment, and decreases in youth idleness are not. A one standard deviation
increase in TIMSS test scores is associated with a 13.2 percentage point decrease in the unemployment
rate (significant at the 5 percent level), while a one standard deviation increase in test scores in the
Altinok-Murseli database is associated with a 2.2 percentage point decrease in unemployment ratios
(marginally significant at the 10 percent level) and a 2.4 percentage point decrease in unemployment
rates (significant at the 5 percent level). One caveat is that the sample of countries on which we are
able to estimate these effects is smaller and higher income than the full sample, as richer countries are
more likely to have participated in multiple rounds of testing than lower income countries.
We find that our primary results are robust in specifications excluding additional controls for youth
unemployment rates, labor force participation, and natural resources; robust to the inclusion of
unemployment measures based on national statistics rather than ILO imputations; and partially robust
to the inclusion of higher order polynomial terms in age and log per capita GDP.
6. Inequality in Cognitive Skills and Youth Labor Markets
We next use individual-level test data from the PISA to next assess the relationship between degree of
inequality in cognitive skills, as reflected in test-score outcomes, on labor market outcomes for youth.
In a context with imperfect information about employee quality, employers may be hesitant to hire new
workers, especially in the presence of employment regulation, and even more so when information
problems are particularly severe – when the average quality of workers is low and the dispersion of
19
worker quality conditional on observables, such as educational attainment, is particularly high. In this
case, inequality and failures of the educational system, and particularly unobservable differences in
education quality, may propagate through youth labor markets and make it more difficult for employers
to selectively hire high-quality young employees.
From the item-level PISA data, we construct a measure of average performance, average percentage of
items answered correctly, that should roughly correspond to the average PISA score measure used in
our primary analysis above. We also construct a measure of test score dispersion, the within-cohort
standard deviation in the percentage of items answered correctly.
Regressing our employment and employment quality outcomes on these two measures, as well as our
full set of controls, we find that as above, increases in average test performance are associated with
significant increases in school enrollment, decreases in youth idleness, decreases in the unemployment
ratio, and decreases in the unemployment rate. They are also associated with increases in job quality,
as measured by wage employment and occupational status.
Increases in the dispersion of test scores tend to mitigate these effects, with significant decreases in
school enrollment and increases in working at young ages. A one percentage point increase in the
standard deviation of the percentage of items answered correctly is associated with a 4.2 percentage
point reduction in the likelihood of continued enrollment (significant at the 5 percent level), and a 2.3
percentage point increase in the likelihood of working at young ages (marginally significant at the 10
percent level).
Somewhat puzzlingly, however, an increase in the dispersion of test performance is also associated with
a statistically significant increase in youth sectoral productivity, conditional on employment. It is
possible that when the signal value of continued education decreases, marginal youth who then select
into employment are employed in higher productivity sectors, such as manufacturing.
Overall we find that increases in the dispersion of test scores lead to decreases in continued enrollment
and increases in working at young ages, perhaps reflecting that increases in the variation in educational
quality as evidenced by test scores, particularly at the low end, may decrease the signal value of
educational attainment and render working or apprenticeship at young ages more attractive relative to
continued formal education.
7. Conclusion
In summary, this paper presents new evidence suggesting that improvements in cognitive skills reduce
unemployment, and may improve job quality in the medium term. These results fill in part of the
potential causal chain from better education quality, not just quantity, to economic growth and
development. In particular, school enrollment rates rise and rates of working and unemployment ratios
20
drop as test score measures of cognitive skills rise. Job quality improves as well, as agricultural
employment shares fall and, in some cases, wage employment rates and occupational status rise as
cognitive skills increase. The effects of test scores for most outcomes are still present when controlling
for educational attainment or restricting attention to low- and middle-income countries, suggesting that
the correlations between test scores and youth employment outcomes are not driven solely by
differences in educational attainment, or broad contrasts between the labor markets of high-income
and low-income countries.
One significant concern for this study, as for all cross-country studies, is that of establishing causality. It
is likely that better labor market opportunities raise the returns to skill investment, and thus raise
investment in schooling and test scores. Similarly, it is also possible that unobserved factors, such as
culture or the level of drive or determination, drive both cross-country differences in test scores and
cross-country differences in youth employment. The findings on job quality and enrollment are of
particular concern because they are not robust to the inclusion of country effects. This could in part
reflect a delayed effect of cognitive skills on labor market structure, as countries’ comparative
advantage gradually adjusts to increased skills among youth. It is hard to rule out, however, the
possibility that the positive relationship between skills and job quality is partly due to joint causality, if
for example students have greater incentives to acquire academic skills in economies that are less
dependent on agricultural employment. Recent experimental evidence further highlights the possibility
that students’ efforts to attend school and acquire skills are sensitive to their perceived returns.17
The strong relationship between test scores and youth employment outcomes suggests highlighting
policies in developing countries that can provide incentives or additional educational inputs to boost
skills and test scores and thus labor market outcomes and growth. One option to do so is to target
employment training programs to youth. Youth training programs, however, often focus on more
practical skills for employment, targeting behaviors or vocational training rather than investing in
improving basic skills in reading and arithmetic at a later age, assuming that low-scoring youth are
already bound for more low-skill or vocational employment. One program in Uganda provided grants to
groups of youth to pursue employment training, leading to high rates of enrollment in popular
vocational training institutes to pursue trade professions such as tailoring or carpentry (Blattman et al,
2012). An evaluation of the “Jovenes en Accion” program in Colombia found that job training led to
large increases in income, and interestingly, increases that were sharply higher for women than for men
(Attanasio et al, 2008). The program, which provided three months of in-classroom training and three
months of practical on-the-job training to youth in the two lowest socio-economic strata of the
population, raised incomes for men by 8 percent and incomes for women by 18 percent. An evaluation
of a third program in the Dominican Republic, the “Juventud y Empleo” program, finds modest effects of
17
In a randomized controlled study in India, Jensen (2012) finds that increasing access to jobs in the burgeoning business process outsourcing industry in rural India leads young women 15 to 21 years old at the outset of the study to obtain more schooling and post-school training in English and computer skills, and to delay marriage and childbearing. Similarly, simply providing information about the income returns to education that exceeded students’ prior beliefs in the Dominican Republic led to increases in schooling, among both girls and boys (Jensen, 2010).
21
youth training on earnings, conditional on employment, but no evidence for effects on employment
outcomes (Card et al, 2011).
A second policy option would be to support remedial education programs that seek to build basic skills
in reading and math, even at later ages. Much of the empirical evidence on the effectiveness of
remedial education programs, or on the impact of increases in education quality, comes however from
interventions targeted towards younger children. Banerjee et al (2007) find in a randomized evaluation
that providing remedial education to elementary school aged children in India initially lagging behind
their peers led to significant test score gains.
As emphasized in Banerjee et al (2007), the quest to improve education quality and subsequent real
outcomes in developing countries is a daunting task, as quickly scaling up enrollment in a setting of
limited resources has led to larger class sizes and lower instructional quality. Our results, however,
provide an indication that both increasing attainment and raising instructional quality pay off in the
form of better for youth. Furthermore, improving levels of cognitive skills has the additional likely
benefit of reducing youth unemployment. Given the significant implications of youth unemployment
and job quality for the future working lives of current youth, further investments to improve both the
quantity and quality of education are essential.
22
References
Attanasio, Orazio, Adriana Kugler, and Costas Meghir (2008). “Training Disadvantaged Youth in Latin
America: Evidence from a Randomized Trial.” NBER Working Paper No. 13931.
Banerjee, Abhjijit, Shawn Cole, Esther Duflo, and Leigh Linden (2007). “Remedying Education: Evidence
from Two Randomized Experiments in India.” Quarterly Journal of Economics, 122(3):1235-1264 (see
also NBER Working Paper No. 11904, 2005; BREAD Working Paper No. 109.
Bell, David and David Blanchflower (2010). “Recession and Unemployment in the OECD.” Mimeo,
Dartmouth University.
Bertola, Guiseppe, Francine Blau and Lawrence Kahn (2007). “Labor Market Institutions and
Demographic Employment Patterns.” Journal of Population Economics, 20(4): 833-867.
Blattman, Chris, Nathan Fiala and Sebastian Martinez (2012). “Can Employment Programs Reduce
Poverty and Social Instability? Experimental Evidence from a Ugandan Aid Program.” Mimeo, Yale
University.
Borghans, Lex, Angela Lee Duckworth, James J. Heckman, and Bas ter Weel (2008). “The Economics and
Psychology of Personality Traits.” NBER Working Paper 13810.
Bowles, Samuel, Herbert Gintis and Melissa Osbourne (2001). “The Determinants of Earnings: A
Behavioral Approach.” Journal of Economic Literature, 39(4): 1137-1176.
Breton, T.R. (2011). The quality vs. the quantity of schooling: What drives economic growth? Economics
of Education Review 30, 765–773
Card, David, Pablo Ibarraran, Ferdinando Regalia, David Rosas-Shady, and Yuri Soares (2011). “The
Labor Market Impacts of Youth Training in the Dominican Republic.” Journal of Labor Economics, 29(2):
p. 267.
Cho, Yoonyoung and David Newhouse (2010). “How Did the Great Recession Affect Different Types of
Workers? Evidence from 17 Middle Income Countries.” World Bank Policy Research Working Paper
5636.
Clemens, Michael, Claudio Montenegro, and Lant Pritchett, 2009, “The Place Premium: Wage
Differences for Identical Workers across the US Border”, Center for Global Development Working Paper
no. 148
Cunha, Flavio and James Heckman (2008). “Formulating, Identifying and Estimating the Technology of
Cognitive and Noncognitive Skill Formation.” Journal of Human Resources, 43(4): 728-782.
Fougere, Denis, Francis Kramarz and Julien Pouget (2009). “Youth Unemployment and Crime in France.”
Journal of the European Economic Association, 7(5): 909-938.
23
Hanushek, E. A., & Kimko, D. D. (2000). Schooling, labor-force quality and the growth of nations. The
American Economic Review, 90(5),1184–1208.
Hanushek, E. A., & Woessmann, L. (2008). The role of cognitive skills in economic development. Journal
of Economic Literature, 46(3), 607–668.
Hanushek, E. A., & Woessmann, L. (2009). “Do better schools lead to more growth? Cognitive skills,
economic outcomes, and causation.” National Bureau of Economic Research,WP 14633.
Hanushek, E. A., & Woessmann, L. (2011). “The Economics of International Differences in Educational
Achievement.” In Eric A. Hanushek, Stephen Machin and Ludger Woessmann (Eds.), Handbook of the
Economics of Education, Vol. 3, Amsterdam: North Holland.
International Labour Organization (2010). “Global Employment Trends: 2010.”
Jensen, Robert (2012). "Do Labor Market Opportunities Affect Young Women's Work and Family
Decisions? Experimental Evidence from India," forthcoming, Quarterly Journal of Economics.
Jensen, Robert (2010). “The (Perceived) Returns to Education and the Demand for Schooling," Quarterly
Journal of Economics, 125(2), p. 515-548.
Jovanovic, Boyan (1978). “Job-Matching and the Theory of Turnover.” Journal of Political Economy,
87(5): 972-990.
Jimenez, Emmanuel, Elizabeth King, and Jee-Peng Tan (2012). “Making the Grade.” Finance and
Development, 49(1).
Kahn, Lisa (2010). “The Long-Term Labor Market Consequences of Graduating from College in a Bad
Economy.” Labour Economics, 17(2): 303-316.
King, Elizabeth, Claudio Montenegro, and Peter Orazem, “Economic Freedom, Human Rights, and the
Returns to Human Capital: An Evaluation of the Schultz Hypothesis”, World Bank Policy Research Paper
no. 5405.
Korenman and Neumark (2000). “Cohort Crowding and Youth Labor Markets: A Cross-National
Analysis.” In Youth Employment and Joblessness in Advanced Countries, ed. David G. Blanchflower and
Richard Freeman, National Bureau of Economic Research.
Lin, Ming-Jen (2008). “Does Unemployment Increase Crime? Evidence from U.S. Data 1974-2000.”
Journal of Human Resources, 43(2): 413-436.
Montenegro, Claudio and Carmen Pages (2004). “Who Benefits from Labor Market Regulations? Chile
1960-1998.” In Law and Employment: Lessons from Latin America and the Caribbean, pages 401-434
National Bureau of Economic Research, Inc.
Montenegro, Claudio, and Maxamillion Hirn, 2009, “A New Disaggregated Set of Labor Market Indicators
Using Standardized Household Indicators from Around the World”, World Bank, mimeo
24
OECD (2011). Off to a Good Start? Jobs for Youth.
O’Higgins, Niall (2003). “Trends in the Youth Labor Market in Developing and Transition Countries.”
Social Protection Discussion Paper No. 0321, World Bank, Washington D.C.
Oreopoulos, Philip, Till von Wachter and Andrew Heisz (2008). “The Short- and Long-Term Career
Effects of Graduating in a Recession: Hysteresis and Heterogeneity in the Market for College Graduates.”
IZA Discussion Paper No. 3578.
Rogerson, Richard, Robert Shimer, and Randall Wright (2005). “Search-theoretic Models of the Labor
Market: A Survey.” Journal of Economic Literature, 43: 959-988.
25
Table 1: Growth as a function of cognitive skill measures
Average per capita
GDP growth rate
(I)
1960-2000
(published
results)
(II)
1960-2010
(attempted
replication)
(III)
1990-2010
(H-W sample)
(IV)
1990-2010
(Additional
countries)
Country cognitive score 1.541*** 1.221*** 0.894 0.206
(0.434) (0.404) (0.594) (0.539)
GDP in initial year -0.000*** -0.000*** -0.000** 0.000
(0.000) (0.000) (0.000) (0.000)
Years of schooling in -0.235* -0.229* -0.111 -0.386***
initial year (0.136) (0.127) (0.170) (0.139)
Observations
45
45
45
69
R-squared 0.420 0.428 0.234 0.141
Source: Hanushek, E. A., & Woessmann, L. (2008). The role of cognitive skills in economic development. Journal of Economic Literature, 46(3), 607–668; Author’s calculations
26
Table 2: Data coverage
Test score source Number of participating countries
Number of cohorts (country, birth year, and gender) observed
Number of cells (survey years in which cohorts outcomes are observed)
Total PISA 41 176 454 TIMSS 34 128 329 Altinok-Murseli (A-M) 67 315 723
Tests in multiple years PISA 32 158 436 TIMSS 27 114 315 Altinok-Murseli (A-M) 50 281 689
Note: Cohorts are defined separately by gender. On average countries administered each test roughly twice, to four different cohorts.
27
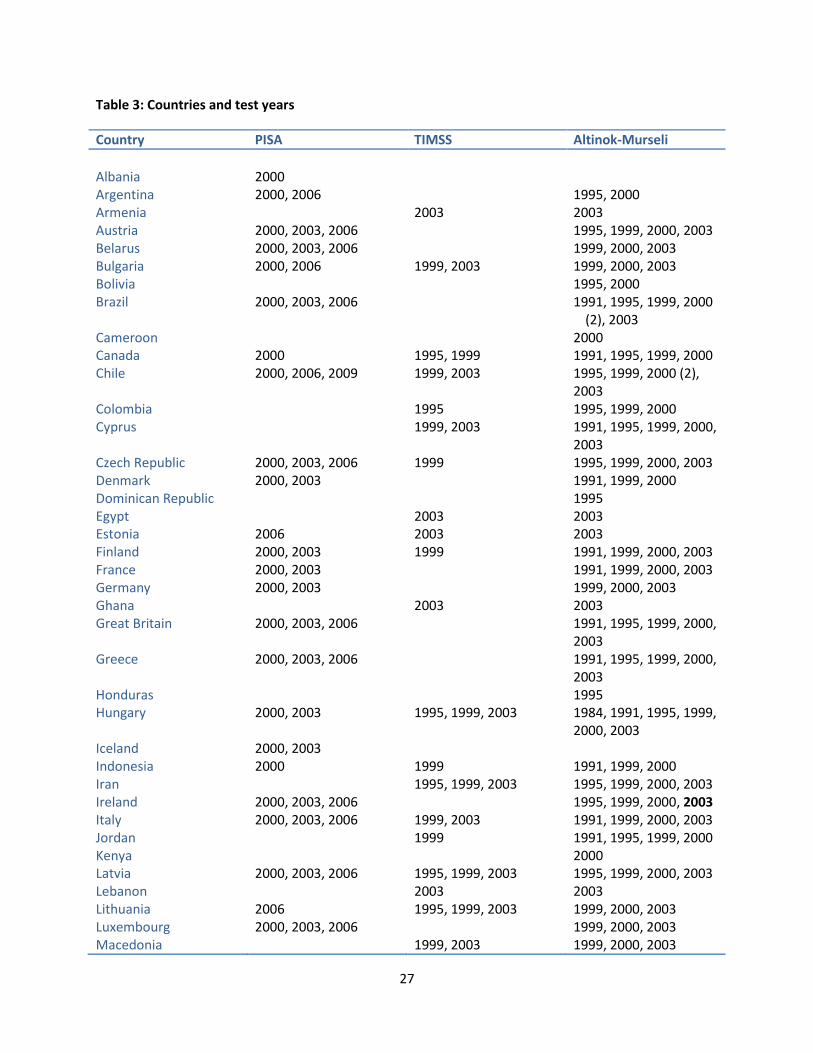
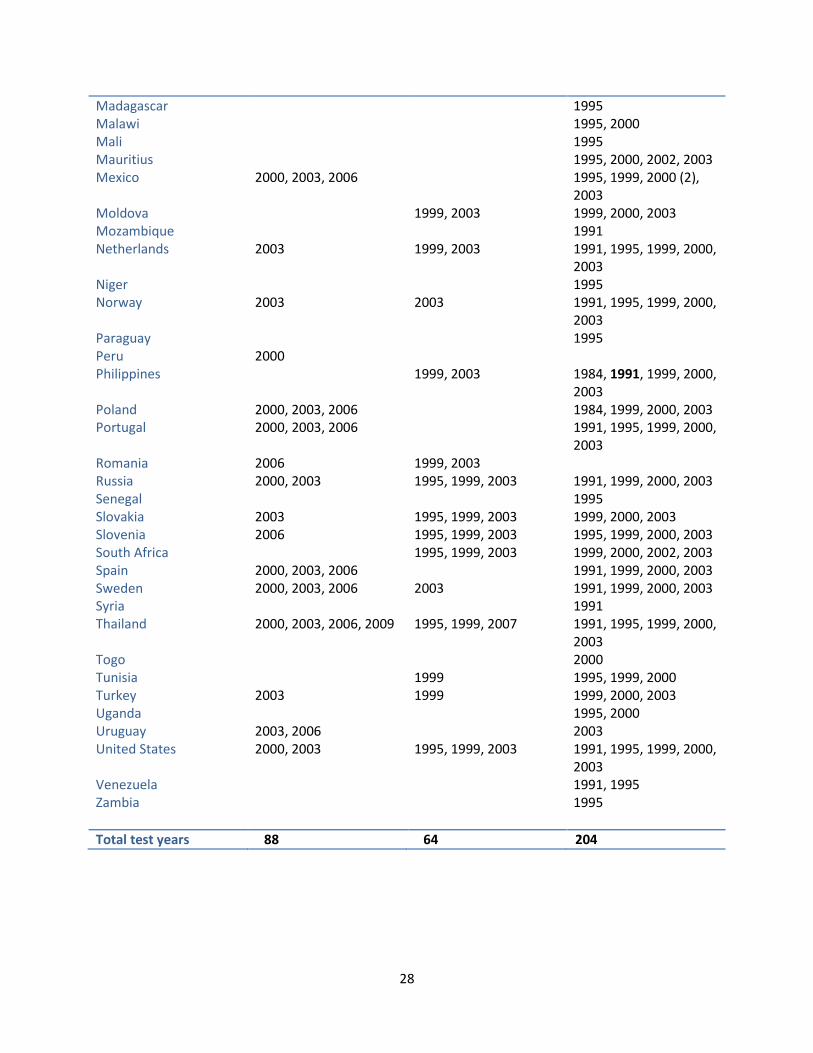
Table 3: Countries and test years
Country PISA TIMSS Altinok-Murseli
Albania 2000 Argentina 2000, 2006 1995, 2000 Armenia 2003 2003 Austria 2000, 2003, 2006 1995, 1999, 2000, 2003 Belarus 2000, 2003, 2006 1999, 2000, 2003 Bulgaria 2000, 2006 1999, 2003 1999, 2000, 2003 Bolivia 1995, 2000 Brazil 2000, 2003, 2006 1991, 1995, 1999, 2000
(2), 2003 Cameroon 2000 Canada 2000 1995, 1999 1991, 1995, 1999, 2000 Chile 2000, 2006, 2009 1999, 2003 1995, 1999, 2000 (2),
2003 Colombia 1995 1995, 1999, 2000 Cyprus 1999, 2003 1991, 1995, 1999, 2000,
2003 Czech Republic 2000, 2003, 2006 1999 1995, 1999, 2000, 2003 Denmark 2000, 2003 1991, 1999, 2000 Dominican Republic 1995 Egypt 2003 2003 Estonia 2006 2003 2003 Finland 2000, 2003 1999 1991, 1999, 2000, 2003 France 2000, 2003 1991, 1999, 2000, 2003 Germany 2000, 2003 1999, 2000, 2003 Ghana 2003 2003 Great Britain 2000, 2003, 2006 1991, 1995, 1999, 2000,
2003 Greece 2000, 2003, 2006 1991, 1995, 1999, 2000,
2003 Honduras 1995 Hungary 2000, 2003 1995, 1999, 2003 1984, 1991, 1995, 1999,
2000, 2003 Iceland 2000, 2003 Indonesia 2000 1999 1991, 1999, 2000 Iran 1995, 1999, 2003 1995, 1999, 2000, 2003 Ireland 2000, 2003, 2006 1995, 1999, 2000, 2003 Italy 2000, 2003, 2006 1999, 2003 1991, 1999, 2000, 2003 Jordan 1999 1991, 1995, 1999, 2000 Kenya 2000 Latvia 2000, 2003, 2006 1995, 1999, 2003 1995, 1999, 2000, 2003 Lebanon 2003 2003 Lithuania 2006 1995, 1999, 2003 1999, 2000, 2003 Luxembourg 2000, 2003, 2006 1999, 2000, 2003 Macedonia 1999, 2003 1999, 2000, 2003
28
Madagascar 1995 Malawi 1995, 2000 Mali 1995 Mauritius 1995, 2000, 2002, 2003 Mexico 2000, 2003, 2006 1995, 1999, 2000 (2),
2003 Moldova 1999, 2003 1999, 2000, 2003 Mozambique 1991 Netherlands 2003 1999, 2003 1991, 1995, 1999, 2000,
2003 Niger 1995 Norway 2003 2003 1991, 1995, 1999, 2000,
2003 Paraguay 1995 Peru 2000 Philippines 1999, 2003 1984, 1991, 1999, 2000,
2003 Poland 2000, 2003, 2006 1984, 1999, 2000, 2003 Portugal 2000, 2003, 2006 1991, 1995, 1999, 2000,
2003 Romania 2006 1999, 2003 Russia 2000, 2003 1995, 1999, 2003 1991, 1999, 2000, 2003 Senegal 1995 Slovakia 2003 1995, 1999, 2003 1999, 2000, 2003 Slovenia 2006 1995, 1999, 2003 1995, 1999, 2000, 2003 South Africa 1995, 1999, 2003 1999, 2000, 2002, 2003 Spain 2000, 2003, 2006 1991, 1999, 2000, 2003 Sweden 2000, 2003, 2006 2003 1991, 1999, 2000, 2003 Syria 1991 Thailand 2000, 2003, 2006, 2009 1995, 1999, 2007 1991, 1995, 1999, 2000,
2003 Togo 2000 Tunisia 1999 1995, 1999, 2000 Turkey 2003 1999 1999, 2000, 2003 Uganda 1995, 2000 Uruguay 2003, 2006 2003 United States 2000, 2003 1995, 1999, 2003 1991, 1995, 1999, 2000,
2003 Venezuela 1991, 1995 Zambia 1995
Total test years 88 64 204
29
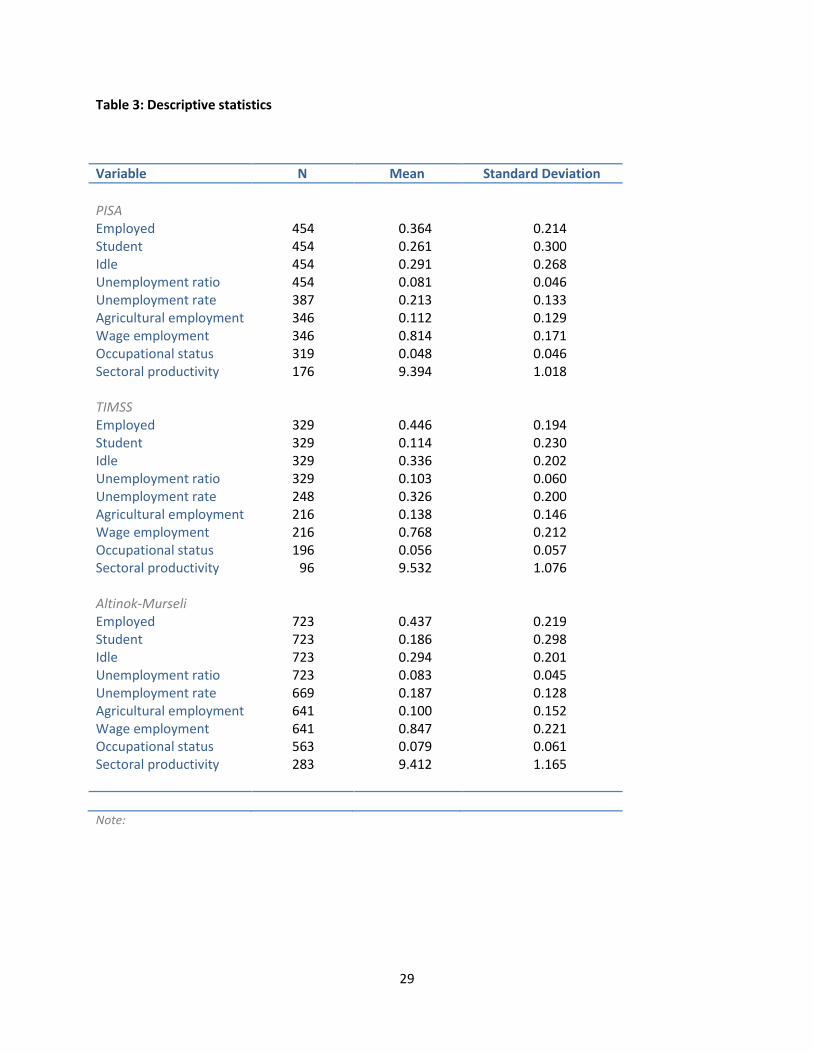
Table 3: Descriptive statistics
Variable N Mean Standard Deviation
PISA Employed 454 0.364 0.214 Student 454 0.261 0.300 Idle 454 0.291 0.268 Unemployment ratio 454 0.081 0.046 Unemployment rate 387 0.213 0.133 Agricultural employment 346 0.112 0.129 Wage employment 346 0.814 0.171 Occupational status 319 0.048 0.046 Sectoral productivity 176 9.394 1.018 TIMSS Employed 329 0.446 0.194 Student 329 0.114 0.230 Idle 329 0.336 0.202 Unemployment ratio 329 0.103 0.060 Unemployment rate 248 0.326 0.200 Agricultural employment 216 0.138 0.146 Wage employment 216 0.768 0.212 Occupational status 196 0.056 0.057 Sectoral productivity 96 9.532 1.076 Altinok-Murseli Employed 723 0.437 0.219 Student 723 0.186 0.298 Idle 723 0.294 0.201 Unemployment ratio 723 0.083 0.045 Unemployment rate 669 0.187 0.128 Agricultural employment 641 0.100 0.152 Wage employment 641 0.847 0.221 Occupational status 563 0.079 0.061 Sectoral productivity 283 9.412 1.165
Note:
30
Table 4a: Estimated effect of test score, by employment outcome, PISA
PISA
(I) Employed
(II) Student
(III) Idle
(IV) Unemployment
ratio
(V) Unemployment
rate
Test score -0.080 0.353** -0.223** -0.053*** -0.026 (0.056) (0.132) (0.095) (0.016) (0.040) Gender 0.057** -0.167*** 0.110*** -0.003 -0.029 (0.024) (0.059) (0.031) (0.010) (0.019) Age 0.076*** -0.033*** -0.051** 0.009*** -0.015*** (0.010) (0.011) (0.019) (0.002) (0.005) Log per capita GDP 0.084*** -0.262*** 0.147*** 0.030*** -0.008 (0.029) (0.059) (0.032) (0.007) (0.021) Youth unemployment 0.002 -0.016 0.009 0.006*** 0.011*** rate by gender, 1991 (0.004) (0.010) (0.006) (0.001) (0.002) Youth labor force part. 0.010** -0.025*** 0.010 0.005*** 0.007*** by gender, 1991 (0.005) (0.009) (0.006) (0.001) (0.002) Natural resource rents 0.009 -0.007 -0.005 0.000 -0.003 to GDP, 1990 (0.007) (0.010) (0.008) (0.001) (0.003) R-squared 0.811 0.622 0.669 0.498 0.406 Number of observations 454 454 454 454 387
Note: Regressions also include regional dummies, and a linear time trend. Standard errors clustered on country.
31
Table 4b: Estimated effect of test score, by employment outcome, TIMSS
TIMSS
(I) Employed
(II) Student
(III) Idle
(IV) Unemployment
ratio
(V) Unemployment
rate
Test score -0.013 0.030 0.018 -0.035*** -0.037** (0.020) (0.044) (0.034) (0.011) (0.016) Gender 0.027** -0.051** 0.023 0.001 0.025 (0.013) (0.024) (0.022) (0.007) (0.019) Age 0.081*** -0.023 -0.073*** 0.016*** -0.003 (0.009) (0.019) (0.023) (0.002) (0.004) Log per capita GDP 0.099*** -0.198*** 0.095** 0.003 -0.073*** (0.023) (0.049) (0.041) (0.007) (0.017) Youth unemployment -0.003 -0.002 -0.002 0.007*** 0.013*** rate by gender, 1991 (0.004) (0.008) (0.006) (0.002) (0.003) Youth labor force part. 0.004 -0.007 -0.003 0.006*** 0.009*** by gender, 1991 (0.004) (0.008) (0.006) (0.002) (0.003) Natural resource rents 0.008* -0.029*** 0.020** 0.002 0.002 to GDP, 1990 (0.004) (0.009) (0.008) (0.001) (0.003) R-squared 0.910 0.694 0.674 0.589 0.753 Number of observations 329 329 329 329 248
Note: Regressions also include regional dummies, and a linear time trend. Standard errors clustered on country.
32
Table 4c: Estimated effect of test score, by employment outcome, Altinok-Murseli
Altinok-Murseli
(I) Employed
(II) Student
(III) Idle
(IV) Unemployment
ratio
(V) Unemployment
rate
Test score -0.051*** 0.135*** -0.056* -0.027*** -0.019 (0.016) (0.042) (0.033) (0.007) (0.012) Gender 0.022 -0.127*** 0.107*** -0.003 -0.034*** (0.019) (0.033) (0.026) (0.008) (0.010) Age 0.054*** -0.021* -0.037*** 0.003** -0.011*** (0.003) (0.011) (0.010) (0.002) (0.002) Log per capita GDP 0.015 -0.090*** 0.063** 0.013*** 0.005 (0.010) (0.033) (0.029) (0.004) (0.006) Youth unemployment -0.007** 0.000 0.001 0.005*** 0.016*** rate by gender, 1991 (0.003) (0.008) (0.006) (0.001) (0.002) Youth labor force part. 0.001 -0.010 0.005 0.005*** 0.010*** by gender, 1991 (0.003) (0.008) (0.006) (0.001) (0.002) Natural resource rents 0.001 -0.007 0.006 0.001 -0.001 to GDP, 1990 (0.002) (0.008) (0.006) (0.000) (0.001) R-squared 0.816 0.588 0.282 0.264 0.620 Number of observations 723 723 723 723 723
Note: Regressions also include regional dummies, and a linear time trend. Standard errors clustered on country.
33
Table 5a: Estimated effect of test score, by employment outcome for men
Male youth (I)
Employed
(II)
Student
(III)
Idle
(IV)
Unemployment
ratio
(V)
Unemployment
rate
PISA Test score -0.021 0.240* -0.171 -0.049** -0.032 (0.065) (0.125) (0.103) (0.019) (0.051) R-squared 0.854 0.7 0.739 0.487 0.388 Observations 227 227 227 227 206 TIMSS Test score -0.013 0.058 -0.025 -0.020 -0.005 (0.019) (0.043) (0.034) (0.013) (0.020) R-squared 0.923 0.752 0.756 0.593 0.723 Observations 165 165 165 165 135 Altinok-Murseli Test score -0.059*** 0.116*** -0.028 -0.029*** -0.015 (0.012) (0.034) (0.030) (0.010) (0.014) R-squared 0.841 0.72 0.439 0.235 0.657 Observations 362 362 362 362 340
Note: Regressions also include per capita GDP in 1990, age, youth unemployment rates by gender in 1991, youth labor force participation rates by gender in 1991, natural resource to GDP ratios, regional dummies, and a linear time trend. Standard errors clustered on country.
34
Table 5b: Estimated effect of test score on employment outcomes for women
Female youth (I)
Employed
(II)
Student
(III)
Idle
(IV)
Unemployment
ratio
(V)
Unemployment
rate
PISA Test score -0.108** 0.415*** -0.251*** -0.060** -0.022 (0.050) (0.132) (0.088) (0.024) (0.054) R-squared 0.778 0.639 0.642 0.529 0.45 Observations 227 227 227 227 181 TIMSS Test score -0.019 0.060 0.010 -0.050*** -0.049* (0.030) (0.062) (0.040) (0.017) (0.026) R-squared 0.907 0.681 0.618 0.6 0.787 Observations 164 164 164 164 113 Altinok-Murseli Test score -0.042** 0.150*** -0.082** -0.025*** -0.022 (0.018) (0.040) (0.037) (0.009) (0.018) R-squared 0.806 0.554 0.235 0.274 0.641 Observations 361 361 361 361 329
Note: Regressions also include per capita GDP in 1990, age, youth unemployment rates by gender in 1991, youth
labor force participation rates by gender in 1991, natural resource to GDP ratios, regional dummies, and a linear
time trend. Standard errors clustered on country.
35
Table 6: Estimated effect of test on employment outcomes including country fixed effects, by gender
and test
(I)
Employed
(II)
Student
(III)
Idle
(IV)
Unemployment
ratio
(V)
Unemployment
rate
Pooled PISA 0.188 0.240 -0.386* -0.041 0.059 (0.136) (0.186) (0.220) (0.036) (0.093) TIMMS -0.139* -0.308** 0.375** 0.072 -0.132** (0.078) (0.131) (0.139) (0.049) (0.056) Altinok-Murseli -0.024 0.019 0.027 -0.022* -0.024** (0.023) (0.014) (0.033) (0.012) (0.011) Men PISA 0.035 0.325* -0.354 -0.004 0.178 (0.159) (0.169) (0.263) (0.044) (0.149) TIMMS -0.227* -0.463*** 0.533*** 0.158* -0.012 (0.112) (0.165) (0.176) (0.080) (0.081) Altinok-Murseli -0.058*** 0.025 0.064** -0.031* -0.025** (0.020) (0.016) (0.029) (0.017) (0.012) Women PISA 0.197* 0.183 -0.337 -0.042 0.129 (0.116) (0.334) (0.338) (0.063) (0.163) TIMMS -0.060 -0.388* 0.370 0.085 -0.166 (0.124) (0.217) (0.271) (0.067) (0.110) Altinok-Murseli 0.001 0.017 -0.007 -0.010 -0.008 (0.030) (0.015) (0.041) (0.017) (0.012)
Note: Regressions include age and a linear time trend.
36
Table 7a: Estimated effect of test score on job quality indicators, by test
(I) Agricultural
employment
(II) Wage
employment
(III) High-status occupation
(IV) Sectoral
productivity
PISA Test score -0.028 0.114** 0.027* -0.059
(0.035) (0.047) (0.016) (0.162) R-squared 0.810 0.707 0.305 0.983 Observations 346 346 319 176 TIMSS Test score -0.033** 0.009 0.010 0.119
(0.017) (0.031) (0.009) (0.196) R-squared 0.642 0.656 0.481 0.99 Observations 216 216 196 96 Altinok-Murseli Test score -0.033*** 0.054** 0.000 -0.011
(0.010) (0.023) (0.007) (0.052) R-squared 0.73 0.802 0.758 0.987 Observations 641 641 563 283
Note: Regressions also include per capita GDP in 1990, age, youth unemployment rates by gender in 1991, youth
labor force participation rates by gender in 1991, natural resource to GDP ratios, regional dummies, and a linear
time trend. Standard errors clustered on country.

37
Table 7b: Estimated effect of test score on job quality indicators, by test, men
(I) Agricultural
employment
(II) Wage
employment
(III) High-status occupation
(IV) Sectoral
productivity
PISA Test score -0.053* 0.181*** 0.024 -0.012
(0.029) (0.041) (0.018) (0.185) R-squared 0.892 0.759 0.275 0.986 Observations 180 180 162 91 TIMSS Test score -0.003 -0.002 0.005 0.082
(0.019) (0.029) (0.018) (0.226) R-squared 0.813 0.758 0.620 0.996 Observations 113 113 101 49 Altinok-Murseli Test score -0.049*** 0.060** 0.013 0.013
(0.014) (0.027) (0.008) (0.051) R-squared 0.779 0.817 0.708 0.989 Observations 322 322 283 142
Note: Regressions also include per capita GDP in 1990, age, youth unemployment rates by gender in 1991, youth
labor force participation rates by gender in 1991, natural resource to GDP ratios, regional dummies, and a linear
time trend. Standard errors clustered on country.
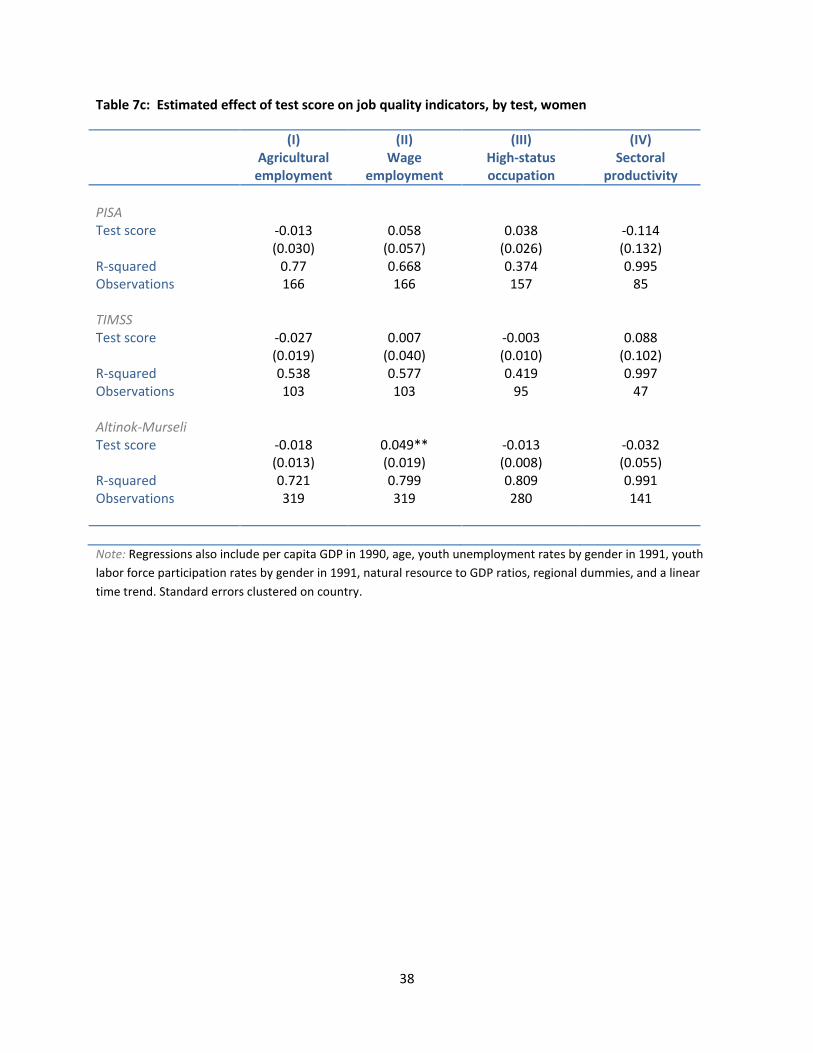
38
Table 7c: Estimated effect of test score on job quality indicators, by test, women
(I) Agricultural
employment
(II) Wage
employment
(III) High-status occupation
(IV) Sectoral
productivity
PISA Test score -0.013 0.058 0.038 -0.114
(0.030) (0.057) (0.026) (0.132) R-squared 0.77 0.668 0.374 0.995 Observations 166 166 157 85 TIMSS Test score -0.027 0.007 -0.003 0.088
(0.019) (0.040) (0.010) (0.102) R-squared 0.538 0.577 0.419 0.997 Observations 103 103 95 47 Altinok-Murseli Test score -0.018 0.049** -0.013 -0.032
(0.013) (0.019) (0.008) (0.055) R-squared 0.721 0.799 0.809 0.991 Observations 319 319 280 141
Note: Regressions also include per capita GDP in 1990, age, youth unemployment rates by gender in 1991, youth
labor force participation rates by gender in 1991, natural resource to GDP ratios, regional dummies, and a linear
time trend. Standard errors clustered on country.
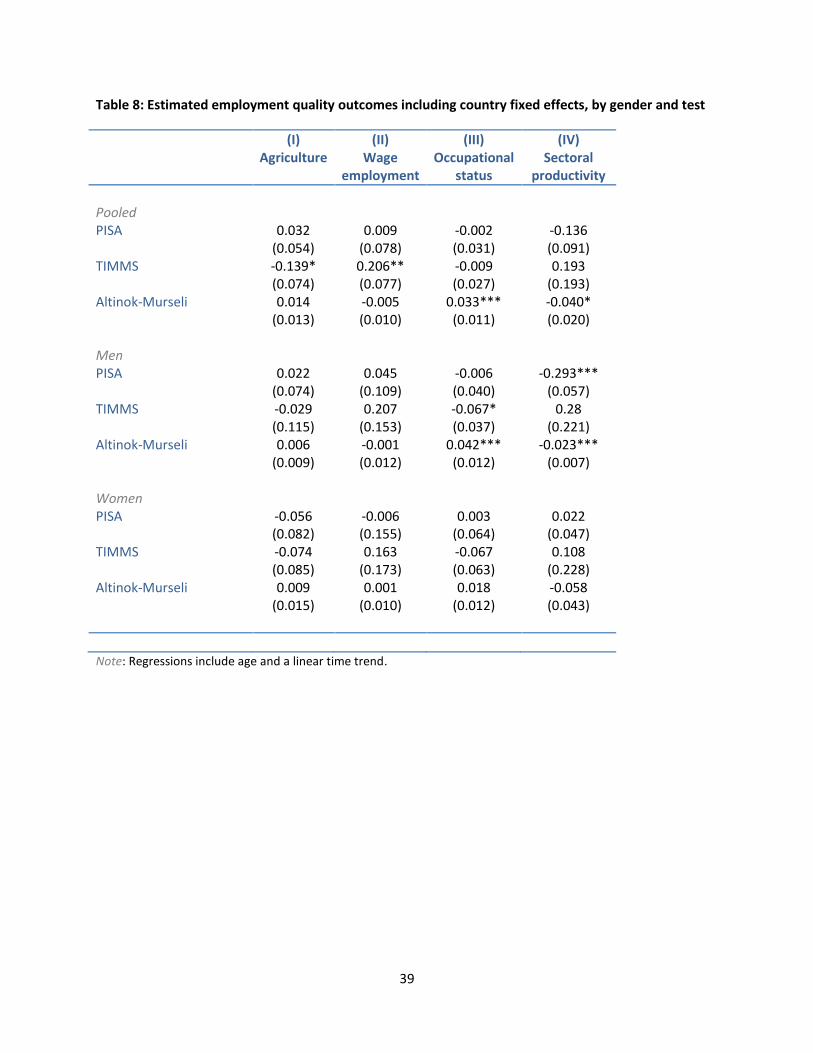
39
Table 8: Estimated employment quality outcomes including country fixed effects, by gender and test
(I) Agriculture
(II) Wage
employment
(III) Occupational
status
(IV) Sectoral
productivity
Pooled PISA 0.032 0.009 -0.002 -0.136 (0.054) (0.078) (0.031) (0.091) TIMMS -0.139* 0.206** -0.009 0.193 (0.074) (0.077) (0.027) (0.193) Altinok-Murseli 0.014 -0.005 0.033*** -0.040* (0.013) (0.010) (0.011) (0.020) Men PISA 0.022 0.045 -0.006 -0.293*** (0.074) (0.109) (0.040) (0.057) TIMMS -0.029 0.207 -0.067* 0.28 (0.115) (0.153) (0.037) (0.221) Altinok-Murseli 0.006 -0.001 0.042*** -0.023*** (0.009) (0.012) (0.012) (0.007) Women PISA -0.056 -0.006 0.003 0.022 (0.082) (0.155) (0.064) (0.047) TIMMS -0.074 0.163 -0.067 0.108 (0.085) (0.173) (0.063) (0.228) Altinok-Murseli 0.009 0.001 0.018 -0.058 (0.015) (0.010) (0.012) (0.043)
Note: Regressions include age and a linear time trend.
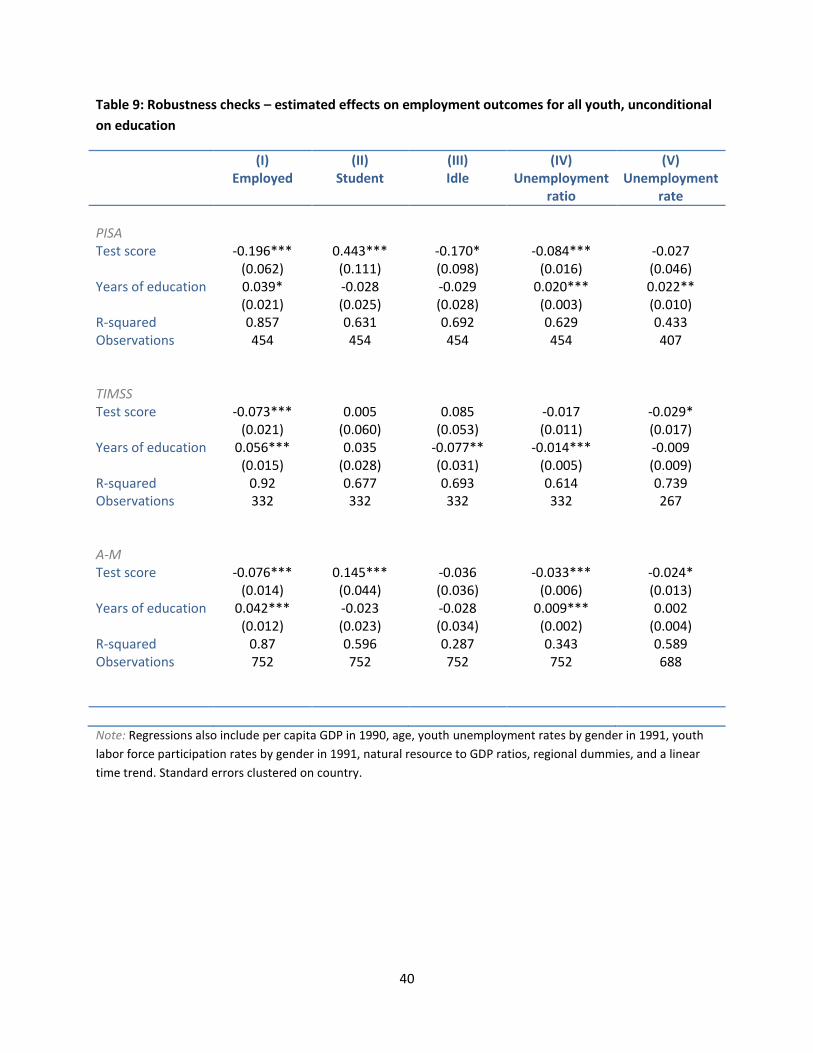
40
Table 9: Robustness checks – estimated effects on employment outcomes for all youth, unconditional
on education
(I) Employed
(II) Student
(III) Idle
(IV) Unemployment
ratio
(V) Unemployment
rate
PISA Test score -0.196*** 0.443*** -0.170* -0.084*** -0.027 (0.062) (0.111) (0.098) (0.016) (0.046) Years of education 0.039* -0.028 -0.029 0.020*** 0.022** (0.021) (0.025) (0.028) (0.003) (0.010) R-squared 0.857 0.631 0.692 0.629 0.433 Observations 454 454 454 454 407 TIMSS Test score -0.073*** 0.005 0.085 -0.017 -0.029* (0.021) (0.060) (0.053) (0.011) (0.017) Years of education 0.056*** 0.035 -0.077** -0.014*** -0.009 (0.015) (0.028) (0.031) (0.005) (0.009) R-squared 0.92 0.677 0.693 0.614 0.739 Observations 332 332 332 332 267 A-M Test score -0.076*** 0.145*** -0.036 -0.033*** -0.024* (0.014) (0.044) (0.036) (0.006) (0.013) Years of education 0.042*** -0.023 -0.028 0.009*** 0.002 (0.012) (0.023) (0.034) (0.002) (0.004) R-squared 0.87 0.596 0.287 0.343 0.589 Observations 752 752 752 752 688
Note: Regressions also include per capita GDP in 1990, age, youth unemployment rates by gender in 1991, youth
labor force participation rates by gender in 1991, natural resource to GDP ratios, regional dummies, and a linear
time trend. Standard errors clustered on country.

41
Table 10: Robustness checks – estimated effects on employment quality for all youth, unconditional
on education
(I) Agriculture
(II) Wage
employment
(III) Occupational
status
(IV) Sectoral
productivity
PISA Test score -0.083** 0.136** 0.016 0.029 (0.032) (0.059) (0.015) (0.157) Years of education -0.009 0.013 0.006 0.022 (0.007) (0.009) (0.004) (0.018) R-squared 0.805 0.729 0.311 0.983 Observations 371 371 347 193 TIMSS Test score -0.073*** -0.015 -0.004 0.057 (0.023) (0.036) (0.011) (0.186) Years of education -0.002 0.045** 0.012** -0.046** (0.010) (0.019) (0.006) (0.016) R-squared 0.684 0.724 0.511 0.992 Observations 235 235 213 106 A-M Test score -0.034*** 0.048** -0.004 0.004 (0.010) (0.023) (0.008) (0.058) Years of education -0.006* 0.023*** 0.011*** 0.024 (0.004) (0.009) (0.002) (0.018) R-squared 0.732 0.81 0.787 0.988 Observations 656 656 578 288
Note: Regressions also include per capita GDP in 1990, age, youth unemployment rates by gender in 1991, youth
labor force participation rates by gender in 1991, natural resource to GDP ratios, regional dummies, and a linear
time trend. Standard errors clustered on country.
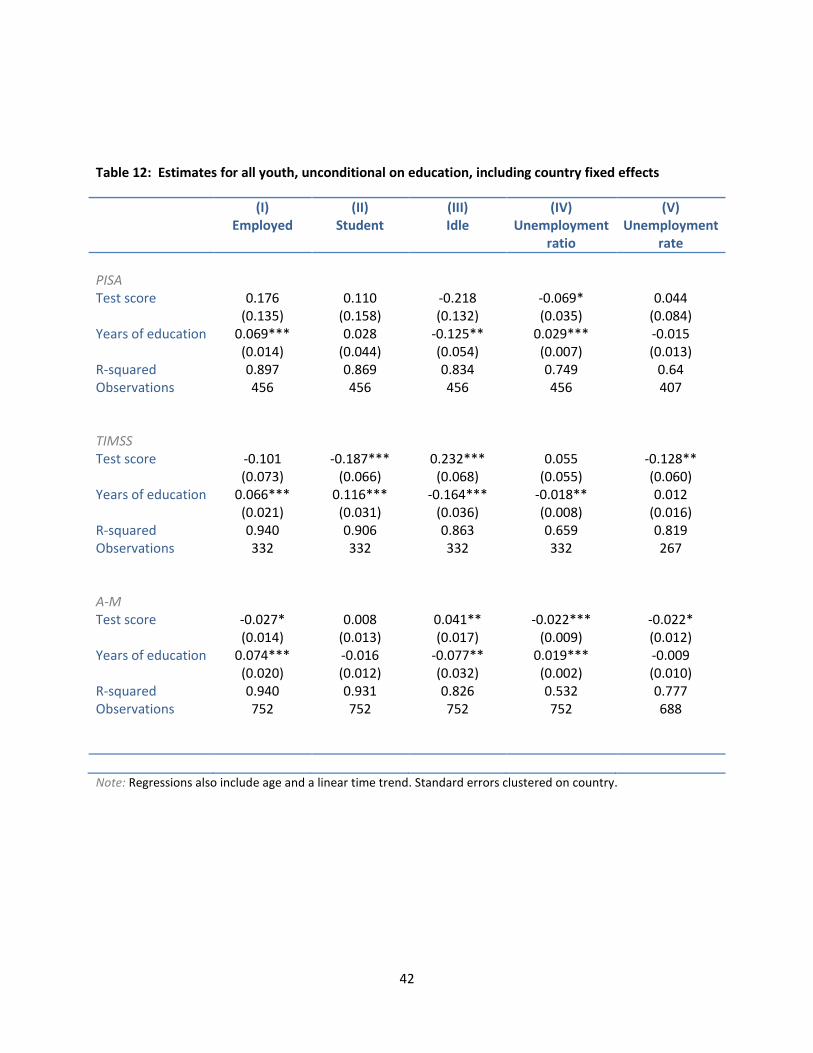
42
Table 12: Estimates for all youth, unconditional on education, including country fixed effects
(I) Employed
(II) Student
(III) Idle
(IV) Unemployment
ratio
(V) Unemployment
rate
PISA Test score 0.176 0.110 -0.218 -0.069* 0.044 (0.135) (0.158) (0.132) (0.035) (0.084) Years of education 0.069*** 0.028 -0.125** 0.029*** -0.015 (0.014) (0.044) (0.054) (0.007) (0.013) R-squared 0.897 0.869 0.834 0.749 0.64 Observations 456 456 456 456 407 TIMSS Test score -0.101 -0.187*** 0.232*** 0.055 -0.128** (0.073) (0.066) (0.068) (0.055) (0.060) Years of education 0.066*** 0.116*** -0.164*** -0.018** 0.012 (0.021) (0.031) (0.036) (0.008) (0.016) R-squared 0.940 0.906 0.863 0.659 0.819 Observations 332 332 332 332 267 A-M Test score -0.027* 0.008 0.041** -0.022*** -0.022* (0.014) (0.013) (0.017) (0.009) (0.012) Years of education 0.074*** -0.016 -0.077** 0.019*** -0.009 (0.020) (0.012) (0.032) (0.002) (0.010) R-squared 0.940 0.931 0.826 0.532 0.777 Observations 752 752 752 752 688
Note: Regressions also include age and a linear time trend. Standard errors clustered on country.
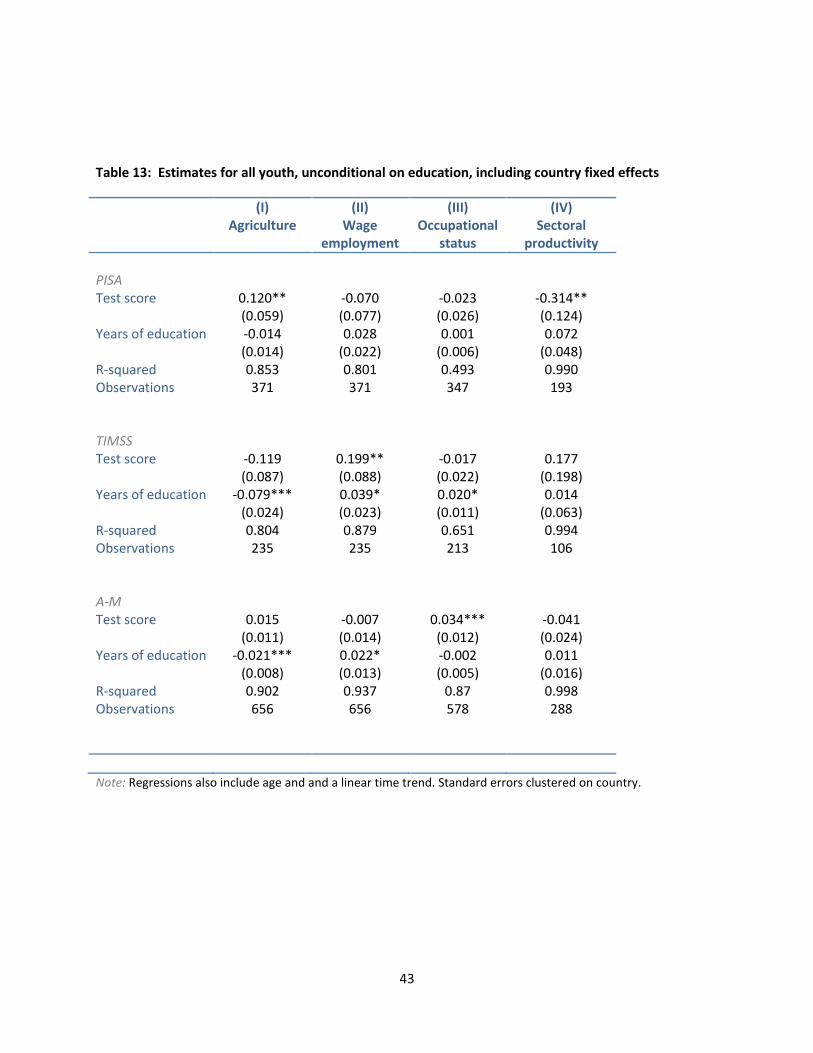
43
Table 13: Estimates for all youth, unconditional on education, including country fixed effects
(I) Agriculture
(II) Wage
employment
(III) Occupational
status
(IV) Sectoral
productivity
PISA Test score 0.120** -0.070 -0.023 -0.314** (0.059) (0.077) (0.026) (0.124) Years of education -0.014 0.028 0.001 0.072 (0.014) (0.022) (0.006) (0.048) R-squared 0.853 0.801 0.493 0.990 Observations 371 371 347 193 TIMSS Test score -0.119 0.199** -0.017 0.177 (0.087) (0.088) (0.022) (0.198) Years of education -0.079*** 0.039* 0.020* 0.014 (0.024) (0.023) (0.011) (0.063) R-squared 0.804 0.879 0.651 0.994 Observations 235 235 213 106 A-M Test score 0.015 -0.007 0.034*** -0.041 (0.011) (0.014) (0.012) (0.024) Years of education -0.021*** 0.022* -0.002 0.011 (0.008) (0.013) (0.005) (0.016) R-squared 0.902 0.937 0.87 0.998 Observations 656 656 578 288
Note: Regressions also include age and and a linear time trend. Standard errors clustered on country.
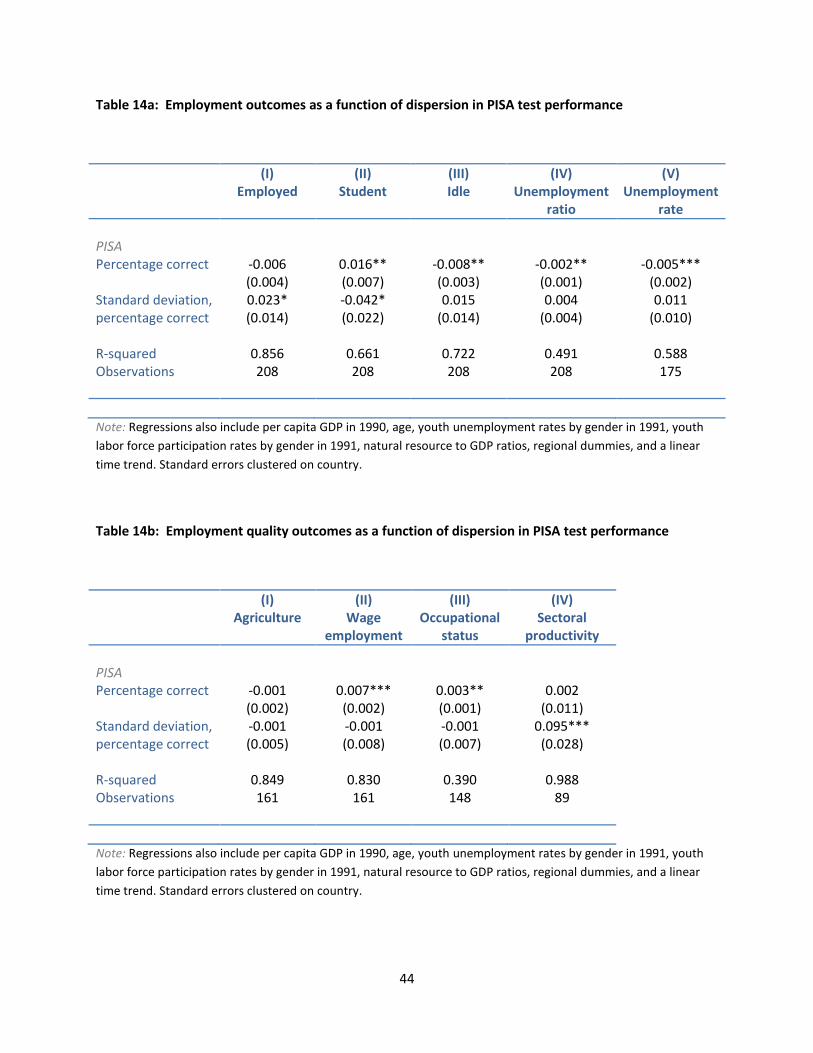
44
Table 14a: Employment outcomes as a function of dispersion in PISA test performance
(I) Employed
(II) Student
(III) Idle
(IV) Unemployment
ratio
(V) Unemployment
rate
PISA Percentage correct -0.006 0.016** -0.008** -0.002** -0.005*** (0.004) (0.007) (0.003) (0.001) (0.002) Standard deviation, 0.023* -0.042* 0.015 0.004 0.011 percentage correct (0.014) (0.022) (0.014) (0.004) (0.010) R-squared 0.856 0.661 0.722 0.491 0.588 Observations 208 208 208 208 175
Note: Regressions also include per capita GDP in 1990, age, youth unemployment rates by gender in 1991, youth
labor force participation rates by gender in 1991, natural resource to GDP ratios, regional dummies, and a linear
time trend. Standard errors clustered on country.
Table 14b: Employment quality outcomes as a function of dispersion in PISA test performance
(I) Agriculture
(II) Wage
employment
(III) Occupational
status
(IV) Sectoral
productivity
PISA Percentage correct -0.001 0.007*** 0.003** 0.002 (0.002) (0.002) (0.001) (0.011) Standard deviation, -0.001 -0.001 -0.001 0.095*** percentage correct (0.005) (0.008) (0.007) (0.028) R-squared 0.849 0.830 0.390 0.988 Observations 161 161 148 89
Note: Regressions also include per capita GDP in 1990, age, youth unemployment rates by gender in 1991, youth
labor force participation rates by gender in 1991, natural resource to GDP ratios, regional dummies, and a linear
time trend. Standard errors clustered on country.
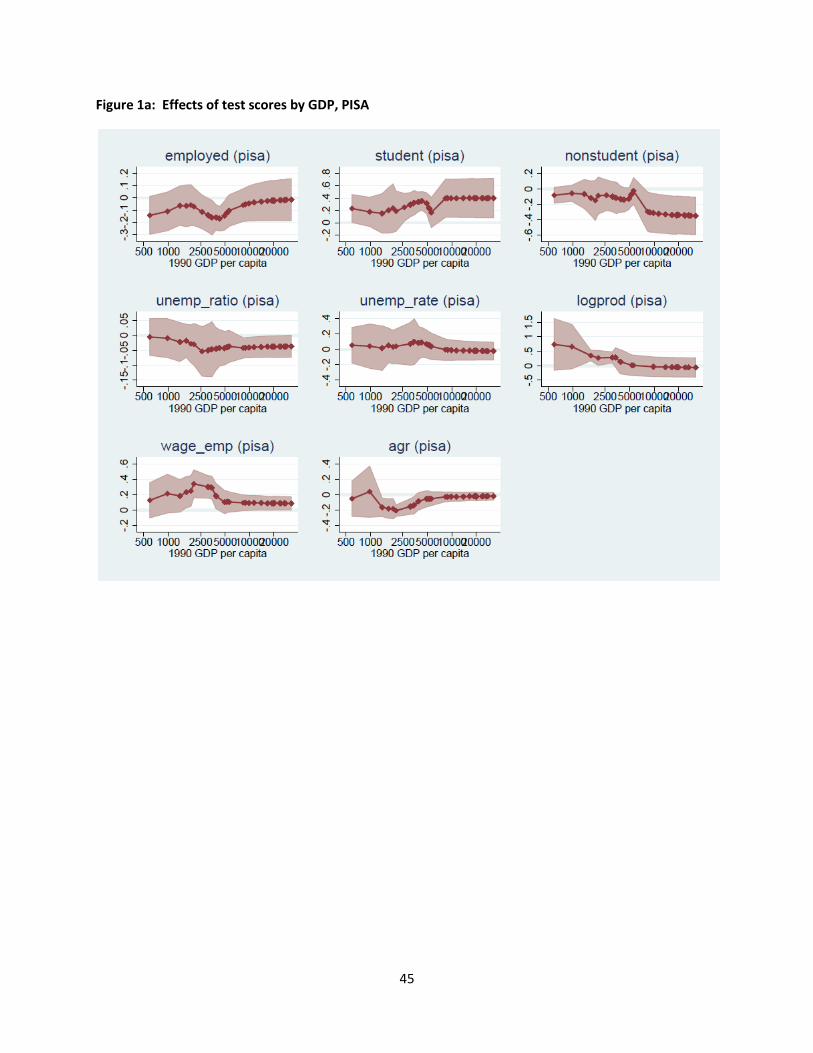
45
Figure 1a: Effects of test scores by GDP, PISA
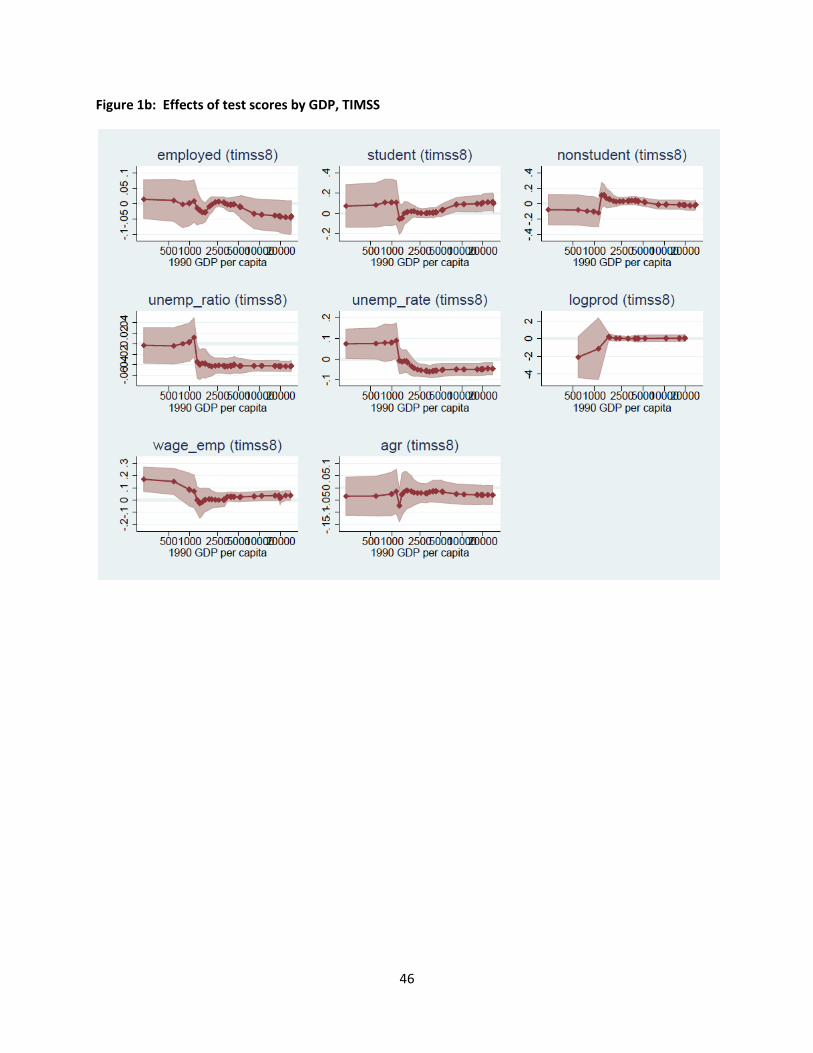
46
Figure 1b: Effects of test scores by GDP, TIMSS
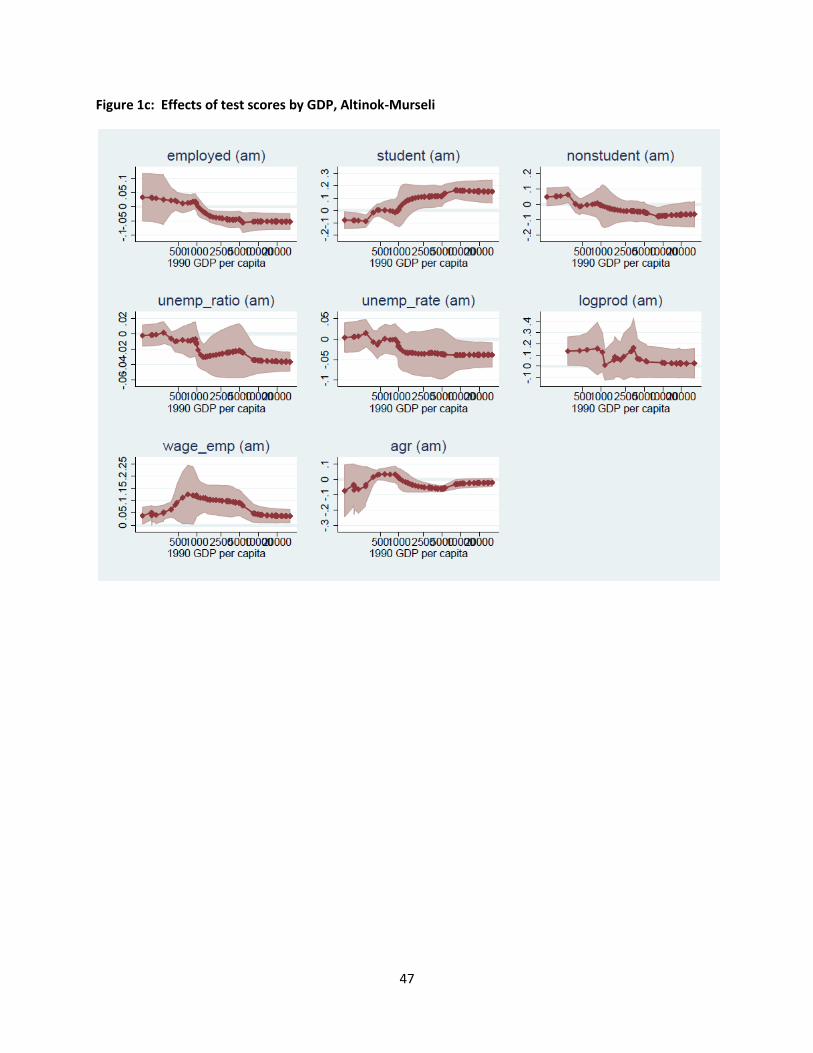
47
Figure 1c: Effects of test scores by GDP, Altinok-Murseli
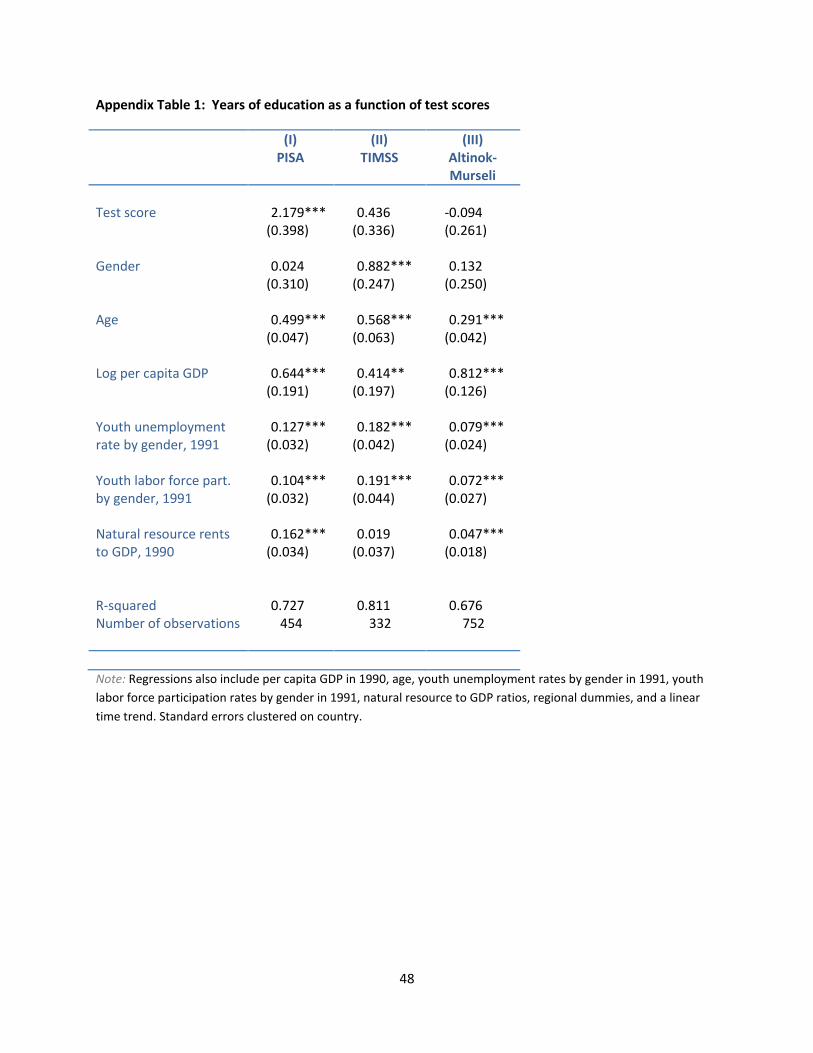
48
Appendix Table 1: Years of education as a function of test scores
(I) PISA
(II) TIMSS
(III) Altinok-Murseli
Test score 2.179*** 0.436 -0.094 (0.398) (0.336) (0.261) Gender 0.024 0.882*** 0.132 (0.310) (0.247) (0.250) Age 0.499*** 0.568*** 0.291*** (0.047) (0.063) (0.042) Log per capita GDP 0.644*** 0.414** 0.812*** (0.191) (0.197) (0.126) Youth unemployment 0.127*** 0.182*** 0.079*** rate by gender, 1991 (0.032) (0.042) (0.024) Youth labor force part. 0.104*** 0.191*** 0.072*** by gender, 1991 (0.032) (0.044) (0.027) Natural resource rents 0.162*** 0.019 0.047*** to GDP, 1990 (0.034) (0.037) (0.018) R-squared 0.727 0.811 0.676 Number of observations 454 332 752
Note: Regressions also include per capita GDP in 1990, age, youth unemployment rates by gender in 1991, youth
labor force participation rates by gender in 1991, natural resource to GDP ratios, regional dummies, and a linear
time trend. Standard errors clustered on country.