co - nasa more exact methods for ciap evaluations. this effort has utilized invariant modeling...
TRANSCRIPT

A.R.A.P. REPORT 199 NASA CR-132323
,o0
N7 4 10863
SOME ANALYSES OF THE CHEMISTRY
AND DIFFUSION OF SST EXHAUST
MATERIALS DURING PHASE III OF
THE WAKE PERIOD
Glenn R. Hilst
Coleman duP. Donaldson
Ross Contiliano
CO
Prepared under Contract NAS1-11873 by
Aeronautical Research Associates of Princeton, Inc
50 Washington Road, Princeton, New Jersey 085 0
for
NATIONAL AERONAUTICS AND SPACE ADMINISTRATION
July 1973
https://ntrs.nasa.gov/search.jsp?R=19740002750 2018-06-25T18:34:39+00:00Z

A.R.A.P. REPORT 199 NASA CR-132323
SOME ANALYSES OP THE CHEMISTRY
AND DIFFUSION OF SST EXHAUST
MATERIALS DURING PHASE III OF
THE WAKE PERIOD
.Glenn R. Hilst
Coleman duP. Donaldson
Ross Contlliano
Prepared under Contract NAS1-11873 by
Aeronautical Research Associates of Princeton, Inc
50 Washington Road, Princeton, New Jersey 08540
for
NATIONAL AERONAUTICS AND SPACE ADMINISTRATION
July 1973

ABSTRACT
In the generally stably stratified lower stratosphere, SSTexhaust plumes could spend a significant length of time in arelatively undispersed state. During this time, the SST exhaustmaterials behave quite differently than had been proposed inearlier studies of their potential environmental impact. It isevident that these prior evaluations have uniformly adopted aconservative set of assumptions, in the sense that they maximizethe effect of SST operations on the stratospheric environment.This report describes the first year of activity in an effort todevelop more exact methods for CIAP evaluations.
This effort has utilized invariant modeling techniques tosimulate the separate and combined effects of atmospheric turbu-lence, turbulent diffusion, and chemical reactions of SST exhaustmaterials in the lower stratosphere. The primary results to dateare :
1. The combination of relatively slow diffusive mixing andrapid chemical reactions during the Phase III wake period minimizesthe effect of SST exhausts on Oo depletion by the so-called NOcatalytic cycle. While the SST-produced NO is substantially abovebackground concentrations, it appears diffusive mixing of NO andOo is simply too slow to produce the Oo depletions originallyproposed.
2. The time required to dilute the SST exhaust plume maybe a significant fraction of the total time these materials areresident in the lower stratosphere. If this is the case, thenprior estimates of the environmental impact of these materialsmust be revised significantly downward.

SOME ANALYSES OP THE CHEMISTRY
AND DIFFUSION OF SST EXHAUST
MATERIALS DURING PHASE III OF
THE WAKE PERIOD
Glenn R. Hllst
Coleman duP. Donaldson
Ross Contillano
Aeronautical Research Associates of Princeton, Inc
SUMMARY
In the summer of 1972 the Aeronautical Research Associates ofPrinceton, Inc., (A.R.A.P.) undertook a study of the combinedproblems of atmospheric diffusion and chemical reactions associatedwith the potential impact of SST exhaust materials on the environ-mental properties of the lower stratosphere. This work was support-ed under Contract NAS1-11873, t>Y a transfer of funds from theDepartment of Transportation's Climatic Impact Assessment Program(DOT/CIAP) to the National Aeronautics and Space Administration'sLangley Research Center (NASA/LRC), and was directed by Dr. AlanGrobecker and Dr. Robert Underwood for DOT/CIAP and Dr. RobertLevine for NASA/LRC. The present document is a report on thefirst year of activity in this program and is directed to thetechnical results derived from applications of invariant modelsimulations of the separate and combined effects of atmosphericturbulence, turbulent diffusion, and chemical reactions to theproblems of the behavior of SST exhaust materials during the timethey are being diffused to background concentrations. In additionto these analyses, A.R.A.P. has participated actively in the CIAPprograms of monograph preparations, workshops, and formal confer-ences.
The genesis and impetus for A.R.A.P.'s contributions to theDOT/CIAP analyses may be traced to the combination of Donaldson'sdevelopment of second-order closure techniques for simulation ofnonlinear dynamical systems (ref. 5), the prior application ofthese techniques to chemical kinetic processes in turbulent fluidsby Donaldson and Hllst (ref. 4), and the recognition of the proba-bility that, in the generally stably stratified lower stratosphere,SST exhaust plumes could spend a significant length of time in arelatively undispersed state. The combination of these eventsled to the conclusion that there was a very real possibility thatduring a significant part of their residence time in the lowerstratosphere SST exhaust materials would behave quite differently

than had been proposed in the earlier studies oi' their potentialenvironmental impact. In a very real sense, the studies reportedhere have attempted to test the bases of these earlier analysesand, where these have been found to be inadequate or erroneous,to develop more exact methods for the CIAP evaluations.
The results of these studies to date may be summarized asfollows:
1. A detailed examination of the chemical depletion of ozone(Oo) by the so-called NOX catalytic cycle during the time the SSTexhausts are confined to above-background concentrations (thePhase III wake period in CIAP. parlance) shows the combination ofrelatively slow diffusive mixing and rapid chemical reactionsserves to minimize the effect of SST exhausts on Oo depletion.While the SST produced NO is substantially above backgroundconcentrations, it appears diffusive mixing of NO and 03 issimply too slow to produce the Oo depletions originally proposed.By way of analogy, it is as though the SST exhaust NO were placedin the stratosphere in a slightly permeable "bag " which expandsand erodes with time.
2. The time required to dilute the SST exhaust plume (theexpansion and erosion of the analogous "bag" containing thesematerials) may be a significant fractioji jpf theJtota 1_time t he s ematBr±aTs~are'T?e sllie"nt i"n~th lower tTa"to phere. If this is thecase, then prior estimates of the environmental impacts of TJKesematerials must be revised significantly downward.
The combination of these conclusions must be tempered by aclear recognition of the uncertainties of present knowledge anddemonstrable facts which plague any analysis of this kind. Theseare detailed in the present report. However, it is evident thatprior evaluations have uniformly adopted a conservative set ofassumptions, in the sense that they lead to estimations of themaximum effect SST operations could have on the stratosphericenvironment. In the face of ignorance and uncertainty, this is,perhaps, a "safe" course to follow. A much more rational course,however, is to remove the ignorance and minimize the uncertainties,so that we might evaluate these effects confidently.
INTRODUCTION
In prior evaluations of the potential environmental impact offleet operations of the SST in the lower stratosphere (refs. 1, 2,3), it was assumed that the exhaust products from many flights were,somehow, conserved and uniformly mixed globally in a layer of thestratosphere. It was further assumed that natural constituents ofthis atmospheric layer, such as 0^, were also uniformly mixed withthe exhaust products according to their local mean value. Under

these assumptions It was possible to calculate alterations of theequilibrium concentrations of natural constituents, and assess thechanges in these values which should associate with routine SSTfleet operations of N aircraft emitting a known amount of eachexhaust material.
As a first approximation to the true state of affairs, theseanalysis techniques provided the first Identification of the majorpotential impact of SST exhausts on the 0^ balance in the lowerstratosphere and their possible effects on the radiation balancefor incoming ultra violet light and on .the circulations of theatmosphere which control weather and climate. These initial esti-mates suggested that either or both of these effects could besignificant, and a more detailed analysis, which would refine theseestimates, was in order before unlimited SST operations were under-taken.
In undertaking this more detailed analysis, the DOT/CIAPeffort has, among other things, reopened the question of thevalidity of the assumptions of uniformly mixed SST exhaust andenvironmental constituents, and the work reported here is
specifically directed to this facet of the CIAP evaluation. Theneed for a reexamlnation of these assumptions is readily estab-lished from a qualitative recognition of the distribution ofexhaust products emitted continuously from multiple flights over a"long period of time. Far from being uniformly distributed overthe globe, the concentrations of these materials will vary fromvery high concentrations in the most recent exhaust plume to back-ground concentrations where these exhaust materials rarely go.The range of concentrations between these two extremes can readilyexceed four or five orders of magnitude. Intermediate between theextremes are the exhaust materials emitted during the prior days,weeks, and months, each in its appropriate stage of dilution tothe background or uniformly mixed level of concentration.
At any one time, then, the more appropriate picture of thedistribution of exhaust products in the lower stratosphere is oneof considerable spatial inhomogeneity, superimposed upon anynatural variability of the exhaust material under study. Nowconsider that the rate of reaction between two chemical species is,in the simplest case, proportional to their joint local concentra-tions. Then the total reaction rate in some volume of the atmos-phere (say a spherical shell located in the lower stratosphere) isthe volume integral of the product of the local concentrations ofthe reacting chemical species. If one of these species is uniform-ly distributed through this volume, the inhomogeneous distributionof the other does not alter the total reaction rate. However, ifboth species are inhomogeneously distributed, then the totalreaction rate depends upon how they are mixed together, and may bevery different from the rate predicted by assuming uniform valuesof concentration for either or both of the reacting species.

It is the purpose of the present study to quantify the abovequalitative arguments and present an initial evaluation of theeffect that inhoraogeneous distributions of exhaust products haveon the depletion of Oo by the NOX catalytic cycle during the timeindividual SST plumes are in the so-called Phase III wake phase.(This phase is defined as the time from vortex decay behind theaircraft until the SST plume has either grown to lateral dimen-sions of the order of 1000 km or the plume material is diluted bydiffusive mixing to background concentrations and is, therefore,no longer distinguishable as an entity.)
The N0x-0o reaction system has been selected because of itsprime importance to the CIAP evaluation. Also, in order toprovide maximum utility to the CIAP effort, the analyses are castin terms of the chemical efficiency of NO destruction of Oo duringthe Phase III wake phase, and the duration of this phase or theSST plume life. When analyzed in terms of the expected residencetime for SST exhausts in the lower stratosphere, these measures ofthe chemical efficiency and duration of the wake phase permit anassessment of the effects of inhomogeneous concentrationdistributions on the overall estimate of Oo depletion in thestratosphere.
Finally, the reader should be aware that novel and rather-s o phi s-tlc a-t ed— mode-ling-fee chnique s—hav e~be~en~ "employe d~in~the s eanalyses. In particular, coupled, second-order closure chemistryand diffusion models are used throughout. The models and theirlimitations are described in this report, but the reader interestedin their development is referred to refs. 4, 5, and 6 for thatinformation.
The Questions Posed
For the purposes of the DOT/CIAP evaluation we wish to addressthree related but specific questions:
1. During the Phase III wake period, is the chemical behaviorof the SST exhaust materials significantly different from theirbehavior after they are well-mixed in the stratospheric environment?
2. if the answer to 1. is "yes, " what is the nature andmagnitude of this effect(s), and how longXdoes it last?
3. Do the combinations of the nature, magnitude, and durationof the chemical behavior of SST exhausts during Phase III signifi-cantly alter estimates of the impact of ••SST fleet operations on thestratospheric environment? . .

Our primary objective here is to provide, within the limitsof present knowledge, time, and resources, best estimates of theanswers to questions 1. and 2. and, by comparison with large-scaleglobal modeling, draw inferences regarding the answers to the thirdquestion. A secondary objective is to provide estimates of thediffusive growth and chemical behavior of SST exhaust plumes untilthey have reached the dimensions of the global transport and chem-istry models. In this sense, these Phase III analyses serve assub-grid scale models for the global models.
'In order to make these results as specific as possible, wehave focussed on the apparently critical problem of the destructionof Oo by the NOX catalytic cycle as described by Johnston (ref. 3).The analytical models used do not admit simultaneous solutions fora large number of reactions (because of excessive computationalrequirements). Our simulation of the NO catalytic cycle is there-fore a simplified one which treats only the simultaneous diffusivemixing and reaction of 0^ with NO under the assumption of theimmediate restoration (and therefore conservation) of NO by thereaction of N02 with 0. Such an analytical system cannot, ofcourse, pretend to follow all of the factors which contribute tothe quasi-equilibrium concentrations of Oo in the lower strato-sphere. However, as shown later, the combined diffusion andsimplified chemical reaction models used here show that the NOXcatalytic cycle is completely dominant in controlling the localfate of Oo during the Phase III wake period under most if not allturbulent diffusion regimes to be expected in the lower strato-sphere .
The results presented here therefore appear to capture themajor part of the potential of SST exhausts for destruction ofenvironmental Oo .while these materials are still rather highlyconcentrated in^intact plumes. However, we hasten to add thatthese results must be tempered by a clear recognition of uncertain-ties which only further measurements and experience can reduce.We have attempted to estimate these uncertainties and their possibleeffects on the validity and interpretation of "the analyticalresults. For one thing, our knowledge of the turbulence structurein the lower stratosphere is still woefully inadequate. Foranother, the complexity of the chemistry, particularly the reac-tions involved in photochemical chains affecting Oo concentrations,still contain enough uncertainty to require sober and skepticalappraisal of any analytical results in which they are included.The present analyses are no exception.
However, with all of these caveats in place, it is still ourintention to present the results of our analyses as a contributionto that ultimate management responsibility, namely, to make deci-sions in the light of incomplete and frequently inaccurate informa-tion.
5

SYMBOLS
a constantA constant
A. Lagrangian scale length
b constantC. . concentration of ith chemical species
CQ concentration of NO just capable of destroying 0_pc at same rate as local production rate of 0~ -1
C.'Ct second-order concentration correlation between1 J ith and jth species
C|u' flux of ith species in jth direction
D diffusion component of difference between maximumand actual reaction rate in plume
E chemical efficiency defined by Eq. (62)
E* chemical efficiency of NO for destruction oflocally_ produced Op-defined Jby__Eq...._(.64_X
f. frequency distribution
F. . the jth surface average flux of ith species
g acceleration due to gravity
k-, , kp reaction rate constants
k , k eddy diffusivities
LD diffusion limitation = D/R*
LM mixedness limitation = M/R*
M mixedness component of total reaction rate
N Brunt-Vaisala frequency = ' '~
q square root of twice the turbulent kineticenergy .
R reaction rate over entire plume
R* maximum possible reaction rate
Re Reynolds number
Ri Richardson number
Ri critical Richardson number

R. correlation coefficient
constant; also used for vertical velocity gradient
S. source term for ith chemical species
„* sources or sinks of i which are not directlyi attributable to chemical reactions
t time
t, time required to dilute plume by 1CP
T duration of Phase III (Eq. (78)) or time betweenturbulence encounters (Eq. (55))
average absolute temperature
adiabatic temperature
temperature fluctuations
residence time of plume in lower stratosphere
longitudinal velocity
second-order correlation of velocity components
nondimensional representations of
w 'w' , u'w1 , u'T1 , w'T' , T'2 ,
defined by Eqs. (38)v lateral velocity
w vertical velocity
x longitudinal directiony lateral direction
y . z coordinates of Cft concentration isopleth"° C (Eq. (64)) PC
z vertical direction
(3 constant
e" average dissipation of turbulent kinetic energy(Eq. (55))
\ micro-scale length
A-,, Ap, AT scalar length scalesA2T' A2TT scalar length scalesA-p scalar length scales
v kinematic viscosity of fluid
4 dummy variable defined by Eq. (19)
a. standard deviation in ith direction
7

superscripts
subscripts
chem
col
e
1
max
o
v
a
P7, 6
1, 2
mean component
fluctuating components
depletion rate due to chemical reactions
vertical column through plume
environment
surface average over spherical shell (see Eq. (2))
maximum value
initial value, or reference to center of plume
volume average over spherical shell (see Eq. (2))
°3NO
chemical species other than 0_ and NO
species designation
The Implications of Wake -Phase Chemistryand Diffusion in the General Problem ofthe Environmental Impact of Fleet SST
Operations
At this point we may anticipate the results to be developed inthe next several sections and note that the major findings of thesestudies may be summarized as follows:
1. During the Phase III wake period the efficiency of SST-emitted NO for the destruction of environmentalsmall, and
is negligibly
2. The Phase III period can be expected to persist for anelapsed time of the order of weeks to months.
Both of these results depend upon the expectation that turbu-lent diffusion is weak in the largely stably stratified lowerstratosphere. The first result also depends upon simultaneouscalculations of the combined effects of diffusive mixing andchemical reactions. The low chemical efficiency of the NO-Ooreaction is directly attributable to the slow diffusive mixingbetween the NO plume and the surrounding Oo, and could not beproperly anticipated from decoupled solutions of the diffusion
8

equations and the chemical kinetic equations.
Interesting as these rather novel results are, however, theirimplications for the overall impact of SST operations on environ-mental Oo depend upon a comparison between the duration of thePhase III period and the expected total residence time for SSTexhaust materials in the lower stratosphere. Present estimates ofthis residence time range from a few months to more than a year,but none of these estimates appear to take into account theselective (route) injection of SST exhausts in the middle latitudesof the Northern Hemisphere. (This is the region of selectiveremoval of stratospheric air into the troposphere.) However, with-out anticipating the results of other analyses of total residencetime, we may note that the Phase III chemical inefficienciesconstitute a significant effect if the duration of Phase III is asignificant fraction of the expected total residence time. Forexample, if Phase III persists for one month and the expectedresidence time is three months, the estimate of the depletion ofOQ is reduced to one-half to one-third of previous estimates.Shorter durations of Phase III and/or longer residence times would,of course, reduce these effects to scientifically interesting, butoperationally insignificant considerations. At this point, we canonly note that neither of these numbers is known within a factorof two (or more) of their true values, and the Impact of thePhase III effect cannot be more precisely estimated until thissituation is corrected.
THE FRAME OF REFERENCE
In order to establish an appropriate frame of reference forthe analyses of the diffusion and chemistry of SST exhausts duringthe wake phase, we should first consider one of the broaderproblems to which CIAP must address itself. This may be stated as,"What are the changes in the global equilibrium amount of Oo, givena steady emission of NO from a fleet of SST's flying in the lowerstratosphere?" Let a and P denote Oo and NO, respectively, andC and CB be the 'local concentrations of these reactants at anyparticular time. Now consider a spherical shell of the atmosphere,surrounding the globe and defined by the spherical surfaces atheights z-, and z2 above the earth's surface. Then the balanceequations for a and p within this shell are
and

_d[CB],
dt
where [ ]y denotes a volume average over the spherical shelland [ ]j_ denotes a surface average over the shell at height i,k.]_ and k-2 are ^he reaction rate constants and Sa and Sg arethe source or production rates for a and P within the shellvolume. C^w1 and C^w' are, of course, the local vertical fluxesof a and f3 at the designated height. We now assume that theNOX catalytic cycle operates everywhere to conserve NO and there-fore the chemistry term in Equation (2) has a value of 0.
Now-consider the case when C™ and Cg are inhomogeneouslydistributed within the shell and [Ca]v
and- [Cp]v > tne volumeaverages of Ca and Cg , are constant in time (a steady stateassumption for the total amount of Oo and NO in the shell). Thenthe local concentrations at any time are defined by
C = [C 1 + C'a L ajv a
Then Equations (l) and (2) become
and
[SP]V
where F ,- = [C^w']j designates the jth surface average flux ofthe ith species. We now assume that all of the terms in Equations(6) and (7) are statistically stationary and time average them.Theen
and
10

3F = 0 = Fp2 - Fpl + [Sp]v (9)
Equation (9) simply states the equilibrium amount of NO in theshell is achieved when the average amount injected by the SST'sjust balances the net flux of NO out of the shell.
However, Equation (8) tells us_ that the equilibrium amount ofOo in the shell, as measured by '[Ca] , is determined by abalance of the net flux of Oo into or out of the shell, the localproduction of Oo, and the degree to which Oo and NO are mixedwithin the shell, as well as upon the equilibrium amount of NO inthe shell. Rewriting Equation (8), this balance is given by
where AP_ is the average net flux of Oo into or out of theshell. a ^
Despite the simplification of the chemistry involved in thederivation of Equation (10), this formulation does clearly revealthe mechanisms which must be considered jointly in determiningthe overall effect of injection of SST exhausts on the Oo balancein the lower stratosphere. In particular, it is clear we mustdetermine how any particular mode of emissions of these exhausts,as well as their amount, affect the vertical flux of Oo, AFa ,the degree of mixedness, C^CJ , and the local production of Oo,Sa , if the changes in the equilibrium amount of Oo in any particu-lar atmospheric layer are to be correctly evaluated.
We can note qualitatively (a quantitative treatment follows),that the net flux of Oo, AFa , depends upon the vertical gradientsof the_ concentration or Oo and the nature of the turbulent motions.If AFa is to be evaluated from first principles, we must have aknowledge of how the distribution of NO in the spherical shell hasaltered the gradients of the Oo distribution by chemical reaction.The mixedness term - k]_[CcltCA]v basically measures the degree towhich local fluctuations of the concentrations of 0^ and NO arecorrelated. As we shall see, this term is produced by the"folding " of anomalous amounts of Oo and NO without Intimate localmixing and is a function of the local gradients of the concentra-tions of Oo and NO and of the turbulence field. Estimates of themagnitude of this term therefore also require some knowledge ofthe distributions of Oo and NO throughout the shell and the turbu-lence fields acting on these distributions. This term can beignored only if we can demonstrate that [C^CJ]V « [Ca]v [Co]v ,a condition which is not obvious a_ priori, given the potential
11

for inhomogeneous mixing of Oo and NO described previously.
Since the wake phase of SST exhaust dispersion in the lowerstratosphere represents the maximum anomaly in NO concentration,an analysis of the balances of NO and 0^ concentrations in theseplumes, with accompanying determinations of the diffusive fluxes,diffusive mixing, and chemical reactions which produce thesebalances, provides the first assessment of these coupled effectsand how they might contribute to the global balance of Oo. Forthis purpose, we adopt a pseudo-Lagrangian frame of reference whichmoves with the mean motion of a plume segment. In this frame ofreference we have removed the large-scale motions of the plumesegment (which only control where the segment goes), and haveretained only the smaller scale motions, which control the diffu-sive transport and mixing of the plume segment with its environ-ment. In this frame we also correctly portray the chemicalreactions as a function of the local, time dependent, jointconcentrations of the reactants. The ensemble averages used inthis frame represent the mean and fluctuations over many repeti-tions of emissions of SST exhausts into turbulence fields whichare stochastically determinant. The result of this choice is thateach prediction represents an expected value, but is not necessar-ily appropriate to any single realization of these processes.Since the ultimate interest is in the integration of these resultsover a sizeable volume and time period, the use of expected valuetheory is entirely appropriate.
THE ANALYTICAL TOOLS - INVARIANT MODELSOF TURBULENCE, TURBULENT DIFFUSION, AND
INHOMOGENEOUS CHEMISTRY
Within the problem orientation and frame of referencedescribed in the previous sections, A.R.A.P. has undertaken theapplication of the invariant modeling techniques (developed overthe past several years by Donaldson and his colleagues) to theproblems of coupled diffusion and chemistry in SST wakes. Thesetechniques, and the turbulence, turbulent diffusion, and chemicalkinetics models which derive from them, have been described indetail in refs. 5 and 6, and the reader interested in such detailis referred to these reports.
By way of a general description, the invariant modelingtechniques depend upon the derivation of dynamical equations forboth the first and second-order moments of physical variableswhich enter into the governing equations for the physical systemunder study. In any nonlinear system (which is what we are deal-ing with in turbulence and chemical processes) the dynamical-equations for second-order moments generally involve third-order(and sometimes higher) moments of the physical variables and
12

therefore these equations are not "closed," i.e., we have moreunknowns than equations. At this point one has the option ofderiving the dynamical equations for the higher-order moments,but these, of course, produce still higher moments and do notprovide closure. In addition the number of equations which mustbe solved simultaneously proliferate quite markedly as one goesto higher and higher moments.
Donaldson's approach to this, closure problem was to establishrules of invariance for finding approximate values of the third-order moments in terms of the first- and second-order moments ofthe physical variables. In particular, the coefficients whichenter into the approximate functional relationships between thethird-order and the lower-order moments were to be invariant forany change of the coordinate system. In addition, the rules ofinvariance required that all tensor symmetries be preserved andthat all conservation laws be observed.
Invariant modeling is therefore a second-order closuretechnique, analogous to first-order closure techniques (in whichsecond-order moments are modeled as functions of first-ordermoments), but has the distinct advantage of retaining predictionequations for the second-order moments explicitly. Terms such asC^w' and C^CJ discussed in the previous section are now explicitvariables in the models and can be examined specifically in thesolutions of the models. These models are, of course, stillapproximate (as any model of nonlinear systems must be), and thecoefficients which enter into the closure relationships must stillbe evaluated empirically. The rule of invariance is particularlypowerful here since these coefficients may be evaluated in onecoordinate system and then be applied to another. (For an exampleof the power of this technique see ref. 8 where coefficientsderived from laboratory measurements were used to establish theMonin - Obukhov similarity functions for atmospheric boundarylayer flows.) However, as noted throughout this report, the valuesof these coefficients for lower stratospheric flow are not rigor-ously established, and the results of model calculations areuncertain within this degree of ignorance. Since this sameuncertainty afflicts all models, only appropriate measurements canovercome this handicap.
Finally, a distinct advantage of second-order closure modelsover mean-value (first-order closure) models is that the formerare inherently time dependent and can therefore be used to predictthe response of the modeled system to time dependent forcing func-tions. In nonsteady turbulence systems, of which there is someevidence the lower stratosphere is one, this property permitsconsistent analyses without grossly arbitrary assumptions regard-ing such parameters as the effective eddy diffusivity.
13

The General Diffusion and Chemistry Model
In approaching the problem of modeling the diffusion andchemical reaction of two chemical species a and p , we beginwith the equations for mass continuity of each species.
acu v w
a2c= v
a ao a
and
ac ac ac ac 'P 'P + s,
(11)
(12)
where u, v, and w are the instantaneous components of motionalong x, y, and z, respectively, vo is the kinematic viscosityof the fluid, and S^ and Sp are any local sources or sinks ofthe a and p species, including chemical alteration. Weseparate out the chemical alteration part of SQ and Sp bynoting from the reaction
a + P —»• 7 + 6 (13)
and writing the chemical kinetics equations
chem- - kl°aCp
and
(15)
chem(16)
Then, if we follow only a and p , we have
*S = Sa a chem
(17)
and

where S now includes all sources and sinks not^ attributable tothe chemical alteration of a and £' according to Equation (13)
We now assume that an ensemble average of the physical vari-ables In the frame of reference just described Is statisticallystationary and we can write any of these variables in the form
e = T + (19)
where £ = u, v w Ca, and C Substituting Equations (17), (l8)and (19) into Equations (ll) and (12), time averaging and rearrang-ing terms gives
- k
and
_ dc • _ ac- _ ac-
For convenience we now assume a statistically steady . state, so thatd/dt = 0 , and a coordinate systejn wi^th x oriented along thedirection of mean flow so that v = w = 0 . With these assumptionswe have two equations and the following unknowns :
15

First-order: .-C and
Second-order: CMu ' , CMv ' , CMw ' , C'u ' , C 'v ' , C^w ' and
— y •%•if u , v0 , k-]_ , k2 , Sa ,
and S6 can tie independently specified.Since we have seven more unknowns than equations (all second-orderunknowns) we need seven equations for these second-order correla-tions. However, Equations (20) and (21) are the ones we wish tosolve for conditions appropriate to the Phase III period of SSTwakes. ,
The Sub-Models
In developing the prediction system which permits approximatesolutions of Equations (20) and (21) three invariant sub-modelshave been constructed. The first, the turbulence sub-model,provides the prediction of the local values of turbulent motions,2 2~ 2 2u1 , v1 , and w1 and temperature fluctuations, T1 , and their
various moments, e.g., w'T' , given the input values for theaverage wind velocity and the average temperature as a function ofheight z . This sub-model is described in some detail in the nextsection.
The second sub-model accepts the mean and turbulent values ofthe fields of motion and temperature generated by the first sub-model, combines these inputs with the initial distribution of aconservative tracer (gaseous or aerosol) material and predicts thethree-dimensional diffusion of the tracer material in this field ofturbulence. (These are essentially Evolutions of Equations. (20) or(21) without the chemistry term - k(CaCp + C^C^) .) The inputdistribution of the concentration of the tracer material may be anyarbitrary source geometry (within the constraints on spatial slopesand curvatures imposed by the numerical solution techniques). Forany individual SST plume this model can therefore be started at anystage of the plume growth if the distribution of tracer concentra-tion at that stage is known. This model may be used to predict thegrowth and dilution of chemically nonreactive exhaust materials, butits primary utility in the present application has been through itscoupling with the chemistry sub-model.
The chemistry sub-model, which was partially developed underCIAP-related programs (see ref. 6), is basically designed topredict chemical reaction rates for a binary, isothermal reactionsystem in which the reactants are inhomogeneously distributed.The sub-model includes only the chemical kinetics of this system,
16

i.e., any mixing processes are excluded. In this form, the modelaccepts any appropriate combination of the means and second-ordercorrelations of the concentrations of the reactants and predictsthe reaction rates and the depletion of each species until thereaction proceeds to exhaustion of either or both of the reactantsin each elemental volume of the reactor. Since very few, if any,data on chemical reactions at the time and space resolutionrequired are available, this sub-model has been validated againstexact solutions of the chemical kinetics equations. This procedurewas particularly Important in the development and testing of theclosure approximations for the third-order moments of the concentra-tion fluctuations.
Probably the most valuable aspect of this sub-model developmenthas been a more rigorous definition of the circumstances under whichthe effects of inhomogeneous mixing of reactants significantlyretards or enhances their reaction rate. These conditions aredescribed in ref. 7, but may be summarized by the observation thatreaction rates can depart drastically from those predicted by meanvalue chemical kinetics when the product of the variance-to-mean-squared ratios for the reactants1 concentrations exceed one. Thissituation is readily realized when reactants are emitted atrelatively high concentrations from multiple sources, which is, ofcourse, the case for multiple SST flights.
The Coupled Invariant Chemistryand Diffusion Model
With the successful development of the sub-models describedabove, it has been possible to combine them into an initial versionof a coupled turbulent diffusion and inhomogeneous chemistry model.The presently operating version of the coupled model and itsdevelopment are described in ref. 6. For several reasons, theprimary one being sheer computational complexity, the initial modelwas developed for the following conditions:
1. Horizontal -straight-line flow with u as a function ofheight only.
2. Horizontally homogeneous turbulence.
3. No coupling between reactant densities or reactions andthe turbulence or flow fields. (Density and thermal effects arenegligible.)
4. Binary and isothermal chemical reactions.
5. Two-dimensional ( z and t ) coupled diffusion and chemis-try. (Lateral and longitudinal diffusion negligible in comparisonwith the vertical component.)
17

Although these conditions may appear restrictive, theycapture a large part of the ;realism of the SST wake features whichwe wish to analyze and, even though simplified, they do permit afirst critical analysis of the interaction of diffusion and chemis-try in a turbulent, nonhomogeneous system.
The first three of the above conditions permit us to decouplethe turbulence sub-model, since there is no feedback from eitherthe presence of the reactants or their chemical reaction into thefield of turbulence. This is not the case for the turbulentdiffusion and chemistry sub-models, however, since in generalthere are intimate interactions between the diffusive mixing andtransport of the reactants.and their chemical reaction rates. Aswill be shown later, several of the important results of thisinteraction cannot be captured by decoupled solutions of thediffusion and chemistry equations. The coupled diffusion andchemistry model constitutes the fourth invariant sub-model, sub-model In. the sense that 'it depends upon the turbulence sub-modelas one of its inputs.
In addition to the turbulence field Input, the diffusion/chemistry model requires an initial specification of the spatial(vertical) distributions of the concentration of the reactants,any initial second-order moments of these concentrations, and thereaction rate constants. Since the model calculates the consist-ent set of second-order moments for both diffusion and chemicalreactions out of the production, diffusion, and dissipation ratesfor these quantities, they are normally set equal to zero Initiallyand their time history is then reckoned from the time the modelbrings them into equilibrium with all of the input conditions.From that time on the basic outputs of the model are the timehistories of the distributions of the reactants and the separaterates of diffusion and chemical depletion which produce thesedistributions. These outputs may be manipulated to produce anymeasure of these processes desired, e.g., the central value andvariance of the concentration distributions, total chemical deple-tion, local diffusive flux rates, etc.
ESTIMATES OF DIFFUSIVE TURBULENCE IN THELOWER STRATOSPHERE '. '
"Any logical- assessment "of ~ 'the' "behavior ~of ~SST exhaust plumesin the lower stratosphere must begin with a specification of thecharacteristics of the fields of turbulence in which these plumeswill be embedded. As a minimum, these turbulent motions willcontrol the rate at which exhaust products are diluted by andmingle with the environmental constituents and are therefore primeagents in determining the fate of these materials. Because of
18

the fragmentary data on turbulence in the lower stratosphere andin view of its importance to any attempt to model the diffusion ofmaterials, we have conducted an extensive study of the possiblemodes of turbulent motions, including continuous as well asdiscontinuous turbulence generation in the lower stratosphere;these results are reported extensively in this section, as aconvenience to other modelers who may not be familiar with thesedata.
The evidence regarding turbulence in the lower stratosphere isnot only fragmentary; it is also somewhat contradictory. By farthe most extensive measurements have been made from aircraft flyingin the appropriate altitude zone fcf. ref. 9). From literallythousands of hours of flight time (using only instrumented flightobservations and ignoring pilot reports) it appears detectableturbulence occurs in this height zone about one to five per centof the time, the lower frequency associating with ocean and flat-land surfaces and the higher frequency with tall mountain areas.These data suggest that a very large fraction of the lower strato-sphere is not turbulent. However, this inference must be drawnwith caution, since the lower limit of detectability of turbulencefor the instrumentation used on these flights was about 15 cm/sec(rms gust velocities). Turbulence levels below this value arestill quite effective as diffusion agents.
Somewhat supportive to the concept of very small turbulentmotions (and even laminar flow) in the lower stratosphere are thepreponderance of upper air soundings which show combinations ofwind shear and temperature lapse rates much in excess of thecritical Richardson number. (An example is provided later.) Thesedata are now extensive for most of the globe and at least requirethe postulation of turbulence generation mechanisms other than •steady wind shear and buoyancy if a continuous level of small-scaleturbulence is to be sustained in the lower stratosphere.
Offsetting the aircraft and sounding data, however, is agrowing body of observations of the motions and at least visualgrowth of visible smoke puffs and trails (cf. refs. 10 and 11).Although still far less extensive than aircraft and sounding data(and perhaps somewhat biased by analytic selectivity), these visualsmoke observations almost universally indicate small-scale shearsand diffusion, and not laminar flow.
Since direct observations of the turbulence are apparentlynot yet adequate to a decision as to how extensive and intensivestratospheric turbulence is, we have utilized the invariant turbu-lence model to predict turbulence levels and decay for the wholerange of Richardson numberswhich might occur, and have theninvestigated the effects of both continuous and discontinuousturbulence on the behavior of SST exhaust plumes. Perhaps not toosurprisingly the net effects are not very different; the endresults are arrived at in about the same length of time, although
19

by very different time histories.
The Turbulence Model
If we consider the motion in the stratosphere to be governedby the equations for an incompressible, two-dimensional, turbulentfree shear layer, then the equations which define the turbulentflow field may be written in the following form (ref. 5). Inthese equations, u is the free stream velocity in the xdirection and z is the direction normal to x in which largegradients in u exist.
Turbulent Energy Components (u1 , v
al
Re
(23)
20

2 x N-21 \ v d
o
ReX'
D
Reynolds Stress (u'w)
A u u'W + a- u'T' - yKp- u'W
o ReX
2v(l - p) aRe u 'w'
A;(25)
Heat Fluxes (u 'T ' , w'T')
_
Re Au 'TT (26)
21

a35-
+ f- T<o
(27)
Temperature Variance (T1 )
( A q - TV A2TTq
2vS TRe
'2 (28)
The micro-scale length (X) is related to the macro-scalelength (A-) by the relation
A.X = 1-
v/a + b Re(29)
If we specify the vertical shear (du/dz) and stability(dT~/dz) , then Equations' (22) to (28) can be solved simultaneouslyfor the turbulence field at any time t . The model parameterswhich provide the best agreement with data for the wide range offlow applications (jets, wakes, boundary layers, vortices)presently under investigation at A.R.A.P. are:
a
b
eA
S
2.5
0.125
0.
0.75
1.8
22

= - 0.3A1
A = a parameter for thisinvestigation
Analyses of Steady and Continuous Turbulencein the Stratosphere
If the wind shear and stability _in the stratosphere are suchthat the Richardson number (Ri = g(dT/dz )/TQ(du/dz)
2) is lessthan the critical value*, then Equations (22) to (2o) yield asteady-state solution for the turbulent flow field. In thissection, we examine the effects of 1) wind shear, 2) stability,3) macro -length scale, 4) Initial turbulent energy and 5) Initialmomentum and energy fluxes on the steady-state turbulent fluctua-tions and on the time required to reach steady state. First, weillustrate some typical results using the numerical model describedby Equations (22) to (28) and then demonstrate the feasibility ofusing a simplified model to estimate the equilibrium turbulencefield without resorting to the complete set of partial differen-tial equations.
For purposes of this analysis, we will assume that the shearlayer has a height of 2 km and that the scale length, AT , isconstant with time. Typical results illustrating the effects ofwind shear, stability and scale length are shown in Figs. 1 to 3-For each calculation, the initial turbulent energy (| q£ ) is0.4 m2/sec2 and the turbulence is isotropic. In addition, theinitial Reynolds stress and heat fluxes are 0. Although theinitial profile assumptions, by definition, have no effect on thesteady-state solutions, their influence on the transient behaviorof the turbulence is not known a priori. Figures 4 and 5 will beused to demonstrate these effects.
Figure 1 Illustrates the effect of wind shear on the verticalvelocity fluctuations for fixed stability (dT/dz = 1 deg/km) andscale length (A]_ •= 15 m) . The strongly-sheared layer (s = 0.05sec~l) corresponds to a Richardson number of 0.02; the leastsheared layer s = .009 sec~l corresponds to the criticalRichardson number of 0.55 and, therefore, does not yield a steady-state solution with time .
It can be demonstrated that the critical Richardson number is0.55 for the model parameters given in the previous sectionrather than the generally accepted value of 0.25.
.v y
A later section deals with the solution when Ri > Ricrj_t
23

u0)in
o>E
IOJ
0OC0)
CDO
-PCtf
a QJ0 i— I
CL
CD-P
O CU
CD-P
03•H
aGH
CH rH -P 03O 03
OCQ -H
CM
CDfn
M•H
CQ
O fn•H CD-P >
G CDOJ CQ±> a.G aJ
COzg
z<°?(E O<3UJ -Ixu.w >Qt-
U. UJ0>
o<UJ U
UJ
^ a:
vi -^
oo '5
CQ -P 03G CDO rH XI
•H 03 CQ-P O03 -H ""drH -P GS ^ -HO CD ?rH >0) GO <M O
orH >>CD CD -Pt3 O iHO G CQS CD G
T3 CD-P G -P
CD Ga-HG03CD
03CDO
> CD GG-.G CDM -P rH.
rH
0
•HPH

EFFECT OF SCALE LENGTH ONVERTICAL VELOCITY FLUCTUATIONS
___200m_(4Km loyer)
V ZQOm
KTime to reach with5% of iteady state
Time (sec)
Figure 3- The dependence of vertical turbulenceIntensity on the macro-scale length,A, .
The strong influence of wind shear on the velocity fluctua-tions is evident. A five-fold decrease in shear from .05 to .01sec~l results in a decrease in turbulent energy of nearly twoorders of magnitude.
The effect of wind shear on the remaining turbulent fluctua-tions is summarized in Table 1.
25

TABLE 1
Effect of Wind Shear on Turbulent Fluctuations
dT/dz = 1 deg/km , Aj.'= 15 m
Turbulent. .Fluctuation
u'2 (m2/sec2)— — T^ o pv' (m /sec ) .
P p pw' (m /sec )
u'w' (m"/sec )
THY"" (m-°C/sec)
w'T1 (m-°C/sec)
^ (°c*). • . ..':
Rl
. Wind Shear (sec"1).05
• .53
...26.
.25
-.18
.82 x 10~2
-.47 x 10~2
.31 x 10"3
..02
.02
. .58 x 10"1
.27 x 10"1
.23 x 10'1
-.17.x 10'1
.21 x 10~2
-.92 x 10"3
.19 x 10~3
. 11
.01
.24 x 10"2
.10 x 10"2
.73 x'lO"3
-.29 x 10"3
.14 x 10"3
-.15 x 10"
.15 x 10"
.45
Note that there are significant changes for all .of the fluctuations,although the velocity fluctuations are more strongly influenced bythe wind shear than are the temperature fluctuations. Also note thatin a shear flow, for conditions of neutral .stability, the componentsof the turbulent kinetic energy are given by v '2 - w'2 - i u«'2 andthis relationship becomes more anisotropic with decreasing shear.
The dashed curve superimposed on Fig. 1 -shows the timerequired to reach within 5$ of the steady-state value. Steady-state is achieved within 10 minutes for the strongly-sheared layer,and within approximately 4.5 hours for s =. .01 sec'1 . For shearsbetween .01 sec"1 and .009 sec"1, the decay time grows exponent-ially to infinity. That is to say, there is no steady-statesolution for a wind shear of .009 sec"1 (when the temperaturegradient is 1 deg/km).
Figure 2 illustrates the effect of stability on the verticalvelocity fluctuations. Stable potential temperature gradientsbetween 0(Ri = 0) and 0.0003 (Ri = 0.55) are shown for fixedwind shear (s = .005 sec"1) and scale length (A]_ = 15 m ) . Itis evident that increased stability results in a significantreduction of the steady-state turbulent energy. Changes in theother turbulent fluctuations are summarized in Table 2.
26

TABLE 2
Effect of Stability on Turbulent Fluctuationsdu/dz = .005 sec'1 , A^_ = 15 m
TurbulentFluctuation
u1 (m /sec )P p p
v ' (m /sec )P 2 ?
w1 (m /sec )
u'w1 (m /sec )
u'T' (m-°C/sec)
vTiT"" (m-°C/sec)
^ (?C2)
Ri
Stability (deg/m)0
.56 x 10"2
.28 x 10"2
.28 x 10"2
-.20 x 10~2
0
0
0
0
.0001
.27 x 10"2
.12 x 10"2
.10 x 10~2
-.70 x 10~3
.38 x 10
-.30 x 10~
.12 x 10"5
.18
.0002
.12 x 10"2
.51 x 10"3
.37 x 10~3
-.20 x 10"3
.28 x 10"
-.48 x 10"5
.14 x 10~5
.36
Although the Richardson number variation is similar for Tables 1and 2, the wind shear has a much larger effect on the turbulentflow field than does the stability. For example, the Reynoldsstress (u'w1) has decreased by a factor of ten due to stabilityand by a factor of 1000 due to wind shear. This comparisonsuggests that wind shear is the dominant parameter for the turbu-lent stratosphere.
One other point should be noted in Table 2, namely, theincreasing anlsotropy with increasing stability. For theneutral stratosphere (dT*/dz = 0), v' = w' =
-= -
~u for
the more stable stratosphere (dT/dz = ,0003),w' = .31 u1 andp P
v1 = 1.4 w1 . In essence, the stability suppresses thevertical velocity fluctuations.
Stability has approximately the same effect on the time toreach steady-state as does wind shear. The dashed curve onFig. 2 shows that the equilibration time is between 1 and 4 hoursand increasing with stability.
The computations described above were based on a constantscale length of 15 m. Many investigations, including our owncurrent estimates, indicate that the scale is probably of the
27

order of 100-200 meters or more. If this is indeed the case, thenthe turbulent fluctuations can be considerably higher than for the15 m scale length.
In order to illustrate the effect of scale length, we haverecomputed the turbulent flow field for one of the above cases(i.e., du/dz = .01 sec"1 , dT/dz = .001 deg/m , and Ri = .45)with scale lengths of 50, 100, and 200 m. The results are illus-trated in Pig. 3.
Before discussing these results, we should note two aspects ofthis figure. First,., two curves are presented for the 200 m case.The solid line is for a 2 km layer, which is the thickness usedfor the smaller scale lengths. The broken-dashed line is for a4 km layer. It was found that the 2 km thickness suppressed theturbulent fluctuations for scale lengths in excess of 100 mbecause relatively steep gradients of the turbulent fluctuationsare established in order to satisfy the zero turbulence boundarycondition. This increases diffusion from the center of the layerand, hence, lowers turbulent fluctuations. Since these decreasesare not the result of scale length, 'we decided to increase thelayer thickness to 4 km. For this thickness, diffusion from thecenter of the layer is relatively unaffected by the boundaryconditions. Therefore, the difference between the dashed curve andthe three lower curves is solely the result of varying the scalelength. In essence, one may think of Fig. 3 as showing the effectof scale length for a 4 km layer since the 15, 50 and 100 m curvesare unchanged for the thicker layer. We will use the 4 km resultsin the following discussion.
The second point to note is that damped oscillations occur forthe first 15 minutes as the momentum and energy fluxes (which areinitially zero) seek to adjust to the turbulent energies. Suchoscillations are not numerical anomalies but rather an accuraterepresentation of the physical process which would occur subsequentto the assumed initial conditions.
The most important point to be gleaned from Fig. 3 is that thevelocity fluctuations are proportional to the square of the scalelength. This is not too surprising in view of the form of Eqs. (22)to (28). Steady-state represents an unchanging balance of turbu-lent production, diffusion and dissipation. The dissipation isinversely proportional to Re«\2 which, for large Reynolds number,is proportional to A^ . Thus, larger A means less dissipationand,"hence, more turbulence. Our results show that since theturbulence is dominated by the dissipation term, the diffusion termsare relatively unimportant for the steady-state solution. We willreturn to this point at the end of this section when we discusssuperequilibrium.
28

The scaling law is not limited to velocity fluctuations only.Table 3 summarizes the effect of scale length on all the turbulentfluctuations. Without exception, the fluctuations are proportionalto A2 .
TABLE 3Effect of Scale Length on Turbulent Fluctuations
du/dz = .01 sec" dT/dz = 1 deg/km
TurbulentFluctuationp p p
u1 (m /sec )p~ P Pv1 (m /sec )p p p
w' (m /sec )p o
u'w ' (m /sec )
u'T' (m-°C/sec
w'T' (m-0C/sec)
72 (QC2)
Scale Length (AI) m
15
.24 x 10~2
.10 x 10~2
.73 x 10 ~3
-.29 x 10"3
.14 x 10~3
-.15 x 10~
.15 x 10"4
50
.26 x 10 "1
.11 x 10'1
.82 x 10~2
-.32 x 10"2
.15 x 10~2
-.16 x 10"3
.17 x 10~3
100
.10
.44 x 10'1
.31 x 10"1
-.12 x 10'1
.59 x 10~2
-.63 x 10~3
.66 x 10"3
200
.41
.18
.12
-.49 x 10'1
.23 x 10""1
-.25 x 10~2
.26 x 10~2
The final point to note,from Fig. 3 is that the scale lengthhas a minor influence on the time required to reach steady state.Equilibration occurs in less than 4 hours.
Each of the computations described above is based on the sameinitial conditions. In particular, the initial turbulent kineticenergy is 0.4 m2/sec2, the turbulence is isotropic and the momentumand heat fluxes are zero. In order to illustrate the effect ofinitial conditions on the turbulence, we varied both the initialkinetic .energy and initial fluxes.
Figure 4 illustrates the transient behavior of wr forthree different energy levels which vary over a span of two ordersof magnitude. In each Instance, the identical steady-statesolution is reached in approximately 4 hours. During the first4 hours, however, the transient adjustment Is strongly influencedby the initial energy. The highly energetic layer decays smoothlyto the equilibrium level, while the least energetic layer under-goes rapid readjustment in the first 10 seconds as the Reynoldsstresses are generated and then decays most rapidly to theequilibrium state.
29

EFFECT OF INITIAL ENERGY LEVEL ONVERTICAL VELOCITY FLUCTUATIONS
f'.OIsec"
Initial profiles are isotrapicwith no momentum or heat fluxes
I . I
Time (sec)
Figure 4. The dependence of vertical turbulenceintensity upon initial conditions chosenfor Invariant model simulations.
- Cl —
10
EFFECT OF INITIAL TURBULENCE ONVELOCITY FLUCTUATIONS 8 REYNOLDS STRESS
4i-*.OI sec"1
A =IOOm
qz(0) = 0.8 m2/sec2
Initial turbulence
No momentum or heat flux-— Momentum & heat flux based on
Ri = -OI (unstable layer, initially)I I
iou 10' 10' 10'Time (sec)
Figure 5. Dependence of "vertical turbulence andshear stress on initial conditionschosen for shear stress and verticalheat flux.
30

In Fig. 5 we Illustrate the effect of Initial momentum and
heat fluxes on the transient behavior of both .w ' and theReynolds stress u 'w ' . The solid curves are for no initialmomentum or heat flux. The initial fluxes for the~~3ashed curvesare based on' the equilibrium solution for a Richardson number of- 0.1 i.e., for an initially unstable shear layer. Steady stateis reached in about 4 hours for both cases.
Superequilibrium
If one is not concerned with the transient behavior of turbu-lence in the stratosphere and requires only the equilibrium turbu-lent flow field, then Eqs. (22) to (28) can be reduced to a set ofseven simultaneous algebraic equations by using the followingthree assumptions:
1. All correlations are in local equilibrium and, thereforeD/Dt = 0 .
2. The diffusive terms are negligible and may be omitted.
3. The Reynolds number is large and, therefore, viscous termscan be neglected.
We refer to the resulting equations 'as the "superequilibrium "equations and summarize them below.
0 =•- 2 TTT¥T - _ (1 >• 2bp) u' + _ [i - 2b(l - p)] (30)
0 = - S_ (1 .+ 2bp) v'2 + _9_ [1 - 2b(l -
.1 ^ 1
P n3-A- v-. - -»K/ w'^ + L_ [1 - 2b(l - P)] (32)**-T • J-**n1 1
(33)
(34)
31

0 = - w'2 -|^ + i- T '2 - -3- w 'T '•3z TQ AI
(35)
0 = - 2 T'2 (36)
In the above equations, we have utilized assumption 3 to rewriteEq. (29) as • *
X =a + b
(37)
If we now introduce the following definitions into Eqs. (30)to (35)
N- \2
N- \ 2
vrr x 2
w'T« = WTA:2
T ' = TTA:1 \"3i" /
2 2 2q = u1 + v ' + W ' (38)
then we can summarize the system of equations in the followingcompact form.

Q(l + 2bp)UU = - [1 - 2b(l - p)] - 2UW (39)
Q
Q(l + 2bp)W = |- [1 - 2b(l - P)] (40)
2Q(l + 2bp)WW = |- [1 - 2b(l - p)] + 2Ri . WT (4l)
Q(l + 2bp)UW = - WW + Ri . UT (42)
Q • A . UT = - UW - WT (43)
Q • A • WT = - WW + Rl • TT (44)
Q . b . g . TT = - WT (45)
In these equations, Ri Is the Richardson number
R,R1 =
Therefore, we have seven algebraic equations which are a functionof Rl and the model parameters b, p, A and S . The solutionsof the equations for values of the model parameters summarizedpreviously are shown In Pigs. 6 to 9. Results are shown for bothstable (positive Rl ) and unstable (negative Rl ) environments.The equilibrium turbulence Is zero for Ri > 0.55 , i'.e., theequilibrium flow field is laminar.
We can demonstrate the accuracy of superequilibrium theory byrecomputing the effects of wind shear on the correlations. We.consider a temperature gradient of 1 deg/km and a scale length of15 m, conditions which correspond to the calculations summarizedin Fig. 1 and Table 1. Superequilibrium results are shown by thesolid lines in Pigs. 10 and 11. These figures graphically illus-trate the strong dependence of the correlations on the wind shear.
The symbols on Pigs. 10 and 11 are the data from Table 1 whichwere obtained using the complete invariant model. The accuracy ofsuperequilibrium is readily apparent. Therefore, if the localRi < Rlcrjt > then superequilibrium can be used to determine theturbulent flow field, when the local Rl is greater than RiCrit>the crucial question is,"How fast does the turbulence decay to alaminar state?" Superequilibrium cannot help us and we must resortto the complete system of equations.
33

Superequilibrium7* 72 72
A =0.75b=O.I250--0S=l.8
-.8 -.6
Figure 6. Superequilibrium solutions forthe
turbulent kinetic energies, u1 ,2 2v ' , and w ' .

k,QQ 8 - Superequilibrium
q«
A«0.75b «O.I25*«0S«l.8
-.6 -.4 -.2 0
Ri
Figure 7. Superequilibrium solutions for totalturbulent kinetic energy,q = u' + V + W .
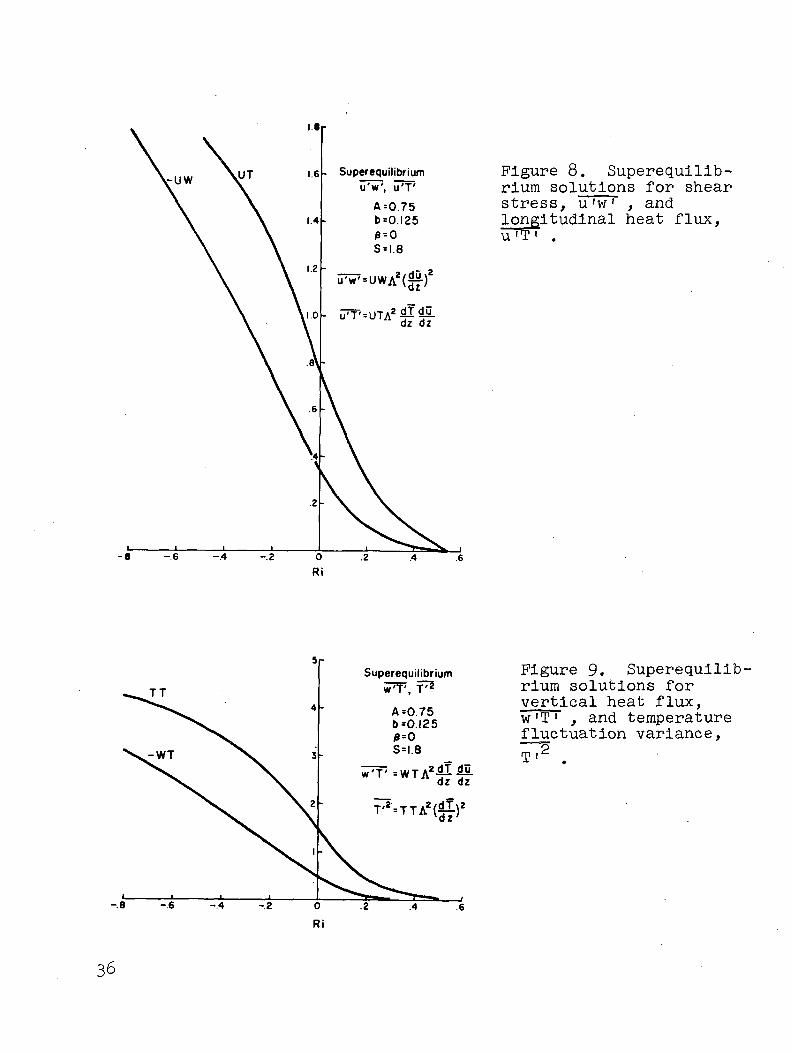
I 8r
. Superequilibrium Figure 8. Superequilib-rium solutions for shearstress, u 'w ' , andlongitudinal heat flux,u'T' .
5r
-.8 -.6 -.4 -.2 0
Ri
Superequilibriumw7!7, f75
A=0.75b=0.!25/j=0
.2 .6
Figure 9. Superequilib-rium solutions forvertical heat flux,w'T' , and temperaturefluctuation variance,

10
10-'-
EQUILIBRIUM TURBULENT ENERGIESo
jy = l deg/Km
— Superequilibrium
o Invariant model
10" ID' 10"
Figure 10. Equilibrium turbulent energies ascalculated from full model and fromSuperequilibrium approximations andfor a range of wind shear conditions.
37

10
10
10
10'
EQUILIBRIUM TURBULENT FLUXES
yj- = l deg/Km
A, =15 m
Superequilibrium
o Invariant model
10" 10'
*0/*z (sec"1)10"
Figure 11. Equilibrium turbulent fluxes of heatand momentum for same conditionsused in Figure 10.
38

Analyses of the Decay of Turbulence when Ri > RinL/
In an effort to estimate the Richardson number in the strato-sphere, we have, computed the wind shear and temperature gradientin the 16 to 26 km altitude interval using wind speed and tempera-ture measurements provided by the United States Weather Bureau.Figure 12 shows the results for one day; the data are based onNorthern Hemisphere Data Tabulations - May 25, 1963. The figurecontains 132 data points for approximately two dozen independentmeasurements in the continental United States, Alaska, and shipsin the Atlantic.
The most significant point to note is that 99$ of the dataare for a Richardson number greater than ten, a value considerablyin excess of the critical value. In addition, 90$ of the pointslie in the stable regime (df/dz > 0) . Admittedly, these dataare for one day only. However, they do suggest that, for the mostpart, the atmosphere is laminar at SST cruise altitudes.
If the stratosphere is Indeed laminar, then how rapidly doturbulent bursts decay? And, does the decay rate vary with windshear, stability, scale length or initial energy level? Thefollowing analyses attempt to answer these questions.
In Fig. 13 we show the turbulent energy decay for three scalelengths. The wind shear (.005 sec"1) and potential temperaturegradient (1 deg/km) are such that the Richardson number (1.8) isgreater than the critical value.
Several points should be noted. First, the decay rateeventually reaches a constant value (the power law exponent isapproximately - 1.8) which is independent of scale length.Secondly, in the constant decay rate region, the curves aredisplaced by a time proportional to -A-j_ . Finally, and perhapsmost significantly, the turbulent energy decays to less than \%of its initial value (q2(t) = .009 m2/sec2) within 15 minutes to3 hours.
The direct scaling of the decay curve with A]_ suggests thatproper normalization of the time might yield universal decay curvesIn Fig. 14 we have redrawn the data with the Independent variablebeing qo t/A]_ . With these variables, the decay curves virtuallycoalesce.
39

STRATOSPHERE
VELOCITY a TEMPERATURE GRADIENTS
Based en Northern Hemisphere data tabulation May 25, !963
o 109 Pit in continental U.S. and Alaska
23 Pti for »hip» in the AtlanticFigure 12. Calculatedvalues of Ri as derivedfrom one day 's observa-tions of wind and tempera-ture between 18 and 2.6 kmaltitude over North Americaand the North Atlantic.
-TURBULENT ENERGY DECAY
^-=0.005 sec'102
4j = l deq/Km
qz(0)=09 m*/secz
10'
Figure 13. Calculatedturbulent energy decayhistories for Ri = 1.8.
Time (sec)

10'
10"
o<v~
o-*v
o-
10',-z
10.-3
IOU
TURBULENT ENERGY DECAY(NONDIMENSIONALIZED TIME)
A,=15
A A|=50m
O~O A i =100 m
4^=0.005 sec"oz
~ = \ deg/Km
q(0)=0.8 m/sec
10'q(0)t/A,
10*
Figure 14. Tizrbulent decay histories normalizedby qQt/A1 .

How universal is this decay curve? To answer this question,we examine the effect of wind shear and stability on turbulenceenergy decay. Figure 15 shows that the effect of wind shear onthe decay rate is insignificant. A shear decrease of one order ofmagnitude decreases the time required to reach \% of the initialenergy approximately 2 minutes. A similar effect can be noted inPig. 16 for an order of magnitude change in the temperaturegradient. We conclude that shear and stability have a second orderinfluence on the turbulence energy decay rate when Ri > R
Having considered the effects of shear and stability, we cannow examine the effect of the initial turbulence profile on theturbulent energy decay rate. In Fig. 17 we illustrate the effectof initial turbulent energy. It is evident that the normalizedcurves virtually coincide even for a two order-of -magnitude changein initial energy. However, because qo appears in the normalizedvariables, it is not immediately obvious how the turbulence resi-dence time varies .with initial energy level. If, for purposes ofdiscussion, we arbitrarily set a detectability limit on q2 of.06 m^/sec , then the turbulence residence time is 20 minutes forq2 = < 6 m^/secS and 30 minutes for q2 = 60 m^/sec. . jn otherwords, as the time required to reach the limit of detectabilityincreases, then the initial kinetic energy has less influence onthe residence time.
In Fig. 18 we illustrate the effect of the initial momentumand heat fluxes on the decay rate. Of course, there are aninfinite number of possible initial turbulence states. We havechosen to illustrate two. We define one state as an equilibriumprofile because the initial conditions are based on the equilibriumstate for Ri = 0.2 and qo = 10 m/sec . The nonequilibrium curveis based on the same initial energy distribution but the initial
fluxes (u 'T ', w 'T ', u 'w ' and T' ) are an order-of -magnitudelarger. Again, the universal nature of the decay curve is evident.
Having discussed the results of computations using thecomplete invariant model, we can simplify matters considerably ifwe assume that the turbulent energy decay rate is primarilygoverned by the dissipation term in the equation for q2 (obtainedby summing Eqs. (22), (23) and (24)). Then we have

ocr
°ooo
(0}zb/U)2b
CM
'o
-PPJ0)
,0 O
-p ra
<<H O raO l-i ra
cdra t>> rHC cd oO o•H CU >ij "* r^ |
cd -H^~I ^^ Pi
3 bO-HO ?H rQrH 0) Cdcd G -Po Ot ra
0)?H^JbO•H
OUJo
<rUJ
UJ
zUJ_1CDtE
°0
egO
go-
IM
'o
Oo
-pa0)
3-P-P •
f-i ra«H o ao<^ o
•Hra >J-PS cd -HO O T)•H 0) £•p -d ocd o
o ?H cdtH Q) <Ucd d ^4o a> CQ
0)

IMo
otr
°0
°0
(0) 2b/(») 2b
in'o
CQ<u
S2
•H -P -P-P 05
. Q) . .G S•H O !»
S 05CH OO 13 <D
•C!-PO
o5(UO
05 C!0) Q>
-P
00iH
0)
bO
s!
oUJo
UJ .2
UJ_jCD
CMO
O"a-
°0
oo
01
'o
-P 03G <U0) 4JrH 05
3 05-P O
0)
05•H G-P O•HG 0)•H 3
rH<4H o5O >
-P >3O bO(U fn
<M 0)
W Q)
0)
^hO•H

If A-. = constant (the case we have considered thus far),then Eq. (47) can be integrated to yield
(48)1 +
where b has the value 0.125. In Fig. 19 the decay rate based onEq. (48) is compared to a typical decay curve based on the completeinvariant model. We note that Eq. (48) gives a satisfactoryprediction of the decay rate. This is not too surprising since wepostulated that the dissipation term was the dominant factor inthe decay rate. However, we can get more useful information fromEq. (48). In particular, as t becomes large Eq. (48) goes tothe limit
A-,(49)
Thus, q(t) is directly proportional to An (as we showed inFig. 13) and does not depend on shear, stability or the initialconditions.
The Problem.of Scale Length
Although Eq. (47) shows the influence of scale length onturbulent decay, it sheds little light on the appropriate scalelength to use. We have therefore, begun to investigate the effectof variable scale length on the decay of turbulence. Some of ourwork in other areas suggests that the scale length depends on theturbulent energy and the Brunt - Valsala frequency, N , such that
(50)
where N = (g/T" dT~/dz|2 and T is the potential temperature,we substitute Eq. (50) into Eq. (47) and integrate we get
If
= e -4bNt (51)
which is a more rapid decay rate than that given by Eq. (48). Weillustrate this decay rate in Fig. 20 and observe that the turbu-lence energy is dissipated to 10~3 x q£ within 30 minutes,compared to approximately 5 hours for the constant A = 50 m case.Because the constant scale length assumption yields the longestturbulence residence times, that assumption provides the moreconservative estimate for the diffusion of SST exhaust products.
45

IOU TURBULENT ENERGY DECAY
10
4^=0.005 sec"1
oz
- = I deg/Kmo z
A =50 m
q(0)=IO m/sec
Decay based on Eq. 27
q . I~
10,-2
10
Decay based oninvariant model
10'q(0)t/A
10'
Figure 19. Comparison ofturbulence decay ratescalculated from full modelto those calculated fromthe dissipation term alone.
10"TURBULENT ENERGY DECAY
10qz(0)«0.8 mz/sec2
10"
1010" 10' 10'
Time (sec)10'
Figure 20. Comparison ofturbulence decay ratesfor two assumptionsregarding the macro-scale length, A-, .
46

At this point, however, we must note that the lack of defini-tive observations of either the steady-state turbulence or thedecay of externally Induced turbulence is a serious handicap inchoosing among turbulence simulation models. And, as the foregoinganalyses show, the primary, uncertainty in these estimates isresident in the'lack of specificity of the scale' length defined asAI in second-order closure models. From a physical point of view,this scale length should associate with the integral spatial scalelength, .i.e., it should depend upon the distance over which thesmall-scale turbulent motions are correlated. Attempts to estimatethis scale length from aircraft traverses of detectable turbulence-patches- sug-ges-ts—-A^- -of- -the-order-of- -hundreds—o-f—meters-.—SlmHar^-ly observations of smoke puff growth can be used to infer effectivescale lengths of the order of 50 to 100 m when the turbulencelevels are apparently below the threshold of aircraft detectability.
These fragmentary observations provide some guidance for thecalculations that follow, but it must be recognized that thiscritical parameter is not known within a factor of two or more,and therefore estimates of turbulence properties, such as theturbulent kinetic energy, are uncertain within at least a factorof four of their true values. The consequences of this uncertaintyin the estimation of diffusion and chemical reaction rates areestimated in the next sections. For now, we may note again thatonly a much more adequate and appropriate experimental measurementsprogram for turbulence fields in the lower stratosphere can reducethese uncertainties.
The Choices of Turbulence Fields for SSTWake Calculations
The results of invariant model simulations of turbulencefields in the lower stratosphere have been reported extensively inthe last section for two reasons, 1) to examine the range ofpossible turbulence fields, and 2) to provide an input to othermodels of the turbulent diffusion of SST exhausts. If one iswilling to assume a steady field of turbulence (and most modelersdo make this assumption for relatively long periods of time In thediffusion process), then the superequilibrium estimates of turbu-lence, given wind shear, stability and an estimate of AI , areparticularly convenient, since all of the turbulence character-istics (through second-order moments) are readily determined.
For a first-order estimate of the significance of the turbu-lence field to the time-rate of dilution of Phase III SST exhaustwakes we have chosen to calculate the three-dimensional timehistory of the diffusion of the plume for five fields of turbulenceranging from q2 (the turbulent kinetic energy) equal to .006 to0.5 m^/sec . These analyses are discussed in the next section.

For estimates of the joint effects of diffusion and chemistry, wehave emphasized an expected value of q2 of 0.08 m^/sec2 toillustrate the interactions of these processes and have thenextended the calculations to the previous range of q2 to examinethe chemical efficiency of NO destruction of Oo during the Phase IIIwake period. These results are discussed in the second followingsection. Both of these analyses assume a steady and continuousfield of turbulence.
Since there is a real possibility that turbulence anddiffusion in the lower stratosphere is not steady, we haveconstructed a preliminary model of diffusion involving aperiodicturbulence "bursts " which decay to laminar flow and have analyzedthe diffusive growth and chemical efficiency of plumes subjectedto this kind of turbulence. The turbulence fields chosen for thisexample are discussed in context in the third following section.
ESTIMATES OF THE DIFFUSION OFNONREACTIVE EXHAUST PRODUCTS
In the analyses of the Phase III wake period for SST exhaustmaterials, a natural first question in the context of CIAP evalua-tions is, "How long does this Phase last?" For one thing, this isthe period of time during which the behavior (transport anddiffusion) of the plumes is within the spatial- and time-scaleresolutions of the large-scale global transport models. Foranother, during this period individual plumes represent localizedanomalies of exhaust material concentrations and exhibit thegreatest departures from the mean values used in large-scalechemical kinetics calculations. The significance of such depar-tures is, of course, heavily weighted by how long they persist.
A second general question of interest to CIAP is the relativeextent to which the plumes are diffused laterally and vertically(the anisotropic nature of the diffusion), during the Phase IIIwake period. These estimates serve directly in describing theconcentration distributions when the plumes achieve the grid-scaledimensions of the global transport models and they can be used toestimate the effective eddy diffusivities for first-order closureplume models.
In order to estimate these basic, parameters., of .Phase III.... ..diffusion processes for a variety of steady turbulence fields, wehave calculated the three-dimensional diffusion history of a plumesegment for which the initial horizontal and vertical variances ofconcentration were 625 m2 (a plume width and depth of about 100 m)over the time required to dilute the plume by factors of 10 .These calculations have been made for five turbulence fields forwhich the intensity of turbulence, q2 f ranged from 0.006 to
48

0.5 m2/sec2 and Ri from 0 to 0.5.turbulence model parameters used.)
(Recall Ri =0.55 forc
The Duration of Phase III as a Functionof Turbulence Intensity
More specifically, the five turbulence fields chosen toinvestigate the rates of diffusive growth and dilution of an SSTplume segment are listed in Table 4. Besides these inputs, thediffusion model requires a specification of the diffusive scale-length.- --T^is-latter--sea-le-1-ength^ ""scale length, but is not necessarily the same, since it dependsupon the dimensions of the plume. (Of., ref. 5 for a discussion ofthis subject.) Prior applications of this model have shown thatthe diffusive scale length for individual plumes is very wellspecified by the standard deviation of the concentration distribu-tion until this length reaches a multiple of the turbulent scalelength. For our present purposes we have chosen this multiple asfive.
TABLE 4
Turbulence Characteristics Chosen ForNonreactive Diffusion Calculations
Case
1
2
3
4
5
q2(m2/sec2)
.500
.210
.100
.034
.006
(m2/sec2)
.125
.052
.025
.008
.0014
Wi2(m2/sec2)
.125
.052
.025
.008
.0014
w 'T '(m°c/sec)
.000
-4 x 10⁻⁴
-3 x 10
-8 x 10~5
-6 x 10"6
RemarksRi
Neutral; Ri = 0"
Stable; Ri = .10
Stable; Ri = .20
Stable; Ri = .35
Stable; Ri = .50
In order to illustrate the basic outputs of these diffusioncalculations we have plotted the lateral and vertical variances ofthe calculated distributions, a2- and a2 , and the ratio of thecenterline concentration to its initial value, all as a functionof time of travel. These values are shown in Figs. 21 to 25 forthe cases described in Table 4.
49

IO"1
• CTZ
010
10
ID"3
ID'4
CASE 1 _Ri=0
q2=0.50 m2/sec2
\ ^^^\ ' <^
\ X^-*^ ^~~l
\ /?
/-A **•t v V/Uo
-// \
r ^ N
, 1 Vv 1
I07
IO6
CM
JC\J
b
IO5
4
IO3 I0t (sec)
I0
Figure 21. Calculationdiffusion and plumegrowth for Ri = 0
io6 and q2 = 0.5 m2/sec2.
10
ic
o10
10
2
r
CASE 2Ri=O.IO
q 2 =0 .2 l m2/sec2
\
c/c0
N
t (sec)10°
10'
Figure 22. Same asFigure 21 but Ri = 0,10and q2 = 0.21 m2/sec2.
IO
IO
o
50

ID'
1C
o10
10
'2
ID'3
10'4
Case 3\ Ri=0.20
q2 = 2.5X|0~2m2/sec2
C/C.
//IO3
X
IO4
t (sec)
—110
I0
I0
'*°IO6
Figure 23. Same asFigure 21 but Ri = 0.20and q2 = 2.5 x 10⁻²m2/sec2.
10-
ID
o10
^10
'2
10"*IO
\
CASE 4Ri = 0.35
q2=8.5XlO"3m2/sec2
/
•»
\
IOt (sec)
io3
IO
IO
PJ
IO
10'10'6
Figure 24. Same asFigure 21 but Ri = 0.35and q2 = 8.5 x 10⁻³m2/sec2,

CASE 510
io-2
oJJ
_J10
ID'41
~~ \ Ri=0.50 7"
\J'I-"xlflr'"I/ta'/ 'c/cX /\ /
\ /" \ "/ \
2 / \y/l_» \/ \~ / s~
/ 9 /'' ~/ 0"z ^1
/ XX
/ xx
/ sD3 IO4 IO5 1
10'
io6
<M
C\J
b
,.510
'§4O6
t (sec)
Figure 25. Same as Figure 21 but Ri = 0.50and q2 = 5.6 x 1Q-3 m2/sec2.
We shall summarize pertinent information from Figs. 21 to 25in a moment, but a visual inspection and comparison quickly showsthe diffusive behavior of the plume as predicted by invariantmodeling. In each case the dilution of the plume proceeds morerapidly than t"1 until either a2- or a2 , or both, reach2.5"x 105 m^ y-j.e.-, the-square x>f- the upper-1-imit-imposed-on-theturbulent diffusion scale length. When this limit is reached thedilution rate goes over to a lesser value, generally less thant"1 . Only when the turbulence is very light (RI ~ Ric) is thedilution rate more or less constant with time, a result expectedfrom Fickian diffusion theory.
52

We can now examine the dependence of the time required todilute the plume on the chosen field of turbulence. For thisanalysis we have determined the time required to reach a dilutionof 10 3 , tj) , and plotted this time versus the turbulent kineticenergy, q^ . These values are listed in Table 5 and plotted inFigure 26. It is very clear that the duration of Phase III isstrongly dependent upon the turbulence field. For q2 values ofthe order of 10~1 mvsec2 the duration of Phase III is around12 hours, but, if the value of q2 is as small as 3 x 10~3 m^/secthe duration of Phase III is about 300 hours* Similarly, aninc-rease--of -one-order—of--magni-t-ude_in- _the_ initial, c.onc.entr_ationresults in an order of magnitude increase in the time required todilute the plume to background levels, as can be seen by extra-polating the dilution curves In Figs. 21 to 25.
TABLE 5
Values of the Time, t-n , Required to Dilute a PlumeSegment by a Factor of 103 and the Variances of theConcentration Distribution Across the Plume at thatTime as Estimated for Five Fields of Turbulence
Case
1
2
3
4
5
q2
\ sec /
..500
.210
.100
.034
.006
V2
/ m2 \
(sec2)
.125
.052
.025
.008
.0014
w-2
' m2\
sec /
.125
.052
.025
.008
.ooi4
D = 103
(sec)
5 x ,103
1.5 x 1C4
4 x 10
1.2 x 10⁵
5 x 10⁵
103
(m2)
3.3 x 10⁵
2.1 x 10⁵
1.2 x 10⁵
8.4 x 10⁴
6.9 x 10
103
(m2)
3.9 x 10⁵
9.0 x 10⁵
1.6 x 10⁶
2.9 x 10⁶
7.9 x 10⁶
This statement assumes Phase III is terminated whenand should not be taken literally.
D - 103
53

lo
10
u4)
10-2
10
\D=I03
^
IOJ 10"(sec)
10= io6
Figure 26. Calculated time required for aplume dilution of 1C>3.
Since, for the most part, the lower stratosphere is stablystratified, we expect to find the lateral and vertical diffusionare not equal, and that lateral growth of the plume is signifi-cantly greater than the vertical growth. In conventional first -order closure models this anisotropy is included by selection ofdissimilar effective eddy diffusivities. In second-order closuremodels this effect is an explicit result of the complex balance ofbouyancy and mechanical forces, and does not require any arbitraryassumptions, other than for the scale lengths discussed previously.
To show the degree of anisotropy in the diffusion process forthe present choices of turbulence fields, we have read out thevalues of af and a at the time the plume dilution reached 1CP,

These values of ay and z/ay as a function of q are shownin Fig. 27. (Recall from Fig. 26 that the time required to reachthese values is also a strong function.of q2.) The degree ofaniso.tropy clearly increases markedly with a decrease in theintensity of turbulence and with increases in Ri. For q2 ofthe order of 10~2 m2/sec2 or less the diffusion of the plume isalmost entirely in the lateral dimension.
10°'
-jo'1
"$CM
CMer
5
10 2
_3
_. C. * __ C. -A /N 1 p _ I S\ •*
O"3 I0~2 10"' 10°1 1 \ ' 1 ' J^ O\ /\s
— '°'\0~7 /crv r \ 2
* 7 X * W y/ r\: / A
. 1 , 1 , 110- 105 ' 10° 10'
cry2 ot C/C0 =IO"3(m2)
Figure 27. Calculated variances of the verticaland horizontal distributions of NOin the SST plume when they have beendiluted by a factor of 103.
55

Diffusion Parameters for ConventionalFirst-Order Closure Models
We may now relate these results of second-order closure modelcalculations to the parameters which would produce the same resultsin first-order closure models. In standard usage of these lattermodels we have the relationships
and°z = 2 w' V = 2
a2 = .2 v'2 Ayt = 2 kyt (53)
where, from statistical theory,
Ai = /°°RiU)cl£ (54)o
and kz and k^ are conventional eddy diffusivities. (Equations(52) and (53) are limited to times, t , for which A has becomeconstant, i.e., R(4) = 0 .) Prom these equations we can readilyevaluate either the It's or the A's and their ratios. Forexample, for case three (Table 5).
t = 4 x 10 sec
a2 = 1.6 x 10⁶m2«y
2 5 ?a = 1.2 x KTin
p ? -P pw i = v ' = -2.5 x 10 ni ,
Then
k = 1.2 x 10⁵/2 x 4 x 10^ = 1.5 m2/secz
k = 1.6 x 10⁶/2 x 4 x 10^ = 20 m2/seci/
AZ = 1. 2x lC?/2 x 2.5 x 10"2 x 4 x 10^ = 60 sec
A = 1.6 x 10⁶/2 x 2.5 x 10"2 x 4 x 104 = 800 sec«y
and
56

These values of kz and k , of course, represent the effectivediffusivities that would produce the shape and dilution of theplume calculated by the invariant diffusion model at the time theplume dilution reached 103. The similar values of these first-order closure model diffusion coefficients are summarized for thefive cases listed in Table 6, and kz and ky are plotted versusq2 in Pig. 28.
TABLE 6
Estimated Values of Diffusivity and LagrangianScale Length Implied by Invariant
Diffusion Models
Case
1
2
3
4
5
q2
-m2
sec
.500
.210
.100
.034
.006
v '
m2
sec
.125
.052
.025
.008
.0014
w'2
m2
sec
.125
.052
.025
.008
.0014
tD
(sec)
5 x 10³
1.5 x 10⁴
4 x 10
1.2 x 10⁵
5 x 10⁵
V
m2sec
33
7
1.5
0.35
0.069
k
m2sec
39
30
20
12
8
Az
(sec)
264
147
60
45
50
Av
(sec)
312
600
800
1500
5640
57

IOV
10
10.-2
10
//K y
A
10" 10° 10'
K, and Ky (mz/sec)
Figure 28, Values of effective eddy diffusivities,kz and kv , which would producecalculated concentration distributionswhen the SST plume has been diluted bya factor of 103.
In combination with the .predictions of turbulent structurefrom known wind and temperature profiles, these estimates ofeffective diffusivities provide useful inputs to models usingthese parameters for prediction of SST plume growth. The valuescalculated agree reasonably well with estimates compiled byBauer (ref. 12) if the reader bears in mind that all large scalehorizontal meandering of the plume has been removed. Bauer'ssummary suggests a value of kz of 1 m
2/sec , a value appropriateto a value of q2 .of about 0.1 m2/sec2 in the present calculation,Similarly, a"comparison of ky suggests that the expected valueof 10^ m2/sec for the combination of diffusive growth plusmeandering is made up mostly by meandering, since the diffusivecomponent is only of the order of 10.'

The primary uncertainty of these calculations resides in thechoice of scale lengths. An exhaustive study of the sensitivityof the results to these choices is yet to be done, but at thepresent juncture it appears different choices could alter theestimates of diffusivity by about a factor of two to four.
Diffusion in Nonsteady Turbulence
The above analysis was based on the assumption of continuous_di£fus_ijDn._in_jfche__sJbra toaphere, ...a._si_t.uation which_is _diff icult -todefend in the light of flight experience and the generally extremehydrostatic stability of this region of the atmosphere (Ri » Ric),As an alternative, we have examined the consequences of a modelwhich assumes that for the most part the lower stratosphere is inessentially laminar flow (no significant turbulence on the scale ofthe SST plume dimensions), but that occasionally each volume ofthis part of the stratosphere experiences an externally inducedburst of turbulence on this scale. This model implies that thedilution of the SST plume will be discontinuous according to atime history such as the one shown schematically in Fig. 29.
TurbulenceOccurrences
Figure 29. Schematic representation of SST plumediffusion by periodic bursts ofturbulence.
59

A major test of this model could be obtained by observingthe frequency and Intensity of turbulence encountered by a free-floating balloon in the appropriate height zones of the strato-sphere. Lacking these measurements, we may make some Inferencesregarding the recurrence period of turbulent bursts and theircharacteristic intensity from HI CAT data. Ashburn et al., (ref.9)has.tabulated the frequency of occurrence of various levels ofeffective vertical gust velocities for 37 turbulence encountersabove 60,000 feet. ; If these are converted into relative frequen-cies of each turbulence level one gets the plot shown in Fig. 30.Although there is some uncertainty in converting effectivevertical gust velocities into turbulence intensity in threedimensions, the data do tend to show an exponential dependence ofrelative frequency on turbulence intensity.
10'r
CMU
i 10
10"
k
\*
i.2 .4 .6
fi(q2>qi2)
.8 1.0
Figure 30. The relative frequency with which theintensity of turbulence, q2 , was
- - observed- to exceed the indicated valuein 37 turbulence episodes, sampled byHI CAT aircraft above 60,000 ft. Errorbars indicate approximate uncertaintyin converting vertical rms gust velocityinto total turbulent kinetic energy.
60

Let us now assume that all of the 37 turbulence eventssampled by HI CAT have a common initial intensity, that thisturbulence decays at a prescribed (exponential) rate, and theHI CAT data simply reflect the probability of occurrence (thetime duration) of each turbulence intensity band. Then thecharacteristic initial turbulence level is about 5 m2/sec2 anddecays exponentially with time.
Using this Information, we may readily deduce that theaverage dissipation of turbulent kinetic energy between bursts ofturbulence is
(55)
where T is now the. time interval between turbulence encountersfor any given volume of the stratosphere and T is assumed to belarge as compared with_the decay time of any individual turbulenceburst. Estimates of e (cf. Lilly, ref. 13) are of the order of10~5 mvsec3. Then
T = 2.5 x 10⁵ to 2.5 x 10⁶ sec
the recurrence period of turbulent bursts is between 70 and 700hours.
We must now determine how many turbulence encounters arerequired to dilute a plume segment to background concentrations.As a first estimate of this quantity, we have taken advantage ofthe time-dependent nature of the invariant turbulence and diffusionmodels to estimate the decay rate of an initial turbulence burstand then the three-dimensional diffusion of a trace materialembedded in this decaying turbulence field. For the turbulencecalculation we have used the slower decay rate associated witha constant value of the turbulence scale length, AT , asdiscussed in the previous section. Using an initial value of q2of 5 m2/sec2 and a value of AI of 100 m, the calculated time.history of q2 shown in Pig. 31 is obtained. Also shown there isthe approximate stepped values of q2 used in the diffusioncalculation.
The results of the diffusion calculation are shown in Pig. 32as the time histories of the lateral and vertical variances of theplume concentration distribution, a| and a| . During the6000 seconds of the calculation (during which the value of q^has decreased to 10~2 m2/sec2)., a2 grows by a factor of 103 anda2 by a factor of 150. Since the concentration in the plume isinversely proportional to a az , the dilution during this timeis about 4 x 10 . Since (as will be discussed later) dilutions ofthe order of 103 to 10^ are required, .we can estimate that two ormore turbulence bursts must be encountered before the Phase IIIplume period is terminated. Using the above estimates of the
61

recurrence period for turbulent bursts In the lower stratosphere,we again estimate that the duration of the Phase III period is theorder of hundreds of hours, and may be as much as one or twothousand hours.
Although this model does not give drastically differentestimates of the duration of Phase III, it does portray a differenttime history of concentrations in the plume. Assuming thatdiffusive mixing is negligible between turbulence encounters, atypical history of centerline concentrations for this model isshown schematically in Fig. 33. These results are elaborated asto their effect on the chemistry of the plume materials in thenext section. Here we need only note that the average concentra-tions in the plume inferred by this model are higher than thoseInferred from continuous diffusion, even though the time requiredto dilute the plume to background concentrations is not demonstra-bly different.
CJoVin^
CM
sec'<JT/dz = .OOI deg/m
Ri = l.8
A=IOO m
Initial condition: neutral stability
Turbulence modelcomputation
Approximation for—i diffusion modelI
2000 4000
TIME, SECONDS
6000
Figure. 31.'.._Turbulence decay history used forcalculations of diffusion in adying turbulence field.
62

10° I01 10
TIME, SECONDS
Figure 32. Time history of lateral and verticaldistributions of concentration in SSTplume for decaying turbulence fieldshown in Figure 31.
1.0
.8
.6o
to^lo
.4
0 1 2 3
Time between turbulent episodes in units of T, therecurrence period for turbulent bursts in the
lower stratosphere
Figure 33. Schematic representation of centerlineconcentration histories in a turbulencefield characterized by short-livedturbulence bursts every T hours andlaminar flow between bursts.

Uncertainties in Stratospheric Diffusion Calculations
As must be evident from this entire discussion, the uncertain-ties of any estimates of turbulent diffusion processes in the lowerstratosphere are unacceptably large. Quite literally, theseuncertainties extend to the very mechanisms of turbulence generationand decay, a fundamental starting point for any simulation of thetime history of the diffusion of SST wake plumes. In addition wehave only fragmentary (and somewhat contradictory) information onthe parameters to use in any models of these processes, even if weare willing to make some arbitrary choices as to whether diffusionis continuous, periodic, or (as is likely) a result of complicatedturbulence histories which encompass the range of Intense turbulencebursts induced by unstable gravity and mountain waves to near-laminar flow.
When summarized in a logical way these uncertainties lead tothe conclusion that we do not know the "expected" duration of thePhase III wake period to within a factor of ten of its true value.Further, all evidence points to a minimum duration of this phase -ofseveral days, and that this duration becomes significant if thePhase III period persists as long as weeks or months. (The analyseswhich lead to this conclusion are presented in the next section.)Since the latter durations are within the range of uncertainty whichmust be attached to estimates presently available, it is clear thattheir significance to CIAP requires harder data on the mechanismsand rates of turbulent diffusion in the lower stratosphere than arenow available. Any continuing program designed to refine theseestimates for realistic regulation of SST operations in the lowerstratosphere should include a measurements program specificallydesigned to address the questions of mechanisms and rates ofdilution of SST plumes.
ESTIMATES OF COUPLED DIFFUSION ANDCHEMISTRY OF SOME EXHAUST MATERIALS
With the above analyses of the diffusion of inert exhaustmaterials in hand, we may now turn attention to the criticalproblems of chemically active exhaust materials and their reactions••with environmental-constituents during the Phase"III wake period.Since the mere presence of trace amounts of exhaust materials inthe stratosphere does not appear to be the cause of any significantenvironmental alteration (although accumulations of opticallysignificant particulate materials may be important), the majorpotential environmental impact of SST operations has been identifiedwith the chemical alteration of environmental constituents. In theCIAP analyses of these potential impacts, the problems of ozone
64

depletion due to the presence of increased (but still trace)amounts of SST-produced water vapor and oxides of nitrogen haveemerged as particularly significant subjects for analysis (refs. 1,3, 7 and 14). In order to provide maximum assistance to CIAP anda focus for the analyses which follow, we have emphasized theNO -CU reaction system for a study of the coupled effects ofdiffusion and chemistry during the Phase III wake period.
With this focus, the critical questions which we wish toaddress are:
1. "Is the chemical efficiency of the NOX catalytic destruc-'tion of Oo significantly altered during the period when the SSTexhaust NO is relatively concentrated in diffusing plumes?" and,
2. "If the answer to 1. is "yes, " how long do these effectspersist, and what is their significance in the total chemistryduring the time the SST exhausts are resident in the stratosphere? "
In posing these questions we are in effect examining the valid-ity and significance of two assumptions made in earlier analyses,one of which states that the chemical efficiency of NOX destructionof Oo is always unity, and the other states that, even though thisefficiency is less than unity during the Phase III period, this,period is short compared with the total residence time in the lowerstratosphere, and the effect is therefore negligible in the totalproblem of 0^ depletion. The following analyses show that thefirst assumption is highly untenable, and the second assumptioncannot be rigorously defended out of present knowledge of therelative durations of the Phase III chemical anomaly and the totalresidence time of SST exhaust materials. The analyses also show •that the combined effects of diffusive mixing and NO^-O^ reactionsduring Phase III can only operate to reduce prior estimates of Oodepletion, i.e., earlier estimates maximize this effect of SSToperations. Offsetting these new insights, however, is the factthat the uncertainties of both these and prior analyses deny adefinitive evaluation of the Oo depletion problem at this time.
The Chemical Model
The following analyses of the combined diffusion and chemistryof NO and Oo during the Phase III period have utilized calculationsmade with A.R.A.P. 's coupled, two-dimensional diffusion/chemistrymodel. This model, which is described in detail in ref. 6, wascompleted during the early phase of the present study and wasdeveloped under partial support from Contract NAS1-11873. In brief,the model solves the nine simultaneous partial differential equa-tions necessary for the solution of the general rate equations forthe local concentrations of two reactants, a and p , given onPages 11-12 of this report. The inputs to the model are 1) the
65

turbulence field (derived from the turbulence sub-model), 2) theinitial concentration distributions for the a and f3 species,and 3) the reaction rate constants.
Although the model, as presently constructed, is limited toan irreversible binary reaction (and we assume an Isothermalreaction as well), the reaction set (the basic NOX catalytic cycle)
NO + 03 -* N02 + 02 (56)
N02 + 0 -* NO + 02 (57)
can be approximated for model solution by assuming that NO + N02 =NOX is conserved and the ratio of NO to NOo is a constant in time.This Implies the further assumption that the restoration of NO byreaction (57) is not limited by the supply of 0, a questionableassumption in the dark sky, since 0 is produced primarily byphotolysis of Oo and NOo. However, under these assumptions thesecond-order chemical kinetics equations for reactions (56) and(57) may be written .
and ;...
=0 (59)
where we have set a = Oo and (3 = NO. Equation (59) assumesthat the depletion rate of NO associated with the reactiongiven in Equation (56) is balanced by the rate of production ofNO associated with Equation (57), and follows directly from theassumptions that the sum of NO + N02 is conserved and the ratioNO/NOo is constant in time. Since this is the equivalent oftreating NO as a conservative tracer, the resultant calculationsof SST NO concentration distributions serve as a surrogate forany conservative exhaust constituent and permit exact comparisonswith the results of the nonreactive diffusion calculationsdescribed previously.
In the use of this model we have ..taken.. k-j. = 5-5 x.lo5(ppp-sec)~1,"a value"which may be compared with the value of1.3 x 105 (ppp-sec)"1 recommended by the CIAP chemistry panel(ref. 15, 16),
66

Chemical Efficiencies for the NOXCatalytic Destruction of Oo
In addressing the primary question of the efficiency of thechemical destruction of Oo by NO via the NOX catalytic cycle, wenote first that two processes are involved when the NO is confinedto an intact plume segment in relatively high concentrations.First, the NO reacts with and destroys locally produced. 0-^ and,second, the environmental Oo (external to the plume segment) maybe diffusively mixed with tne NO and is thereby destroyed. In thefirst_process _we recognize that the production of Oo may be anoma-lously tiighTirf the~p~ruine" segment "due 7 for" example, ""to excelfsTveproduction of 0. However, since NO concentrations are also high,this excess 03 is destroyed and the result is essentially a "do-nothing" cycle so far as the exce_ss production and destruction ofOo is concerned. We may, therefore, concentrate on the destructionof only that component of Oo production which occurs in the normal(nonplume) atmosphere for this phase of the chemical efficiencyanalysis. For this purpose we assume there is a limiting value ofthe concentration of NO just capable of destroying Oo at its localproduction rate and any excess of NO above this value is Inactivein this process.
The second process, on the other hand, depends upon calcula-tions of the rates at which external Oo and NO are mixed comparedwith the rate at which they react. To determine the efficiencywith which the NO destroys the environmental Oo we note that therate of destruction of 03 in a vertical column of unit cross-section and extending through the plume segment is given by
dc
Now, the maximum value which C""a can attain through the plume isthe environmental concentration of 0^ and under this circumstanceC^ must be zero in this column (the^Oo is uniformly mixed). Thenthe maximum possible rate of destruction of Oo is
^= - k-, C / CD dz
_ —00
dzmax /a e p
where C^ is the environmental concentration of 03 and, of course,
/ CQ dz is a measure of the total amount of NO in the verticalu p—oo
column through the plume segment. Since this is the maximum rateat which NO in the plume segment can destroy existing Oo, we maydefine the chemical efficiency of any combination of NO and 03 in
67

the plume by
E = (62)
oe C~,Pdz
Chemical Efficiency of NO Destructionof Locally Produced 0~
, As a method'of estimating the efficiency of plume-bound NOfor the destruction of Oo produced within the plume, we assume thedistribution of, NO concentration is appropriately specified, atany particular time, by a bivariate normal distribution of the form
C6 =; exp "(f 2. /J
CgD is the axial concentration on y = z = 0 andthe variances of the C« distribution in the y ant
(63)
andwhere _a2 are £Ke variances of the Cg distribution in the ydimensions, respectively. Further, we assume Oo is produced at'the same rate in all portions of the plume, at a rate appropriateto the nonplume atmosphere (see discussion in previous section),and that there is a concentration of NO, C«c , just capable ofdestroying 0^ at this rate. Then the efficiency of the NO for thedestruction of locally produced Oo, E*, is the fraction of the _total NO which occurs at concentrations less than or equal to C6cin the plume. Then E is given by
fyrE = 1- z.c_rr
-00 -OO
(64)C6 dy dz
where (yc> zc) are ^^e coordinates of the Cgc .concentrationisopleth, _whlch go to zero when Cg is everywhere less than orequal to CBC •
Equation (64) can_be solved, using.Equation (63), by aconformal mapping of ' Cg into the (y, £) plane by
(65)
68

2 2 2 2where a is defined by a = a a . Then«y "
expp f - — r
L 2a a
which is a circular distribution of Cg about the origin of thetransformed plume. ^
. - . . _ . .._ _
C (r) = C exp - —fa \i r2 = y2 + f (6?)2a a'
and we note particularly that Cg(oo) = o and
(68)
But
' z ^ r r C ' 2/
y rz r^ \ 2 i 07 C Cp dy dz = Try Cpo exp - -^ dr2 (69)
-yc -z o
and for r = <»
> o o p o o _ O p
Cg dy dz = 2ir atf o^ ^"B0 (70)— DO —00
69

For r = rc ,
dz =-z 2 22a2a2
C TT ('71)
27T a2 a2
1 - exp - "2C
(72)
27ra 2 a2 CC,
C"C
(73)
and Equation (64) becomes
E = 1 -
2 2 —2 T a az C
P0r ^flp "-i PC1 -
2 —- TT r Coc pc
(74)
and
E = 1 +
'(302 2^az
(75)
70

But
P ?2a az
and
'po1 - (76)
-A--p-10-t:-0-f—Eq-ua-t-i-0n--(-7-6-} -i-s--given- in -Fig-.- 3<U--and-,.- as. can-be .s.e.en.there, the efficiency of plume-bound NQ. destruction of 63 is lessthan 25 per cent until the ratio GQQ/CDQ goes above 10~1. Sincethe initial value of this ratio is expected to be around 10" to10~3, the efficiency for this process is essentially negligibleuntil the plume has been diluted by a factor of about 102 to 103.The utilization of plume-bound NO for the destruction of locallyproduced Oo is therefore a small fraction of the total NO presentin the plume during the first several hundred hours of the plume'sexistence.
More importantly, perhaps, this calculation provides the firstsuggestion of an "Oo hole_^ in the plume, since within the plumecross-section for wnich CA > Coc the NO concentration is capableof destroying all of the locally produced Oo. Unless external Oois transported into this section of the plume at a rate greaterthan the rate at which the local excess of NO can destroy it, thisportion of the plume should be essentially Oo-free. We now turnattention to this facet of the problem, i.e., the comparativediffusive transport and chemical reaction between the plume-boundNO and the external Oo.
10°
10
10
10ID'
Figure 34. The efficiency ofplume-bound NO for thedestruction of locallyproduced 0,, as a_function ofCo /CSQ where Cp is the
NO concentration which isjust capable of destroyingOo in__the nonplume atmosphereand Cop, is the centerlineconcentration of NO.
10°
71

Coupled Chemistry and Diffusion Calculationsfor Reaction Rates Between SST NO and
Environmental CU
Since the A.R.A.P. coupled diffusion and chemistry model inits present form can handle only two-dimensional (z, t) diffusioncalculations, we introduce the assumption that the lateral extentof the plume cross-section is large with respect to the verticalextent and that lateral gradients of concentration are negligiblecompared with the vertical. The diffusion calculations presentedearlier suggest this is an acceptable assumption after the firstfew hours of plume life.
With this assumption, we have exercised the Invariantdiffusion/chemistry model for various choices of the turbulencefield and for various plume cross-sections representative of thediffusive life history of the NO plume during the Phase III wakeperiod. These calculations have been summarized in terms of thechemical efficiency of NO destruction of environmental Oo and thecontrolling physical causes when this efficiency is less than one.
To illustrate these calculations and the basic mechanisms atwork, the results of one calculation are given in detail in Figs. 35and 36. The conditions chosen for this calculation are 1) a stablystratified atmosphere, and 2) vertical turbulent rms velocitycomponent of 0.1 3 m/sec (w'2 =0.02 m /sec2); the NO plume had acenterline concentration of 1.8 x 10"? kg/m3 and a vertical thick-ness of slightly more than 200 meters. The environmental concen-tration of O^ (external to the plume) was taken as 2 x 10~7 kg/m3( ~ 2 ppm). The "equilibrium" profiles of NO and Oo concentrationsfor these conditions are shown on the left-hand side of Pig. 35.(Only the upper half of the full plume is plotted; since the plumeis symmetrical about its axis, there is, of course, a mirror imageof all of these quantities along the negative z axis.) On theright-hand side of this figure we have plotted the calculatedchemical reaction rate (Oo depletion rate) as a function of height,first including the "mlxedness" term, C'Cd , and then, for compari-son, the reaction rates calculated for tne mean values of theconcentration of NO and Oo.
72

I60r UNITSMultiply numbers given (or C by 2x|0*7 to
get concentrations in kg/ms.
Multiply numbers given for 4C/*tby 2xlO"'°
to get reaction rotes in kg/m'/sec.
^=-K,CaC,
K,
0 .2 .4 .6 .8 ' 1 . 0 0
C, Concentrations of 03 & NO dt
2 3 4 5 6
-, Depletion rote of Os
Figure 35. Calculated vertical profiles of NO and 0^concentration in the half-plume and thechemical reaction rate for the depletionof Oo for t = 150 sec. The reaction ratebasea on mean values of concentration onlyis shown to Illustrate the effect 'of mixed-ness on the reaction rate.
73

UNITSMultiply numbers for C'a*' by 2XIO~9 to get
flux of 03 in units of Kg/m2/secMultiply numbers for Cfcw' by 2XICT9 to get
flux of NO in units of Kg/m2/secMultiply numbers for C'a C'p by 4X|Q~ l 7to get
correlation units of Kg
1.6 2.0 2.4
Figure 36. Calculated vertical profiles of the verticalturbulent fluxes of NO .(3) and Oo (a) andthe'mixedness correlation of their concentra-tion fluctuations for the case shown inFig. 35.

Prom these results we can quickly discern that from the plumeaxis up to 50 m the plume is Go-free; the combination of diffusivemixing and chemical reaction has created an "CU-hole " in the coreof the plume. Second, the chemical reaction rate profiles show thedestruction of 03 occurs only in the outer edges of the NO plumeand, due to a lack of intimate local mixing of the NO and Oo, thetotal reaction rate is only about one third the rate predicted bymean value chemical kinetics. From these results we can alsodeduce that the efficiency of the NO destruction of Oo is (recallEquation (62), E ~ 2 x 10~3 , i.e., only 2/lOtns of one per centof jthe^_p lume ._ JNO _i_s_ involved in the destruction of environmental Oo.1
The associated vertical profiles of the turbulent flux of NOand Oo are shown on the left-hand side of Fig. 36, and the"mixeaness " factor profile is shown on the right -hand side of thisfigure. The profile of C'w ' shows clearly that the turbulentflux of Oo into the plume is completely offset by chemical deple-tion below about 50 meters. Similarly, the mixedness limitation onthe chemical reaction rate is a maximum at the height at whichturbulent diffusion is most strongly "folding " the Oo into theNO at the edge of the NO plume.
We can now examine the relative effects of the diffusionlimitation and the mixedness limitation on the chemical efficiencyof this system as follows: Let
oo
= k-.C' C"Adz (the maximum possiblej. ae u o p reaction rate in the half-
plume )
, o f1 J o v a p a p
(the calculated reactionrate in the half-plume)
/
ooC~rCj dz (the mixedness component of
~ o a p the calculated reactionrate In the half-plume)
D = R* - (R + M) (the diffusion component ofthe difference between themaximum and the calculatedreaction rate in the half-plume )
75

Then, by definition,
E j\ "1 T T ( r~T'~7 \= R* = D ~ LM ^7}
where LD = D/R* and LM = M/R*. For the example given above
R*= 126 x 10~7 kg/sec
R - 206 x 10~10 kg/sec
M - 318 x 10"10 kg/sec
D - 125.5 x 10"7 kg/sec
E = 1.63 x 10~3
= • 2.6 x 10~3
LD=.996
The diffusion limitation accounts for essentially all of thechemical efficiency deficit calculated for this case. In fact,the case just discussed is appropriate to present estimates of SSTexhaust emissions of NO about one hour after fly-by, and they pointvery clearly to a chemical reaction system completely dominated bydiffusive mixing. The net result is a marked reduction of the NOdestruction of 0^ compared with the rate calculated under theassumptions of uniform mixing of Oo through the plume and meanvalue chemical kinetics. In a very real sense these resultsindicate that the NO plume is self-shielding so far as environ-mental 0-3 destruction is concerned; it is as though the NO wereplaced in the stratosphere in a slightly permeable shell whichexpands and erodes with time. To study the importance of this toCIAP, we now turn to estimates of the rate at which this expansionand erosion occurs and its control of the efficiency of NO destruc-tion of Oo.
76

The Dependence of Chemical Efficiencyon Turbulence Intensities and NO Plume
Concentrations During Phase III
In order to estimate the chemical efficiency of NO destructionof Oo during the Phase III wake period and for a range of turbu-lence conditions, the A.R.A.P. coupled diffusion/chemistry modelwas run for nine combinations of turbulence intensity, q"2 andplume widths, <jy . The range of q2 was from 10~2 m2/sec2 to10 m2/sec2, and the range of a-y was from 102m to lO^m . The
--v-er-tical-thic-kne.s.a...o.f...tJie_p.l.ume_...w.a.s...he.l.d_at. _.~ _2QQ_jn ..(-.z—- 5— J?.]b__and the centerline concentration of NO was taken as 10 ~* kg/m3 whena = 102 m . (Additional calculations have shown that there is aweak dependence of E on az which is to be studied further, but,which is apparently of negligible importance in the present analy-ses , )
Since the concentration of NO in the plume is essentiallyinversely proportional to ay , this variable may be treated as ameasure of the concentration of NO, controlled by either thelateral diffusion of the SST plume or by the variation of the NOemission rate. While we shall emphasize a constant emission rateand interpret these results in terms of diffusion of the NO plumeduring Phase III, they are equally appropriate to estimates of theeffects of increasing or reduc-ing the NO emission rate from SST's.In the latter case, one simply assumes the dimensions of the plumeare constant and the emission rate varies inversely as Oy .
The results of these calculations of E, L^, and Lp are shownin Figs. 37) 38 and 39 respectively, and the dependence of chemicalefficiency and the mechanisms which cause this efficiency to departfrom one during Phase III are immediately evident. As was to beexpected, E varies from less than 0.05 when q = 10~2 m2/sec2
and ay = 102m to very nearly 1.0 when q2 = 1 m2/sec2 and
ay = ID^m . For the most part E depends more strongly on theconcentration (or plume width) than it does on the intensity ofturbulence. The exception to this statement is found when theconcentrations of NO are relatively high (ay is small). In thiscase E depends about equally on the concentration of NO and theintensity of turbulence.
77

on
mp
o
inH
^-— "^
'
_ _ __
~^~ •\
0
-p*\
\\
\ \~~~">V / j
^^ /
/
, /
"S °2
(2D8S/zllJ).!b
^~'•*"
(P, " .-'. — ID „-"'
^- ' ^— •* **'- "~ If) . — tf)^^
_ -—' .^- m ^-^ ^
'"""' ,-^*^ ^-"^ £'s*^^ ^ - * i,** ' ^^
— ' ' ^^' " — ^'"•' * ^^ -
- ••" ~ ' *S^ iTt^
* - — m/' *—.' ,^ s • ^^^
'•^ / /'^" ' ^
/x /'/ ' /X' / X
/ x/ /• - / - - • I.*/
/ ^x01
X i / ,o
"o -g
(^as^uijjJ
//1
1t, / ,
O
G0•H-P
PL•H
-P
« ? Oo-^ o
60
£
•
OOoo
0
~0 SoT 7 - -H2 o fe
» O— ^ -^ — ^^ i r^
." tr-**' ***' ~.
~*^" — *^* ^'"^
^**' ***^~ *^^.' ^ ^^
^^^^ ^^' *
,^^ ^^"~^^
.• "
^*- f,
" ^S*'"^ _
.'
S^
s^'
1 1T w
CQ0•HOG0•HO•HCHIn
» "i 0
° ~^.~ b ^
-Pcti
orHCtiO
N •
2 . |>.g 'o ^
) 0
bO•HPn
O
G0•H-PCti-P•HS•HrH
CQCQ
mix
edne
G
in•H>G0
O
GO*H-PO
..•HO•H
0
:»o
0•HO•H
0
-P
CM
O
q_,O
co•H-po
-pCQ0
O
0
Of~\ 1V.M
G a-O•H-POG
^cd
CO03
i-p•H
G0-PG•H
0
1
^f^
Go5
^
^CM-P D1 •
<H0
o•H-pO
<*H
03
CQ
CQG
•HCQG0S•H
rH05
0-P05
3 OOO Hill-PCQ0•ao
O
rH05-PC0
G0rH3•j?
-p
0£-P
t5
«?
•>5
-P
•HCQ
0-P
G•H
0OG0
*
K.K"
D
•\0S3rHaoS0X!-P
O
Kf-
D
-P
•H
0S3rH
•a
78

10 10"
Figure 39. The contribution of the diffusionlimitation to the efficiency deficitfor NO destruction of environmentalOo as a function of turbulenceintensity, q2 , and plume width, O
79

The relative contributions of the mixedness limitation, L^ ,and the diffusion limitation, Im , to E are clearly shown inPigs. 38 and 39. In all cases the diffusion limitation dominatesthese two effects. In its region of maximum value (ay ~ lO^m andq2 > 1 m2/sec2) LM never contributes more than one third to theefficiency deficit. . However, note that the mixedness limitationacts to counter the diffusion limitation; if LJVJ is neglected, Ewill be overestimated.
With these calculations in hand we may now make some prelimin-ary estimates of the overall effect of diffusion and mixednesslimitations on the NO-Oo reaction during Phase III. To do so, weassume that the initial axial concentration of NO in the plume is2 ppm (the immediate post-vortex region of the plume) and that theNO concentration is diluted by diffusive mixing until it reaches abackground concentration of 2 x 10~ ppm. At this time we presumethe NO is in chemical equilibrium with the locally produced Oo anddiffusive transport of the 0^ Is no longer Influenced by thepresence of excess NO above Background.
Now, consider the two diffusion histories designated as Case 3and Case 4 and shown in Figs. 23 and 24. For the first (Fig. 23)the NO concentration reaches background levels at about 2 x 10" secin a turbulence field of q2 = 2.5 x 10~2 m2/sec2. In the secondcase (Fig. 24) the the NO concentration reaches background levelsat t ~ 4 x 10° sec in a turbulence field of q2 = 8.5 x 10~3 m2/secr.Using the predicted values of oy as a function of time for thesecases, we may enter Fig. 37 and read off estimates offunction of time. The resulting time histories oftwo cases are shown in Fig. 40.
EE as afor these
CASE 3
q 2 »2.5XIO~ 2 mz/sec2
CASE 4
qz«8.5X|0"3 mz/8ec2
10
Figure 40. Estimated time histories of the chemicalefficiency of NO destruction of Oo duringthe time required, to dilute the NO plumeby a factor of 104 .
80

From these examples we may estimate that the duration ofPhase III is 600 to 1200 hours, and the chemical efficiency of NOdestruction of environmental Oo during this time is between 10 and20 per cent. Recall that we have assumed light but continuousturbulence fields for these calculations - any individual plumesegment which encounters a strong turbulence burst during Phase IIIperiod will, of course, follow a different diffusion and chemicalefficiency history. On the other hand, plume segments may frequent-ly find themselves in essentially laminar flow and these will, ofcourse, diffuse more slowly (if at all) and exhibit much lowerctiemrca± ef-f-lc.ieneies--du-ri-ng- these—periods-. At. be.s.t-, _the...examp.le.s._.cited above may be considered a weighted mean among these diversePhase III histories, and therefore provide "expected" values ofPhase III durations and chemical efficiencies. Improvement uponthese estimates depends upon much more knowledge of the turbulenceregimes in the lower stratosphere than we now possess.
Implications for Overall NODestruction of 0^
The above estimates of NO destruction of Oo during Phase IIItake on their real significance for CIAP evaluations only when theyare appropriately incorporated in estimates of the effects producedby SST exhausts during their entire residence time in the lowerstratosphere. Since we have not made any definitive assessment ofthis residence time, we can only note the range of estimates madeby others, which extend from something less than 6 months to some-thing greater than a year. If we assume the SST NO is fully activein the destruction of 0~ following Phase III, we may estimate theoverall effect of Phase-5!!! from the relationship
E(T ) = 1 - * (1 - E(T)) (78)" XR
where E"(TR) is the chemical efficiency for the entire residencetime, TR, T is the duration of Phase III, and E(T) is thechemical efficiency during Phase III. Prom the above estimates, Tis of the order of lo3 hours and E(T) is about 0.15. Then
E(TR) = 1 - ±jj£ (0.85) (79)K 1R
TR is as little as 2 x 10³ hours ( ~ 3 months),_ E(TR) ~ 0.60.TR is of the order of one year (~ 10^ hours), E(TR) ~ 0.92.
IfIfIn the latter case, the overall effect of Phase III chemistrylimitations is quite negligible; in the first case the effect isthe equivalent of nearly halving the proposed SST fleet.1
81

Experimental Verification and Refinementsof These Results
The foregoing analyses of the structure of turbulence, turbu-lent diffusion processes, and the combined mechanisms of diffusionand chemistry, as these relate to the environmental impact of SSToperations in the lower stratosphere, can be accepted as conclusiveonly when appropriately validated against direct observations. Ashas been noted throughout this report, present observational dataare adequate to this important task only if uncertainties of ordersof magnitude in critical processes and of factors of 2 to 10 inestimates of environmental effects (e.g., the depletion of Oo) areacceptable and useful. The paucity of appropriate data is hardlysurprising, since observations which have been made have been quitedifferent applications. For example, measurements of turbulenceintensities and structure have, until very recently, been designedto provide criteria for structural requirements on aircraft expectedto fly In this region of the atmosphere. It is quite appropriate touse aircraft as measurement platforms for this purpose and toemphasize the measurement of the relatively severe levels of turbu-lence which would be significant in structural failures. Thesedata are only marginally useful in determining the diffusion ofexhaust materials, however, since the threshold values of turbulencemeasured are too large and the method of measurement (fly-bys)precludes any definitive specification of the turbulence historyto which these exhaust materials are subjected.
Similarly, the estimates of chemical reactions and theirconsequences for environmental states are handicapped by the lackof adequate measurements of the natural magnitude and time- andspace-variabilities of the concentrations of key chemical, species.Any attempt to measure directly the chemical consequences of inject-ed exhaust products must contend with these background and 'hoise "levels.
If the reduction in uncertainties of the estimates of environ-mental Impacts of SST operations is important to the regulation oftheir operations, then the hard data appropriate to these analysesmust be obtained. In this regard, and aside from their value inproviding first estimates for CIAP evaluations, the models describedhere are extremely valuable in the design of experimental measure-ments which will clarify key processes and serve to validate predic-tions of the environmental consequences of SST operations. Theseare, of course, tasks -beyond the- present -objectives" of CIAP, but it"seems equally clear that one of CIAP's responsibilities is toprescribe what more needs to be done. Given the Intensive scopingof the problems, analyses, and preliminary estimates which CIAP hasaccomplished, the stage is set for a thoughtful and balancedprescription of requirements for refinement of these estimates.
82
CONCLUSIONS
In conclusion, we may summarize the results of this study todate by answering the questions posed in the introductory remarks.The first question was, "During the Phase III wake period, is thechemical behavior of the SST exhaust materials significantlydifferent from their behavior after they are well-mixed in thestratospheric environment?" The answer is an unequivocal "yes,"-if--the_che.nii.c.al.._re_a_ctiQri rates_ are fast with regard to the diffu-sion rates encountered in the lower stratosphere".
The second question was, "If the answer (to the first question)is "yes, " what is the nature and magnitude of this effect(s), andhow long does it last?" The answers to this question are several,and they may be summarized as follows:
1. During Phase III the reaction .of NO with 0- , via the NOXcatalytic cycle, for the destruction of Oo is strongly inhibited bythe limitations of diffusive mixing between the NO plume and theenvironmental Oo, and by the relatively small local production of03. As a result of these limitations, the efficiency of NO destruc-tion of Oo during Phase III is probably around lf> per cent, and maybe less. .
2. Best estimates of exhaust emissions of NO and of thediffusive properties of the stratosphere suggest Phase III should,on the average, persist for about 1000 hours, but this estimate isuncertain within a factor of five to ten of that number.
The third question posed was, "Do the combinations of thenature, magnitude, and duration of the chemical behavior of SSTexhausts during Phase III significantly alter estimates of theimpact of SST fleet operations on the stratospheric environment?"A logical assembly of the analyses directed to the first twoquestions (again in the context of NO destruction of Oo), andassuming the post-Phase III chemical behavior is properly portrayedby classical chemical kinetics, the answer to this question is thatthere may be a significant effect, but estimates of this effect areuncertain within a factor of two to five. From what we know nowwith regard to the multiple factors which enter into these esti-mates, the Phase III chemistry anomaly may reduce the previous 0-^depletion estimates by either as much as 80 to 90 per cent or byas little as 10 per cent. There is presently little basis forchoice within this range.
It is only fair to note that the significance of these resultsdepends strongly upon the validity of prior analyses of the overallimpact of NO on 0^ and on estimates of expected exhaust emissions.
83

If, in fact, further analyses of the multiple chemical processeswhich govern the balance of Oo in the stratosphere significantlyreduce estimates of the depletion of Oo during the entire residencetime of SST exhausts, then Phase III effects tend to becomeunimportant. On the other hand, increases in these large-scaleeffects enhance the Phase III anomaly.Similarly, reductions inSST exhaust emissions operate to minimize the Phase III anomalyand reduce its importance in the CIAP evaluation. For example,a reduction of NO emissions to 10 per cent of present estimatesand an accompanying increase of the SST fleet by a factor of tenshifts the overall problem to the large-scale effects since theanomalous behavior during Phase III is reduced while the totalemissions are kept constant. This latter consideration says, ineffect, that environmental effects are not on a one-to-onerelationship with total SST emissions, and caution should be usedin evaluating any extrapolations of these effects based on such anassumption.
Finally, an attempt has been made in this report to present,results of the use of invariant model analyses in sufficient detailto be useful to other modelers. In particular, the presentationsof the simulations of turbulence structure and the diffusiveproperties of stratospheric flows are sufficiently detailed topermit direct use of these tools by the reader. As a minimum,these analyses permit a consistency check on the properties ofturbulence and the mean wind and temperature fields used in anydiffusion calculations. Unhappily, the models do not prescribethe forcing functions which' dictate the history of turbulence andall its consequences, but they do provide best estimates of theresults, given our best guesses as to what these functions are.One of our chores is to convert these "guesses" into facts.
REFERENCES
1. Man's Impact on the Global Environment: Assessment andRecommendations for Action. Report of the Study of CriticalEnvironmental Problems (SCEP), MIT Press, 1970.
2. Inadvertent Climate Modification. Report of the Study ofMan's Impact on Climate (SMIC), MIT Press, 1971.
3. Johnston, Harold: Reduction of Stratospheric Ozone by NitrogenOxide Catalysts from Superspnlc Transport Exhaust. Science,vol. 173, August 6, 1971, PP. 517-522.
4. Donaldson, Coleman duP. and Hilst, Glenn R.: Effect ofInhomogeneous Mixing on Atmospheric Photochemical Reactions.Environmental Science and Technology, vol. 6, Sept. 1972,pp. 812-816.
84 .

5. Donaldson, Coleman duP.: Atmospheric Turbulence and theDispersal of Atmospheric Pollutants. EPA-R4-73~Ol6a,March 1973.
6. Hilst, Glenn R., et al.: The Development and PreliminaryApplication of an Invariant Coupled Diffusion and ChemistryModel. A.R.A.P. Report No. 193, (also NASA CR- 2295 ),May 1973.
7. Hilst, Glenn R.: Solutions of the Chemical Kinetic Equations- - -for—I-n-1-M-a-l-l-y—I-nhoraoge-neeu-s- Mi-x-tures-.- Second -Conference--on
the Climatic Impact Assessment Program, Nov. 1972, pp. 351-357,
8. Lewellen, W. S. and Teske, M.: Prediction of the Monin -Obukhov Similarity Functions for an Invariant Model ofTurbulence. A.R.A.P. Report No. 185, to be published inthe J. of Atmos. Sciences, October 1973.
9. Ashburn, E. V., et al.: High Altitude Gust Criteria forAircraft Design. Tech. Report AFFDL-TR-70-101, October, 1970.
10. Kellogg, W. W.: Diffusion of Smoke in the Stratosphere.J. Meteorol., vol. 13, June 1956, pp. 241-250.
11. Rosenberg, N. W., Good, R. E. and Zimmerman, S. P.: TransportMeasurements in the Stratosphere. Second Conference on theClimatic Impact Assessment Program, Nov. 1972, pp. 247-253.
12. Bauer, Ernest: Dispersion of Tracers in the Atmosphere:Survey of Meteorological Data. Paper P-925, IDA ContractDAH 73 0200 Task T-90, February 1973.
13. Lilly, D. K.: Draft Copy, DOT/CIAP Monograph III, March 1973.
14. Grobecker, A. J.: Chairman's Address: The DOT ClimaticImpact Assessment Program. Proceedings of the SurveyConference (CIAP), February 1972.
15. Johnston, H. and Crosley, H.: CIAP Monograph I. J. Chem. Phys,vol. 22, 1954, pp. 689; ibid vol. 19, 1951, PP.'799.
16. Garvin, David, ed.: Chemical Kinetics Data Survey IV.Preliminary Tables of Chemical Data for Modelling of theStratosphere. CIAP Interim Report NBSIR 73-203, May 1973.
85