climate change as a contributor to terrorism: a case study
TRANSCRIPT

University of South Carolina University of South Carolina
Scholar Commons Scholar Commons
Senior Theses Honors College
5-2017
Climate Change as a Contributor to Terrorism: A Case Study in Climate Change as a Contributor to Terrorism: A Case Study in
Nigeria and Pakistan Nigeria and Pakistan
Natalie Lytle
Follow this and additional works at: https://scholarcommons.sc.edu/senior_theses
Part of the International and Area Studies Commons, and the Life Sciences Commons
Recommended Citation Recommended Citation Lytle, Natalie, "Climate Change as a Contributor to Terrorism: A Case Study in Nigeria and Pakistan" (2017). Senior Theses. 207. https://scholarcommons.sc.edu/senior_theses/207
This Thesis is brought to you by the Honors College at Scholar Commons. It has been accepted for inclusion in Senior Theses by an authorized administrator of Scholar Commons. For more information, please contact [email protected].
CLIMATE CHANGE AS A CONTRIBUTOR TO TERRORISM:
A CASE STUDY IN NIGERIA AND PAKISTAN
By
Natalie Lytle
Submitted in Partial Fulfillment of the Requirements for
Graduation with Honors from the South Carolina Honors College
May 2017
Approved:
Dr. Tamara Sheldon Director of Thesis
Dr. Barbara Bolt Second Reader
Steve Lynn, Dean
For South Carolina Honors College

2
Table of Contents
I. List of Illustrations 3 II. Thesis Summary 6
III. Introduction 8 a. Background on Climate Change 8 b. Background on Terrorism 10
IV. Hypothesis 12 V. Literature Review 11
VI. Main Body 17 a. Approach and Methods 17 b. Country Background Information 17 c. Data 21
VII. Analysis and Conclusion 30 a. Analysis 30 b. Conclusion 44
VIII. Threats to Identification 45 IX. Addenda 46
a. Appendix A: Data for Nigeria 47 b. Appendix B: Data for Pakistan 58 c. Bibliography 70
3
I. List of Illustrations
Figure Page
1. Nigeria Terrorism Attack Frequency & Number of Deaths 25
2. Pakistan Terrorism Attack Frequency & Number of Deaths 29
3. Nigeria Temperature & Number of Attacks 30
4. Nigeria Rainfall & Number of Attacks 31
5. Nigeria Temperature & Number of Deaths 32
6. Nigeria Rainfall & Number of Deaths 32
7. Nigeria Agriculture & Number of Attacks 33
8. Nigeria Agriculture & Number of Deaths 34
9. Nigeria Crop Production Index & Number of Attacks 35
10. Nigeria Crop Production Index & Number of Deaths 35
11. Pakistan Temperature & Number of Attacks 38
12. Pakistan Temperature & Number of Deaths 38
13. Pakistan Rainfall & Number of Attacks 39
14. Pakistan Rainfall & Number of Deaths 39
15. Pakistan Agriculture & Number of Attacks 40
16. Pakistan Agriculture & Number of Deaths 41
17. Pakistan Crop Production Index & Number of Attacks 42
18. Pakistan Crop Production Index & Number of Deaths 42
19. Nigeria Temperature Trend 47
20. Nigeria Rainfall Trend 47
21. Nigeria Frequency of Natural Disasters 1960-2016 48
22. Nigeria Total Deaths by Disaster Type 48
23. Nigeria Natural Disaster Total Damages 49
24. Nigeria Agriculture (% of GDP) & Agricultural Exports (% of Exports) 49
25. Nigeria Agriculture Raw Material Imports 50
26. Nigeria Cash Crop Gross Production Value 50
27. Nigeria Crop Production Index 51
28. Nigeria Food Production Index 51
29. Nigeria Prevalence of Undernourishment (% of Population) 52

4
30. Nigeria Per Capita Food Supply Variability 52
31. Nigeria GDP Growth, annual % 53
32. Nigeria Exports of Goods & Services (% of GDP) 53
33. Nigeria Export Value Index 54
34. Nigeria Carbon Dioxide Emissions 54
35. Nigeria Total Greenhouse Gas Emissions 55
36. Nigeria GDP Growth & Number of Attacks 55
37. Nigeria GDP Growth & Number of Deaths 56
38. Nigeria Deadliest Attacks 56
39. Nigeria Attack Target Distribution 57
40. Pakistan Temperature Trend 58
41. Pakistan Rainfall Trend 58
42. Pakistan Frequency of Natural Disasters 1960-2016 59
43. Pakistan Total Deaths by Disaster Type 59
44. Pakistan Natural Disaster Total Damages 60
45. Pakistan Agriculture (% of GDP) & Agricultural Exports (% of Exports) 60
46. Pakistan Agriculture Raw Material Imports 61
47. Pakistan Cash Crop Gross Production Value 61
48. Pakistan Crop Production Index 62
49. Pakistan Food Production Index 62
50. Pakistan Prevalence of Undernourishment (% of Population) 63
51. Pakistan Per Capita Food Supply Variability 63
52. Pakistan GDP Growth, annual % 64
53. Pakistan Exports of Goods & Services (% of GDP) 64
54. Pakistan Export Value Index 65
55. Pakistan Carbon Dioxide Emissions 65
56. Pakistan Total Greenhouse Gas Emissions 66
57. Pakistan GDP Growth & Number of Attacks 66
58. Pakistan GDP Growth & Number of Deaths 67
59. Pakistan Deadliest Attacks 67
60. Pakistan Number of Incidents by Decade 68
5
61. Pakistan Number of Deaths by Decade 68
62. Pakistan Attack Target Distribution 69

6
II. Thesis Summary
This thesis explores the relationship between climate change and terrorism. It seeks to
identify climate change as a contributing factor to terrorism. The motivation for this research is
the increasing threat from both global issues. The threat of climate change and terrorism were
heavily debated topics in the United States 2016 election, and remain contentious topics for
world leaders today. The years 2014 and 2015 were the top two deadliest years for global
terrorism, and out of the 17 hottest years on record, 16 of them have occurred since 2000. The
world has already begun to see the repercussions of climate change through increases in natural
disasters, extreme weather events, and shifting ecosystem characteristics. Political and
humanitarian leaders alike are searching for solutions to these seemingly separate issues, but if
they analyze climate change and terrorism as related factors, new solutions may appear that
could not have been developed previously. This is what this research is hoping to bring to light –
that terrorism and climate change are equally threatening to all nations.
The stated hypothesis of this paper is detrimental climate change implications that
particularly affect natural resources, such as floods and droughts, create civil unrest and
eventually a vacuum for terrorist events to occur. This would most likely occur in conjunction
with poor governance and/or political terror, which would result in a poor distribution of
resources for the population. A literature review was conducted and there were gaps found in
research directly comparing climate data and terrorism trends, especially for specific countries.
This paper focuses on Nigeria and Pakistan, due to their extensive experience with terrorism. The
2016 Global Terrorism Index ranks both countries in the top five, with Nigeria in third and
Pakistan in fourth. Nearly 78 percent of global terrorism-related deaths occurred in the top five
countries alone. The countries were not selected based on climate change vulnerability or
responsiveness, because climate change is a global issue, and all countries are experiencing its
effects. Albeit, developing countries are the most at risk for climate change. The climate and
terrorism data of the two countries were compared in a chronological fashion to discern if there
were correlating factors. The data include agriculture exports and imports, crop production
index, prevalence of undernourishment, GDP growth, exports as a percentage of GDP and export
value, carbon dioxide and total greenhouse gas emissions, rainfall, temperature, and extreme
weather events. This data was gathered from the World Bank, the Food and Agriculture
Organization, and various natural disaster databases. The terrorism data was gathered from

7
publications and the Global Terrorism Database. If there is a correlation present, terrorist attacks
are generally investigated to identify a correlation and potentially establish the climate events as
a contributing factor to the terrorism.
It was found that in Nigeria, climate trends and agriculture influence terrorism trends in
the country, specifically with the group Boko Haram, who recruits young men from families in
poverty. The current President of Nigeria also identifies the increasing violence between
different ethnic herding groups, many time fatal. The quantitative data can be linked to
qualitative reports and articles that also support this view of climate change as a threat multiplier
for conflict in Nigeria. A Regarding Pakistan, the link between climatic events and its violence is
not as clearly observed as is Nigeria’s. There are more intrastate political conflicts and ethnic-
religious tensions that feed the terrorism in Pakistan. It is also more heavily involved with
foreign actors and maintains a wider variety and wider spread of terrorism than Nigeria. This is
not to say that climate change is not worsening the situation and or creating a platform for
terrorism. As has been seen from natural disasters all over the world, unemployment and poverty
are indirect, if not direct, effects. The combination of the effects of the floods in 2010, increasing
temperatures, volatile precipitation patterns, poor agricultural governance, a deteriorating
situation in the Middle East and controversial foreign ties, the extensive increase in lethal
terrorism in Pakistan in the two most recent decades makes sense.

8
III. Introduction
a. Background on Climate Change
In the past 100 years, climate scientists have witnessed a drastic warming of the earth and
variability in climate in both hemispheres. There is debate on whether it is a normal climatic
cycle of the earth, but a clear majority of scientists agree that the climate variability experienced
in the two most recent centuries has been exacerbated by the industrial revolution and the
production of greenhouse gases that followed. The scientific community has established
benchmarks to try and prevent potential irrevocable consequences, and numerous state actors are
trying to establish agreements to stay under these benchmarks. An example of an agreement is
the Paris Agreement whose goal is to limit the impacts of climate change by limiting the
temperature increase to 1.5 degrees Celsius. The damaging effects of climate change are
amplified by a rising population and the extraction and utilization of resources. The
Intergovernmental Panel on Climate Change (IPCC) reports that since the 1950s, the warming of
the climate system is unequivocal and many of the observed changes are unprecedented. These
changes include the warming of the ocean, diminished amounts of snow and ice, and sea level
rise.1 It is also important to note the difference between global warming and climate change. The
United States Environmental Protection Agency defines climate change as “any significant
change in the measures of climate lasting for an extended period of time” and global warming as
“the recent and ongoing rise in global average temperature near Earth's surface…caused mostly
by increasing concentrations of greenhouse gases in the atmosphere, which trap infrared heat
causing a warming effect.”2 Other aspects of climate change include an increase in ocean
acidification, increase in extreme weather events, shifting ecosystem characteristics, and varying
precipitation patterns. Extra heat in the atmosphere has drastic changes on weather patterns and
the ocean, which results in more or less rain depending on location, and more detrimental natural
disasters. These effects can only be expected to increase in the future unless extreme measures
are taken to prevent any increased changes, and some of these have already been witnessed in the
form of massive floods, hurricanes, and droughts around the world.
1 IPCC. “Climate Change 2014: Synthesis Report.” (2014). Contribution of Working Groups I, II and III to the Fifth Assessment
Report of the Intergovernmental Panel on Climate Change [Core Writing Team, R.K. Pachauri and L.A. Meyer (eds.)]. IPCC, Geneva, Switzerland, 151 pp.
2 Environmental Protection Agency. “Overview of Climate Science.” (September 29, 2016). Retrieved from https://www.epa.gov/climate-change-science/overview-climate-change-science

9
Extreme weather events such as droughts, hurricanes, and floods have a large impact on
humans. Coastal communities are in fear of disappearing with rising sea levels, and the
increasing presence of heat waves poses health risks for children and elderly people, possibly
even creating uninhabitable areas. Out of the 17 hottest years on record since 1880, 16 have
occurred since 2000.3 In 2016, Jos Lelieveld, Director of the Max Planck Institute for Chemistry
and Professor at the Cyprus Institute, presented data that projected the climate of the Middle East
and North Africa which indicated the number of extremely hot days could increase “fivefold” by
2100.4 This would create dangerous conditions for a large part of each year for the habitants.
Water supplies and water quality will only worsen with increased droughts and changes in
precipitation patterns and prolong the world water crisis, especially in areas already experiencing
it. The combination of water issues, precipitation volatility, and prolonged heat waves is a threat
to food production across the globe. Increases in the frequency and intensity of extreme weather
events can increase losses to property, cause costly disruptions to society, and reduce the
availability and affordability of insurance.5 Currently, 20 million people in South Sudan, Yemen,
Somalia, and northeast Nigeria are experiencing dangerous levels of food insecurity and are all
on the brink of a famine that the UN attributes to both conflict and climate issues.6 As can be
seen by this brief overview, climate change impacts every aspect of the natural world, including
humans, in both short and long range repercussions. The risks disproportionately affect
disadvantaged areas of the world, such as areas in which infrastructure is not as developed,
because it is more difficult for the inhabitants to repair damage and access scarce resources.
World leaders and organizations have identified two methods to approach these issues:
mitigation and adaptation. Mitigation is an attempt to reduce the human activities that contribute
to climate change, such as utilizing fossil fuels for energy, which create greenhouse gases that
trap warmth in the atmosphere. Adaptation is the act of adapting to the new climate and would
include actions such as strengthening storm water systems because there will be more frequent
3 Brandon Miller. “2016 Was the Hottest Year on Record – Again.” Cable News Network. (January 18, 2017). Retrieved from
http://www.cnn.com/2017/01/18/world/2016-hottest-year/index.html 4 Emmanuel Akinwotu. “Drought Worsens Deadly Battle Between Fulani Herdsmen and Farmers in Nigeria.” The Guardian
(January 3, 2017). Retrieved from https://www.theguardian.com/global-development/2017/jan/03/drought-worsens-deadly-conflict-between-fulani-herdsmen-nigeria-farmers
5 Environmental Protection Agency. “Climate Change: Basic Information.” (January 17, 2017). Retrieved from https://www.epa.gov/climatechange/climate-change-basic-information
6 UN News Centre. “Tackling Hunger Crises in South Sudan, Somalia, Nigeria and Yemen Requires $4.4 billion.” UN News Service. (February 22, 2017). Retrieved from http://www.un.org/apps/news/story.asp?NewsID=56223#.WPET8qPMxsN

10
and damaging weather. Both adaptation and mitigation will be necessary to fully prepare for
climate change ramifications.
b. Background on Terrorism
Terrorism is a difficult concept to define, and scholars and government leaders alike struggle
to fully grasp it in its entirety. In the simplest of terms as defined in the Oxford English
Dictionary, it’s the “unlawful use of violence and intimidation, especially against civilians, in the
pursuit of political aims.”7 This explanation is not sufficient to understand its causes and actors.
William Cunningham, an adjunct professor in the Institute for Conflict Analysis and Resolution
at George Mason University, defines terrorism more adequately in the book Terrorism:
Concepts, Causes, and Conflict Resolution as “a violent act or threat of violence against civilians
or non-combatants in order to further a political cause by the psychological effects of the terror
created by the act.”8 The word terrorism first appeared during the French Revolution, in which it
was associated more with an idea of democracy and virtue, and dealt with revolution. Since then,
it has transformed from a label openly claimed by groups to one many avoid because it focuses
more on freedom and liberation, righteous vengeance, or self-defense.
The idea of a terrorist or terrorist group is dependent on one’s reality. It can be used to
describe non-state enemies on both sides of an issue.9 Understanding this explanation of
terrorism is useful because in recent years it has become more difficult to separate the idea of
terrorism from the Middle Eastern groups that have dominated the concept in the twenty-first
century. Terrorism comes in many forms from many sources to satisfy many political ends, and
because of that there are many potential causes. The 2016 Global Terrorism Index conducted a
statistical test to identify significant factors associated with terrorism. These results were
separated into two country categories: members in the Organization for Economic Cooperation
and Development (OECD) and non-members. Significant factors that were present in both
country categories included higher levels of political terror, lower respect for human rights, the
7 Oxford English Dictionary. “Terrorism.” Oxford University Press. (2017). Retrieved from
https://en.oxforddictionaries.com/definition/terrorism 8 William Cunningham, et. al. “Terrorism: Causes, Concepts and Resolutions.” Printed: Defense Threat Reduction Agency Fort
Belvoir. (January 2003). Retrieved from http://scar.gmu.edu/sites/default/files/global-documents/Sandole-Terrorism_concepts.pdf
9 Bruce Hoffman. Inside Terrorism. Ch. 1. New York Columbia University Press. (1998). Retrieved from http://www.nytimes.com/books/first/h/hoffman-terrorism.html
11
existence of policies targeting religious freedoms, group grievances, political instability and
lower respect for the UN or the EU. In other words, both countries saw these as correlating
factors with terrorist events. The report also found that in OECD member countries, socio-
economic factors carry more weight, whereas in non-OECD countries, internal conflict including
violence and corruption are shown to be the most prominent factors in driving terrorism.10 In
both countries, when individual or group rights are threatened, especially from the political entity
in that state, there is a stage set for terror: “93 percent of all terrorism attacks [between 1989 and
2014] occurred in countries with violent political terror.”11 While each terrorist event is distinct
and difficult to predict, there are situational factors that act as enablers for terrorism to occur.
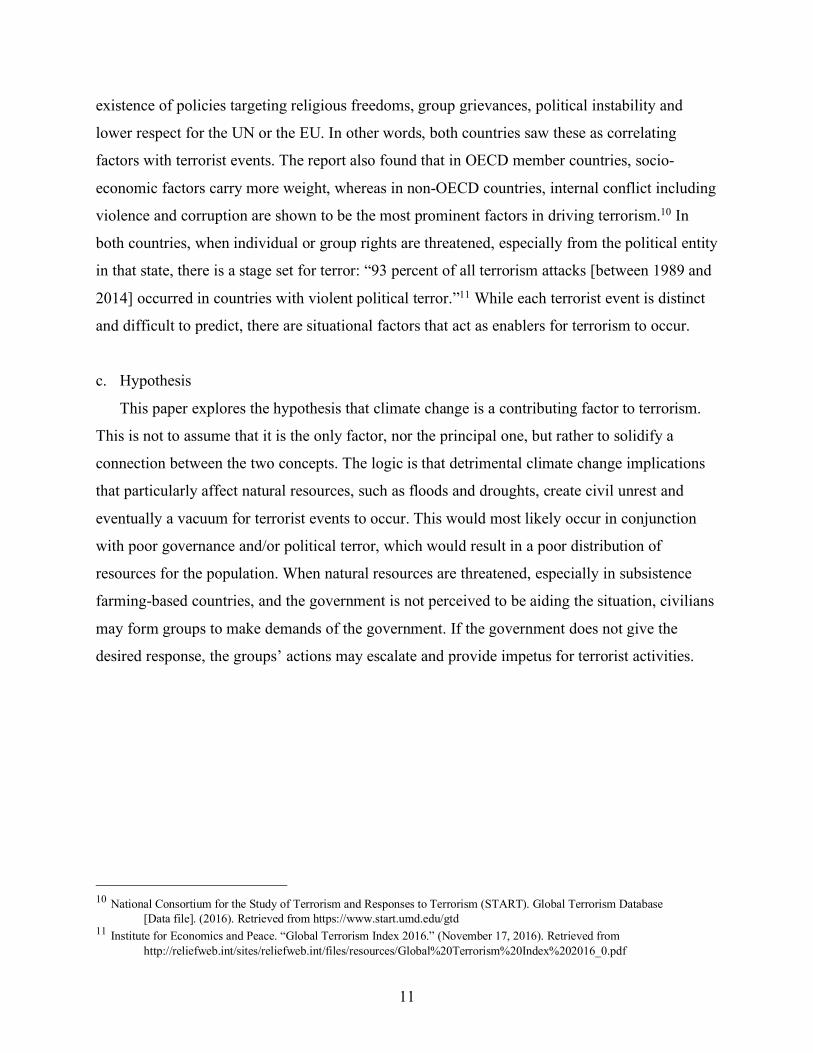
c. Hypothesis
This paper explores the hypothesis that climate change is a contributing factor to terrorism.
This is not to assume that it is the only factor, nor the principal one, but rather to solidify a
connection between the two concepts. The logic is that detrimental climate change implications
that particularly affect natural resources, such as floods and droughts, create civil unrest and
eventually a vacuum for terrorist events to occur. This would most likely occur in conjunction
with poor governance and/or political terror, which would result in a poor distribution of
resources for the population. When natural resources are threatened, especially in subsistence
farming-based countries, and the government is not perceived to be aiding the situation, civilians
may form groups to make demands of the government. If the government does not give the
desired response, the groups’ actions may escalate and provide impetus for terrorist activities.
10 National Consortium for the Study of Terrorism and Responses to Terrorism (START). Global Terrorism Database
[Data file]. (2016). Retrieved from https://www.start.umd.edu/gtd 11 Institute for Economics and Peace. “Global Terrorism Index 2016.” (November 17, 2016). Retrieved from
http://reliefweb.int/sites/reliefweb.int/files/resources/Global%20Terrorism%20Index%202016_0.pdf
12
IV. Literature Review
It is necessary to review previous publications on both the damaging effects of climate
change and its potential relationship to terrorism in order to fully define the hypothesis of this
paper. The 2014 IPCC Climate Change Synthesis Report lists five reasons for concern (RFCs)
regarding climate change: 1.) unique and threatened systems, 2.) extreme weather events, 3.)
distribution of impacts, 4.) global aggregate impacts, and 5.) large-scale singular events (e.g., the
melting of the Greenland ice sheet). The two most relevant RFCs to this paper are extreme
weather events and the distribution of impacts. Hurricanes, floods, and heat waves are examples
of extreme weather events that profoundly affect areas that rely on agriculture for a living. These
weather events combined with Earth’s surface temperature increasing reduce fresh water and
arable land availability for the long term. In the article “Global Warming and Its Health Impact”,
Antonella Rossati provides a 2025 forecast which shows that 64 percent of the world’s
population will live in water-stressed basins. Water scarcity is due to an increase in heat and
precipitation volatility, which both result from a 2.5 degree Celsius increase in average global
temperature. This scarcity could put 20 to 30 percent of all plant and animal species at high risk
of extinction – a massive loss of biodiversity.12 Within that loss, crop yield production is
expected to decrease and disrupt the market for commodities that people both need for exports
and subsistence. The article “Strategic Implications of Climate Change” in the journal Survival,
shows that in the developing world this commodity disruption and reduction in crop yields could
seriously undermine political and economic stability.13
Commodity disruption will more heavily affect populations who are highly reliant on
agriculture. Many developing countries, such as Nigeria and Pakistan, are agriculture-dependent
economies. Therefore, the distribution of impacts refers to the fact that disadvantaged people will
bear greater risk for the consequences of climate change. Aside from resource scarcity, a lack of
infrastructure is another detriment to developing countries when battling the effects of climate
change. Because the current systems of most developing countries are not resilient, one can
imagine how they will fare under more extreme weather and shifting ecosystems. Disaster relief
will only become a greater expense for the global community. Environmental refugees will also
12 Antonella Rossati, “Global Warming and Its Health Impact.” International Journal of Occupational & Environmental
Medicine, 8(1) (2017): 7-20. 13 Alan Dupont, “The Strategic Implications of Climate Change.” Survival (00396338), 50(3), (2008): 29-54.
doi:10.1080/00396330802173107
13
become more prevalent in developing countries. Refugees have been a topic of argument that has
escalated recently due to the Syrian Civil War, and combined with political disturbances, climate
change could force populations to migrate simply because their homeland is uninhabitable. It is
predicted that people will move in response to a deteriorating environment, again in developing
countries. These movements will be amplified by political turbulence, military conflict,
ecological stress and socio-economic changes that stem from unfavorable climatic effects.14 This
response is logical as the articles and reports reviewed for this paper all project soil degradation,
volatile temperatures, and other disastrous effects to the agricultural systems and some of which
have been witnessed already. An article published in Statistical Modeling: An International
Journal, emulated the global climate change impacts on crop yields and found that irrigated
crops are more sensitive to temperature than precipitation, whereas rain-fed crops react more to
carbon dioxide changes, latitude, leaf area index, and baseline seasonal temperature.15 It’s
important to reiterate just how sensitive these processes are, and how slight changes in climatic
conditions can shock agriculture systems that developing populations depend on heavily. In the
journal American Psychologist, an article compares information dissemination and responses to
terrorism and climate change. Its findings also predict that the inevitable mass migrations that
will come from unmitigated climate change will rarely be resolved in a conflict-free manner.
When the projections are less extreme, and more likely, a temperature increase of 4 degrees
Celsius could still displace 187 million people during the remainder of this century, largely due
to rising sea levels.16
The idea that climate change may be a driver of social and political instability is not a
new idea. Many articles projecting future climate change effects mention violent conflict as a
risk. In an article in Peace Review: A Journal of Social Justice, the authors claim that climate
change has induced terrorism and internal conflict in most African countries and specifically
analyze Nigeria due to the natural disasters that have threatened food security, such as the 2012
floods that washed away farmlands in Kogi and Abuja. Many times, families must migrate to
find food or employment, which creates ethnic tension, overpopulation, food scarcity, and
14 Alan Dupont, “The Strategic Implications of Climate Change.” Survival (00396338), 50(3), (2008): 29-54.
doi:10.1080/00396330802173107 15 Oluwole Oyebamiji., et. al. “Emulating Global Climate Change Impacts on Crop Yields.” Statistical Modelling: An
International Journal, 15(6) (2015): 499-525. doi:10.1177/1471082X14568248 16Stephan Lewandowsky, et. al, “Misinformation, Disinformation, and Violent Conflict.” American Psychologist, 68(7) (2013):
487-501. doi:10.1037/a0034515

14
artificial increases in the cost of living.17 Hunger and frustration lead to aggression and unrest in
the society, and when there are no jobs at home for the youth, they turn to crime to obtain what is
needed for their families. This desperation feeds into the militant and terrorist groups in Nigeria.
Oluremi Tinubu, the Vice-Chairwoman of the Nigerian Senate Committee on Labor,
Employment and Productivity, reiterates this stating that “the problem with Nigeria and terrorism
is the level of hunger.”14 It is difficult to accurately measure the indirect effects of an extreme
weather event on populations. In a study conducted by the UNHabitat consultant, farmers from
both the North and South of Nigeria are interviewed, due to two regions having distinct climates.
In the North, the farmer explains how food scarcity has forced villagers to migrate and travel to
another village, where they are unwelcome due to the competition for resources. The two groups
fight and kill each other because it is “more honored to die of war than to die of hunger…. Since
people do not have anything to eat or have forage for animals, they…go to the jungle to identify
with the extremists.” They believe that the government has failed them. In the South, gas flaring
and oil spillage wreck the land and air, making it extremely difficult to hunt for food or produce
crops. The government claimed that restrictions have been placed upon the invasive oil
companies, but citizens have yet to see a change in their behavior. The pollution from the gas
flaring enters the local precipitation system producing “black rain” which ruins crops and
induces health problems such as asthma. They reemphasize that it is the same in the South: when
there is no food, many youths leave to join militant groups.14
The relationship between resources scarcity and violent conflict is supported in “Global
Warming and Its Health Impact”, which describes how desertification threatens the economies
based on subsistence agriculture, as the competition for resources results in violence between
farmers and nomadic herders.18 The article also references a study conducted by economist
Marshall Burke at the University of California, Berkeley, that found a relationship between civil
conflict resulting in at least 1,000 deaths in sub-Saharan Africa and warmer temperatures in the
same and previous years of 1982 to 2001. This study is also referenced in an article in Nature,
citing the prediction of an alarming 54 percent increase in the incidence of civil conflict in this
17 Afolabi Aribigbola, et. al, “Climate Change and Insecurity are Like a Chain Reaction.” Peace Review, 25(4), (2013): 518-525.
doi:10.1080/10402659.2013.846169 18 Antonella Rossati, “Global Warming and Its Health Impact.” International Journal Of Occupational & Environmental
Medicine, 8(1) (2017): 7-20.
15
region by 2030, with additional deaths in the hundreds of thousands based on future warming
projections.19
Still, many factors are involved in civil conflict with climate conditions not being the sole
driver. The authors of the article “Economic Shocks and Civil Conflict: An Instrumental
Variables Approach” note that the relationship between GDP growth and the incidence of civil
wars is extremely strong. A five-percentage-point drop in annual economic growth increases the
likelihood of a civil conflict (at least 25 deaths per year) in the following year by over 12
percentage points. GDP level, democracy, ethnic diversity, oil exporter status and other variables
were also measured, but none were found to have as a strong effect as GDP growth.20 GDP
growth can be affected by a decrease in exports or weakening of the domestic economy, which
most definitely occurs when a nation is negatively impacted by climate change and its natural
resources are vulnerable.
The 2015 Climate Change and Environment Risk Atlas evaluates 198 countries across 26
issues on their sensitivity of populations, physical exposure, and governmental capacity to adapt
to climate change over the next 30 years. The ten countries with the highest level of risk are
Bangladesh, Sierra Leone, South Sudan, Nigeria, Chad, Haiti, Ethiopia, Philippines, Central
African Republic and Eritrea. The growth economies in the extreme risk category include
Cambodia, India, Myanmar, Pakistan, and Mozambique. Each of these countries heavily relies
on agriculture for revenue (65 percent employed in the sector), and a climatic threat to their
agriculture sector incites instability, which can lead to terrorism. It references Nigeria as the
prime example, because the emergence of Boko Haram and violence in the Northeast can be
attributed to socioeconomic conditions created by drought and food insecurity. The Arab Spring
was also found to be initiated by food price volatility and food insecurity, especially in Egypt
and Syria.21
A 2014 U.S. Department of Defense report refers to climate change as a “threat
multiplier” that is the “root of government instability that leads to widespread migration,
19 Andrew Solow, “Global Warming: A Call for Peace on Climate and Conflict.” Nature, 497(7448) (2013): 179-180.
doi:10.1038/497179a 20 Edward Miguel, et. al, “Economic Shocks and Civil Conflict: An Instrumental Variables Approach.” Journal of Political
Economy, 112(4) (2004): 725-753. doi:10.1086/421174 21 Verisk Maplecroft Analytics. “Climate Change and Environmental Risk Atlas 2015.” Verisk Maplecroft. (October 29, 2014).
Retrieved from https://maplecroft.com/portfolio/new-analysis/2014/10/29/climate-change-and-lack-food-security-multiply-risks-conflict-and-civil-unrest-32-countries-maplecroft/
16
damages infrastructure and leads to the spread of disease”.22 The paper published in the
academic journal, PNAS, attempts to confirm this idea of climate change as a threat multiplier by
analyzing the Syrian drought and its implications. It dives deep into precipitation data and the
regional climate variability and trends and identifies a relationship between human interference
with climate. This is related to severe drought which led to agricultural collapse and mass human
migration. A combination of the strain put on the agriculture sector and government policies that
promoted unsustainable practices initiated this mass migration, which the government also failed
to address correctly. The authors recognize that there are multiple factors interacting to produce
the civil war that has only worsened since the publishing date. But to further support the
hypothesis, an interview with a Syrian farmer is referenced, in which she was questioned about
the drought and its contribution to civil unrest, she replied, “’Of course. The drought and
unemployment were important in pushing people toward revolution. When the drought
happened, we could handle it for two years, and then we said, ‘It’s enough.’”23
These articles and reports provide sufficient support to make a general assumption that
climate change could result in social and violent conflict. Very few were found to analyze
climate and socioeconomic data against terrorism trends in specific areas. This paper will
analyze two cases specifically, Nigeria and Pakistan, both plagued by terrorism, and search for
links between climate variations and terrorism trends.
22 Justin Worland, “Why Climate Change and Terrorism are Connected.” Time.Com, N.PAG. (November 15, 2015). 23 Colin Kelley, et. al. “Climate Change in the Fertile Crescent and Implications of the Recent Syrian Drought.” PNAS.org
112(11) (March 17, 2015). doi:10.1073/pnas.1421533112

17
V. Main Body
a. Approach and Methods
This paper focuses on Nigeria and Pakistan, due to their extensive experience with terrorism.
The 2016 Global Terrorism Index ranks both countries in the top five, with Nigeria in third and
Pakistan in fourth. Nearly 78 percent of global terrorism-related deaths occurred in the top five
countries alone.24 The countries were not selected based on climate change vulnerability or
responsiveness, because climate change is a global issue, and all countries are experiencing its
effects. Albeit these two countries have been described as more vulnerable to the effects of
climate change. The climate and terrorism data of the two countries are compared in a
chronological fashion to discern if there are correlating factors. The data include agriculture
exports and imports, crop production index, prevalence of undernourishment, GDP growth,
exports as a percentage of GDP and export value, carbon dioxide and total greenhouse gas
emissions, rainfall, temperature, and extreme weather events. This data was gathered from the
World Bank, the Food and Agriculture Organization, and various natural disaster databases. The
terrorism data was gathered from publications and the Global Terrorism Database. If there is a
correlation present, terrorist attacks are generally investigated to identify a correlation and
potentially establish the climate events as a contributing factor to the terrorism.
b. Country Background Information
Nigeria
Nigeria is considered a country that relies heavily on agriculture, and one that has
experienced economic downturn in recent years. In 2015, Nigeria reported 481 billion USD in
GDP, which is a large decrease from 569 billion dollars from the previous year, and the first drop
since 2008. The country attributes 21 percent of its GDP to agriculture, and the world average is
four percent. From 2000 to 2015 both its GDP and agriculture had an annual growth of
approximately eight percent. Its exports have seen the largest decrease, as they are currently at
only ten percent. The unemployment rate in 2014 was almost eight percent of the population,
which is an insignificant change from 1991. Approximately 46 percent of the population lives
below the national poverty line, and 55 percent of the population has access to electricity and 69
24 Institute for Economics and Peace. “Global Terrorism Index 2016.” (November 17, 2016). Retrieved from
http://reliefweb.int/sites/reliefweb.int/files/resources/Global%20Terrorism%20Index%202016_0.pdf

18
percent to clean water. Although its infrastructure has improved over the past couple decades,
climate change poses a threat to water supply.25
The IPCC labeled Nigeria a “hot spot” likely to see major shifts in weather in the twenty-first
century. It has experienced a myriad of these effects already, and due to its varying climate
regions, it’s difficult to lay out an adaptation plan for the ramifications to come. In the North, the
country is comprised of an arid savanna, and forested coastal areas make up the South. Its coastal
areas have seen more rain than usual, which is a common effect of climate change – an increase
in coastal area rainfall but decrease of interior land rainfall. The situation is worsened by the sea
level rise, which is estimated to displace 14 million people in those same coastal areas. There is a
significant reduction in arable land due to an average temperature increase and undesirable
rainfall patterns over the most recent decades. The Sahara Desert is also observed to be
encroaching from the north imposing a rapid shrinkage of Lake Chad.26
Generally, terrorism in Nigeria can be categorized in three waves, but only the most recent
will be relevant to this paper. It is important to note that before that, Nigeria’s terrorism can be
characterized by inter-village conflict and the Nigerian Civil War. This war lasted from mid-July
of 1967 to January of 1970, killing over one million people from fighting and famine. The
country had gained its independence in 1960, and since, arbitrary borders had been drawn
between various ethnic groups. Hausa-Fulani were in the North, Yoruba in the West, and Igbos
in the East. Overall, the South was predominantly Christian and the North Muslim, much like
today.27 The war was officially started by a “military coup (carried out by Maj. Nzeogwu which
led to the death of Tafawa Belewa, etc), a counter-coup (led by Gowon, which led to the brutal
murder of Aguiyi Ironsi, Fajuyi, etc) and the 1966 anti-Igbo pogrom in the north (persecution of
Igbo people living in Northern Nigeria).”28 The eastern region then declared itself the
independent Republic of Biafra. Many characterize the anti-Igbo actions as genocide, and there
is dispute as to whether the Nigerian government was involved in the killings. Multiple foreign
actors, such as the U.S. and the U.K. became involved, as well as foreign oil companies, such as
25 The World Bank. World Bank Development Indicators. (2016). [Data File] Retrieved from http://data.worldbank.org 26 Odjugo Akpodiogagaa Ovuyovwiroye, “General Overview of Climate Change Impacts in Nigeria.” Kamla-Raj Journal of
Human Ecolology, 29(1) (2010): 47-55 https://www.usip.org/sites/default/files/Climate_Change_Nigeria.pdf 27 Lasse Heerten, Dirk Moses. "The Nigeria-Biafra War: Postcolonial Conflict and the Question of Genocide." Journal of
Genocide Research. 16 (August 21, 2014): 169-203. http://dx.doi.org/10.1080/14623528.2014.936700 28 Nkem Ikeke. "10 Things You Should Know About Biafra and the Biafran War." Nigeria Breaking News. (2016). Retrieved
from https://www.naij.com/629644-10-things-need-know-biafra-biafran-war.html
19
Shell. The war became a stalemate towards the end, and eventually the Biafrans were starved of
resources and had to surrender. This civil war is important to note as it was a massive
humanitarian crisis and many frustrations against the government and oil companies are still
present decades later.
The third wave includes groups such as, O’Odua Peoples’ Congress (OPC), Abia State
Vigilante Service, Imo State Vigilante Service, Niger-Delta Volunteers Force, Ogoni Youth,
Mambilla Militia Group, and Boko Haram. These groups budded from factors such as the
economic recession in the 1980s, falling commodity prices, currency devaluation, and civil
conflict combined with a reduced ability of the government to fund welfare projects, increasing
job cuts and inflation rates. Civilian frustration was only aggravated by dictatorships, under
which people felt as if their needs weren’t being met.29 Civil conflicts can often transform into
violent group action, as President Muhammadu Buhari, the current President of Nigeria, notes in
a speech. In November of 2016, he spoke on the connection between oil prices, pipeline
vandalizing, and GDP rates. He states:
Turning to Fulani herdsmen and farmer clashes, this has had an unfortunate long history. Disputes have arisen, use of essential resources, farmlands and grazing areas and water, farmers complaining of invasion of their farms and destruction of their crops by cattle, climate change and the continuous decrease in grazing land have led to even greater complications and the dire needs that have continually presented this particular problem. More recently, the disputes have turned more violent with the arming of herdsmen with guns.30
This statement connects the importance of the climate to the stability of a nation. Climatic shifts
can easily incite negative relations between groups, which in turn foster an environment for these
groups from the third wave to form.
An important terrorist group to note is Boko Haram. Boko Haram was founded in 2002
by Mohammed Yusuf with the initial focus was to oppose Western education. This focus shifted
in 2009 when the group launched military operations to create an Islamic nation in the 12
northern states of Nigeria and eventually the entire country. The northern half is already
predominately Muslim, but the South is mostly Christian. In 2013, the U.S. declared it a terrorist
group, and three northern states in Nigeria declared a state of emergency as Boko Haram had
escalated to bombings of churches, military barracks, and U.N. headquarters. This worsened
29 Adeyemi Oyenini, “Terrorism in Nigeria: Groups, Activities, and Politics.” International Journal of Politics and Good
Governance. 1(1.1) (2010). Retrieved from http://onlineresearchjournals.com/ijopagg/art/42.pdf 30 Federal Republic of Nigeria. Speech by His Excellency, President Muhammadu Bahari. (Novermber 21, 2016). Retrieved
from http://www.statehouse.gov.ng/index.php/news/2881-speech-by-his-excellency-president-muhammadu-buhari

20
when citizens fled the cities and Boko Haram began raiding villages, abducting women and
children, and recruiting young men to its army. The following year, the group abducted 200
schoolgirls in a northern state in Nigeria to sell and marry off, which garnered international
attention. Since then, the group has been divided and said to be defeated by some sources, but
remains an issue for the country of Nigeria.31 The problem is exacerbated by a general distrust of
state institutions and the government. A 2009 report by Amnesty International accused the
Nigerian Police Force of hundreds of extrajudicial disappearances and killings each year, which
have all gone uninvestigated.32 Although Boko Haram did not have its beginnings rooted in
natural resource scarcity, that element aids the group in its goals. Especially near the Lake Chad
area, in which the drought-caused instability forces migration and increases unemployment, the
ideal breeding ground for Boko Haram recruits.
Pakistan
Pakistan is also a country considered to be highly reliant on its agriculture sector. Its 2015
GDP was 272 billion USD and has been growing relatively steadily over the years, with an
average annual growth rate of four percent from 2000. Agriculture comprises 25 percent of
Pakistan’s GDP, and from 2000-2015 it only grew at an average annual rate of three percent.
Pakistan’s unemployment rate is around five percent of the population, and approximately 30
percent lived beneath the national poverty line in 2013. Over 90 percent of the population has
access to a clean water source and electricity, which is a much higher portion than in Nigeria. Its
exports of goods and services as a percentage of GDP are at 11 percent, which is an
unremarkable change from 13 percent in 2000.33
Pakistan’s history with terrorism is linked to interactions with neighboring countries. The
coup in 1973 in Afghanistan, the Soviet invasion of Afghanistan in 1979, and the Iranian
revolution of 1979 each fostered an environment that, combined with Pakistan’s domestic
politics, allowed for the devastating terrorism it experiences today. When Muhammad Daud took
control of Afghanistan in 1973, he began claiming Pakistani territory, which strengthened a
31 BBC News. “Who are Nigeria’s Boko Haram Islamist Group?” BBC. (November 24, 2016). Retrieved from
http://www.bbc.com/news/world-africa-13809501 32 Christopher Bartolotta, “Terrorism in Nigeria: The Rise of Boko Haram.” World Policy Institute. (September 19, 2011).
Retrieved from http://www.worldpolicy.org/blog/2011/09/19/terrorism-nigeria-rise-boko-haram 33 The World Bank. World Bank Development Indicators. (2016). [Data File] Retrieved from http://data.worldbank.org

21
rebellion in the country. This instability created by the rebellion in Afghanistan put it in a
vulnerable position regarding the Soviet Union. Then began Soviet invasion, which Pakistan
staunchly opposed through a policy of Islamization of its own country. This included religion-
based education and supporting religious militias, which increased tensions within the country.
Following this, Iran’s civil unrest between the Sunni and Shiite populations played out on
Pakistan’s borders as well, which incited fear in the Shiite majority in Pakistan. This furthered
the sectarian divide that already existed. Terrorism in the 1990s can be attributed mostly to
ethnic and sectarian conflict. Lastly, in the early 2000s, Pakistan decided to support NATO with
logistics when the U.S. launched the War on Terror and invaded Afghanistan. Naturally, this
angered militant religious actors that had felt patronized by the State in its previous actions.
Terrorist incidents were most frequent in the 1990s but most lethal in the 2000s. There are also
various non-sectarian terrorist events that occurred that are not relevant to wholly understand the
terrorism climate in Pakistan.34
c. Data
Temperature and rainfall data were obtained from The World Bank. Agriculture data
including exports, imports, percentage of GDP, crop production, food production, prevalence of
undernourishment, were also obtained from The World Bank Development Indicators. This is
also true for socioeconomic indicators of each country such as GDP and GDP growth, exports as
a percentage of GDP, export value, unemployment, carbon dioxide emissions and total
greenhouse gas emissions. More detailed crop data such as cash crop production and food per
capita availability were obtained from the Food and Agriculture Organization. Terrorism data
were obtained from the Global Terrorism Database, provided by National Consortium for the
Study of Terrorism and Responses to Terrorism, published papers, and various news sources.
Each of the country’s data will be analyzed in the following order: weather, natural disasters,
agriculture and socioeconomic data, emissions, and terrorism.
34 Roger Martin, et. al. “Historical Patterns of Terrorism in Pakistan.” Defense & Security Analysis, 30(3) (2014): 209-229, doi:
10.1080/14751798.2014.921450

22
Nigeria
Weather
The average temperature in Nigeria gradually rose from 1901 through the late 1960s,
when there was a sharp increase in temperatures that has continued to date. Rainfall also
generally declined over the same period and sharply decreased as well in the 1970s. The
particularly hotter years include 1969, 1973, 1987, 1990, 1998, 2009, and 2010, as can be seen in
Figure 19. Rainfall follows the same pattern by slowly decreasing, then experiencing a sharp
decline after 1960. In the years 1973, 1982, 1983, 1987, 2005, and 2011 there is a significantly
lower rate of rainfall and an unnaturally higher rate in 2008 and 2012, which can be seen in
Figure 20.
Natural Disasters
Nigeria has experienced more frequent natural disasters due to climate change. From 1960 to
2016, there were 28 riverine floods impacting over ten million people and costing approximately
630 million USD.35 Specifically, the rainfall-induced flood of 2012 affected more than 7.7
million people in 32 of Nigeria’s 36 states, resulting in 363 deaths and almost 600,000 houses
damaged or destroyed.36 Droughts were less frequent during 1960 through 2016, but affected 3
million people and incurred around 71 million USD in costs.35 They also increases the likelihood
of wildfires, which is important to note, as half of Nigeria’s terrain is comprised of a wildfire-
prone arid savanna. For natural disaster data see Figures 21-23.
Seventy percent of Nigeria’s land area experiences bush fires and economic losses, with the
1982 and 1983 wildfires costing more than 30 million USD.37 Increasing air and soil
temperatures combined with less rainfall in certain areas of the country create a drier
environment, putting the crops at a higher risk for fire. This danger is expected to increase as the
earth’s surface temperature is projected to continue rising with the sustained release of
greenhouse gases into the atmosphere. The Nigerian farmers do not help the problem, as they
clear large areas of the forest for agriculture, or even light fires to arable land to prevent other
35 Debarati Guha-Sapir, et. al, EM-DAT: The CRED/OFDA International Disaster Database – www.emdat.be –
Université Catholique de Louvain – Brussels – Belgium. 36 United Nations Office of the Coordination of Humanitarian Affairs (OCHA). “Nigeria: Floods –July 2012.” Relief Web.
Retrieved from http://reliefweb.int/disaster/fl-2012-000138-nga 37 International Forest Fire News. “Fire Situation in Nigeria.” (IFFN) No. 34 (January-June, 2006): (89-93). Retrieved from
http://www.fire.uni-freiburg.de/iffn/iffn_34/12-IFFN-34-Nigeria.pdf

23
villages from using it. This incites a shift of the more arid savanna zones southward towards the
forested and coastal areas.37 The combination of rising temperatures and decreasing rainfall has
led to a loss of 350,000 hectares of land annually to desertification and costing around 5 billion
USD, which is occurring in the Lake Chad area.38 This drought increases tensions between
natives as hundreds are being displaced from crop land in search for jobs, food, and water. Both
national and international politicians alike note the danger of the increasing insecurity of Lake
Chad as Niger’s Minister of Defense, Mahamadou Karidjo, told delegates at COP21 that due to
hunger, poverty, and insecurity, young people are lost and targeted by Boko Haram’s
recruiters.39
Agricultural and Socioeconomic Indicators
Nigeria’s agriculture sector has been slowly declining over the most recent decades.
From 1962 to 1980 there was a steep regression in agricultural exports. They were reported at 16
percent in 1962, but since 1972, they have not exceeded two percent, except for a small bubble
from 2010 to 2012. The data available for agriculture as a percent of GDP is from 1980 to 2014,
and it was volatile through 2009, ranging from 25 percent to 50 percent with sharp increases in
1988, 1994, 2002, and 2009. Since then it has declined to its lowest at approximately 20 percent
of GDP. For full data for these two indicators see Figure 24. Agricultural imports in Nigeria have
been unstable and inconsistent with increases in 1973, 2001, 2012, and 2013 and have never
ventured above four percent of merchandise imports. On average, they comprised about one
percent of merchandise imports from 1962 to 2014, which can be seen on Figure 25. The
country’s cash crops include yams, cassava, millet, soybeans, palm oil, etc. Their production
decreased in 1999, 2007, 2009, and 2011. For full cash crop data see Figure 26. Nigeria’s crop
production index has seen a successful increase from 21 to 108 from 1961 to 2013, but the
consistent incline was interrupted by volatility in 2006, as seen in Figure 27. Nigeria’s food
production index follows the same pattern, seen in Figure 28. The prevalence of
undernourishment decreased greatly from 21 percent to 5.9, but since 2008, it has slowly been
rising again. It was reported at seven percent in 2015, as seen in Figure 29. In Figure 30, the food
38 Odjugo Akpodiogagaa Ovuyovwiroye, “General Overview of Climate Change Impacts in Nigeria.” Kamla-Raj Journal of
Human Ecolology, 29(1) (2010): 47-55 https://www.usip.org/sites/default/files/Climate_Change_Nigeria.pdf 39 Krinniger, T. “Lake Chad: Climate Change Fosters Terrorism.” Deutsche Welle. (July 12, 2015). Retrieved from
http://www.dw.com/en/lake-chad-climate-change-fosters-terrorism/a-18899499
24
supply variability has been extremely volatile with sharp decreases in 1992, 1996, 1999, 2005,
2009, and 2010. This shows the hunger that Nigeria’s population experiences in varying degrees.
Nigeria’s GDP has grown at an average of 3.7 percent from 1980 through 2014. There
are periods of negative growth in the late 60s through the late 80s. Overall exports as a
percentage of GDP have been extremely volatile from 1960 through 2015, reaching a high in
2000 at around 52 percent. Since then they have been decreasing drastically and were reported at
11 percent in 2015. For full economic indicator data see Figures 31-33.
Emissions
Total greenhouse gas emissions steadily increased from 1970 to 1997, then experienced a
sharp increase. Since then they have maintained volatility but in a close range, reporting around
300,000 kilotons in 2012. The world average is approximately 54,000,000 kilotons. From 1968-
1974, Nigeria’s carbon dioxide emissions increased sharply from a 0.1 metric tons per capita to
one metric ton per capita. Since then they have been increasing and decreasing inconsistently and
were last reported at 0.6 metric tons per capita; the world average is around five metric tons per
capita. In both cases, Nigeria falls far below the world average for contributing to emissions, yet
experiences many of the consequences of the global warming resulting from these emissions
around the world. For full emissions data see Figures 34 and 35.
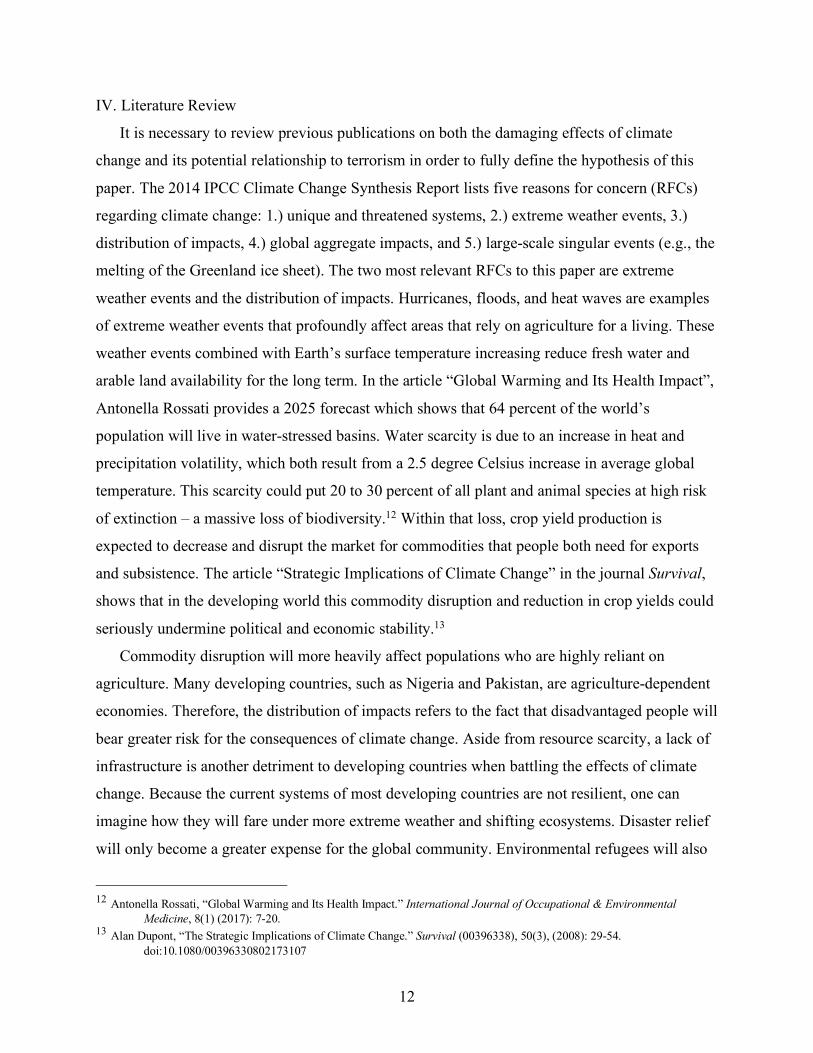
Terrorism
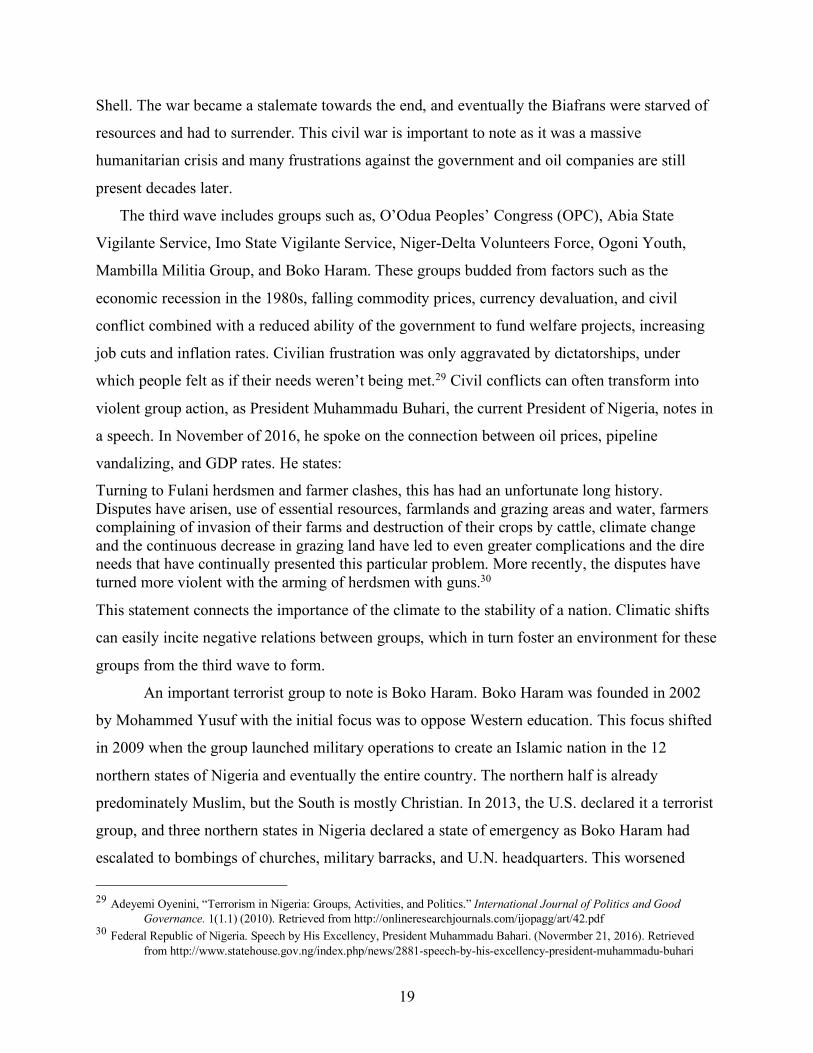
The Global Terrorism Database has compiled every terrorist event in Nigeria from 1980
through 2015, making up a total of 2,888 incidents. From 1980 through 2006, there were no
more than 20 incidents per year and an average of 36 deaths per year. The years 1992, 1997, and
1999 had an uncharacteristic number of deaths coming in at over 100 for the year, but the
number of incidents stayed below 20 for each of those years, indicating singular deadly attacks.
In 2006, the number of incidents increase to 37 and deaths 254, but returned to previous levels.
Of the 37 attacks, 62 percent were attributed to the Movement for the Emancipation of the Niger
Delta (MEND), a group dedicated to driving out foreign oil companies. It is in 2011 when there
is a massive increase in both incidents and deaths: there were over 100 incidents and 447 deaths.
Only 72 of those 100 attacks were found to have a motive, and 27 of them were attributed to
Boko Haram. One incident specifically regarded an oil spill. In 2012, there were 616 incidents
and 1,504 deaths. The year of 2014 saw the most at 713 incidents and 7,773 deaths with 50
percent attributed to Boko Haram and 21 percent to the Fulani militants. In recent years both the

25
frequency and deadliness of incidents have increased exponentially.40 See Figure 1 for terrorist
attacks and number of deaths. In the Global Terrorism Index 2016 report, it states that of the 20
most fatal terrorist attacks in 2015, four took place in Nigeria, and of the 50 most fatal attacks,
12 occurred in Nigeria. Terrorism has almost a five percent economic impact on Nigeria’s
GDP.41 Most these events target private citizens or property (40 percent), while another 21
percent of them target the government or police, see Figure 39. Out of the deadliest attacks in
Nigeria from 1980 to 2015, those with deaths exceeding 100, 15 of the 22 occurred in 2014, seen
in Figure 38. Boko Haram was culpable for 86 percent of the deadliest attacks in Nigeria. Other
agents include the Fulani Militants and the Movement Emancipation of the Niger Delta.40
Figure 1:
Source: National Consortium for the Study of Terrorism and Responses to Terrorism, 2016
40 National Consortium for the Study of Terrorism and Responses to Terrorism (START). Global Terrorism Database
[Data file]. (2016). Retrieved from https://www.start.umd.edu/gtd 41 Institute for Economics and Peace. “Global Terrorism Index 2016.” (November 17, 2016). Retrieved from
http://reliefweb.int/sites/reliefweb.int/files/resources/Global%20Terrorism%20Index%202016_0.pdf
0
1000
2000
3000
4000
5000
6000
7000
8000
9000
1980
1981
1982
1983
1984
1985
1986
1987
1988
1989
1990
1991
1992
1994
1995
1996
1997
1998
1999
2000
2001
2002
2003
2004
2005
2006
2007
2008
2009
2010
2011
2012
2013
2014
2015
NGA Terrorism Attack Frequency & Number of Deaths
# of Attacks # of Deaths

26
Pakistan
Weather
Temperature in Pakistan has maintained a consistent upward trend since 1901, but also
radically increased around 1960. The years 1988, 2004, 2009, 2013, 2014, and 2015 are
particularly warmer than any previous year, as seen in Figure 40. Rainfall is not as consistent in
its pattern, but there are lower averages than recorded since 1901 in the early 70s, 1987, 1999,
and 2000, which can be seen in Figure 41. There is also an extremely high average in 2010,
which resulted in the devastating floods of 2010.
Natural Disasters
Floods are by far the most frequent natural disasters in Pakistan, with 97 occurring from
1960 through 2016. They have impacted approximately 80 million people and cost the country
more than 20 billion USD. In 2010, the flooding of the Indus River resulted in one of the worst
humanitarian disasters Pakistan has seen. Approximately one-fifth of the country’s land area was
covered resulting in 2,000 deaths, 18 million people affected, 2.2 million hectares of crop
destruction, and half of a million livestock lost.42 Floods alone cost Pakistan around 21 billion
USD.44 In the summer months of 2003, 2007, and 2010 to 2014, the country experienced
flooding due to monsoon rains.45 The National Oceanic and Atmospheric Association (NOAA)
reported that in 2013, Pakistan experienced one of its worst heat waves in decades in the pre-
monsoon season, with temperatures reaching 124 degrees Fahrenheit in some regions.43
Droughts also burden the country, affecting 2.2 million people at the price of 2.5 million USD.44
The drought of 1998 through 2002 is considered one of the worst in 50 years in Pakistan. It
experienced two more in 2004 and 2009, though not as severe.45 The 1998 drought was caused
by El Niño developments and displaced 1.2 million people. Some provinces did not see rainfall
for five years. The government resorted to cloud-seeding experiments to induce short periods of
relief for the population. La Niña effects in 2003 officially ended the drought, but brought about
the flood in the summer months, mentioned above. Pakistan’s most frequent disasters include
42 Disasters Emergency Committee. “Pakistan Floods Facts and Figures.” (2015). Retrieved from
http://www.dec.org.uk/articles/pakistan-floods-facts-and-figures 43 NOAA National Centers for Environmental Information, “State of the Climate: Global Climate Report for Annual 2013”.
(January 2014). Web. Retrieved from https://www.ncdc.noaa.gov/sotc/global/201313. 44 Debarati Guha-Sapir, et. al, EM-DAT: The CRED/OFDA International Disaster Database – www.emdat.be –
Université Catholique de Louvain – Brussels – Belgium. 45 Pakistan Weather Portal. “History of Drought in Pakistan – In Detail.” (May 8, 2011). Retrieved from
https://pakistanweatherportal.com/2011/05/08/history-of-drought-in-pakistan-in-detail/

27
floods, earthquakes, and heat waves. Its most impactful disasters include floods, earthquakes and
droughts, which combined affected a total of 91.4 million people from 1960 through 2016. This
succession of natural disasters has halted the country’s economic development, as almost half of
its population lives in poverty. See full natural disaster data in Figures 42-44.
Agricultural and Socioeconomic Indicators
There has been volatility and decline in Pakistan’s agriculture sector, on which it is
heavily dependent. In 1962, its agriculture raw materials exports as a percentage of merchandise
exports was at 61 percent and in 2015 was reported at just one percent. The decline was swift,
occurring mostly in the 1960s, and then volatile for a couple decades before finally settling
between one and two percent in 1997 to date. Agriculture as a percentage of GDP started out in
1960 at 48 percent but slowly declined to 25 percent in 2015. Both indicators can be seen in
Figure 45. Agriculture raw materials imports ranged between three and six percent over the past
couple decades, averaging at about four percent as seen in Figure 46. Pakistan’s cash crops
include wheat, rice, sugar cane, cotton, and mangos, seen in Figure 47. These crops experienced
a decline in gross production in 2001, 2008, 2010, and 2012. The decrease in production almost
completely correlates with Pakistan’s droughts and floods in the 2000s. Its crop production index
also reflects this with declines in 1992, 1997, 2001, 2006, 2010, and 2012, seen in Figure 48.
Oddly, Pakistan’s food production does not follow this pattern as it has a steady incline through
2011, but a sharp drop in 2012 (see Figure 49). The country’s prevalence of undernourishment
has stayed around 23 percent from 1991 to date, but experienced a slight increase in the early
2000s at 26 percent before dropping back to previous levels (see Figure 50). Pakistan’s food
supply variability has also performed poorly from 1990 to date. Its highest point was 79
kcal/capita/day, but in 2011 it hit a record low at 14. It was volatile with low number from 1992
to 2001, decline in 2004, and again has been declining since 2007 (see Figure 51). The natural
disasters in Pakistan have not aided the wheat production, which is Pakistan’s most prized crop.
Pakistan has seen an average GDP growth of 4.7 percent from 1970 through 2014, with
little to no stability. From 1967 through 1992, Pakistan’s exports as a percentage of GDP
increased with high instability, and since 2003 they have been declining. They were reported at
approximately 11 percent of GDP in 2015. For full GDP and export data see Figures 52-54.
Emissions

28
Similar to Nigeria, Pakistan is not a large contributor to global emissions, but it remains
one of the more vulnerable countries with adaptation costs predicted to exceed 10 billion USD in
the next couple decades.46 Its total greenhouse gas emissions from 1970 to 2012 increased
consistently, but remained far below the world average. Carbon dioxide emissions also
increased, with a short decline from 1968 to 1972, and then peaked in 2007 and have been
declining since. See Figures 55 and 56 for emissions data.
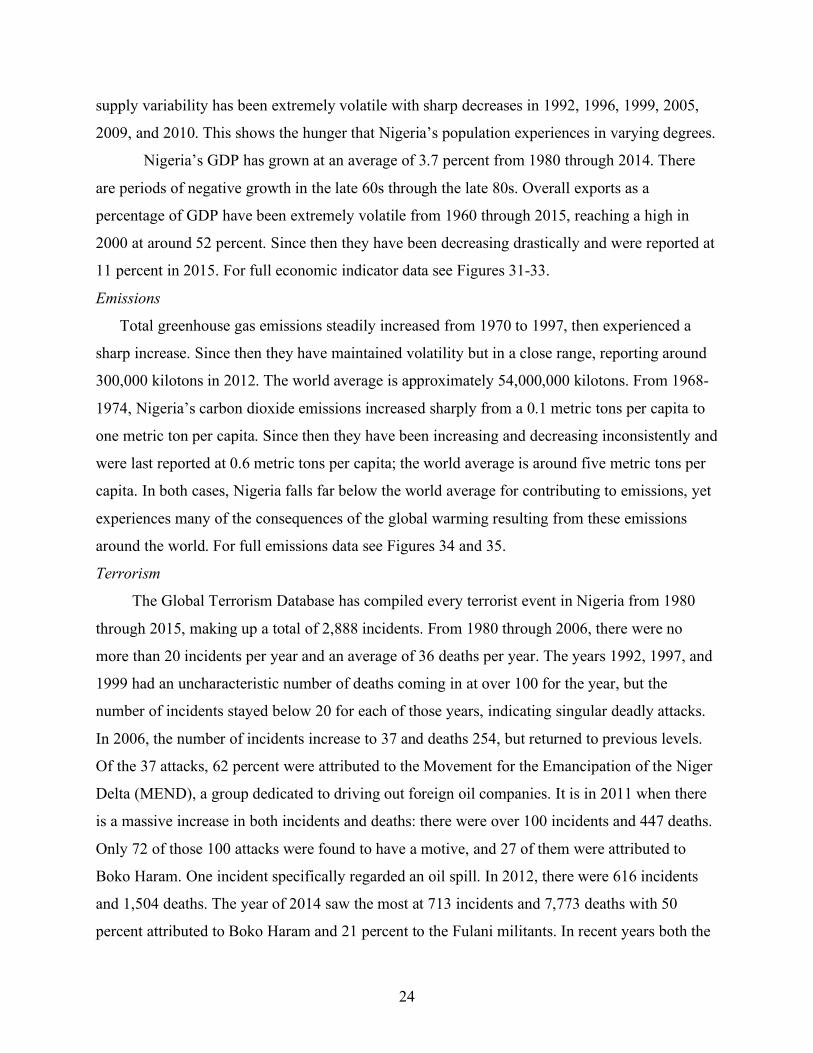
Terrorism
The Global Terrorism Database recorded 12,768 terrorist incidents in Pakistan from 1970
to 2015. Up until 1987, no more than 24 incidents or 17 deaths occurred per year related to
terrorism. In 1987 deaths rose to the hundreds, and in 1991, the number of incidents broke into
the hundreds as well. This trend peaked in 1995 with 666 attacks and 712 deaths. The database
recorded no known motives, but other publications imply that most were related to ethnic and
sectarian conflict. From then to 2006, the number of attacks returned to lower numbers, but the
deaths stayed in the hundreds, at an average of 214. In 2006, the number of attacks rose back up
to the hundreds, and deaths increased to the thousands the following year in 2007. Again, many
were motivated by religious goals, but there was one regarding the natural resources of a region.
From 2007 to date there has been an average of 1,162 incidents and 1,933 deaths per year. The
peak years include 2012 with 2,786 deaths and 2013 with 2,701 deaths. Of the known motives
for 2012 attacks, 363 were ethnic or religiously motivated and four were oil-related. The groups
responsible for the attacks in 2012 include the Baloch/Sindhu Liberation parties or the Tehrik-i-
Taliban. In 2013, 425 of the attacks were attributed to Sunni vs. Shiite conflict, the Tehrik-i-
Taliban, and retaliation for or suspicion of U.S. involvement in the country. Since the 1980s the
number of terrorist attacks has increased over fifteen-fold. See Figure 2 below for terrorism
attack and deaths data. Again, the majority of these attacks, 24 percent, targeted private citizens
and property, and another 24 percent were aimed at the military and police, as seen in Figure 62.
Each of the five deadliest attacks in Pakistan, those with over 100 deaths, during this period
occurred after 2006, and the majority were motivated politically (see Figure 59). Of the five
deadliest attacks, four were claimed by the Tehrik-i-Taliban Pakistan (TTP) and one by Harkatul
46 Islamic Relief (Worldwide). “Pakistan: Current Situation.” (2016). Retrieved from http://www.islamic-relief.org/current-
situation-18/
29
Jihad-e-Islami.47 The Global Terrorism Index reports the economic impact of terrorism on
Pakistan’s GDP at approximately three percent.48
Figure 2:
Source: National Consortium for the Study of Terrorism and Responses to Terrorism, 2016
47 National Consortium for the Study of Terrorism and Responses to Terrorism (START). Global Terrorism Database
[Data file]. (2016). Retrieved from https://www.start.umd.edu/gtd 48 Institute for Economics and Peace. “Global Terrorism Index 2016.” (November 17, 2016). Retrieved from
http://reliefweb.int/sites/reliefweb.int/files/resources/Global%20Terrorism%20Index%202016_0.pdf
0
500
1000
1500
2000
2500
3000
3500
1970
1975
1978
1980
1982
1984
1986
1988
1990
1992
1995
1997
1999
2001
2003
2005
2007
2009
2011
2013
2015
PAK Terrorism Attack Frequency & Number of Deaths
# of Incidents # of Kills
30
VI. Analysis and Conclusion
a. Analysis
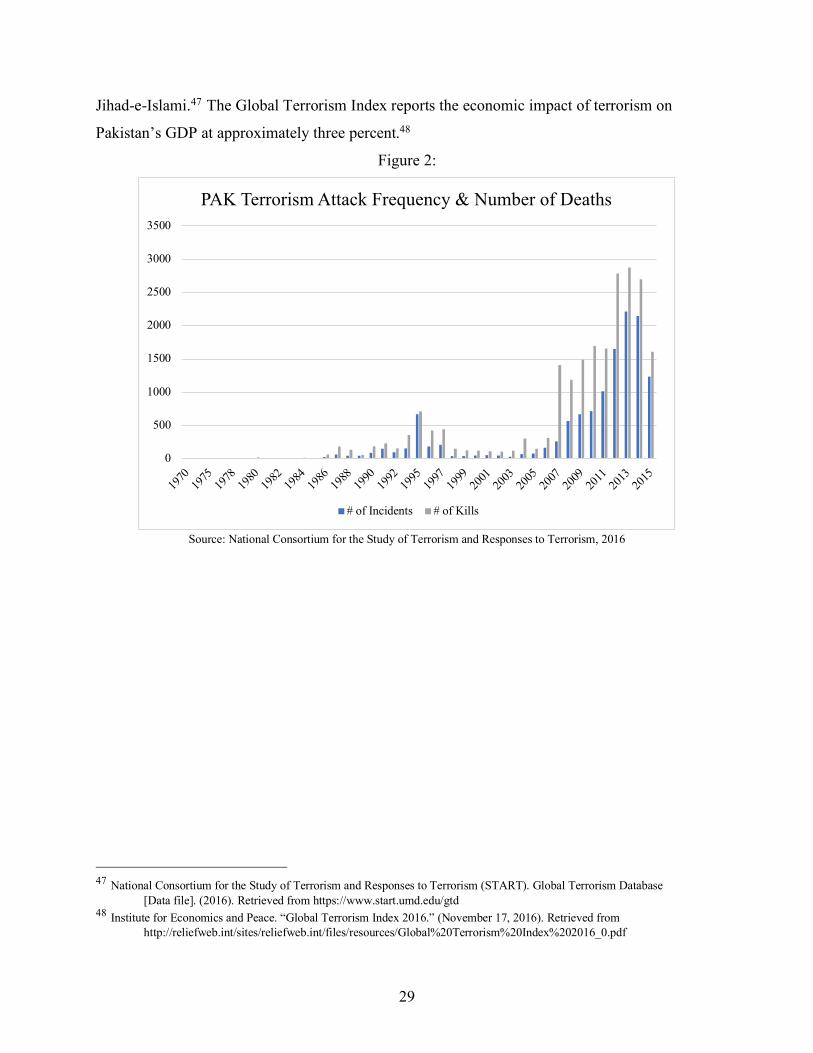
Nigeria
Terrorism data in Nigeria is inconsistent from 1980 to 1990, in which case it is difficult
to compare climate data and the wildfires of 1982 and1983 against terrorism incidents and
number of deaths before then. Also, both temperature and rainfall data are only available through
2012, which does not allow comparison of 2013 through 2015, the last record of the terrorism
data. In each of the hotter years (see below) after 1990, 1998, 2009, 2010, there is a slight uptick
in the number of terrorist attacks the following year. There were 18 terrorist incidents recorded in
1999, and most were motivated by discontent with the government regulation of foreign oil
companies on Nigerian land. In 2010, the 63 terrorist incidents were attributed to religious or
political motives against the government with one incidence regarding oil supplies. The year
2011 saw 175 terrorist attacks with the majority attributed to Boko Haram, who was attempting
to establish Sharia law before the elections. The other incidents were politically or religiously
motivated, with no stated reason, besides a hostage situation in which the kidnapper was
attempting to influence how oil compensation would be distributed among the community.
Figure 3:
Source: The World Bank, National Consortium for the Study of Terrorism and Responses to Terrorism (START).
25.5
26
26.5
27
27.5
28
0
100
200
300
400
500
600
700
1980
1982
1984
1986
1988
1990
1992
1994
1996
1998
2000
2002
2004
2006
2008
2010
2012
2014
NGA Temperature (C) & Number of Attacks
# of Attacks Temperature (C)

31
In the late 90s and through the 2000s, it appears that the frequency of terror attacks
increases when a higher average rainfall is recorded, with 2011 as the exception (see below).
This could be attributed to higher rainfall averages causing flooding, which is the known case for
2012. The 2012 floods destroyed 600,000 homes and killed 363 people. Another 7.7 million
were affected, and most likely had to migrate, which would increase tensions. There are 616
terrorism incidents recorded for 2012, and the majority were attributed to Boko Haram or
sectarian conflict, though much of that was speculation as motive was labeled as unknown. The
terrorist events were evenly distributed before and after the floods, not showing concrete
indication that the floods increased terrorism directly, although many attack motives were
labeled as unknown.
Figure 4:
Source: The World Bank, National Consortium for the Study of Terrorism and Responses to Terrorism (START).
The deadliness of the events does not correlate with the hotter years on record, as the
number of deaths increased significantly from 2011 and onward (see below). The drought in the
Lake Chad area has increasingly become worse in the later 2000s, which reflects on the terrorism
graphs. The number of events and number of deaths considerably increases in 2012 to 1,504. As
stated previously, the majority were attributed to Boko Haram or religious conflict.
60
70
80
90
100
110
120
0
100
200
300
400
500
600
700
800
1980
1982
1984
1986
1988
1990
1992
1994
1996
1998
2000
2002
2004
2006
2008
2010
2012
2014
NGA Rainfall (mm) & Number of Attacks
# of Attacks Rainfall (mm)
32
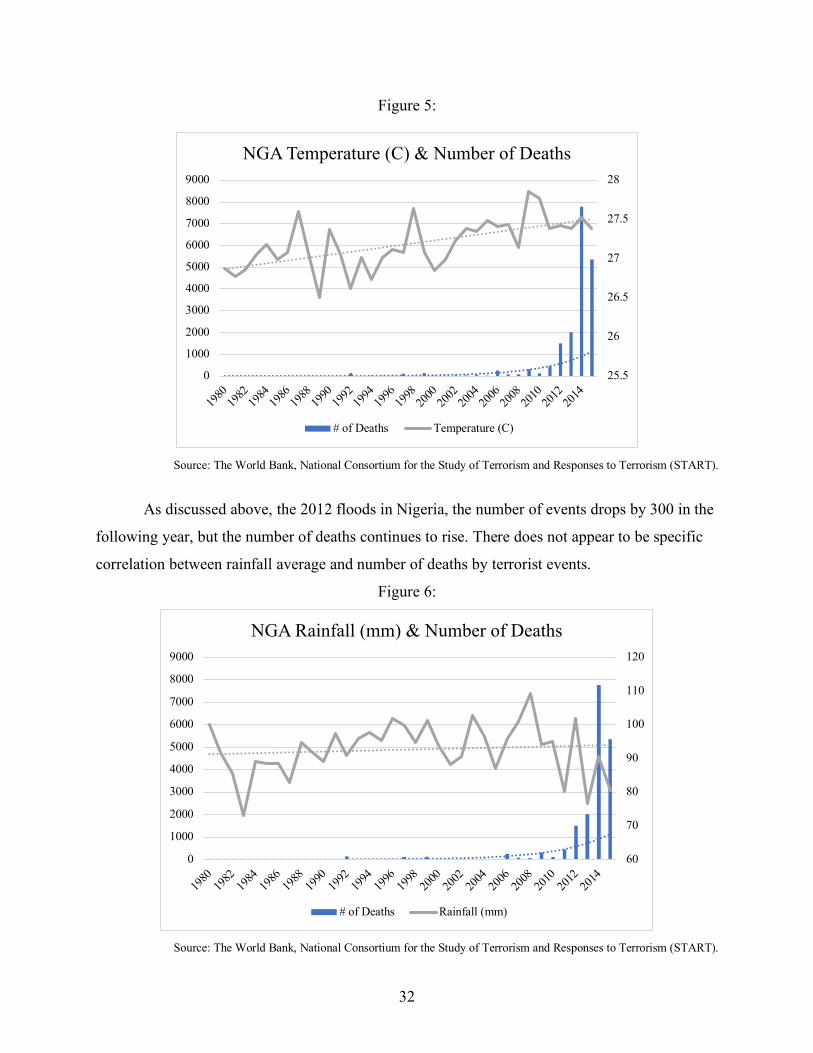
Figure 5:
Source: The World Bank, National Consortium for the Study of Terrorism and Responses to Terrorism (START).
As discussed above, the 2012 floods in Nigeria, the number of events drops by 300 in the
following year, but the number of deaths continues to rise. There does not appear to be specific
correlation between rainfall average and number of deaths by terrorist events.
Figure 6:
Source: The World Bank, National Consortium for the Study of Terrorism and Responses to Terrorism (START).
25.5
26
26.5
27
27.5
28
0
1000
2000
3000
4000
5000
6000
7000
8000
9000
1980
1982
1984
1986
1988
1990
1992
1994
1996
1998
2000
2002
2004
2006
2008
2010
2012
2014
NGA Temperature (C) & Number of Deaths
# of Deaths Temperature (C)
60
70
80
90
100
110
120
0
1000
2000
3000
4000
5000
6000
7000
8000
9000
1980
1982
1984
1986
1988
1990
1992
1994
1996
1998
2000
2002
2004
2006
2008
2010
2012
2014
NGA Rainfall (mm) & Number of Deaths
# of Deaths Rainfall (mm)
33
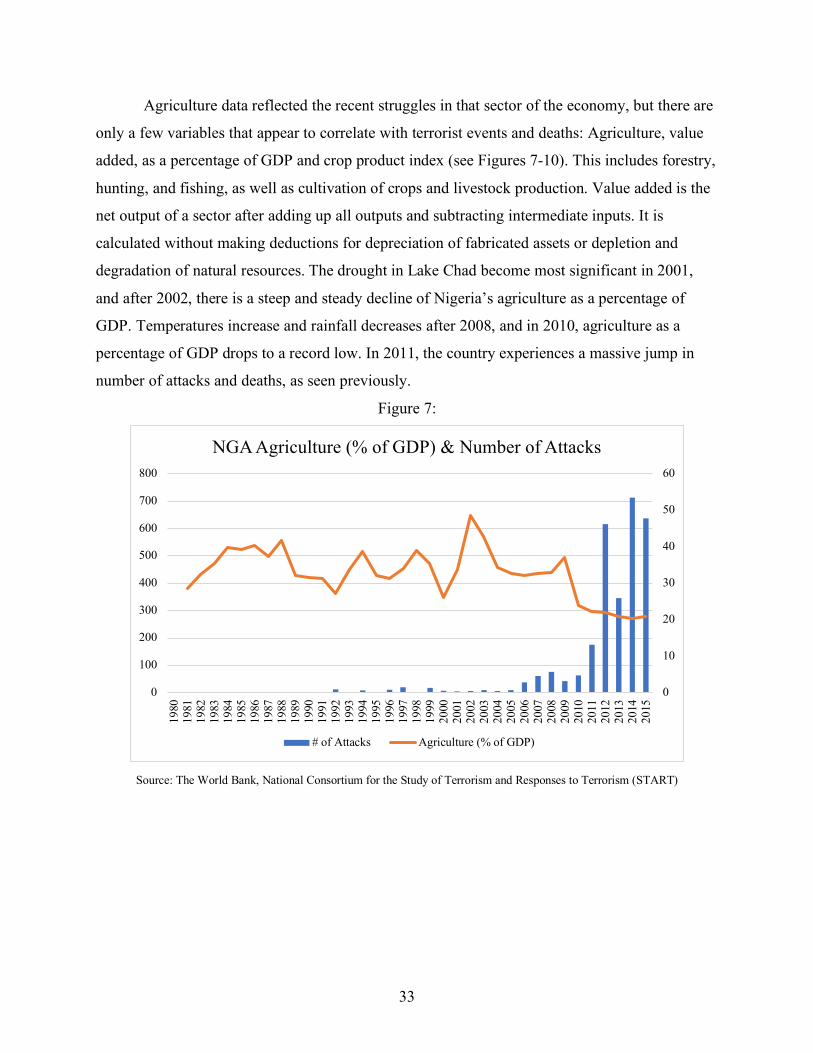
Agriculture data reflected the recent struggles in that sector of the economy, but there are
only a few variables that appear to correlate with terrorist events and deaths: Agriculture, value
added, as a percentage of GDP and crop product index (see Figures 7-10). This includes forestry,
hunting, and fishing, as well as cultivation of crops and livestock production. Value added is the
net output of a sector after adding up all outputs and subtracting intermediate inputs. It is
calculated without making deductions for depreciation of fabricated assets or depletion and
degradation of natural resources. The drought in Lake Chad become most significant in 2001,
and after 2002, there is a steep and steady decline of Nigeria’s agriculture as a percentage of
GDP. Temperatures increase and rainfall decreases after 2008, and in 2010, agriculture as a
percentage of GDP drops to a record low. In 2011, the country experiences a massive jump in
number of attacks and deaths, as seen previously.
Figure 7:
Source: The World Bank, National Consortium for the Study of Terrorism and Responses to Terrorism (START)
0
10
20
30
40
50
60
0
100
200
300
400
500
600
700
800
1980
1981
1982
1983
1984
1985
1986
1987
1988
1989
1990
1991
1992
1993
1994
1995
1996
1997
1998
1999
2000
2001
2002
2003
2004
2005
2006
2007
2008
2009
2010
2011
2012
2013
2014
2015
NGA Agriculture (% of GDP) & Number of Attacks
# of Attacks Agriculture (% of GDP)

34
Figure 8:
Source: The World Bank, National Consortium for the Study of Terrorism and Responses to Terrorism (START)
Furthermore, crop production was analyzed against the terrorist events and number of
deaths (see Figures 9 and 10 below). There is a steady rise in Nigeria’s crop production from
1961 through 2006, but after there is a period of instability. In the year 2006, the number of
terrorist attacks quadruples and the number of deaths increases thirteen-fold. In 2009, there is
another sharp drop in crop production, but this time with a decrease in terrorist attacks from 76 to
42 and a major increase in the number of deaths from 72 to 316. The most recent decline in crop
production in 2011 has similar results with a doubling of terrorist events at 175 and quadrupling
of the number of deaths at 447. The agriculture as a percentage of GDP does not follow this
trend, but as discussed in Section V, the cash crops of Nigeria experienced sharp declines in its
major cash crops in 1999, 2007, 2009, and 2011. The most recent declines correlate with the crop
production decline, and 2007 could be delayed effect from the start of crop production instability
beginning in 2006. It is also noted that while there is not a decline in the crop product in 1999,
there is a stagnant growth period from 1999 through 2001. Yams are Nigeria’s most profitable
crop, and they have a low yield per hectare, compared to its other crops. They also require more
0
10
20
30
40
50
60
0
1000
2000
3000
4000
5000
6000
7000
8000
900019
8019
8119
8219
8319
8419
8519
8619
8719
8819
8919
9019
9119
9219
9319
9419
9519
9619
9719
9819
9920
0020
0120
0220
0320
0420
0520
0620
0720
0820
0920
1020
1120
1220
1320
1420
15
NGA Agriculture (% of GDP) & Number of Deaths
# of Deaths Agriculture (% of GDP)
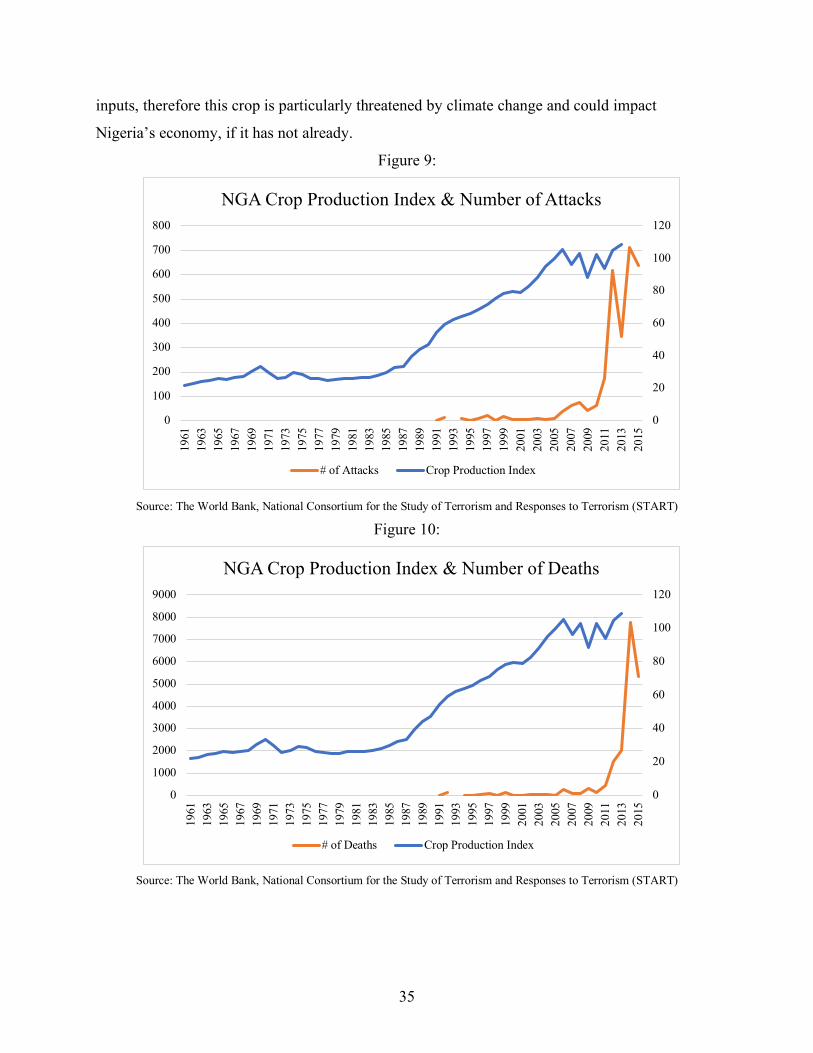
35
inputs, therefore this crop is particularly threatened by climate change and could impact
Nigeria’s economy, if it has not already.
Figure 9:
Source: The World Bank, National Consortium for the Study of Terrorism and Responses to Terrorism (START)
Figure 10:
Source: The World Bank, National Consortium for the Study of Terrorism and Responses to Terrorism (START)
0
20
40
60
80
100
120
0
100
200
300
400
500
600
700
800
1961
1963
1965
1967
1969
1971
1973
1975
1977
1979
1981
1983
1985
1987
1989
1991
1993
1995
1997
1999
2001
2003
2005
2007
2009
2011
2013
2015
NGA Crop Production Index & Number of Attacks
# of Attacks Crop Production Index
0
20
40
60
80
100
120
0
1000
2000
3000
4000
5000
6000
7000
8000
9000
1961
1963
1965
1967
1969
1971
1973
1975
1977
1979
1981
1983
1985
1987
1989
1991
1993
1995
1997
1999
2001
2003
2005
2007
2009
2011
2013
2015
NGA Crop Production Index & Number of Deaths
# of Deaths Crop Production Index

36
There is little to no correlation in Nigeria’s carbon dioxide and total greenhouse gas
emissions and terror events and number of deaths, but that information is still relevant because
even though Nigeria is not even close to being a contributor to the global emissions issue, it will
be hit hard by the effects emissions on the atmosphere and global warming. This creates a feeling
of marginalization, since the developed countries are the culprits for the massive amounts of
harmful particles in the atmosphere, yet poor, undeveloped countries, such as Nigeria, will get
the brunt of the hit.
In 2014, Nigeria recorded 7,773 deaths attributed to terrorism. Only 69 of the 713 attacks
in 2014 had a known motive, and almost half of those known were attributed to Boko Haram.
The remaining were religiously motivated, a couple inter-village conflict, or militant groups.
Again, the issue of oil companies’ involvement in the delta region turns violent. One event was
speculated to be related to a disagreement over who would represent the region in negations with
multinational oil companies. The Movement for the Emancipation of the Niger Delta (MEND)
claimed responsibility for another incident stating that it served as a remainder of its presence in
the area and that by 2015 they will have driven away all oil companies in the country.
Boko Haram is a major actor in Nigeria’s terrorism. With so many deadly attacks
attributed to the group, it’s crucial to understand how climate has played a role in its growth. A
2012 article in the Africa Review reported that many Boko Haram foot soldiers happen to be
people displaced by severe drought and food shortages in neighboring Niger and Chad. This was
found odd, because many Boko Haram fighters are perceived to be extremists, but the authorities
who arrested these members noted that they could not recite a single line from the Quran.49 A
combination of natural disasters, global warming-induced drought, and a shrinking Lake Chad,
which sustains four countries, forces mass migration, starvation, and conflict. An article from the
nonprofit, Mother Jones, recounted an interview with Vanda Felbab-Brown, an expert on
insurgency at the Brookings Institution, in which she states, "Much of the conflict...between
Christians and Muslims is about land and access to water, but Boko Haram is tapping to those
sentiments and inflaming those sentiments." The executive director of CLEEN Foundation, a
Nigerian security-focused nonprofit, also emphasizes Boko Haram’s appeal, giving the example
of young people being pushed to their limits from this conflict and getting “sucked into” Boko
49 Emmanuel Mayah. “Climate Change Fuels Nigeria Terrorism.” Africa Review. (February 24, 2012). Web. Retrieved from
http://www.africareview.com/News/Climate-change-fuels-Nigeria-terrorism/-/979180/1334472/-/vq4tja/-/index.html
37
Haram.50 Many Nigerian officials and world leaders close to the issue reiterate the strength that
Boko Haram has gained from crop failures and dispute over resources.
The quantitative data can be linked to qualitative reports and articles that also support this
view of climate change as a threat multiplier for conflict. A special report conducted by the U.S.
Institute for Peace laid out a basic causal mechanism that links climate change to the violence in
Nigeria. It identifies the climatic risks and their immediate effect on resource shortage, and the
secondary effects from these shortages, such as famine, sickness, and population displacement. A
poor response to these secondary effects creates strained relationships between citizens and their
institution. It found that forty percent of all intrastate conflicts in the last six decades involved
disputes over limited natural resources, and there have been approximately 24 of them since
1990.51 Conflict does not immediately result in terrorism, but it opens the door to it. Dr. Moncef
Marzouki, former President of Tunisia, held a speaking session at the University of South
Carolina on March 23, 2017. When questioned about terrorism, which he has seen firsthand, he
labeled three main causes of it: poverty, lack of education, and frustration. All things are quite
present in this country of focus as the motives of the terrorism events have been analyzed.
Pakistan
Pakistan has more consistent terrorism data from 1970, so there is more than can be
compared than Nigeria. Unlike Nigeria though, there is no significant increase in terrorist events
or number of deaths from the hotter years on record, 1988, 1999, 2004, and 2009 (see below). As
stated before, the year 2013 was one of the hottest on record, and in May Pakistan experienced
its most severe heat wave in decades. The droughts of 1998, 2004, and 2009 do not seem to have
had a direct effect on terrorism activity either.
50 Erika Eichelberger. “How Environmental Disaster is Making Boko Haram Violence Worse.” Mother Jones. (June 2014).
Web. Retrieved from http://www.motherjones.com/environment/2014/06/nigeria-environment-climate-change-boko-haram?page=2
51 Aaron Sayne, “Climate Change Adaptation and Conflict in Nigeria.” United States Institute for Peace. (June, 2011). Retrieved from https://www.usip.org/sites/default/files/Climate_Change_Nigeria.pdf
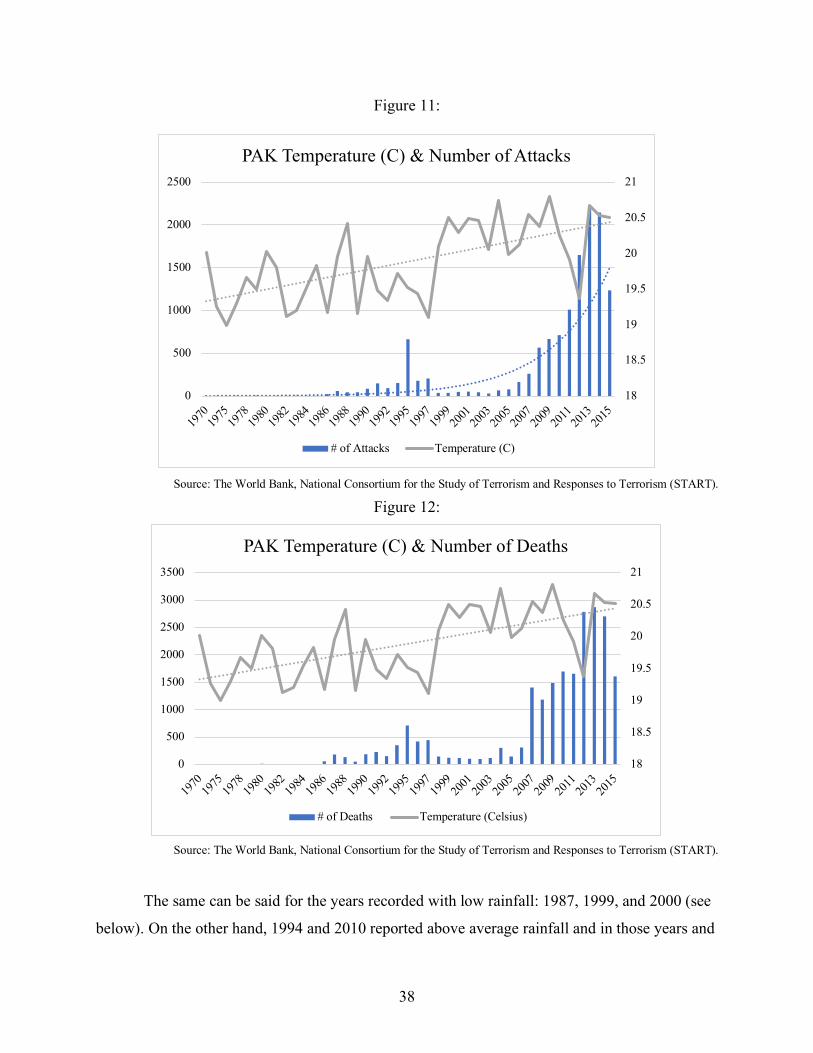
38
Figure 11:
Source: The World Bank, National Consortium for the Study of Terrorism and Responses to Terrorism (START).
Figure 12:
Source: The World Bank, National Consortium for the Study of Terrorism and Responses to Terrorism (START).
The same can be said for the years recorded with low rainfall: 1987, 1999, and 2000 (see
below). On the other hand, 1994 and 2010 reported above average rainfall and in those years and
18
18.5
19
19.5
20
20.5
21
0
500
1000
1500
2000
2500
1970
1975
1978
1980
1982
1984
1986
1988
1990
1992
1995
1997
1999
2001
2003
2005
2007
2009
2011
2013
2015
PAK Temperature (C) & Number of Attacks
# of Attacks Temperature (C)
18
18.5
19
19.5
20
20.5
21
0
500
1000
1500
2000
2500
3000
3500
1970
1975
1978
1980
1982
1984
1986
1988
1990
1992
1995
1997
1999
2001
2003
2005
2007
2009
2011
2013
2015
PAK Temperature (C) & Number of Deaths
# of Deaths Temperature (Celsius)

39
the following both the number of terrorist incidents and the number of deaths increased radically.
Again, it was mentioned previously that the floods of 2010 were caused by this monsoon rain
impacted millions. From then until 2014 there was a continuous uptick in terrorism, deadlier than
ever. The flooding in 2003 and 2008 do not appear to have a great impact on Pakistan’s terrorism
though.
Figure 13:
Source: The World Bank, National Consortium for the Study of Terrorism and Responses to Terrorism (START).
Figure 14:
Source: The World Bank, National Consortium for the Study of Terrorism and Responses to Terrorism (START).
0
5
10
15
20
25
30
35
40
0
500
1000
1500
2000
2500
1970
1975
1978
1980
1982
1984
1986
1988
1990
1992
1995
1997
1999
2001
2003
2005
2007
2009
2011
2013
2015
PAK Rainfall (mm) & Number of Attacks
# of Attacks Rainfall (mm)
0
5
10
15
20
25
30
35
40
0
500
1000
1500
2000
2500
3000
3500
1970
1975
1978
1980
1982
1984
1986
1988
1990
1992
1995
1997
1999
2001
2003
2005
2007
2009
2011
2013
2015
PAK Rainfall (mm) & Number of Deaths
# of Deaths Rainfall (mm)

40
Pakistan’s agriculture as a percentage of its GDP and its agriculture exports have fallen
tremendously since the 1960s, furthering frustration and poverty. In 2005, Pakistan’s agriculture
as a percentage of GDP hit its lowest point since 1970, and in the following year the number of
deaths from terrorism and number of attacks both doubled. Since its drop in 2005, agriculture as
a percentage of GDP has risen back up to 25 percent from 21 percent, but it is still low compared
to 36 percent in 1970. It experienced a slight drop again in 2012, and again the number of attacks
increases by 150 percent, but the number of deaths stays relatively constant as it was already
quite high.
Figure 15:
Source: The World Bank, National Consortium for the Study of Terrorism and Responses to Terrorism (START)
0
5
10
15
20
25
30
35
40
0
500
1000
1500
2000
2500
1970
1972
1974
1976
1978
1980
1982
1984
1986
1988
1990
1992
1994
1996
1998
2000
2002
2004
2006
2008
2010
2012
2014
PAK Agriculture (% of GDP) & Number of Attacks
# of Attacks Agriculture (% of GDP)
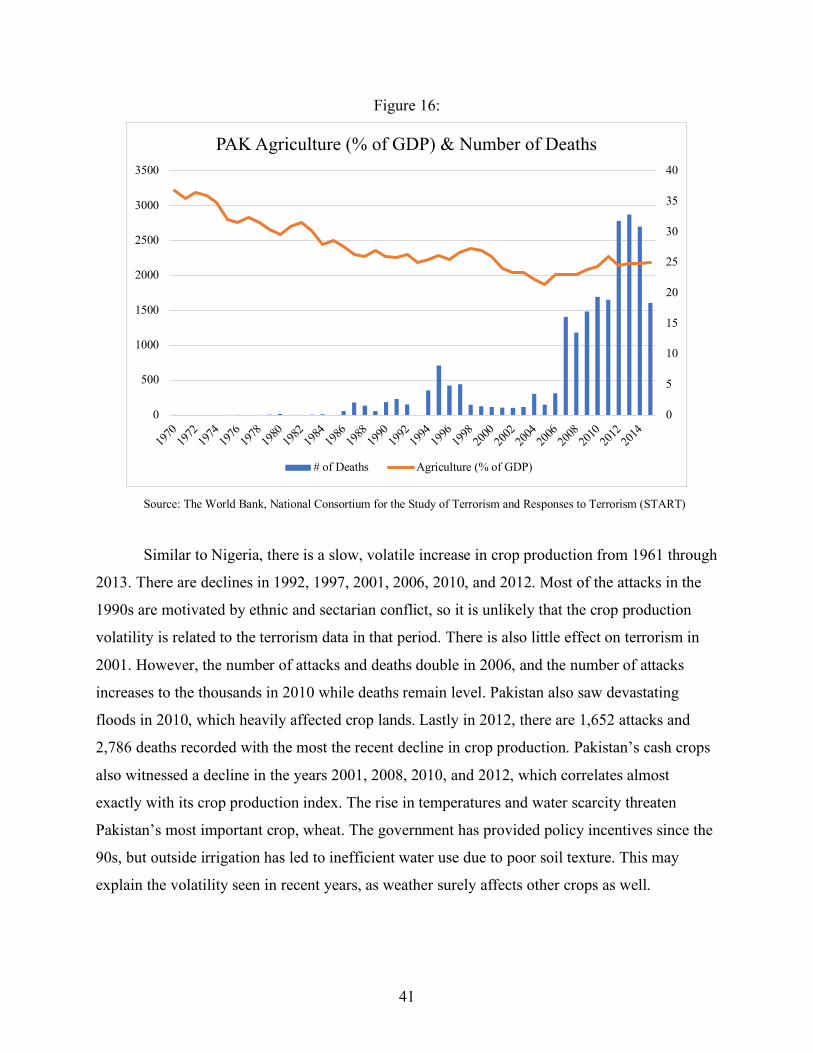
41
Figure 16:
Source: The World Bank, National Consortium for the Study of Terrorism and Responses to Terrorism (START)
Similar to Nigeria, there is a slow, volatile increase in crop production from 1961 through
2013. There are declines in 1992, 1997, 2001, 2006, 2010, and 2012. Most of the attacks in the
1990s are motivated by ethnic and sectarian conflict, so it is unlikely that the crop production
volatility is related to the terrorism data in that period. There is also little effect on terrorism in
2001. However, the number of attacks and deaths double in 2006, and the number of attacks
increases to the thousands in 2010 while deaths remain level. Pakistan also saw devastating
floods in 2010, which heavily affected crop lands. Lastly in 2012, there are 1,652 attacks and
2,786 deaths recorded with the most the recent decline in crop production. Pakistan’s cash crops
also witnessed a decline in the years 2001, 2008, 2010, and 2012, which correlates almost
exactly with its crop production index. The rise in temperatures and water scarcity threaten
Pakistan’s most important crop, wheat. The government has provided policy incentives since the
90s, but outside irrigation has led to inefficient water use due to poor soil texture. This may
explain the volatility seen in recent years, as weather surely affects other crops as well.
0
5
10
15
20
25
30
35
40
0
500
1000
1500
2000
2500
3000
3500
1970
1972
1974
1976
1978
1980
1982
1984
1986
1988
1990
1992
1994
1996
1998
2000
2002
2004
2006
2008
2010
2012
2014
PAK Agriculture (% of GDP) & Number of Deaths
# of Deaths Agriculture (% of GDP)
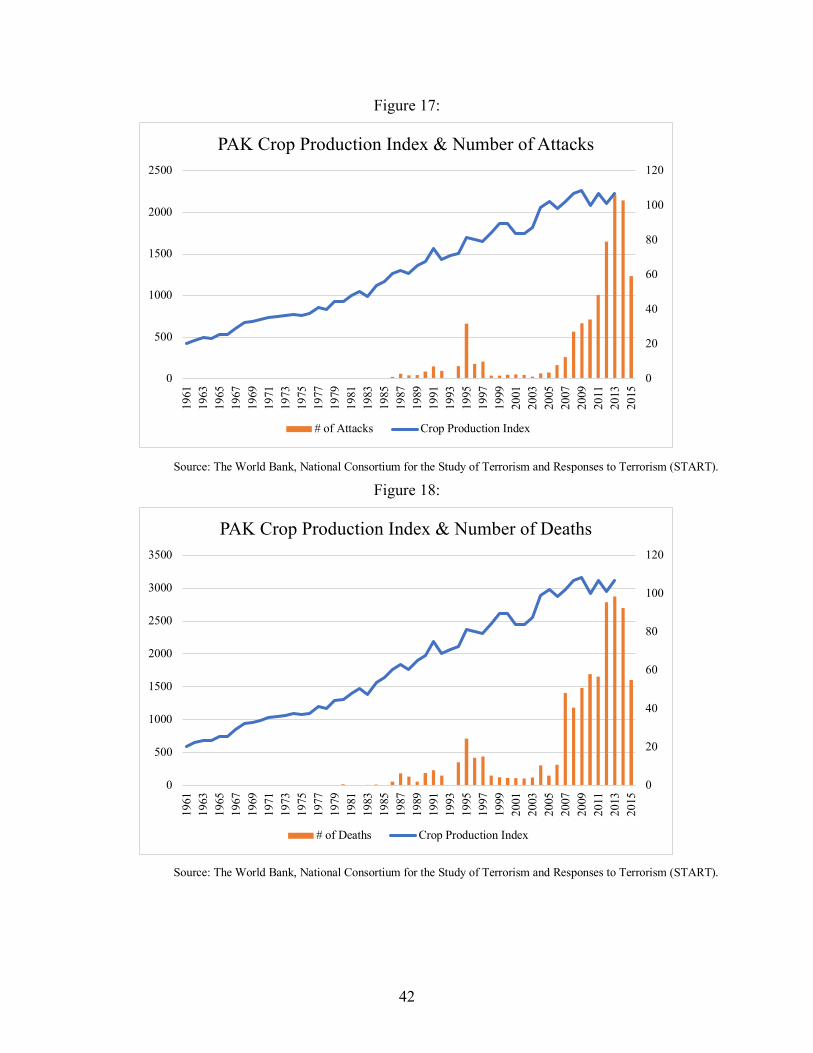
42
Figure 17:
Source: The World Bank, National Consortium for the Study of Terrorism and Responses to Terrorism (START).
Figure 18:
Source: The World Bank, National Consortium for the Study of Terrorism and Responses to Terrorism (START).
0
20
40
60
80
100
120
0
500
1000
1500
2000
250019
6119
6319
6519
6719
6919
7119
7319
7519
7719
7919
8119
8319
8519
8719
8919
9119
9319
9519
9719
9920
0120
0320
0520
0720
0920
1120
1320
15
PAK Crop Production Index & Number of Attacks
# of Attacks Crop Production Index
0
20
40
60
80
100
120
0
500
1000
1500
2000
2500
3000
3500
1961
1963
1965
1967
1969
1971
1973
1975
1977
1979
1981
1983
1985
1987
1989
1991
1993
1995
1997
1999
2001
2003
2005
2007
2009
2011
2013
2015
PAK Crop Production Index & Number of Deaths
# of Deaths Crop Production Index
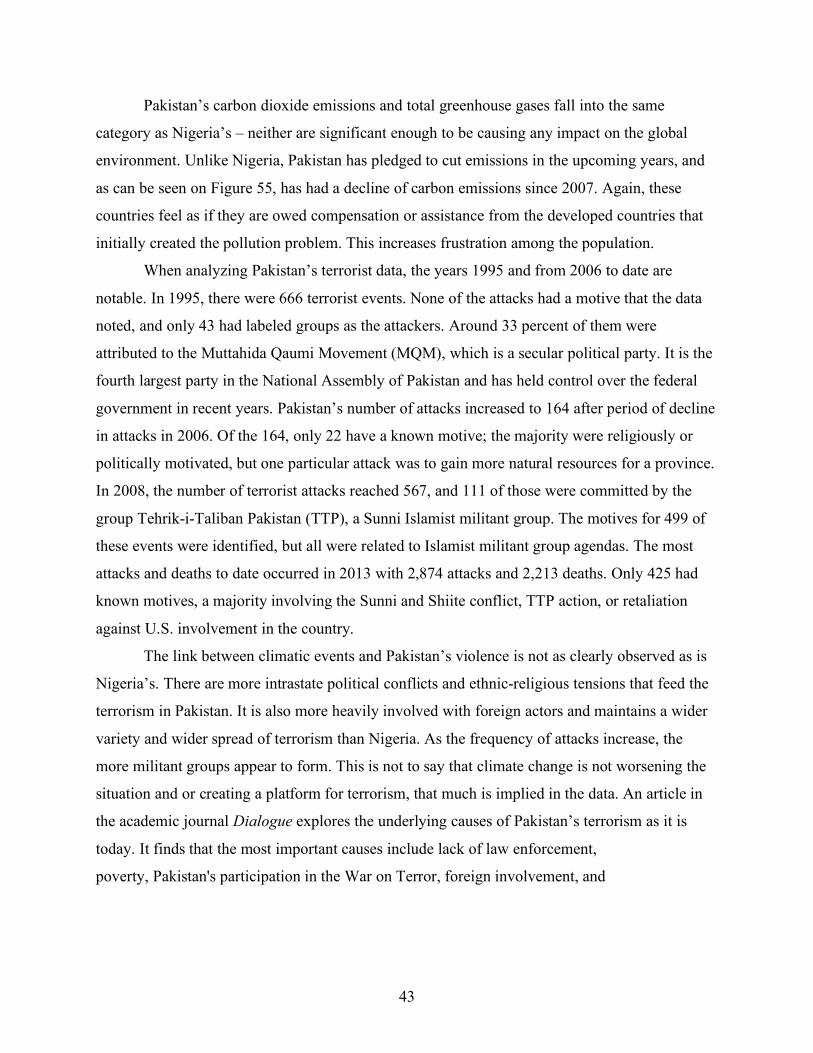
43
Pakistan’s carbon dioxide emissions and total greenhouse gases fall into the same
category as Nigeria’s – neither are significant enough to be causing any impact on the global
environment. Unlike Nigeria, Pakistan has pledged to cut emissions in the upcoming years, and
as can be seen on Figure 55, has had a decline of carbon emissions since 2007. Again, these
countries feel as if they are owed compensation or assistance from the developed countries that
initially created the pollution problem. This increases frustration among the population.
When analyzing Pakistan’s terrorist data, the years 1995 and from 2006 to date are
notable. In 1995, there were 666 terrorist events. None of the attacks had a motive that the data
noted, and only 43 had labeled groups as the attackers. Around 33 percent of them were
attributed to the Muttahida Qaumi Movement (MQM), which is a secular political party. It is the
fourth largest party in the National Assembly of Pakistan and has held control over the federal
government in recent years. Pakistan’s number of attacks increased to 164 after period of decline
in attacks in 2006. Of the 164, only 22 have a known motive; the majority were religiously or
politically motivated, but one particular attack was to gain more natural resources for a province.
In 2008, the number of terrorist attacks reached 567, and 111 of those were committed by the
group Tehrik-i-Taliban Pakistan (TTP), a Sunni Islamist militant group. The motives for 499 of
these events were identified, but all were related to Islamist militant group agendas. The most
attacks and deaths to date occurred in 2013 with 2,874 attacks and 2,213 deaths. Only 425 had
known motives, a majority involving the Sunni and Shiite conflict, TTP action, or retaliation
against U.S. involvement in the country.
The link between climatic events and Pakistan’s violence is not as clearly observed as is
Nigeria’s. There are more intrastate political conflicts and ethnic-religious tensions that feed the
terrorism in Pakistan. It is also more heavily involved with foreign actors and maintains a wider
variety and wider spread of terrorism than Nigeria. As the frequency of attacks increase, the
more militant groups appear to form. This is not to say that climate change is not worsening the
situation and or creating a platform for terrorism, that much is implied in the data. An article in
the academic journal Dialogue explores the underlying causes of Pakistan’s terrorism as it is
today. It finds that the most important causes include lack of law enforcement,
poverty, Pakistan's participation in the War on Terror, foreign involvement, and

44
unemployment.52 As has been seen from natural disasters all over the world, unemployment and
poverty are indirect, if not direct, effects. The combination of the effects of the floods in 2010,
increasing temperatures, volatile precipitation patterns, poor agricultural governance, a
deteriorating situation in the Middle East and controversial foreign ties, the extensive increase in
lethal terrorism in Pakistan in the two most recent decades makes sense.
b. Conclusion
The data supports that both Nigeria and Pakistan are experiencing mounting temperatures
and diminishing rainfall. They both are falling victim to more frequent and more varied natural
disasters. This creates a vicious cycle of natural resource depletion, forced migration, and
unemployment, which is exacerbated by their agriculture-reliant economies. Climatic shifts also
have secondary repercussions such as famine and sickness. The state institutions do not have the
monetary or infrastructural support to aid their citizens, or they engage in intrastate conflicts that
further worsen the citizen’s sentiment towards its institutions. This mayhem creates an opening
for terrorism to develop and occur.
52 Sajid Haider, et. al, “Identifying Causes of Terrorism in Pakistan.” Dialogue (1819-6462), 10(3) (2015): 220-236.

45
VII. Threats to Identification
There are various threats to the identification of this thesis. The most important is the
inconsistency and/or lack of credible data from both Pakistan and Nigeria. In many cases, the
data for the countries was simply not available, which could hinder a full analysis of each of the
factors. Also, when analyzing terrorism from a broad perspective, it is important to note that each
singular event or attack could have a myriad of causes. This paper is not trying to identify a
climatic cause for every single terrorist event in both countries. Political, economic, social, and
other actors are at play. Furthermore, the specific crop data could be analyzed more in depth to
more accurately identify the effects of the natural disasters on the population.

46
VIII. Addenda

47
a. Appendix A: Data for Nigeria
Figure 19:
Source: World Bank, 2016
Figure 20:
Source: World Bank, 2016
25.5
26
26.5
27
27.5
28
28.5
1900 1920 1940 1960 1980 2000
NGA Temperature (C) Trend
70
75
80
85
90
95
100
105
110
115
1900 1920 1940 1960 1980 2000
NGA Rainfall (mm) Trend

48
Figure 21:
Source: Guha-Sapir, D., et. al, 2016
Figure 22:
Source: Guha-Sapir, D., et. al, 2016
1
17
25
1 1
27
63
28
3
0
5
10
15
20
25
30
Drough
t
Viral d
isease
Bacteri
al dis
ease
Heat w
ave
Cold w
ave
Riverin
e floo
d
Flash f
lood
Landsl
ideStor
m
Conve
ctive
storm
NGA Frequency of Natural Disasters 1960-2016
6715
17263
60 181092 330 32
119254
02000400060008000
100001200014000160001800020000
Drough
t
Viral d
isease
Bacteri
al dis
ease
Heat w
ave
Cold w
ave
Riverin
e floo
d
Flash f
lood
Landsl
ideStor
m
Conve
ctive
storm
NGA Total Deaths by Disaster Type
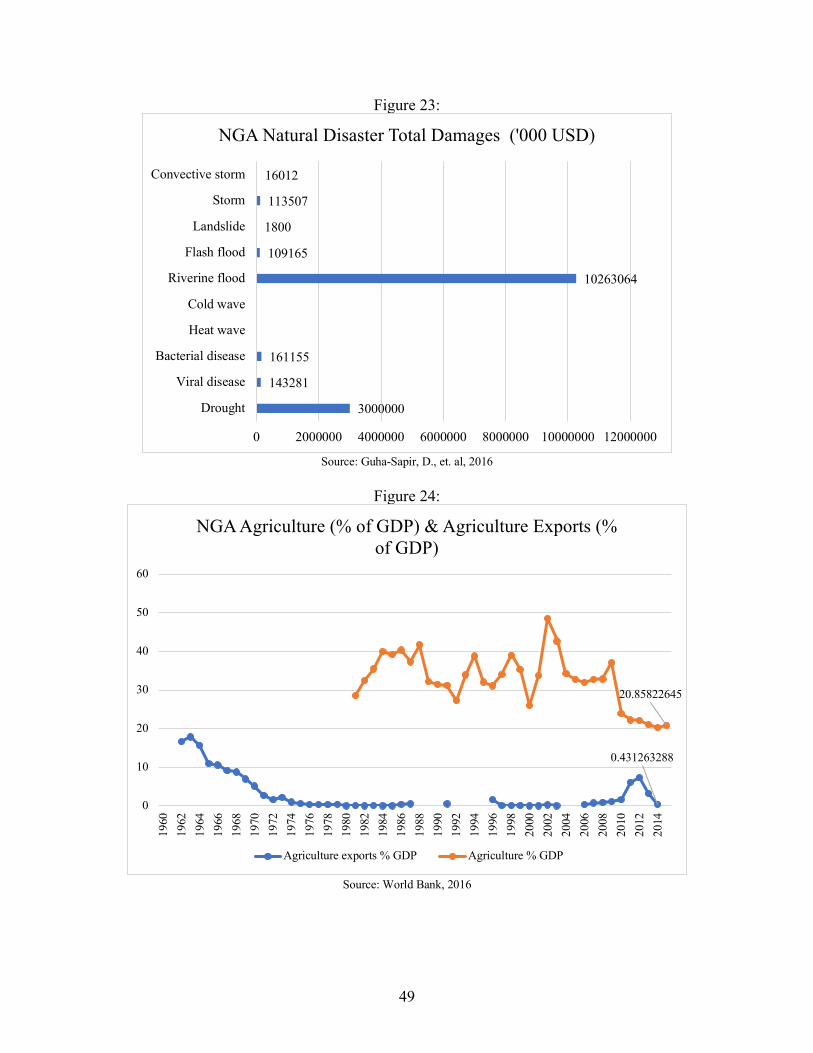
49
Figure 23:
Source: Guha-Sapir, D., et. al, 2016
Figure 24:
Source: World Bank, 2016
3000000
143281
161155
10263064
109165
1800
113507
16012
0 2000000 4000000 6000000 8000000 10000000 12000000
Drought
Viral disease
Bacterial disease
Heat wave
Cold wave
Riverine flood
Flash flood
Landslide
Storm
Convective storm
NGA Natural Disaster Total Damages ('000 USD)
0.431263288
20.85822645
0
10
20
30
40
50
60
1960
1962
1964
1966
1968
1970
1972
1974
1976
1978
1980
1982
1984
1986
1988
1990
1992
1994
1996
1998
2000
2002
2004
2006
2008
2010
2012
2014
NGA Agriculture (% of GDP) & Agriculture Exports (% of GDP)
Agriculture exports % GDP Agriculture % GDP

50
Figure 25:
Source: World Bank, 2016
Figure 26:
Source: Food and Agriculture Organization of the United Nations, 2015
0.6679865660
0.5
1
1.5
2
2.5
3
3.5
4
4.519
6219
6419
6619
6819
7019
7219
7419
7619
7819
8019
8219
8419
8619
8819
9019
9219
9419
9619
9820
0020
0220
0420
0620
0820
1020
1220
14
NGA Agricultural Raw Materials Imports (% of merchandise imports)
13038.4713
0
5000
10000
15000
20000
25000
30000
35000
1991
1992
1993
1994
1995
1996
1997
1998
1999
2000
2001
2002
2003
2004
2005
2006
2007
2008
2009
2010
2011
2012
2013
NGA Cash Crop Gross Production Value (million USD)
Cassava Groundnuts Oil, palm Maize Millet
Plantains Rice, paddy Soybeans Yams
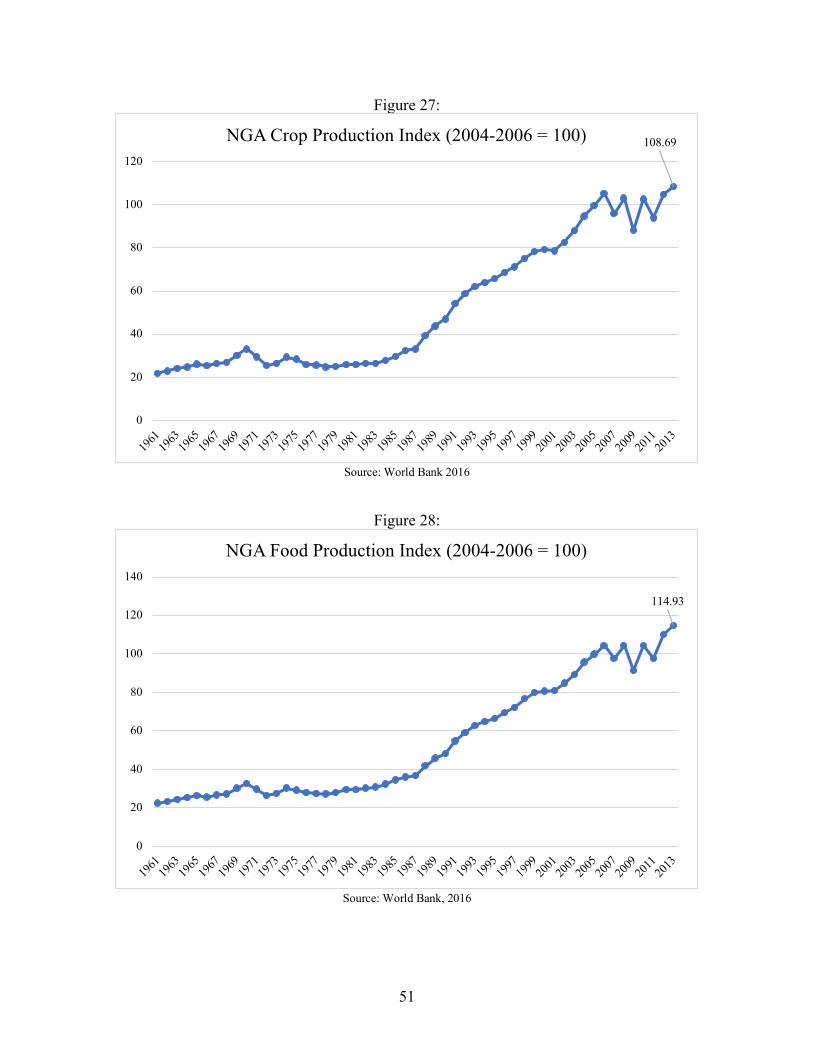
51
Figure 27:
Source: World Bank 2016
Figure 28:
Source: World Bank, 2016
108.69
0
20
40
60
80
100
120
1961
1963
1965
1967
1969
1971
1973
1975
1977
1979
1981
1983
1985
1987
1989
1991
1993
1995
1997
1999
2001
2003
2005
2007
2009
2011
2013
NGA Crop Production Index (2004-2006 = 100)
114.93
0
20
40
60
80
100
120
140
1961
1963
1965
1967
1969
1971
1973
1975
1977
1979
1981
1983
1985
1987
1989
1991
1993
1995
1997
1999
2001
2003
2005
2007
2009
2011
2013
NGA Food Production Index (2004-2006 = 100)

52
Figure 29:
Source: World Bank, 2016
Figure 30:
Source: Food and Agriculture Organization of the United Nations, 2015
7
0
5
10
15
20
25
30
1991
1992
1993
1994
1995
1996
1997
1998
1999
2000
2001
2002
2003
2004
2005
2006
2007
2008
2009
2010
2011
2012
2013
2014
2015
NGA Prevalence of Undernourishment (% of population)
19
0
10
20
30
40
50
60
70
80
90
1990
1991
1992
1993
1994
1995
1996
1997
1998
1999
2000
2001
2002
2003
2004
2005
2006
2007
2008
2009
2010
2011
2012
2013
2014
2015
NGA Per Capita Food Supply Variability (kcal/capita/day)

53
Figure 31:
Source: World Bank, 2016
Figure 32:
Source: World Bank, 2016
-20
-10
0
10
20
30
4019
6019
6219
6419
6619
6819
7019
7219
7419
7619
7819
8019
8219
8419
8619
8819
9019
9219
9419
9619
9820
0020
0220
0420
0620
0820
1020
1220
14
NGA GDP Growth, annual %
10.65669501
0
10
20
30
40
50
60
1960
1962
1964
1966
1968
1970
1972
1974
1976
1978
1980
1982
1984
1986
1988
1990
1992
1994
1996
1998
2000
2002
2004
2006
2008
2010
2012
2014
NGA Exports of Goods & Services (% of GDP)
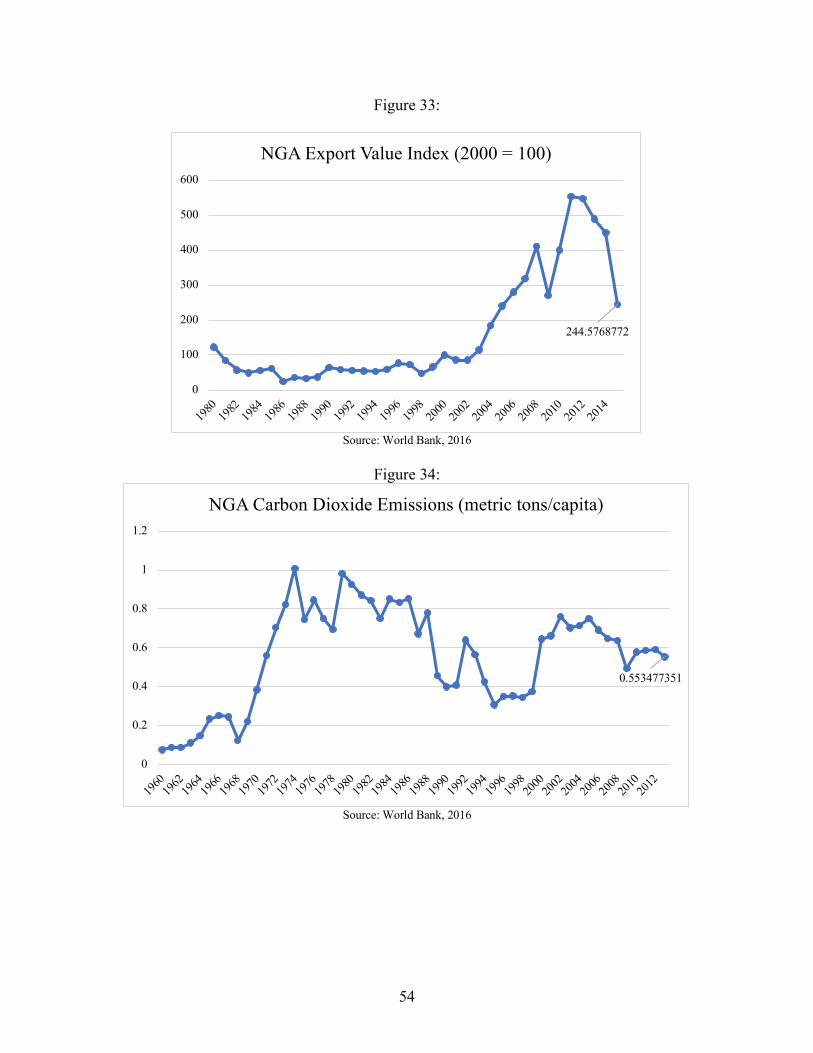
54
Figure 33:
Source: World Bank, 2016
Figure 34:
Source: World Bank, 2016
244.5768772
0
100
200
300
400
500
600
1980
1982
1984
1986
1988
1990
1992
1994
1996
1998
2000
2002
2004
2006
2008
2010
2012
2014
NGA Export Value Index (2000 = 100)
0.553477351
0
0.2
0.4
0.6
0.8
1
1.2
1960
1962
1964
1966
1968
1970
1972
1974
1976
1978
1980
1982
1984
1986
1988
1990
1992
1994
1996
1998
2000
2002
2004
2006
2008
2010
2012
NGA Carbon Dioxide Emissions (metric tons/capita)

55
Figure 35:
Source: World Bank, 2016
Figure 36:
Source: World Bank, National Consortium for the Study of Terrorism and Responses to Terrorism, 2016
301010.1259
0
50000
100000
150000
200000
250000
300000
350000
400000
1970
1972
1974
1976
1978
1980
1982
1984
1986
1988
1990
1992
1994
1996
1998
2000
2002
2004
2006
2008
2010
2012
NGA Total Greenhouse Gas Emissions (kt of CO2 equivalent)
-20
-10
0
10
20
30
40
0
100
200
300
400
500
600
700
800
1980
1982
1984
1986
1988
1990
1992
1994
1996
1998
2000
2002
2004
2006
2008
2010
2012
2014
NGA GDP Growth & Number of Attacks
# of Attacks GDP Growth
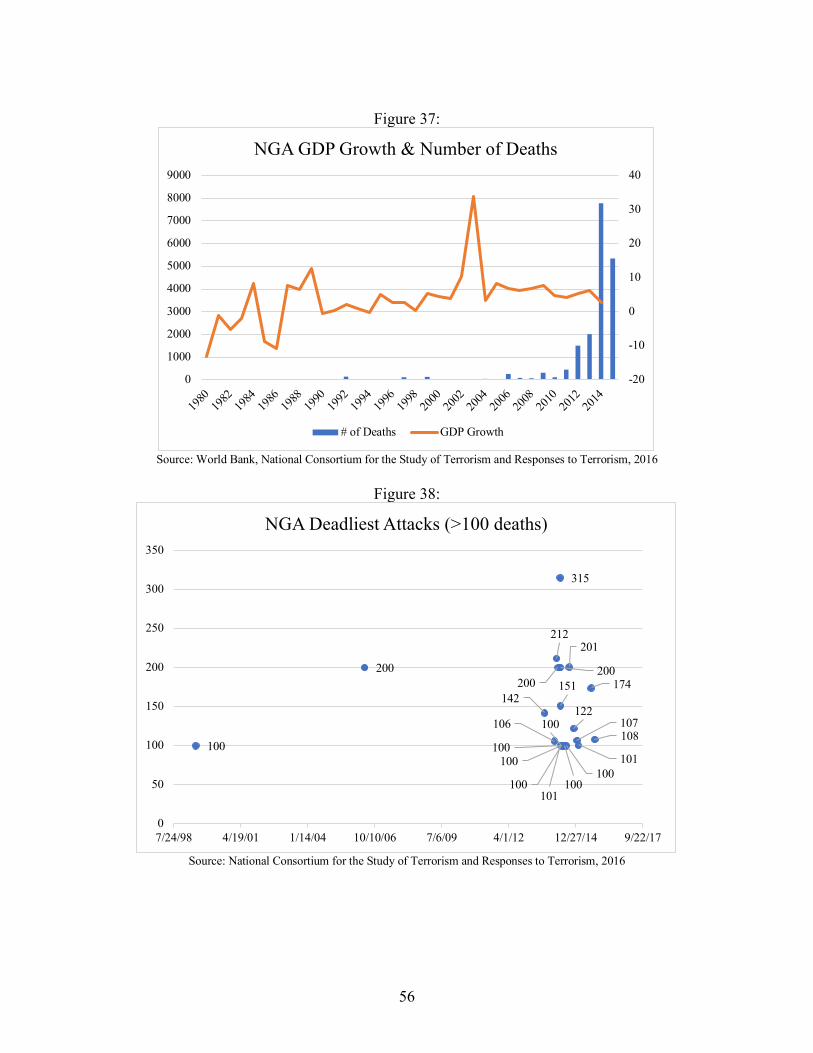
56
Figure 37:
Source: World Bank, National Consortium for the Study of Terrorism and Responses to Terrorism, 2016
Figure 38:
Source: National Consortium for the Study of Terrorism and Responses to Terrorism, 2016
-20
-10
0
10
20
30
40
0
1000
2000
3000
4000
5000
6000
7000
8000
9000
1980
1982
1984
1986
1988
1990
1992
1994
1996
1998
2000
2002
2004
2006
2008
2010
2012
2014
NGA GDP Growth & Number of Deaths
# of Deaths GDP Growth
100
200
142
106
212
200
315
200151
101
100
100
100
100
100100
201
122107
101
174
108
0
50
100
150
200
250
300
350
7/24/98 4/19/01 1/14/04 10/10/06 7/6/09 4/1/12 12/27/14 9/22/17
NGA Deadliest Attacks (>100 deaths)

57
Figure 39:
Source: National Consortium for the Study of Terrorism and Responses to Terrorism, 2016
Airport & Aircraft0%
Business 9%
Education4%
Government11% Journalists/Media
1%Maritime
1%Military7%
NGO 0%
Other0%
Police10%
Private Citizens40%
Religious Institutions
6%
Telecomm1%
Terrorists/Non-State Militia
0%
Transportation2% Unknown
2%Utilities
2%
Violent Political Party3%
NGA Attack Target Distribution
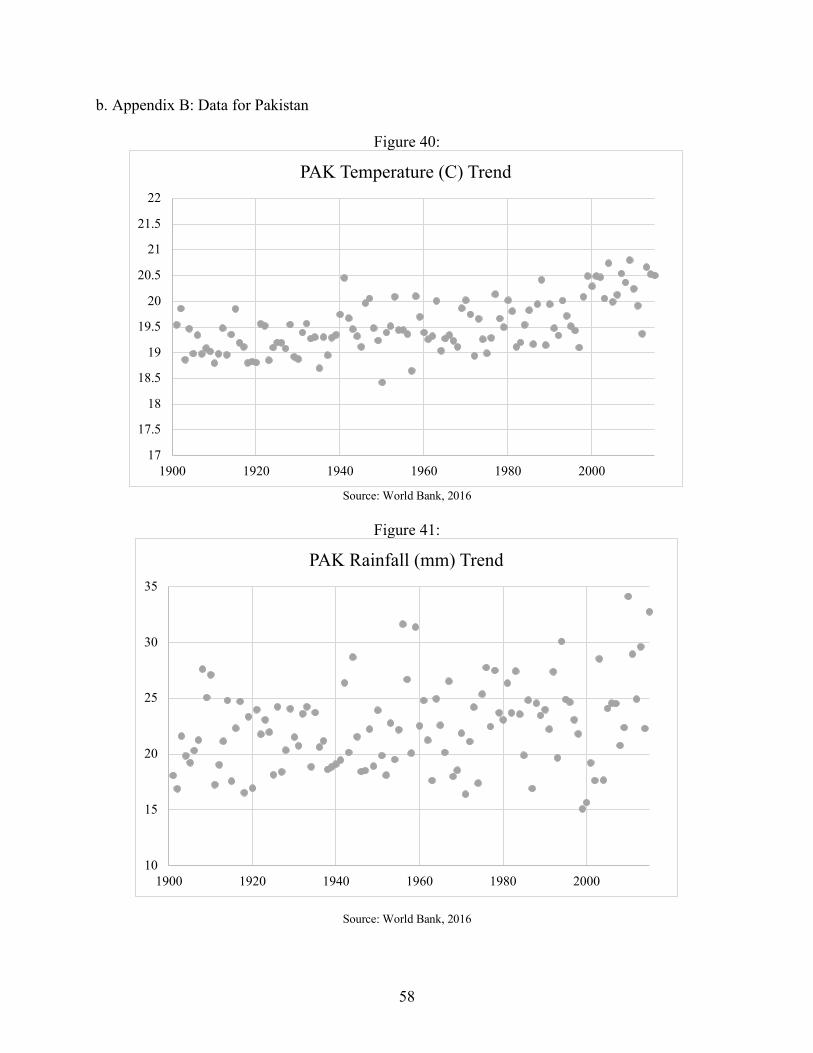
58
b. Appendix B: Data for Pakistan
Figure 40:
Source: World Bank, 2016
Figure 41:
Source: World Bank, 2016
17
17.5
18
18.5
19
19.5
20
20.5
21
21.5
22
1900 1920 1940 1960 1980 2000
PAK Temperature (C) Trend
10
15
20
25
30
35
1900 1920 1940 1960 1980 2000
PAK Rainfall (mm) Trend

59
Figure 42:
Source: Guha-Sapir, D., et. al, 2016
Figure 43:
Source: Guha-Sapir, D., et. al, 2016
1
29
13
13
13
4139
17
10 11
1
106
0
5
10
15
20
25
30
35
40
45
Drough
t
Earthq
uake
Parasit
ic dis
ease
Bacteri
al dis
ease
Viral d
isease
Cold w
ave
Heat w
ave
Riverin
e floo
dFloo
d
Flash f
lood
Landsl
ide
Avalan
che
Rockfa
ll
Conve
ctive
storm
Tropica
l cyc
lone
PAK Frequency of Natural Disasters 1960-2016
2470005329755
180009725030
117003010074118
18000
1715036
0 2000000 4000000 6000000 8000000 10000000 12000000
DroughtEarthquake
Parasitic diseaseBacterial disease
Viral diseaseCold waveHeat wave
Riverine floodFlood
Flash floodLandslide
AvalancheRockfall
Convective stormTropical cyclone
PAK Natural Disaster Total Damages ('000 USD)

60
Figure 44:
Source: Guha-Sapir, D., et. al, 2016
Figure 45:
Source: World Bank, 2016
143
79734
142 10 18 2645 6188 4401 3107 222 560 13 211
11555
0
10000
20000
30000
40000
50000
60000
70000
80000
90000
Drough
t
Earthq
uake
Parasit
ic dis
ease
Bacteri
al dis
ease
Viral d
isease
Cold w
ave
Heat w
ave
Riverin
e floo
dFloo
d
Flash f
lood
Landsl
ide
Avalan
che
Rockfa
ll
Conve
ctive
storm
Tropica
l cyc
lone
PAK Total Deaths by Disaster Type
1.190471888
25.10669087
0
10
20
30
40
50
60
70
1960
1962
1964
1966
1968
1970
1972
1974
1976
1978
1980
1982
1984
1986
1988
1990
1992
1994
1996
1998
2000
2002
2004
2006
2008
2010
2012
2014
PAK Agriculture (% of GDP) & Agriculture Exports (% of GDP)
Agriculture exports % GDP Agriculture % GDP
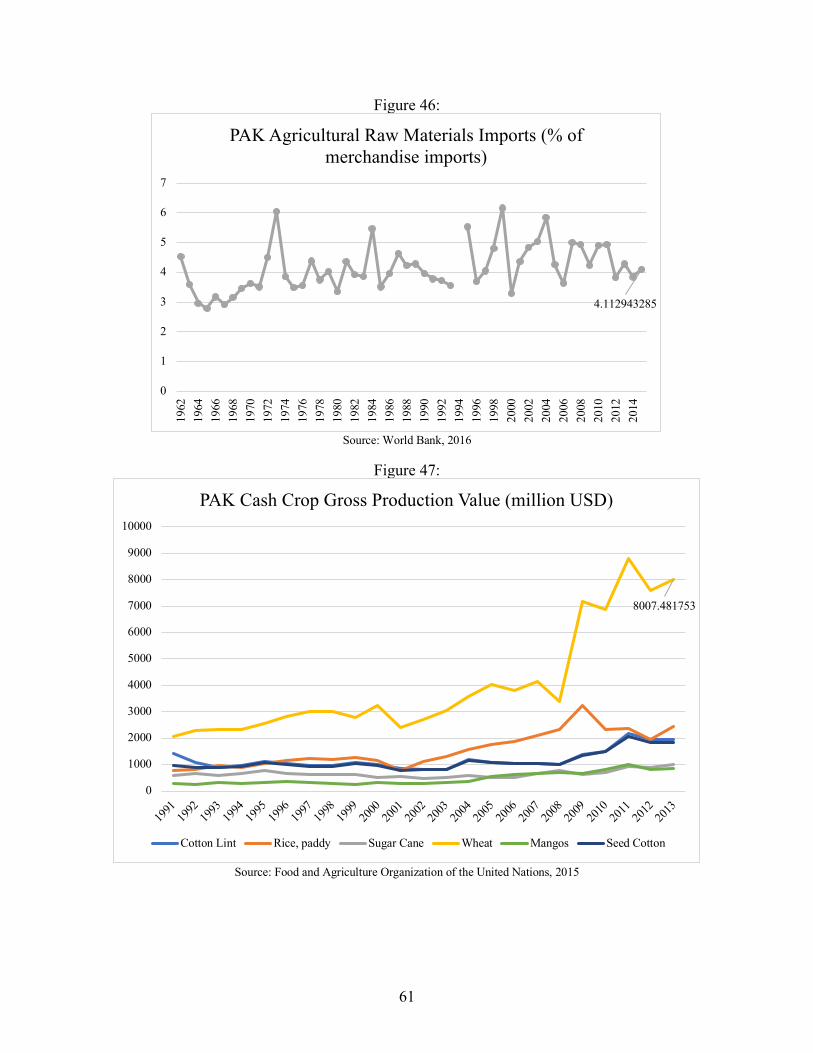
61
Figure 46:
Source: World Bank, 2016
Figure 47:
Source: Food and Agriculture Organization of the United Nations, 2015
4.112943285
0
1
2
3
4
5
6
719
6219
6419
6619
6819
7019
7219
7419
7619
7819
8019
8219
8419
8619
8819
9019
9219
9419
9619
9820
0020
0220
0420
0620
0820
1020
1220
14
PAK Agricultural Raw Materials Imports (% of merchandise imports)
8007.481753
0
1000
2000
3000
4000
5000
6000
7000
8000
9000
10000
1991
1992
1993
1994
1995
1996
1997
1998
1999
2000
2001
2002
2003
2004
2005
2006
2007
2008
2009
2010
2011
2012
2013
PAK Cash Crop Gross Production Value (million USD)
Cotton Lint Rice, paddy Sugar Cane Wheat Mangos Seed Cotton
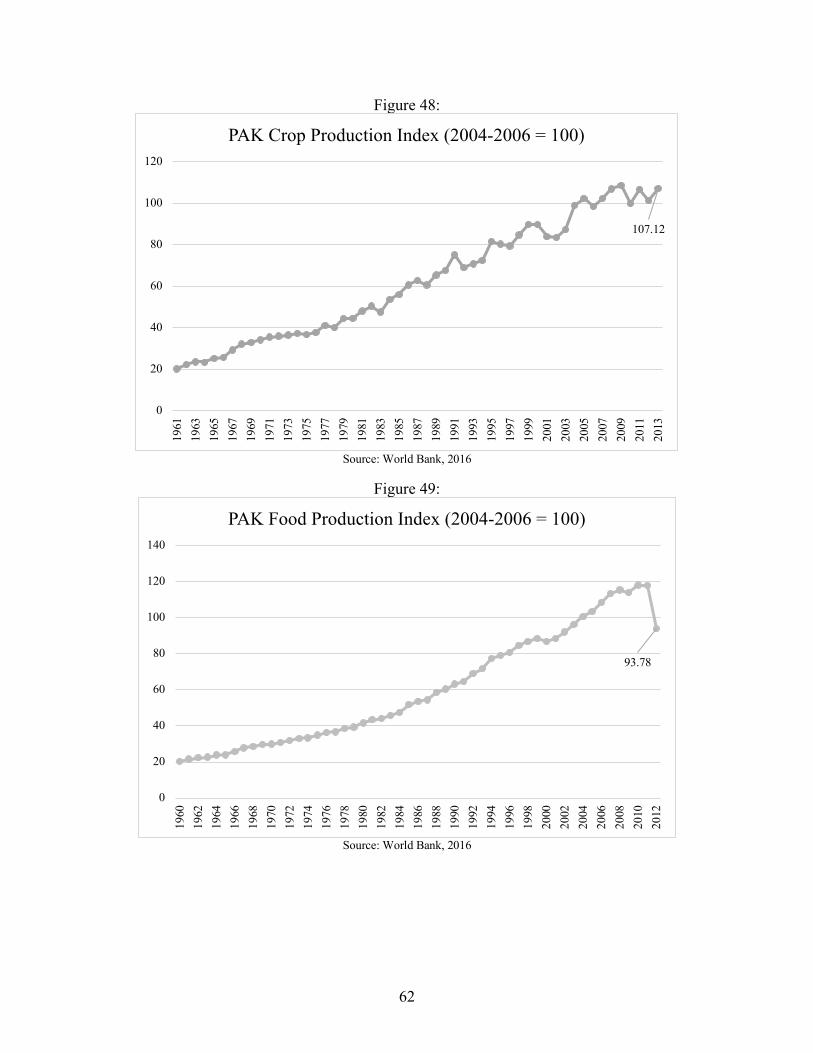
62
Figure 48:
Source: World Bank, 2016
Figure 49:
Source: World Bank, 2016
107.12
0
20
40
60
80
100
12019
6119
6319
6519
6719
6919
7119
7319
7519
7719
7919
8119
8319
8519
8719
8919
9119
9319
9519
9719
9920
0120
0320
0520
0720
0920
1120
13
PAK Crop Production Index (2004-2006 = 100)
93.78
0
20
40
60
80
100
120
140
1960
1962
1964
1966
1968
1970
1972
1974
1976
1978
1980
1982
1984
1986
1988
1990
1992
1994
1996
1998
2000
2002
2004
2006
2008
2010
2012
PAK Food Production Index (2004-2006 = 100)
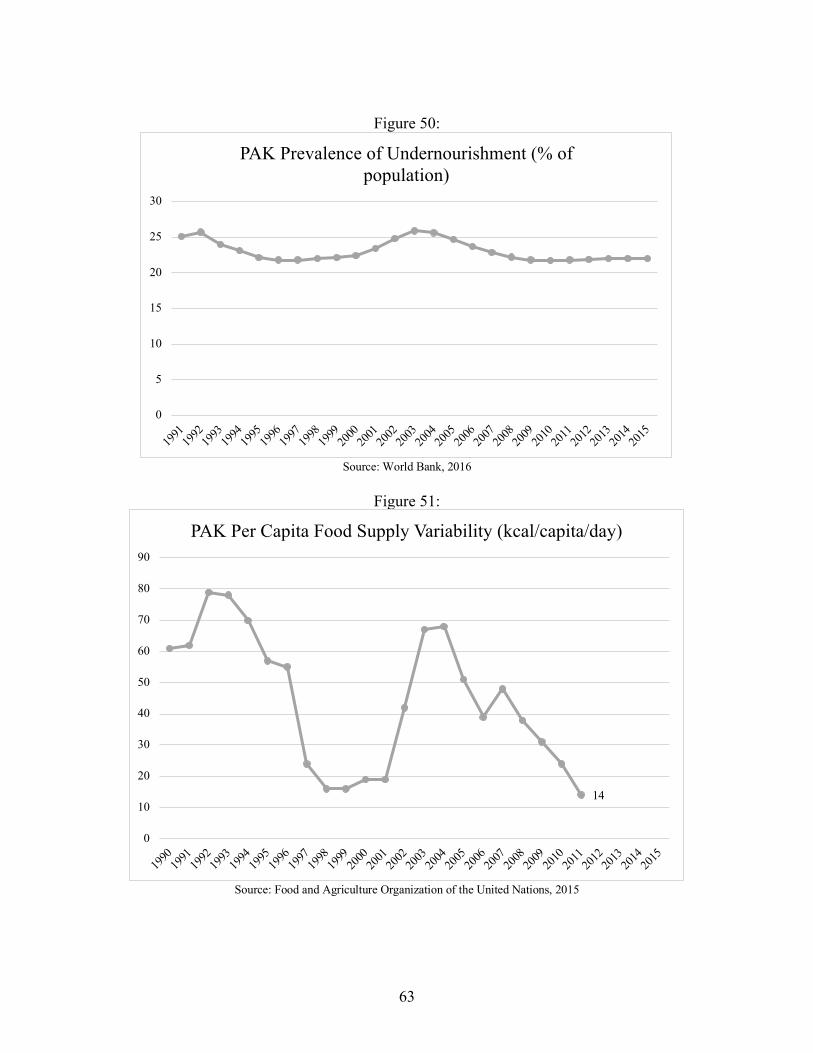
63
Figure 50:
Source: World Bank, 2016
Figure 51:
Source: Food and Agriculture Organization of the United Nations, 2015
0
5
10
15
20
25
30
1991
1992
1993
1994
1995
1996
1997
1998
1999
2000
2001
2002
2003
2004
2005
2006
2007
2008
2009
2010
2011
2012
2013
2014
2015
PAK Prevalence of Undernourishment (% of population)
14
0
10
20
30
40
50
60
70
80
90
1990
1991
1992
1993
1994
1995
1996
1997
1998
1999
2000
2001
2002
2003
2004
2005
2006
2007
2008
2009
2010
2011
2012
2013
2014
2015
PAK Per Capita Food Supply Variability (kcal/capita/day)

64
Figure 52:
Source: World Bank, 2016
Figure 53:
Source: World Bank, 2016
0
2
4
6
8
10
1219
6019
6219
6419
6619
6819
7019
7219
7419
7619
7819
8019
8219
8419
8619
8819
9019
9219
9419
9619
9820
0020
0220
0420
0620
0820
1020
1220
14
PAK GDP Growth, annual %
10.58509397
0
2
4
6
8
10
12
14
16
18
20
1967
1969
1971
1973
1975
1977
1979
1981
1983
1985
1987
1989
1991
1993
1995
1997
1999
2001
2003
2005
2007
2009
2011
2013
2015
PAK Exports of Goods & Services (% of GDP)
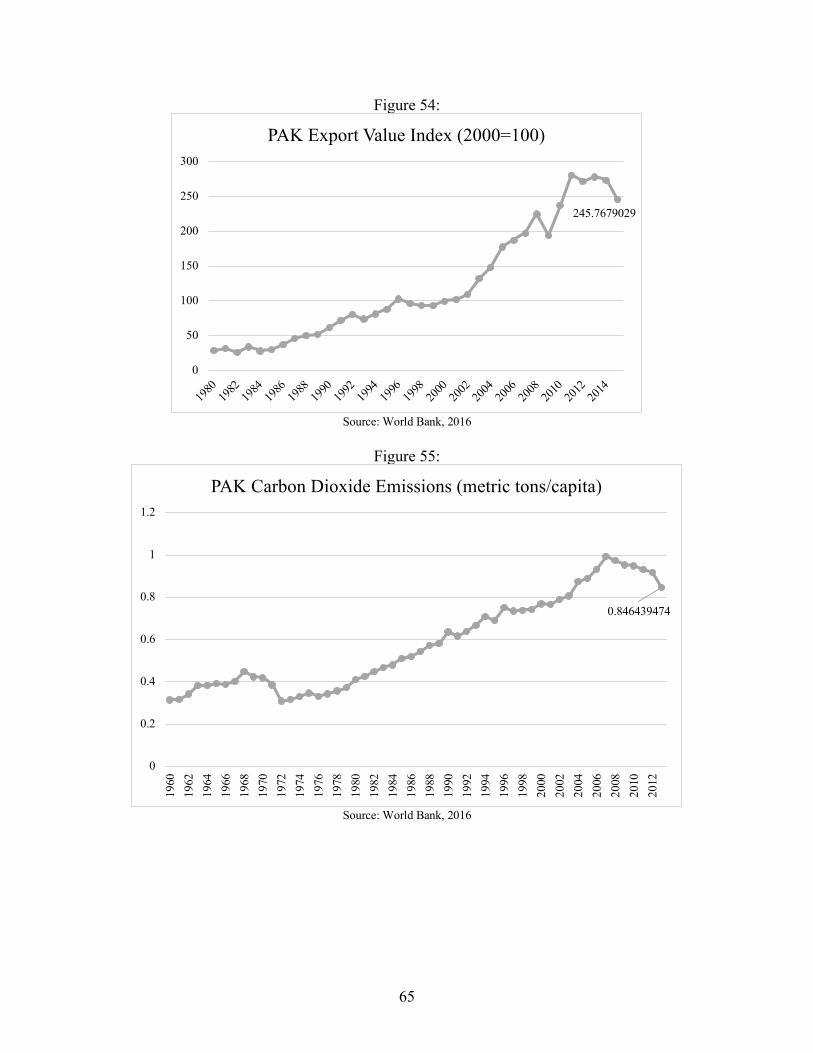
65
Figure 54:
Source: World Bank, 2016
Figure 55:
Source: World Bank, 2016
245.7679029
0
50
100
150
200
250
300
1980
1982
1984
1986
1988
1990
1992
1994
1996
1998
2000
2002
2004
2006
2008
2010
2012
2014
PAK Export Value Index (2000=100)
0.846439474
0
0.2
0.4
0.6
0.8
1
1.2
1960
1962
1964
1966
1968
1970
1972
1974
1976
1978
1980
1982
1984
1986
1988
1990
1992
1994
1996
1998
2000
2002
2004
2006
2008
2010
2012
PAK Carbon Dioxide Emissions (metric tons/capita)
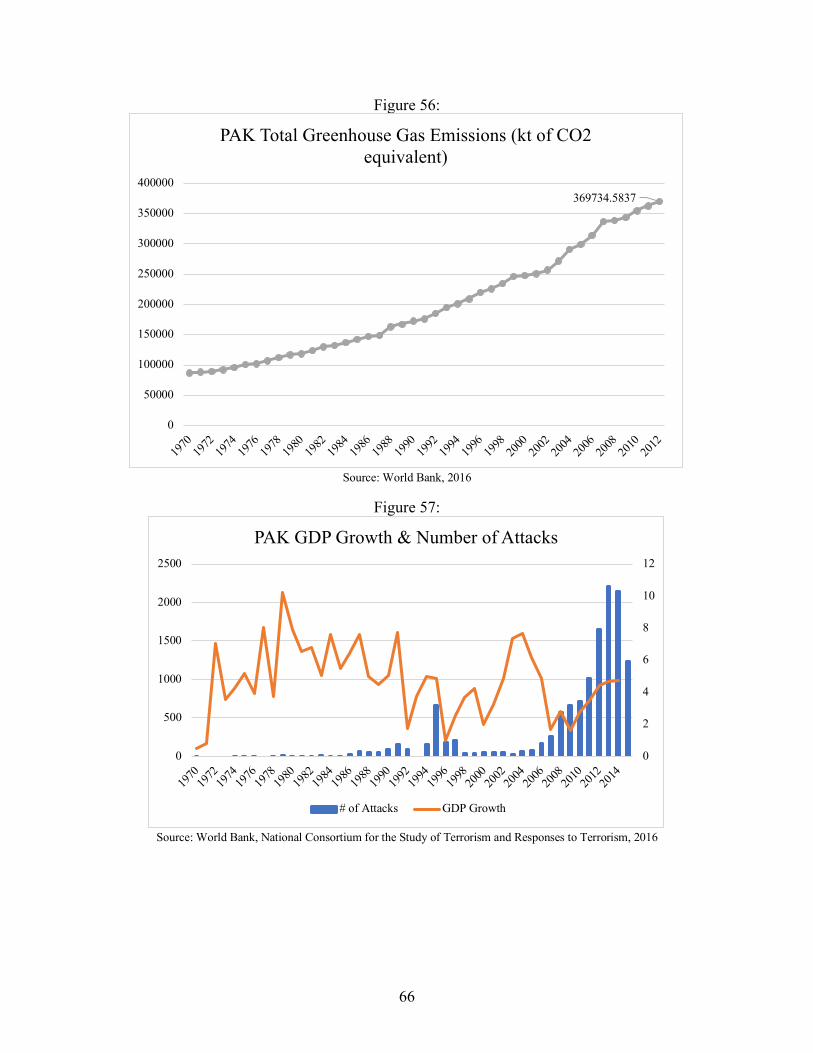
66
Figure 56:
Source: World Bank, 2016
Figure 57:
Source: World Bank, National Consortium for the Study of Terrorism and Responses to Terrorism, 2016
369734.5837
0
50000
100000
150000
200000
250000
300000
350000
400000
1970
1972
1974
1976
1978
1980
1982
1984
1986
1988
1990
1992
1994
1996
1998
2000
2002
2004
2006
2008
2010
2012
PAK Total Greenhouse Gas Emissions (kt of CO2 equivalent)
0
2
4
6
8
10
12
0
500
1000
1500
2000
2500
1970
1972
1974
1976
1978
1980
1982
1984
1986
1988
1990
1992
1994
1996
1998
2000
2002
2004
2006
2008
2010
2012
2014
PAK GDP Growth & Number of Attacks
# of Attacks GDP Growth

67
Figure 58:
Source: World Bank, National Consortium for the Study of Terrorism and Responses to Terrorism, 2016
Figure 59:
Source: National Consortium for the Study of Terrorism and Responses to Terrorism, 2016
0
2
4
6
8
10
12
0
500
1000
1500
2000
2500
3000
3500
1970
1972
1974
1976
1978
1980
1982
1984
1986
1988
1990
1992
1994
1996
1998
2000
2002
2004
2006
2008
2010
2012
2014
PAK GDP Growth & Number of Deaths
# of Deaths GDP Growth
141
120
100
106
157
0
20
40
60
80
100
120
140
160
180
10/10/06 2/22/08 7/6/09 11/18/10 4/1/12 8/14/13 12/27/14 5/10/16
PAK Deadliest Terrorist Attacks (>100 deaths)

68
Figure 60:
Source: Martin, R., Saeed L., Syed, S.H., 2014
Figure 61:
Source: Martin, R., Saeed L., Syed, S.H., 2014
186
1977
3264
5427
0
1000
2000
3000
4000
5000
6000
1981-1989 1990-1999 2000-2010 1981-2010
PAK Number of Incidents by Decade
303
2405
13727
16435
0
2000
4000
6000
8000
10000
12000
14000
16000
18000
1981-1989 1990-1999 2000-2010 1981-2010
PAK Number of Deaths by Decade
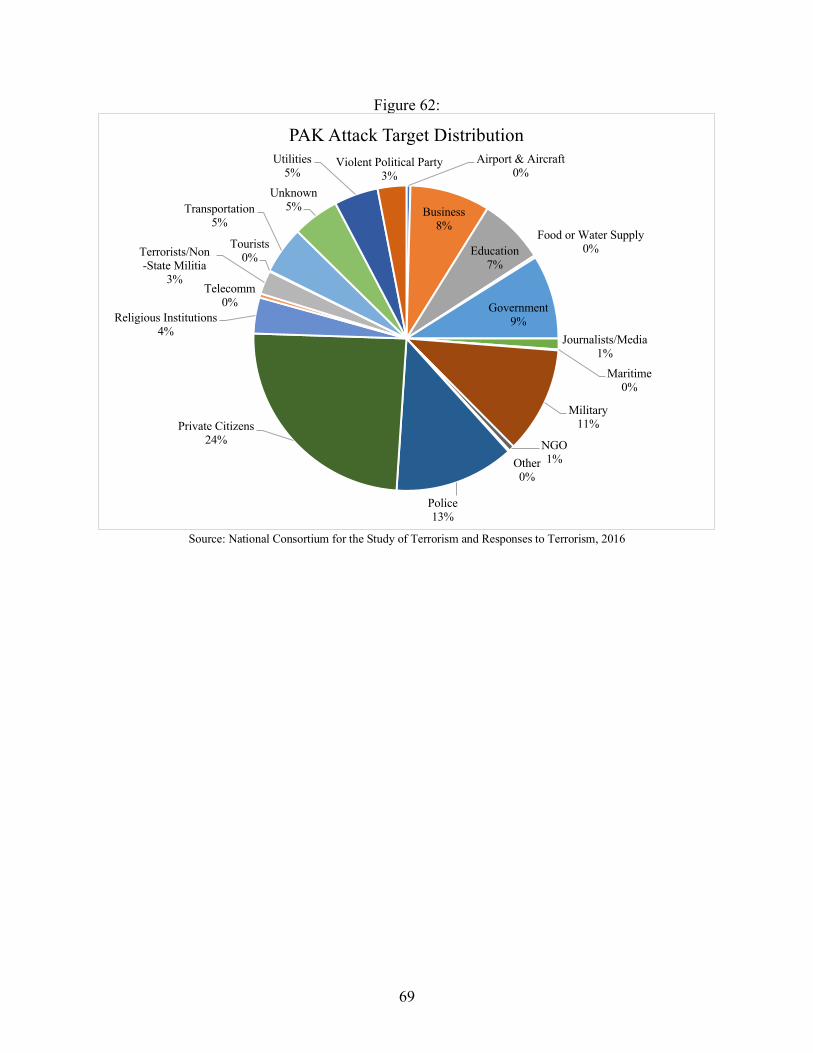
69
Figure 62:
Source: National Consortium for the Study of Terrorism and Responses to Terrorism, 2016
Airport & Aircraft0%
Business 8%
Education7%
Food or Water Supply0%
Government9%
Journalists/Media1%
Maritime0%
Military11%
NGO 1%Other
0%
Police13%
Private Citizens24%
Religious Institutions4%
Telecomm0%
Terrorists/Non-State Militia
3%
Tourists0%
Transportation5%
Unknown5%
Utilities5%
Violent Political Party3%
PAK Attack Target Distribution
70
c. Bibliography:
Akinwotu, E. “Drought Worsens Deadly Battle Between Fulani Herdsmen and Farmers in Nigeria.” The Guardian (January 3, 2017). Retrieved from https://www.theguardian.com/global-development/2017/jan/03/drought-worsens-deadly-conflict-between-fulani-herdsmen-nigeria-farmers
Akpodiogaga, P., Akpodiogagaa Ovuyovwiroye O., “General Overview of Climate Change
Impacts in Nigeria.” Kamla-Raj Journal of Human Ecology, 29(1) (2010): 47-55 https://www.usip.org/sites/default/files/Climate_Change_Nigeria.pdf
Aribigbola, A., Folami, O. M., & Folami, A. O. “Climate Change and Insecurity Are Like
a Chain Reaction.” Peace Review, 25(4), (2013): 518-525. doi:10.1080/10402659.2013.846169
Bartolotta, C. “Terrorism in Nigeria: The Rise of Boko Haram.” World Policy Institute.
(September 19, 2011). Retrieved from http://www.worldpolicy.org/blog/2011/09/19/terrorism-nigeria-rise-boko-haram
BBC News. “Who Are Nigeria’s Boko Haram Islamist Group?” BBC. (November 24, 2016).
Retrieved from http://www.bbc.com/news/world-africa-13809501 Cunningham, W., et. al. “Terrorism: Causes, Concepts and Resolutions.” Printed:
Defense Threat Reduction Agency Fort Belvoir. (January 2003). Retrieved from http://scar.gmu.edu/sites/default/files/global-documents/Sandole-Terrorism_concepts.pdf
Disasters Emergency Committee. “Pakistan Floods Facts and Figures.” (2015). Retrieved from
http://www.dec.org.uk/articles/pakistan-floods-facts-and-figures Dupont, A. “The Strategic Implications of Climate Change.” Survival (00396338) 50(3) (2008):
29-54. doi:10.1080/00396330802173107 Eichelberger, E. “How Environmental Disaster is Making Boko Haram Violence Worse.”
Mother Jones. (June 2014). Web. Retrieved from http://www.motherjones.com/ environment/2014/06/nigeria-environment-climate-change-boko-haram?page=2
Eleftheriou-Smith, L. “Climate Change Could Make Parts of the Middle East and
North Africa ‘Uninhabitable’.” Independent.co.uk. (May 3, 2016). Retrieved from http://www.independent.co.uk/news/science/climate-change-could-make-parts-of-the-middle-east-and-north-africa-uninhabitable-a7010811.html
Environmental Protection Agency. “Climate Change: Basic Information.” (January 17, 2017).
Retrieved from https://www.epa.gov/climatechange/climate-change-basic-information Environmental Protection Agency. “Overview of Climate Science.” (September 29, 2016).
Retrieved from https://www.epa.gov/climate-change-science/overview-climate-change-science

71
Estrada F, Tol RSJ, Botzen WJW. “Global Economic Impacts of Climate Variability and
Change During the 20th Century.” PLoS ONE 12(2) (2017): e0172201. doi:10.1371/journal.pone.0172201
Federal Republic of Nigeria. Speech by His Excellency, President Muhammadu
Bahari. (November 21, 2016). Retrieved from http://www.statehouse.gov.ng/index.php /news/2881-speech-by-his-excellency-president-muhammadu-buhari
Food and Agriculture Organization of the United Nations. Value of Agriculture Production.
(November 9, 2015). FAOSTAT. Web. Retrieved from http://www.fao.org/faostat/en/?#data/QV
Guha-Sapir, D., Below R., Hoyois Ph.- EM-DAT: The CRED/OFDA International Disaster
Database – www.emdat.be – Université Catholique de Louvain – Brussels – Belgium. Haider, S., de Pablos Heredero, C., Ahmed, M., & Dustgeer, S. “Identifying Causes of
Terrorism in Pakistan.” Dialogue (1819-6462), 10(3) (2015): 220-236. Heerten, L. Moses, D. "The Nigeria-Biafra War: Postcolonial Conflict and the Question of
Genocide." Journal of Genocide Research. 16 (August 21, 2014): 169-203. http://dx.doi.org/10.1080/14623528.2014.936700
Hoffman, B. Inside Terrorism. Ch. 1. New York Columbia University Press. (1998). Retrieved
from http://www.nytimes.com/books/first/h/hoffman-terrorism.html Hsu, A. et al. “2016 Environmental Performance Index.” New Haven, CT: Yale University.
(2016). Retrieved from www.epi.yale.edu. Institute for Economics and Peace. “Global terrorism index 2016.” (November 17, 2016).
Retrieved from http://reliefweb.int/sites/reliefweb.int/files/resources/Global%20 Terrorism%20Index%202016_0.pdf
International Forest Fire News. “Fire Situation in Nigeria.” (IFFN) No. 34 (January-June, 2006):
(89-93). Retrieved from http://www.fire.uni-freiburg.de/iffn/iffn_34/12-IFFN-34-Nigeria.pdf
IPCC. “Climate Change 2014: Synthesis Report.” (2014) Contribution of Working Groups I, II
and III to the Fifth Assessment Report of the Intergovernmental Panel on Climate Change [Core Writing Team, R.K. Pachauri and L.A. Meyer (eds.)]. IPCC, Geneva, Switzerland, 151 pp.
Ikeke, N. "10 Things You Should Know About Biafra and the Biafran War." Nigeria Breaking News. (2016). Retrieved from https://www.naij.com/629644-10-things-need-know-biafra-biafran-war.html

72
Islamic Relief (Worldwide). “Pakistan: Current Situation.” (2016). Retrieved from http://www.islamic-relief.org/current-situation-18/
Kelley, C. et. al. “Climate Change in the Fertile Crescent and Implications of the
Recent Syrian drought.” PNAS.org 112(11) (March 17, 2015). doi:10.1073/pnas.1421533112
Krinniger, T. “Lake Chad: Climate Change Fosters Terrorism.” Deutsche Welle. (July 12, 2015).
Retrieved from http://www.dw.com/en/lake-chad-climate-change-fosters-terrorism/a-18899499
Lewandowsky, S., Stritzke, W. K., Freund, A. M., Oberauer, K., & Krueger, J. I.
“Misinformation, Disinformation, and Violent Conflict.” American Psychologist, 68(7) (2013): 487-501. doi:10.1037/a0034515
Martin, R., et. al. “Historical Patterns of Terrorism in Pakistan.” Defense & Security Analysis, 30(3) (2014): 209-229, doi: 10.1080/14751798.2014.921450
Mayah, E. “Climate Change Fuels Nigeria Terrorism.” Africa Review. (February 24, 2012). Web.
Retrieved from http://www.africareview.com/News/Climate-change-fuels-Nigeria-terrorism/-/979180/1334472/-/vq4tja/-/index.html
Miguel, E., Satyanath, S., & Sergenti, E. “Economic Shocks and Civil Conflict: An
Instrumental Variables Approach.” Journal of Political Economy, 112(4) (2004): 725-753. doi:10.1086/421174
Miller, B. “2016 Was the Hottest Year on Record – Again.” Cable News Network. (January 18, 2017). Retrieved from http://www.cnn.com/2017/01/18/world/2016-hottest-year/index.html
National Consortium for the Study of Terrorism and Responses to Terrorism (START). (2016).
Global Terrorism Database [Data file]. Retrieved from https://www.start.umd.edu/gtd NOAA National Centers for Environmental Information, “State of the Climate: Global Climate
Report for Annual 2013.” (January 2014). Retrieved from https://www.ncdc.noaa.gov/sotc/global/201313.
Oguntala, A.B. “The Climatic Aspects of the 1982/83 Wildfires in Nigeria.” Meteorology and
Agroforestry. (8). World Agroforestry Centre. Retrived from: http://www.worldagroforestry.org/Units/Library/Books/Book%2077/meteorology%20and%20agroforestry/html/clilmatic_aspects_wildfires_Nigeria.htm?n=68
Oxford English Dictionary. “Terrorism.” Oxford University Press. (2017). Retrieved from
https://en.oxforddictionaries.com/definition/terrorism
73
Oyebamiji, O. K., Edwards, N. R., Holden, P. B., Garthwaite, P. H., Schaphoff, S., & Gerten, D. “Emulating Global Climate Change Impacts on Crop Yields.” Statistical Modelling: An International Journal, 15(6) (2015): 499-525. doi:10.1177/1471082X14568248
Oyenini, A. “Terrorism in Nigeria: Groups, Activities, and Politics.” International Journal
of Politics and Good Governance. 1(1.1) (2010). Retrieved from http://onlineresearchjournals.com/ijopagg/art/42.pdf
Pakistan Weather Portal. “History of Drought in Pakistan – In Detail.” (May 8, 2011). Retrieved
from https://pakistanweatherportal.com/2011/05/08/history-of-drought-in-pakistan-in-detail/
Rossati, A. “Global Warming and Its Health Impact.” International Journal Of
Occupational & Environmental Medicine, 8(1) (2017): 7-20. Sayed, A. “Climate Change and Its Realities for Pakistan.” Symposium on “Changing
Environmental Pattern and its impact with Special Focus on Pakistan”. No. 288 (pp. 80-92). Retrieved from https://pecongress.org.pk/images/upload/books/6-Climate%20Change%20and%20its%20Realities%20for%20Pakistan%20(6).pdf
Sayne, A. “Climate Change Adaptation and Conflict in Nigeria.” United States Institute for
Peace. (June 2011). Retrieved from https://www.usip.org/sites/default/files/Climate_Change_Nigeria.pdf
Solow, A. R. “Global Warming: A Call for Peace on Climate and Conflict.” Nature, 497(7448)
(2013): 179-180. doi:10.1038/497179a
United Nations News Centre. “Tackling Hunger crises in South Sudan, Somalia, Nigeria and Yemen Requires $4.4 billion.” UN News Service. (February 22, 2017). Retrieved from http://www.un.org/apps/news/story.asp?NewsID=56223#.WPET8qPMxsN
United Nations Office of the Coordination of Humanitarian Affairs (OCHA). “Nigeria:
Floods –July 2012.” Relief Web. Retrieved from http://reliefweb.int/disaster/fl-2012-000138-nga
United Nations Water Activity Information System. “Drought Conditions and Management
Strategies in Nigeria.” Retrieved from http://www.ais.unwater.org/ais/pluginfile.php/629/mod_page/content/6/Nigeria_EN.pdf
Verisk Maplecroft Analytics. “Climate Change and Environmental Risk Atlas 2015.”
Verisk Maplecroft. (October 29, 2014). Retrieved from https://maplecroft.com/portfolio/new-analysis/2014/10/29/climate-change-and-lack-food-security-multiply-risks-conflict-and-civil-unrest-32-countries-maplecroft/
Worland, J. “Why Climate Change and Terrorism are Connected.” Time.Com, N.PAG. (November 15, 2015).

74
The World Bank. World Bank Development Indicators. (2016). [Data File] Retrieved from
http://data.worldbank.org