city research onlineopenaccess.city.ac.uk/1515/1/ijerfinal.pdfinjector, employing a multi-hole...
TRANSCRIPT

City, University of London Institutional Repository
Citation: Mitroglou, N., Nouri, J. M., Gavaises, M. & Arcoumanis, C. (2006). Spray characteristics of a multi-hole injector for direct-injection gasoline engines. International Journal of Engine Research, 7(3), pp. 255-270. doi: 10.1243/146808705X62922
This is the unspecified version of the paper.
This version of the publication may differ from the final published version.
Permanent repository link: http://openaccess.city.ac.uk/1515/
Link to published version: http://dx.doi.org/10.1243/146808705X62922
Copyright and reuse: City Research Online aims to make research outputs of City, University of London available to a wider audience. Copyright and Moral Rights remain with the author(s) and/or copyright holders. URLs from City Research Online may be freely distributed and linked to.
City Research Online: http://openaccess.city.ac.uk/ [email protected]
City Research Online

Spray characteristics of a multi-hole injector for direct - injection gasoline engines
N. Mitroglou, J. M. Nouri, M. Gavaises and C. Arcoumanis
Centre for Energy and the Environment
School of Engineering and Mathematical Sciences, City University, London, UK
Abstract: The sprays from a high-pressure multi-hole
nozzle injected into a constant volume chamber have been
visualised and quantified in terms of droplet velocity and
diameter with a two-component phase Doppler
amenometry (PDA) system at injection pressures up to
200bar and chamber pressures varying from atmospheric
to 12bar. The flow characteristics within the injection
system were quantified by means of an FIE 1-D model,
providing the injection rate and the injection velocity in
the presence of hole cavitation, by an in-house 3-D CFD
model providing the detailed flow distribution for various
combinations of nozzle hole configurations, and by a fuel
atomisation model giving estimates of the droplet size
very near to the nozzle exit. The overall spray angle
relative to the axis of the injector was found to be almost
independent of injection and chamber pressure, a
significant advantage relative to swirl pressure
atomisers. Temporal droplet velocities were found to
increase sharply at the start of injection and then to
remain unchanged during the main part of injection
before decreasing rapidly towards the end of injection.
The spatial droplet velocity profiles were jet-like at all
axial locations, with the local velocity maximum found at
the centre of the jet. Within the measured range, the effect
of injection pressure on droplet size was rather small
while the increase in chamber pressure from atmospheric
to 12bar resulted in much smaller droplet velocities, by
up to fourfold, and larger droplet sizes by up to 40%.
Key words: gasoline direct injection engines, high-
pressure multi-hole injectors, phase Doppler
anemometry, nozzle flow CFD simulation, atomisation
modelling
1. Introduction
The objective of introducing direct-injection gasoline
engines into the market is to reduce fuel consumption
through charge stratification under overall lean
conditions, to increase volumetric efficiency and to
reduce exhaust emissions. There are numerous feasible
design configurations for spark-ignition gasoline direct
injection engines, which are classified depending on the
relative position of the injector to the spark plug and
piston crown shape, the injection timing and the air
motion and mixture preparation strategy. They are
classified as wall-, air-, or spray-guided combustion
systems, employing central or side fuel injection. In all
concepts, good combustion is achieved by formation of a
stable and ignitable mixture around the spark plug at the
time of ignition. The major component of the fuel
injection system that is responsible for preparing such a
fuel/air mixture cloud is the high-pressure injector. Thus,
knowledge of the spray characteristics, including spray
structure, tip penetration and distribution of droplet
velocities and diameters as a function of nozzle design,
injection and chamber pressures, is essential.
Previously published investigations [1-8] have
mainly focused on swirl pressure atomisers, known as
first-generation injectors. In general, this type of injector
can produce very finely atomised droplets with diameters
(SMD) in the range 15-25μm over a moderate range of
injection pressures (50-100bar). Their disadvantage is
that the spray generated from these injectors is very
sensitive to the operating and thermodynamic conditions.
An unavoidable ‘collapse’, i.e. a reduction of spray angle
and penetration at elevated chamber pressures
(corresponding to the late-injection strategy of spray-
guided systems) has been reported. A different type of
injector, employing a multi-hole nozzle, has been recently
introduced by fuel injection manufacturers, aiming to
overcome this dependence of the spray characteristics on
thermodynamic and operating conditions by introducing
several holes in a configuration similar to diesel injector
nozzles. Up to now there have been limited investigations
on this type of injectors [9-12], who confirmed the
improved stability of the spray at elevated chamber
pressures relative to that of swirl injectors. Also,
enhanced air entrainment has been observed due to the
N.Mitroglou, J.M.Nouri, M.Gavaises and C.Arcoumanis
separated spray jets, and the larger surface area, which
can be independently directed at desired locations,
achieving improved matching between the injector and
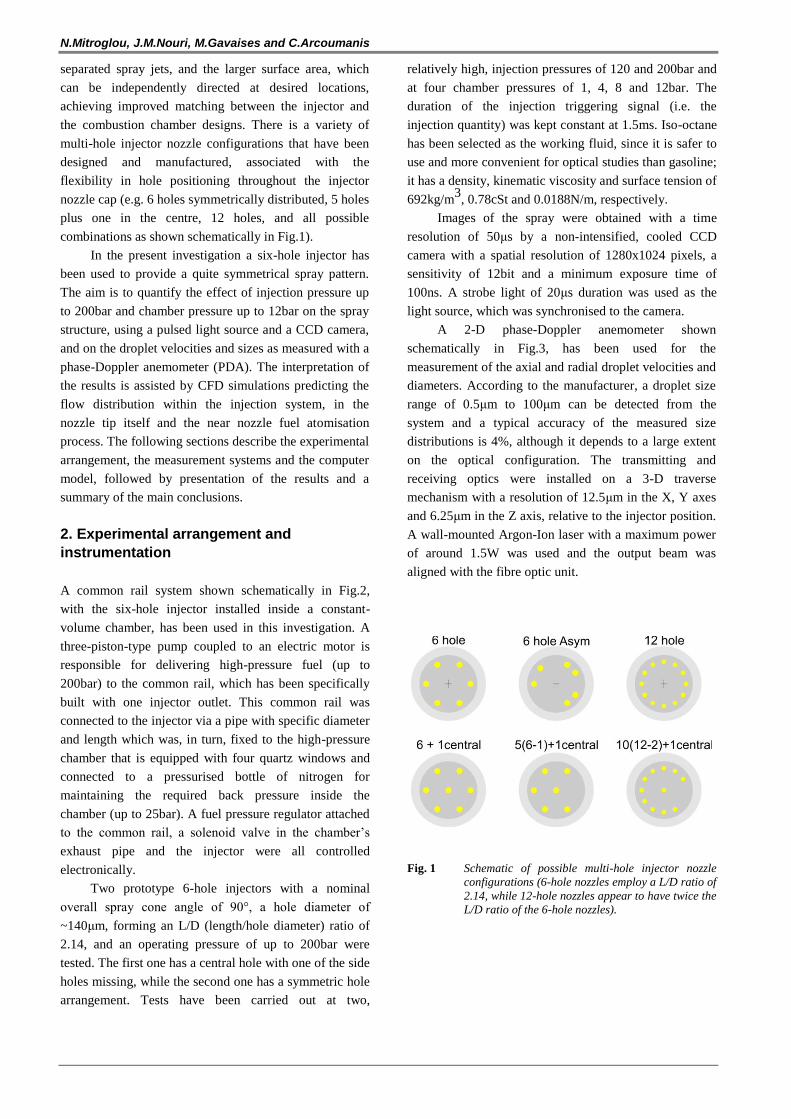
the combustion chamber designs. There is a variety of
multi-hole injector nozzle configurations that have been
designed and manufactured, associated with the
flexibility in hole positioning throughout the injector
nozzle cap (e.g. 6 holes symmetrically distributed, 5 holes
plus one in the centre, 12 holes, and all possible
combinations as shown schematically in Fig.1).
In the present investigation a six-hole injector has
been used to provide a quite symmetrical spray pattern.
The aim is to quantify the effect of injection pressure up
to 200bar and chamber pressure up to 12bar on the spray
structure, using a pulsed light source and a CCD camera,
and on the droplet velocities and sizes as measured with a
phase-Doppler anemometer (PDA). The interpretation of
the results is assisted by CFD simulations predicting the
flow distribution within the injection system, in the
nozzle tip itself and the near nozzle fuel atomisation
process. The following sections describe the experimental
arrangement, the measurement systems and the computer
model, followed by presentation of the results and a
summary of the main conclusions.
2. Experimental arrangement and
instrumentation
A common rail system shown schematically in Fig.2,
with the six-hole injector installed inside a constant-
volume chamber, has been used in this investigation. A
three-piston-type pump coupled to an electric motor is
responsible for delivering high-pressure fuel (up to
200bar) to the common rail, which has been specifically
built with one injector outlet. This common rail was
connected to the injector via a pipe with specific diameter
and length which was, in turn, fixed to the high-pressure
chamber that is equipped with four quartz windows and
connected to a pressurised bottle of nitrogen for
maintaining the required back pressure inside the
chamber (up to 25bar). A fuel pressure regulator attached
to the common rail, a solenoid valve in the chamber’s
exhaust pipe and the injector were all controlled
electronically.
Two prototype 6-hole injectors with a nominal
overall spray cone angle of 90°, a hole diameter of
~140μm, forming an L/D (length/hole diameter) ratio of
2.14, and an operating pressure of up to 200bar were
tested. The first one has a central hole with one of the side
holes missing, while the second one has a symmetric hole
arrangement. Tests have been carried out at two,
relatively high, injection pressures of 120 and 200bar and
at four chamber pressures of 1, 4, 8 and 12bar. The
duration of the injection triggering signal (i.e. the
injection quantity) was kept constant at 1.5ms. Iso-octane
has been selected as the working fluid, since it is safer to
use and more convenient for optical studies than gasoline;
it has a density, kinematic viscosity and surface tension of
692kg/m3
, 0.78cSt and 0.0188N/m, respectively.
Images of the spray were obtained with a time
resolution of 50μs by a non-intensified, cooled CCD
camera with a spatial resolution of 1280x1024 pixels, a
sensitivity of 12bit and a minimum exposure time of
100ns. A strobe light of 20μs duration was used as the
light source, which was synchronised to the camera.
A 2-D phase-Doppler anemometer shown
schematically in Fig.3, has been used for the
measurement of the axial and radial droplet velocities and
diameters. According to the manufacturer, a droplet size
range of 0.5μm to 100μm can be detected from the
system and a typical accuracy of the measured size
distributions is 4%, although it depends to a large extent
on the optical configuration. The transmitting and
receiving optics were installed on a 3-D traverse
mechanism with a resolution of 12.5μm in the X, Y axes
and 6.25μm in the Z axis, relative to the injector position.
A wall-mounted Argon-Ion laser with a maximum power
of around 1.5W was used and the output beam was
aligned with the fibre optic unit.
Fig. 1 Schematic of possible multi-hole injector nozzle
configurations (6-hole nozzles employ a L/D ratio of
2.14, while 12-hole nozzles appear to have twice the
L/D ratio of the 6-hole nozzles).

Spray characteristics of a multi-hole injector for direct-injection gasoline engines
0¦ 1¦¦
¦¦2¦¦¦¦
3¦ ¦¦¦
4¦¦
¦ ¦5 ¦ ¦
¦¦6 ¦¦¦ ¦7 ¦¦ ¦ ¦8¦ ¦¦ ¦9
¦¦¦¦10¦¦¦¦11
B a r
B a r
0¦ ¦¦
¦10¦¦¦¦
30¦ ¦¦ ¦
50
¦ ¦ ¦¦7 0 ¦ ¦¦ ¦9 0 ¦ ¦¦ ¦1
10¦ ¦ ¦¦ 1
30¦¦¦¦1
50¦
F u e l ta n k
L o w p re s s u re
p u m p
F ilte r
S o le n o id v a lv e
E x h a u s t p ip e
C o n tro l b o x
Pre
ss
ure
ra
ilL o w p re s s u re fu e l p ip e s
H ig h p re s s u re fu e l p ip e s
F u e l re tu rn p ip e
C o n tro l p u ls e s
M o to r H ig h p re s s u re
p u m p
In je c to r
Fig. 2 Schematic of the constant volume chamber test rig
This unit was responsible for the splitting of the laser
beam into two pairs of different wavelengths; each pair
consisted of two equal intensity beams. The first pair was
green light with a wavelength of 514.5nm, responsible for
the axial velocity component, while the second pair was
blue light with 488nm wavelength providing the radial
velocity component.
A Bragg cell unit positioned inside this fibre optical
unit provided a 40MHz frequency shift. The transfer of
the four laser beams to the transmitting optics was
through a fibre-optic cable. The collimating and focusing
lenses formed an intersection volume with major and
minor axes of approximately 2.863 and 0.092mm for the
green, and 2.716 and 0.088mm for the blue component.
Light scattered by the droplets was collected by a 310mm
focal length lens positioned at 30° to the plane of the two
incident green beams to ensure that refraction dominated
the scattered light (Fig.3). The signal from the four
photomultipliers was transmitted to the processor unit
where all the data processing was carried out. The
processor was connected to a desktop computer via an
ethernet adaptor, where all the acquired data were saved
for further analysis. Up to 1000 validated sample data
were collected for each measurement location and a time
window of 0.1ms over many injection cycles, to allow
ensemble averages to be estimated. The measurements
were synchronised with the needle lift by an external
reset pulse, and restricted to the first 2.5ms after the start
of the injection process, depending on the axial location
and the pressure in the chamber.
Difficulties in measurements were encountered
during the main injection period especially in the central
part of the individual sprays jets and near the nozzle exit
region under certain test conditions due to the attenuation
of the incident laser beams and the scattered light. The
problem was more pronounced in the case of injection
against elevated chamber pressures, where the system
was unable to detect adequate signals during the main
part of injection up to an axial distance of 20 mm from
the nozzle exit.
Re c e iv in g O p tic s Tra n sm isio n O p tic s
In je c to r
To p Vie w
3 0 d e g re e s
Fig. 3 Optical configuration of the phase Doppler
anemometer (PDA) system.
3. Computer simulation model
In this section, the methodology employed in order to
calculate the whole fuel injection process, that comprises
the fuel injection system, the nozzle flow and the
atomisation process of the injected sprays, is briefly
described.
A variety of models have been applied to the
simulation of the fuel injection process. Initially, a 1-D
model has been used for the simulation of the pressure
N.Mitroglou, J.M.Nouri, M.Gavaises and C.Arcoumanis
waves developing inside the fuel injection system. The
model is based on the solution of the mass and
momentum flow conservation equations, expressed in 1-
D, and which are solved numerically using the method of
characteristics. It estimates the transient variation of the
injection pressure inside the nozzle gallery and the flow
rate through the discharge holes using as inputs the
geometric characteristics of the rail, the connecting pipe
and the nozzle itself as well as the nominal pressure value
inside the common-rail. The needle lift, shown in Fig. 4,
as well as the nozzle geometric details are additional
inputs required by the model. The model used has been
found to predict accurately the total fuel injection
quantity as a function of injection pressure and injection
duration, according to Fig. 5, for different needle lifts; a
typical one is shown together with the triggering signal in
Fig. 4. As can be seen, the volumetric capacity of the
injector is almost a linear function of the triggering pulse
width for injection durations greater than 1ms, but less so
for shorter pulse durations. This is related to the fact that
the needle opens fully at around 0.85 ms from triggering.
It is also evident that the volumetric capacity of the
injector at 200bar injection pressure is larger, as
expected, than at 120bar.
- 0 .2 0 .0 0 .2 0 .4 0 .6 0 .8 1 .0 1 .2 1 .4 1 .6 1 .8 2 .0 2 .2
0 .0
0 .5
1 .0
1 .5
2 .0
2 .5
3 .0
Vo
lta
ge
(V
)
Ti m e a f te r tr ig g e r in g (m s)
Tr ig g e r in g P u lse
0
1 0
2 0
3 0
4 0
5 0
6 0
7 0
8 0
Ne e d le L if t
Ne
ed
le L
ift
(μ
m)
Fig. 4 Triggering signal and typical needle lift diagram
Fig. 5 Volumetric capacity of the injector as a function of
injection pulse duration under atmospheric conditions
and for two injection pressures
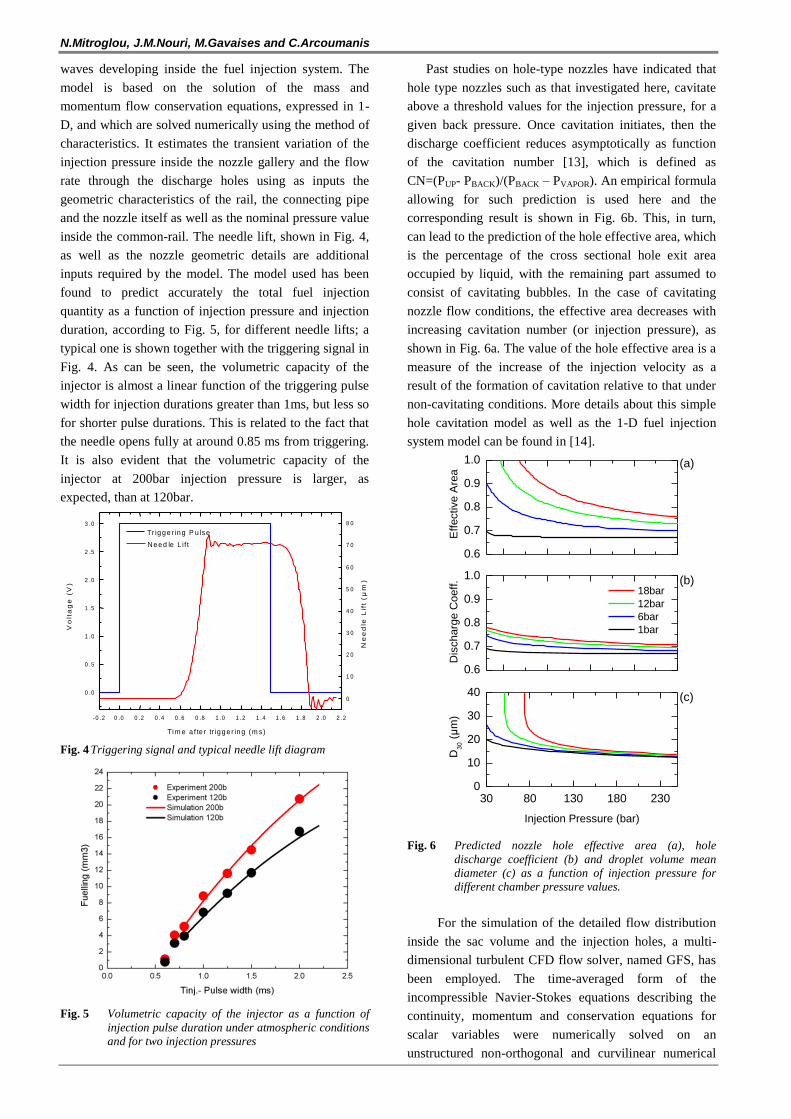
Past studies on hole-type nozzles have indicated that
hole type nozzles such as that investigated here, cavitate
above a threshold values for the injection pressure, for a
given back pressure. Once cavitation initiates, then the
discharge coefficient reduces asymptotically as function
of the cavitation number [13], which is defined as
CN=(PUP- PBACK)/(PBACK – PVAPOR). An empirical formula
allowing for such prediction is used here and the
corresponding result is shown in Fig. 6b. This, in turn,
can lead to the prediction of the hole effective area, which
is the percentage of the cross sectional hole exit area
occupied by liquid, with the remaining part assumed to
consist of cavitating bubbles. In the case of cavitating
nozzle flow conditions, the effective area decreases with
increasing cavitation number (or injection pressure), as
shown in Fig. 6a. The value of the hole effective area is a
measure of the increase of the injection velocity as a
result of the formation of cavitation relative to that under
non-cavitating conditions. More details about this simple
hole cavitation model as well as the 1-D fuel injection
system model can be found in [14].
30 80 130 180 2300
10
20
30
40
0.6
0.7
0.8
0.9
1.0
0.6
0.7
0.8
0.9
1.0
D3
0 (
μm
)
Injection Pressure (bar)
18bar
12bar
6bar
1bar
Dis
charg
e C
oeff.
E
ffective A
rea
Fig. 6 Predicted nozzle hole effective area (a), hole
discharge coefficient (b) and droplet volume mean
diameter (c) as a function of injection pressure for
different chamber pressure values.
For the simulation of the detailed flow distribution
inside the sac volume and the injection holes, a multi-
dimensional turbulent CFD flow solver, named GFS, has
been employed. The time-averaged form of the
incompressible Navier-Stokes equations describing the
continuity, momentum and conservation equations for
scalar variables were numerically solved on an
unstructured non-orthogonal and curvilinear numerical
(a)
(b)
(c)

Spray characteristics of a multi-hole injector for direct-injection gasoline engines
grid using collocated Cartesian velocity components.
Turbulence was simulated by the two equation k-ε model.
The discretisation method was based on the finite volume
approach and the pressure correction method used was
based on the PISO algorithm. A more detailed description
can be found in [15]. A typical numerical grid used for
the simulation of the nozzle flow is shown in Fig. 7.
Fig. 7 Typical numerical grid used for the simulation of the
flow in the sac volume and the injection holes.
L if t= 4 0mL ift= 4 0m
Fig. 8 Predicted pressure distribution inside the injection
nozzle as a function of the needle lift, showing the
pressure drop taking place at the needle seat area.
The low pressure (cavitation) region formed at the
hole entrance can be seen clearly even at very low
needle lifts.
Following its injection, the fuel disintegrates into a
large number of liquid droplets, which form the spray
plume. The detailed process is difficult or even
impossible to be described using direct numerical
simulation, due to the large number of parameters
involved, associated with the presence of the cavitating
bubbles exiting from the injection hole together with the
liquid. To address the problem in an engineering manner,
a phenomenological cavitation-induced atomisation
model previously used for diesel spray simulations has
been employed. Nevertheless, modifications were
required to the original model in order to accurately
predict the measured droplet size distribution near the
nozzle. Overall, the model predicts a reduction of the
droplet volume mean diameter D30 with increasing
injection pressure, as shown in Fig. 6c. The predicted
values reach asymptotically a minimum value of around
20m for injection pressures in excess of 200bar and
atmospheric chamber pressure.
4. Results and discussion
4.1 Internal nozzle flow and near-nozzle
spray characteristics
The first set of results to be presented refers to the
internal nozzle flow and its effect on the near-nozzle
spray characteristics. Since in this area reliable
measurements are very difficult to be obtained, the
computer model has been used to provide an indication of
the detailed two-phase flow processes.
The internal nozzle flow is mainly determined by
the pressure drop at the needle seat area and the entrance
to the injection holes. For the particular injector design
investigated here, the needle seat pressure drop can be
substantial relative to the rail pressure, as shown in Fig. 8
for a needle lift of 40m. This is reflected in the spray
velocity and the resulting droplet size during the transient
phase of the needle opening and closing. During that
period, droplet velocities are much smaller than in the
main injection phase and droplet diameters significantly
larger. Also, even at full lift, the actual injection pressure
is about 90% of the rail pressure. At the entrance to the
injection holes, the local pressure falls well below the
vapour pressure of the liquid, indicating that cavitation is
expected to take place in this area. For the side holes, the
fluid volume under negative pressure is located at the
‘top’ of each injection hole. As can be seen in Fig. 9,
according to the streamlines inside the sac volume that
are coloured relative to the total velocity of the liquid,
most of the fuel entering those holes is coming directly
from above. However, for the central hole, cavitation is
present all around the periphery of the nozzle inlet. Again
from Fig. 9, it can be deduced that for the central hole the
liquid is entering from the side area where one hole is
missing, but also from the space between adjacent side
holes. The liquid coming from that space splits into three
parts. The central part is heading towards the central hole,
but at the point where it mixes with the opposite side
flow, just upstream of the hole entrance, two side jets are
formed and create various recirculation zones. Part of that
N.Mitroglou, J.M.Nouri, M.Gavaises and C.Arcoumanis
liquid is forming stagnation points within the sac volume,
believed to be candidate areas for internal cocking
formation, and part enters into the side holes from the
‘bottom’. This turbulent and unsteady flow structure
leads to the central hole injecting more fuel relative to the
rest, while the flow itself becomes more unsteady as
higher turbulent kinetic energy values are predicted. At
the same time, as the CCD spray images have revealed,
the spray penetrates faster and with significant shot-to-
shot variations. An indicative spray image from that
injector is shown in Fig. 10. Since this injector design
(5+1 central) has been found to give undesirable spray
patterns, the remaining of the results to be presented later
on refer to the symmetric six-hole nozzle configuration.
Fig. 9 Streamlines of the internal nozzle flow for the
injector with the central hole. The flow is unevenly
distributed between the various holes, leading to an
unstable pattern in the central hole.
Fig. 10 CCD Image from a 5+1 central hole nozzle
configuration showing the over-penetration of the
central hole relative to the side ones
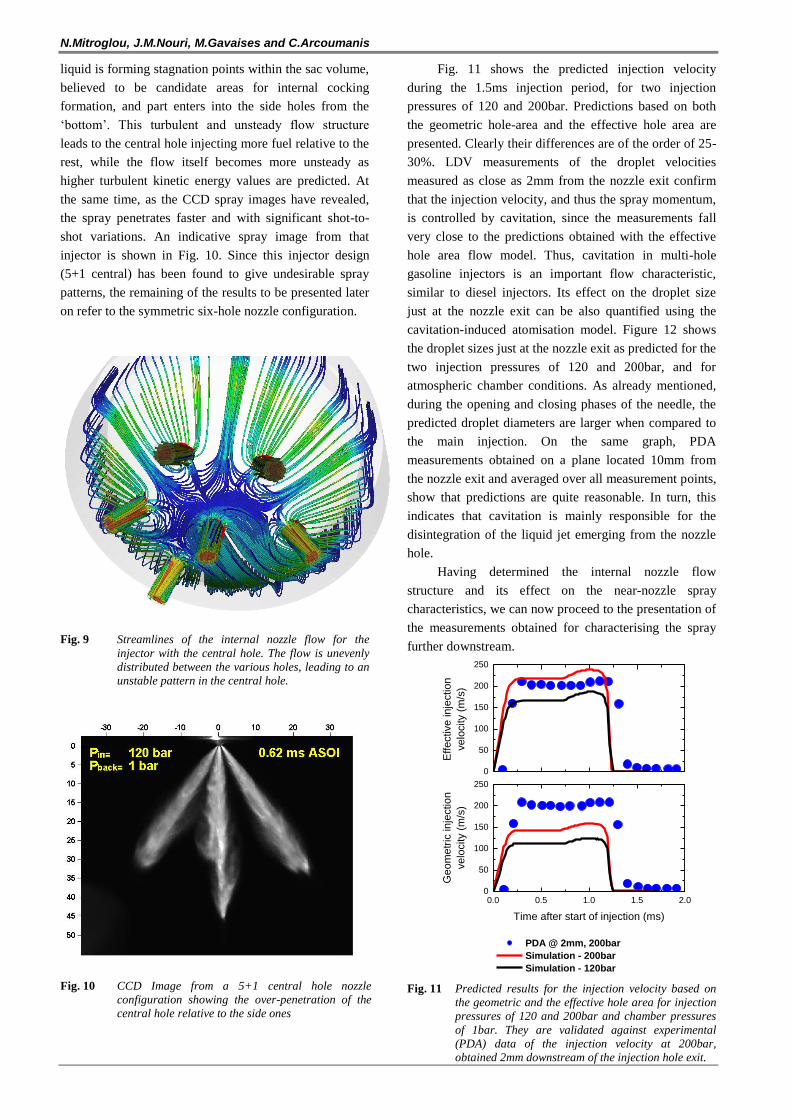
Fig. 11 shows the predicted injection velocity
during the 1.5ms injection period, for two injection
pressures of 120 and 200bar. Predictions based on both
the geometric hole-area and the effective hole area are
presented. Clearly their differences are of the order of 25-
30%. LDV measurements of the droplet velocities
measured as close as 2mm from the nozzle exit confirm
that the injection velocity, and thus the spray momentum,
is controlled by cavitation, since the measurements fall
very close to the predictions obtained with the effective
hole area flow model. Thus, cavitation in multi-hole
gasoline injectors is an important flow characteristic,
similar to diesel injectors. Its effect on the droplet size
just at the nozzle exit can be also quantified using the
cavitation-induced atomisation model. Figure 12 shows
the droplet sizes just at the nozzle exit as predicted for the
two injection pressures of 120 and 200bar, and for
atmospheric chamber conditions. As already mentioned,
during the opening and closing phases of the needle, the
predicted droplet diameters are larger when compared to
the main injection. On the same graph, PDA
measurements obtained on a plane located 10mm from
the nozzle exit and averaged over all measurement points,
show that predictions are quite reasonable. In turn, this
indicates that cavitation is mainly responsible for the
disintegration of the liquid jet emerging from the nozzle
hole.
Having determined the internal nozzle flow
structure and its effect on the near-nozzle spray
characteristics, we can now proceed to the presentation of
the measurements obtained for characterising the spray
further downstream.
0.0 0.5 1.0 1.5 2.00
50
100
150
200
250
0
50
100
150
200
250
Ge
om
etr
ic in
jectio
n
ve
locity (
m/s
)
Time after start of injection (ms)
Effe
ctive
in
jectio
n
ve
locity (
m/s
)
PDA @ 2mm, 200bar
Simulation - 200bar
Simulation - 120bar
Fig. 11 Predicted results for the injection velocity based on
the geometric and the effective hole area for injection
pressures of 120 and 200bar and chamber pressures
of 1bar. They are validated against experimental
(PDA) data of the injection velocity at 200bar,
obtained 2mm downstream of the injection hole exit.

Spray characteristics of a multi-hole injector for direct-injection gasoline engines
0.0 0.5 1.0 1.50
10
20
30
D3
0 (
μm
)
Time after start of injection (ms)
PDA - Pin=120bar @10mm
PDA - Pin=200bar @10mm
Prediction - Pin=120bar
Prediction - Pin=200bar
Fig. 12 Predicted D30 of the formed droplets for two different
injection pressures of 120 and 200bar. They are
validated against PDA measurements of the droplet
size obtained under atmospheric conditions 10mm
downstream of the injection hole.
4.2 Spray characteristics
Images of the spray development as a function of time
after the start of injection were obtained at two injection
pressures, 120 and 200bar, and four chamber pressures of
1, 4, 8 and 12bar. The injection duration was 1.5ms in all
test cases investigated. A typical sequence of the obtained
images is shown in Figs.15 and 16. Quantitative spray
characteristics, such as droplet velocities and diameters,
were obtained at two injection pressures (120 and 200bar)
and two chamber pressures (1 and 12bar); they are
presented in Figs.18-23 for axial distances (z) of 10 and
30 mm from the nozzle exit.
4.2.1 Spray imaging
Spray images have been obtained using a CCD camera,
which was synchronised with the injection pulse. The
images revealed that the injector needle opening delay
time relative to the triggering signal was about 0.6ms,
while the end of injection was at about 1.8ms. This
resulted in an actual injection duration of 1.2ms for a
triggering signal of 1.5ms duration. The needle opening
and closing delay times proved to be quite independent of
the injection pressure and chamber pressure. These
effects can be clearly seen in the needle lift curve (Fig.4).
The spray cone angle and tip penetration data were
obtained by post-processing of the images, which
quantified their dependency on injection conditions. A
bottom view of the injector nozzle shows that the 6 holes
are evenly distributed on the periphery of a circle, whose
centre is the axis of symmetry of the injector. The plane
where the overall spray angle was calculated is shown in
Fig.13; the angle is measured between the axes of the two
outer jet sprays. The results showed a constant overall
spray angle, independent of injection and chamber
pressure, with a mean value estimated to be 80°±1.5°
under all conditions tested; this remained unchanged at
all axial distances from the nozzle exit.
Fig. 13 Overall spray angle definition
Data extracted from the images also revealed useful
information about the spray tip penetration. The multi-
hole spray consists of individual jets and the penetration
of the spray is defined as the axial distance between the
nozzle exit and the tip of each jet. In Fig.14 a comparison
of the spray penetration curves for the two injection and
chamber pressures is presented. The values plotted
represent the mean over 20 single-shot images acquired
consecutively. All jets in every single shot image proved
to have nearly identical penetration. As expected, spray
penetration increases with injection pressure and
decreases with increasing chamber pressure.
Fig. 14 Spray penetration for two different injection and back
pressures as estimated by averaging over 20 CCD
spray images
The effect of back-pressure is evident not only in the
spray penetration curves but also in the individual spray
images shown in Fig. 15. For injection against
atmospheric chamber pressure, the individual sprays are
thin and long relative to those corresponding to 12bar
which are more dense, with a bushy shaped tip;
nevertheless, the overall spray cone angle remains the
same at both chamber pressures, providing strong
justification for the use of these injectors in direct-
injection gasoline engines.

(a) (b)
Fig. 15 Time-dependent comparison of spray injected at two injection pressures: a 120bar and b 200bar for atmospheric chamber
pressure

Spray characteristics of a multi-hole injector for direct-injection gasoline engines
(a) (b)
Fig. 16 Time-dependent comparison of spray injected at two chamber pressures: a 1bar and b 12bar for a 200bar injection pressure
4.2.2 Droplet velocity and size distribution The temporal and spatial distributions of droplet velocity
and diameter were obtained using a 2-D PDA system at
two different axial distances from the 6-hole fully
symmetric injector, z=10 and 30 mm, as shown in Fig.
17. Due to the symmetric arrangement of the holes in the
sac-volume, a fully symmetric in-nozzle flow is expected.
Measurements have thus been focused on one spray jet,
assuming close similarity amongst all six jet plumes.
Measurements have been obtained for chamber pressures
of 1 and 12bar, injection pressures of 120 and 200bar and
an injection duration of 1.5ms. Ensemble averaged values
of the droplet mean and root mean square. (RMS)
velocities and the arithmetic mean (AMD) and Sauter
mean (SMD) droplet diameters were estimated over 0.1
ms time intervals.
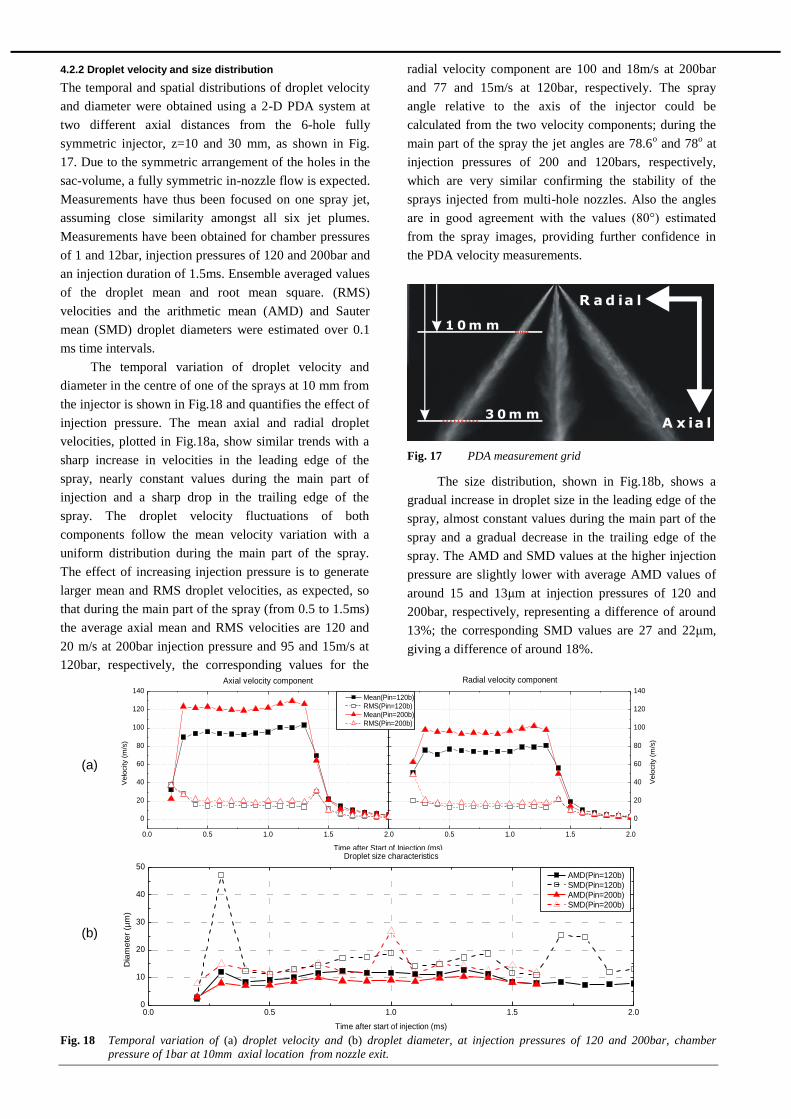
The temporal variation of droplet velocity and
diameter in the centre of one of the sprays at 10 mm from
the injector is shown in Fig.18 and quantifies the effect of
injection pressure. The mean axial and radial droplet
velocities, plotted in Fig.18a, show similar trends with a
sharp increase in velocities in the leading edge of the
spray, nearly constant values during the main part of
injection and a sharp drop in the trailing edge of the
spray. The droplet velocity fluctuations of both
components follow the mean velocity variation with a
uniform distribution during the main part of the spray.
The effect of increasing injection pressure is to generate
larger mean and RMS droplet velocities, as expected, so
that during the main part of the spray (from 0.5 to 1.5ms)
the average axial mean and RMS velocities are 120 and
20 m/s at 200bar injection pressure and 95 and 15m/s at
120bar, respectively, the corresponding values for the
radial velocity component are 100 and 18m/s at 200bar
and 77 and 15m/s at 120bar, respectively. The spray
angle relative to the axis of the injector could be
calculated from the two velocity components; during the
main part of the spray the jet angles are 78.6o and 78
o at
injection pressures of 200 and 120bars, respectively,
which are very similar confirming the stability of the
sprays injected from multi-hole nozzles. Also the angles
are in good agreement with the values (80°) estimated
from the spray images, providing further confidence in
the PDA velocity measurements.
1 0m m
3 0m mA x ia l
R a d ia l
Fig. 17 PDA measurement grid
The size distribution, shown in Fig.18b, shows a
gradual increase in droplet size in the leading edge of the
spray, almost constant values during the main part of the
spray and a gradual decrease in the trailing edge of the
spray. The AMD and SMD values at the higher injection
pressure are slightly lower with average AMD values of
around 15 and 13μm at injection pressures of 120 and
200bar, respectively, representing a difference of around
13%; the corresponding SMD values are 27 and 22μm,
giving a difference of around 18%.
0.0 0.5 1.0 1.5 2.0
0
20
40
60
80
100
120
140
0.5 1.0 1.5 2.0
0
20
40
60
80
100
120
140
Axial velocity component
Velo
city (
m/s
)
Time after Start of Injection (ms)
Mean(Pin=120b)
RMS(Pin=120b)
Mean(Pin=200b)
RMS(Pin=200b)
Velo
city (
m/s
)
Radial velocity component
0.0 0.5 1.0 1.5 2.00
10
20
30
40
50
Droplet size characteristics
Dia
mete
r (µ
m)
Time after start of injection (ms)
AMD(Pin=120b) SMD(Pin=120b) AMD(Pin=200b) SMD(Pin=200b)
Fig. 18 Temporal variation of (a) droplet velocity and (b) droplet diameter, at injection pressures of 120 and 200bar, chamber
pressure of 1bar at 10mm axial location from nozzle exit.
(a) (b)

Spray characteristics of a multi-hole injector for direct-injection gasoline engines
0.0 0.5 1.0 1.5 2.0 2.5
0
20
40
60
80
100
120
140
0.5 1.0 1.5 2.0 2.5
0
20
40
60
80
100
120
140
Axial velocity component
Velo
city (
m/s
)
Time after Start of Injection (ms)
Mean(Pin=120b)
RMS(Pin=120b)
Mean(Pin=200b)
RMS(Pin=200b)
Velo
city (
m/s
)
Radial velocity component
0.0 0.5 1.0 1.5 2.0 2.5 3.00
10
20
30
40
50
Droplet size characteristics
Dia
mete
r (µ
m)
Time after start of injection (ms)
AMD(Pin=120b) SMD(Pin=120b) AMD(Pin=200b) SMD(Pin=200b)
Fig. 19 Temporal variation of (a) droplet velocity and (b) droplet diameter, at injection pressures of 120 and 200bar, chamber
pressure of 1bar at 30mm axial location from nozzle exit.
Figure 19 presents similar results to those of Fig.18 but
further away from the injector at an axial location of 30
mm. Droplet mean and RMS velocity measurements are
plotted in Fig.19a for the two velocity components
demonstrating an overall reduction in mean velocities, but
similar RMS values relative to the measurements
obtained at 10mm. The droplet sizes shown in Fig.19,
also present similar trends to those at 10 mm from the
injector but with an overall reduction in AMD and SMD
values. In particular, during the main part of the spray, the
average AMD values are 12 and 9μm at injection
pressures of 120 and 200bar, respectively, while the
corresponding SMD values are 19 and 14μm,
respectively. These values suggest that the overall droplet
diameters at 200bar injection pressure are lower than
those at 120bar by about 25% for both AMD and SMD,
demonstrating the obvious advantages on fuel atomisation
of high pressure injectors.
Figure 20 presents the temporal variation of droplet
velocities and diameters at the spray centre at the same
distance of z=30 mm and 200 bar injection pressure but
for two chamber pressures of 1 and 12bar. The effect of
chamber pressure on droplet velocities, shown in Fig.20,
is clearly evident leading to substantially reduced mean
velocities for both components at 12bar chamber pressure
during the main part of the spray by more than threefold;
the reduction in the RMS velocities is up to 50% during
the same period. However, the droplet mean and RMS
velocity values tend to be similar at both chamber
pressures in the tail of the spray. It is also evident from
the results that the droplet arrival time at z=30mm has
been delayed by 0.5ms at the 12bar chamber pressure
case, which is in agreement with the reduction in the
spray penetration length estimated from the CCD images.
The spray angle to the axis, as calculated from the mean
axial and radial velocities, was found to be 80 2o during
the main phase of the spray for both chamber pressures,
demonstrating the independence of the overall jet angle
on chamber pressure, in agreement with the spray
visualisation results. It is useful to stress the importance
of spray angle stability in spray-guided systems where
successful ignition depends on the precise delivery of the
spray edge recirculation onto the spark plug gap at the
time of ignition.
The effect of chamber pressure on the droplet sizes
is demonstrated in the results shown in Fig.20, which
reveal a considerable increase in droplet diameter at
elevated chamber pressures. For example, during the
main part of the spray the average values of AMD and
SMD at atmospheric chamber pressure are 10 and 15μm,
respectively, while at 12bar those values increase to 18
and 25μm, respectively.
The spatial distribution of droplet velocities and
diameters across the jet at z=10 mm from the injector and
at 1ms after the start of injection is shown in Fig.21 for
injection pressures of 120 and 200bar. The mean velocity
profiles across the spray diameter at both injection
pressures exhibited a jet like distribution with the peak
corresponding to a radial position of 8.5-9.0mm from the
injector axis as shown in Fig.21a; the RMS velocity
distribution, on the other hand, was more uniform.
(a) (b)

N.Mitroglou, J.M.Nouri, M.Gavaises and C.Arcoumanis
0.0 0.5 1.0 1.5 2.0 2.5 3.0 3.5
0
20
40
60
80
100
120
140
0.5 1.0 1.5 2.0 2.5 3.0 3.5
0
20
40
60
80
100
120
140
Axial velocity component
Velo
city (
m/s
)
Time after Start of Injection (ms)
Mean(Pb=1b)
RMS(Pb=1b)
Mean(Pb=12b)
RMS(Pb=12b)
Velo
city (
m/s
)
Radial velocity component
0.0 0.5 1.0 1.5 2.0 2.5 3.0 3.50
10
20
30
40
50
Droplet size characteristics
Dia
mete
r (µ
m)
Time after start of injection (ms)
AMD(Pb=1b) SMD(Pb=1b) AMD(Pb=12b) SMD(Pb=12b)
Fig. 20 Temporal variation of (a) droplet velocity and (b) droplet diameter, at injection pressure of 200bar, chamber pressures of
1bar and 12bar and axial location 30mm from nozzle exit.
7.0 7.5 8.0 8.5 9.0 9.5 10.0 10.5
0
20
40
60
80
100
120
140
7.5 8.0 8.5 9.0 9.5 10.0 10.5
0
20
40
60
80
100
120
140
Axial velocity component
Velo
city (
m/s
)
Radial distance from injector's axis of symmetry (mm)
Mean(Pin=120b)
RMS(Pin=120b)
Mean(Pin=200b)
RMS(Pin=200b)
Velo
city (
m/s
)
Radial velocity component
7.0 7.5 8.0 8.5 9.0 9.5 10.0 10.50
10
20
30
40
50
Droplet size characteristics
Dia
mete
r (µ
m)
Radial distance from injector's axis of symmetry (mm)
AMD(Pin=120b) SMD(Pin=120b) AMD(Pin=200b) SMD(Pin=200b)
Fig. 21 Spatial variation of (a) droplet velocity and (b) droplet diameter, at injection pressures of 120 and 200bar, chamber pressure
of 1bar and axial location 10mm from nozzle exit.
(a) (b)
(a) (b)

The droplet diameter radial distribution shown in Fig.21b
for the same conditions, follows the trend of the mean
velocity profile with a gradual increase to a maximum
value at around the spray axis and a gradual decrease
towards the edges. As for the effect of injection pressure
on the droplet velocity and diameter, it is similar to that
described previously, in that the higher injection pressure
gives rise to higher droplet velocities and smaller droplet
diameters.
Further downstream at z=30mm the droplet
diameter distribution shown in Fig. 22 follows the same
trend as at 10mm. However, both the AMD and SMD
values are reduced at 30mm compared to those at 10mm
over the whole cross-section. This suggests that droplets
are undergoing a secondary break up as the spray
develops downstream.
Finally, Fig. 23 quantifies the effect of chamber
pressure on the droplet velocities and diameters over the
whole cross-section of the spray at z=30 mm from the
nozzle exit and 200bar injection pressure. The effect of
the increased chamber pressure on droplet velocities,
shown in Fig.23a, is clearly evident. The mean velocity
of both velocity components is reduced substantially at
12bar chamber pressure over the whole cross-section by
up to four times due to the higher drag, and that the
droplet velocity fluctuations are also reduced by a factor
of two during the same period. Fig. 23b presents the
effect of chamber pressure on droplet sizes and it clearly
shows a considerable increase in the droplet diameter
when the chamber pressure increases from 1 to 12bar.
The average values of AMD and SMD around the centre
of the spray at atmospheric chamber pressure are 15 and
20μm, respectively, while the corresponding values at
12bar chamber pressure are 19 and 28μm, which
corresponds to a 25% increase for the AMD and a 40%
increase for the SMD, respectively.
20 21 22 23 24 25 26 27 28 29 30 31
0
20
40
60
80
100
120
140
21 22 23 24 25 26 27 28 29 30 31
0
20
40
60
80
100
120
140
Axial velocity component
Velo
city (
m/s
)
Radial distance from injector's axis of symmetry (mm)
Mean(Pin=120b)
RMS(Pin=120b)
Mean(Pin=200b)
RMS(Pin=200b)
Velo
city (
m/s
)
Radial velocity component
20 21 22 23 24 25 26 27 28 29 30 31 320
10
20
30
40
50
Droplet size characteristics
Dia
mete
r (µ
m)
Radial distance from injector's axis of symmetry (mm)
AMD(Pin=120b) SMD(Pin=120b) AMD(Pin=200b) SMD(Pin=200b)
Fig. 22 Spatial variation of (a) droplet velocity and (b) droplet diameter at injection pressures of 120 and 200bar, chamber pressure
of 1bar and axial location 30mm from nozzle exit.
(a) (b)

20 21 22 23 24 25 26 27 28 29 30
0
20
40
60
80
100
120
140
21 22 23 24 25 26 27 28 29 30
0
20
40
60
80
100
120
140
Axial velocity component
Velo
city (
m/s
)
Radial distance from injector's axis of symmetry (mm)
Mean(Pb=1b)
RMS(Pb=1b)
Mean(Pb=12b)
RMS(Pb=12b)
Velo
city (
m/s
)
Radial velocity component
20 21 22 23 24 25 26 27 28 29 30 31 320
10
20
30
40
50
Droplet size characteristics
Dia
mete
r (µ
m)
Radial distance from injector's axis of symmetry (mm)
AMD(Pb=1b) SMD(Pb=1b) AMD(Pb=12b) SMD(Pb=12b)
Fig. 23 Spatial variation of (a) droplet velocity and (b) droplet diameter at injection pressure of 200bar, chamber pressures of 1bar
and 12bar and axial location 30mm from nozzle exit.
4. Conclusions The sprays generated from multi-hole injectors,
introduced recently in spray-guided direct injection
gasoline engines, have been characterised in terms of
droplet velocities/diameters at injection pressures of 120
and 200bar and chamber pressures varying from
atmospheric to 12bar. Additional spray visualisation has
confirmed that the spray angle remains constant and is
almost independent of injection and chamber pressure, a
significant advantage relative to pressure-swirl atomisers
used in the first-generation, wall-guided gasoline engines.
The internal nozzle flow and the near nozzle spray
characteristics have been estimated by employing a
combination of computer models. Those comprised a 1-D
model simulating the flow inside the injection system, a
3-D Navier-Stokes equations flow solver simulating the
sac-volume and injection holes and a phenomenological
nozzle hole cavitation. In addition, a cavitation-induced
atomisation model was used to provide estimates of the
liquid velocity increase due to hole cavitation and the
corresponding effect on the size of the droplets formed
during the atomisation process of the injected fuel. The
results have shown that cavitation is the main flow factor
that determines injection velocity and initial droplet size.
At the same time, internal flow simulations have shown
that multi-hole injectors with a central hole have an
uneven flow distribution which results to an over
penetrating and unstable spray pattern, as also confirmed
by CCD spray images.
The droplet temporal velocity profiles revealed that
the droplet velocities increased sharply at the start of
injection to a maximum value and then remained
unchanged during the main part of injection before
decreasing rapidly towards the end of injection. The
spatial velocity profiles were jet-like at all axial locations
with the local velocity maximum found on the spray axis.
The droplet SMD in the main spray at 10mm from nozzle
exit were of the order of 19 and 14µm at injection
pressures of 120 and 200bar, respectively, for injection
against atmospheric chamber pressure. Within the
measured range the effect of injection pressure on droplet
size was small while the increase in chamber pressure to
12bar resulted in a large decrease in droplet velocities by
up to fourfold and an increase of droplet sizes by up to
40%.
Overall, the obtained results have confirmed the
advantages of new generation high-pressure multi-hole
injectors for gasoline direct-injection engines, compared
to swirl pressure atomisers, in terms of spray structure
stability under varying chamber thermodynamic and
injector operating conditions. Nevertheless, their ability
to generate the desired air/fuel mixture at the spark plug
at the time of ignition with minimum nozzle cocking
remains an issue. At present, a lot of effort and resources
are devoted to identifying the best injection system for
second-generation gasoline engines employing the spray-
(a) (b)

Spray characteristics of a multi-hole injector for direct-injection gasoline engines
guided concept under stratified operation. It seems that
the degree of success of the spray-guided concept will
determine whether direct-injection gasoline engines will
make an impact onto the passenger car market at a time
of increasing competition from advanced direct-injection
diesel engines. It is likely that spray-guided gasoline
engines operating with stoichiometric mixtures under
naturally aspirated or turbocharged conditions will be the
first to enter production prior to the most fuel efficient,
albeit more difficult, stratified direct-injection, gasoline
engines. Stoichiometric engines offer significant
advantages in terms of volumetric efficiency and
reduction of charge temperature (allowing higher
compression ratios to be used) while at the same time
maintaining the benefits of three-way catalysts in
reducing all three major gaseous pollutants.
Acknowledgement
Financial support from BMW AG and EPSRC
(GR/R71740/01) is gratefully acknowledged. The authors
would like to thank Mr Tom Fleming for his valuable
technical support during the course of this project.
References
1 Shrimpton, J. S., Yule, A. J., Akhtar, P., Wigley, G.
and Wagner, T. Measurement in diesel sprays for three
fuels with and without cross flow of high-pressure gas.
Proc. ILASS, 1997.
2 Shelby, M. H., VanDerWege, B. A. and Hochgreb, S.
Early spray development in gasoline direct-injection
spark-ignition engines. SAE 980160, 1998.
3 Wigley, G., Hargrave, G. K. and Heath, J. A high
power, high resolution LDA/PDA system applied to dense
gasoline direct-injection spray. 9th Int. Symp. Appl. Laser
Tech. to Fluid Mechanics, 1998.
4 Abo-Serie, E., Arcoumanis, C., and Gavaises, M.
Structure of sprays generated by pressure swirl atomisers
for direct-injection gasoline engines. ILASS Symposium,
1999.
5 Ipp, W., Wagner, H. K., Wensing, M., Leipertz, A.,
Arndt, S. and Jain, A. K. Spray formation of high-
pressure swirl gasoline injectors investigated by two-
dimensional Mie and LIEF techniques. SAE 1999-01-
0498, 1999.
6 Nouri, J. M., and Whitelaw, J. H. Spray characteristics
of a GDI injector with short injection duration. Exp.
Fluids, 2001.
7 Nouri, J. M., Brehm, C. and Whitelaw, J. H. The spray
from a gasoline direct injector. ILASS Symposium, 1999.
8 Gavaises, M. and Arcoumanis, C. Modelling of sprays
from high pressure-swirl atomisers." International Journal
of Engine Research 2, 2001.
9 Ortmann, R., Arndt, S., Raimann, J., Grzeszik, R. and
Wurfel, G. Methods and analysis of fuel injection,
mixture preparation and charge stratification in different
direct-injected SI engines. SAE 2001-01-0970, 2001.
10 Arndt, S., Gartung, K. and Bruggemann, D. Influence
of ambient temperature on the evaporation rate of
hexadecane droplets Proc. ILASS-Europe 2001.
11 Lippert, A. M., El Tahry, S. H., Huebler, M. S.,
Parrish, S. E., Inoue, H., Noyori, T., Nakama, K. and
Abe, T. Development and optimisation of a small-
displacement spark-ignition direct-injection engine –
Stratified operation. SAE 2004-01-0033, 2004.
12 Pontoppidan, M., Gaviani, G., Bella, G. and De Maio,
A. Optimisation by CFD simulation of spray formation
parameters to adapt direct-injection high-pressure fuel
injectors to high-speed SI engines. SAE 2004-01-0539,
2004.
13 Soteriou, C., Andrews, R., and Smith, M., Direct
injection diesel sprays and the effect of cavitation and
hydraulic flip on atomization, SAE 950080, 1995.
14 Arcoumanis, C., Gavaises, M. and French, B. Effect of
fuel injection processes on the structure of diesel sprays.
SAE 970799, 1997.
15 Gavaises, M., Tonini, S., Arcoumanis, C., Kometani, S.
and Theodorakakos, A. Multi-component fuel
vaporisation and its effect on spray development and air-
fuel mixing in gasoline direct-injection engines, 5th
International Conference ICE2003 Internal Combustion
Engines: Experiments and Modelling, 2003.