chwc presentation
TRANSCRIPT
Marketing Communication
StrategyAlison Golensky | Xinyu LiuQiulin Peng | Hang “April” Yuan
Table of Contents
❖ Executive Summary
❖ Cooper’s Hawk Business Model Analysis
❖ Wine Club Member Evaluation
❖ Marketing Objective
❖ Segmentation
❖ Strategy for Target Group
❖ Summary
❖ Appendix
Executive Summary Increase restaurant revenue via targeted marketing
Assignment: Establish a goal for CHWC and develop a marketing plan to meet that
objective
Solution: Based on CHWC’s business situation, our marketing objective is to increase
restaurant revenue by 8% ($166K) over the next four quarters
Strategy: We designed a marketing program for two key customer segments:
❖ VIP: Leverage these best customers to acquire new customers through WOM
❖ Active Small: Encourage them to explore more areas of the restaurant to
increase spending and frequency
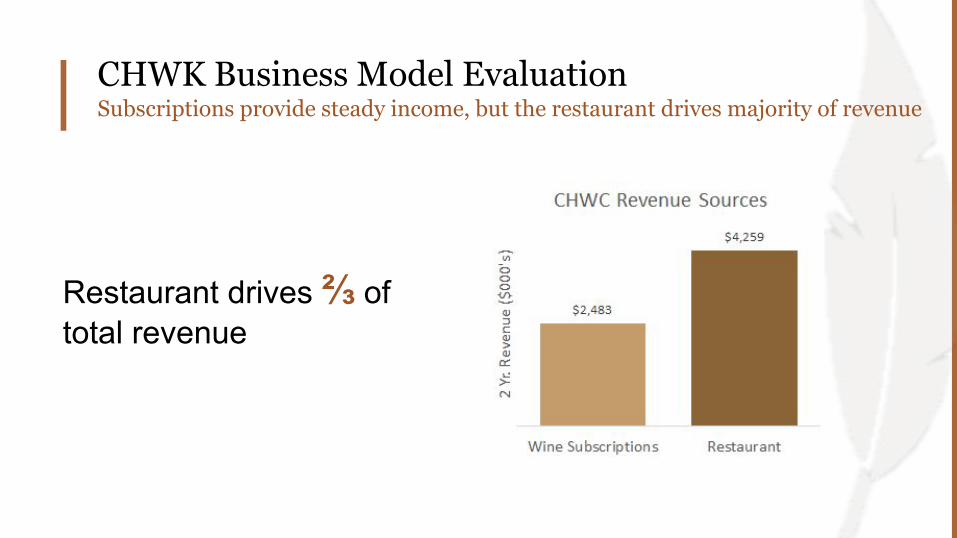
CHWK Business Model EvaluationSubscriptions provide steady income, but the restaurant drives majority of revenue
Restaurant drives ⅔ of total revenue
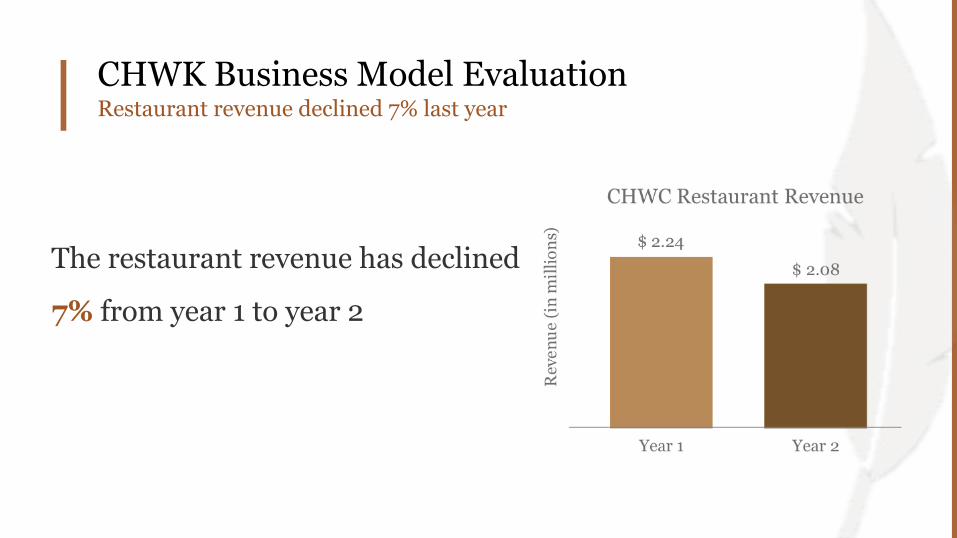
CHWK Business Model EvaluationRestaurant revenue declined 7% last year
The restaurant revenue has declined
7% from year 1 to year 2

Business Model EvaluationRestaurant venue and visitation patterns
Visiting Weekday
Saturday and Sunday are the busiest
Visiting Month
August and December are the peaks
❖ Server room, bar room, and patio
drive 70% of revenue. The tasting
room drives 22% of revenue;
banquets 7%
❖ The top two areas with decreasing
revenue are tasting room (12%) and
server area (-8%)
Venue Type
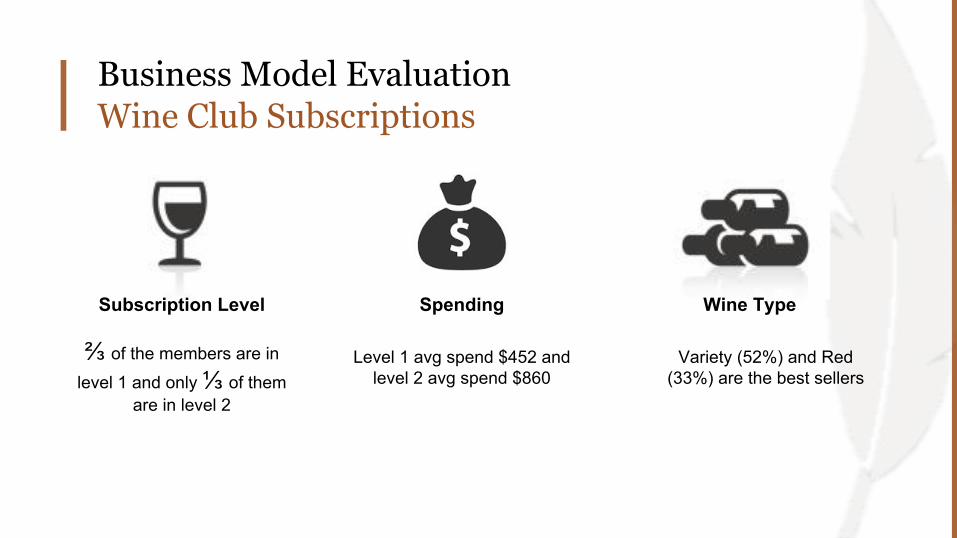
Business Model Evaluation Wine Club Subscriptions
Variety (52%) and Red (33%) are the best sellers
⅔ of the members are in
level 1 and only ⅓ of them are in level 2
Level 1 avg spend $452 and level 2 avg spend $860
Subscription Level Wine TypeSpending

Wine Club Members on Social MediaMembers love sharing
75K people like thisHigh post interaction rate
2807 Followers3661 Likes
Avg. Rating of 4377 Reviews129 Photos
❖ Highly Positive Social Media Presence❖ Members think the main theme is sharing and celebration❖ Members like to sharing their experience and comments about Cooper’s Hawk
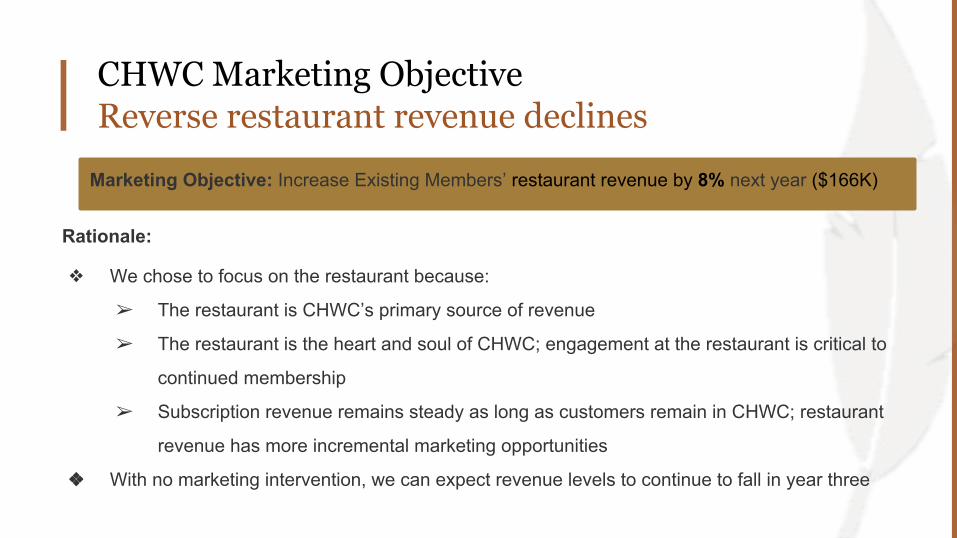
CHWC Marketing ObjectiveReverse restaurant revenue declines
Rationale:
❖ We chose to focus on the restaurant because:
➢ The restaurant is CHWC’s primary source of revenue
➢ The restaurant is the heart and soul of CHWC; engagement at the restaurant is critical to
continued membership
➢ Subscription revenue remains steady as long as customers remain in CHWC; restaurant
revenue has more incremental marketing opportunities
❖ With no marketing intervention, we can expect revenue levels to continue to fall in year three
Marketing Objective: Increase Existing Members’ restaurant revenue by 8% next year ($166K)
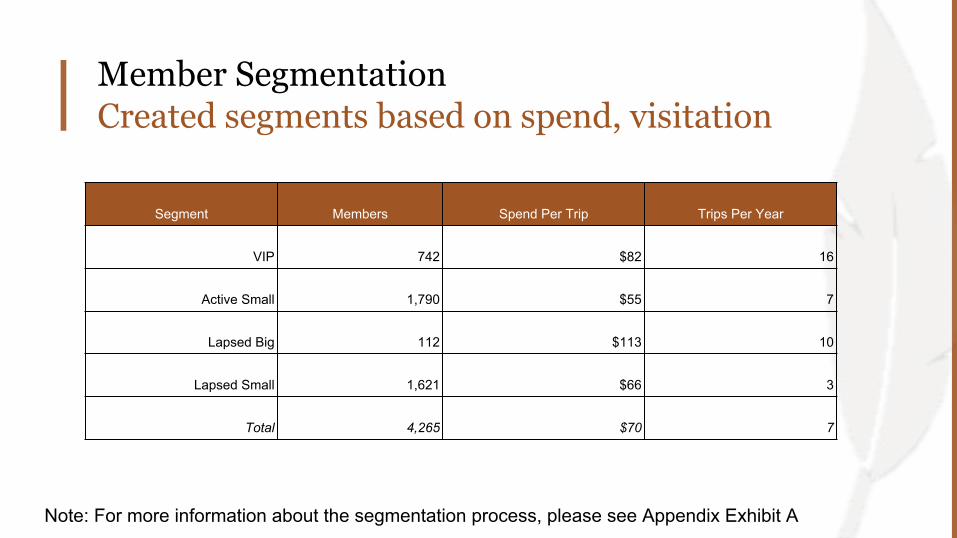
Member SegmentationCreated segments based on spend, visitation
Note: For more information about the segmentation process, please see Appendix Exhibit A
Segment Members Spend Per Trip Trips Per Year
VIP 742 $82 16
Active Small 1,790 $55 7
Lapsed Big 112 $113 10
Lapsed Small 1,621 $66 3
Total 4,265 $70 7

Population % vs. Revenue %
❖ Our first target group, VIPs,
generate the most revenue
❖ Our second target group,
Active Smalls, has the most
customers
Member Segmentation: Identifying Targets Target Groups cover 77% of total restaurant revenue
Note: For more information about the segmentation process, please see Appendix Exhibit 1
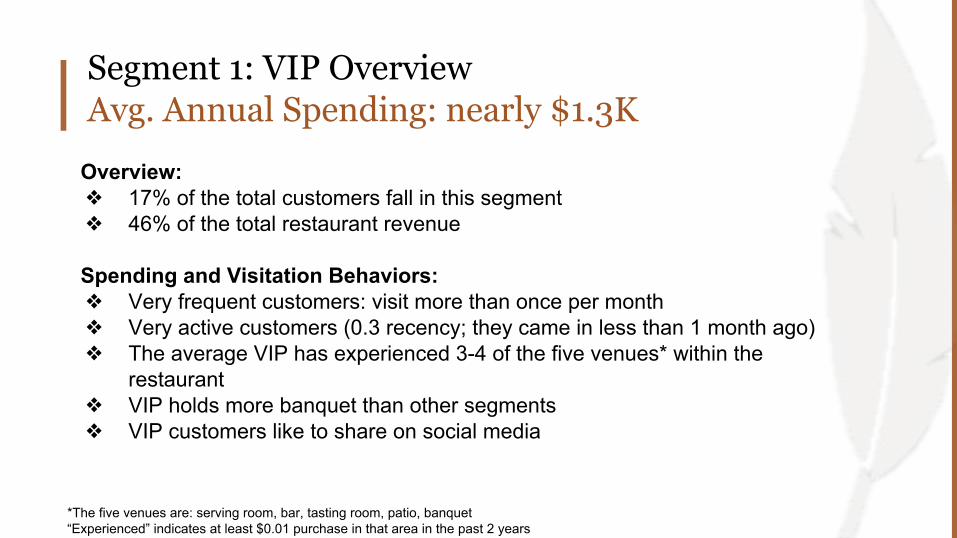
Segment 1: VIP OverviewAvg. Annual Spending: nearly $1.3K
Overview:❖ 17% of the total customers fall in this segment❖ 46% of the total restaurant revenue
Spending and Visitation Behaviors:❖ Very frequent customers: visit more than once per month ❖ Very active customers (0.3 recency; they came in less than 1 month ago)❖ The average VIP has experienced 3-4 of the five venues* within the
restaurant❖ VIP holds more banquet than other segments❖ VIP customers like to share on social media
*The five venues are: serving room, bar, tasting room, patio, banquet“Experienced” indicates at least $0.01 purchase in that area in the past 2 years
Segment 1: VIP CustomersAcquire new customers to have a $75K incremental revenue by Year 3
Behavioral Objective: Encourage VIP customers to actively share and refer Cooper’s Hawk to their friends and family to acquire 148 new customers next year
Communication Objective:Cooper’s Hawk is a perfect place to hang out with friends
Referral Program
❖ Send referral link through email and social media❖ Give VIP customers discount code or other incentives by successfully refer a
new friend to Cooper’s Hawk ❖ Holding “Sharing” event for VIPs to ask them bring friends with them to the
restaurant with discounted dishes and wine
Premium VIP service
❖ Offer premium wine tour for VIP customers
Segment 1: VIP CustomersIncentives/offers
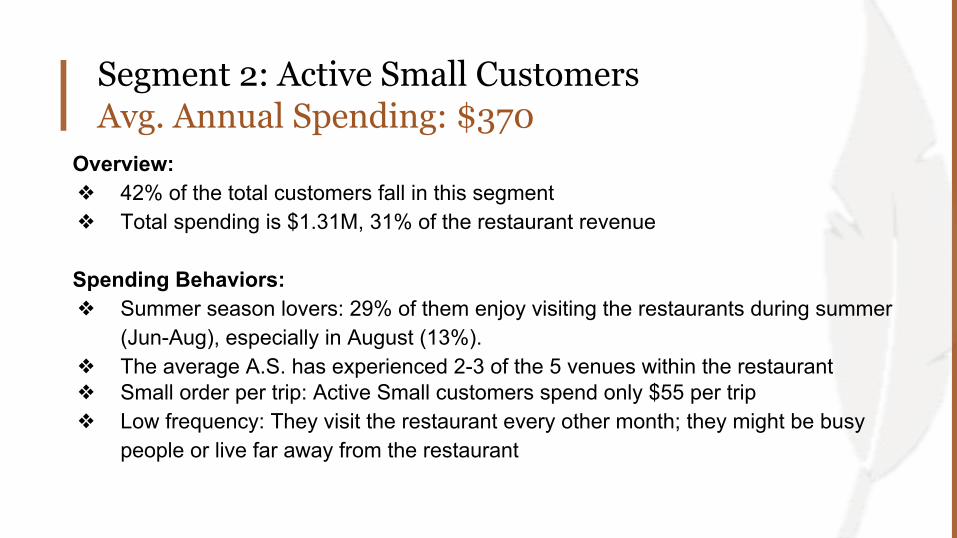
Segment 2: Active Small CustomersAvg. Annual Spending: $370
Overview:❖ 42% of the total customers fall in this segment❖ Total spending is $1.31M, 31% of the restaurant revenue
Spending Behaviors:❖ Summer season lovers: 29% of them enjoy visiting the restaurants during summer
(Jun-Aug), especially in August (13%).❖ The average A.S. has experienced 2-3 of the 5 venues within the restaurant❖ Small order per trip: Active Small customers spend only $55 per trip❖ Low frequency: They visit the restaurant every other month; they might be busy
people or live far away from the restaurant
Segment 2: Active Small CustomersIncrease by $91K restaurant revenue by Year 3
Behavioral Objectives:❖ Increase average check size by $10 for 40% of visits❖ Drive one incremental annual visit from 50% of customers
Communication Objective:Cooper’s Hawk is a great choice that worth exploring: five unique food and wine experiences under one roof
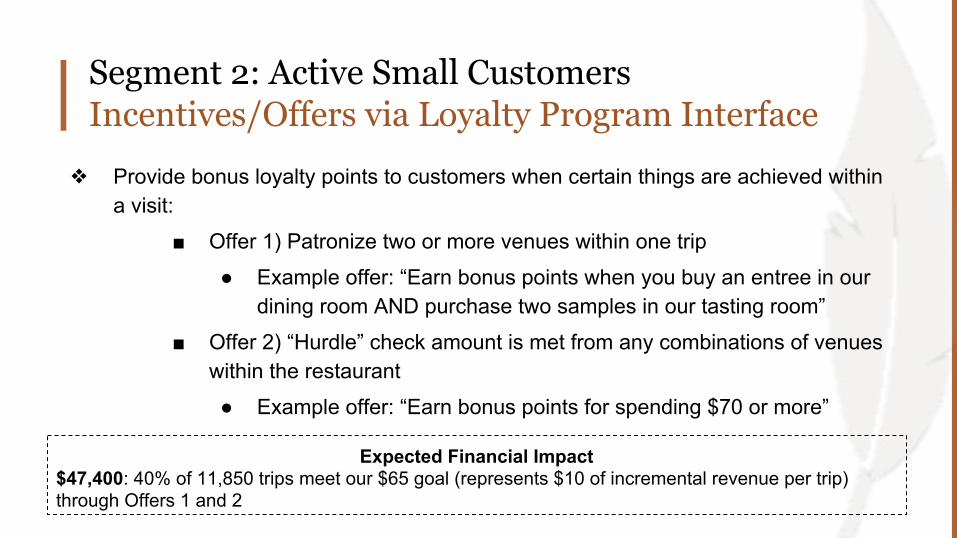
❖ Provide bonus loyalty points to customers when certain things are achieved within a visit:
■ Offer 1) Patronize two or more venues within one trip
● Example offer: “Earn bonus points when you buy an entree in our dining room AND purchase two samples in our tasting room”
■ Offer 2) “Hurdle” check amount is met from any combinations of venues within the restaurant
● Example offer: “Earn bonus points for spending $70 or more”
Segment 2: Active Small CustomersIncentives/Offers via Loyalty Program Interface
Expected Financial Impact$47,400: 40% of 11,850 trips meet our $65 goal (represents $10 of incremental revenue per trip) through Offers 1 and 2
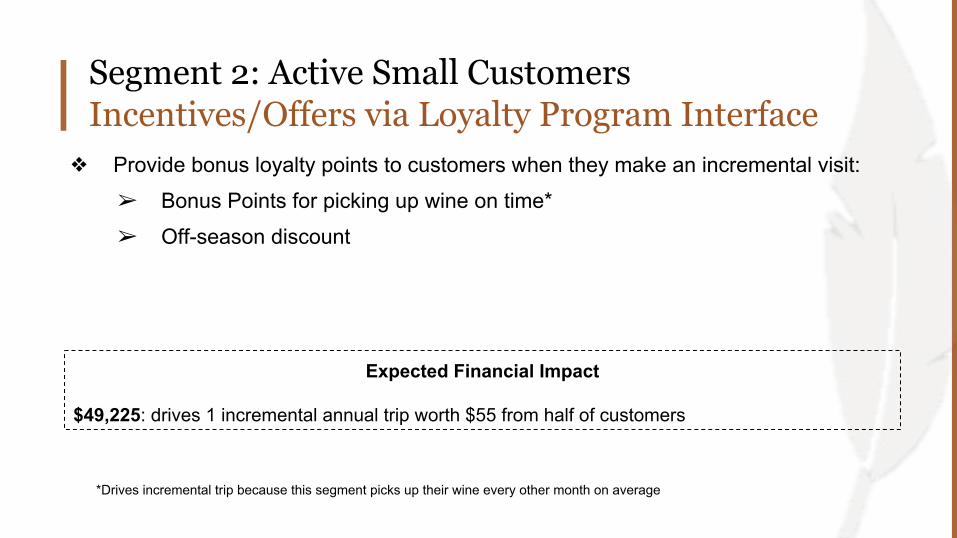
❖ Provide bonus loyalty points to customers when they make an incremental visit:
➢ Bonus Points for picking up wine on time*
➢ Off-season discount
Segment 2: Active Small CustomersIncentives/Offers via Loyalty Program Interface
Expected Financial Impact
$49,225: drives 1 incremental annual trip worth $55 from half of customers
*Drives incremental trip because this segment picks up their wine every other month on average
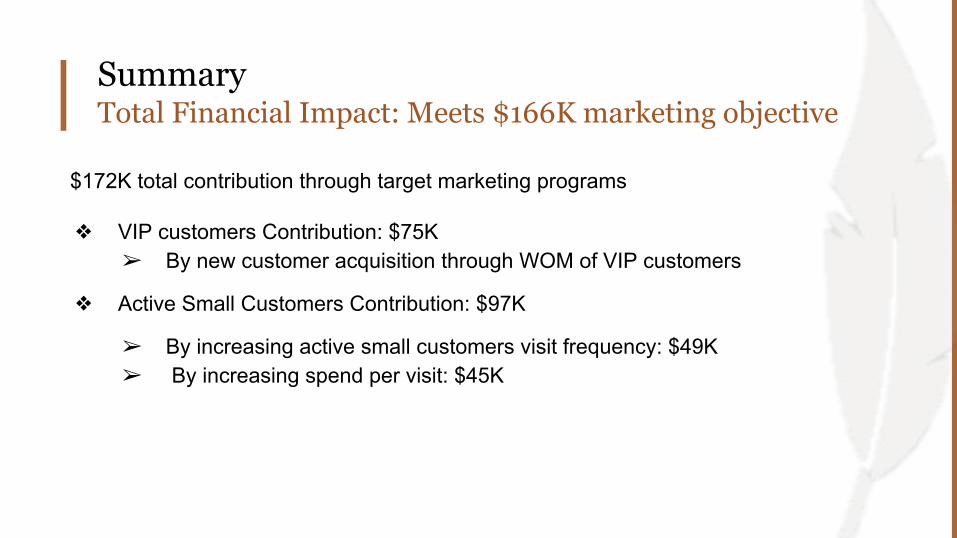
SummaryTotal Financial Impact: Meets $166K marketing objective
$172K total contribution through target marketing programs
❖ VIP customers Contribution: $75K➢ By new customer acquisition through WOM of VIP customers
❖ Active Small Customers Contribution: $97K
➢ By increasing active small customers visit frequency: $49K➢ By increasing spend per visit: $45K

Appendix

Restaurant Revenue (cut off point: 99%: 5206, 80%: 1476)
Restaurant Recency (cut off point: 1 month)
Monetary/Recency Active Lapsed
VIP M>=5206
Big Spenders 1476<M<5206, R<=1 1476<M<5206, R>1
Small Spenders M<=1476, R<=1 M<=1476, R>1
Exhibit 1: Member Segmentation Process

segment # Members Percent of Members
Valid
AB 699 16.4
AS 1790 42
LB 112 2.6
LS 1621 38
VIP 43 1
Total 4265 100
Exhibit 2: Results & Target Segments
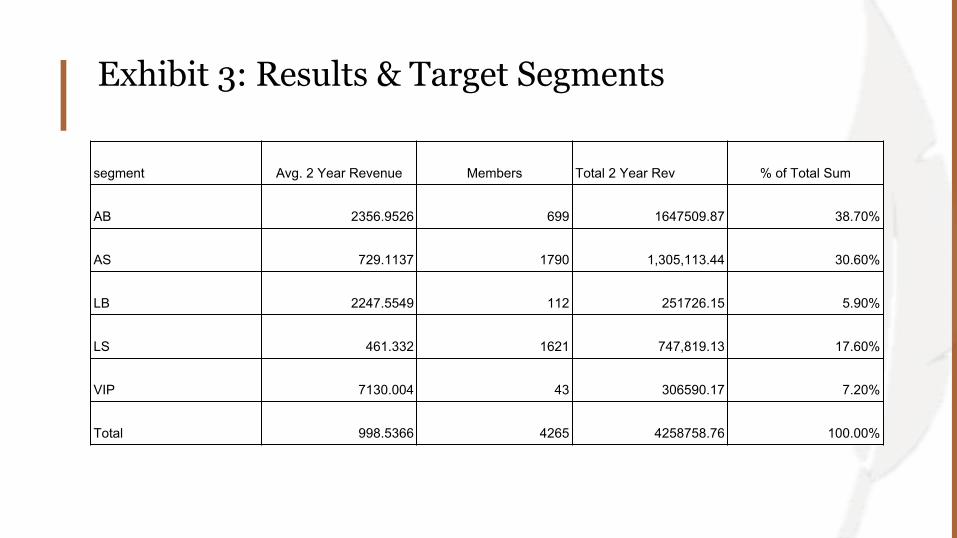
Exhibit 3: Results & Target Segments
segment Avg. 2 Year Revenue Members Total 2 Year Rev % of Total Sum
AB 2356.9526 699 1647509.87 38.70%
AS 729.1137 1790 1,305,113.44 30.60%
LB 2247.5549 112 251726.15 5.90%
LS 461.332 1621 747,819.13 17.60%
VIP 7130.004 43 306590.17 7.20%
Total 998.5366 4265 4258758.76 100.00%
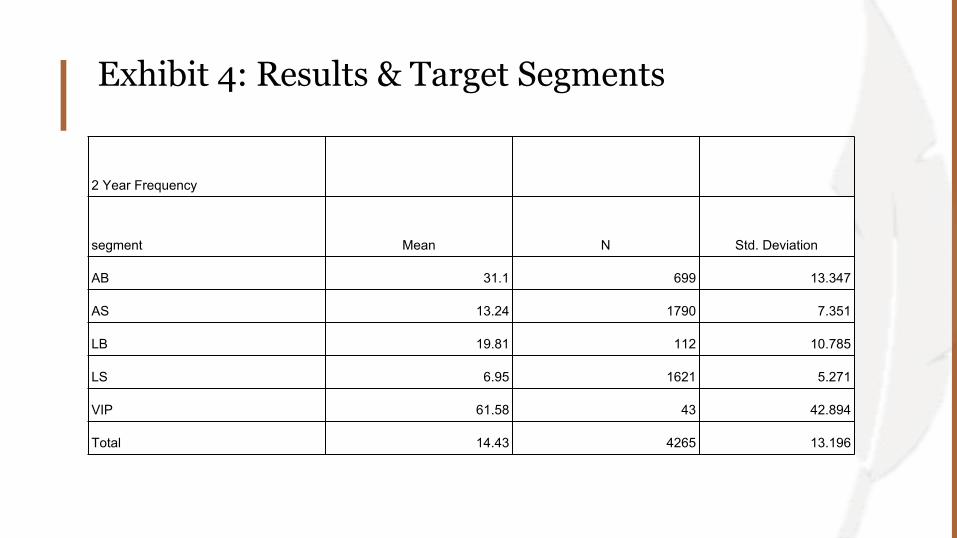
Exhibit 4: Results & Target Segments
2 Year Frequency
segment Mean N Std. Deviation
AB 31.1 699 13.347
AS 13.24 1790 7.351
LB 19.81 112 10.785
LS 6.95 1621 5.271
VIP 61.58 43 42.894
Total 14.43 4265 13.196

Exhibit 5: Results & Target Segments
Total Venues Visited in Past 2 years
segment Mean N Std. Deviation Sum % of Total Sum
AB 3.35 699 0.706 2343 20.60%
AS 2.74 1790 0.778 4905 43.10%
LB 3.2 112 0.721 358 3.10%
LS 2.22 1621 0.858 3598 31.60%
VIP 3.91 43 0.75 168 1.50%
Total 2.67 4265 0.901 11372 100.00%

Exhibit 6: Restaurant Analysis
Venue 2 Year Rev.
Server $2,050,149
Tasting Room $959,617
Bar $905,768
Banquet $316,807
Patio $79,657
Total $4,311,998
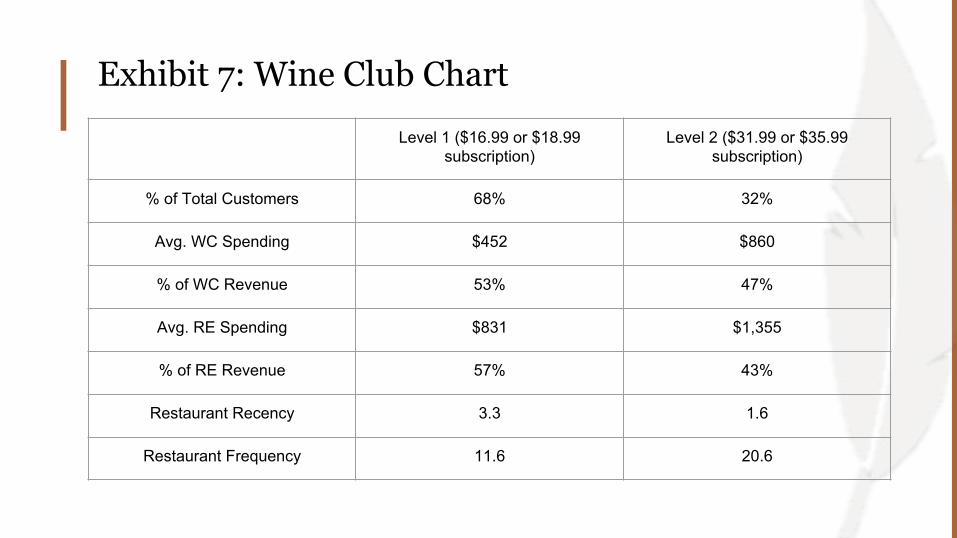
Exhibit 7: Wine Club Chart
Level 1 ($16.99 or $18.99 subscription)
Level 2 ($31.99 or $35.99 subscription)
% of Total Customers 68% 32%
Avg. WC Spending $452 $860
% of WC Revenue 53% 47%
Avg. RE Spending $831 $1,355
% of RE Revenue 57% 43%
Restaurant Recency 3.3 1.6
Restaurant Frequency 11.6 20.6

Exhibit 8: Wine Club ChartRE_amountsegment2 Year Mean Sum
1 133.926 28660.162 125.4634 24716.29
Total 129.8697 53376.45
AB
1 76.2366 1000147.532 76.0788 953952.51
Total 76.1595 1954100.04
AS
1 52.0514 642002.532 51.162 663110.91
Total 51.5957 1305113.44
LB
1 99.4974 131436.042 122.495 120290.11
Total 109.3036 251726.15
LS
1 63.0397 433649.942 62.9724 314169.19
Total 63.0114 747819.13
Total
1 66.0199 2235896.22 65.5627 2076239.01
Total 65.799 4312135.21