characterization of biogenic emissions by online thermal ... · the exposure chamber and the istd...
TRANSCRIPT

Ap
pN
ote
2/1
997 Characterization of Biogenic
Emissions by Online Thermal Desorption Gas Chromatography-Mass Spectrometry
Arnd C. Heiden, Klaus Kobel, Jürgen WildtInstitut für Chemie der Belasteten Atmosphäre (ICG-2), Forschungszentrum Jülich, D - 52425 Jülich, Germany
SUMMARYThe novel GERSTEL Online TDS G was developed to al-low fast, reliable and continuous analysis of airborne com-pounds. For the described application the total analysis time, including GC runtime, is about 1 hour. Sampling is done in parallel with gas chromatographic analysis.
INTRODUCTIONVolatile Organic Compounds (VOCs) are important trace atmospheric gases because they participate in many che-mical processes occurring in the troposphere (0 - 12 km height). During tropospheric ozone formation, the VOCs act as fuel while nitrogen oxides NOx (NO + NO2) act as catalysts. Tropospheric ozone is mainly produced during summertime smog episodes. However, car exhaust is not the only source of VOCs. VOCs are emitted from natural (biogenic) as well as from human (anthropogenic) sources. Estimates by several authors [1-3] lead to the assumption that, on a global scale, the emission strength of biogenic VOCs is about 10 times higher than that of anthropogenic sources. However, on a regional scale the contribution of

AN/1997/02 - 2
biogenic VOCs to photochemical ozone formation is not known. Some new results from fi eld measurements made at Schauinsland (close to the city of Frei burg in southwestern Germany) indicate that biogenic VOCs are responsible for 60 % of total reactions with OH-radicals [4].
To determine the mechanisms of VOC emissions from higher plants, an experimental system was built at For schungs zen trum Jülich as part of a joint venture with GERSTEL GmbH. This experimental system allows investigations of biogenic emissions under controlled en vi ron men tal conditions. The main compounds emitted by plants are 2-methyl-1,3-bu-tadiene (isoprene, C5H8), monoterpenes (C10H16), including a couple of oxygenated varieties as well as sesquiterpenes (C15H24). Some of these compounds are emitted as signal molecules [5], as defense com-pounds against attack by herbivore or bacteria, or as signal molecules to attract natural enemies of parasites [6-7]. In order to determine these airborne compounds, a novel, automated online thermal desorption (Online TDS G) device was developed in collaboration with GERSTEL GmbH. This online thermal desorption system is used with a Hewlett Packard GC (HP 5890 Series II) that is directly coupled to a quadrupole mass selective detector (HP 5972 A, MSD). The system is now commercially available and it is described in this article.
ALTERNATIVE TECHNIQUES FOR VOC CONCEN-TRATION MEASUREMENTSMeasurements of biogenic VOCs require an enrich-ment step because their concentrations in the atmos-phere are in the pptV to ppbV (pmol/mol to nmol/mol of sampled air) range. Cryogenic or adsorptive devices can be used for the enrichment. Adsorptive sample enrichment is feasible with classical adsorbents, such as charcoal, graphitized carbon black, porous polymers or novel adsorbents like polydimethylsiloxane particles (PDMS) [8]. The choice of the adsorbent depends on the method of elution. However, not all adsorbents are suitable for thermal desorption.
Solid phase extraction (SPE) of sample analytes followed by elution with solvent mixtures is a time consuming process. Furthermore, SPE can lead to large sample dilutions. Hence, large sample volumes (100 - 150 L) and often long sampling times are necessary, making the process diffi cult to automate. In contrast, the GERSTEL Online TDS G is highly automated,
and through the use of a standby cooling mode, al-lows sampling at a constant temperature during the chromatographic analyses. High desorption fl ows (20 - 100 ml/min) are made possible by providing a split fl ow at the TDS G as well as at the Cooled Injection System (CIS), that acts as a cryotrap and inlet. The system confi guration allows a column fl ow of less than 2 ml/min, which is needed to directly couple the column to the MSD. Furthermore, blank measurements and calibrations can be made at any time during the analysis.
INSTRUMENTATIONThe GERSTEL Online TDS G (Figure 1) is built from a modified GERSTEL ThermoDesorption System (TDS 2), a heated Valco 6-2-way valve, and a mass fl ow controller. A CIS is connected to the Valco val-ve. The CIS is used to focus the thermally desorbed compounds before injection onto the capillary column. Figure 2 shows a schematic dia gram of the adsorption-desorption cycle. An advantage of this confi guration is that the direction of the gas fl ow is reversed between sample adsorption and desorption. This prevents the adsorbed compounds from having to pass through the entire adsorbent bed.
Figure 1. The GERSTEL Online TDS G.

AN/1997/02 - 3
Figure 2. Schematic fl ow diagram of the adsorption and desorption cycle.
MATERIAL AND METHODSThe porous polymer Tenax TA (60/80 mesh) is a suitable adsorbent for the terpenoid compounds [9-10]. A second adsorbent phase is necessary to avoid loss of C5 - C7 hydrocarbons. The graphitized carbon black Carbotrap (20/40 mesh) is used for this application. The CIS is cooled by liquid nitrogen to -100 °C. Furthermore, the inlet liner is fi lled with an adsorbent. Here Tenax TA, or the graphitized carbon black sorbent Carbopack B is suitable. This increases the surface area and reduces the dead volume. A non-polar column (5 % phenyl / 95 % methylpolysiloxane) is used for the separation of the compounds. In this case, a BPX-5-capillary column (50 m x 0.2 mm x 1 μm; SGE) is used. Figure 3 shows the suitability of the column for the analysis as well as the performance of the CIS as a cryotrap.
Figure 3. Chromatogram (Total Ion Current; TIC) of a complex liquid standard of monoterpenes, oxygenated terpenes and sesquiterpenes. 1 μL sample was injected into the CIS.
GerstelTDS 2
GasChromatographMSD
GerstelCIS
He 6.0
MFC
Pump
Sample
Enrichment
MSD
GerstelTDS 2
GasChromatograph
GerstelCIS
He 6.0
MFC
Pump
Sample
Desorption

AN/1997/02 - 4
A permeation source that delivers the compounds at a constant concentration is used for calibration. The per-meation rates are controlled gravimetrically. To determine the performance of the analytical system, deuterated decane (D22) acts as an internal standard (ISTD). This compound is provided by a separate permeation source, and is added to every sample. A schematic diagram of the setup for calibration and sampling is shown in Figure 4.
GerstelTDS 2
HP 5890SeriesII
HP 5972 A
GerstelCIS
He 6.0
MFC
MFM
scrubber
mixingplate
V5
V1
V1
V6
chamberinlet
chamberoutlet
pressureregulator
2 bar
MFC 50-2 l/min
MFC 40-1 l/min
MFC 30-20 l/min
MFC 20-2 l/min
MFC 10-1 l/min
N 5.02
pressureregulator
2 bar
Pdcatalyst
Zanderadsorptiveair dryer
outsideair
mixing tube
mixing tube
samplebottles
split
split
circulatorbath25 C
water
internalstandard
V4 V2
V3
pump
Figure 4. Schematic diagram of calibration and sampling system.
Pure chemicals are stored in separate sample bottles that are equipped with septa with different size holes. The hole size is determined by the vapor pressure of the compounds. The sample bottles are sealed with Tefl onâ membranes and stored in a thermostatically controlled glass vessel. A mass fl ow controller is used to provide a constant nitrogen fl ow through the vessel. A split vent is installed at the exit of this vessel. After this, another dilution step is employed to obtain concentrations in the ppbV range. Valve V2 is used for enrichment from the exposure chamber and the ISTD is added through valve V5. Valve V1 switches the airfl ow over an ozone scrubber, if necessary. For calibrations, valves V2-V4 are switched. Calibration gas, which has been diluted with cleaned air (V3), is available from valve V4.
Detection limits for the compounds range from about 1 pptV to 5 pptV depending on the quantitation mass. Reproducibility is typically better than 8 %, and breakthrough does not occur for sample volumes up to 5 L. The time needed to run the entire method is about 1 hour. The thermal desorption portion takes 9 minutes while 47 minutes are necessary for the GC analytical run. These 47 minutes can be used for adsorption of the next sample.
Several authors [11-14] have already described the suitability of this method for measurements of biogenic hydrocarbons. The suitability of this method is further demonstrated by comparison of the results obtained with thermal desorption to those obtained with liquid injection (Figure 5). A series of calibration standards were measu-red with both methods. Sensitivities were normalized to the molar mass of the compounds for both methods. The
AN/1997/02 - 5
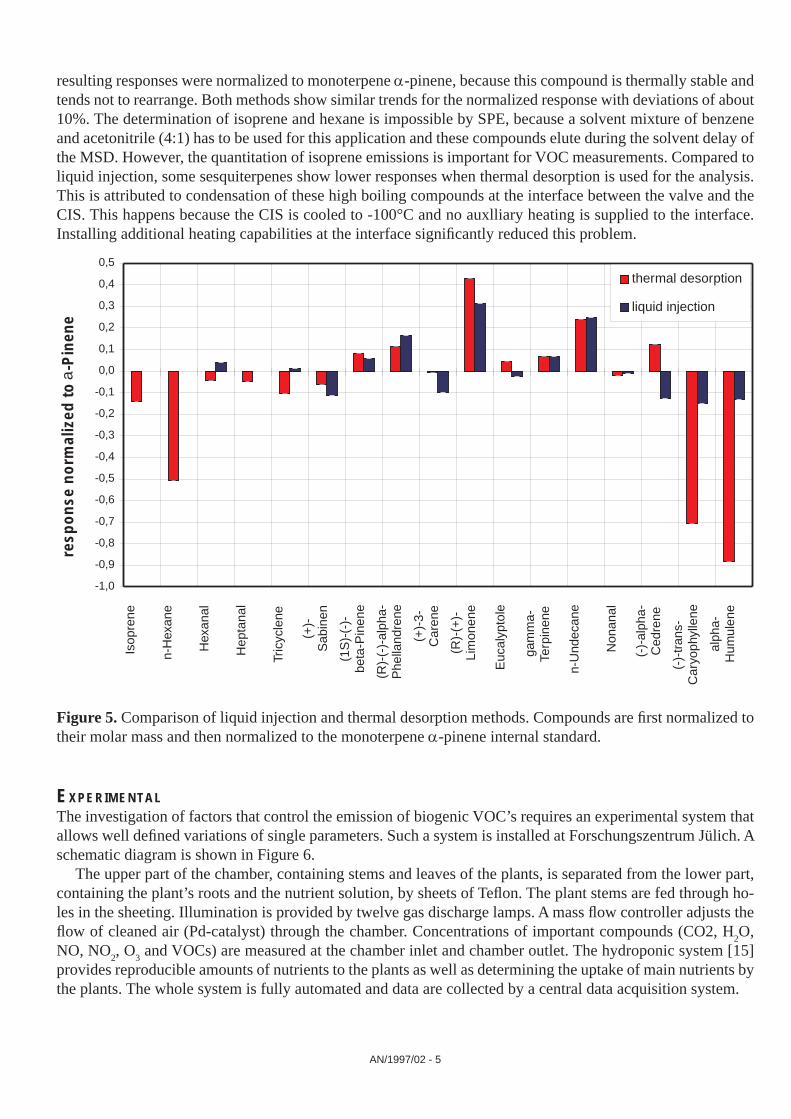
resulting responses were normalized to monoterpene α-pinene, because this compound is thermally stable and tends not to rearrange. Both methods show similar trends for the normalized response with deviations of about 10%. The determination of isoprene and hexane is impossible by SPE, because a sol vent mixture of benzene and acetonitrile (4:1) has to be used for this application and these compounds elute during the solvent delay of the MSD. However, the quantitation of isoprene emissions is important for VOC measurements. Compared to liquid injection, some sesquiterpenes show lower responses when thermal desorption is used for the analysis. This is attributed to condensation of these high boiling compounds at the interface between the valve and the CIS. This happens because the CIS is cooled to -100°C and no auxlliary heating is supplied to the interface. Installing additional heating capabilities at the interface signifi cantly reduced this problem.
Figure 5. Comparison of liquid injection and thermal desorption methods. Compounds are fi rst normalized to their molar mass and then normalized to the monoterpene α-pinene internal standard.
EXPERIMENTALThe investigation of factors that control the emission of biogenic VOC’s requires an experimental system that allows well defi ned variations of single parameters. Such a system is installed at Forschungszentrum Jülich. A schematic dia gram is shown in Figure 6.
The upper part of the chamber, containing stems and leaves of the plants, is separated from the lower part, containing the plant’s roots and the nutrient solution, by sheets of Tefl on. The plant stems are fed through ho-les in the sheeting. Illumination is provided by twelve gas discharge lamps. A mass fl ow controller adjusts the fl ow of cleaned air (Pd-catalyst) through the chamber. Concentrations of important compounds (CO2, H2O, NO, NO2, O3 and VOCs) are measured at the chamber inlet and chamber outlet. The hydroponic system [15] provides reproducible amounts of nutrients to the plants as well as determining the uptake of main nutrients by the plants. The whole system is fully automated and data are collected by a central data acquisition system.
-1,0
-0,9
-0,8
-0,7
-0,6
-0,5
-0,4
-0,3
-0,2
-0,1
0,0
0,1
0,2
0,3
0,4
0,5
Isop
rene
n-H
exan
e
Hex
anal
Hep
tana
l
Tric
ycle
ne
(+)-
Sab
inen
(1S
)-(-
)-be
ta-P
inen
e
(R)-
(-)-
alph
a-P
hella
ndre
ne
(+)-
3-C
aren
e
(R)-
(+)-
Lim
onen
e
Euc
alyp
tole
gam
ma-
Terp
inen
e
n-U
ndec
ane
Non
anal
(-)-
alph
a-C
edre
ne
(-)-
tran
s-C
aryo
phyl
lene
alph
a-H
umul
ene
resp
on
se n
orm
aliz
ed to
a-P
inen
e
thermal desorption
liquid injection
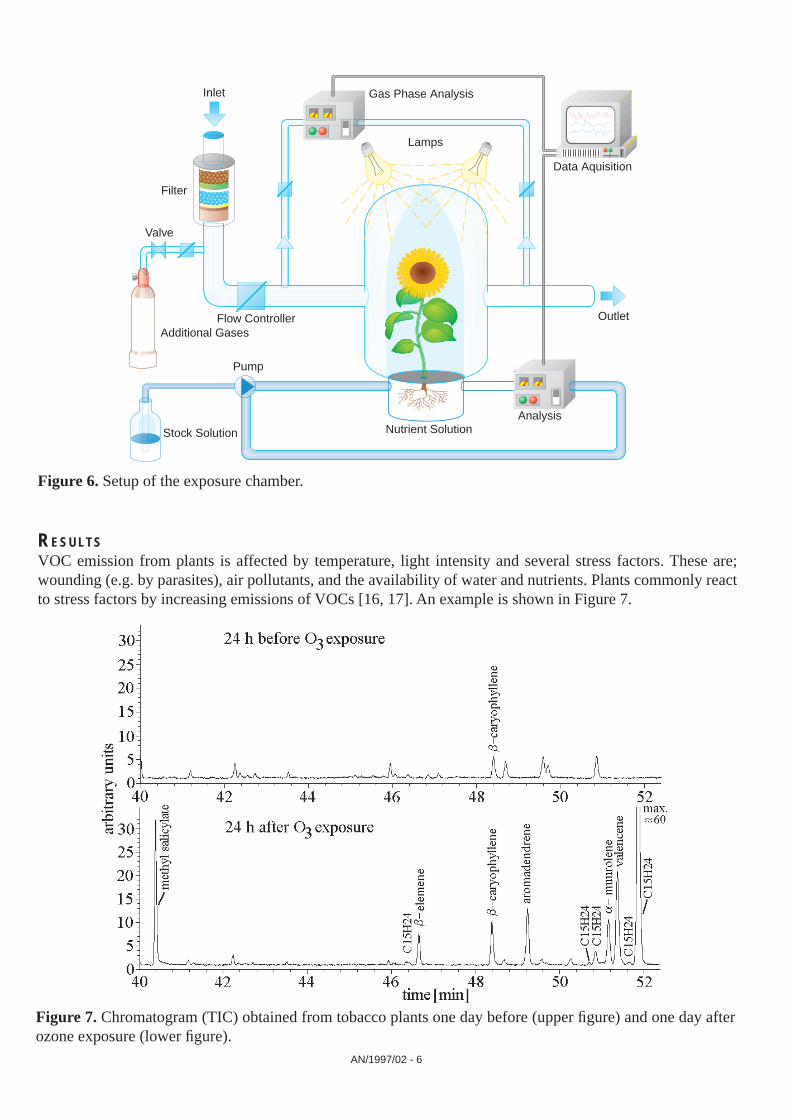
Figure 6. Setup of the exposure chamber.
RESULTSVOC emission from plants is affected by temperature, light intensity and several stress factors. These are; wounding (e.g. by parasites), air pollutants, and the availability of water and nutrients. Plants commonly react to stress factors by increasing emissions of VOCs [16, 17]. An example is shown in Figure 7.
Inlet Gas Phase Analysis
Lamps
Data Aquisition
Outlet
AnalysisNutrient Solution
Pump
Stock Solution
Additional GasesFlow Controller
Valve
Filter
Figure 7. Chromatogram (TIC) obtained from tobacco plants one day before (upper fi gure) and one day after ozone exposure (lower fi gure).
AN/1997/02 - 6
In this context it is interesting that different kinds of stress lead to different VOC emissions [18]. For example, wounding leads to emission of (Z)-3-hexenol but not to emission of methyl salicylate. In some cases of stress, compounds are produced de novo. Furthermore, the time at which the emissions occur is different for different stress factors.
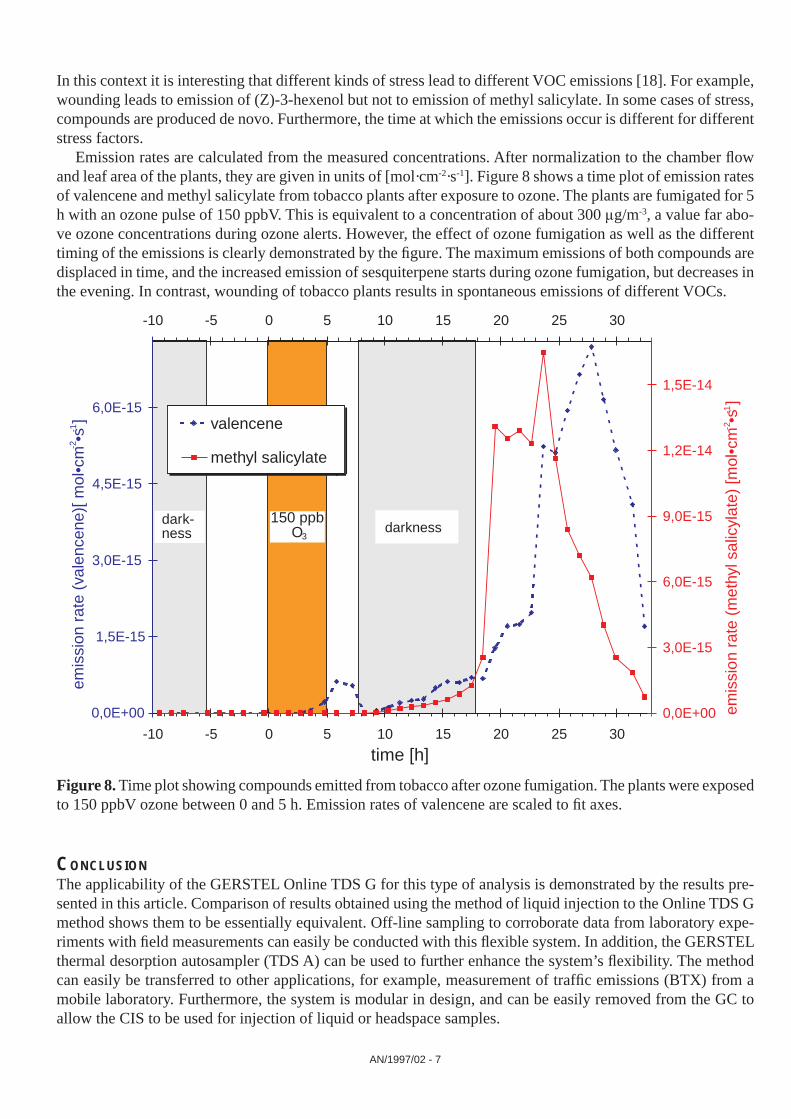
Emission rates are calculated from the measured concentrations. After normalization to the chamber fl ow and leaf area of the plants, they are given in units of [mol·cm-2·s-1]. Figure 8 shows a time plot of emission rates of valencene and methyl salicylate from tobacco plants after exposure to ozone. The plants are fumigated for 5 h with an ozone pulse of 150 ppbV. This is equivalent to a concentration of about 300 μg/m-3, a value far abo-ve ozone concentrations during ozone alerts. However, the effect of ozone fumigation as well as the different timing of the emissions is clearly demonstrated by the fi gure. The maximum emissions of both compounds are displaced in time, and the increased emission of sesquiterpene starts during ozone fumigation, but decreases in the evening. In contrast, wounding of tobacco plants results in spontaneous emissions of different VOCs.
darkness150 ppb
O3
dark-ness
0,0E+00
1,5E-15
3,0E-15
4,5E-15
6,0E-15
-10 -5 0 5 10 15 20 25 30
time [h]
0,0E+00
3,0E-15
6,0E-15
9,0E-15
1,2E-14
1,5E-14
-10 -5 0 5 10 15 20 25 30
valencene
methyl salicylate
emis
sion
rat
e (v
alen
cene
)[ m
ol•c
m •
s ]
-2
emis
sion
rat
e (m
ethy
l sal
icyl
ate)
[mol
•cm
•s
]-2-1
-1
Figure 8. Time plot showing compounds emitted from tobacco after ozone fumigation. The plants were exposed to 150 ppbV ozone between 0 and 5 h. Emission rates of valencene are scaled to fi t axes.
CONCLUSIONThe applicability of the GERSTEL Online TDS G for this type of analysis is demonstrated by the results pre-sented in this article. Comparison of results obtained using the method of liquid injection to the Online TDS G method shows them to be essentially equivalent. Off-line sampling to corroborate data from laboratory expe-riments with fi eld measurements can easily be conducted with this fl exible system. In addition, the GERSTEL thermal desorption autosampler (TDS A) can be used to further enhance the system’s fl exibility. The method can easily be transferred to other applications, for example, measurement of traffi c emissions (BTX) from a mobile laboratory. Furthermore, the system is modular in design, and can be easily removed from the GC to allow the CIS to be used for injection of liquid or headspace samples.
AN/1997/02 - 7

REFERENCES[1] F. FEHSENFELD, J. CALVERT, R.R. FALL, P. GOLDAN, A.B. GUENTHER, C.N. HEWITT, B. LAMB, S. LIU, M. TRAINER, H. WESTBERG AND P. ZIMMERMAN in »Emissions of Volatile Organic Compounds from Vegetation and the Implications for Atmospheric Chemistry«, Global Biogeochemical Cycles 6 (1992), 389-430.[2] A.B. GUENTHER, P. ZIMMERMAN, P.C. HARLEY, R.K. MONSON AND R. FALL in »Isoprene and Mo no ter pe ne Emission Rate Variability: Model Eva lua ti on and Sensitivity Analysis«, Journal of Geophysical Research 98, No. D7 (1993), 12609-12617.[3] J.-F. MÜLLER in »Geographical Distribution and Seasonal Variation of Surface Emissions and De po si ti on Velocities of Atmospheric Trace Ga ses«, Journal of Geophysical Research 97, No. D4 (1992), 3787-3804.[4] Private communication: B. KOLAHGAR, For schungs zen trum Jülich, ICG-2.[5] V. SHULAEV, P. SILVERMAN AND I. RASKIN in »Airborne Signalling by Methyl Salicylate in Plant Pathogen Resistance«, Nature 385 (1997), 718-721.[6] J. TAKABAYASHI, M. DICKE AND M.A. POSTHUMUS in »Volatile Herbivore-Induced Terpenoids in Plant-Mite Interactions: Variations caused by Biotic and Abiotic Factors«, Journal of Chemical Ecology 20, No. 6 (1994), 1329-1354.[7] P.W. PARÉ AND J.H. TUMLINSON in »Induced Synthesis of Plant Volatiles«, Nature 385 (1997), 30-31.[8] H.-G. JANSSEN, E. BALTUSSEN, P. SANDRA AND C.A. CRAMERS »Eine neue Methode für die sorptive Anreicherung von gasförmigen Proben«, Gerstel Aktuell 18 (1997), 4-5.[9] L.D. BUTLER AND M.F. BURKe in »Chromatographic Characterization of Porous Polymers for Use as Adsorbents in Sampling Columns«, Journal of Chromatographic Science 14 (1976), 117-122.[10] H. ROTHWEILER, P.A. WÄGER AND C. SCHLATTER in »Comparison of Tenax TA and Carbotrap for Sampling and Analysis of Volatile Organic Compounds in Air«, Atmospheric En vi ron ment 25B, No. 2 (1991), 231-235.[11] A.C. HEIDEN in »Cha rak te ri sie rung eines Gas chro ma to gra phie-Massenspektrometrie-Systems hin sicht lich der Eignung als Rou ti ne meß ge rät für Labor- und Feldmessungen von Kohlen- wasserstoffen im pptV-Bereich«, Berichte des For schungs zen trums Jülich 3106 (1995).[12] T. HOFFMANN in »Adsorptive Preconcentration Technique Including Oxidant Scavenging for the Measurement of Reactive Natural Hydrocarbons in Ambient Air«, Fresenius Journal of Analytical Chemistry 351 (1995), 41-47.[13] M.-L. RIBA, N. TSIROPOULOS, B. CLEMENT, A. GOLFIER AND L. TORRES in »Preconcentration and Ana ly sis of Atmospheric Isoprene and Monoterpenes«, Journal of Chromatography 456 (1988), 165-173.[14] D.D. RIEMER, P.J. MILNE, C.T. FARMER AND R.G. ZIKa in »Determination of Terpenes and Related Compounds in Semi-Urban Air by GC-MSD«, Chemosphere 28, No. 4 (1994), 837-850.[15] P. ROCKEL in »Growth and Nitrate Consumption of Sunfl owers (Helianthus annuus L.) in the Rhizostat, Device for Continous Nutrient Supply to Plants«, Journal of Plant Nutrition 20, No. 10, (1997), 1431- 1447.
AN/1997/02 - 8


GERSTEL Worldwide
GERSTEL GmbH & Co. KGEberhard-Gerstel-Platz 145473 Mülheim an der RuhrGermany +49 (0) 208 - 7 65 03-0 +49 (0) 208 - 7 65 03 33 [email protected] www.gerstel.com
GERSTEL, Inc.701 Digital Drive, Suite J Linthicum, MD 21090USA +1 (410) 247 5885 +1 (410) 247 5887 [email protected] www.gerstelus.com
GERSTEL AGWassergrabe 27CH-6210 SurseeSwitzerland +41 (41) 9 21 97 23 +41 (41) 9 21 97 25 [email protected] www.gerstel.ch
GERSTEL K.K.1-3-1 Nakane, Meguro-kuTokyo 152-0031SMBC Toritsudai Ekimae Bldg 4FJapan +81 3 5731 5321 +81 3 5731 5322 [email protected] www.gerstel.co.jp
GERSTEL LLPLevel 25, North TowerOne Raffles QuaySingapore 048583 +65 6622 5486 +65 6622 5999 [email protected] www.gerstel.com
GERSTEL BrasilAv. Pascoal da Rocha Falcão, 36704785-000 São Paulo - SP Brasil +55 (11)5665-8931 +55 (11)5666-9084 [email protected] www.gerstel.com.br
������ ����
��������
�
�������� ��� ����
�
����� � ������� �
Awarded for the active pursuit of
environmental sustainability
Information, descriptions and specifications in this Publication are subject to change without notice.GERSTEL, GRAPHPACK and TWISTER are registeredtrademarks of GERSTEL GmbH & Co. KG.
© Copyright by GERSTEL GmbH & Co. KG