chapter clouds - federal aviation administration 00... · chapter 7 clouds clouds, to almost...
TRANSCRIPT
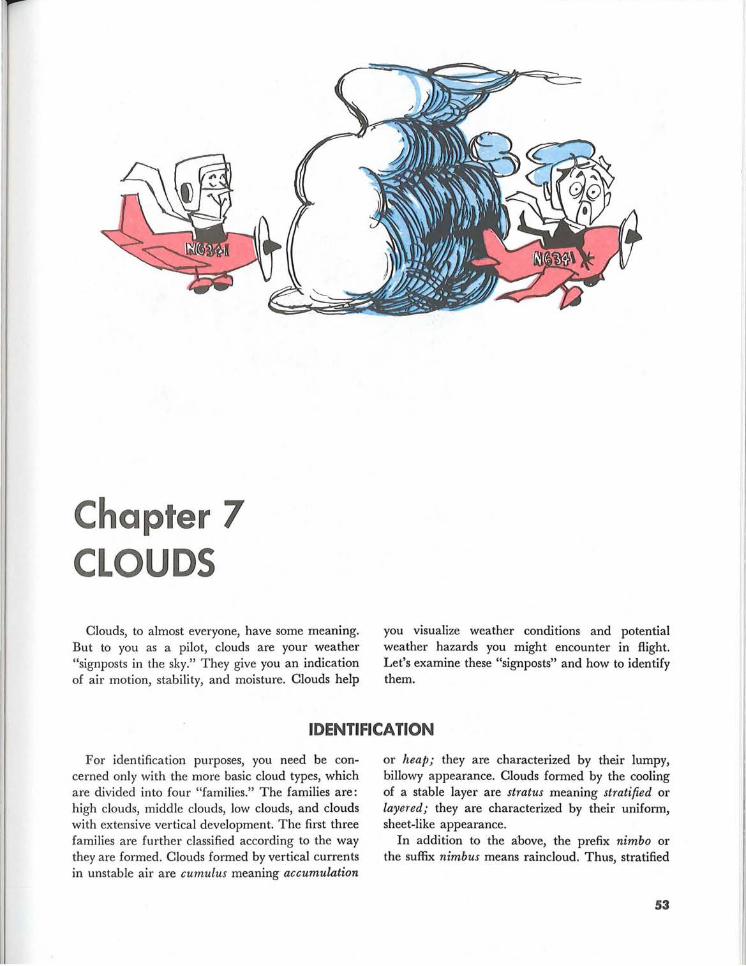
Chapter 7 CLOUDS
Clouds, to almost everyone, have some meaning. But to you as a pilot, clouds are your weather "signposts in the sky." They give you an indication of air motion, stability, and moisture. Clouds help
you visualize weather conditions and potential weather hazards you might encounter in flight. Let's examine these "signposts" and how to identify them.
IDENTIFICATION
For identification purposes, you need be concerned only with the more basic cloud types, which are divided into four "families." The families are: high clouds, middle clouds, low clouds, and clouds with extensive vertical development. The first three families are further classified according to the way they are formed. Clouds formed by vertical currents in unstable air are cumulus meaning accumulation
or heap; they are characterized by their lumpy, billowy appearance. Clouds formed by the cooling of a stable layer are stratus meaning stratified or layered; they are characterized by their uniform, sheet-like appearance.
In addition to the above, the prefix nimbo or the suffix nimbus means raincloud. Thus, stratified
53
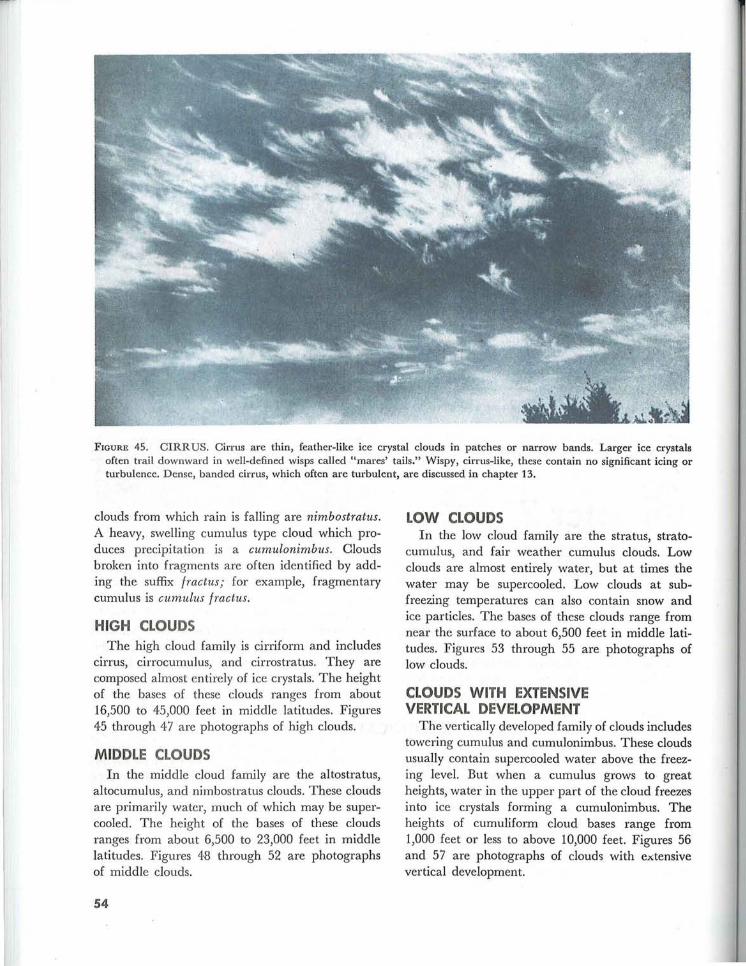
FIGURE 45. CIRRUS. Cirrus are thin, feather-like ice crystal clouds in patches or narrow bands. Larger ice crystals often trail downward in well-defined wisps called "mares' tai ls." Wispy, cirrus-like, these contain no significant icing or turbulence. Dense, banded cirrus, which often are turbulent, are discussed in chapter 13.
clouds from which rain is falling are nimbostratus. A heavy, swelling cumulus type cloud which produces precipita tion is a cumulonimbus. Clouds broken into fragments are often identified by adding the suffix tractus; for example, fragmentary cumulus is cumulus tractus.
HIGH CLOUDS The high cloud family is cirriform and includes
cirrus, cirrocumulus, and cirrostratus. They are composed almost entirely of ice crystals. The height of the bases of these clouds ranges from about 16,500 to 45,000 feet in middle latitudes. Figures 45 through 47 a re photographs of high clouds.
MIDDLE CLOUDS In the middle cloud family are the altostratus,
altocumulus, and nimbostratus clouds. These clouds are primarily water, much of which may be supercooled. The height of the bases of these clouds ranges from about 6,500 to 23,000 feet in middle latitudes. Figures 48 through 52 are photographs of middle clouds.
54
LOW CLOUDS In the low cloud family are the stratus, strato
cumulus, and fair weather cumulus clouds. Low clouds are almost entirely water, but at times the water may be supercooled. Low clouds at subfreezing temperatures can also contain snow and ice particles. The bases of these clouds range from near the surface to about 6,500 feet in middle latitudes. Figures 53 through 55 are photographs of low clouds.
CLOUDS WITH EXTENSIVE VERTICAL DEVELOPMENT
The vertically developed family of clouds includes towering cumulus and cumulonimbus. These clouds usually contain supercooled water above the freezing level. But when a cumulus grows to great heights, water in the upper part of the cloud freezes into ice crystals forming a cumulonimbus. The heights of cumuliform cloud bases range from 1,000 feet or less to above 10,000 feet. Figures 56 and 57 are photographs of clouds with extensive vertical development.
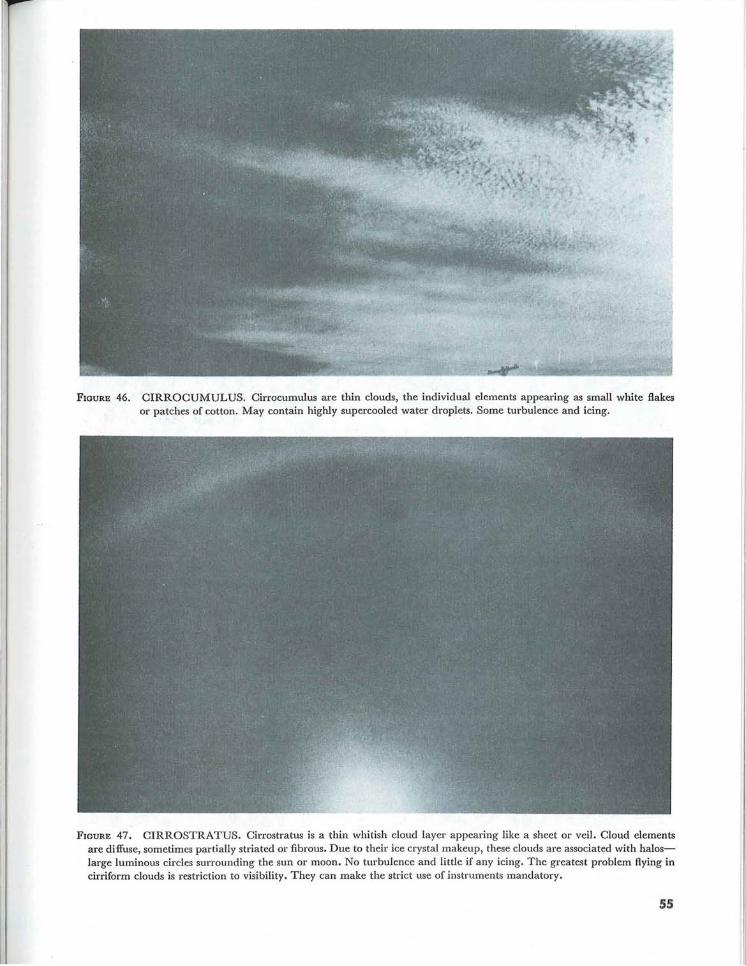
FIGURE 46. CIRROCUMULUS. Cirrocumulus are thin clouds, the individual elements appearing as small white flakes or patches of cotton. May contain highly supercooled water droplets. Some turbulence and icing.
FIGURE 47. CIRROSTRATUS. Cirrostratus is a thin whitish cloud layer appearing like a sheet or veil. Cloud elements are diffuse, sometimes partially striated or fibrous. Due to their ice crystal makeup, these clouds are associated with haloslarge luminous circles surrounding the sun or moon. No turbulence and little if any icing. The greatest problem flying in cirriform clouds is restriction to visibility. They can make the strict use of instruments mandatory.
55
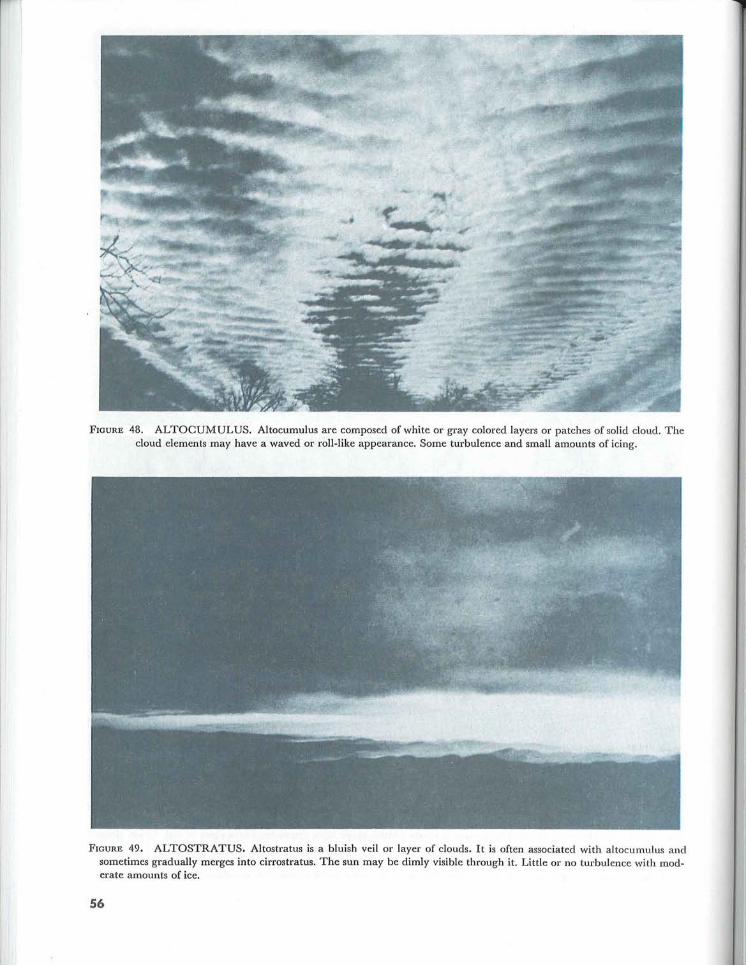
FIGURE 48. AL TOCUMUL US. Altocumulus are composed of white or gray colored layers or patches of solid cloud. The cloud elements may have a waved or roll-like appearance. Some turbulence and small amounts of icing.
FIGURE 49. ALTOSTRATUS. Altostratus is a bluish veil or layer of clouds. It is often associated with altocumulus and sometimes gradually merges into cirrostratus. The sun may be dimly visible through it. Little or no turbulence with moderate amounts of ice.
56
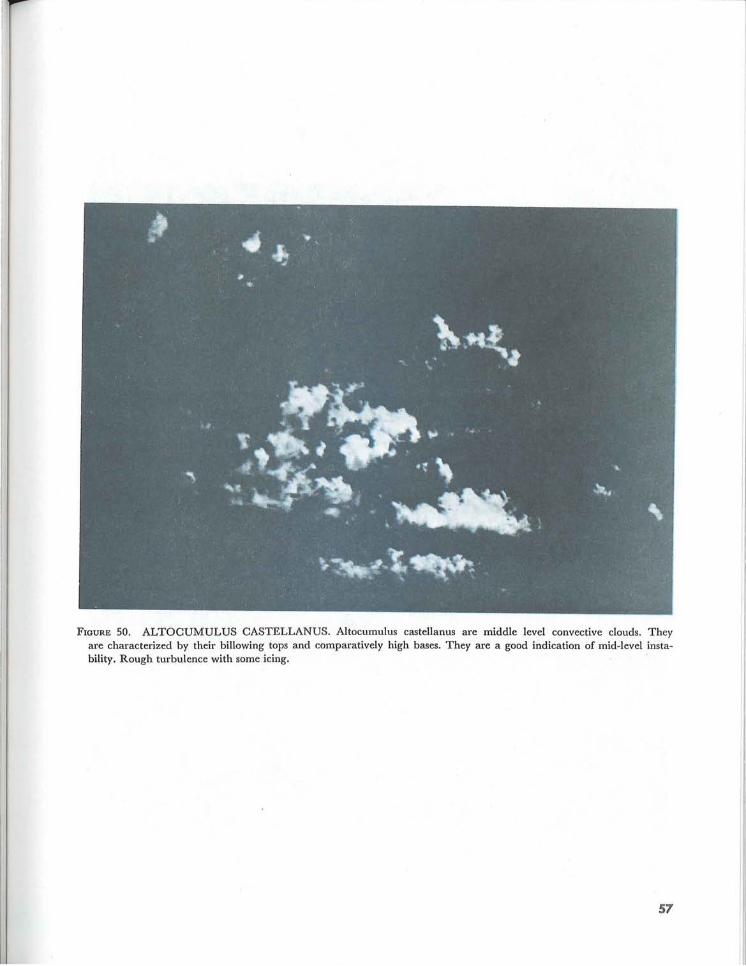
FIGURE 50. ALTOCUMULUS CASTELLANUS. Altocumulus castellanus are middle level convective clouds. They are characterized by their billowing tops and comparatively high bases. They are a good indication of mid-level instability. Rough turbulence with some icing.
57
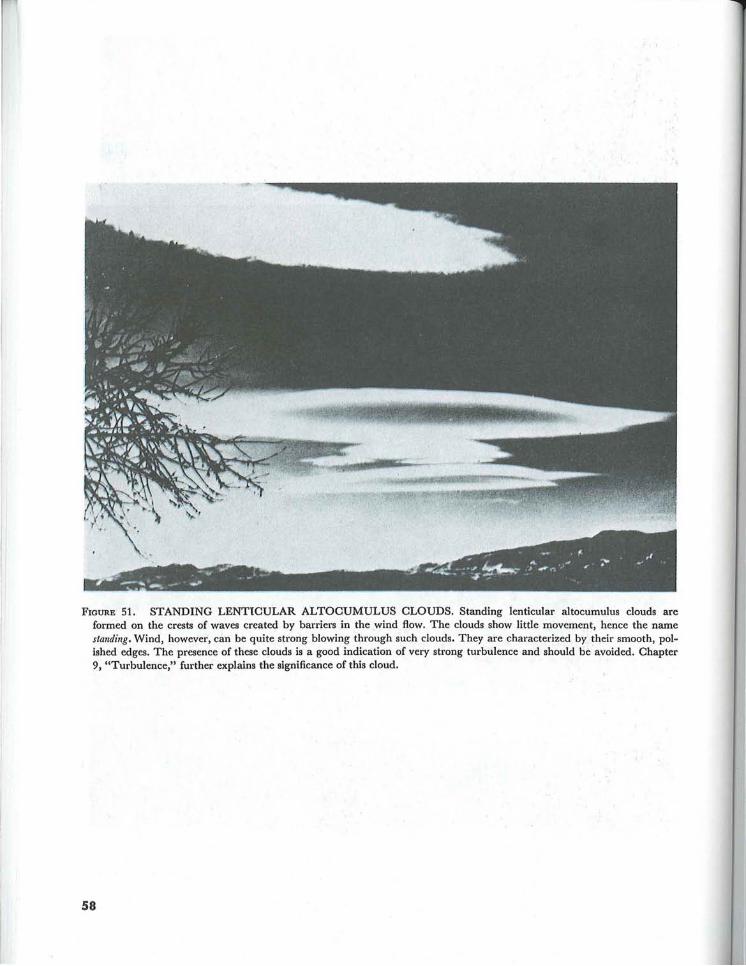
FIGURE 51. STANDING LENTICULAR ALTOCUMULUS CLOUDS. Standing lenticular altocumulus clouds are formed on the crests of waves created by barriers in the wind flow. The clouds show little movement, hence the name standing. Wind, however, can be quite strong blowing through such clouds. They are characterized by their smooth, polished edges. The presence of these clouds is a good indication of very strong turbulence and should be avoided. Chapter 9, "Turbulence," further explains the significance of this cloud.
58
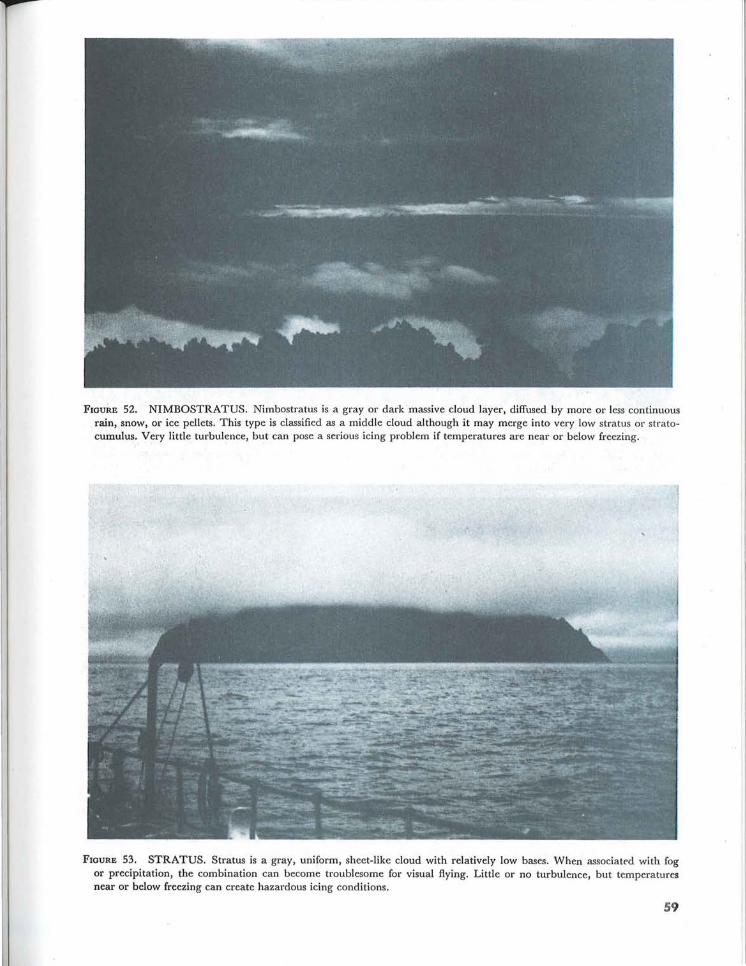
FIGURE 52. NIMBOSTRATUS. Nimbostratus is a gray or dark massive cloud layer, diffused by more or less continuous rain, snow, or ice pellets. This type is classified as a middle cloud although it may merge into very low stratus or stratocumulus. Very little turbulence, but can pose a serious icing problem if temperatures are near or below freezing.
FIGURE 53. STRATUS. Stratus is a gray, uniform, sheet-like cloud with relatively low bases. When associat('d with fog or precipitation, the combination can become troublesome for visual flying. Little or no turbulence, but temperatures near or below freezing can create hazardous icing conditions.
59

FIGURE 54. STRATOCUMULUS. Strata cumulus bases are globular masses or rolls unlike the flat, sometimes indefinite, bases of stratus. They usually form at the top of a layer mixed by moderate surface winds. Sometimes, they form from the breaking up of stratus or the spreading out of cumulus. Some turbulence, and possible icing at subfreezing temperatures. Ceiling and visibility usually better than with low stratus.
FIGURE 55 . CUMULUS. Fair weather cumulus clouds form in convective currents and are characterized by relatively flat bases and dome-shaped tops. Fair weather cumulus do not show extensive vertical development and do not produce precipitation. More often, fair weather cumulus indicates a shallow layer of instability. Some turbulence and no significant icing.
60
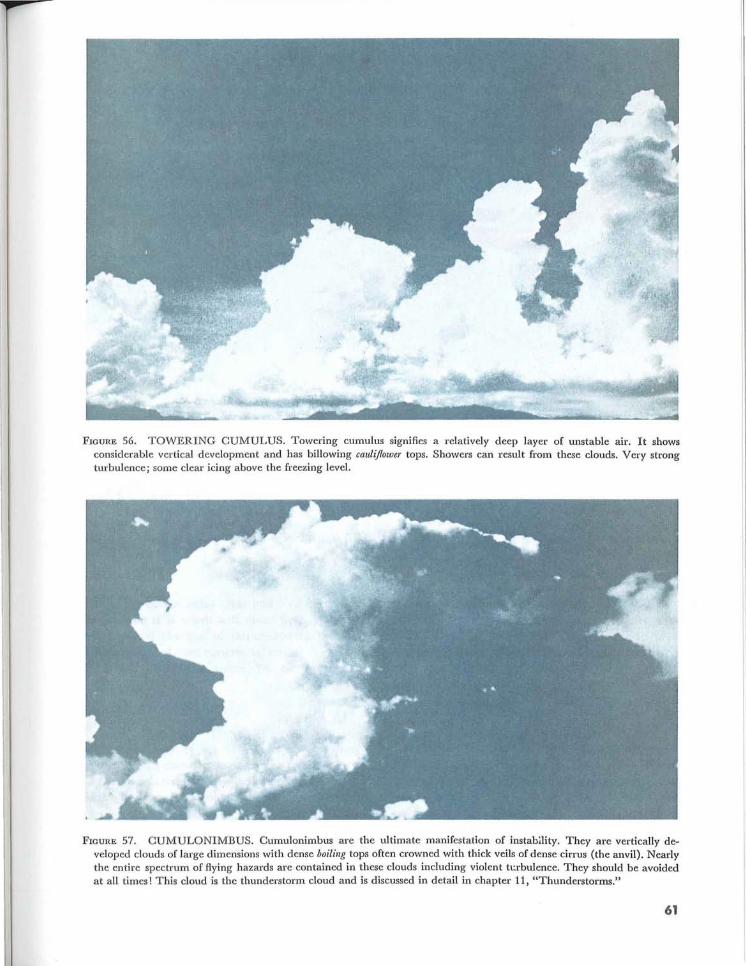
FIGURE 56. TOWERING CUMULUS. Towering cumulus signifies a relatively deep layer of unstable air. It shows considerable vertical development and has billowing cauliflower tops. Showers can result from these clouds. Very strong turbulence; some clear icing above the freezing level.
FIGURE 57. CUMULONIMBUS. Cumulonimbus are the ultimate manifestation of instability. They are vertically developed clouds of large dimensions with dense boiling tops often crowned with thick veils of dense cirrus (the anvil). Nearly the entire spectrum of flying hazards are contained in these clouds including violent tt:rbulence. They should be avoided at all times ! This cloud is the thunderstorm cloud and is discussed in detail in chapter 11, "Thunderstorms."
61
SIGNPOSTS IN THE SKY
The photographs illustrate some of the basic cloud types. The caption with each photograph describes the type and its significance to flight. In closing, we suggest you take a second look at the
62
cloud photographs. Study the descriptions and potential hazards posed by each type and learn to use the clouds as "signposts in the sky."
Chapter 8 AIR MASSES AND FRONTS
Why is weather today clear and cold over Oklahoma while it is warm and moist over Alabama? What caused the line of thunderstorms that you circumnavigated over eastern Arkansas? Air masses and fronts provide the answer. You can better plan
the safety and economy of flight when you can evaluate the expected effects of air masses and fronts. This chapter explains air masses and fronts and relates them to weather and flight planning.
AIR MASSES
When a body of air comes to rest or moves slowly over an extensive area having fairly uniform properties of temperature and moisture, the air takes on those properties. Thus, the air over the area becomes somewhat of an entity as illustrated in figure 58 and has fairly uniform horizontal distribution of its properties. The area over which the air mass acquires its identifying distribution of moisture and temperature is its "source region."
Source regions are many and varied, but the best source regions for air masses are large snow or icecovered polar regions, cold northern oceans, tropical oceans, and large desert areas. Midlatitudes are poor source regions because transitional disturbances dominate these latitudes giving little opportunity for air masses to stagnate and take on the properties of the underlying region.
63
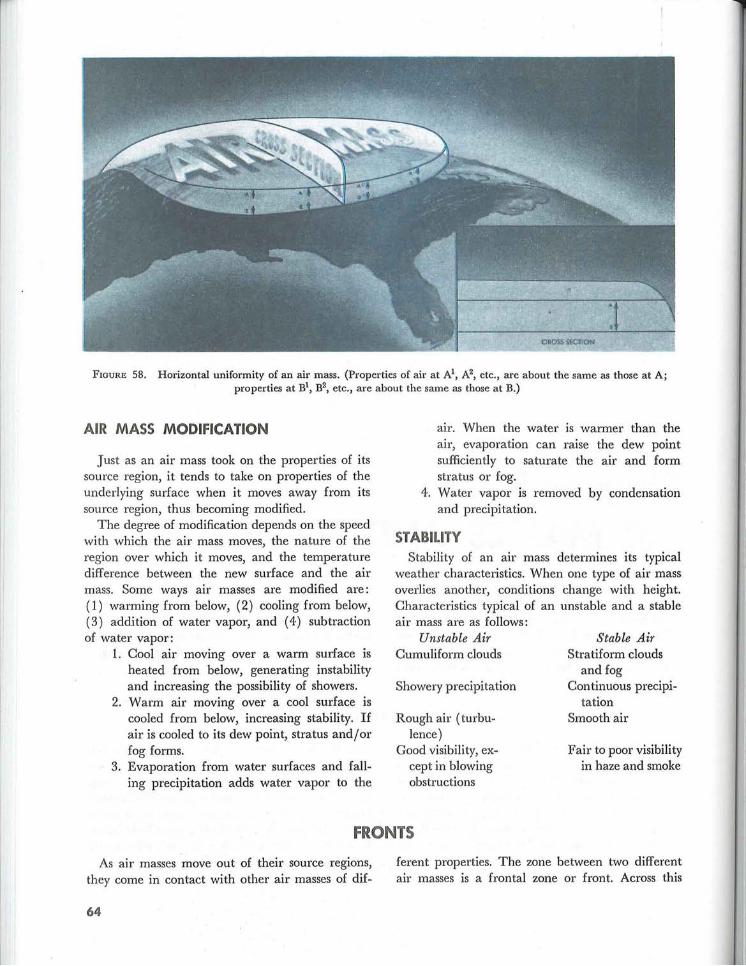
FIGURE 58. Horizontal uniformity of an air mass. (Properties of air at Ai, A2, etc., are about the same as those at A; properties at Bl, B2, etc., are about the same as those at B.)
AIR MASS MODIFICATION
Just as an air mass took on the properties of its source region, it tends to take on properties of the underlying surface when it moves away from its source region, thus becoming modified.
The degree of modification depends on the speed with which the air mass moves, the nature of the region over which it moves, and the temperature difference between the new surface and the air mass. Some ways air masses are modified are: (1) warming from below, (2) cooling from below, (3) addition of water vapor, and (4) subtraction of water vapor:
1. Cool air moving over a warm surface is heated from below, generating instability and increasing the possibility of showers.
2. Warm air moving over a cool surface is cooled from below, increasing stability. If air is cooled to its dew point, stratus and/or fog forms.
3. Evaporation from water surfaces and falling precipitation adds water vapor to the
aIr. When the water is warmer than the air, evaporation can raise the dew point sufficiently to saturate the air and form stratus or fog.
4. Water vapor is removed by condensation and precipitation.
STABILITY Stability of an air mass determines its typical
weather characteristics. When one type of air mass overlies another, conditions change with height. Characteristics typical of an unstable and a stable air mass are as follows:
Unstable Air Stable Air Cumuli form clouds
Showery precipitation
Rough air (turbulence)
Good visibility, except in blowing obstructions
Stratiform clouds and fog
Continuous precipitation
Smooth air
Fair to poor visibility in haze and smoke
FRONTS
As air masses move out of their source regions, they come in contact with other air masses of dif-
64
ferent properties. The zone between two different air masses is a frontal zone or front. Across this
zone, temperature, humidity and wind often change rapidly over short distances.
DISCONTINUITIES When you pass through a front, the change from
the properties of one air mass to those of the other is sometimes quite abrupt. Abrupt changes indicate a narrow frontal zone. At other times, the change of properties is very gradual indicating a broad and diffuse frontal zone.
Temperature Temperature is one of the most easily recog
nized discontinuities across a front. At the surface, the passage of a front usually causes noticeable temperature change. When flying through a front, you note a significant change in temperature, especially at low altitudes. Remember that the temperature change, even when gradual, is faster and more pronounced than a change during a flight wholly within one air mass. Thus, for safety, obtain a new altimeter setting after flying through a front. Chapter 3 discussed the effect of a temperature change on the aircraft altimeter.
Dew Point As you learned in Chapter 5, dew point temper
ature is a measure of the amount of water vapor in the air. Temperature-dew point spread is a measure of the degree of saturation. Dew point and temperature-dew point spread usually differ across a front. The difference helps identify the front and may give a clue to differences of cloudiness and! or fog.
Wind Wind always changes across a front. Wind dis
continuity may be in direction, in speed, or in both. Be alert for a wind shift when flying in the vicinity of a frontal surface; if the wind shift catches you unaware it can get you off course or even lost in a short time. The relatively sudden change in wind also creates wind shear, and you will study its significance in the next chapter, "Turbulence."
Pressure A front lies in a pressure trough, and pressure
generally is higher in the cold air. Thus, when you cross a front directly into colder air, pressure usually rises abruptly. When you approach a front toward warm air, pressure generally falls until you cross the front and then remains steady or falls
slightly in the warm air. However, pressure patterns vary widely across fronts, and your course may not be directly across a front. The important thing to remember is that when crossing a front, you will encounter a difference in the rate of pressure change; be especially alert in keeping your altimeter setting current.
TYPES Of FRONTS The three principal types of fronts are the cold
front, the warm front, and the stationary front.
Cold Front The leading edge of an advancing cold air mass
is a cold front. At the surface, cold air is overtaking and replacing warmer air. Cold fronts move at about the speed of the wind component perpendicular to the front just above the frictional layer. Figure 59 shows the vertical cross section of a cold front and the symbol depicting it on a surface weather chart. A shallow cold air mass or a slow moving cold front may have a frontal slope more like a warm front shown in figure 60.
Warm Front The edge of an advancing warm air mass is a
warm front-warmer air is overtaking and replacing colder air. Since the cold air is denser than the warm air, the cold air hugs the ground. The warm air slides up and over the cold air and lacks direct push on the cold air. Thus, the cold air is slow to retreat in advance of the warm air. This slowness of the cold air to retreat produces a frontal slope that is more gradual than the cold frontal slope as shown in figure 60. Consequently, warm fronts on the surface are seldom as well marked as cold fronts, and they usually move about half as fast when the general wind flow is the same in each case.
Stationary fronts When neither air mass is replacing the other, the
front is stationary. Figure 61 shows a cross section of a stationary front and its symbol on a surface chart. The opposing forces exerted by adjacent air masses of different densities are such that the frontal surface between them shows little or no movement. In such cases, the surface winds tend to blow parallel to the frontal zone. Slope of a stationary front is normally shallow, although it may be steep depending on wind distribution and density difference.
65
--- -- ... ~ ......
COLD
> > > <
COLD
WARM
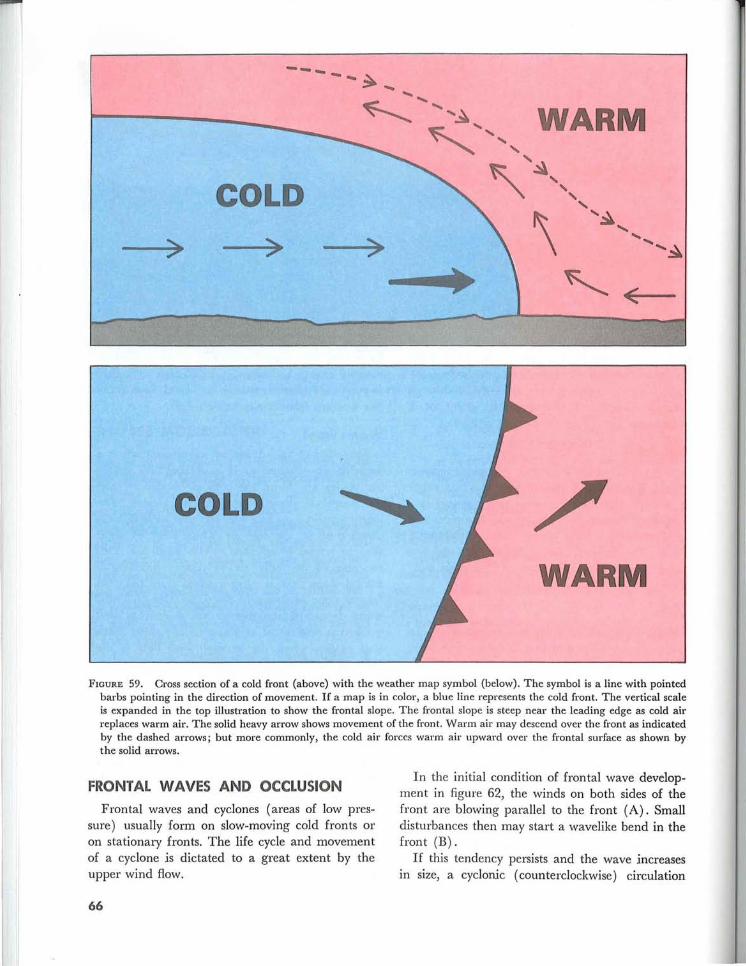
FIGURE 59. Cross section of a cold front (above) with the weather map symbol (below). The symbol is a line with pointed barbs pointing in the direction of movement. If a map is in color, a blue line represents the cold front. The vertical scale is expanded in the top illustration to show the frontal slope. The frontal slope is steep near the leading edge as cold air replaces warm air. The solid heavy arrow shows movement of the front. Warm air may descend over the front as indicated by the dashed arrows; but more commonly, the cold air forces warm air upward over the frontal surface as shown by the solid arrows.
FRONTAL WAVES AND OCCLUSION
Frontal waves and cyclones (areas of low pressure) usually form on slow-moving cold fronts or on stationary fronts. The life cycle and movement of a cyclone is dictated to a great extent by the upper wind flow.
66
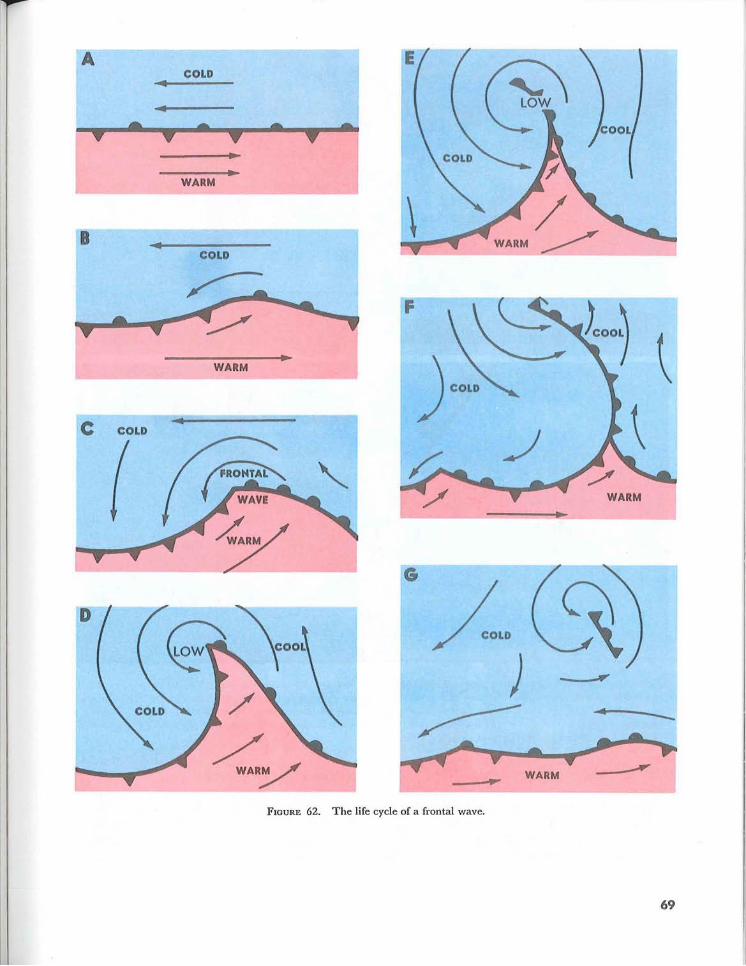
In the initial condition of frontal wave development in figure 62, the winds on both sides of the front are blowing parallel to the front (A). Small disturbances then may start a wavelike bend in the front (B).
If this tendency persists and the wave increases in size, a cyclonic (counterclockwise) circulation
WARM
> COLD
COLD
WARM
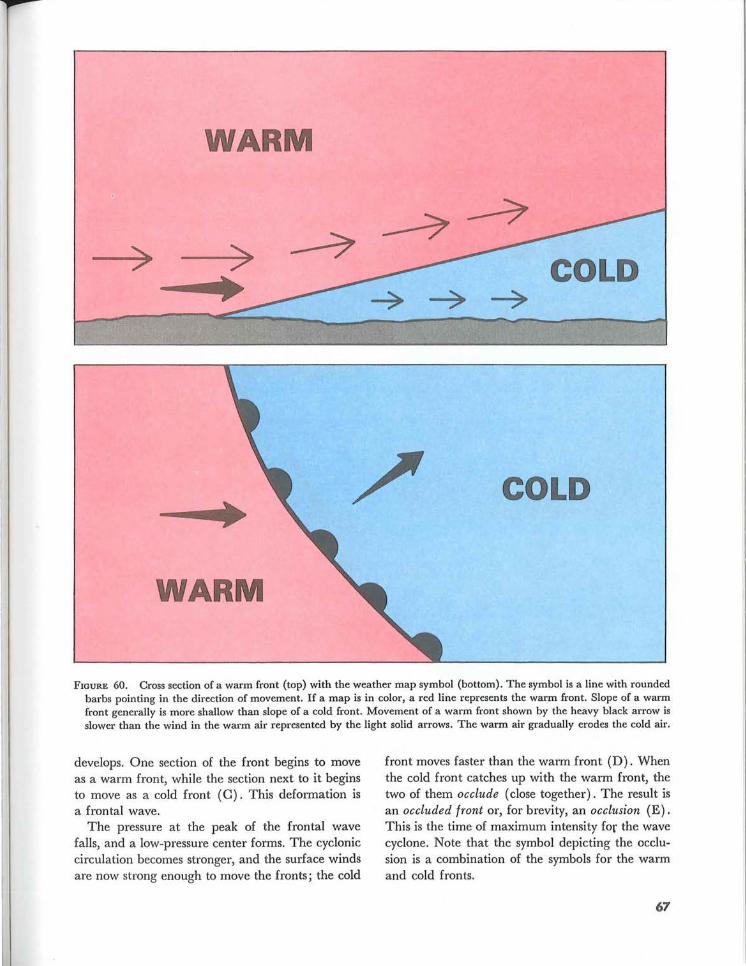
FIGURE 60. Cross section of a warm front (top) with the weather map symbol (bottom). The symbol is a line with rounded barbs pointing in the direction of movement. If a map is in color, a red line represents the warm front. Slope of a warm front generally is more shallow than slope of a cold front . Movement of a warm front shown by the heavy black arrow is slower than the wind in the warm air represented by the light solid arrows. The warm air gradually erodes the cold air.
develops. One section of the front begins to move as a warm front, while the section next to it begins to move as a cold front (C) . This deformation is a frontal wave.
The pressure at the peak of the frontal wave falls, and a low-pressure center forms. The cyclonic circulation becomes stronger, and the surface winds are now strong enough to move the fronts; the cold
front moves faster than the warm front (D). When the cold front catches up with the warm front, the two of them occlude (close together). The result is an occluded front or, for brevity, an occlusion (E). This is the time of maximum intensity for the wave cyclone. Note that the symbol depicting the occlusion is a combination of the symbols for the warm and cold fronts.
67
WARM
COLD
COLD
WARM
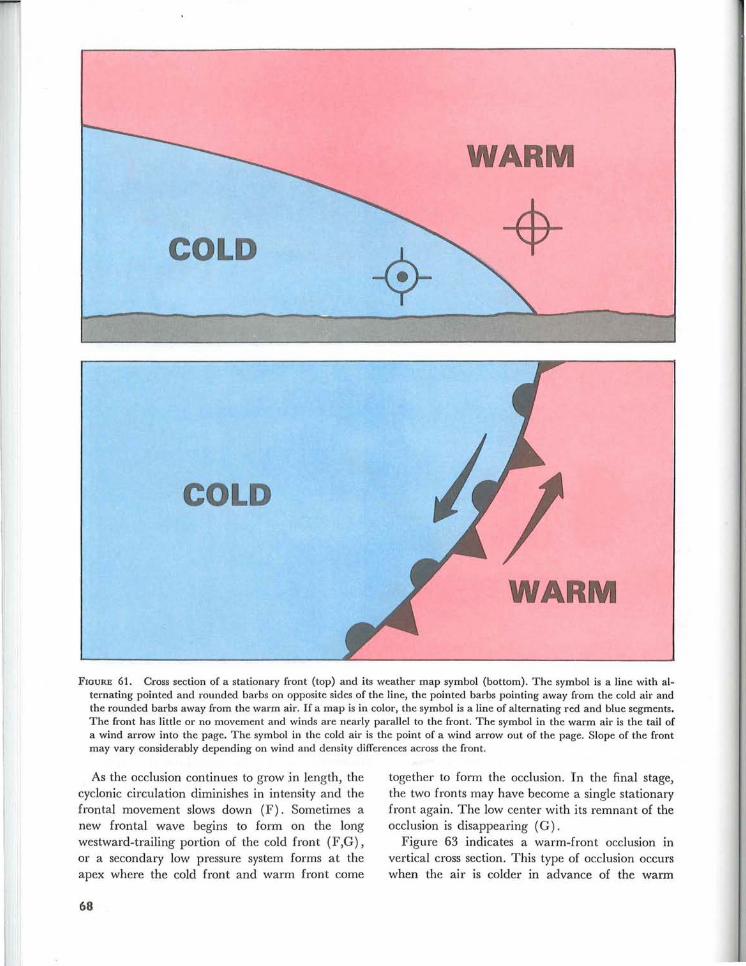
FIGURE 61. Cross section of a stationary front (top) and its weather map symbol (bottom). The symbol is a line with alternating pointed and rounded barbs on opposite sides of the line, the pointed barbs pointing away from the cold air and the rounded barbs away from the warm air. If a map is in color, the symbol is a line of alternating red and blue segments. The front has little or no movement and winds are nearly parallel to the front. The symbol in the warm air is the tail of a wind arrow into the page. The symbol in the cold air is the point of a wind arrow out of the page. Slope of the front may vary considerably depending on wind and density differences across the front .
As the occlusion continues to grow in length, the cyclonic circulation diminishes in intensity and the frontal movement slows down (F). Sometimes a new frontal wave begins to form on the long westward-trailing portion of the cold front (F,G), or a secondary low pressure system forms at the apex where the cold front and warm front come
68
together to form the occlusion. In the final stage, the two fronts may have become a single stationary front again . The low center with its remnant of the occlusion is disappearing (G).
Figure 63 indicates a warm-front occlusion in vertical cross section. This type of occlusion occurs when the air is colder in advance of the warm
B
•
C COLD
(
• COLD
...
,.
•
~
WARM ~
•
COLD
~ ~
WARM
,/
/
..
G
~L' ~
WA~
FIGURE 62 ... . The life cycle of a frontal wave.
....
69
WARM
COOL
COLD
(Warm Air Aloft)
COOL COLD
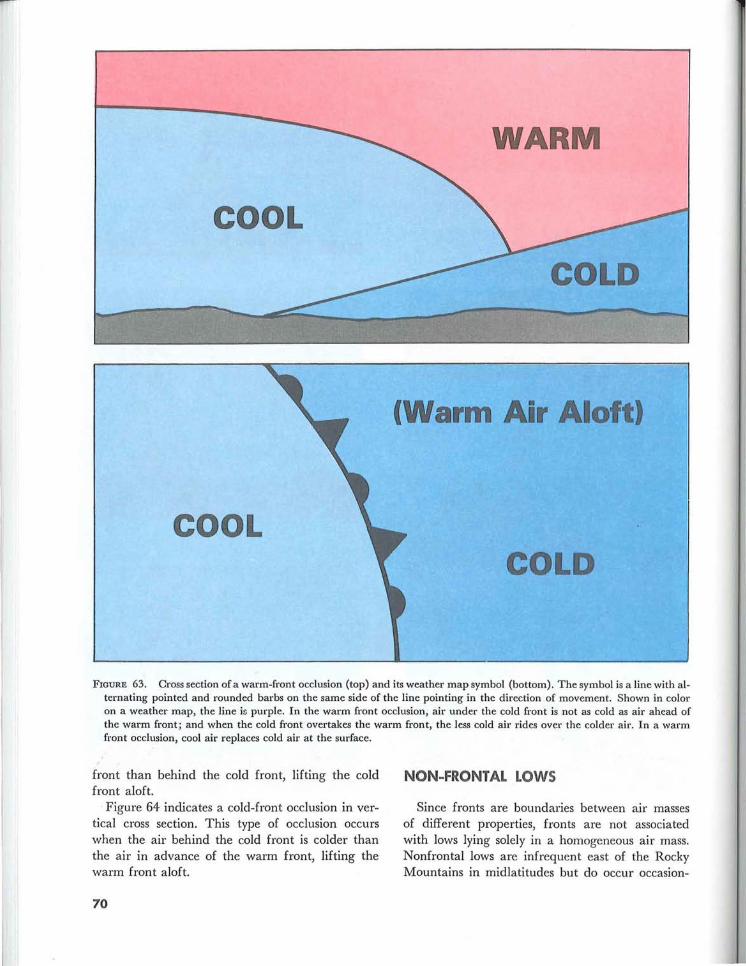
FIGURE 63. Cross section of a warm-front occlusion (top) and its weather map symbol (bottom) . The symbol is a line with alternating pointed and rounded barbs on the same side of the line pointing in the direction of movement. Shown in color on a weather map, the line is purple. In the warm front occlusion, air under the cold front is not as cold as air ahead of the warm front; and when the cold front overtakes the warm front, the less cold air rides over the colder air. In a warm front occlusion, cool air replaces cold air at the surface.
front than behind the cold front, lifting the cold front aloft.
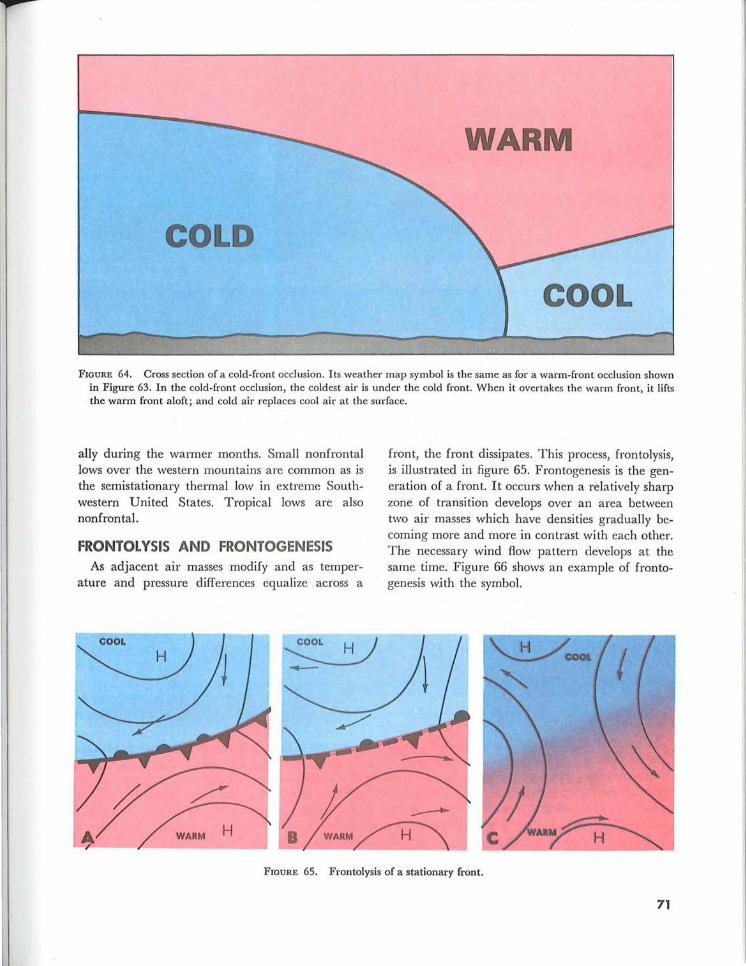
Figure 64 indicates a cold-front occlusion in vertical cross section. This type of occlusion occurs when the air behind the cold front is colder than the air in advance of the warm front, lifting the warm front aloft.
70
NON-FRONTAL LOW S
Since fronts are boundaries between air masses of different properties, fronts are not associated with lows lying solely in a homogeneous air mass. Nonfrontal lows are infrequent east of the Rocky Mountains in midlatitudes but do occur occasion-
WARM
COLD
COOL
FIGURE 64. Cross section of a cold-front occlusion. Its weather map symbol is the same as for a warm-front occlusion shown in Figure 63. In the cold-front occlusion, the coldest air is under the cold front. When it overtakes the warm front, it lifts the warm front aloft; and cold air replaces cool air at the surface.
ally during the warmer months. Small nonfrontal lows over the western mountains are common as is the semistationary thermal low in extreme Southwestern United States. Tropical lows are also nonfrontal.
FRONTOl YSIS AND FRONTOGENESIS As adjacent air masses modify and as temper
ature and pressure differences equalize across a
front, the front dissipates. This process, frontolysis, js illustrated in figure 65. Frontogenesis is the generation of a front. It occurs when a relatively sharp zone of transition develops over an area between two air masses which have densities gradually becoming more and more in contrast with each other. The necessary wind flow pattern develops at the same time. Figure 66 shows an example of frontogenesis wjth the symbol.
FIGURE 65. Frontolysis of a stationary front.
71
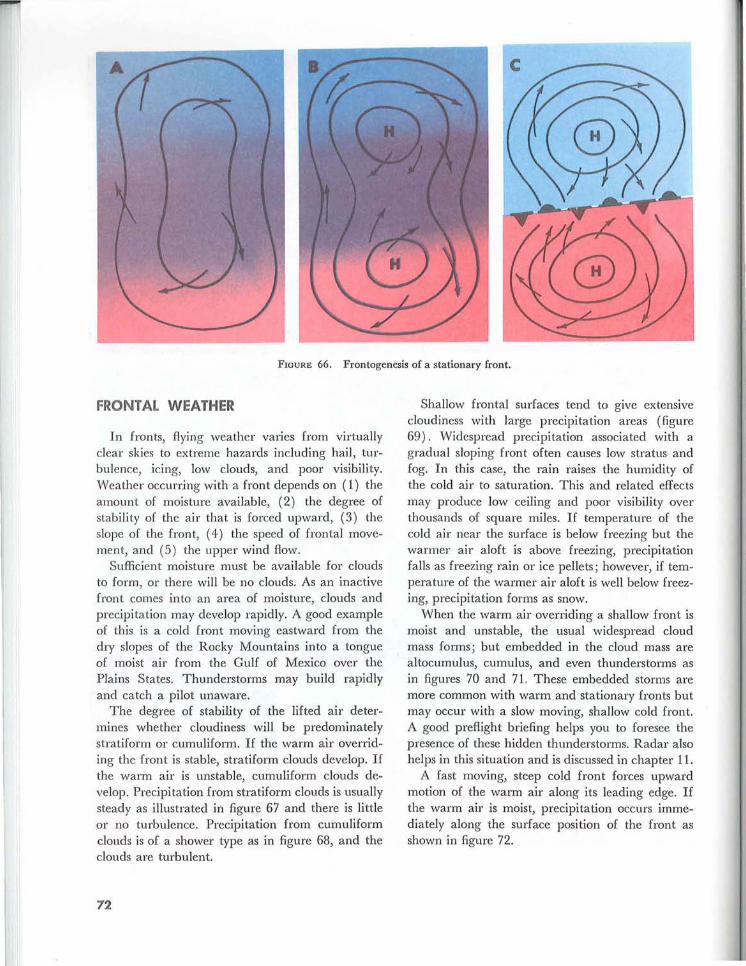
FIGURE 66. Frontogenesis of a stationary front.
FRONTAL WEATHER
In fronts, flying weather varies from virtually clear skies to extreme hazards including hail, turbulence, icing, low clouds, and poor visibility. Weather occurring with a front depends on (1) the amount of moisture available, (2) the degree of stabi li ty of the air that is forced upward, (3) the slope of the front, (4) the speed of frontal movement, and (5) the upper wind flow.
Sufficient moisture must be available for clouds to form, or there will be no clouds. As an inactive front comes into an area of moisture, clouds and precipitation may develop rapidly. A good example of this is a cold front moving eastward from the dry slopes of the Rocky Mountains into a tongue of moist air from the Gulf of Mexico over the Plains States. Thunderstorms may build rapidly and catch a pilot unaware.
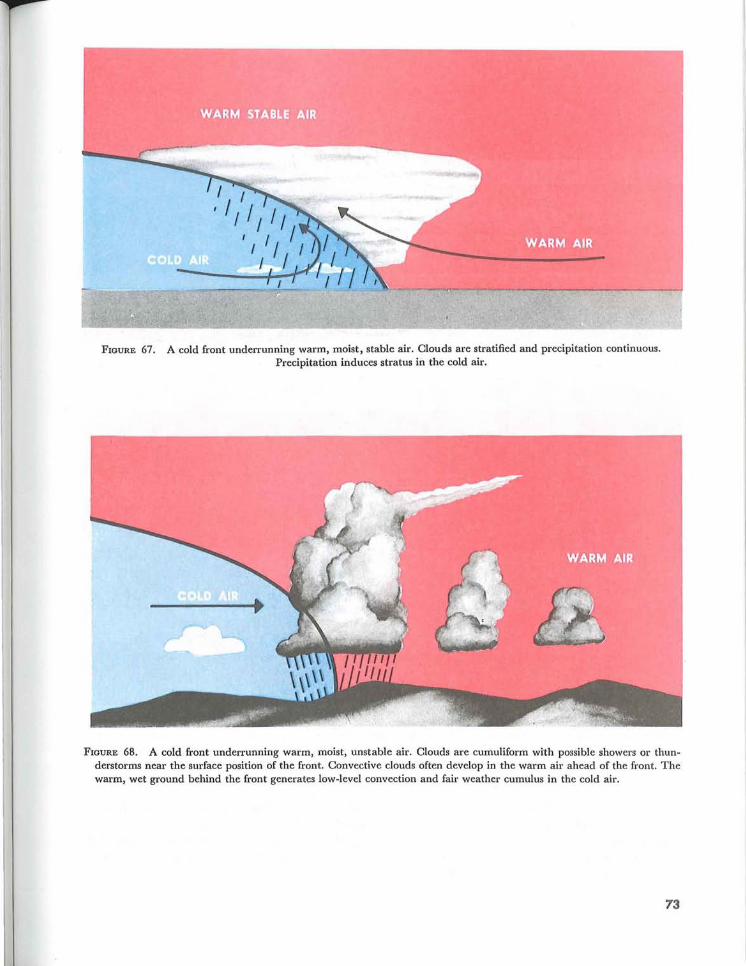
The degree of stability of the lifted air determines whether cloudiness will be predominately stratiform or cumuliform. If the warm air overriding the front is stable, stratiform clouds develop. If the warm air is unstable, cumuliform clouds develop. Precipitation from stratiform clouds is usually steady as illustrated in figure 67 and there is little or no turbulence. Precipitation from cumuli form clouds is of a shower type as in figure 68, and the clouds are turbulent.
72
Shallow frontal surfaces tend to give extensive cloudiness with large precipitation areas (figure 69) . Widespread precipitation associated with a gradual sloping front often causes low stratus and fog. In this case, the rain raises the humidity of the cold air to saturation. This and related effects may produce low ceiling and poor visibility over thousands of square miles. If temperature of the cold air near the surface is below freezing but the warmer air aloft is above freezing, precipitation falls as freezing rain or ice pellets; however, if temperature of the warmer air aloft is well below freezing, precipitation forms as snow.
When the warm air overriding a shallow front is moist and unstable, the usual widespread cloud mass forms; but embedded in the cloud mass are altocumulus, cumulus, and even thunderstorms as in figures 70 and 71. These embedded storms are more common with warm and stationary fronts but may occur with a slow moving, shallow cold front. A good preflight briefing helps you to foresee the presence of these hidden thunderstorms. Radar also helps in this situation and is discussed in chapter 11.
A fast moving, steep cold front forces upward motion of the warm air along its leading edge. If the warm air is moist, precipitation occurs immediately along the surface position of the front as shown in figure 72.
~--~(~~~,~~------------~-------
FIGURE 67. A cold front underrunning warm, moist, stable air. Clouds are stratified and precipitation continuous. Precipitation induces stratus in the cold air.
FIGURE 68. A cold front underrunning warm, moist, unstable air. Clouds are cumuliform with possible showers or thunderstorms near the surface position of the front. Convective clouds often develop in the warm air ahead of the front. The warm, wet ground behind the front generates low-level convection and fair weather cumulus in the cold air.
73
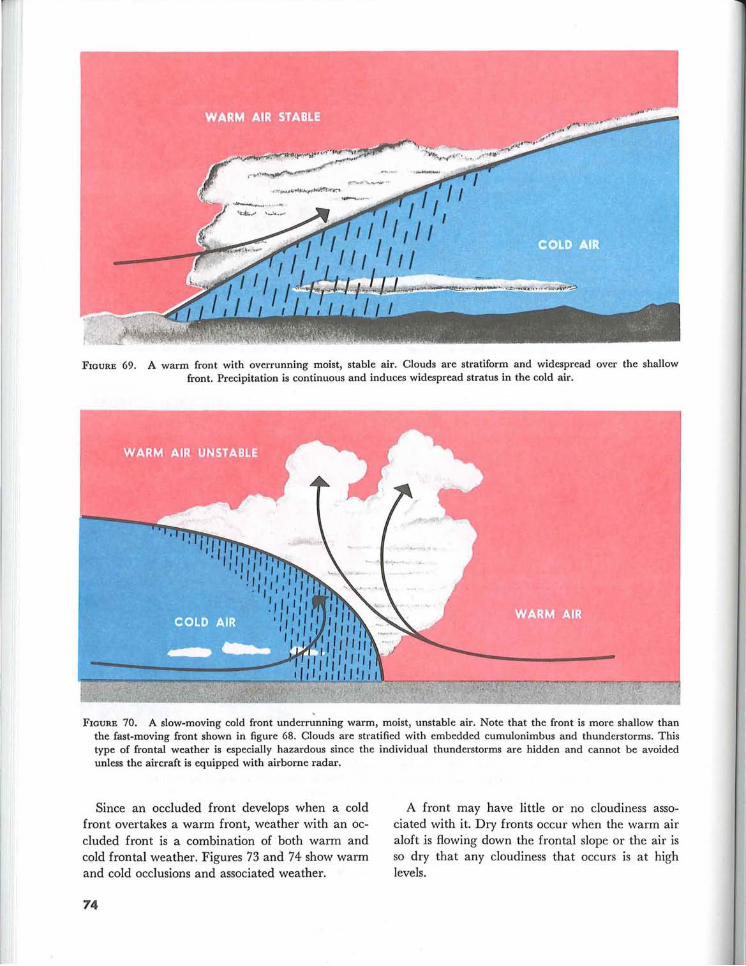
FIGURE 69. A warm front with overrunning moist, stable air. Clouds are stratiform and widespread over the shallow front . Precipitation is continuous and induces widespread stratus in the cold air.
FIGURE 70. A slow-moving cold front underrunning warm, moist, unstable air. Note that the front is more shallow than the fast-moving front shown in figure 68. Clouds are stratified with embedded cumulonimbus and thunderstorms. This type of frontal weather is especially hazardous since the individual thunderstorms are hidden and cannot be avoided unless the aircraft is equipped with airborne radar.
Since an occluded front develops when a cold front overtakes a warm front, weather with an occluded front is a combination of both warm and cold frontal weather. Figures 73 and 74 show warm and cold occlusions and associated weather.
74
A front may have little or no cloudiness associated with it. Dry fronts occur when the warm air aloft is flowing down the frontal slope or the air is so dry that any cloudiness that occurs is at high levels.
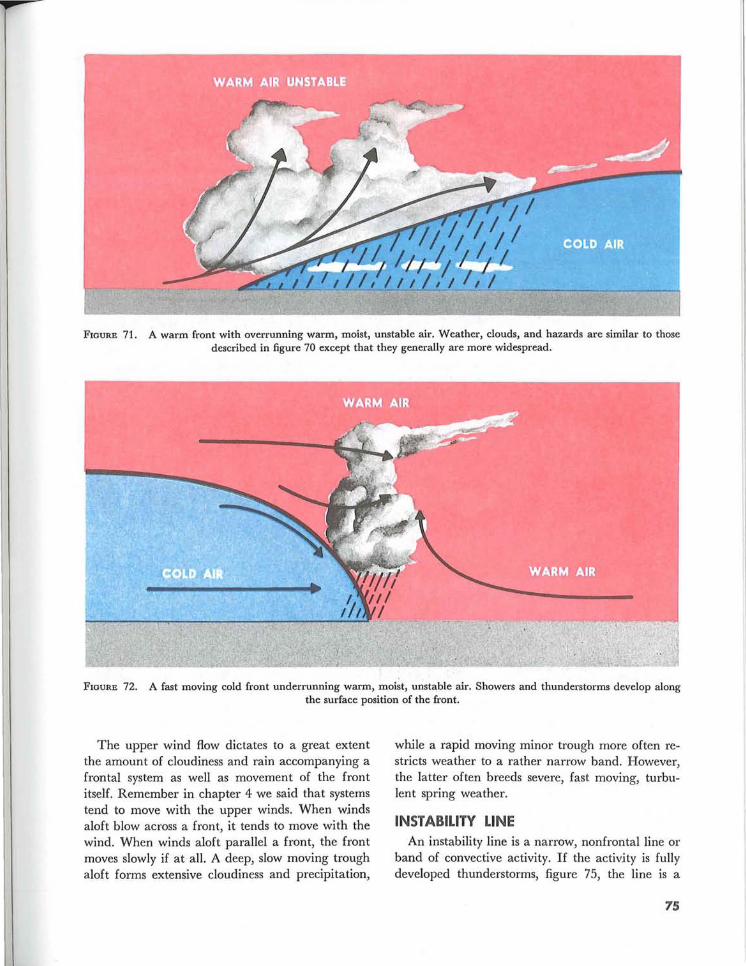
FIGURE 71. A warm front with overrunning warm, moist, unstable air. Weather, clouds, and hazards are similar to those described in figure 70 except that they generally are more widespread.
FIGURE 72. A fast moving cold front underrunning warm, moist, unstable air. Showers and thunderstorms develop along the surface position of the front.
The upper wind flow dictates to a great extent the amount of cloudiness and rain accompanying a frontal system as well as movement of the front itself. Remember in chapter 4 we said that systems tend to move with the upper winds. When winds aloft blow across a front, it tends to move with the wind. When winds aloft parallel a front, the front moves slowly if at all. A deep, slow moving trough aloft forms extensive cloudiness and precipitation,
while a rapid moving minor trough more often restricts weather to a rather narrow band. However, the latter often breeds severe, fast moving, turbulent spring weather.
INSTABILITY LINE An instability line is a narrow, non frontal line or
band of convective activity. If the activity is fully developed thunderstorms, figure 75, the line is a
75

FIGURE 73. A warm front occlusion lifting warm, moist, unstable air. Note that the associated weather is complex and encompasses all types of weather associated with both the warm and cold fronts when air is moist and unstable.
FIGURE 74. A cold front occlusion lifting warm, moist, stable air. Associated weather encompasses types of weather associated with both warm and cold fronts when air is moist and stable.
squall line (chapter 11, "Thunderstorms"). Instability lines form in moist unstable air. An instability line may develop far from any front. More often, it develops ahead of a cold front, and sometimes a series of these lines move out ahead of the front. A favored location for instability lines which frequently erupt into severe thunderstorms is a dew point front or dry line.
76
DEW POINT FRONT OR DRY LINE
During a considerable part of the year, dew point fronts are common in Western Texas and New Mexico northward over the Plains States. Moist air flowing north from the Gulf of Mexico abuts the dryer and therefore slightly denser air flowing from the southwest. Except for moisture
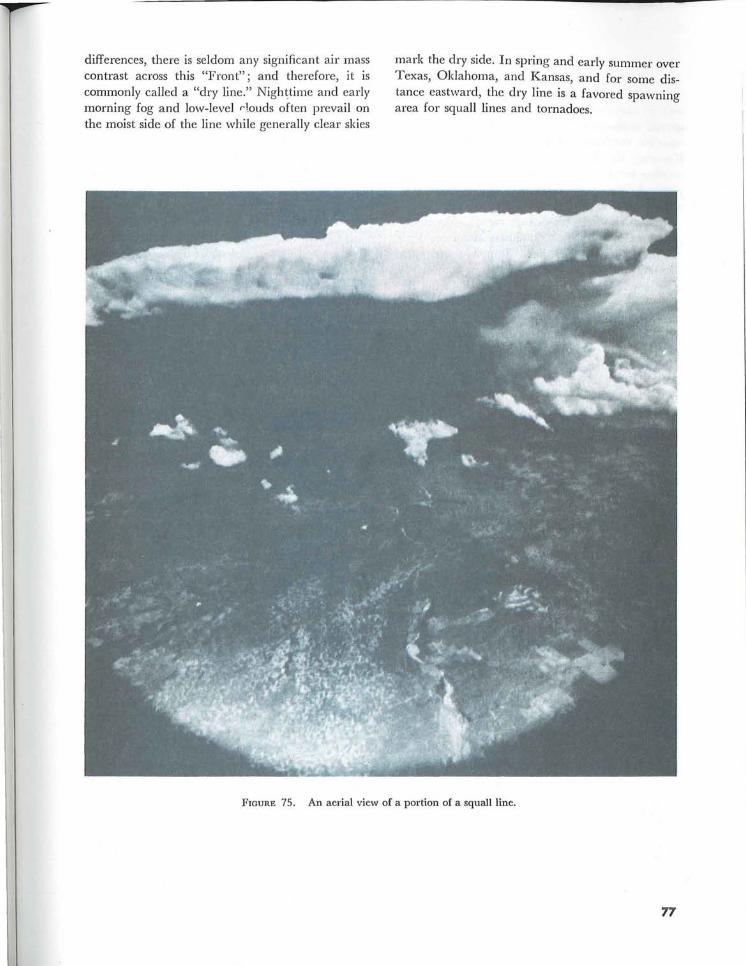
differences, there is seldom any significant air mass contrast across this "Front"; and therefore, it is commonly called a "dry line." Nighttime and early morning fog and low-level r1.ouds often prevail on the moist side of the line while generally clear skies
mark the dry side. In spring and early summer over Texas, Oklahoma, and Kansas, and for some distance eastward, the dry line is a favored spawning area for squall lines and tornadoes.
FIGURE 75. An aerial view of a portion of a squal l line.
77
FRONTS AND FLIGHT PLANNING
Surface weather charts pictorially portray fronts and, in conjunction with other forecast charts and special analyses, aid you in determining expected weather conditions along your proposed route. Knowing the locations of fronts and associated weather helps you determine if you can proceed as planned. Often you can change your route to avoid adverse weather.
Frontal weather may change rapidly. For example, there may be only cloudiness associated with a cold front over northern Illinois during the morning but with a strong squall line forecast by afternoon. Skies may be partly cloudy during the afternoon over Atlanta in advance of a warm front, but by sunset drizzle and dense fog are forecast. A cold front in Kansas is producing turbulent thun-
78
derstorms, but by midnight the upper flow is expected to dissipate the thunderstorms and weaken the front. A Pacific front is approaching Seattle and is expected to produce heavy rain by midnight.
A mental picture of what is happening and what is forecast should greatly aid you in avoiding adverse weather conditions. If unexpected adverse weather develops en route, your mental picture aids you in planning the best diversion. If possible, always obtain a good preflight weather briefing.
We suggest you again look at figures 67 through 75 and review weather conditions associated with different types of fronts and stability conditions. These are only a few of many possibilities, but they should give some help during preflight planning or inflight diversion.
Chapter 9 TURBULENCE
Everyone who flies encounters turbulence at some time or other. A turbulent atmosphere is one in which air currents vary greatly over short distances. These currents range from rather mild eddies to strong currents of relatively large dimensions. As an aircraft moves through these currents, it undergoes changing accelerations which jostle it from its smooth flight path. This jostling is turbulence. Turbulence ranges from bumpiness which can annoy crew and passengers to severe jolts which can structurally damage the aircraft or injure its passengers.
Aircraft reaction to turbulence varies with the difference in windspeed in adjacent currents, size of the aircraft, wing loading, airspeed, and aircraft attitude. When an aircraft travels rapidly from one current to another, it undergoes abrupt changes in acceleration. Obviously, if the aircraft moved more slowly, the changes in acceleration would be more gradual. The first rule in flying turbulence is to reduce airspeed. Your aircraft manual most likely lists recommended airspeed for penetrating turbulence.
Knowing where to expect turbulence helps a
79
pilot avoid or minimize turbulence discomfort and hazards. The main causes of turbulence are (1) convective currents, (2) obstructions to wind flow, and (3) wind shear. Turbulence also occurs in the
wake of moving aircraft whenever the airfoils exert lift-wake turbulence. Any combination of causes may occur at one time.
CONVECTIVE CURRENTS
Convective currents are a common cause of turbulence, especially at low altitudes. These currents
are localized vertical air movements, both ascending and descending. For every rising current, there
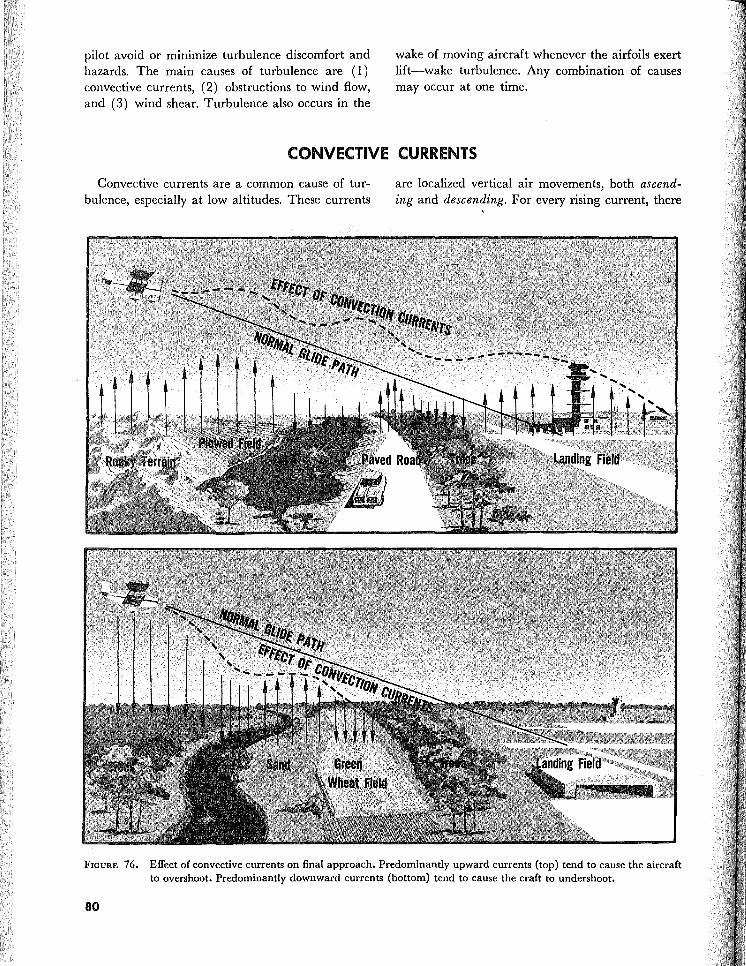
FIGURE 76. Effect of convective currents on final approach. Predominantly upward currents (top) tend to cause the aircraft to overshoot. Predominantly downward currents (bottom) tend to cause the craft to undershoot.
80
is a compensating downward current. The downward currents frequently occur over broader areas than do the upward currents, and therefore, they have a slower vertical speed than do the rising currents.
Convective currents are most active on warm summer afternoons when winds are light. Heated air at the surface creates a shallow, unstable layer, and the warm air is forced upward. Convection increases in strength and to greater heights as surface heating ircreases. Barren surfaces such as sandy or rocky wastelands and plowed fields become hotter than open water or ground covered by vegetation. Thus, air at and near the surface heats unevenly. Because of uneven heating, the strength of convective currents can vary considerably within short distances.
When cold air moves over a warm surface, it becomes unstable in lower levels. Convective currents extend several thousand feet above the surface resulting in rough, choppy turbulence when flying in the cold air. This condition often occurs in any season after the passage of a cold front.
Figure 76 illustrates the effect of low-level convective turbulence on aircraft approaching to land. Turbulence on approach can cause abrupt changes in airspeed and may even result in a stall at a dangerously low altitude. To prevent the danger,
-J
7\
increase airspeed slightly over normal approach speed. This procedure may appear to conflict with the rule of reducing airspeed for turbulence penetration; but remember, the approach speed for your aircraft is well below the recommended turbulence penetration speed.
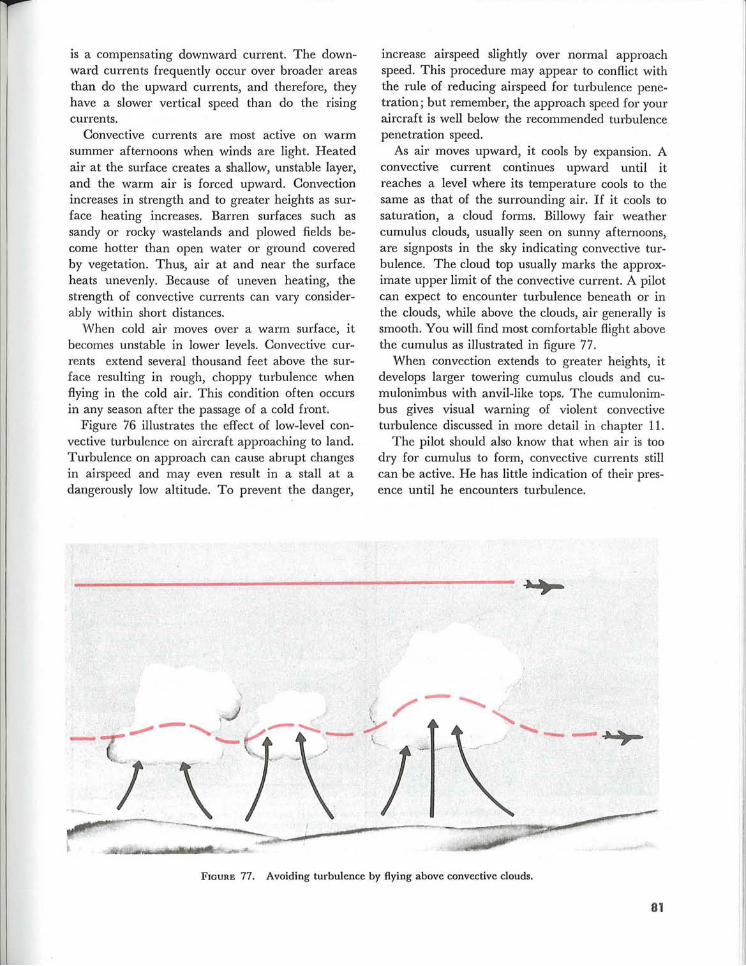
As air moves upward, it cools by expansion. A convective current continues upward until it reaches a level where its temperature cools to the same as that of the surrounding air. If it cools to saturation, a cloud forms. Billowy fair weather cumulus clouds, usually seen on sunny afternoons, are signposts in the sky indicating convective turbulence. The cloud top usually marks the approximate upper limit of the convective current. A pilot can expect to encounter turbulence beneath or in the clouds, while above the clouds, air generally is smooth. You will find most comfortable flight above the cumulus as illustrated in figure 77.
When convection extends to greater heights, it develops larger towering cumulus clouds and cumulonimbus with anvil-like tops. The cumulonimbus gives visual warning of violent convective turbulence discussed in more detail in chapter 11.
The pilot should also know that when air is too dry for cumulus to form, convective currents still can be active. He has little indication of their presence until he encounters turbulence .
. r , /
/ FIGURE 77. Avoiding turbulence by flying above convective clouds.
81
OBSTRUCTIONS TO WIND FLOW
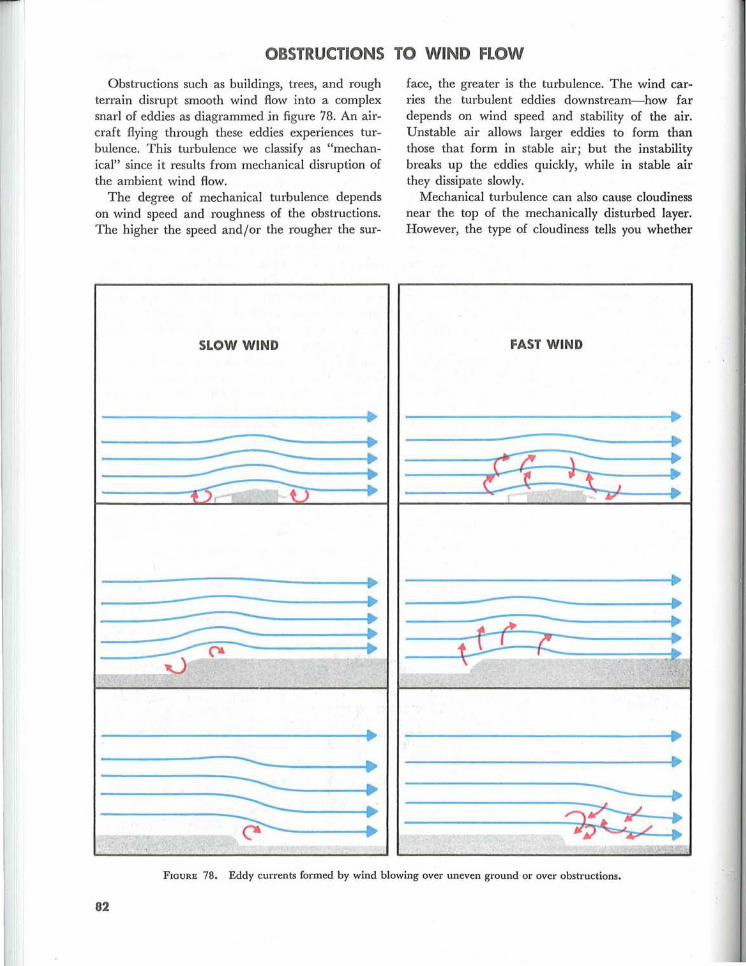
Obstructions such as buildings, trees, and rough terrain disrupt smooth wind flow into a complex snarl of eddies as diagrammed in figure 78. An aircraft flying through these eddies experiences turbulence. This turbulence we classify as "mechanical" since it results from mechanical disruption of the ambient wind flow.
The degree of mechanical turbulence depends on wind speed and roughness of the obstructions. The higher the speed and/or the rougher the sur-
SLOW WIND
• --- ---- • --- ---- • --- --- • ~) r' -1 tJ
.. ...
• • --- ---- • ~ • ~ • 0 ~
• ---- • ---- • ~ • r- •
_~'L' • . -.
face, the greater is the turbulence. The wind carries the turbulent eddies downstream-how far depends on wind speed and stability of the air. Unstable air allows larger eddies to form than those that form in stable air; but the instability breaks up the eddies quickly, while in stable air they dissipate slowly.
Mechanical turbulence can also cause cloudiness near the top of the mechanically disturbed layer. However, the type of cloudiness tells you whether
FAST WIND
• ---- • a 5:=1 : I -;. p
•• - • -- - • ~ ~ :
-~.
• • --- •
~ -~ --'-~ : FIGURE 78. Eddy currents formed by wind blowing over uneven ground or over obstructions.
82
it is from mechanical or convective mixing. Mechanical mixing produces stratocumulus clouds in rows or bands, while convective clouds form a random pattern. The cloud rows developed by mechanical mixing may be parallel to or perpendicular to the wind depending on meteorological factors which we do not discuss here.
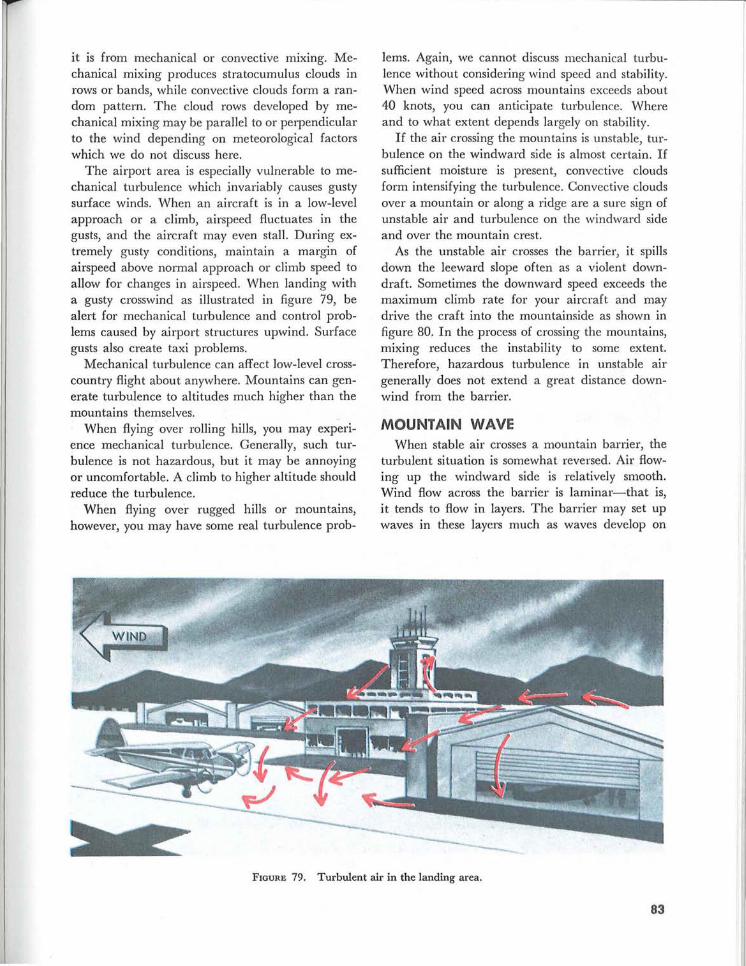
The airport area is especially vulnerable to mechanical turbulence which invariably causes gusty surface winds. When an aircraft is in a low-level approach or a climb, airspeed fluctuates in the gusts, and the aircraft may even stall. During extremely gusty conditions, maintain a margin of airspeed above normal approach or climb speed to allow for changes in airspeed. When landing with a gusty crosswind as illustrated in figure 79, be alert for mechanical turbulence and control problems caused by airport structures upwind. Surface gusts also create taxi problems.
Mechanical turbulence can affect low-level crosscountry flight about anywhere. Mountains can generate turbulence to altitudes much higher than the mountains themselves.
When flying over rolling hills, you may experience mechanical turbulence. Generally, such turbulence is not hazardous, but it may be annoying or uncomfortable. A climb to higher altitude should reduce the turbulence.
When flying over rugged hills or mountains, however, you may have some real turbulence prob-
lems. Again, we cannot discuss mechanical turbulence without considering wind speed and stability. When wind speed across mountains exceeds about 40 knots, you can anticipate turbulence. Where and to what extent depends largely on stability.
If the air crossing the mountains is unstable, turbulence on the windward side is almost certain. If sufficient moisture is present, convective clouds form intensifying the turbulence. Convective clouds over a mountain or along a ridge are a sure sign of unstable air and turbulence on the windward side and over the mountain crest.
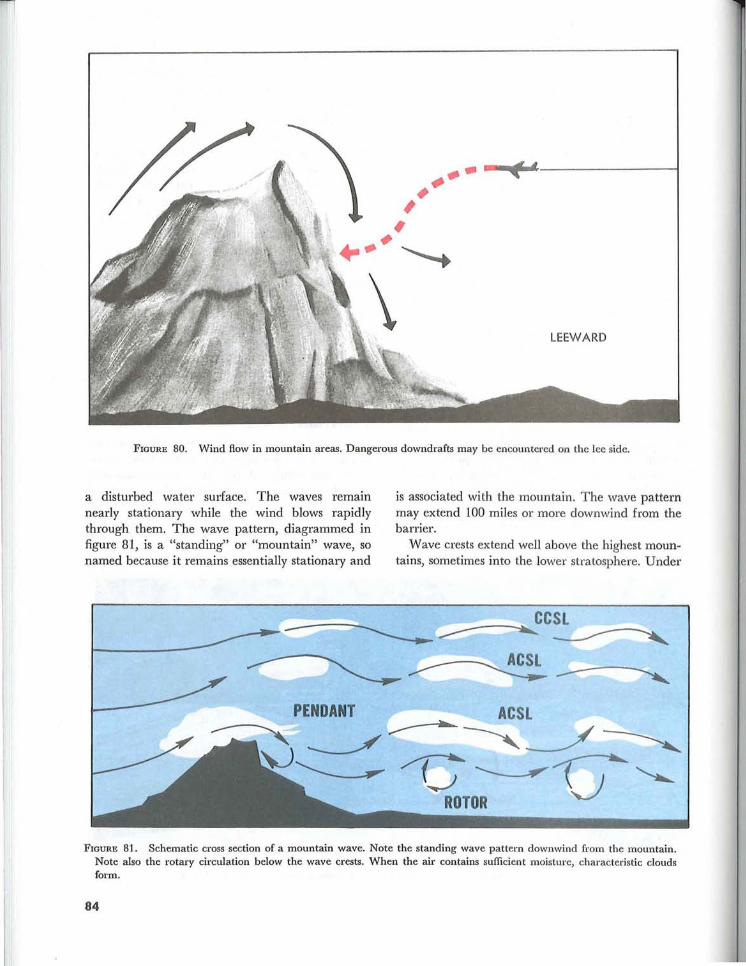
As the unstable air crosses the barrier, it spills down the leeward slope often as a violent downdraft. Sometimes the downward speed exceeds the maximum climb rate for your aircraft and may drive the craft into the mountainside as shown in figure 80. In the process of crossing the mountains, mixing reduces the instability to some extent. Therefore, hazardous turbulence in unstable air generally does not extend a great distance downwind from the barrier.
MOUNTAIN WAVE When stable air crosses a mountain barrier, the
turbulent situation is somewhat reversed. Air flowing up the windward side is relatively smooth. Wind flow across the barrier is laminar-that is, it tends to flow in layers. The barrier may set up waves in these layers much as waves develop on
FIGURE 79. Turbulent air in the landing area.
83
.. ~ c ____________________ ~
LEEWARD
FIGURE 80. Wind flow in mountain areas. Dangerous downdrafts may be encountered on the lee side.
a disturbed water surface. The waves rem am nearly stationary while the wind blows rapidly through them. The wave pattern, diagrammed in figure 81, is a "standing" or "mountain" wave, so named because it remains essentially stationary and
is associated with the mountain. T he wave pattern may extend 100 miles or more downwind from the barrier.
Wave crests extend well above the highest mountains, sometimes into the lower stratosphere. Under
FIGURE 81. Schematic cross section of a mountain wave. Note the standing wave pattern downwind from the mountain. Note also the rotary circulation below the wave crests. When the air contains sufficient moisture, characteristic clouds form.
84
each wave crest is a rotary circulation also diagrammed in figure 81. The "rotor" forms below the elevation of the mountain peaks. Turbulence can be violent in the overturnillg rotor. Updrafts and downdrafts in the waves can also create violent turbulence.
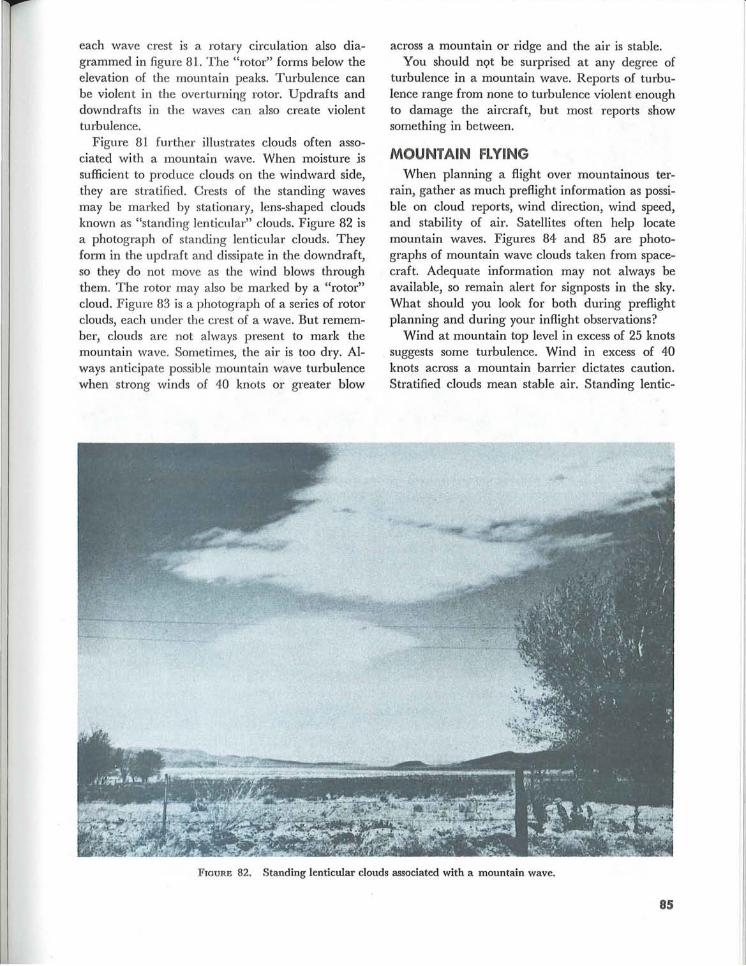
Figure 81 further illustrates clouds often associated with a mountain wave. When moisture is sufficien t to produce clouds on the windward side, they are stratified. Crests of the standing waves may be marked by stationary, lens-shaped clouds known as "standing lenticular" clouds. Figure 82 is a photograph of standing lenticular clouds. They form in the updraft and dissipate in the downdraft, so they do not move as the wind blows through them. The rotor may also be marked by a "rotor" cloud. Figure 83 is a photograph of a series of rotor clouds, each under the crest of a wave. But remember, clouds are not always present to mark the mountain wave. Sometimes, the air is too dry. Always anticipate possible mountain wave turbulence when strong winds of 40 knots or greater blow
across a mountain or ridge and the air is stable. You should n<;>t be surprised at any degree of
turbulence in a mountain wave. Reports of turbulence range from none to turbulence violent enough to damage the aircraft, but most reports show something in between.
MOUNTAIN FLYING When planning a flight over mountainous ter
rain, gather as much preflight information as possible on cloud reports, wind direction, wind speed, and stability of air. Satellites often help locate mountain waves. Figures 84 and 85 are photographs of mountain wave clouds taken from spacecraft. Adequate information may not always be available, so remain alert for signposts in the sky. What should you look for both during preflight planning and during your inflight observations?
Wind at mountain top level in excess of 25 knots suggests some turbulence. Wind in excess of 40 knots across a mountain barrier dictates caution. Stratified clouds mean stable air. Standing lentic-
FIGURE 82. Standing lenticular clouds associated with a mountain wave.
85
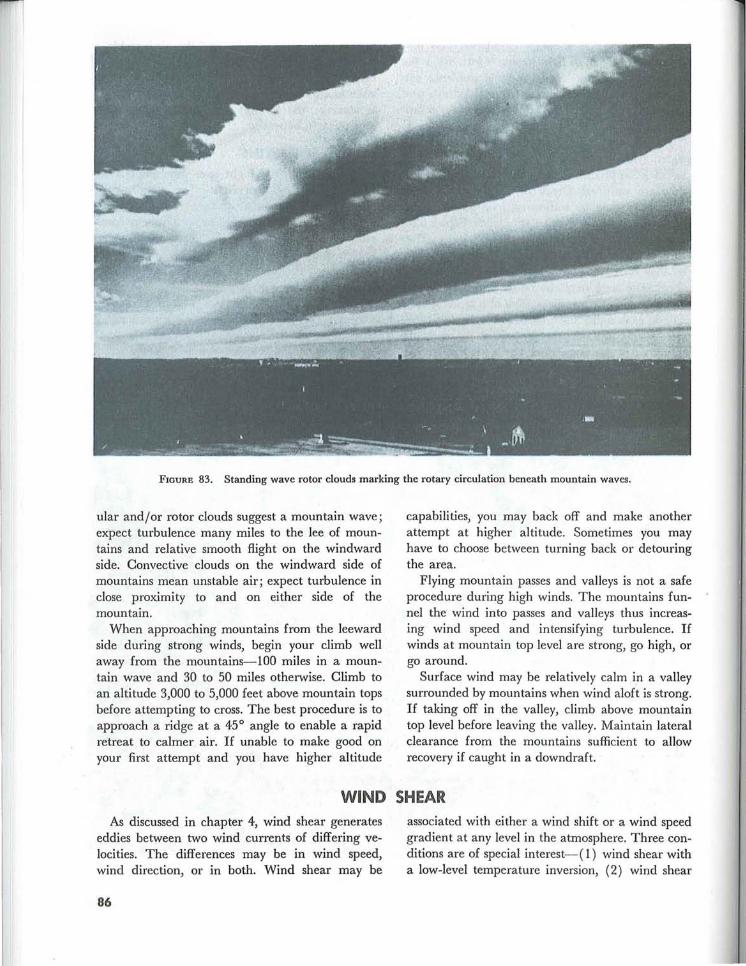
FIGURE 83. Standing wave rotor clouds marking the rotary circulation beneath mountain waves.
ular and/or rotor clouds suggest a mountain wave; expect turbulence many miles to the lee of mountains and relative smooth flight on the windward side. Convective clouds on the windward side of mountains mean unstable air; expect turbulence in close proximity to and on either side of the mountain.
When approaching mountains from the leeward side during strong winds, begin your climb well away from the mountains-100 miles in a mountain wave and 30 to 50 miles otherwise. Climb to an altitude 3,000 to 5,000 feet above mountain tops before attempting to cross. The best procedure is to approach a ridge at a 45° angle to enable a rapid retreat to calmer air. If unable to make good on your first attempt and you have higher altitude
capabilities, you may back off and make another attempt at higher altitude. Sometimes you may have to choose between turning back or detouring the area.
Flying mountain passes and valleys is not a safe procedure during high winds. The mountains funnel the wind into passes and valleys thus increasing wind speed and intensifying turbulence. If winds at mountain top level are strong, go high, or go around.
Surface wind may be relatively calm in a valley surrounded by mountains when wind aloft is strong. If taking off in the valley, climb above mountain top level before leaving the valley. Maintain lateral clearance from the mountains sufficient to allow recovery if caught in a downdraft.
WIND SHEAR As discussed in chapter 4, wind shear generates
eddies between two wind currents of differing velocities. The differences may be in wind speed, wind direction, or in both. Wind shear may be
86
associated with either a wind shift or a wind speed gradient at any level in the atmosphere. Three conditions are of special interest-( 1) wind shear with a low-level temperature inversion, (2) wind shear
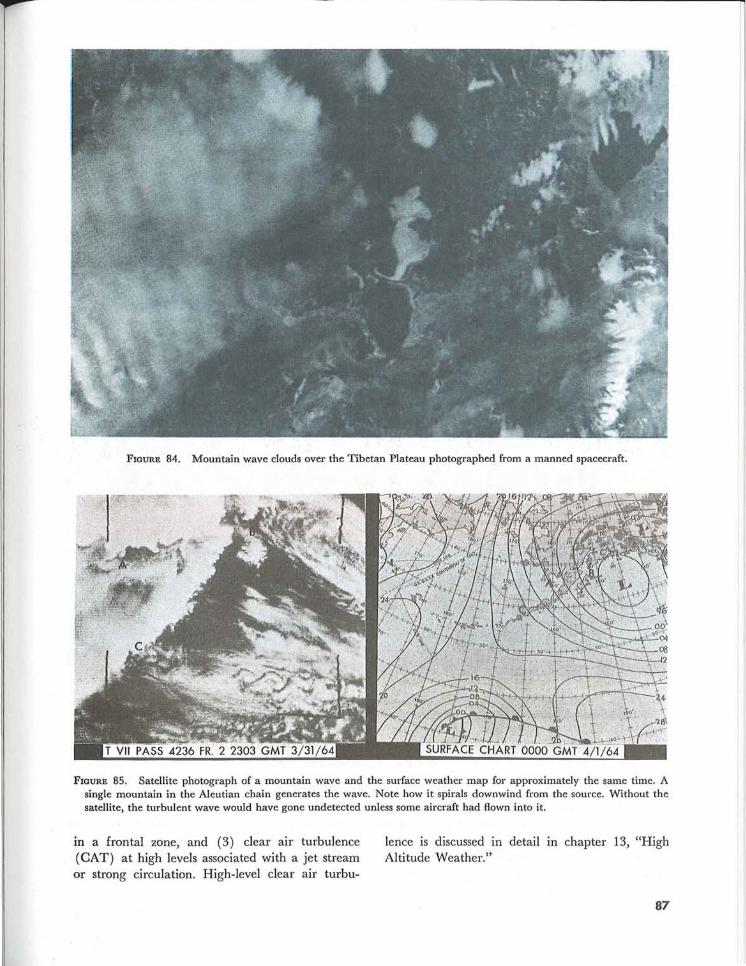
FIGURE 84. Mountain wave clouds over the Tibetan Plateau photographed from a manned spacecraft.
FIGURE 85. Satellite photograph of a mountain wave and the surface weather map for approximately the same time. A single mountain in the Aleutian chain generates the wave. Note how it spirals downwind from the source. Without the satellite, the turbulent wave would have gone undetected unless some aircraft had flown into it.
in a frontal zone, and (3) clear air turbulence (CAT) at high levels associated with a jet stream or strong circulation. High-level clear air turbu-
lence is discussed in detail in chapter 13, "High Altitude Weather."
87
WIND SHEAR WITH A LOW-LEVEL TEMPERATURE INVERSION
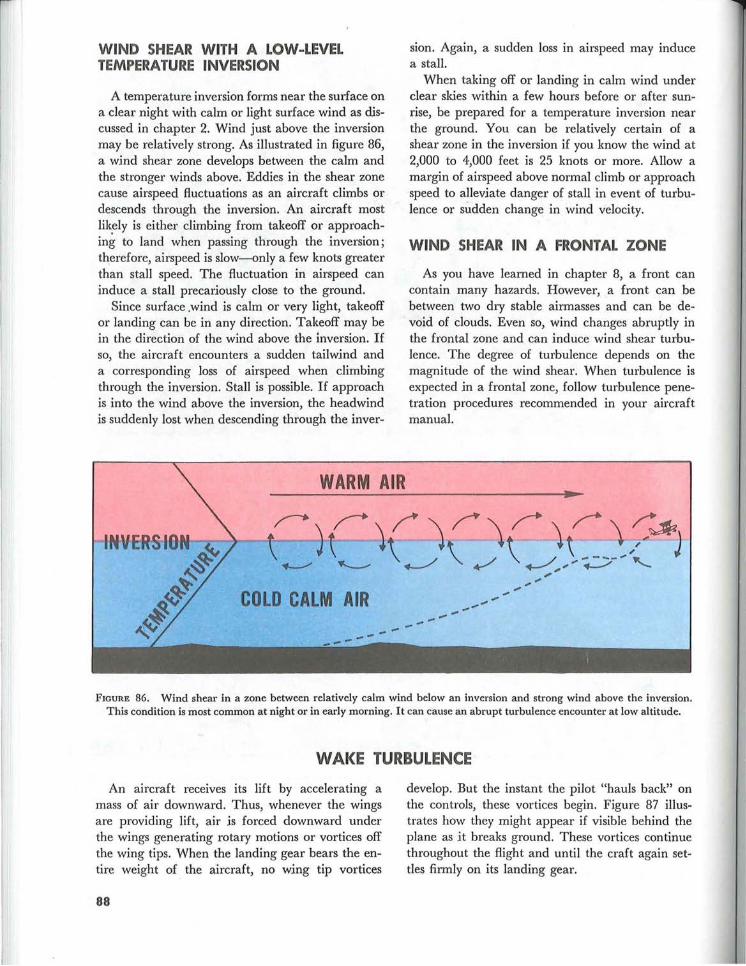
A temperature inversion forms near the surface on a clear night with calm or light surface wind as discussed in chapter 2. Wind just above the inversion may be relatively strong. As illustrated in figure 86, a wind shear zone develops between the calm and the stronger winds above. Eddies in the shear zone cause airspeed fluctuations as an aircraft climbs or descends through the inversion. An aircraft most likely is either climbing from takeoff or approaching to land when passing through the inversion; therefore, airspeed is slow-only a few knots greater than stall speed. The fluctuation in airspeed can induce a stall precariously close to the ground.
Since surface .wind is calm or very light, takeoff or landing can be in any direction. Takeoff may be in the direction of the wind above the inversion. If so, the aircraft encounters a sudden tailwind and a corresponding loss of airspeed when climbing through the inversion. Stall is possible. If approach is into the wind above the inversion, the headwind is suddenly lost when descending through the inver-
WARM AIR
COLD CALM AIR
sion. Again, a sudden loss in airspeed may induce a stall.
When taking off or landing in calm wind under clear skies within a few hours before or after sunrise, be prepared for a temperature inversion near the ground. You can be relatively certain of a shear zone in the inversion if you know the wind at 2,000 to 4,000 feet is 25 knots or more. Allow a margin of airspeed above normal climb or approach speed to alleviate danger of stall in event of turbulence or sudden change in wind velocity.
WIND SHEAR IN A FRONTAL ZONE
As you have learned in chapter 8, a front can contain many hazards. However, a front can be between two dry stable airmasses and can be devoid of clouds. Even so, wind changes abruptly in the frontal zone and can induce wind shear turbulence. The degree of turbulence depends on the magnitude of the wind shear. When turbulence is expected in a frontal zone, follow turbulence penetration procedures recommended in your aircraft manual.
FIGURE 86. Wind shear in a zone between relatively calm wind below an inversion and strong wind above the inversion. This condition is most common at night or in early morning. It can cause an abrupt turbulence encounter at low altitude.
WAKE TURBULENCE
An aircraft receives its lift by accelerating a mass of air downward. Thus, whenever the wings are providing lift, air is forced downward under the wings generating rotary motions or vortices off the wing tips. When the landing gear bears the entire weight of the aircraft, no wing tip vortices
88
develop. But the instant the pilot "hauls back" on the controls, these vortices begin. Figure 87 illustrates how they might appear if visible behind the plane as it breaks ground. These vortices continue throughout the flight and until the craft again settles firmly on its landing gear.
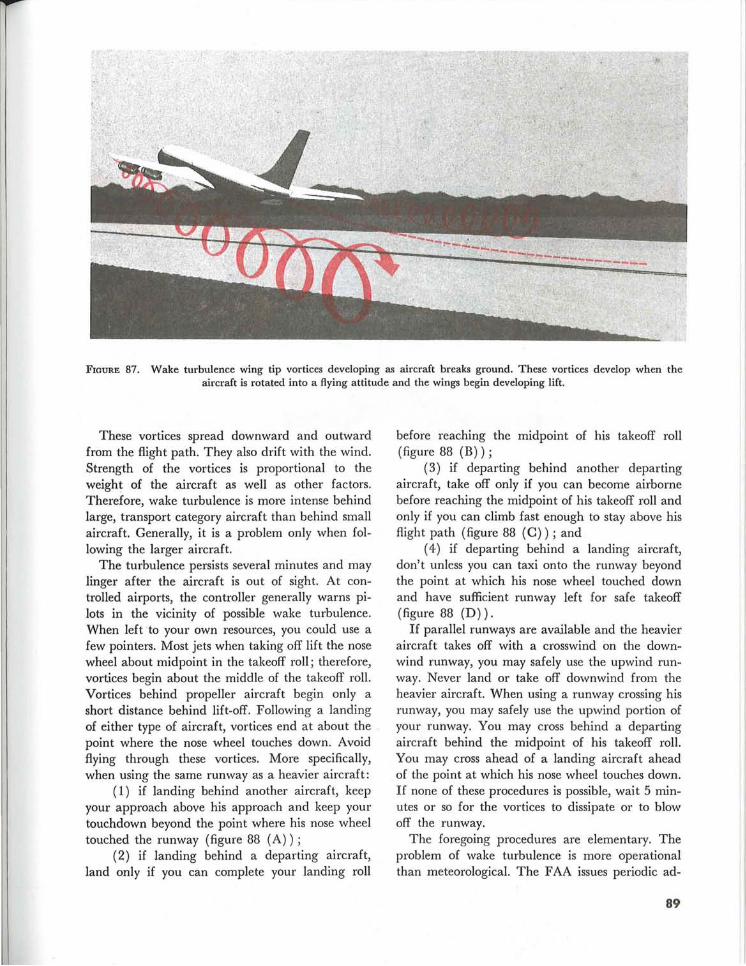
FIGURE 87. Wake turbulence wing tip vortices developing as aircraft breaks ground. These vortices develop when the aircraft is rotated into a flying attitude and the wings begin developing lift.
These vortices spread downward and outward from the flight path. They also drift with the wind. Strength of the vortices is proportional to the weight of the aircraft as well as other factors. Therefore, wake turbulence is more intense behind large, transport category aircraft than behind small aircraft. Generally, it is a problem only when fol lowing the larger aircraft.
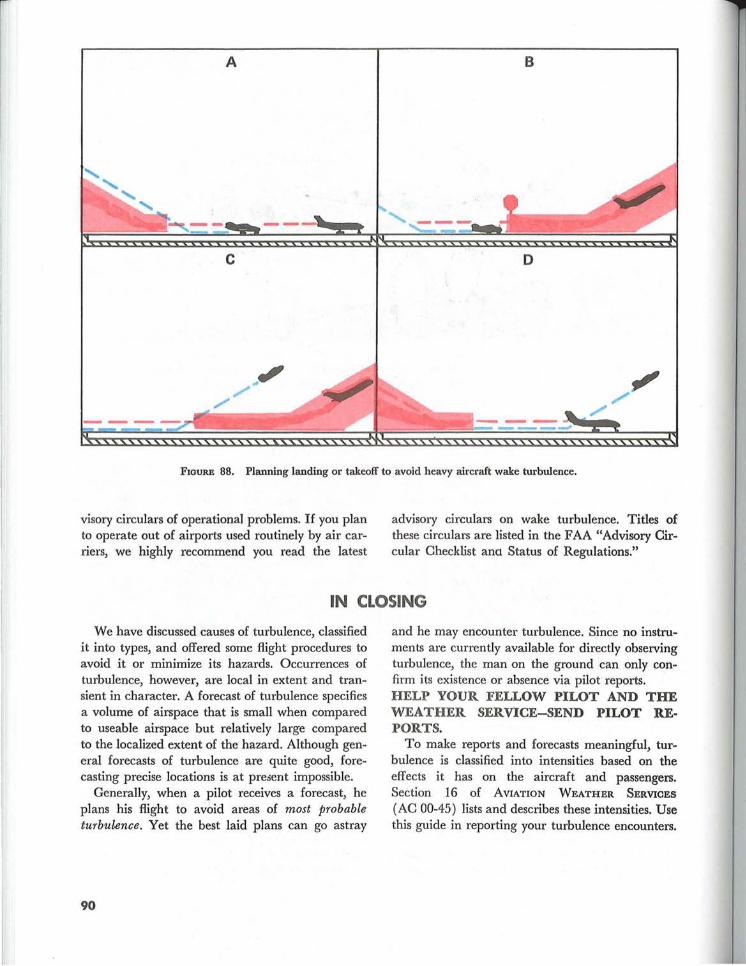
The turbulence persists several minutes and may linger after the aircraft is out of sight. At controlled airports, the controller generally warns pilots in the vicinity of possible wake turbulence. When left to your own resources, you could use a few pointers. Most jets when taking off lift the nose wheel about midpoint in the takeoff roll; therefore, vortices begin about the middle of the takeoff roll. Vortices behind propeller aircraft begin only a short distance behind lift-off. Following a landing of either type of aircraft, vortices end at about the . point where the nose wheel touches down. Avoid flying through these vortices. More specifically, when using the same runway as a heavier aircraft:
(1) if landing behind another aircraft, keep your approach above his approach and keep your touchdown beyond the point where his nose wheel touched the runway (figure 88 (A));
(2) if landing behind a departing aircraft, land only if you can complete your landing roll
before reaching the midpoint of his takeoff roll (figure 88 (B));
(3) if departing behind another departing aircraft, take off only if you can become airborne before reaching the midpoint of his takeoff roll and only if you can climb fast enough to stay above his flight path (figure 88 (C)) ; and
( 4) if departing behind a landing aircraft, don't unless you can taxi onto the runway beyond the point at which his nose wheel touched down and have sufficient runway left for safe takeoff (figure 88 (D)).
If parallel runways are available and the heavier aircraft takes off with a crosswind on the downwind runway, you may safely use the upwind runway. Never land or take off downwind from the heavier aircraft. When using a runway crossing his runway, you may safely use the upwind portion of your runway. You may cross behind a departing aircraft behind the midpoint of his takeoff roll. You may cross ahead of a landing aircraft ahead of the point at which his nose wheel touches down. If none of these procedures is possible, wait 5 minutes or so for the vortices to dissipate or to blow off the runway.
The foregoing procedures are elementary. The problem of wake turbulence is more operational than meteorological. The FAA issues periodic ad-
89
A B
c D
------.,.,.
FIGURE 88. Planning landing or takeoff to avoid heavy aircraft wake turbulence.
visory circulars of operational problems. If you plan to operate out of airports used routinely by air carriers, we highly recommend you read the latest
advisory circulars on wake turbulence. Titles of these circulars are listed in the FAA "Advisory Circular Checklist ana Status of Regulations."
IN CLOSING
We have discussed causes of turbulence, classified it into types, and offered some flight procedures to avoid it or minimize its hazards. Occurrences of turbulence, however, are local in extent and transient in character. A forecast of turbulence specifies a volume of airspace that is small when compared to useable airspace but relatively large compared to the localized extent of the hazard. Although general forecasts of turbulence are quite good, forecasting precise locations is at present impossible.
Generally, when a pilot receives a forecast, he plans his flight to avoid areas of most probable turbulence. Yet the best laid plans can go astray
90
and he may encounter turbulence. Since no instruments are currently available for directly observing turbulence, the man on the ground can only confirm its existence or absence via pilot reports. HELP YOUR FELLOW PILOT AND THE WEATHER SERVlCE-SEND PILOT REPORTS.
To make reports and forecasts meaningful, turbulence is classified into intensities based on the effects it has on the aircraft and passengers. Section 16 of AVIATION WEATHER SERVICES (AC 00-45) lists and describes these intensities. Use this guide in reporting your turbulence encounters.