chapter 11 n o emissions from managed soils, and co ... · chapter 11: n 2 o emissions from managed...
TRANSCRIPT

Chapter 11: N2O Emissions from Managed Soils, and CO2 Emissions from Lime and Urea Application
2019 Refinement to the 2006 IPCC Guidelines for National Greenhouse Gas Inventories 11.1
CH APTE R 11
N2O EMISSIONS FROM MANAGED
SOILS, AND CO2 EMISSIONS FROM
LIME AND UREA APPLICATION
Volume 4: Agriculture, Forestry and Other Land Use
11.2 2019 Refinement to the 2006 IPCC Guidelines for National Greenhouse Gas Inventories
Authors
Kristell Hergoualc’h (France), Hiroko Akiyama (Japan), Martial Bernoux (FAO), Ngonidzashe Chirinda (CGIAR,
Zimbabwe), Agustin del Prado (Spain), Åsa Kasimir (Sweden), James Douglas MacDonald (Canada), Stephen
Michael Ogle (USA), Kristiina Regina (Finland), Tony John van der Weerden (New Zealand)
Contributing Authors
Chang Liang (Canada), Alasdair Noble (New Zealand)

Chapter 11: N2O Emissions from Managed Soils, and CO2 Emissions from Lime and Urea Application
2019 Refinement to the 2006 IPCC Guidelines for National Greenhouse Gas Inventories 11.3
Contents
11. N2O Emissions from Managed Soils, and CO2 emissions from Lime and Urea Application ................. 11.5
11.1 Introduction ....................................................................................................................................... 11.5
11.2 Nitrous oxide (N2O) Emissions from Managed Soils ....................................................................... 11.5
11.2.1 Direct N2O emissions ............................................................................................................. 11.5
11.2.1.1 Choice of method ........................................................................................................ 11.6
11.2.1.2 Choice of emission factors ........................................................................................ 11.11
11.2.1.3 Choice of activity data .............................................................................................. 11.13
11.2.1.4 Uncertainty assessment ............................................................................................. 11.21
11.2.2 Indirect N2O emissions ........................................................................................................ 11.21
11.2.2.1 Choice of method ...................................................................................................... 11.22
11.2.2.2 Choice of emission, volatilisation and leaching factors ............................................ 11.25
11.2.2.3 Choice of activity data .............................................................................................. 11.26
11.2.2.4 Uncertainty assessment ............................................................................................. 11.27
11.2.3 Completeness, Time series, QA/QC .................................................................................... 11.27
11.3 CO2 Emissions from Liming ........................................................................................................... 11.27
11.4 CO2 Emissions from Urea Fertilization ........................................................................................... 11.27
Annex 11A.1 References for crop residue data in Table 11.2 ................................................... 11.28
Annex 11A.2 Estimation of Default Emission Factor(s) for EF1 .............................................. 11.29
Annex 11A.3 Estimation of Default Emission Factor(s) for EF1FR ........................................... 11.32
Annex 11A.4 Estimation of Default Emission Factor(s) for EF3PRP .......................................... 11.33
Annex 11A.5 Estimation of Default Emission Factor(s) for EF4 .............................................. 11.35
Annex 11A.6 Estimation of Default Emission Factor(s) for EF5 .............................................. 11.36
Annex 11A.7 Estimation of Default Factor(s) for FracGASF ...................................................... 11.37
Annex 11A.8 Estimation of Default Factor for FracGASM .......................................................... 11.39
Annex 11A.9 Estimation of Default Factor for FracLEACH-(H) .................................................... 11.40
References ............................................................................................................................ 11.41
Equations
Equation 11.1 Direct N2O emissions from managed soils (Tier 1) .............................................. 11.6
Equation 11.2 Direct N2O emissions from managed soils (Tier 2) .............................................. 11.8
Equation 11.3 N from organic N additions applied to soils (Tier 1) .......................................... 11.13
Equation 11.4 N from animal manure applied to soils (Tier 1) .................................................. 11.14
Equation 11.5 N in urine and dung deposited by grazing animals on pasture, range and paddock
(Tier 1) ................................................................................................................ 11.14
Equation 11.6 (Updated) N from crop residues and forage/pasture renewal (tier 1) ................................... 11.15
Equation 11.7 Dry-weight correction of reported crop yields .................................................... 11.16

Volume 4: Agriculture, Forestry and Other Land Use
11.4 2019 Refinement to the 2006 IPCC Guidelines for National Greenhouse Gas Inventories
Equation 11.8 N mineralised in mineral soils as a result of loss of soil C through change in land use
or management (Tiers 1 and 2) ........................................................................... 11.20
Equation 11.9 N2O from atmospheric deposition of N volatilised from managed soils (Tier 1) 11.22
Equation 11.10 N2O from N leaching/runoff from managed soils in regions where leaching/runoff
occurs (Tier 1) ..................................................................................................... 11.23
Equation 11.11 N2O from atmospheric deposition of N volatilised from managed soils (Tier 2) 11.24
Figure
Figure 11.1 Schematic diagram illustrating the sources and pathways of N that result in direct
and indirect N2O emissions from soils and waters ................................................ 11.9
Figure 11.2 Decision tree for direct N2O emissions from managed soils ............................... 11.10
Figure 11.3 Decision tree for indirect N2O emissions from managed soils ............................ 11.23
Tables
Table 11.1 (Updated) Default emission factors to estimate direct N2O emissions from managed soils ...... 11.12
Table 11.1a (New) Default values for N AG(T), N BG(T), R AG(T), RS (T) and DRY to be used in Equations 11.6
and 11.7 ..................................................................................................................... 11.17
Table 11.2 (Updated) Alternative method and data for estimating above-ground residue (AGDM (T)) a .. 11.19
Table 11.3 (Updated) Default emission, volatilisation and leaching factors for indirect soil N2O emissions
.................................................................................................................................. 11.26
Table 2A.1 Sample size, mean, and uncertainty range of the EF1 disaggregated by length of the
experiment (days) and n application rate (kg n ha-1 period-1) .................................... 11.30
Table 2A.2 Sample size, mean, and uncertainty range of the EF1 disaggregated by climate, fertiliser
form and irrigation practice ....................................................................................... 11.31
Table 4A.1 EF values for cattle and sheep dung and urine, in wet and dry climates ................... 11.34
Table 5A.1 Results from review papers of N addition experiments in non-agricultural sites ...... 11.35
Table 5A.2 Results from review papers of N2O emissions and N deposition conducted at non-
agricultural sites ........................................................................................................ 11.35
Table 7A.1 Fertiliser consumption in the period 2007-2015 expressed as thousand tonnes nutrients
and % of total fertiliser consumed (source: IFA: http://ifadata.fertilizer.org/ ) ......... 11.37
Table 7A.2 Assumptions on the potential mix of different IFA fertiliser products ..................... 11.37
Table 7A.3 Emission factors for % NH3–N and NOx-N (N applied) –1) from different fertiliser types
resulting from two meta-analysis and number of studies involved ........................... 11.38
Table 8A.1 Emission factors for NH3–N and NOx-N (N applied –1) from manure or slurry
application and excreta patches ................................................................................. 11.39

Chapter 11: N2O Emissions from Managed Soils, and CO2 Emissions from Lime and Urea Application
2019 Refinement to the 2006 IPCC Guidelines for National Greenhouse Gas Inventories 11.5
11. N2O EMISSIONS FROM MANAGED SOILS, AND
CO2 EMISSIONS FROM LIME AND UREA
APPLICATION
Users are expected to go to Mapping Tables in Annex 1 Volume 4 (AFOLU), before reading this chapter. This is
required to correctly understand both the refinements made and how the elements in this chapter relate to the
corresponding chapter in the 2006 IPCC Guidelines.
11.1 INTRODUCTION
No refinement.
11.2 NITROUS OXIDE (N2O) EMISSIONS FROM
MANAGED SOILS
This section presents the methods and equations for estimating total national anthropogenic emissions of N2O
(direct and indirect) from managed soils. The generic equations presented here can also be used for estimating
N2O within specific land-use categories or by condition-specific variables (e.g., N additions to rice paddies) if the
country can disaggregate the activity data to that level (i.e., N use activity within a specific land use).
Nitrous oxide is produced naturally in soils through the processes of nitrification and denitrification. Nitrification
is the aerobic microbial oxidation of ammonium to nitrate, and denitrification is the anaerobic microbial reduction
of nitrate to nitrogen gas (N2). Nitrous oxide is a gaseous intermediate in the reaction sequence of denitrification
and a by-product of nitrification that leaks from microbial cells into the soil and ultimately into the atmosphere.
One of the main controlling factors in this reaction is the availability of inorganic N in the soil. This methodology,
therefore, estimates N2O emissions using human-induced net N additions to soils (e.g., synthetic or organic
fertilisers, deposited manure, crop residues, sewage sludge), or of mineralisation of N in soil organic matter
following drainage/management of organic soils, or cultivation/land-use change on mineral soils (e.g., Forest
Land/Grassland/Settlements converted to Cropland).
The emissions of N2O that result from anthropogenic N inputs or N mineralisation occur through both a direct
pathway (i.e., directly from the soils to which the N is added/released), and through two indirect pathways: (i)
following volatilisation of ammonia (NH3) and nitrogen oxides (NOx) from managed soils and from fossil fuel
combustion and biomass burning, and the subsequent redeposition of these gases and their products NH4+ and
NO3- to soils and waters; and (ii) after leaching and runoff of N, mainly as NO3
-, from managed soils. The principal
pathways are illustrated in Figure 11.1.
Direct emissions of N2O from managed soils are estimated separately from indirect emissions, though using a
common set of activity data. The Tier 1 methodologies do not take into account different land cover, soil type,
climatic conditions or management practices (other than specified below). Neither do they take account of any lag
time for direct emissions from crop residue N, and allocate these emissions to the year in which the residues are
returned to the soil. These factors are not considered for direct or (where appropriate, indirect) emissions because
limited data are available to provide appropriate emission factors. Countries that have data to show that default
factors are inappropriate for their country should utilise Tier 2 equations or Tier 3 approaches and include a full
explanation for the values used.
11.2.1 Direct N2O emissions
In most soils, an increase in available N enhances nitrification and denitrification rates which then increase the
production of N2O. Increases in available N can occur through human-induced N additions or change of land-use
and/or management practices that mineralise soil organic N.
The following N sources are included in the methodology for estimating direct N2O emissions from managed soils:
synthetic N fertilisers (FSN);
organic N applied as fertiliser (e.g., animal manure, compost, sewage sludge, rendering waste, waste water
effluent) (FON);
urine and dung N deposited on pasture, range and paddock by grazing animals (FPRP);

Volume 4: Agriculture, Forestry and Other Land Use
11.6 2019 Refinement to the 2006 IPCC Guidelines for National Greenhouse Gas Inventories
N in crop residues (above-ground and below-ground), including from N-fixing crops 1 and from forages during
pasture renewal 2 (FCR);
N mineralisation associated with loss of soil organic matter resulting from change of land use or management
of mineral soils (FSOM); and
Drainage/management of organic soils (i.e., Histosols) 3 (FOS).
11.2.1.1 CHOICE OF METHOD
The decision tree in Figure 11.2 provides guidance on which tier method to use.
Tier 1
In its most basic form, direct N2O emissions from managed soils are estimated using Equation 11.1 as follows:
EQUATION 11.1
DIRECT N2O EMISSIONS FROM MANAGED SOILS (TIER 1)
2 2 2 2Direct N inputs OS PRPN O N N O N N O N N O N
Where:
FRFRSOMCRONSN
SOMCRONSNinputsN
EFFFFF
EFFFFFNON
1
12
, , 2 , , , 2 ,
2 , , , 2 , , , , , 2 , ,
, , 2 ,
OS CG Temp CG Temp OS CG Trop CG Trop
OS OS F Temp NR F Temp NR OS F Temp NP F Temp NP
OS F Trop F Trop
F EF F EF
N O N F EF F EF
F EF
2 , 3 , , 3 ,PRP PRP CPP PRP CPP PRP SO PRP SON O N F EF F EF
Where:
2 DirectN O N = annual direct N2O–N emissions produced from managed soils, kg N2O–N yr-1
2 N inputsN O N = annual direct N2O–N emissions from N inputs to managed soils, kg N2O–N yr-1
2 OSN O N = annual direct N2O–N emissions from managed organic soils, kg N2O–N yr-1
1 Biological nitrogen fixation has been removed as a direct source of N2O because of the lack of evidence of significant
emissions arising from the fixation process itself (Rochette and Janzen, 2005). These authors concluded that the N2O
emissions induced by the growth of legume crops/forages may be estimated solely as a function of the above-ground and
below-ground nitrogen inputs from crop/forage residue (the nitrogen residue from forages is only accounted for during
pasture renewal). Conversely, the release of N by mineralisation of soil organic matter as a result of change of land use or
management is now included as an additional source. These are significant adjustments to the methodology previously
described in the 1996 IPCC Guidelines. Countries may consider a Tier 2 approach for disaggregating low-N concentration
crop residues from high-N concentration residues. Current knowledge shows no evidence for such a disaggregation at Tier 1
(Graham et al. 2017).
2 The nitrogen residue from perennial forage crops is only accounted for during periodic pasture renewal, i.e. not necessarily
on an annual basis as is the case with annual crops.
3 Soils are organic if they satisfy the requirements 1 and 2, or 1 and 3 below (FAO, 1998): 1. Thickness of 10 cm or more. A
horizon less than 20 cm thick must have 12 percent or more organic carbon when mixed to a depth of 20 cm; 2. If the soil is
never saturated with water for more than a few days, and contains more than 20 percent (by weight) organic carbon (about
35 percent organic matter); 3. If the soil is subject to water saturation episodes and has either: (i) at least 12 percent (by
weight) organic carbon (about 20 percent organic matter) if it has no clay; or (ii) at least 18 percent (by weight) organic
carbon (about 30 percent organic matter) if it has 60 percent or more clay; or (iii) an intermediate, proportional amount of
organic carbon for intermediate amounts of clay (FAO, 1998).

Chapter 11: N2O Emissions from Managed Soils, and CO2 Emissions from Lime and Urea Application
2019 Refinement to the 2006 IPCC Guidelines for National Greenhouse Gas Inventories 11.7
2 PRPN O N = annual direct N2O–N emissions from urine and dung inputs to grazed soils, kg N2O–N yr-
1
SNF = annual amount of synthetic fertiliser N applied to soils, kg N yr-1
ONF = annual amount of animal manure, compost, sewage sludge and other organic N additions
applied to soils (Note: If including sewage sludge, cross-check with Waste Sector to ensure
there is no double counting of N2O emissions from the N in sewage sludge), kg N yr-1
CRF = annual amount of N in crop residues (above-ground and below-ground), including N-fixing
crops, and from forage/pasture renewal, returned to soils, kg N yr-1
SOMF = annual amount of N in mineral soils that is mineralised, in association with loss of soil C
from soil organic matter as a result of changes to land use or management, kg N yr-1
OSF = annual area of managed/drained organic soils, ha (Note: the subscripts CG, F, Temp, Trop,
NR and NP refer to Cropland and Grassland, Forest Land, Temperate, Tropical, Nutrient
Rich, and Nutrient Poor, respectively)
PRPF = annual amount of urine and dung N deposited by grazing animals on pasture, range and
paddock, kg N yr-1 (Note: the subscripts CPP and SO refer to Cattle, Poultry and Pigs, and
Sheep and Other animals, respectively)
1EF = emission factor for N2O emissions from N inputs, kg N2O–N (kg N input)-1(Table 11.1)
1FREF = is the emission factor for N2O emissions from N inputs to flooded rice, kg N2O–N (kg N
input)-1 (Table 11.1) 4
2EF = emission factor for N2O emissions from drained/managed organic soils, kg N2O–N ha-1 yr-
1; (See guidance in 2013 Supplement to the 2006 IPCC Guidelines for National Greenhouse
Gas Inventories: Wetlands, Chapter 2, Table 2.5 where further disaggregation by climate and
land use is available) (Note: the subscripts CG, F, Temp, Trop, NR and NP refer to Cropland
and Grassland, Forest Land, Temperate, Tropical, Nutrient Rich, and Nutrient Poor,
respectively)
3PRPEF = emission factor for N2O emissions from urine and dung N deposited on pasture, range and
paddock by grazing animals, kg N2O–N (kg N input)-1; (Table 11.1) (Note: the subscripts
CPP and SO refer to Cattle, Poultry and Pigs, and Sheep and Other animals, respectively)
Conversion of N2O–N emissions to N2O emissions for reporting purposes is performed by using the following
equation:
N2O = N2O–N ● 44/28
Tier 2
If more detailed emission factors and corresponding activity data are available to a country than are presented in
Equation 11.1, further disaggregation of the terms in the equation can be undertaken. For example, if emission
factors and activity data are available for the application of synthetic fertilisers and organic N (FSN and FON) under
different conditions I, Equation 11.1 would be expanded to become 5:
4 When the total annual quantity of N applied to flooded paddy rice is known, this N input may be multiplied by a lower default
emission factor applicable to this crop, EF1FR (Table 11.1) or, where a country-specific emission factor has been determined,
by that factor instead.
5 It is important to note that Equation 11.2 is just one of many possible modifications to Equation 11.1 when using the Tier 2
method. The eventual form of Equation 11.2 will depend upon the availability of condition-specific emission factors and the
ability to which a country can disaggregate its activity data.
Volume 4: Agriculture, Forestry and Other Land Use
11.8 2019 Refinement to the 2006 IPCC Guidelines for National Greenhouse Gas Inventories
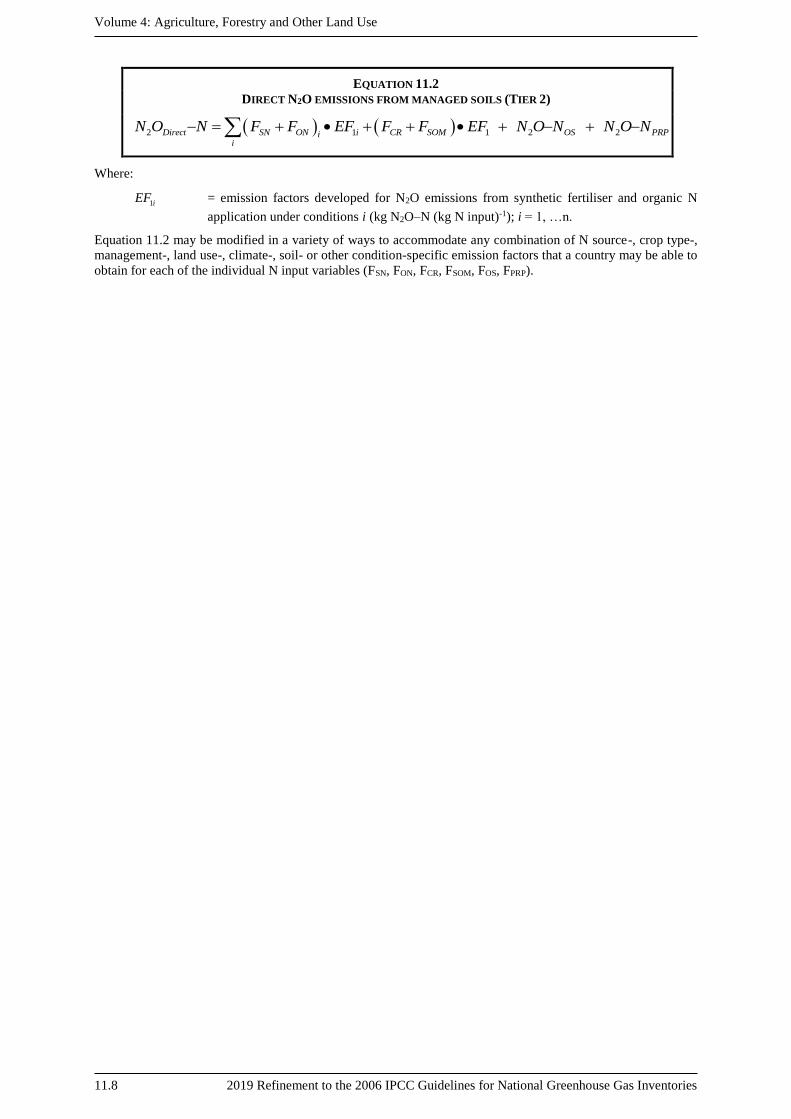
EQUATION 11.2
DIRECT N2O EMISSIONS FROM MANAGED SOILS (TIER 2)
2 1 1 2 2Direct SN ON i CR SOM OS PRPii
N O N F F EF F F EF N O N N O N
Where:
1iEF = emission factors developed for N2O emissions from synthetic fertiliser and organic N
application under conditions i (kg N2O–N (kg N input)-1); i = 1, …n.
Equation 11.2 may be modified in a variety of ways to accommodate any combination of N source-, crop type-,
management-, land use-, climate-, soil- or other condition-specific emission factors that a country may be able to
obtain for each of the individual N input variables (FSN, FON, FCR, FSOM, FOS, FPRP).
Chapter 11: N2O Emissions from Managed Soils, and CO2 Emissions from Lime and Urea Application
2019 Refinement to the 2006 IPCC Guidelines for National Greenhouse Gas Inventories 11.9
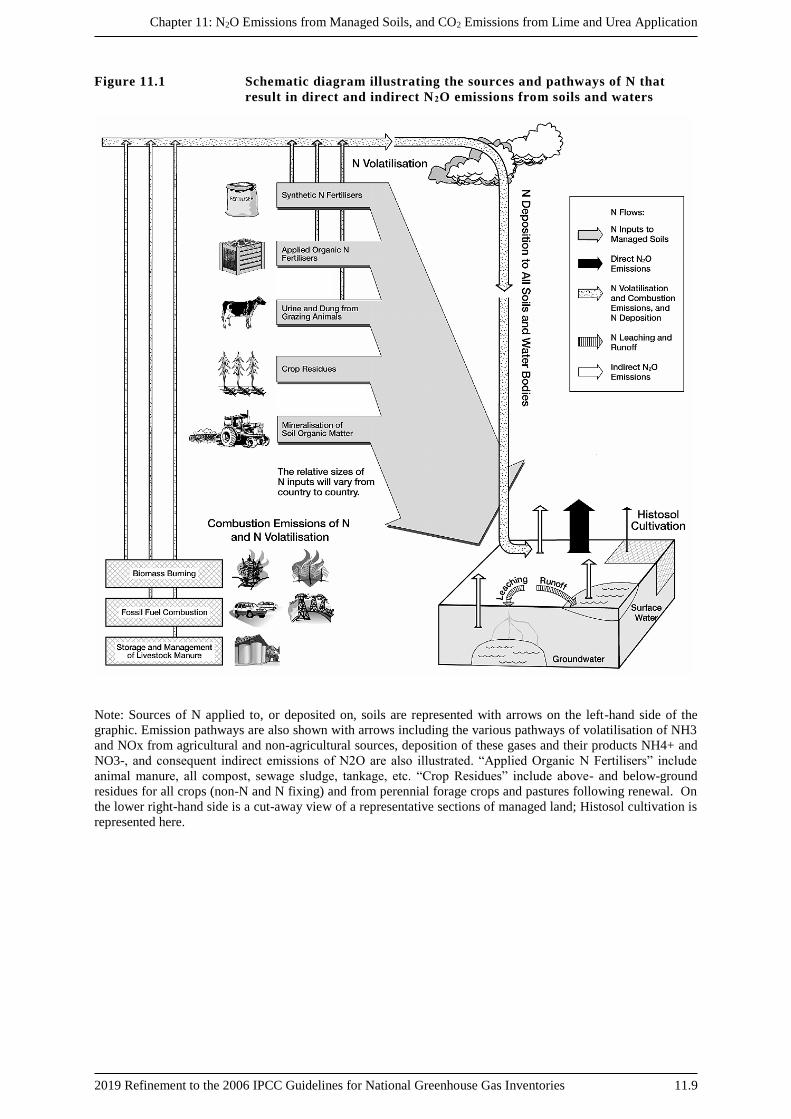
Figure 11.1 Schematic diagram illustrating the sources and pathways of N that
result in direct and indirect N2O emissions from soils and waters
Note: Sources of N applied to, or deposited on, soils are represented with arrows on the left-hand side of the
graphic. Emission pathways are also shown with arrows including the various pathways of volatilisation of NH3
and NOx from agricultural and non-agricultural sources, deposition of these gases and their products NH4+ and
NO3-, and consequent indirect emissions of N2O are also illustrated. “Applied Organic N Fertilisers” include
animal manure, all compost, sewage sludge, tankage, etc. “Crop Residues” include above- and below-ground
residues for all crops (non-N and N fixing) and from perennial forage crops and pastures following renewal. On
the lower right-hand side is a cut-away view of a representative sections of managed land; Histosol cultivation is
represented here.

Volume 4: Agriculture, Forestry and Other Land Use
11.10 2019 Refinement to the 2006 IPCC Guidelines for National Greenhouse Gas Inventories
Figure 11.2 Decision tree for direct N2O emissions from managed soils
Start
For
each N source ask:
Do you have country-specific
activity data1?
Do you
have rigorously
documented country-specific
emission factors
for EF1, EF2, and/or
EF3PRP?
Is this
a key category2 and is this
N source significant3?
Obtain country-
specific data
Estimate emissions using Tier 1 equations,
default emission factors, FAO activity data
for mineral N fertiliser use and livestock
populations, and expert opinion on other
activity data.
Estimate emissions using Tier 2 equation
and available country-specific emission
factors, or Tier 3 methods.
Estimate emissions using the Tier 1
default emission factor value and
country-specific activity data.
Note
1: N sources include: synthetic N fertiliser, organic N additions, urine and dung deposited during grazing, crop/forage residue, mineralisation
of N contained in soil organic matter that accompanies C loss from soils following a change in land use or management and dra inage/
management of organic soils. Other organic N additions (e.g. compost, sewage sludge, rendering waste) can be included in this calculation if
sufficient information is available. The waste input is measured in units of N and added as an additional source sub-term under FON in
Equation 11.1 to be multiplied by EF1.
2: See Volume 1 Chapter 4, "Methodological Choice and Identification of Key Categories" (noting Section 4.1.2 on limited resources), for
discussion of key categories and use of decision trees.
3: As a rule of thumb, a sub-category would be significant if it accounts for 25-30% of emissions from the source category.
Yes
Yes
No
Yes
No
No
Box 1: Tier 1
Box 2: Tier 1Box 3: Tier 2 or 3
Compilers can develop Tier 2 emission factors specific to mitigation options such as the application of nitrification
inhibitors (Akiyama et al. 2010, Ruser & Schulz 2015, Gilsanz et al. 2016). Compilers can also consider an
exponential response of N2O emissions to N application by developing country-specific emission factors (van
Groenigen et al. 2010, Shcherbak et al. 2014, Gerber et al. 2016). This method will require activity data on specific
fertiliser application rates to individual fields in order to apply rate-specific emission factors that capture the
exponential response 6. The influence of other environmental conditions, such as freeze-thaw cycles (Wagner-
Riddle et al. 2017) can also be addressed with the development of Tier 2 emission factors.
6 The Tier 1 method is designed as a simple method for estimating direct N2O emissions with top-down commodity data on
fertiliser production, import/export, or sales data. With these data, it is not possible to know the application rates to individual
fields, which is needed for emission factors that are adjusted with application rates. However, variable emission factors can
be developed with the Tier 2 method.

Chapter 11: N2O Emissions from Managed Soils, and CO2 Emissions from Lime and Urea Application
2019 Refinement to the 2006 IPCC Guidelines for National Greenhouse Gas Inventories 11.11
Conversion of N2O–N emissions to N2O emissions for reporting purposes is performed by using the following
equation:
N2O = N2O–N ● 44/28
Tier 3
Tier 3 methods are modelling or measurement approaches. Models are useful because in appropriate forms they
can relate the soil and environmental variables responsible for N2O emissions to the size of those emissions. These
relationships may then be used to predict emissions from whole countries or regions for which experimental
measurements are impracticable. Models should only be used after validation by representative experimental
measurements. Care should also be taken to ensure that the emission estimates developed through the use of models
or measurements account for all anthropogenic N2O emissions7. Guidance that provides a sound scientific basis
for the development of a Tier 3 Model-based Accounting System is given in Chapter 2, Section 2.5.
According to Equation 11.1, direct emissions of N2O from managed soils are calculated in the Tier 1 approach on
the basis of total N applied to soils as synthetic and organic fertilisers and/or soil N mineralisation. The processes
of run-off of N, volatilization of NH3 and NOx, emissions of N2O, and leaching of N, however, do not occur
simultaneously but in a sequence, with the peak of run-off and NH3+NOx volatilization happening before
emissions of N2O and losses of N through leaching. For example, an application technique affecting the
volatilization rate of NH3+NOx is likely to change the flow rates of subsequent processes. To illustrate, injecting
slurry instead of broadcasting the organic amendment may increase the availability of N for N2O emissions and/or
N-leaching, depending on climatic and soil conditions (Chadwick et al. 2011). It is therefore good practice to
carefully assess such ’pollution swapping’ effects when implementing a Tier 3 approach and adopting the N-flow
principle when estimating direct N2O emissions. The same applies when estimating indirect N2O emissions from
leaching and runoff (see Section 11.2.2.1). This adoption can be achieved by accounting for the decreased pool of
nitrogen that is available for direct N2O emissions (and nitrogen leaching).
11.2.1.2 CHOICE OF EMISSION FACTORS
Tiers 1 and 2
Three emission factors (EF) are needed to estimate direct N2O emissions from managed soils. The default values
presented here may be used in the Tier 1 equation or in the Tier 2 equation in combination with country-specific
emission factors. The first EF (EF1) refers to the amount of N2O emitted from the various synthetic and organic N
applications to soils, including crop residue and mineralisation of soil organic carbon in mineral soils due to land-
use change or management. The second EF (EF2) refers to the amount of N2O emitted from an area of
drained/managed organic soils, and the third EF (EF3PRP) estimates the amount of N2O emitted from urine and
dung N deposited by grazing animals on pasture, range and paddock. Default emission factors for the Tier 1 method
are summarised in Table 11.1. For EF2, see guidance in 2013 Supplement to the 2006 IPCC Guidelines for National
Greenhouse Gas Inventories: Wetlands, Chapter 2, Table 2.5.
The default value for EF1 has been set at 1percent of the N applied to soils or released through activities that result
in mineralisation of organic matter in mineral soils 8. Given the growing number of studies highlighting the role
of climate and fertiliser type in determining EF1 (Flechard et al. 2007, Aguilera et al. 2013, Cayuela et al. 2017),
alternative emission factors that are disaggregated by climatic zone and fertiliser type are also provided. In wet
climates, the default value has been set at 0.6percent of organic N inputs and 1.6percent of synthetic N inputs. In
dry climates, the default value has been set at 0.5percent of N inputs for both organic and synthetic N. These
alternative factor values for EF1 can be used by compilers that are able to disaggregate their activity data by
climate9 and fertiliser type. There are data to suggest that the emission factor could also be further disaggregated
as part of a Tier 2 method. This disaggregation could be based on (1) environmental factors (soil organic C content,
soil texture, drainage, soil pH and climate such as temperature and freeze-thaw cycle); and (2) management-related
7 Natural N2O emissions on managed land are assumed to be equal to emissions on unmanaged land. These latter emissions
are very low. Therefore, nearly all emissions on managed land are considered anthropogenic. Estimates using the IPCC
methodology are of the same magnitude as total measured emissions from managed land. Some Tier 3 methods may estimate
only part of or aggregate some of the emission sources. Developers of Tier 3 methods should be aware of which components
of Equation 11.2 are included in the estimate produced by their country-specific method.
8 The value of EF1 draw on a much larger number of measurements (see Annex 11A.2) than were available for the previous
value used for EF1 in the 2006 IPCC Guidelines (Bouwman et al. 2002a,b; Novoa & Tejeda 2006; Stehfest & Bouwman
2006).
9 Wet climates occur in temperate and boreal zones where the ratio of annual precipitation: potential evapotranspiration > 1,
and tropical zones where annual precipitation > 1000 mm. Dry climate occur in temperate and boreal zones where the ratio
of annual precipitation: potential evapotranspiration < 1, and tropical zones where annual precipitation < 1000 mm (cf. Figure
3.A.5.1 in Chapter 3 of Vol. 4 provides a map subdividing wet and dry climates based on these criteria).

Volume 4: Agriculture, Forestry and Other Land Use
11.12 2019 Refinement to the 2006 IPCC Guidelines for National Greenhouse Gas Inventories
factors (N application rate per fertiliser type; fertiliser type, liquid or solid form of organic fertiliser; irrigation and
type of crop with differences between legumes, non-leguminous arable crops, and grass) (e.g. Cayuela et al. 2017,
Chadwick et al. 2018, Rochette et al. 2018, Wagner-Riddle et al. 2017).
TABLE 11.1 (UPDATED)
DEFAULT EMISSION FACTORS TO ESTIMATE DIRECT N2O EMISSIONS FROM MANAGED SOILS
Emission factor
Aggregated Disaggregated
Default
value
Uncertainty
range Disaggregation4
Default
value
Uncertainty
range
EF1 for N additions from
synthetic fertilisers, organic
amendments and crop residues,
and N mineralised from
mineral soil as a result of loss
of soil carbon1 [kg N2O–N (kg
N)-1]
0.010 0.001 – 0.018
Synthetic fertiliser
inputs5 in wet climates 0.016 0.013 – 0.019
Other N inputs6 in wet
climates 0.006 0.001 – 0.011
All N inputs in dry
climates 0.005 0.000 – 0.011
EF1FR for flooded rice fields2,7
[kg N2O–N (kg N)-1] 0.004
0.000 – 0.029
Continuous flooding 0.003 0.000 – 0.010
Single and multiple
drainage 0.005 0.000 – 0.016
EF3PRP, CPP for cattle (dairy, non-
dairy and buffalo), poultry and
pigs3 [kg N2O–N (kg N)-1] 0.004 0.000– 0.014
Wet climates 0.006 0.000 – 0.026
Dry climates 0.002 0.000 – 0.006
EF3PRP, SO for sheep and ‘other
animals’3 [kg N2O–N (kg N)-1] 0.003 0.000 – 0.010 - - -
Sources:
1 Stehfest & Bouwman 2006; van Lent et al. 2015; Grace et al. 2016; van der Weerden et al. 2016; Albanito et al. 2017; Cayuela et al. 2017;
Liu et al. 2017; Rochette et al. 2018. 2 Akiyama et al. 2005; Albanito et al. 2017; Cayuela et al. 2017.
3 Yamulki et al. 1998; Galbally et al. 2000; Liebig et al. 2008; Cai & Akiyama 2016; Cardenas et al. 2016; Di et al. 2016; Hoogendoorn et al. 2016; Hyde et al. 2016; Krol et al. 2016; Li et al. 2016; Luo et al. 2016; Marsden et al. 2016; Misselbrook et al. 2016; Nichols et al. 2016;
O’Connor et al. 2016; Owens et al. 2016; Pelster et al. 2016; Ward et al. 2016; Balvert et al. 2017; Byrnes et al. 2017; Forrestal et al. 2017;
Marsden et al. 2017; Owens et al. 2017; Thomas et al. 2017a, b; Tully et al. 2017; van der Weerden et al. 2017; Cardoso et al. 2018;
Chadwick et al. 2018; Nichols et al. 2018.
Notes:
EF1: Uncertainty range of disaggregated EF1 based on the 95% confidence interval of fitted values. Uncertainty range of aggregated EF1 is
based on the 2.5th to 97.5th percentile of the dataset (See methods, data and results in Annex 11A.2).
EF1FR: Uncertainty range is based on the 2.5th to 97.5th percentile (See methods and data in Annex 11A.3).
EF3PRP, CPP and EF3PRP, SO: Uncertainty range is based on the 2.5th to 97.5th percentile (See methods and data in Annex 11A.4).
For EF2, see guidance in 2013 Supplement to the 2006 IPCC Guidelines for National Greenhouse Gas Inventories: Wetlands, Chapter 2,
Table 2.5. 4 Disaggregation of EF1 and EF3PRP, CPP by climate (based on long-term averages): Wet climates occur in temperate and boreal zones where
the ratio of annual precipitation: potential evapotranspiration > 1, and tropical zones where annual precipitation > 1000 mm. Dry climate
occur in temperate and boreal zones where the ratio of annual precipitation: potential evapotranspiration < 1, and tropical zones where annual precipitation < 1000 mm (cf. Figure 3.A.5.1 in Chapter 3 of Vol. 4 provides a map subdividing wet and dry climates based on these criteria).
In wet climates, the EF1 is further disaggregated by synthetic fertiliser N inputs and other N inputs.
5 This emission factor should be used for synthetic fertiliser applications, and fertiliser mixtures that include both synthetic and organic forms
of N.
6 Other N input refers to organic amendments, animal manures (e.g. slurries, digested manures), N in crop residues and mineralised N from
soil organic matter decomposition. 7 Disaggregation of EF1FR: Single and multiple drainage also include alternate wetting and drying. Disaggregated EF1FR for rain-fed and deep-
water systems not provided due to lack of data. The EF1 should be used for upland rice.
Compilers that are able to disaggregate their activity data from all or some of these factors may choose to use
disaggregated emission factors with the Tier 2 approach.
The default value for EF3PRP is 0.4percent of the N deposited by all animal types except ‘sheep’ and ‘other’ animals.
For these latter species, a default emission factor of 0.3percent of the N deposited may be used 10. EF3PRP for cattle,
10 This is an update on the 2006 IPCC Guidelines, with over 400 cattle and sheep dung and urine EF3 values collated from 13
countries (See Annex 11.4). As noted in the 2006 IPCC Guidelines, reasons for the lower EF3PRP for sheep include more
even urine distribution (smaller and more frequent urinations), and smaller effects on soil compaction during grazing. There

Chapter 11: N2O Emissions from Managed Soils, and CO2 Emissions from Lime and Urea Application
2019 Refinement to the 2006 IPCC Guidelines for National Greenhouse Gas Inventories 11.13
pigs and poultry (EF3PRP, CPP) is also disaggregated by wet and dry climates with values of 0.6percent and 0.2percent,
respectively. There is no difference in EF3PRP for sheep and other animals (EF3PRP, SO) when disaggregated into wet
and dry climates, therefore only an aggregated value is provided.
11.2.1.3 CHOICE OF ACTIVITY DATA
Tiers 1 and 2
This section describes generic methods for estimating the amount of various N inputs to soils (FSN, FON, FPRP, FCR,
FSOM, FOS) that are needed for the Tier 1 and Tier 2 methodologies (Equations 11.1 and 11.2).
Applied synthetic fertiliser (FSN)
The term FSN refers to the annual amount of synthetic N fertiliser applied to soils 11. It is estimated from the total
amount of synthetic fertiliser consumed annually. Annual fertiliser consumption data may be collected from
official country statistics, often recorded as fertiliser sales and/or as domestic production and imports. If country-
specific data are not available, data can be used from the International Fertilizer Association (IFA)
(http://www.fertilizer.org/ifa/statistics.asp) on total fertiliser use by type and by crop, or from the Food and
Agriculture Organisation of the United Nations (FAO) (http://fao.org/faostat/) on synthetic fertiliser consumption.
It may be useful to compare national statistics to international databases such as those of the IFA and FAO. If
sufficient data are available, fertiliser use may be disaggregated by fertiliser type, crop type and climatic regime
for major crops. These data may be useful in developing revised emission estimates if inventory methods are
improved in the future. It should be noted that most data sources (including FAO) might limit reporting to
agricultural N uses, although applications may also occur on Forest Land, Settlements, or other lands. This
unaccounted N is likely to account for a small proportion of the overall emissions. However, it is recommended
that countries seek out this additional information whenever possible.
Applied organic N fertilisers (FON)
The term “applied organic N fertiliser” (FON) refers to the amount of organic N inputs applied to soils other than
by grazing animals and is calculated using Equation 11.3. This includes applied animal manure, sewage sludge
applied to soil, compost applied to soils, as well as other organic amendments of regional importance to agriculture
(e.g., rendering waste, guano, brewery waste, etc.). Organic N fertiliser (FON) is calculated using Equation 11.3:
EQUATION 11.3
N FROM ORGANIC N ADDITIONS APPLIED TO SOILS (TIER 1)
ON AM SEW COMP OOAF F F F F
Where:
ONF = total annual amount of organic N fertiliser applied to soils other than by grazing animals,
kg N yr-1
AMF = annual amount of animal manure N applied to soils, kg N yr-1
SEWF = annual amount of total sewage N (coordinate with Waste Sector to ensure that sewage N is
not double-counted) that is applied to soils, kg N yr-1
are no or very limited data for N2O emission factors of other animal types, and the emission factor for poultry and swine is
assumed to be the same as for cattle. However, a value of 0.3% of the nitrogen deposited may be used for animals classified
as ‘other animals’ which includes goats, horses, mules, donkeys, camels, reindeer, and camelids, as these are likely to have
nitrogen excretion rates and patterns that are more similar to sheep than to cattle. For disaggregation of EF3 by dung and
urine nitrogen for each livestock group, see Annex 11.4.
11 For the Tier 1 approach, the amounts of applied mineral nitrogen fertilisers (FSN) and of applied organic nitrogen fertilisers
(FON) are no longer adjusted for the amounts of NH3 and NOx volatilisation after application to soil. This is a change from
the methodology described in the 1996 IPCC Guidelines. The reason for this change is that field studies that have determined
N2O emission factors for applied N were not adjusted for volatilisation when they were estimated. In other words, these
emission factors were determined from: fertiliser-induced N2O–N emitted / total amount of N applied, and not from: fertiliser-
induced N2O–N emitted / (total amount of N applied – NH3 and NOx volatilised). As a result, adjusting the amount of N
input for volatilisation before multiplying it with the emission factor would in fact underestimate total N2O emissions.
Countries using Tier 2 or Tier 3 approaches should be aware that correction for NH3/NOx volatilisation after mineral or
organic N application to soil may be required depending on the emission factor and/or the inventory methodology used.
Volume 4: Agriculture, Forestry and Other Land Use
11.14 2019 Refinement to the 2006 IPCC Guidelines for National Greenhouse Gas Inventories
COMPF = annual amount of total compost N applied to soils (ensure that manure N in compost is not
double-counted), kg N yr-1
OOAF = annual amount of other organic amendments used as fertiliser (e.g., rendering waste, guano,
brewery waste, etc.), kg N yr-1
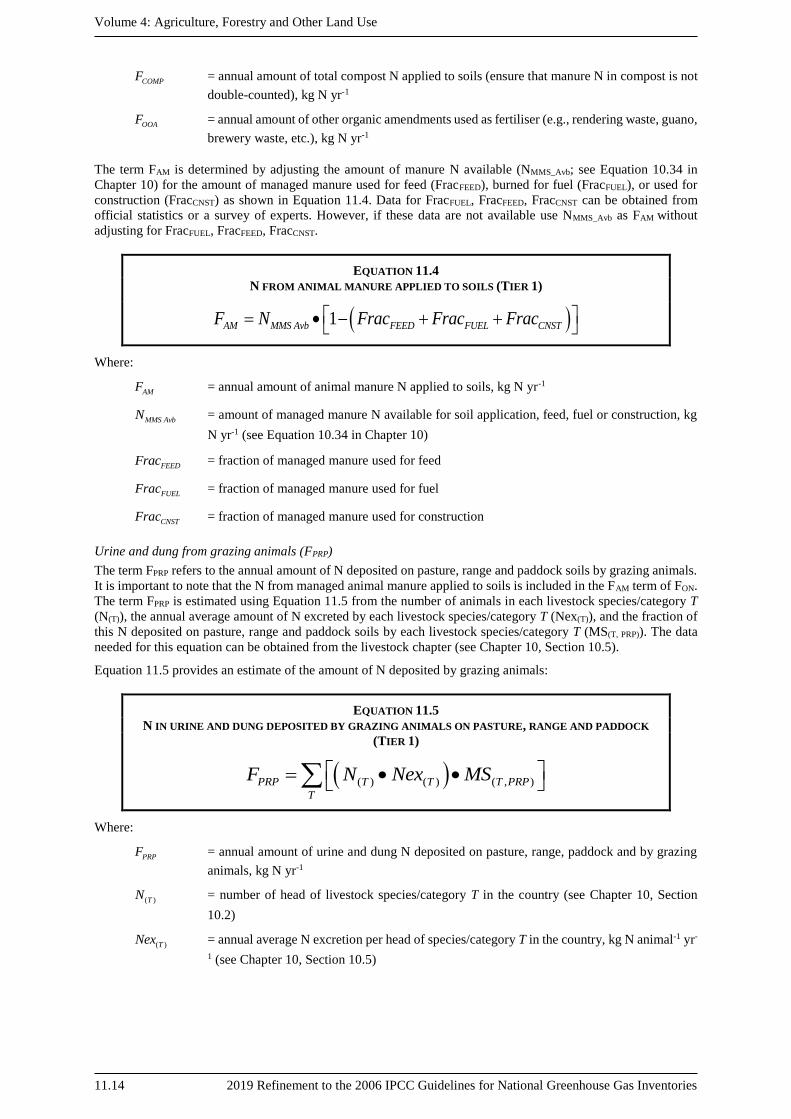
The term FAM is determined by adjusting the amount of manure N available (NMMS_Avb; see Equation 10.34 in
Chapter 10) for the amount of managed manure used for feed (FracFEED), burned for fuel (FracFUEL), or used for
construction (FracCNST) as shown in Equation 11.4. Data for FracFUEL, FracFEED, FracCNST can be obtained from
official statistics or a survey of experts. However, if these data are not available use NMMS_Avb as FAM without
adjusting for FracFUEL, FracFEED, FracCNST.
EQUATION 11.4
N FROM ANIMAL MANURE APPLIED TO SOILS (TIER 1)
1AM MMS Avb FEED FUEL CNSTF N Frac Frac Frac
Where:
AMF = annual amount of animal manure N applied to soils, kg N yr-1
MMS AvbN = amount of managed manure N available for soil application, feed, fuel or construction, kg
N yr-1 (see Equation 10.34 in Chapter 10)
FEEDFrac = fraction of managed manure used for feed
FUELFrac = fraction of managed manure used for fuel
CNSTFrac = fraction of managed manure used for construction
Urine and dung from grazing animals (FPRP)
The term FPRP refers to the annual amount of N deposited on pasture, range and paddock soils by grazing animals.
It is important to note that the N from managed animal manure applied to soils is included in the FAM term of FON.
The term FPRP is estimated using Equation 11.5 from the number of animals in each livestock species/category T
(N(T)), the annual average amount of N excreted by each livestock species/category T (Nex(T)), and the fraction of
this N deposited on pasture, range and paddock soils by each livestock species/category T (MS(T, PRP)). The data
needed for this equation can be obtained from the livestock chapter (see Chapter 10, Section 10.5).
Equation 11.5 provides an estimate of the amount of N deposited by grazing animals:
EQUATION 11.5
N IN URINE AND DUNG DEPOSITED BY GRAZING ANIMALS ON PASTURE, RANGE AND PADDOCK
(TIER 1)
( ) ( ) ( , )PRP T T T PRP
T
F N Nex MS
Where:
PRPF = annual amount of urine and dung N deposited on pasture, range, paddock and by grazing
animals, kg N yr-1
( )TN = number of head of livestock species/category T in the country (see Chapter 10, Section
10.2)
( )TNex = annual average N excretion per head of species/category T in the country, kg N animal-1 yr-
1 (see Chapter 10, Section 10.5)

Chapter 11: N2O Emissions from Managed Soils, and CO2 Emissions from Lime and Urea Application
2019 Refinement to the 2006 IPCC Guidelines for National Greenhouse Gas Inventories 11.15
( , )T PRPMS = fraction of total annual N excretion for each livestock species/category T that is deposited
on pasture, range and paddock12 (see Chapter 10, Section 10.5)
Crop residue N, including N-fixing crops and forage/ pasture renewal, returned to soils (FCR)
The term FCR refers to the amount of N in crop residues (above-ground and below-ground), including N-fixing
crops, returned to soils annually13. It also includes the N from N-fixing and non-N-fixing forages15 mineralized
during forage or pasture renewal14. It is estimated from crop yield statistics and default factors for above-/below-
ground residue:yield ratios and residue N contents. In addition, the method accounts for the effect of residue
burning or other removal of residues (direct emissions of N2O from residue burning are addressed under Chapter
2, Section 2.4. Because different crop types vary in residue:yield ratios, renewal time and N contents, separate
calculations should be performed for major crop types and then N values from all crop types are summed up. At a
minimum, it is recommended that crops be segregated into: 1) non-N-fixing grain crops (e.g., maize, rice, wheat,
barley); 2) N-fixing grains and pulses (e.g., soybean, dry beans, chickpea, lentils); 3) root and tuber crops (e.g.,
potato, sweet potato, cassava); 4) N-fixing forage crops (alfalfa, clover); and 5) other forages including perennial
grasses and grass/clover pastures. Equation 11.6 provides the equation to estimate N from crop residues and
forage/pasture renewal, for a Tier 1 approach. As regards crop residue N, a cross check with the amount of
NbeddingMS of the Equation 10.34 in “Managed manure N available for application to managed soils, feed, fuel or
construction use” (Volume 4, Chapter 10 Section 10.5.4) and “Field Burning of Agricultural Residue” (3F CRF
category – Volume 4, Chapter 5 Section 5.2.4), relative to the amount of agricultural residues that is returned to
soils other than the amount of agricultural residues that is removed for other purposes (e.g. bedding) or burnt
should be done, in order to eliminate the possibility of double counting.
EQUATION 11.6 (UPDATED)
N FROM CROP RESIDUES AND FORAGE/PASTURE RENEWAL (TIER 1)
( ) ( ) Re ( ) ( ) ( )1CR T AG T move T Burnt T f T BG TT
F AGR N Frac Frac C BGR N
( ) ( )2 2 – • 44 / 28ATDATDN O N O N
( ) ( )
( )T T DM T T T
M
Rene
D T AG TT
w TBGR Crop AG RS Area F
AG Crop R
rac
Where:
CRF = annual amount of N in crop residues (above and below ground), including N-fixing crops,
and from forage/pasture renewal, returned to soils annually, kg N yr-1
( )TAGR = annual total amount of above-ground crop residue for crop T, kg d.m. yr-1.
( )AG TN = N content of above-ground residues for crop T, kg N (kg d.m.) -1 (Table 11.1a)
Re ( )move TFrac = fraction of above-ground residues of crop T removed annually for purposes such as feed,
bedding and construction, dimensionless. Survey of experts in country is required to obtain
data. If data for FracRemove are not available, assume no removal
( )Burnt TFrac = fraction of annual harvested area of crop T burnt, dimensionless
fC = combustion factor (dimensionless) (refer to Chapter 2, Table 2.6)
12 In the livestock section, pasture, range and paddock is referred to as one of the manure management systems denoted as “S”.
13 The equation to estimate FCR has been modified from the previous 1996 IPCC Guidelines to account for the contribution of
the below-ground nitrogen to the total input of nitrogen from crop residues, which previously was ignored in the estimate of
FCR. As a result, FCR now represents a more accurate estimate of the amount of nitrogen input from crop residue, which
makes it possible to assess the contribution to residue nitrogen arising from the growth of forage legumes such as alfalfa,
where the harvesting of virtually all the above-ground dry matter results in no significant residue except the root system.
14 The inclusion of nitrogen from forage or pasture renewal is a change from previous 1996 IPCC Guidelines.
Volume 4: Agriculture, Forestry and Other Land Use
11.16 2019 Refinement to the 2006 IPCC Guidelines for National Greenhouse Gas Inventories
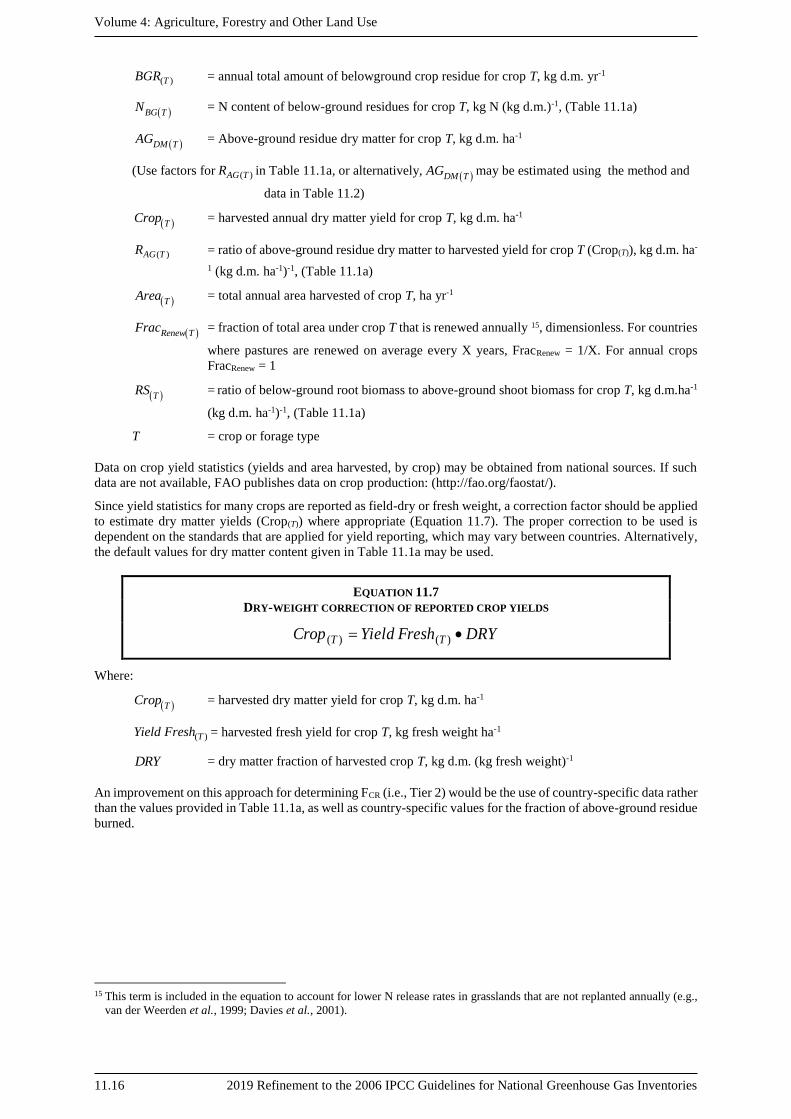
( )TBGR = annual total amount of belowground crop residue for crop T, kg d.m. yr-1
BG TN = N content of below-ground residues for crop T, kg N (kg d.m.)-1, (Table 11.1a)
DM TAG = Above-ground residue dry matter for crop T, kg d.m. ha-1
(Use factors for ( )AG TR in Table 11.1a, or alternatively, DM TAG may be estimated using the method and
data in Table 11.2)
TCrop = harvested annual dry matter yield for crop T, kg d.m. ha-1
( )AG TR = ratio of above-ground residue dry matter to harvested yield for crop T (Crop(T)), kg d.m. ha-
1 (kg d.m. ha-1)-1, (Table 11.1a)
TArea = total annual area harvested of crop T, ha yr-1
Renew TFrac = fraction of total area under crop T that is renewed annually 15, dimensionless. For countries
where pastures are renewed on average every X years, FracRenew = 1/X. For annual crops
FracRenew = 1
TRS = ratio of below-ground root biomass to above-ground shoot biomass for crop T, kg d.m.ha-1
(kg d.m. ha-1)-1, (Table 11.1a)
T = crop or forage type
Data on crop yield statistics (yields and area harvested, by crop) may be obtained from national sources. If such
data are not available, FAO publishes data on crop production: (http://fao.org/faostat/).
Since yield statistics for many crops are reported as field-dry or fresh weight, a correction factor should be applied
to estimate dry matter yields (Crop(T)) where appropriate (Equation 11.7). The proper correction to be used is
dependent on the standards that are applied for yield reporting, which may vary between countries. Alternatively,
the default values for dry matter content given in Table 11.1a may be used.
EQUATION 11.7
DRY-WEIGHT CORRECTION OF REPORTED CROP YIELDS
DRYFreshYieldCrop TT )()(
Where:
TCrop = harvested dry matter yield for crop T, kg d.m. ha-1
( )TYield Fresh = harvested fresh yield for crop T, kg fresh weight ha-1
DRY = dry matter fraction of harvested crop T, kg d.m. (kg fresh weight)-1
An improvement on this approach for determining FCR (i.e., Tier 2) would be the use of country-specific data rather
than the values provided in Table 11.1a, as well as country-specific values for the fraction of above-ground residue
burned.
15 This term is included in the equation to account for lower N release rates in grasslands that are not replanted annually (e.g.,
van der Weerden et al., 1999; Davies et al., 2001).

Chapter 11: N2O Emissions from Managed Soils, and CO2 Emissions from Lime and Urea Application
2019 Refinement to the 2006 IPCC Guidelines for National Greenhouse Gas Inventories 11.17
TABLE 11.1A (NEW)
DEFAULT VALUES FOR N AG(T), N BG(T), R AG(T), RS (T) AND DRY TO BE USED IN EQUATIONS 11.6 AND 11.7
Crops
N content of
above-ground
residues
(N AG(T))a
N content of
below-ground
residues
(N BG(T))a
Ratio of above-
ground residue
dry matter to
harvested yield
(RAG (T))b
Ratio of below-
ground biomass
to above-ground
biomass
(RS (T))a
Dry matter
fraction of
harvested
product
(DRY)a
Crops
Generic value
for crops not
indicated
belowc
0.008 (± 75%)d 0.009 (± 75%)d 1.0 0.22 0.85
Generic Grains 0.006 (± 75%)d 0.009 (± 75%)d 1.3 0.22 (±16%) 0.88
Winter Wheat 0.006 (± 75%)d 0.009 (± 75%)d 1.3 0.23 (±41%) 0.89
Spring Wheat 0.006 (± 75%)d 0.009 (± 75%)d 1.3 0.28 (±26%) 0.89
Barley 0.007 (± 75%)d 0.014 (± 75%)d 1.2 0.22 (± 33%) 0.89
Oats 0.007 (± 75%)d 0.008 (± 75%)d 1.3 0.25 (± 120%) 0.89
Maize 0.006 (± 75%)d 0.007 (± 75%)d 1.0 0.22 (± 26%) 0.87
Rye 0.005 (± 75%)d 0.011 (± 75%)d 1.6 -e 0.88
Rice 0.007 (± 75%)d -e 1.4 0.16 (± 35%) 0.89
Millet 0.007 (± 75%)d -e 1.4 -e 0.90
Sorghum 0.007 (± 75%)d 0.006 (± 75%)d 1.4 -e 0.89
Beans and
Pulses 0.008 (± 75%)d 0.008 (± 75%)d 2.1 0.19 (± 45%) 0.91
Soybeans 0.008 (± 75%)d 0.008 (± 75%)d 2.1 0.19 (± 45%) 0.91
Potatoes and
Tubers 0.019 (± 75%)d 0.014 (± 75%)d 0.4 0.20 (± 50%)f 0.22
Peanuts 0.016 (± 75%)d -e 1.0 -e 0.94
Volume 4: Agriculture, Forestry and Other Land Use
11.18 2019 Refinement to the 2006 IPCC Guidelines for National Greenhouse Gas Inventories
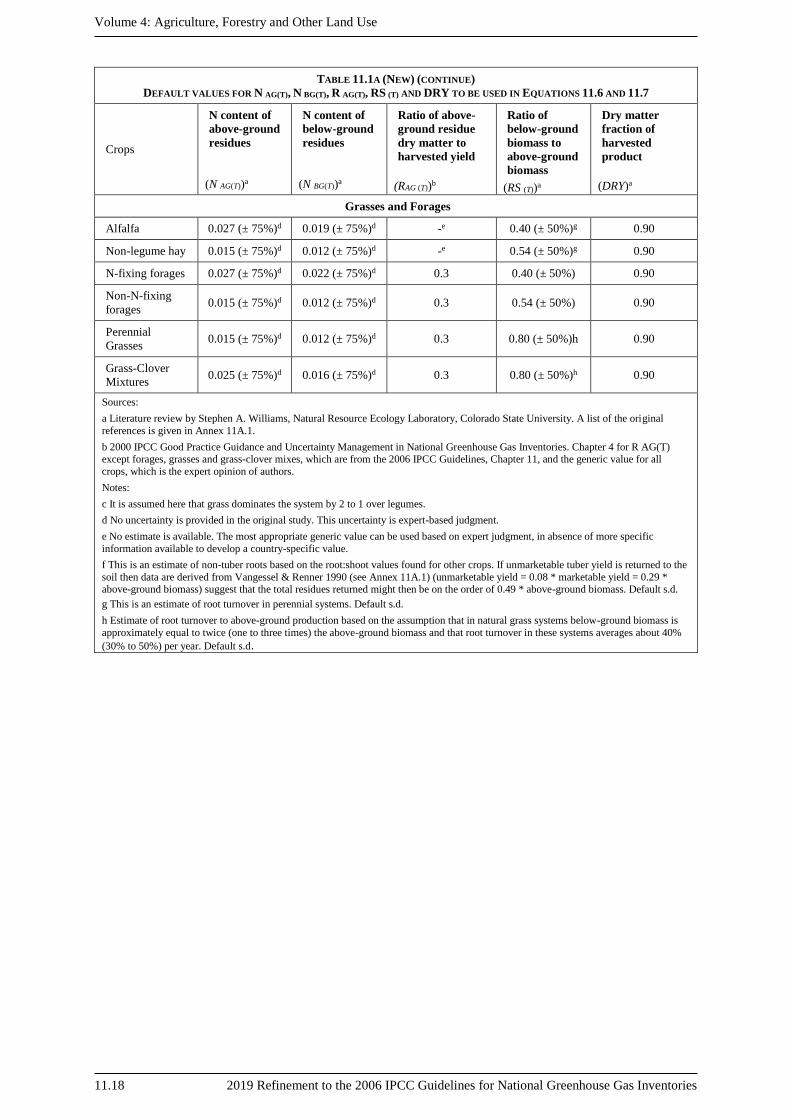
TABLE 11.1A (NEW) (CONTINUE)
DEFAULT VALUES FOR N AG(T), N BG(T), R AG(T), RS (T) AND DRY TO BE USED IN EQUATIONS 11.6 AND 11.7
Crops
N content of
above-ground
residues
(N AG(T))a
N content of
below-ground
residues
(N BG(T))a
Ratio of above-
ground residue
dry matter to
harvested yield
(RAG (T))b
Ratio of
below-ground
biomass to
above-ground
biomass
(RS (T))a
Dry matter
fraction of
harvested
product
(DRY)a
Grasses and Forages
Alfalfa 0.027 (± 75%)d 0.019 (± 75%)d -e 0.40 (± 50%)g 0.90
Non-legume hay 0.015 (± 75%)d 0.012 (± 75%)d -e 0.54 (± 50%)g 0.90
N-fixing forages 0.027 (± 75%)d 0.022 (± 75%)d 0.3 0.40 (± 50%) 0.90
Non-N-fixing
forages 0.015 (± 75%)d 0.012 (± 75%)d 0.3 0.54 (± 50%) 0.90
Perennial
Grasses 0.015 (± 75%)d 0.012 (± 75%)d 0.3 0.80 (± 50%)h 0.90
Grass-Clover
Mixtures 0.025 (± 75%)d 0.016 (± 75%)d 0.3 0.80 (± 50%)h 0.90
Sources:
a Literature review by Stephen A. Williams, Natural Resource Ecology Laboratory, Colorado State University. A list of the original
references is given in Annex 11A.1.
b 2000 IPCC Good Practice Guidance and Uncertainty Management in National Greenhouse Gas Inventories. Chapter 4 for R AG(T) except forages, grasses and grass-clover mixes, which are from the 2006 IPCC Guidelines, Chapter 11, and the generic value for all
crops, which is the expert opinion of authors.
Notes:
c It is assumed here that grass dominates the system by 2 to 1 over legumes.
d No uncertainty is provided in the original study. This uncertainty is expert-based judgment.
e No estimate is available. The most appropriate generic value can be used based on expert judgment, in absence of more specific
information available to develop a country-specific value.
f This is an estimate of non-tuber roots based on the root:shoot values found for other crops. If unmarketable tuber yield is returned to the
soil then data are derived from Vangessel & Renner 1990 (see Annex 11A.1) (unmarketable yield = 0.08 * marketable yield = 0.29 * above-ground biomass) suggest that the total residues returned might then be on the order of 0.49 * above-ground biomass. Default s.d.
g This is an estimate of root turnover in perennial systems. Default s.d.
h Estimate of root turnover to above-ground production based on the assumption that in natural grass systems below-ground biomass is
approximately equal to twice (one to three times) the above-ground biomass and that root turnover in these systems averages about 40%
(30% to 50%) per year. Default s.d.
Chapter 11: N2O Emissions from Managed Soils, and CO2 Emissions from Lime and Urea Application
2019 Refinement to the 2006 IPCC Guidelines for National Greenhouse Gas Inventories 11.19
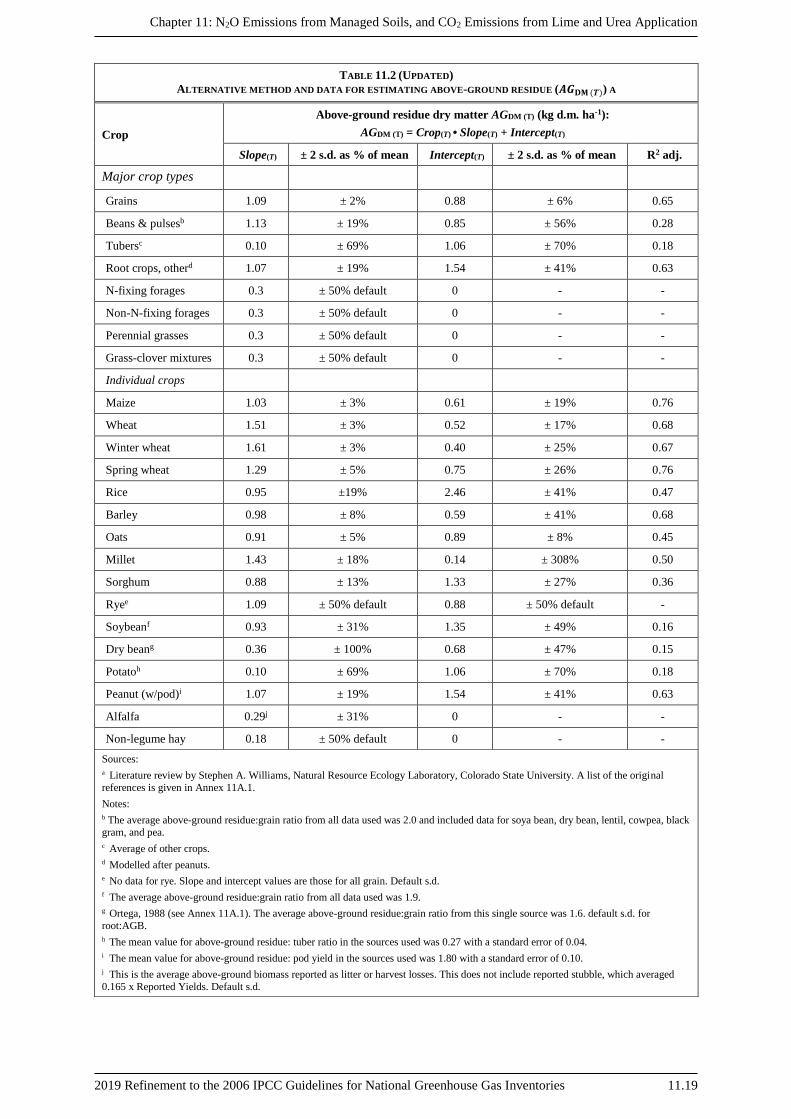
TABLE 11.2 (UPDATED)
ALTERNATIVE METHOD AND DATA FOR ESTIMATING ABOVE-GROUND RESIDUE (𝑨𝑮𝐃𝐌 (𝑻)) A
Crop
Above-ground residue dry matter AGDM (T) (kg d.m. ha-1):
AGDM (T) = Crop(T) • Slope(T) + Intercept(T)
Slope(T) ± 2 s.d. as % of mean Intercept(T) ± 2 s.d. as % of mean R2 adj.
Major crop types
Grains 1.09 ± 2% 0.88 ± 6% 0.65
Beans & pulsesb 1.13 ± 19% 0.85 ± 56% 0.28
Tubersc 0.10 ± 69% 1.06 ± 70% 0.18
Root crops, otherd 1.07 ± 19% 1.54 ± 41% 0.63
N-fixing forages 0.3 ± 50% default 0 - -
Non-N-fixing forages 0.3 ± 50% default 0 - -
Perennial grasses 0.3 ± 50% default 0 - -
Grass-clover mixtures 0.3 ± 50% default 0 - -
Individual crops
Maize 1.03 ± 3% 0.61 ± 19% 0.76
Wheat 1.51 ± 3% 0.52 ± 17% 0.68
Winter wheat 1.61 ± 3% 0.40 ± 25% 0.67
Spring wheat 1.29 ± 5% 0.75 ± 26% 0.76
Rice 0.95 ±19% 2.46 ± 41% 0.47
Barley 0.98 ± 8% 0.59 ± 41% 0.68
Oats 0.91 ± 5% 0.89 ± 8% 0.45
Millet 1.43 ± 18% 0.14 ± 308% 0.50
Sorghum 0.88 ± 13% 1.33 ± 27% 0.36
Ryee 1.09 ± 50% default 0.88 ± 50% default -
Soybeanf 0.93 ± 31% 1.35 ± 49% 0.16
Dry beang 0.36 ± 100% 0.68 ± 47% 0.15
Potatoh 0.10 ± 69% 1.06 ± 70% 0.18
Peanut (w/pod)i 1.07 ± 19% 1.54 ± 41% 0.63
Alfalfa 0.29j ± 31% 0 - -
Non-legume hay 0.18 ± 50% default 0 - -
Sources:
a Literature review by Stephen A. Williams, Natural Resource Ecology Laboratory, Colorado State University. A list of the original
references is given in Annex 11A.1.
Notes:
b The average above-ground residue:grain ratio from all data used was 2.0 and included data for soya bean, dry bean, lentil, cowpea, black
gram, and pea.
c Average of other crops.
d Modelled after peanuts. e No data for rye. Slope and intercept values are those for all grain. Default s.d.
f The average above-ground residue:grain ratio from all data used was 1.9. g Ortega, 1988 (see Annex 11A.1). The average above-ground residue:grain ratio from this single source was 1.6. default s.d. for
root:AGB.
h The mean value for above-ground residue: tuber ratio in the sources used was 0.27 with a standard error of 0.04.
i The mean value for above-ground residue: pod yield in the sources used was 1.80 with a standard error of 0.10. j This is the average above-ground biomass reported as litter or harvest losses. This does not include reported stubble, which averaged
0.165 x Reported Yields. Default s.d.

Volume 4: Agriculture, Forestry and Other Land Use
11.20 2019 Refinement to the 2006 IPCC Guidelines for National Greenhouse Gas Inventories
Mineralised N resulting from loss of soil organic C stocks in mineral soils through land-use change or
management practices (FSOM) 16
The term FSOM refers to the amount of N mineralised from loss in soil organic C in mineral soils through land-use
change or management practices. As explained in Chapter 2, Section 2.3.3, land-use change and a variety of
management practices can have a significant impact on soil organic C storage. Organic C and N are intimately
linked in soil organic matter. Where soil C is lost through oxidation as a result of land-use or management change,
this loss will be accompanied by a simultaneous mineralisation of N. Where a loss of soil C occurs, this mineralised
N is regarded as an additional source of N available for conversion to N2O (Smith and Conen, 2004); just as
mineral N released from decomposition of crop residues, for example, becomes a source. The same default
emission factor (EF1) is applied to mineralised N from soil organic matter loss as is used for direct emissions
resulting from fertiliser and organic N inputs to agricultural land. This is because the ammonium and nitrate
resulting from soil organic matter mineralisation is of equal value as a substrate for the microorganisms producing
N2O by nitrification and denitrification, no matter whether the mineral N source is soil organic matter loss from
land-use or management change, decomposition of crop residues, synthetic fertilisers or organic amendments.
(Note: the opposite process to mineralisation, whereby inorganic N is sequestered into newly formed SOM, is not
taken account of in the calculation of the mineralisation N source. This is because of the different dynamics of
SOM decomposition and formation, and also because reduced tillage in some circumstances can increase both
SOM and N2O emission.)
For all situations where soil C losses occur (as calculated in Chapter 2, Equation 2.25) the Tier 1 and 2 methods
for calculating the release of N by mineralisation are shown below:
Calculation steps for estimating changes in N supply from mineralisation
Step 1: Calculate the average annual loss of soil C (∆CMineral, LU) for the area, over the inventory period, using
Equation 2.25 in Chapter 2. Using the Tier 1 approach, the value for ∆CMineral, LU will have a single value for all
land-uses and management systems. Using Tier 2, the value for ∆CMineral, LU will be disaggregated by individual
land-use and/or management systems.
Step 2: Estimate the N mineralised as a consequence of this loss of soil C (FSOM), using Equation 11.8:
EQUATION 11.8
N MINERALISED IN MINERAL SOILS AS A RESULT OF LOSS OF SOIL C THROUGH CHANGE IN LAND
USE OR MANAGEMENT (TIERS 1 AND 2)
,
11000SOM Mineral LU
LU
F CR
Where:
SOMF = the net annual amount of N mineralised in mineral soils as a result of loss of soil carbon
through change in land use or management, kg N
,Mineral LUC = average annual loss of soil carbon for each land-use type (LU), tonnes C (Note: for Tier 1,
,Mineral LUC will have a single value for all land-uses and management systems. Using Tier
2 the value for ,Mineral LUC will be disaggregated by individual land-use and/or management
systems.
R = C:N ratio of the soil organic matter. A default value of 15 (uncertainty range from 10 to 30)
for the C:N ratio (R) may be used for situations involving land-use change from Forest Land
or Grassland to Cropland, in the absence of more specific data for the area. A default value
of 10 (range from 8 to 15) may be used for situations involving management changes on
Cropland Remaining Cropland. C:N ratio can change over time, land use, or management
practice 17. If countries can document changes in C:N ratio, then different values can be used
over the time series, land use, or management practice.
16 The inclusion of the term FSOM is a change from the previous 1996 IPCC Guidelines, which did not include the N from
mineralisation associated with a loss of soil organic C.
17 Information on C:N ratios in forest and cropped soils may be found in the following references: Aitkenhead-Peterson et al.,
2005; Garten et al., 2000; John et al., 2005; Lobe et al., 2001; Snowdon et al., 2005, and other references cited by these
authors.

Chapter 11: N2O Emissions from Managed Soils, and CO2 Emissions from Lime and Urea Application
2019 Refinement to the 2006 IPCC Guidelines for National Greenhouse Gas Inventories 11.21
LU = land-use and/or management system type
Step 3: For Tier 1, the value for FSOM is calculated in a single step. For Tier 2, FSOM is calculated by summing
across all land-uses and/or management system types (LU).
Countries that are not able to estimate gross changes of mineral soil C will create a bias in the N2O estimate, and
it is good practice to acknowledge this limitation in the reporting documentation. It is also good practice to use
specific data for the C:N ratios for the disaggregated land areas, if these are available, in conjunction with the data
for carbon changes.
Area of drained/managed organic soils (FOS)
The term FOS refers to the total annual area (ha) of drained/managed organic soils (see footnote 3 for definition).
This definition is applicable for both the Tier 1 and Tier 2 methods. For all land uses, the areas should be stratified
by climate zone (temperate and tropical). In addition, for temperate Forest Land the areas should be further
stratified by soil fertility (nutrient rich and nutrient poor). The area of drained/managed organic soils (FOS) may be
collected from official national statistics. Alternatively, total areas of organic soils from each country are available
from FAO (http://fao.org/faostat/), and expert judgement may be used to estimate areas that are drained/managed.
For Forest Land, national data will be available at soil survey organisations and from wetland surveys, e.g., for
international conventions. In case no stratification by soil fertility is possible, countries may rely on expert
judgment.
11.2.1.4 UNCERTAINTY ASSESSMENT
No Refinement.
11.2.2 Indirect N2O emissions
In addition to the direct emissions of N2O from managed soils that occur through a direct pathway (i.e., directly
from the soils to which N is applied), emissions of N2O also take place through two indirect pathways (i.e., ‘off-
site’ N2O emission from N volatilisation/deposition and N leaching, as illustrated above in Section 11.2).
The first of these pathways is the volatilisation of N as NH3 and oxides of N (NOx), and the deposition of these
gases and their products NH4+ and NO3
- onto soils and the surface of lakes and other waters. The sources of N as
NH3 and NOx are not confined to agricultural fertilisers and manures, but also include fossil fuel combustion,
biomass burning, and processes in the chemical industry (see Volume 1, Chapter 7, Section 7.3). Thus, these
processes cause N2O emissions in an exactly analogous way to those resulting from deposition of agriculturally
derived NH3 and NOx, following the application of synthetic and organic N fertilisers and /or urine and dung
deposition from grazing animals. The second pathway is the leaching and runoff from land of N from synthetic
and organic fertiliser additions, crop residues 18, mineralisation of N associated with loss of soil C in mineral and
drained/managed organic soils through land-use change or management practices, and urine and dung deposition
from grazing animals. Some of the inorganic N in or on the soil, mainly in the NO3- form, may bypass biological
retention mechanisms in the soil/vegetation system by transport in overland water flow (runoff) and/or flow
through soil macropores or pipe drains. Where NO3- is present in the soil in excess of biological demand, e.g.,
under cattle urine patches, the excess leaches through the soil profile. The nitrification and denitrification processes
described at the beginning of this chapter transform some of the NH4+ and NO3
- to N2O. This may take place in
the groundwater below the land to which the N was applied, or in riparian zones receiving drain or runoff water,
or in the ditches, streams, rivers and estuaries (and their sediments) into which the land drainage water eventually
flows.
This methodology described in this Chapter addresses the following N sources of indirect N2O emissions from
managed soils arising from agricultural inputs of N:
synthetic N fertilisers (FSN);
organic N applied as fertiliser (e.g., applied animal manure 19, compost, sewage sludge, rendering waste, waste
water effluent and other organic amendments) (FON);
urine and dung N deposited on pasture, range and paddock by grazing animals (FPRP);
18 Crop residues should be included as an N input into the leaching and runoff component.
19 Volatilisation and subsequent deposition of nitrogen from the manure in manure management systems is covered in the
manure management section of this Volume.
Volume 4: Agriculture, Forestry and Other Land Use
11.22 2019 Refinement to the 2006 IPCC Guidelines for National Greenhouse Gas Inventories
N in crop residues (above- and below-ground), including N-fixing crops and forage/pasture renewal returned
to soils (FCR) 20; and
N mineralisation associated with loss of soil organic matter resulting from change of land use or management
on mineral soils (FSOM).
The generic Tier 1 and Tier 2 methods described below can be used to estimate aggregate total indirect N2O
emissions from agricultural N additions to managed soils for an entire country. If a country is estimating its direct
N2O from managed soils by land-use category, the indirect N2O emissions can also be estimated by the same
disaggregation of land-use categories using the equations presented below with activity data, partitioning fractions,
and/or emission factors specific for each land-use category. The methodology for estimating indirect N2O
emissions from combustion-related and industrial sources is described in Volume 1, Chapter 7, Section 7.3.
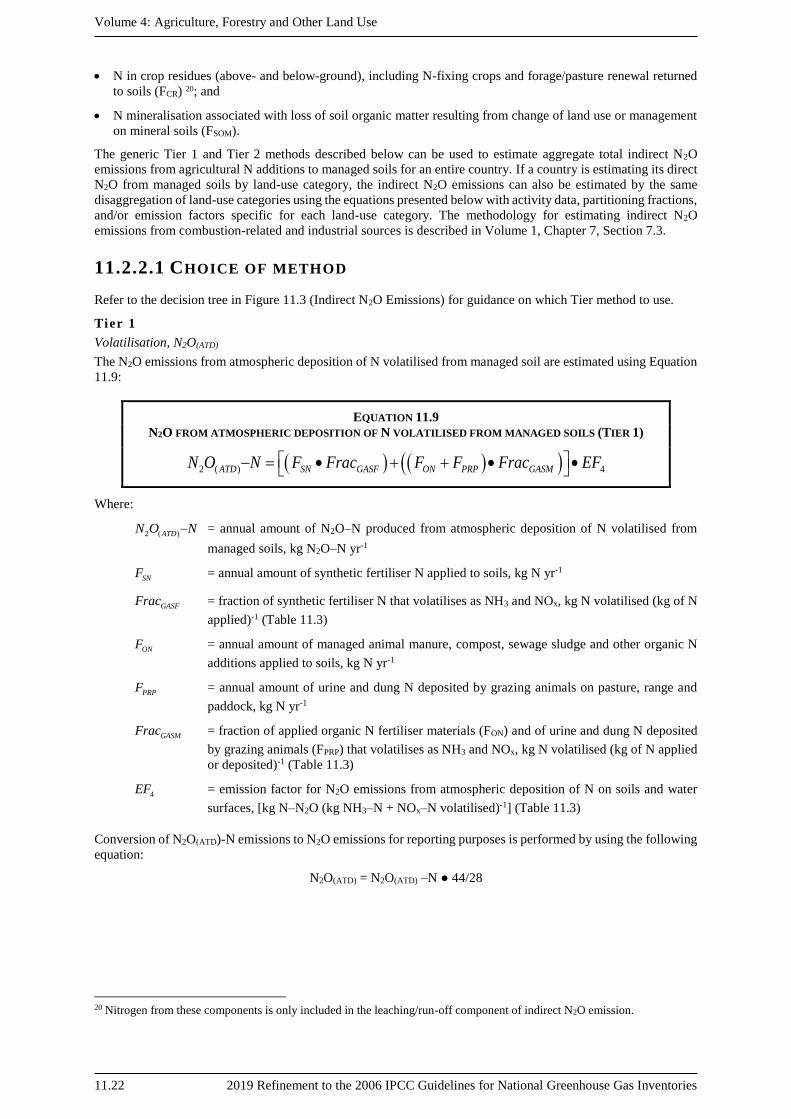
11.2.2.1 CHOICE OF METHOD
Refer to the decision tree in Figure 11.3 (Indirect N2O Emissions) for guidance on which Tier method to use.
Tier 1
Volatilisation, N2O(ATD)
The N2O emissions from atmospheric deposition of N volatilised from managed soil are estimated using Equation
11.9:
EQUATION 11.9
N2O FROM ATMOSPHERIC DEPOSITION OF N VOLATILISED FROM MANAGED SOILS (TIER 1)
2 ( ) 4ATD SN GASF ON PRP GASMN O N F Frac F F Frac EF
Where:
2 ( )ATDN O N = annual amount of N2O–N produced from atmospheric deposition of N volatilised from
managed soils, kg N2O–N yr-1
SNF = annual amount of synthetic fertiliser N applied to soils, kg N yr-1
GASFFrac = fraction of synthetic fertiliser N that volatilises as NH3 and NOx, kg N volatilised (kg of N
applied)-1 (Table 11.3)
ONF = annual amount of managed animal manure, compost, sewage sludge and other organic N
additions applied to soils, kg N yr-1
PRPF = annual amount of urine and dung N deposited by grazing animals on pasture, range and
paddock, kg N yr-1
GASMFrac = fraction of applied organic N fertiliser materials (FON) and of urine and dung N deposited
by grazing animals (FPRP) that volatilises as NH3 and NOx, kg N volatilised (kg of N applied
or deposited)1 (Table 11.3)
4EF = emission factor for N2O emissions from atmospheric deposition of N on soils and water
surfaces, [kg N–N2O (kg NH3–N + NOx–N volatilised)-1] (Table 11.3)
Conversion of N2O(ATD)-N emissions to N2O emissions for reporting purposes is performed by using the following
equation:
N2O(ATD) = N2O(ATD) –N ● 44/28
20 Nitrogen from these components is only included in the leaching/run-off component of indirect N2O emission.
Chapter 11: N2O Emissions from Managed Soils, and CO2 Emissions from Lime and Urea Application
2019 Refinement to the 2006 IPCC Guidelines for National Greenhouse Gas Inventories 11.23
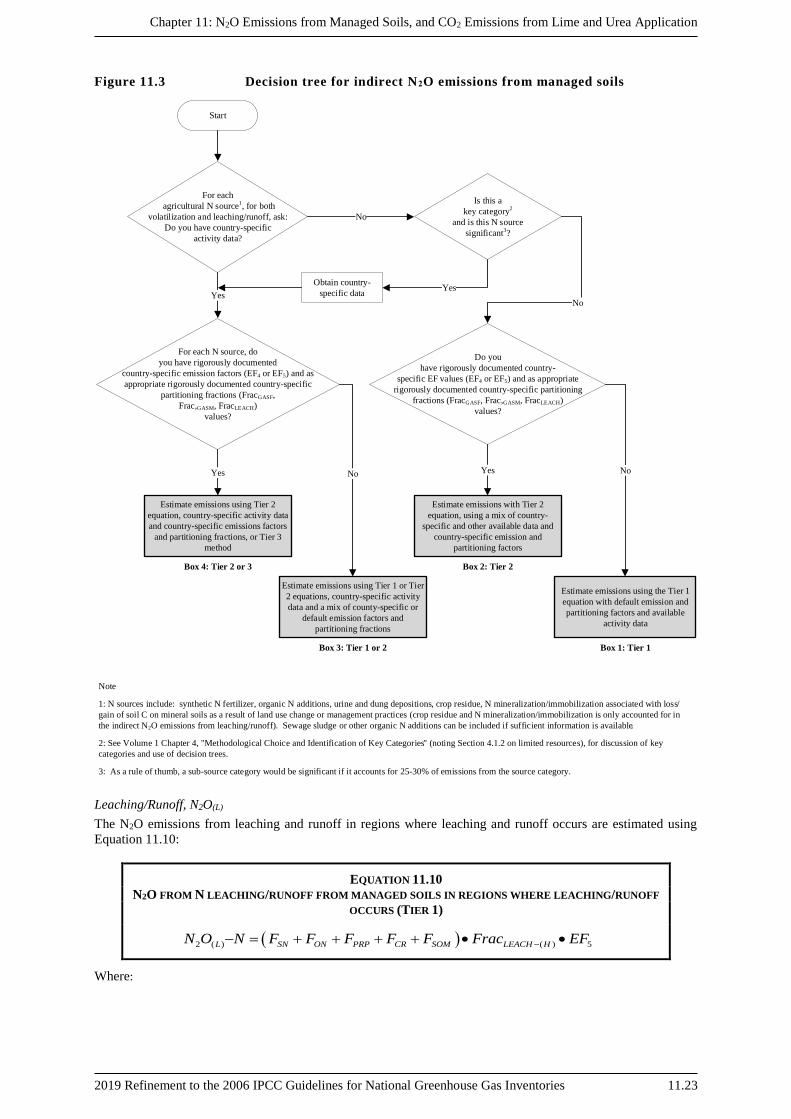
Figure 11.3 Decision tree for indirect N2O emissions from managed soils
Start
For each
agricultural N source1, for both
volatilization and leaching/runoff, ask:
Do you have country-specific
activity data?
For each N source, do
you have rigorously documented
country-specific emission factors (EF4 or EF5) and as
appropriate rigorously documented country-specific
partitioning fractions (FracGASF,
Frac,GASM, FracLEACH)
values?
Is this a
key category2
and is this N source
significant3?
Obtain country-
specific data
Do you
have rigorously documented country-
specific EF values (EF4 or EF5) and as appropriate
rigorously documented country-specific partitioning
fractions (FracGASF, Frac,GASM, FracLEACH)
values?
Estimate emissions using Tier 2
equation, country-specific activity data
and country-specific emissions factors
and partitioning fractions, or Tier 3
method
Estimate emissions using Tier 1 or Tier
2 equations, country-specific activity
data and a mix of county-specific or
default emission factors and
partitioning fractions
Estimate emissions with Tier 2
equation, using a mix of country-
specific and other available data and
country-specific emission and
partitioning factors
Estimate emissions using the Tier 1
equation with default emission and
partitioning factors and available
activity data
Note
1: N sources include: synthetic N fertilizer, organic N additions, urine and dung depositions, crop residue, N mineralization/immobilization associated with loss/
gain of soil C on mineral soils as a result of land use change or management practices (crop residue and N mineralization/immobilization is only accounted for in
the indirect N2O emissions from leaching/runoff). Sewage sludge or other organic N additions can be included if sufficient information is available.
2: See Volume 1 Chapter 4, "Methodological Choice and Identification of Key Categories" (noting Section 4.1.2 on limited resources), for discussion of key
categories and use of decision trees.
3: As a rule of thumb, a sub-source category would be significant if it accounts for 25-30% of emissions from the source category.
Yes
No
Yes
No
Yes No Yes No
Box 1: Tier 1
Box 2: Tier 2
Box 3: Tier 1 or 2
Box 4: Tier 2 or 3
Leaching/Runoff, N2O(L)
The N2O emissions from leaching and runoff in regions where leaching and runoff occurs are estimated using
Equation 11.10:
EQUATION 11.10
N2O FROM N LEACHING/RUNOFF FROM MANAGED SOILS IN REGIONS WHERE LEACHING/RUNOFF
OCCURS (TIER 1)
2 ( ) ( ) 5L SN ON PRP CR SOM LEACH HN O N F F F F F Frac EF
Where:

Volume 4: Agriculture, Forestry and Other Land Use
11.24 2019 Refinement to the 2006 IPCC Guidelines for National Greenhouse Gas Inventories
2 ( )LN O N = annual amount of N2O–N produced from leaching and runoff of N additions tomanaged
soils in regions where leaching/runoff occurs, kg N2O–N yr-1
SNF = annual amount of synthetic fertiliser N applied to soils in regions where leaching/runoff
occurs, kg N yr-1
ONF = annual amount of managed animal manure, compost, sewage sludge and other organic N
additions applied to soils in regions where leaching/runoff occurs, kg N yr-1
PRPF = annual amount of urine and dung N deposited by grazing animals in regions where
leaching/runoff occurs, kg N yr-1 (from Equation 11.5)
CRF = amount of N in crop residues (above- and below-ground), including N-fixing crops, and
from forage/pasture renewal, returned to soils annually in regions where leaching/runoff
occurs, kg N yr-1
SOMF = annual amount of N mineralised in mineral soils associated with loss of soil C from soil
organic matter as a result of changes to land use or management in regions where
leaching/runoff occurs, kg N yr-1 (from Equation 11.8)
( )LEACH HFrac = fraction of all N added to/mineralised in managed soils in regions where leaching/runoff
occurs that is lost through leaching and runoff, kg N (kg of N additions)-1 (Table 11.3)
5EF = emission factor for N2O emissions from N leaching and runoff, kg N2O–N (kg N leached
and runoff)1 (Table 11.3)
Note: If a country is able to estimate the quantity of N mineralised from organic soils, then include this as an
additional input to Equation 11.10.
Conversion of N2O(L)–N emissions to N2O emissions for reporting purposes is performed by using the following
equation:
N2O(L) = N2O(L)–N ● 44/28
Tier 2
If more detailed emission, volatilisation or leaching factors are available to a country than are presented in Table
11.4, further disaggregation of the terms in the equations can also be undertaken. For example, if specific
volatilisation factors are available for the application of synthetic fertilisers (FSN) under different conditions i,
Equation 11.9 would be expanded to become 21:
EQUATION 11.11
N2O FROM ATMOSPHERIC DEPOSITION OF N VOLATILISED FROM MANAGED SOILS (TIER 2)
2 ( ) 4i iATD SN GASF ON PRP GASM
i
N O N F Frac F F Frac EF
Where:
2 ( )ATDN O N = annual amount of N2O–N produced from atmospheric deposition of N volatilised from
managed soils, kg N2O–N yr-1
iSNF = annual amount of synthetic fertiliser N applied to soils under different conditions i, kg N
yr-1
iGASFFrac = fraction of synthetic fertiliser N that volatilises as NH3 and NOx under different conditions
i, kg N volatilised (kg of N applied)-1
21 It is important to note that Equation 11.11 is just one of many possible modifications to Equation 11.9, and is also meant to
illustrate how Equation 11.10 could be modified, when using the Tier 2 method. The eventual form of Equation 11.11 will
depend upon the availability of land use and/or condition-specific partitioning fractions and/or emission factors and the ability
to which a country can disaggregate its activity data.

Chapter 11: N2O Emissions from Managed Soils, and CO2 Emissions from Lime and Urea Application
2019 Refinement to the 2006 IPCC Guidelines for National Greenhouse Gas Inventories 11.25
ONF = annual amount of managed animal manure, compost, sewage sludge and other organic N
additions applied to soils, kg N yr-1
PRPF = annual amount of urine and dung N deposited by grazing animals on pasture, range and
paddock, kg N yr-1
GASMFrac = fraction of applied organic N fertiliser materials (FON) and of urine and dung N deposited
by grazing animals (FPRP) that volatilises as NH3 and NOx, kg N volatilised (kg of N applied
or deposited)1 (Table 11.3)
4EF = emission factor for N2O emissions from atmospheric deposition of N on soils and water
surfaces, [kg N–N2O (kg NH3–N + NOx–N volatilised)-1] (Table 11.3)
Note: If a country is able to estimate the quantity of N mineralised from drainage/management of organic soils
then include this as one of the N inputs into the Tier 2 modification of Equation 11.10. Countries can also develop
emission factors for FracGASF and FracGASM that are specific for mitigation options such as the application of urease
inhibitors.
Conversion of N2O(ATD)–N emissions to N2O(ATD) emissions for reporting purposes is performed by using the
following equation:
( ) ( )2 2 – • 44 / 28ATDATDN O N O N
Tier 3
Tier 3 methods are modelling or measurement approaches. Models are useful as they can relate the variables
responsible for the emissions to the size of those emissions. These relationships may then be used to predict
emissions from whole countries or regions for which experimental measurements are impracticable. For more
information refer to Chapter 2, Section 2.5, where guidance is given that provides a sound scientific basis for the
development of a Tier 3 Model-based Accounting System.
According to Equations 11.1, 11.10 and 11.11, direct and indirect emissions of N2O from managed soils are
calculated in the Tier 1 approach on the basis of total N applied to soils as synthetic and organic fertilisers and/or
soil N mineralisation. As noted in Section 11.2.1.1, the processes of run-off of N, volatilization of NH3 and NOx,
emissions of N2O, and leaching of N, however, do not occur simultaneously but in a sequence, with the peak of
run-off and NH3+NOx volatilization happening before emissions of N2O and losses of N through leaching. Refer
to Section 11.2.1.1 for good practice guidance when implementing a Tier 3 approach and adopting the N-flow
principle when estimating direct N2O emissions and indirect N2O emissions from leaching and runoff.
11.2.2.2 CHOICE OF EMISSION , VOLATILISATION AND LEACHING
FACTORS
The method for estimating indirect N2O emissions includes two emission factors: one associated with volatilised
and re-deposited N (EF4), and the second associated with N lost through leaching/runoff (EF5). The method also
requires values for the fractions of N that are lost through volatilisation (FracGASF and FracGASM) or leaching/runoff
(FracLEACH-(H)). The default values of all these factors are presented in Table 11.3.
Note that in the Tier 1 method, for wet climates22 or in dry climate regions where irrigation (other than drip
irrigation) is used, the default FracLEACH-(H) is 0.24. For dry climates, the default FracLEACH-(H) is zero. The climate
threshold for FracLEACH-(H) can be refined at Tier 2 by countries that are able to disaggregate their activity data (see
methodological suggestion in Table 11.3).
Country-specific values for EF4 should be used with great caution because of the special complexity of
transboundary atmospheric transport. Although inventory compilers may have specific measurements of N
deposition and associated N2O flux, in many cases the deposited N may not have originated in their country.
Similarly, some of the N that volatilises in their country may be transported to and deposited in another country,
where different conditions that affect the fraction emitted as N2O may prevail. For these reasons the value of EF4
is very difficult to determine, and the method presented in Volume 1, Chapter 7, Section 7.3 attributes all indirect
22 Wet climates occur in temperate and boreal zones where the ratio of annual precipitation: potential evapotranspiration > 1,
and tropical zones where annual precipitation > 1000 mm. Dry climate occur in temperate and boreal zones where the ratio
of annual precipitation: potential evapotranspiration < 1, and tropical zones where annual precipitation < 1000 mm (cf. Figure
3.A.5.1 in Chapter 3 of Vol. 4 provides a map subdividing wet and dry climates based on these criteria).
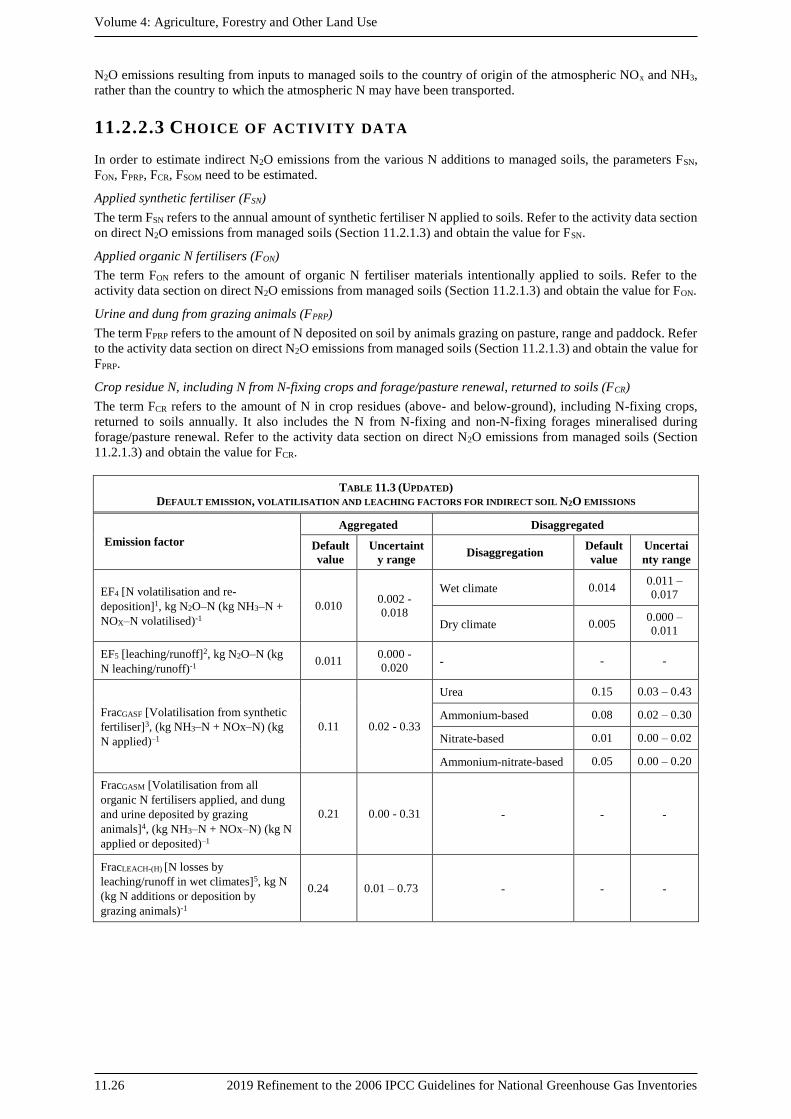
Volume 4: Agriculture, Forestry and Other Land Use
11.26 2019 Refinement to the 2006 IPCC Guidelines for National Greenhouse Gas Inventories
N2O emissions resulting from inputs to managed soils to the country of origin of the atmospheric NOx and NH3,
rather than the country to which the atmospheric N may have been transported.
11.2.2.3 CHOICE OF ACTIVITY DATA
In order to estimate indirect N2O emissions from the various N additions to managed soils, the parameters FSN,
FON, FPRP, FCR, FSOM need to be estimated.
Applied synthetic fertiliser (FSN)
The term FSN refers to the annual amount of synthetic fertiliser N applied to soils. Refer to the activity data section
on direct N2O emissions from managed soils (Section 11.2.1.3) and obtain the value for FSN.
Applied organic N fertilisers (FON)
The term FON refers to the amount of organic N fertiliser materials intentionally applied to soils. Refer to the
activity data section on direct N2O emissions from managed soils (Section 11.2.1.3) and obtain the value for FON.
Urine and dung from grazing animals (FPRP)
The term FPRP refers to the amount of N deposited on soil by animals grazing on pasture, range and paddock. Refer
to the activity data section on direct N2O emissions from managed soils (Section 11.2.1.3) and obtain the value for
FPRP.
Crop residue N, including N from N-fixing crops and forage/pasture renewal, returned to soils (FCR)
The term FCR refers to the amount of N in crop residues (above- and below-ground), including N-fixing crops,
returned to soils annually. It also includes the N from N-fixing and non-N-fixing forages mineralised during
forage/pasture renewal. Refer to the activity data section on direct N2O emissions from managed soils (Section
11.2.1.3) and obtain the value for FCR.
TABLE 11.3 (UPDATED)
DEFAULT EMISSION, VOLATILISATION AND LEACHING FACTORS FOR INDIRECT SOIL N2O EMISSIONS
Emission factor
Aggregated Disaggregated
Default
value
Uncertaint
y range Disaggregation
Default
value
Uncertai
nty range
EF4 [N volatilisation and re-
deposition]1, kg N2O–N (kg NH3–N +
NOX–N volatilised)-1
0.010 0.002 -
0.018
Wet climate 0.014 0.011 –
0.017
Dry climate 0.005 0.000 –
0.011
EF5 [leaching/runoff]2, kg N2O–N (kg
N leaching/runoff)-1 0.011
0.000 -
0.020 - - -
FracGASF [Volatilisation from synthetic
fertiliser]3, (kg NH3–N + NOx–N) (kg
N applied)–1
0.11 0.02 - 0.33
Urea 0.15 0.03 – 0.43
Ammonium-based 0.08 0.02 – 0.30
Nitrate-based 0.01 0.00 – 0.02
Ammonium-nitrate-based 0.05 0.00 – 0.20
FracGASM [Volatilisation from all
organic N fertilisers applied, and dung
and urine deposited by grazing
animals]4, (kg NH3–N + NOx–N) (kg N
applied or deposited)–1
0.21 0.00 - 0.31 - - -
FracLEACH-(H) [N losses by
leaching/runoff in wet climates]5, kg N
(kg N additions or deposition by
grazing animals)-1
0.24 0.01 – 0.73 - - -
Chapter 11: N2O Emissions from Managed Soils, and CO2 Emissions from Lime and Urea Application
2019 Refinement to the 2006 IPCC Guidelines for National Greenhouse Gas Inventories 11.27
TABLE 11.3 (UPDATED) (CONTINUED)
DEFAULT EMISSION, VOLATILISAION AND LEACHING FACTORS FOR INDIRECT SOIL N2O EMISSIONS
Sources:
1 Stehfest & Bouwman 2006; van Lent et al. 2015; Grace et al. 2016; van der Weerden et al. 2016; Albanito et al. 2017; Cayuela et al.
2017; Liu et al. 2017; Rochette et al. 2018. 2 Tian et al. 2019.
3 NH3: Bouwman et al. 2002; Pan et al. 2016. NOx: Liu et al. 2017.
4 NH3: Bouwman et al. 2002; Cai & Akiyama 2016. NOx: Liu et al. 2017. 5 Reviews: Di & Cameron 2002; Cai & Akiyama 2016. Original papers: Moreno et al. 1996; Diez et al. 1997; Catt et al. 1998; Sogbedji et
al. 2000; Asadi et al. 2002; Readman et al. 2002; Ren et al. 2003; Dauden & Quilez 2004; Dauden et al. 2004; Diez et al. 2004; Bakhsh et al. 2005; Basso & Ritchie 2005; Gehl et al. 2005; Fang et al. 2006; Li et al. 2006; Diez-Lopez et al. 2008; Conrad & Fohrer 2009; Zhu et
al. 2009; Aronsson & Stenberg 2010; Bakhsh et al. 2010; Salmeron et al. 2010; Yague & Quilez 2010; Claret et al. 2011; Huang et al.
2011; Gallejones et al. 2012; Perego et al. 2012; Sorensen & Rubaek 2012; Tafteh & Sepaskhah 2012; Wang et al. 2012.
Notes:
Disaggregation by climate for EF4 and FracLEACH-(H) (based on long-term averages): Wet climates occur in temperate and boreal zones where the ratio of annual precipitation: potential evapotranspiration > 1, and tropical zones where annual precipitation > 1000 mm. Dry
climates occur in temperate and boreal zones where the ratio of annual precipitation: potential evapotranspiration < 1, and tropical zones
where annual precipitation < 1000 mm (cf. Figure 3.A.5.1 in Chapter 3 of Vol. 4).
EF4: The aggregated EF4 is the same as the aggregated EF1 (see Annex 11A.5). The disaggregated EF4 are the same as the EF1
disaggregated by wet and dry climates (see Table A2-1 in Annex11A.2). Uncertainty range of the aggregated EF4 is based on the 2.5th to
97.5th percentile of the dataset, uncertainty range of disaggregated EF4 is based on the 95% confidence interval of fitted values (See
methods and data in Annex 11A.2).
EF5: This emission factor incorporates three components: EF5 = EF5g + EF5r + EF5e. EF5g: Emission factor for groundwater and surface
drainage, including upstream supersaturated with N2O (N2O emitted mainly from degassing of groundwater); EF5r: Emission factor for rivers and reservoirs, including downstream (supersaturated N2O was already degassed and N2O mainly produced by
nitrification/denitrification in situ); EF5e: Emission factor for estuaries. See methods in Annex 11A.6. Uncertainty range is based on the
2.5th to 97.5th percentile.
FracGASF: Calculated by weighting world fertiliser usage with number of observations from review papers (See methods and data in
Annex 11A.7). Uncertainty range based on the 2.5th to 97.5th percentile.
FracGASM: See methods in Annex 11A.8. Uncertainty range is based on the 2.5th to 97.5th percentile.
FracLEACH-(H): The FracLEACH-(H) only applies to wet climates. For dry climate, the default FracLEACH-(H) is taken as zero. See methods in
Annex 11A.9. Uncertainty range is based on the 2.5th to 97.5th percentile.
For Tier 2, country specific FracLEACH-(H) can be estimated for N losses by leaching/runoff for regions where Σ(rain) - Σ(ET0) > soil water holding capacity, OR where irrigation (except drip irrigation) is used. ET0 = Kpan * Ep, where ET0: reference evapotranspiration, Kpan:
pan evaporation coefficient, Ep: pan evaporatio n. When Kpan is not available, reference evaporation can be estimated as ET0= 0.5 * Ep
(Explanations of reference and pan evaporation: see Allen et al.,1998). Long-term mean of annual rainfall data should be used for
estimating FracLEACH-(H). Precipitation and potential evapotranspiration data are available from global datasets, such as the CRU climate
dataset (https://crudata.uea.ac.uk/cru/data/hrg/), if country-specific data are not available.
Mineralised N resulting from loss of soil organic C stocks in mineral soils (FSOM)
The term FSOM refers to the amount of N mineralised from the loss of soil organic C in mineral soils through land-
use change or management practices. Refer to the activity data section on direct N2O emissions from managed
soils (Section 11.2.1.3) and obtain the value for FSOM.
11.2.2.4 UNCERTAINTY ASSESSMENT
No refinement.
11.2.3 Completeness, Time series, QA/QC
No refinement.
11.3 CO2 EMISSIONS FROM LIMING
No refinement.
11.4 CO2 EMISSIONS FROM UREA FERTILIZATION
No refinement.
Volume 4: Agriculture, Forestry and Other Land Use
11.28 2019 Refinement to the 2006 IPCC Guidelines for National Greenhouse Gas Inventories
Annex 11A.1 References for crop residue data in Table 11.2
No Refinement.

Chapter 11: N2O Emissions from Managed Soils, and CO2 Emissions from Lime and Urea Application
2019 Refinement to the 2006 IPCC Guidelines for National Greenhouse Gas Inventories 11.29
Annex 11A.2 Estimation of Default Emission Factor(s) for EF1
Material and methods
We extracted all studies from the databases by Stehfest & Bouwman (2006), van Lent et al. (2015), Grace et al.
(2016), van der Weerden et al. (2016), Albanito et al. (2017), Cayuela et al. (2017), Liu et al. (2017), and Rochette
et al. (2018) and excluded studies which:
Were non-peer-reviewed publications.
Were conducted in the laboratory and greenhouse, and modelling studies (only field studies were selected).
Were conducted in flooded rice fields (emissions from N inputs in flooded rice are estimated using the EF1FR).
Related to grazed soils where urine and/or dung were applied (emissions from urine/dung inputs in grazed
soils are estimated using the EF3PRP).
Related to enhanced synthetic or organic fertiliser either treated with inhibitors or coated, and
Were conducted on drained organic soils.
We further selected the cases from the source databases for which an emission factor had been or could be
computed using a control site as:
2 21
Ti Cii
i
N O N OEF
N
Where N2OTi is the N2O flux during the experimental period due to the application of inputs Ni and other
unquantified sources of N; and N2OCi is the N2O flux during the experimental period at a control site due to other
sources of N than Ni.
Climate (Temperate/Boreal Wet, Temperate/Boreal, Dry Tropical Wet, Tropical Dry) was assigned to most cases.
Temperate, boreal and tropical zones correspond to those defined in Chapter 3 of Vol. 4 in the 2006 IPCC
guidelines. Wet climates occur in temperate and boreal zones where the ratio of annual precipitation: potential
evapotranspiration > 1, and tropical zones where annual precipitation > 1000 mm. Dry climates occur in temperate
and boreal zones where the ratio of annual precipitation: potential evapotranspiration < 1, and tropical zones where
annual precipitation < 1000 mm. Climates were also grouped at a lower level of disaggregation by distinguishing
dry climates from wet climates. Fertiliser was categorised as synthetic, organic or a mix of synthetic and organic
forms. At a less disaggregated level, fertiliser comprised two groups: organic and synthetic plus mixed forms of
fertilser.
The linear mixed-effect model approach was selected for developing the disaggregated emission factors to account
for lack of independence among data from individual sites compared to data from different sites. A location
identification was assigned to all individual cases from experimental sites. Cases either with an identical coordinate
or being from a same reference with a same soil type and a same land use were considered a unique location. The
models included location identification as a random-effect, and climate, fertiliser or their interaction as fixed-
effects. Influence of the length of the experiment, of the N application rate as well as influence of irrigation in dry
climates was evaluated by considering these 3 variables as fixed-effects. The length of the experiment (days) was
categorized into 5 classes as: ≤ 120, (120; 180], (180; 240], (240; 300], and > 300. The N application rate (kg N
ha-1 period-1) was categorized following the 6 classes: (0; 100], (100; 200], (200; 300], (300; 500], (500; 700], and
> 700. Irrigation was categorized as yes or no.
Means for the fixed-effects were compared using the LSD Fisher test. The confidence interval of fitted values by
the models was considered for uncertainty quantification of disaggregated EF1. Given the unbalance of the
dataset between climates and fertiliser forms (76percent in wet climate, 80percent with synthetic plus mixed
fertiliser form), the aggregated EF1 could not be analysed by linear mixed-effect modelling. Instead the estimate
was computed as the average of the EF1 disaggregated by precipitation regime (wet, dry) and fertiliser form for
wet climate (S + M, O) with a bootstrapping method (each applied 1000 times). The confidence interval of the
aggregated EF1 was computed from the standard deviation of the mean (n = 3000).
Results
The dataset was dominated by cases from Europe (34percent) and North America (28percent). Cases from Asia
represented 19percent of all cases while Africa, Central-South America, and Oceania formed an equal share of
6−7percent of the dataset.
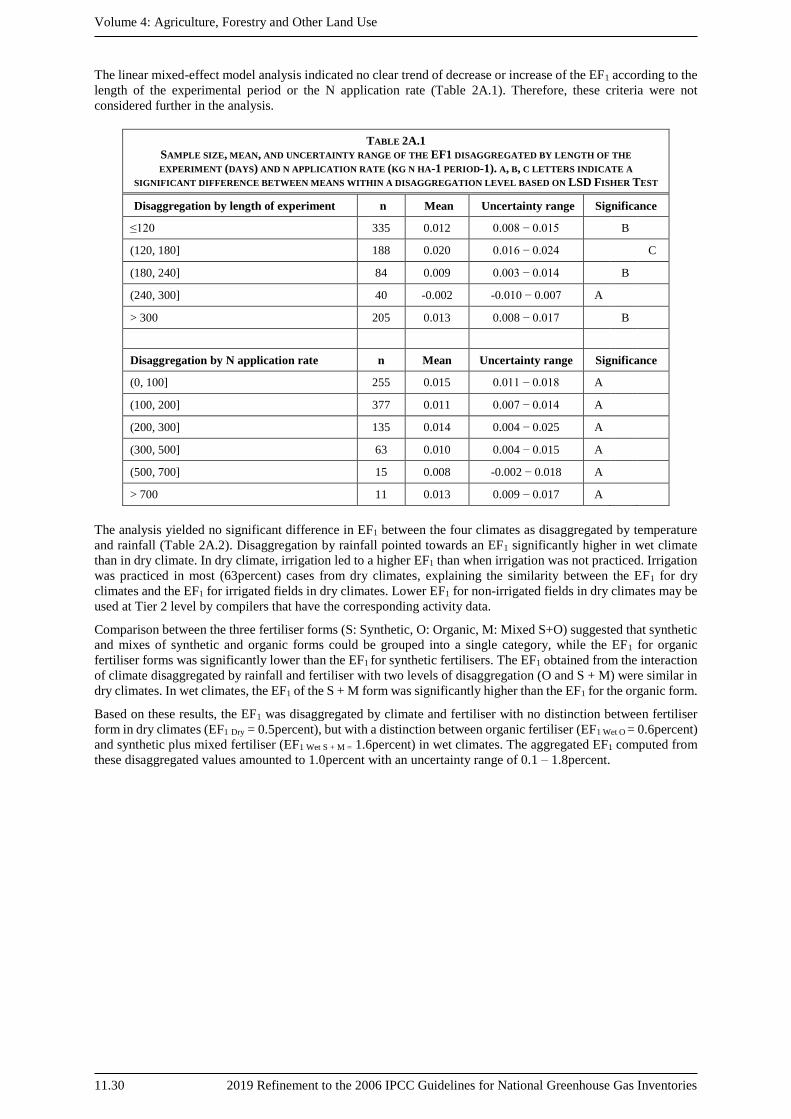
Volume 4: Agriculture, Forestry and Other Land Use
11.30 2019 Refinement to the 2006 IPCC Guidelines for National Greenhouse Gas Inventories
The linear mixed-effect model analysis indicated no clear trend of decrease or increase of the EF1 according to the
length of the experimental period or the N application rate (Table 2A.1). Therefore, these criteria were not
considered further in the analysis.
TABLE 2A.1
SAMPLE SIZE, MEAN, AND UNCERTAINTY RANGE OF THE EF1 DISAGGREGATED BY LENGTH OF THE
EXPERIMENT (DAYS) AND N APPLICATION RATE (KG N HA-1 PERIOD-1). A, B, C LETTERS INDICATE A
SIGNIFICANT DIFFERENCE BETWEEN MEANS WITHIN A DISAGGREGATION LEVEL BASED ON LSD FISHER TEST
Disaggregation by length of experiment n Mean Uncertainty range Significance
≤120 335 0.012 0.008 − 0.015 B
(120, 180] 188 0.020 0.016 − 0.024 C
(180, 240] 84 0.009 0.003 − 0.014 B
(240, 300] 40 -0.002 -0.010 − 0.007 A
> 300 205 0.013 0.008 − 0.017 B
Disaggregation by N application rate n Mean Uncertainty range Significance
(0, 100] 255 0.015 0.011 − 0.018 A
(100, 200] 377 0.011 0.007 − 0.014 A
(200, 300] 135 0.014 0.004 − 0.025 A
(300, 500] 63 0.010 0.004 − 0.015 A
(500, 700] 15 0.008 -0.002 − 0.018 A
> 700 11 0.013 0.009 − 0.017 A
The analysis yielded no significant difference in EF1 between the four climates as disaggregated by temperature
and rainfall (Table 2A.2). Disaggregation by rainfall pointed towards an EF1 significantly higher in wet climate
than in dry climate. In dry climate, irrigation led to a higher EF1 than when irrigation was not practiced. Irrigation
was practiced in most (63percent) cases from dry climates, explaining the similarity between the EF1 for dry
climates and the EF1 for irrigated fields in dry climates. Lower EF1 for non-irrigated fields in dry climates may be
used at Tier 2 level by compilers that have the corresponding activity data.
Comparison between the three fertiliser forms (S: Synthetic, O: Organic, M: Mixed S+O) suggested that synthetic
and mixes of synthetic and organic forms could be grouped into a single category, while the EF1 for organic
fertiliser forms was significantly lower than the EF1 for synthetic fertilisers. The EF1 obtained from the interaction
of climate disaggregated by rainfall and fertiliser with two levels of disaggregation (O and S + M) were similar in
dry climates. In wet climates, the EF1 of the S + M form was significantly higher than the EF1 for the organic form.
Based on these results, the EF1 was disaggregated by climate and fertiliser with no distinction between fertiliser
form in dry climates (EF1 Dry = 0.5percent), but with a distinction between organic fertiliser (EF1 Wet O = 0.6percent)
and synthetic plus mixed fertiliser (EF1 Wet S + M = 1.6percent) in wet climates. The aggregated EF1 computed from
these disaggregated values amounted to 1.0percent with an uncertainty range of 0.1 – 1.8percent.
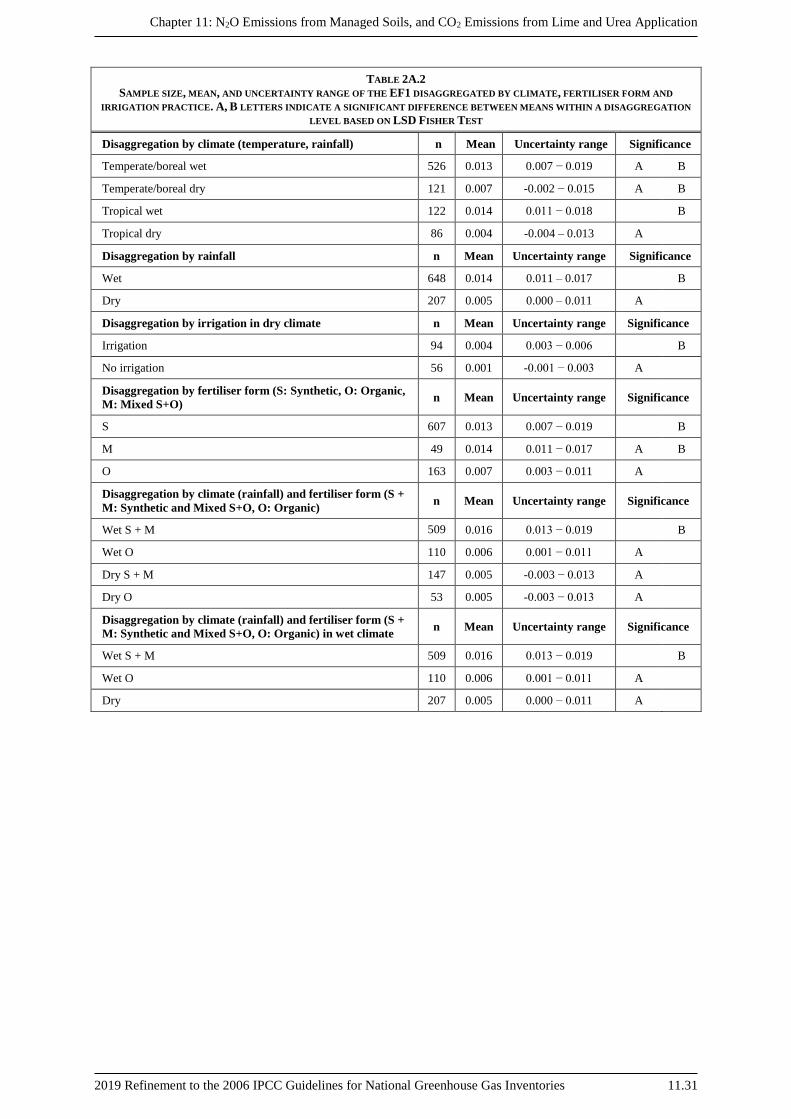
Chapter 11: N2O Emissions from Managed Soils, and CO2 Emissions from Lime and Urea Application
2019 Refinement to the 2006 IPCC Guidelines for National Greenhouse Gas Inventories 11.31
TABLE 2A.2
SAMPLE SIZE, MEAN, AND UNCERTAINTY RANGE OF THE EF1 DISAGGREGATED BY CLIMATE, FERTILISER FORM AND
IRRIGATION PRACTICE. A, B LETTERS INDICATE A SIGNIFICANT DIFFERENCE BETWEEN MEANS WITHIN A DISAGGREGATION
LEVEL BASED ON LSD FISHER TEST
Disaggregation by climate (temperature, rainfall) n Mean Uncertainty range Significance
Temperate/boreal wet 526 0.013 0.007 − 0.019 A B
Temperate/boreal dry 121 0.007 -0.002 − 0.015 A B
Tropical wet 122 0.014 0.011 − 0.018 B
Tropical dry 86 0.004 -0.004 – 0.013 A
Disaggregation by rainfall n Mean Uncertainty range Significance
Wet 648 0.014 0.011 – 0.017 B
Dry 207 0.005 0.000 – 0.011 A
Disaggregation by irrigation in dry climate n Mean Uncertainty range Significance
Irrigation 94 0.004 0.003 − 0.006 B
No irrigation 56 0.001 -0.001 − 0.003 A
Disaggregation by fertiliser form (S: Synthetic, O: Organic,
M: Mixed S+O) n Mean Uncertainty range Significance
S 607 0.013 0.007 − 0.019 B
M 49 0.014 0.011 − 0.017 A B
O 163 0.007 0.003 − 0.011 A
Disaggregation by climate (rainfall) and fertiliser form (S +
M: Synthetic and Mixed S+O, O: Organic) n Mean Uncertainty range Significance
Wet S + M 509 0.016 0.013 − 0.019 B
Wet O 110 0.006 0.001 − 0.011 A
Dry S + M 147 0.005 -0.003 − 0.013 A
Dry O 53 0.005 -0.003 − 0.013 A
Disaggregation by climate (rainfall) and fertiliser form (S +
M: Synthetic and Mixed S+O, O: Organic) in wet climate n Mean Uncertainty range Significance
Wet S + M 509 0.016 0.013 − 0.019 B
Wet O 110 0.006 0.001 − 0.011 A
Dry 207 0.005 0.000 − 0.011 A
Volume 4: Agriculture, Forestry and Other Land Use
11.32 2019 Refinement to the 2006 IPCC Guidelines for National Greenhouse Gas Inventories
Annex 11A.3 Estimation of Default Emission Factor(s) for
EF1FR
We extracted all studies with paddy rice field experiments that had a zero-N control from the databases by Akiyama
et al. (2005), Albanito et al. (2017) and Cayuela et al. (2017). We excluded studies which:
Were non-peer-reviewed publications;
Were conducted in the laboratory and greenhouses, and modelling studies (only field studies were selected);
Were conducted in upland rice fields;
Were less than 70 days in duration;
Related to grazed soils where urine and/or dung was applied; and
Related to manure or fertilizer treated with inhibitors.
The database contained 70 EF1FR values and the arithmetic mean was 0.4percentpercent. Water management
strongly affects N2O emission from paddy rice fields (Akiyama et al. 2005). Therefore, aggregated and
disaggregated values by water management were calculated based on arithmetic means and confidence intervals
were constructed to include 95percent of the distribution of measured emissions. Arithmetic mean of ‘continuous
flooding’ (0.3percent, n = 44) was lower than ‘with single and multiple drainage’ (0.5percent, n = 26). Only
‘continuous flooding and ‘with single and multiple drainage’ were considered for disaggregation of water
management, because the number of available data were not adequate to evaluate other drivers. For example, other
factors such as climate were not considered due to limited number of data.

Chapter 11: N2O Emissions from Managed Soils, and CO2 Emissions from Lime and Urea Application
2019 Refinement to the 2006 IPCC Guidelines for National Greenhouse Gas Inventories 11.33
Annex 11A.4 Estimation of Default Emission Factor(s) for
EF3PRP
We combined the dataset recently collated by Cai & Akiyama (2016) with 27 additional studies to derive EF3PRP
factors (Yamulki et al. 1998; Galbally et al. 2005; Liebig et al. 2008; Cardenas et al. 2016; Di et al. 2016;
Hoogendoorn et al. 2016; Hyde et al. 2016; Krol et al. 2016; Li et al. 2016; Luo et al. 2016; Marsden et al. 2016;
Misselbrook et al. 2016; Nichols et al. 2016; O’Connor et al. 2016; Owens et al. 2016; Pelster et al. 2016; Ward
et al. 2016; Balvert et al. 2017; Byrnes et al. 2017; Forrestal et al. 2017; Marsden et al. 2017; Owens et al. 2017;
Thomas et al. 2017a, b; Tully et al. 2017; van der Weerden et al. 2017; Cardoso et al. 2018; Chadwick et al. 2018;
Nichols et al. 2018). We excluded studies which:
Were non-peer-reviewed publications;
Were conducted in the laboratory and greenhouses, and modelling studies (only field studies were selected);
Were conducted in flooded rice fields;
Included fertiliser (manure or synthetic) additions;
Were less than 30 days in duration; and
Related to excreta treated with inhibitors.
The updated dataset contained 461 EF3PRP values, with urine dominating the data, representing 326 (= 71percent)
of the values. Data were collated from studies where excreta was deposited onto either pasture or forage crops
such as brassicas or fodder beets. Nitrogen sources were dung, real urine and artificial urine. Artificial urine
represented a substantial number of data values (72).
Research has shown that increasing soil water content generally results in greater N2O production and emission
from urine patches (de Klein et al. 2003, van der Weerden et al. 2014). Therefore, EF3PRP data have been
disaggregated by climate (dry and wet) for compilers with suitable activity data to allow disaggregation of
livestock classes by climate. The division between wet and dry in the tropics is based on 1000 mm of precipitation
(greater than 1000 mm equating with wet/moist climate), and the division in the temperate region is based on mean
annual precipitation:potential evapotranspiration ratio of 1 (greater than 1 equating with a wet/moist climate).
There are currently insufficient observations in the dataset to allow further climate disaggregation. Aggregated
values are also provided for compilers that are not able to disaggregate PRP N inputs by climate.
Disaggregated excreta EF3PRP values for cattle in wet and dry climates and sheep in wet and dry climates were
calculated from the urine and dung EF3PRP values reported in Table 4A.1, assuming a urine:dung nitrogen ratio of
0.66:0.34 (Kelliher et al. 2014). Disaggregated and aggregated excreta EF3PRP values are shown in Table 11.1.
There was no difference in excreta EF3PRP for sheep when disaggregated into wet and dry climates, therefore only
an aggregated value is provided.
The 95percent confidence intervals were calculated using the 2.5th and 97.5th percentile of the data. Where urine
and dung values have been aggregated to determine ‘excreta’ values, the 95percent confidence intervals for urine
and dung values have been converted to a proportion of the mean (see Fig. 3.3b in Volume 1, Chapter 3
‘Uncertainties’) and weighted according to the urine:dung nitrogen ratio. These weighted proportions were then
used to estimate the 2.5th and 97.5th percentile of the excreta values.
To determine whether there were significant differences in excreta EF3 values between different categories (e.g.
cattle vs. sheep), the data were analysed using a linear model. Excreta type (dung vs. urine vs. artificial urine),
livestock type (cattle vs. sheep), land use (pastoral vs. forage crop) and climate (wet vs. dry) were added as fixed
effects. There were very few data obtained from the same site, therefore site was not included in the model as a
random effect. Due to its non-normal distribution, however, data was log transformed using a log (x + a) approach,
(where a = 0.25percent). An a term was added due to the presence of several negative values.
Results showed a significant difference between real urine and artificial urine EF3PRP values (P = 0.05). However,
the analysis of data from two of the studies that included both real urine and artificial urine at similar N loads (de
Klein et al. 2003; Chadwick et al. 2018) showed urine type (real vs artificial) had no significant effect on EF3PRP
(P = 0.88, n = 16). On this basis, all artificial urine data were included, adding considerably more observations to
the dataset (i.e., 63 additional observations).
Excreta type and animal type were highly significant (both P < 0.001), while there was a significant interaction
between climate and animal type (P = 0.04). EF3PRP values for cattle and sheep dung and urine, in wet and dry
climates are shown in Table 4A.1.
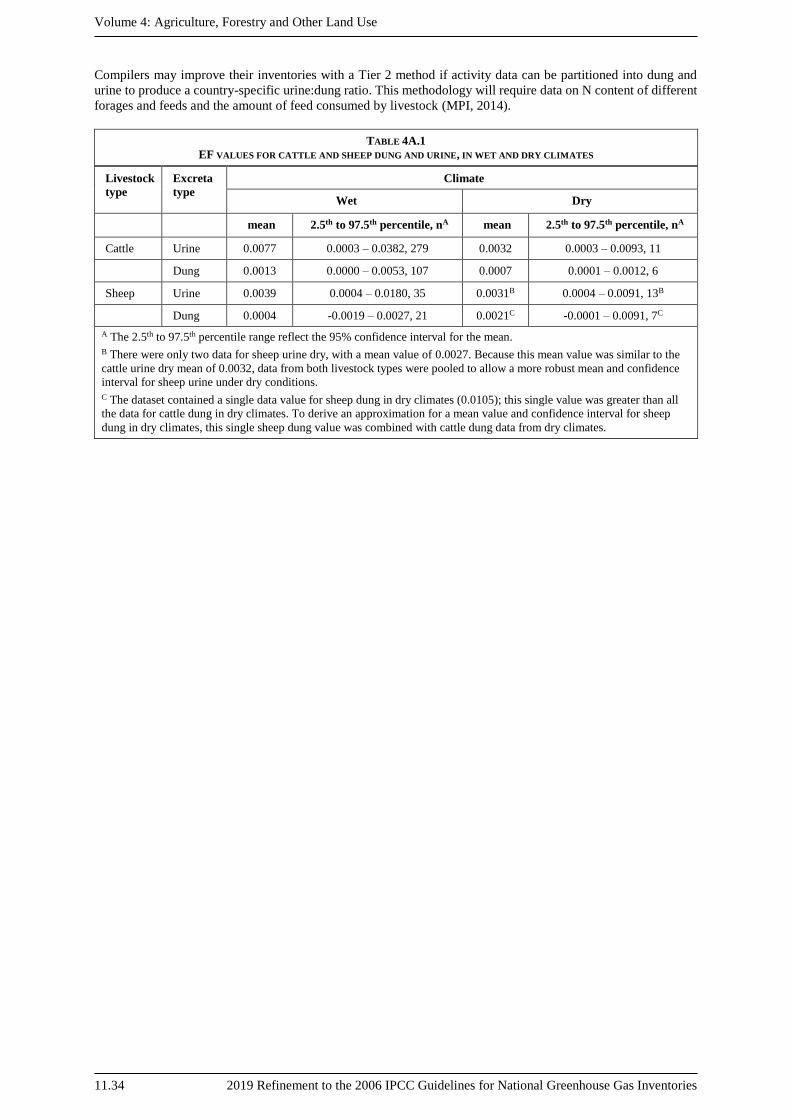
Volume 4: Agriculture, Forestry and Other Land Use
11.34 2019 Refinement to the 2006 IPCC Guidelines for National Greenhouse Gas Inventories
Compilers may improve their inventories with a Tier 2 method if activity data can be partitioned into dung and
urine to produce a country-specific urine:dung ratio. This methodology will require data on N content of different
forages and feeds and the amount of feed consumed by livestock (MPI, 2014).
TABLE 4A.1
EF VALUES FOR CATTLE AND SHEEP DUNG AND URINE, IN WET AND DRY CLIMATES
Livestock
type
Excreta
type
Climate
Wet Dry
mean 2.5th to 97.5th percentile, nA mean 2.5th to 97.5th percentile, nA
Cattle Urine 0.0077 0.0003 – 0.0382, 279 0.0032 0.0003 – 0.0093, 11
Dung 0.0013 0.0000 – 0.0053, 107 0.0007 0.0001 – 0.0012, 6
Sheep Urine 0.0039 0.0004 – 0.0180, 35 0.0031B 0.0004 – 0.0091, 13B
Dung 0.0004 -0.0019 – 0.0027, 21 0.0021C -0.0001 – 0.0091, 7C
A The 2.5th to 97.5th percentile range reflect the 95% confidence interval for the mean.
B There were only two data for sheep urine dry, with a mean value of 0.0027. Because this mean value was similar to the
cattle urine dry mean of 0.0032, data from both livestock types were pooled to allow a more robust mean and confidence
interval for sheep urine under dry conditions.
C The dataset contained a single data value for sheep dung in dry climates (0.0105); this single value was greater than all
the data for cattle dung in dry climates. To derive an approximation for a mean value and confidence interval for sheep
dung in dry climates, this single sheep dung value was combined with cattle dung data from dry climates.
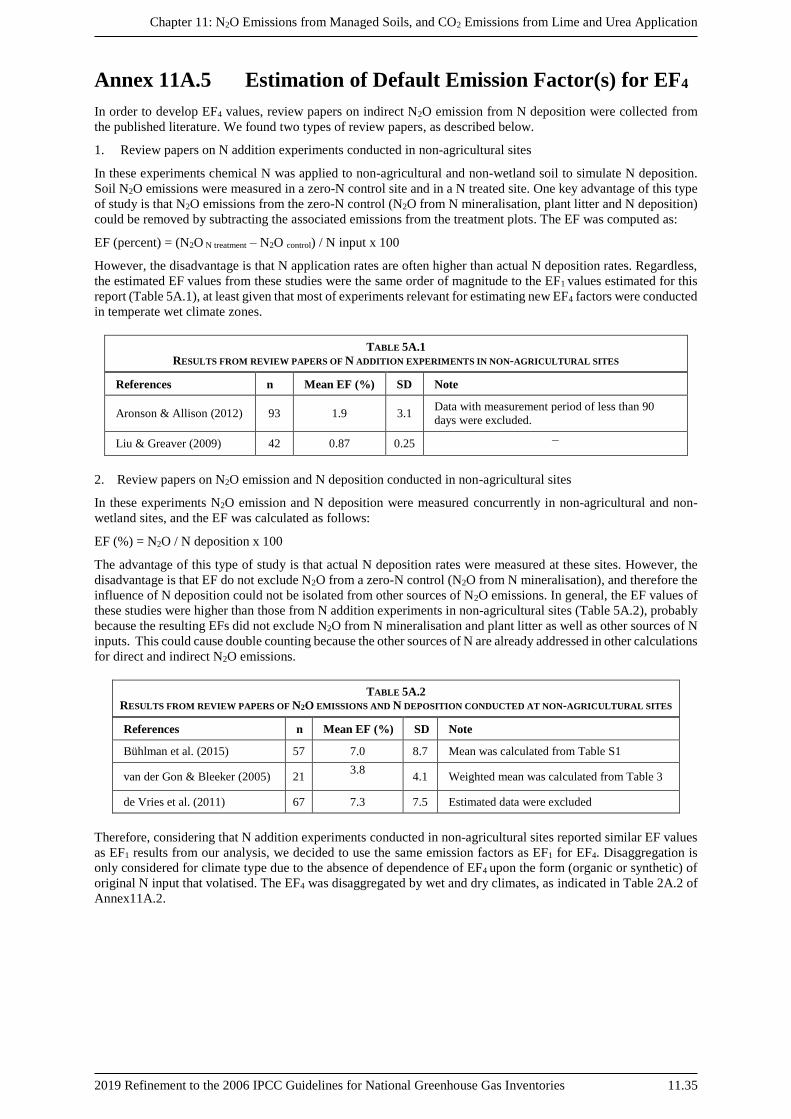
Chapter 11: N2O Emissions from Managed Soils, and CO2 Emissions from Lime and Urea Application
2019 Refinement to the 2006 IPCC Guidelines for National Greenhouse Gas Inventories 11.35
Annex 11A.5 Estimation of Default Emission Factor(s) for EF4
In order to develop EF4 values, review papers on indirect N2O emission from N deposition were collected from
the published literature. We found two types of review papers, as described below.
1. Review papers on N addition experiments conducted in non-agricultural sites
In these experiments chemical N was applied to non-agricultural and non-wetland soil to simulate N deposition.
Soil N2O emissions were measured in a zero-N control site and in a N treated site. One key advantage of this type
of study is that N2O emissions from the zero-N control (N2O from N mineralisation, plant litter and N deposition)
could be removed by subtracting the associated emissions from the treatment plots. The EF was computed as:
EF (percent) = (N2O N treatment – N2O control) / N input x 100
However, the disadvantage is that N application rates are often higher than actual N deposition rates. Regardless,
the estimated EF values from these studies were the same order of magnitude to the EF1 values estimated for this
report (Table 5A.1), at least given that most of experiments relevant for estimating new EF4 factors were conducted
in temperate wet climate zones.
TABLE 5A.1
RESULTS FROM REVIEW PAPERS OF N ADDITION EXPERIMENTS IN NON-AGRICULTURAL SITES
References n Mean EF (%) SD Note
Aronson & Allison (2012) 93 1.9 3.1 Data with measurement period of less than 90
days were excluded.
Liu & Greaver (2009) 42 0.87 0.25 –
2. Review papers on N2O emission and N deposition conducted in non-agricultural sites
In these experiments N2O emission and N deposition were measured concurrently in non-agricultural and non-
wetland sites, and the EF was calculated as follows:
EF (%) = N2O / N deposition x 100
The advantage of this type of study is that actual N deposition rates were measured at these sites. However, the
disadvantage is that EF do not exclude N2O from a zero-N control (N2O from N mineralisation), and therefore the
influence of N deposition could not be isolated from other sources of N2O emissions. In general, the EF values of
these studies were higher than those from N addition experiments in non-agricultural sites (Table 5A.2), probably
because the resulting EFs did not exclude N2O from N mineralisation and plant litter as well as other sources of N
inputs. This could cause double counting because the other sources of N are already addressed in other calculations
for direct and indirect N2O emissions.
TABLE 5A.2
RESULTS FROM REVIEW PAPERS OF N2O EMISSIONS AND N DEPOSITION CONDUCTED AT NON-AGRICULTURAL SITES
References n Mean EF (%) SD Note
Bühlman et al. (2015) 57 7.0 8.7 Mean was calculated from Table S1
van der Gon & Bleeker (2005) 21 3.8
4.1 Weighted mean was calculated from Table 3
de Vries et al. (2011) 67 7.3 7.5 Estimated data were excluded
Therefore, considering that N addition experiments conducted in non-agricultural sites reported similar EF values
as EF1 results from our analysis, we decided to use the same emission factors as EF1 for EF4. Disaggregation is
only considered for climate type due to the absence of dependence of EF4 upon the form (organic or synthetic) of
original N input that volatised. The EF4 was disaggregated by wet and dry climates, as indicated in Table 2A.2 of
Annex11A.2.

Volume 4: Agriculture, Forestry and Other Land Use
11.36 2019 Refinement to the 2006 IPCC Guidelines for National Greenhouse Gas Inventories
Annex 11A.6 Estimation of Default Emission Factor(s) for EF5
We collected peer-reviewed papers on EF5 for in situ field studies (Tian et al. 2019). The final dataset contained
254 data observations (EF5g: n = 101, EF5r: n = 91, EF5e: n = 23).
The EF5g, EF5r and EF5e are defined as:
EF5g: groundwater (soil solution and lysimeter leaching water were not included), spring, surface drainage, and
upstream emissions (upstream supersaturated with N2O, N2O emitted mainly from degassing of groundwater)
EF5r: rivers, reservoirs (including lake and pond), and downstream emissions (supersaturated N2O was already
degassed and N2O mainly produced by nitrification/denitrification in situ).
EF5e: estuary emissions (only including inner estuaries or lower reaches of river that are close to the river mouth,
while outer estuaries and coastal seawater are excluded)
We found a lack of consistency in dividing EF5g and EF5r for streams based on the literature, at least in some
studies. Here, we categorized data into EF5g based on upstream supersaturated with N2O where N2O is emitted
mainly from degassing of groundwater, and EF5r based on downstream, supersaturated N2O that was already
degassed and N2O mainly produced by nitrification/denitrification in situ.
Note that the N sources in most rivers include both agricultural (mainly arable farming and grazing grassland) and
urban sewage. However, we found it was difficult to separate the different N sources based on the limited
information in the publications. Therefore, our dataset on EF5r includes non-agricultural N source.
Most estuaries are impacted by urban waste water and aquaculture in addition to agriculture. However, all available
data were included because of their limited number.
Arithmetic mean emission factors were calculated as follows; EF5g: 0.0060 kg N2O–N/kg NO3-N in the water,
EF5r: 0.0026 kg N2O–N/kg NO3-N in the water and EF5e: 0.0026 kg N2O–N/kg NO3-N in the water.
EF5 was calculated as follows:
EF5 = EF5g + EF5r + EF5e
Uncertainty range is based on the 2.5th to 97.5th percentile.

Chapter 11: N2O Emissions from Managed Soils, and CO2 Emissions from Lime and Urea Application
2019 Refinement to the 2006 IPCC Guidelines for National Greenhouse Gas Inventories 11.37
Annex 11A.7 Estimation of Default Factor(s) for FracGASF
The Tier 1 aggregated default NH3 + NOx EF for emissions from synthetic fertiliser has been derived as the
arithmetic mean of default EF values for the different types of individual N fertilisers. Individual fertiliser types
were weighted according to their use in the period 2007-2015 as reported by the International Fertilizer Industry
Association (IFA) (Table A7.1), based on world fertiliser usage. For countries that require inventories for air
pollutant emissions, there is a continuous update of NH3 and NO EF values through the EMEP/EEA air pollutant
emission inventory guidebook (European Environment Agency, 2016).
TABLE 7A.1
FERTILISER CONSUMPTION IN THE PERIOD 2007-2015 EXPRESSED AS THOUSAND TONNES NUTRIENTS AND % OF
TOTAL FERTILISER CONSUMED (SOURCE: IFA: HTTP://IFADATA.FERTILIZER.ORG/ )
Fertiliser product 2007-2015 %
Ammonia (direct application) 35823 4%
AS 27931 3%
Urea 442550 50%
AN 53676 6%
CAN 29624 3%
Nitrogen solutions 46870 5%
Other N straight 45722 5%
AP 55692 6%
Other NP (N) 17911 2%
N K compound (N) 2372 0.3%
N P K compound (N) 127227 14%
Where Ammonia (direct application) = anhydrous ammonia, AS= ammonium sulphate, AN=Ammonium nitrate,
CAN= calcium ammonium nitrate and AP= ammonium phosphate
For disaggregation, we divided all fertiliser usage into 4 types of fertiliser categories based on their basic chemical
composition: urea, ammonium-based (ammonia-direct application, AS, and AP), nitrate-based (N K compound-
N) and ammonium-nitrate-based (AN, CAN, Nitrogen solutions, Other N straight, Other NP-N and N P K
compound-N). For weighting purposes, assumptions on chemical compositions had to be considered for different
fertiliser types reported by IFA for compound fertilisers and for those fertilisers that had not been tested in our
experimental datasets. We assumed that emissions from these fertiliser types were those obtained from the mean
value of a mix of different straight fertilisers for different IFA fertiliser products, in the absence of clear statistics
on their composition and based on qualitative assessments (Table A7.2).
TABLE 7A.2
ASSUMPTIONS ON THE POTENTIAL MIX OF DIFFERENT IFA FERTILISER PRODUCTS
Fertiliser product Fertiliser Mix
Nitrogen solutions Urea (50%), AN (25%), CAN (25%)
Other N straight AN (50%), CAN (50%)
Other NP (N) AN (50%), CAN (50%)
AP MAP (50%), DAP (50%)
N K compound (N) Sodium Nitrate
N P K compound (N) AN (50%), CAN (50%)
Where AN = Ammonium nitrate, CAN = calcium ammonium nitrate AS = ammonium sulphate, AP = ammonium
phosphate, MAP = monoammonium phosphate and DAP = diammonium phosphate.
For NH3, we used the datasets of peer-reviewed studies from the Bouwman et al. (2002) meta-analysis and the
recently published dataset collated by Pan et al. (2016). A total number of 273 studies were used, and included
most of the common fertiliser types. Although data were primarily obtained from studies comparing NH3 emissions
from different fertiliser types, we also included emissions data from other studies that were conducted for other

Volume 4: Agriculture, Forestry and Other Land Use
11.38 2019 Refinement to the 2006 IPCC Guidelines for National Greenhouse Gas Inventories
purposes (e.g., assessing effect of urease inhibitors, application rate, and amendments) by using the EF values
from the control treatments.
For NOx, we used the dataset of peer-reviewed studies collated by Liu et al. (2017). For the Tier1 EF, we used the
data from 54 studies (171 field measurements) comprising information on NO emissions by aggregating data from
all types of fertiliser. Furthermore, to develop the disaggregated NOx EFs, we estimated values that were specific
to different fertiliser types.
Median EF values for each fertiliser type for both NH3 and NOx are shown in Table A7.3. Median instead of mean
values were used due to skewed right distribution of the data.
TABLE 7A.3
EMISSION FACTORS FOR % NH3–N AND NOX-N (N APPLIED) –1) FROM DIFFERENT FERTILISER TYPES RESULTING
FROM TWO META-ANALYSIS AND NUMBER OF STUDIES INVOLVED
% lost as N number of studies
Fertiliser Total NH3-N NOx-N Total NH3-N NOx-N
urea 15.3% 14.2% 1.1% 209 187 22
AS 10.2% 9.5% 0.7% 41 37 4
AN 6.0% 3.0% 2.9% 34 23 11
CAN 3.2% 1.6% 1.6% 7 6 1
DAP 9.8% 9.1% 0.7% 11 8 3
MAP 6.0% 5.3% 0.7% 3 2 1
Sodium Nitrate 1.2% 0.2% 1.0% 4 1 3
AA 3% 2.9% 0.1% 2 1 1
Where AS = ammonium sulphate, AN = Ammonium nitrate, CAN = calcium ammonium nitrate, DAP = diammonium
phosphate, MAP = monoammonium phosphate and AA = anhydrous ammonia.
EF values for NH3 emissions were compared with those obtained using the method to predict NH3 emissions in
the current EMEP/EEA guidelines (EMEP/EEA, 2016). The EF for NH3-N from urea (14.2percent) is lower than
the range of 15.5-21percent from current EMEP/EEA guidelines values, which depend on soil pH and temperature
conditions, but similar to Bouwman et al. (2002) and Pan et al. (2016) values. Discrepancies are likely to arise
based on the assumptions taken and analytical choices (e.g. use of mean vs. median). Moreover, it must be noted
that future revisions to the EMEP/EEA guidebook are expected to use most of the same data utilized in this report
and therefore, EFs may be updated in the EMEP/EEA guidebook (2016).

Chapter 11: N2O Emissions from Managed Soils, and CO2 Emissions from Lime and Urea Application
2019 Refinement to the 2006 IPCC Guidelines for National Greenhouse Gas Inventories 11.39
Annex 11A.8 Estimation of Default Factor for FracGASM
Review papers on NH3 and NO were collected to derive the fraction of N that is volatilised. Field measurement
data with manure or slurry application and excreta patches were extracted from the published literature (see below).
Field measurement data with chemical N application as well as studies with a focus on mitigation technologies,
such as nitrification inhibitors or urease inhibitors were excluded from this analysis.
For NH3, the arithmetic mean was calculated from Bouwman et al. (2002) and Cai & Akiyama (2016). For NO,
the mean and uncertainty range were calculated from Cai & Akiyama (2016) and Liu et al (2017). The difference
between mean EF for cattle and sheep excreta were negligible, thus livestock type was not considered. The default
FracGASM was derived as the sum of the arithmetic mean of NH3 EF and NOx EF. The uncertainty range was based
on 2.5th and 97.5th percentile.
TABLE 8A.1
EMISSION FACTORS FOR NH3–N AND NOX-N (N APPLIED –1) FROM MANURE OR SLURRY APPLICATION AND EXCRETA
PATCHES
n Mean Range (2.5th to 97.5th percentile) Source of data
NOx 40 0.015 0 – 0.149 Liu et al. (2017)
NH3 172 0.197 0 – 0.295 Bouwman et al. (2002), Cai & Akiyama
(2016)
NOx + NH3 212 0.212 0 – 0.312 References listed above
Volume 4: Agriculture, Forestry and Other Land Use
11.40 2019 Refinement to the 2006 IPCC Guidelines for National Greenhouse Gas Inventories
Annex 11A.9 Estimation of Default Factor for FracLEACH-(H)
We collected review papers (Di & Cameron 2002; Cai & Akiyama 2016) and original papers on N leaching for
this analysis (Moreno et al. 1996; Diez et al. 1997; Catt et al. 1998; Sogbedji et al. 2000; Asadi et al. 2002;
Readman et al. 2002; Ren et al. 2003; Dauden & Quilez 2004; Dauden et al. 2004; Diez et al. 2004; Bakhsh et al.
2005; Basso & Ritchie 2005; Gehl et al. 2005; Fang et al. 2006; Li et al. 2006; Diez-Lopez et al. 2008; Conrad &
Fohrer 2009; Zhu et al. 2009; Aronsson & Stenberg 2010; Bakhsh et al. 2010; Salmeron et al. 2010; Yague &
Quilez 2010; Claret et al. 2011; Huang et al. 2011; Gallejones et al. 2012; Perego et al. 2012; Sorensen & Rubaek
2012; Tafteh & Sepaskhah 2012; Wang et al. 2012). Only peer-reviewed studies that used lysmeters and in-situ
field measurements were included. Studies conducted in the laboratory were excluded, along with studies that used
mitigation technologies such as nitrification inhibitor. The final dataset contained 355 data observations from
which the arithmetic mean and uncertainty range for a 95percent confidence interval were calculated.

Chapter 11: N2O Emissions from Managed Soils, and CO2 Emissions from Lime and Urea Application
2019 Refinement to the 2006 IPCC Guidelines for National Greenhouse Gas Inventories 11.41
References
REFERENCES NEWLY CITED IN THE 2019 REFINEMENT
Aguilera, E., Lassaletta, L., Sanz-Cobena, A., Garnier, J. & Vallejo, A. (2013) The potential of organic fertilizers
and water management to reduce N2O emissions in Mediterranean climate cropping systems. A review.
Agriculture, Ecosystems & Environment 164: 32-52.
Akiyama, H., Yagi, K. & Yan, X. (2005) Direct N2O emissions from rice paddy fields: Summary of available data.
Global Biogeochemical Cycles 19(1).
Akiyama, H., Yan, X. & Yagi, K. (2010) Evaluation of effectiveness of enhanced-efficiency fertilizers as
mitigation options for N2O and NO emissions from agricultural soils: meta-analysis. Global Change Biology
16(6): 1837-1846.
Albanito, F., Lebender, U., Cornulier, T., Sapkota, T. B., Brentrup, F., Stirling, C. & Hillier, J. (2017) Direct
nitrous oxide emissions from tropical and sub-tropical agricultural systems – A review and modelling of
emission factors. Scientific reports 7.
Aronson, E. & Allison, S. (2012) Meta-analysis of environmental impacts on nitrous oxide release in response to
N amendment. Frontiers in Microbiology 3.
Aronsson, H. & Stenberg, M. (2010) Leaching of nitrogen from a 3-yr grain crop rotation on a clay soil. Soil Use
and Management 26(3): 274-285.
Asadi, M., Clemente, R., Das Gupta, A., Loof, R. & Hansen, G. (2002) Impacts of fertigation via sprinkler
irrigation on nitrate leaching and corn yield in an acid-sulphate soil in Thailand. Agricultural Water
Management 52(3): 197-213.
Bakhsh, A., Kanwar, R. & Baker, J. (2010) N-Application Methods and Precipitation Pattern Effects on Subsurface
Drainage Nitrate Losses and Crop Yields. Water Air and Soil Pollution 212(1-4): 65-76.
Bakhsh, A., Kanwar, R. & Karlen, D. (2005) Effects of liquid swine manure applications on NO3-N leaching losses
to subsurface drainage water from loamy soils in Iowa. Agriculture Ecosystems & Environment 109(1-2): 118-
128.
Balvert, S. F., Luo, J. & Schipper, L. A. (2017) Do glucosinolate hydrolysis products reduce nitrous oxide
emissions from urine affected soil? Science of The Total Environment 603-604: 370-380.
Basso, B. & Ritchie, J. (2005) Impact of compost, manure and inorganic fertilizer on nitrate leaching and yield for
a 6-year maize-alfalfa rotation in Michigan. Agriculture Ecosystems & Environment 108(4): 329-341.
Bouwman, A. F., Boumans, L. J. M. & Batjes, N. H. (2002) Estimation of global NH3 volatilization loss from
synthetic fertilizers and animal manure applied to arable lands and grasslands. Global Biogeochemical Cycles
16(2): 8-1.
Bühlmann, T., Hiltbrunner, E., Korner, C., Rihm, B. & Achermann, B. (2015) Induction of indirect N2O and NO
emissions by atmospheric nitrogen deposition in (semi-)natural ecosystems in Switzerland. Atmospheric
Environment 103: 94-101.
Byrnes, R. C., Nùñez, J., Arenas, L., Rao, I., Trujillo, C., Alvarez, C., Arango, J., Rasche, F. & Chirinda, N. (2017)
Biological nitrification inhibition by Brachiaria grasses mitigates soil nitrous oxide emissions from bovine
urine patches. Soil Biology and Biochemistry 107: 156-163.
Cai, Y. & Akiyama, H. (2016) Nitrogen loss factors of nitrogen trace gas emissions and leaching from excreta
patches in grassland ecosystems: A summary of available data. Science of The Total Environment 572: 185-
195.
Cardenas, L. M., Misselbrook, T. M., Hodgson, C., Donovan, N., Gilhespy, S., Smith, K. A., Dhanoa, M. S. &
Chadwick, D. (2016) Effect of the application of cattle urine with or without the nitrification inhibitor DCD,
and dung on greenhouse gas emissions from a UK grassland soil. Agriculture, Ecosystems and Environment
235: 229-241.
Cardoso, A. D. S., Alves, B. J. R., Urquiaga, S. & Boddey, R. M. (2018) Effect of volume of urine and mass of
faeces on N2O and CH4 emissions of dairy-cow excreta in a tropical pasture. Animal Production Science 58(6):
1079-1086.

Volume 4: Agriculture, Forestry and Other Land Use
11.42 2019 Refinement to the 2006 IPCC Guidelines for National Greenhouse Gas Inventories
Catt, J., Howse, K., Christian, D., Lane, P., Harris, G. & Goss, M. (1998) Strategies to decrease nitrate leaching in
the Brimstone Farm Experiment, Oxfordshire, UK, 1988-93: the effect of straw incorporation. Journal of
Agricultural Science 131: 309-319.
Cayuela, M. L., Aguilera, E., Sanz-Coben, a. A., Adams, D. C., Abalos, D., Barton, L., Ryals, R., Silver, W. L.,
Alfaro, M. A., Pappa, V. A., Smith, P., Garnier, J., Billen, G., Bouwman, L., Bondeau, A. & Lassaletta, L.
(2017) Direct nitrous oxide emissions in Mediterranean climate cropping systems: Emission factors based on
a meta-analysis of available measurement data. . Agric Ecosyst Environ. 238: 25-35.
Chadwick, D., Sommer, S., Thorman, R., Fangueiro, D., Cardenas, L., Amon, B. & Misselbrook, T. (2011) Manure
management: Implications for greenhouse gas emissions. Animal Feed Science and Technology 166-167: 514-
531.
Chadwick, D. R., Cardenas, L. M., Dhanoa, M. S., Donovan, N., Misselbrook, T., Williams, J. R., Thorman, R.
E., McGeough, K. L., Watson, C. J., Bell, M., Anthony, S. G. & Rees, R. M. (2018) The contribution of cattle
urine and dung to nitrous oxide emissions: Quantification of country specific emission factors and implications
for national inventories. Science of The Total Environment 635: 607-617.
Claret, M., Urrutia, R., Ortega, R., Best, S. & Valderrama, N. (2011) Quantifying nitrate leaching in irrigated
wheat with different nitrogen fertilization strategies in an Alfisol. Chilean Journal of Agricultural Research
71(1): 148-156.
Conrad, Y. & Fohrer, N. (2009) Modelling of nitrogen leaching under a complex winter wheat and red clover crop
rotation in a drained agricultural field. Physics and Chemistry of the Earth 34(8-9): 530-540.
Dauden, A. & Quilez, D. (2004) Pig slurry versus mineral fertilization on corn yield and nitrate leaching in a
Mediterranean irrigated environment. European Journal of Agronomy 21(1): 7-19.
Dauden, A., Quilez, D. & Vera, M. (2004) Pig slurry application and irrigation effects on nitrate leaching in
Mediterranean soil lysimeters. Journal of Environmental Quality 33(6): 2290-2295.
De Klein, C. A. M., Barton, L., Sherlock, R. R., Li, Z. & Littlejohn, R. P. (2003) Estimating a nitrous oxide
emission factor for animal urine from some New Zealand pastoral soils. 41(3): 381-399.
De Vries, W., Kros, J., Reinds, G. & Butterbach-Bahl, K. (2011) Quantifying impacts of nitrogen use in European
agriculture on global warming potential. Current Opinion in Environmental Sustainability 3(5): 291-302.
Di, H. J., Cameron, K. C., Podolyan, A., Edwards, G. R., de Klein, C. A. M., Dynes, R. & Woods, R. (2016) The
potential of using alternative pastures, forage crops and gibberellic acid to mitigate nitrous oxide emissions.
Journal of Soils and Sediments 16(9): 2252-2262.
Diez, J., Hernaiz, P., Munoz, M., de la Torre, A. & Vallejo, A. (2004) Impact of pig slurry on soil properties, water
salinization, nitrate leaching and crop yield in a four-year experiment in Central Spain. Soil Use and
Management 20(4): 444-450.
Diez, J., Roman, R., Caballero, R. & Caballero, A. (1997) Nitrate leaching from soils under a maize-wheat-maize
sequence, two irrigation schedules and three types of fertilisers. Agriculture Ecosystems & Environment 65(3):
189-199.
Diez-Lopez, J., Hernaiz-Algarra, P., Arauzo-Sanchez, M. & Carrasco-Martin, I. (2008) Effect of a nitrification
inhibitor (DMPP) on nitrate leaching and maize yield during two growing seasons. Spanish Journal of
Agricultural Research 6(2): 294-303.
European Environment Agency. (2016) EMEP/EEA air pollutant emission inventory guidebook 2016. Technical
guidance to prepare national emission inventories. Luxembourg: Publications Office of the European Union.
Fang, Q., Yu, Q., Wang, E., Chen, Y., Zhang, G., Wang, J. & Li, L. (2006) Soil nitrate accumulation, leaching and
crop nitrogen use as influenced by fertilization and irrigation in an intensive wheat-maize double cropping
system in the North China Plain. Plant and Soil 284(1-2): 335-350.
Flechard, C. R., Ambus, P., Skiba, U. M., Rees, R. M., Hensen, A., van Amstel, A., Pol-van Dasselaar, A. V.,
Soussana, J. F., Jones, M., Clifton-Brown, J., Raschi, A., Horvath, L., Neftel, A., Jocher, M., Ammann, C.,
Leifeld, J., Fuhrer, J., Calanca, P., Thalman, E., Pilegaard, K., Di Marco, C., Campbell, C., Nemitz, E.,
Hargreaves, K. J., Levy, P. E., Ball, B. C., Jones, S. K., van de Bulk, W. C. M., Groot, T., Blom, M.,
Domingues, R., Kasper, G., Allard, V., Ceschia, E., Cellier, P., Laville, P., Henault, C., Bizouard, F., Abdalla,
M., Williams,
Chapter 11: N2O Emissions from Managed Soils, and CO2 Emissions from Lime and Urea Application
2019 Refinement to the 2006 IPCC Guidelines for National Greenhouse Gas Inventories 11.43
Forrestal, P. J., Krol, D. J., Lanigan, G. J., Jahangir, M. M. R. & Richards, K. G. (2017) An evaluation of urine
patch simulation methods for nitrous oxide emission measurement. Journal of Agricultural Science 155(5):
725-732.
Galbally, I., Meyer, M., Bentley, S., Weeks, I., Leuning, R., Kelly, K., Phillips, F., Barker-Reid, F., Gates, W.,
Baigent, R., Eckard, R. & Grace, P. (2005) A study of environmental and management drivers of non-CO2
greenhouse gas emissions in Australian agro-ecosystems. Environmental Sciences 2(2-3): 133-142.
Gallejones, P., Castellon, A., del Prado, A., Unamunzaga, O. & Aizpurua, A. (2012) Nitrogen and sulphur
fertilization effect on leaching losses, nutrient balance and plant quality in a wheat-rapeseed rotation under a
humid Mediterranean climate. Nutrient Cycling in Agroecosystems 93(3): 337-355.
Gehl, R., Schmidt, J., Stone, L., Schlegel, A. & Clark, G. (2005) In situ measurements of nitrate leaching implicate
poor nitrogen and irrigation management on sandy soils. Journal of Environmental Quality 34(6): 2243-2254.
Gerber, J. S., Carlson, K. M., Makowski, D., Mueller, N. D., Garcia de Cortazar-Atauri, I., Havlík, P., Herrero,
M., Launay, M., O’Connell, C. S., Smith, P. & West, P. C. (2016) Spatially explicit estimates of N2O emissions
from croplands suggest climate mitigation opportunities from improved fertilizer management. Global Change
Biology 22(10): 3383-3394.
Gilsanz, C., Baez, D., Misselbrook, T. H., Dhanoa, M. S. & Cardenas, L. M. (2016) Development of emission
factors and efficiency of two nitrification inhibitors, DCD and DMPP. . Agric. Ecosyst. Environ. 216: 1-8.
Grace, P., Shcherbak, I., Macdonald, B., Scheer, C. & Rowlings, D. (2016) Emission factors for estimating
fertiliser-induced nitrous oxide emissions from clay soils in Australia’s irrigated cotton industry. Soil Research
54(5): 598-603.
Graham, R., Wortman, S. & Pittelkow, C. (2017) Comparison of Organic and Integrated Nutrient Management
Strategies for Reducing Soil N2O Emissions. Sustainability 9(4): 510.
Hoogendoorn, C. J., Luo, J., Lloyd-West, C. M., Devantier, B. P., Lindsey, S. B., Sun, S., Pacheco, D., Li, Y.,
Theobald, P. W. & Judge, A. (2016) Nitrous oxide emission factors for urine from sheep and cattle fed forage
rape (Brassica napus L.) or perennial ryegrass/white clover pasture (Lolium perenne L./Trifolium repens).
Agriculture, Ecosystems and Environment 227: 11-23.
Huang, M., Liang, T., Ou-Yang, Z., Wang, L., Zhang, C. & Zhou, C. (2011) Leaching losses of nitrate nitrogen
and dissolved organic nitrogen from a yearly two crops system, wheat-maize, under monsoon situations.
Nutrient Cycling in Agroecosystems 91(1): 77-89.
Hyde, B. P., Forrestal, P. J., Jahangir, M. M. R., Ryan, M., Fanning, A. F., Carton, O. T., Lanigan, G. J. & Richards,
K. G. (2016) The interactive effects of fertiliser nitrogen with dung and urine on nitrous oxide emissions in
grassland. Irish Journal of Agricultural and Food Research 55(1): 1-9.
Kelliher, F. M., Cox, N., Van Der Weerden, T. J., De Klein, C. A. M., Luo, J., Cameron, K. C., Di, H. J., Giltrap,
D. & Rys, G. (2014) Statistical analysis of nitrous oxide emission factors from pastoral agriculture field trials
conducted in New Zealand. Environmental Pollution 186: 63-66.
Krol, D. J., Carolan, R., Minet, E., McGeough, K. L., Watson, C. J., Forrestal, P. J., Lanigan, G. J. & Richards, K.
G. (2016) Improving and disaggregating N2O emission factors for ruminant excreta on temperate pasture soils.
Science of The Total Environment 568: 327-338.
Li, C., Farahbakhshazad, N., Jaynes, D., Dinnes, D., Salas, W. & McLaughlin, D. (2006) Modeling nitrate leaching
with a biogeochemical model modified based on observations in a row-crop field in Iowa. Ecological
Modelling 196(1-2): 116-130.
Li, J., Luo, J., Shi, Y., Li, Y., Ma, Y., Ledgard, S., Wang, L., Houlbrooke, D., Bo, L. & Lindsey, S. (2016) Dung
and farm dairy effluent affect urine patch nitrous oxide emissions from a pasture. Animal Production Science
56(3): 337-342.
Liebig, M. A., Kronberg, S. L. & Gross, J. R. (2008) Effects of normal and altered cattle urine on short-term
greenhouse gas flux from mixed-grass prairie in the Northern Great plains. Agriculture Ecosystems &
Environment 125(1-4): 57-64.
Liu, L. & Greaver, T. (2009) A review of nitrogen enrichment effects on three biogenic GHGs: the CO2 sink may
be largely offset by stimulated N2O and CH4 emission. Ecology Letters 12(10): 1103-1117.

Volume 4: Agriculture, Forestry and Other Land Use
11.44 2019 Refinement to the 2006 IPCC Guidelines for National Greenhouse Gas Inventories
Liu, S., Lin, F., Wu, S., Ji, C., Sun, Y., Jin, Y., Li, S., Li, Z. & Zou, J. (2017) A meta-analysis of fertilizer-induced
soil NO and combined NO+N2O emissions. Global Change Biology 23(6): 2520-2532.
Luo, J., Ledgard, S., Wise, B. & Lindsey, S. (2016) Effect of dicyandiamide (DCD) on nitrous oxide emissions
from cow urine deposited on a pasture soil, as influenced by DCD application method and rate. Animal
Production Science 56(3): 350-354.
M., Baronti, S., Berretti, F. & Grosz, B. (2007) Effects of climate and management intensity on nitrous oxide
emissions in grassland systems across Europe. Agr. Ecosyst. Environ. 121: 135-152.
Marsden, K. A., Jones, D. L. & Chadwick, D. R. (2016) Disentangling the effect of sheep urine patch size and
nitrogen loading rate on cumulative N2O emissions. Animal Production Science 56(3): 265-275.
Marsden, K. A., Jones, D. L. & Chadwick, D. R. (2017) DMPP is ineffective at mitigating N2O emissions from
sheep urine patches in a UK grassland under summer conditions. Agriculture, Ecosystems and Environment
246: 1-11.
Misselbrook, T., Fleming, H., Camp, V., Umstatter, C., Duthie, C. A., Nicoll, L. & Waterhouse, T. (2016)
Automated monitoring of urination events from grazing cattle. Agriculture, Ecosystems and Environment 230:
191-198.
Moreno, F., Cayuela, J., Fernandez, J., FernandezBoy, E., Murillo, J. & Cabrera, F. (1996) Water balance and
nitrate leaching in an irrigated maize crop in SW Spain. Agricultural Water Management 32(1): 71-83.
MPI. (2014) Partitioning of animal excreta N into urine and dung and developing the N2O inventory. In: MPI
Technical Paper, p. 26. Wellington, NZ: Ministry for Primary Industries.
Nichols, K. L., Del Grosso, S. J., Derner, J. D., Follett, R. F., Archibeque, S. L., Delgado, J. A. & Paustian, K. H.
(2018) Nitrous oxide and ammonia emissions from cattle excreta on shortgrass steppe. Journal of
Environmental Quality 47(3): 419-426.
Nichols, K. L., Del Grosso, S. J., Derner, J. D., Follett, R. F., Archibeque, S. L., Stewart, C. E. & Paustian, K. H.
(2016) Nitrous oxide and methane fluxes from cattle excrement on C3 pasture and C4-dominated shortgrass
steppe. Agriculture, Ecosystems and Environment 225: 104-115.
O’Connor, P. J., Minogue, D., Lewis, E., Lynch, M. B. & Hennessy, D. (2016) Applying urine collected from non-
lactating dairy cows dosed with dicyandiamide to lysimeters and grass plots: Effects on nitrous oxide
emissions, nitrate leaching and herbage production. Journal of Agricultural Science 154(4): 674-688.
Owens, J., Clough, T. J., Laubach, J., Hunt, J. E. & Venterea, R. T. (2017) Nitrous oxide fluxes and soil oxygen
dynamics of soil treated with cow urine. Soil Science Society of America Journal 81(2): 289-298.
Owens, J., Clough, T. J., Laubach, J., Hunt, J. E., Venterea, R. T. & Phillips, R. L. (2016) Nitrous oxide fluxes,
soil oxygen, and denitrification potential of urine- and non-urine-treated soil under different irrigation
frequencies. Journal of Environmental Quality 45(4): 1169-1177.
Pan, B., Lam, S. K., Mosier, A., Luo, Y. & Chen, D. (2016) Ammonia volatilization from synthetic fertilizers and
its mitigation strategies: A global synthesis. Agriculture, Ecosystems & Environment 232(Supplement C): 283-
289.
Pelster, D. E., Gisore, B., Koske, J. K., Goopy, J., Korir, D., Rufino, M. C. & Butterbach-Bahl, K. (2016) Methane
and nitrous oxide emissions from cattle excreta on an East African grassland. Journal of Environmental Quality
45(5): 1531-1539.
Perego, A., Basile, A., Bonfante, A., De Mascellis, R., Terribile, F., Brenna, S. & Acutis, M. (2012) Nitrate
leaching under maize cropping systems in Po Valley (Italy). Agriculture Ecosystems & Environment 147: 57-
65.
Readman, R., Beckwith, C. & Kettlewell, P. (2002) Effects of spray application of urea fertilizer at stem extension
on winter wheat: N recovery and nitrate leaching. Journal of Agricultural Science 139: 11-25.
Ren, L., Ma, J. & Zhang, R. (2003) Estimating nitrate leaching with a transfer function model incorporating net
mineralization and uptake of nitrogen. Journal of Environmental Quality 32(4): 1455-1463.
Rochette, P., Liang, B. C., Pelster, D., Bergeron, O., Lemke, R., Kroebel, R., MacDonald, D., Yan, W. &
Flemming, C. (2018) Soil nitrous oxide emissions from agricultural soils in Canada: exploring relationships
with soil, crop and climatic variables. Agriculture, Ecosystems and Environment 254: 69-81.

Chapter 11: N2O Emissions from Managed Soils, and CO2 Emissions from Lime and Urea Application
2019 Refinement to the 2006 IPCC Guidelines for National Greenhouse Gas Inventories 11.45
Ruser, R. & Schulz, R. (2015) The Effect of Nitrification Inhibitors on the Nitrous Oxide (N2O) Release from
Agricultural Soils-A Review. Journal of Plant Nutrition and Soil Science 178: 171-188.
Salmeron, M., Cavero, J., Quilez, D. & Isla, R. (2010) Winter Cover Crops Affect Monoculture Maize Yield and
Nitrogen Leaching under Irrigated Mediterranean Conditions. Agronomy Journal 102(6): 1700-1709.
Shcherbak, I., Millar, N. & Robertson, G. P. (2014) A global meta-analysis of the nonlinear response of soil nitrous
oxide (N2O) emissions to fertilizer nitrogen. Proceedings of the National Academy of Science 111: 9199–9204.
Sogbedji, J., van Es, H., Yang, C., Geohring, L. & Magdoff, F. (2000) Nitrate leaching and nitrogen budget as
affected by maize nitrogen rate and soil type. Journal of Environmental Quality 29(6): 1813-1820.
Sorensen, P. & Rubaek, G. (2012) Leaching of nitrate and phosphorus after autumn and spring application of
separated solid animal manures to winter wheat. Soil Use and Management 28(1): 1-11.
Stehfest, E. & Bouwman, L. (2006) N2O and NO emission from agricultural fields and soils under natural
vegetation: summarizing available measurement data and modeling of global annual emissions. Nutrient
Cycling in Agroecosystems 74: 207-228.
Tafteh, A. & Sepaskhah, A. (2012) Yield and nitrogen leaching in maize field under different nitrogen rates and
partial root drying irrigation. International Journal of Plant Production 6(1): 93-113.
Thomas, B. W., Gao, X., Beck, R. & Hao, X. (2017) Are distinct nitrous oxide emission factors required for cattle
urine and dung deposited on pasture in western Canada? Environmental Science and Pollution Research
24(33): 26142-26147.
Thomas, B. W., Stoeckli, J. L., Beck, R., Liu, K., Koenig, K. M., Beres, B. L., Hao, X. & Gao, X. (2017) Nitrapyrin
reduced nitrous oxide emissions from beef cattle urine patches on a semiarid tame pasture. Soil Science Society
of America Journal 81(6): 1537-1547.
Tian, L., Cai, Y. & Akiyama, H. (2019) A review of indirect N2O emission factors from agricultural nitrogen
leaching and runoff to update of the default IPCC values. Environmental Pollution 245: 300-306.
Tully, K. L., Abwanda, S., Thiong’o, M., Mutuo, P. M. & Rosenstock, T. S. (2017) Nitrous oxide and methane
fluxes from urine and dung deposited on Kenyan pastures. Journal of Environmental Quality 46(4): 921-929.
Van der Gon, H. & Bleeker, A. (2005) Indirect N2O emission due to atmospheric N deposition for the Netherlands.
Atmospheric Environment 39(32): 5827-5838.
Van der Weerden, T., Cox, N., Luo, J., Di, H. J., Podolyan, A., Phillips, R., Saggar, S., De Klein, C., Ettema, P. &
Rys, G. (2016) Refining the New Zealand nitrous oxide emission factor for urea fertiliser and farm dairy
effluent.
Van der Weerden, T. J., Manderson, A., Kelliher, F. M. & de Klein, C. A. M. (2014) Spatial and temporal nitrous
oxide emissions from dairy cattle urine deposited onto grazed pastures across New Zealand based on soil water
balance modelling. Agriculture, Ecosystems and Environment 189: 92-100.
Van der Weerden, T. J., Styles, T. M., Rutherford, A. J., de Klein, C. A. M. & Dynes, R. (2017) Nitrous oxide
emissions from cattle urine deposited onto soil supporting a winter forage kale crop. New Zealand Journal of
Agricultural Research 60(2): 119-130.
Van Groenigen, J. W., Velthof, G. L., Oenema, O., Van Groenigen, K. J. & Van Kessel, C. (2010) Towards an
agronomic assessment of N2O emissions: A case study for arable crops. Eur J Soil Sci 61 903-913.
Van Lent, J., Hergoualc’h, K. & Verchot, L. V. (2015) Soil N2O and NO emissions from land use and land-use
change in the tropics and subtropics: a meta-analysis. Biogeosciences 12: 7299-7313.
Wagner-Riddle, C., Congreves, K. A., Abalos, D., Berg, A. A., Brown, S. E., Ambadan, J. T., Gao, X. & Tenuta,
M. (2017) Globally important nitrous oxide emissions from croplands induced by freeze-thaw cycles. Nat
Geosci 10: 279-286.
Wang, T., Zhu, B. & Kuang, F. (2012) Reducing interflow nitrogen loss from hillslope cropland in a purple soil
hilly region in southwestern China. Nutrient Cycling in Agroecosystems 93(3): 285-295.
Ward, G. N., Kelly, K. B. & Hollier, J. W. (2018) Greenhouse gas emissions from dung, urine and dairy pond
sludge applied to pasture. 1. Nitrous oxide emissions. Animal Production Science 58(6): 1087-1093.

Volume 4: Agriculture, Forestry and Other Land Use
11.46 2019 Refinement to the 2006 IPCC Guidelines for National Greenhouse Gas Inventories
Yague, M. & Quilez, D. (2010) Response of Maize Yield, Nitrate Leaching, and Soil Nitrogen to Pig Slurry
Combined with Mineral Nitrogen. Journal of Environmental Quality 39(2): 686-696.
Yamulki, S., Jarvis, S. C. & Owen, P. (1998) Nitrous oxide emissions from excreta applied in a simulated grazing
pattern. Soil Biology & Biochemistry 30(4): 491-500.
Zhu, B., Wang, T., Kuang, F., Luo, Z., Tang, J. & Xu, T. (2009) Measurements of Nitrate Leaching from a
Hillslope Cropland in the Central Sichuan Basin, China. Soil Science Society of America Journal 73(4): 1419-
1426.
REFERENCES COPIED FROM THE 2006 IPCC GUIDELINES
Aitkenhead-Peterson, J.A., Alexander, J.E. and Clair, T.A. (2005). Disssolved organic carbon and dissolved
organic nitrogen export from forested watersheds in Nova Scotia: Identifying controlling factors. Global
Biogeochemical Cycles, 19.
Akiyama, H., Yagi, K. and Yan, X. (2005). Direct N2O emission from rice paddy fields: Summary of available
data. Glob. Biogeochem. Cycles, 19(1).
Alm, J., Saarnio, S., Nykanen, H., Silvola, J. and Martikainen, P.J. (1999). Winter CO2, CH4 and N2O fluxes on
some natural and drained boreal peatlands. Biogeochem. 44, 163-186.
Bouwman, A.F. (1996). Direct emissions of nitrous oxide from agricultural soils. Nutr. Cycl. Agroecosyst., 46, 53-
70.
Bouwman, A.F., Boumans, L.J.M. and Batjes, N.H. (2002a). Emissions of N2O and NO from fertilised fields:
Summary of available measurement data. Glob. Biogeochem. Cycles, 16(4).
Bouwman, A.F., Boumans, L.J.M. and Batjes, N.H. (2002b). Modeling global annual N2O and NO emissions from
fertilised fields. Glob. Biogeochem. Cycles, 16(4).
Brumme, R., Borken, W. and Finke, S. (1999). Hierarchical control on nitrous oxide emission in forest ecosystems.
Global Biochem. Cycles 13, 1137–1148.
Butterbach-Bahl, K., Gasche, R., Breuer, L. And Papen, H. (1997). Fluxes of NO and N2O from temperate forest
soils: impact of forest type, N deposition and of liming on the NO and N2O emissions. Nutr. Cycl. Agroecosyst.
48, 79–90.
Clough, T., Bertram, J.E., Sherlock, R.R., Leonard, R.L. and Nowicki, B.L. (2006). Comparison of measured and
EF5-r-derived N2O fluxes from a spring-fed river. Glob. Change Biol. 12, 477-488.
Corre, M.D., Pennock, D.J., van Kessel, C., and Elliott, D.K. (1999). Estimation of annual nitrous oxide emissions
from a transitional grassland-forest region in Saskatchewan, Canada. Biogeochem. 44, 29–49.
Davies, M.G., Smith, K.A. and Vinten, A.J.A. (2001). The mineralisation and fate of N following ploughing of
grass and grass-clover swards. Biol. Fertil. Soils, 33, 423-434.
De Klein, C.A.M. (2004). Review of the N2O emission factor for excreta deposited by grazing animals (EF3PRP).
Paper prepared as part of the 2006 Revised Guidelines for Greenhouse Gas Inventories of IPCC.
Denier van der Gon, H. And Bleeker, A. (2005). Indirect N2O emission due to atmospheric N deposition for the
Netherlands. Atmos. Environ. 39, 5827-5838.
Dong, L.F., Nedwell, D.B., Colbeck, I. and Finch, J. (2004). Nitrous oxide emission from some English and Welsh
rivers and estuaries. Water Air Soil Pollution: Focus 4, 127-134.
FAO (1998). World Reference Base for Soil Resources. World Soil Resources Reports 84. FAO, Rome. 88pp.
Garten, C.T., Cooper, L.W., Post, W.M. and Hanson, P.J. (2000). Climate controls on forest soil C isotope ratios
in the southern Appalachian mountains. Ecology, 81, 1108-1119.
Hiscock, K.M., Bateman, A.S., Fukada, T. and Dennis, P.F. (2002). The concentration and distribution of
groundwater N2O in the Chalk aquifer of eastern England. In: Van Ham, J., Baede, A.P.M., Guicherit, R. and
Williams-Jacobse, J.G.F.M. (eds.), Proc. 3rd Internat. Symp. Non-CO2 Greenhouse Gases, Maastricht, The
Netherlands, 185-190.
Hiscock, K.M., Bateman, A.S., Muhlherr, I.H., Fukada, T. and Dennis, P.F. (2003). Indirect emissions of nitrous
oxide from regional aquifers in the United Kingdom. Environ. Sci. Technol. 37, 3507-3512.
IPCC (1997). Revised 1996 IPCC Guidelines for National Greenhouse Inventories. Houghton J.T., Meira Filho
L.G., Lim B., Tréanton K., Mamaty I., Bonduki Y., Griggs D.J. Callander B.A. (Eds). Intergovernmental Panel
on Climate Change (IPCC), IPCC/OECD/IEA, Paris, France.
Chapter 11: N2O Emissions from Managed Soils, and CO2 Emissions from Lime and Urea Application
2019 Refinement to the 2006 IPCC Guidelines for National Greenhouse Gas Inventories 11.47
IPCC (2000). Good Practice Guidance and Uncertainty Management in National Greenhouse Gas Inventories.
Penman J., Kruger D., Galbally I., Hiraishi T., Nyenzi B., Emmanuel S., Buendia L., Hoppaus R., Martinsen
T., Meijer J., Miwa K., Tanabe K. (Eds). Intergovernmental Panel on Climate Change (IPCC),
IPCC/OECD/IEA/IGES, Hayama, Japan.
IPCC (2003). Good Practice Guidance for Land Use, Land-Use Change and Forestry. Penman J., Gytarsky M.,
Hiraishi T., Krug, T., Kruger D., Pipatti R., Buendia L., Miwa K., Ngara T., Tanabe K., Wagner F.
(Eds).Intergovernmental Panel on Climate Change (IPCC), IPCC/IGES, Hayama, Japan.
John, B., Yamashita, T., Ludwig, B. and Flessa, H. (2005). Storage of organic carbon in aggregate and density
fractions of silty soils under different types of land use. Geoderma, 128, 63-79.
Klemedtsson, L., Kasimir Klemedtsson, A., Escala, M. And Kulmala, A. (1999). Inventory of N2O emission from
farmed European peatlands. In: Freibauer, A. and Kaltschmitt, M. (eds.), Approaches to Greenhouse Gas
Inventories of Biogenic Sources in Agriculture, Proc. Workshop at Lökeberg, Sweden, 9-10 July 1998, pp. 79-
91.
Klemedtsson, L., Weslien, P., Arnold, K., Agren, G., Nilsson, M. and Hanell, B. (2002). Greenhouse gas
emissionsfrom drained forests in Sweden. In: Olsson M. (ed.) Land-use strategies for reckoning net greenhouse
gas emissions. Mistra Programme: Progress report 1999 – 2002. Swedish Univ. Agric. Sciences, Uppsala: pp.
44-67.
Laine, J., Silvola, J., Tolonen, K., Alm, J., Nykanen, H., Vasander, H., Sallantaus, T., Savolainen, I., Sinisalo, J.,
and Martikainen, P.J. (1996). Effect of water-level drawdown on global climatic warming – northern peatlands.
Ambio 25, 179-184.
Lobe, I., Amelung, W. and Du Preez, C.C. (2001). Losses of carbon and nitrogen with prolonged arable cropping
from sandy soils of the South African Highveld. European Journal of Soil Science, 52, 93-101.
Martikainen, P.J., Nykanen, H., Alm, J., and Silvola, J. (1995). Change in fluxes of carbon dioxide, methane and
nitrous oxide due to forest drainage of mire sites of different trophy. Plant Soil 169, 571-577.
Minkkinen, K., Korhonen, K., Savolainen, I. and Laine, J. (2002). Carbon balance and radiative forcing of Finnish
peatlands 1900-2100: the impact of forestry drainage. Glob. Change Biol. 8, 785-799.
Novoa, R. and Tejeda, H.R. (2006) Evaluation of the N2O emissions from N in plant residues as affected by
environmental and management factors. Nutr. Cycl. Agroecosyst. 1-3, 29-46.
Reay, D.S., Smith, K.A. and Edwards A.C. (2004). Nitrous oxide in agricultural drainage waters following field
fertilisation. Water Air Soil Pollution: Focus, 4, 437-451.
Reay, D.S., Smith, K.A., Edwards, A.C., Hiscock, K.M., Dong, L.F. and Nedwell, D. (2005). Indirect nitrous oxide
emissions: revised emission factors. Environ. Sciences, 2, 153-158.
Regina, K., Nykänen, H., Silvola, J. and Martikainen, P.J. (1996). Nitrous oxide production in boreal peatlands of
different hydrology and nutrient status. In: Northern peatlands in global climatic change. Proc. Internat.
Workshop, Academy of Finland, Hyytiälä: pp. 158-166.
Robertson, G.P. and Grace, P.R. (2004). Greenhouse gas fluxes in tropical and temperate agriculture: the need for
a full-cost accounting of global warming potentials. Environ. Develop. Sustain. 6, 51-63.
Rochette, P. and Janzen, H.H. (2005). Towards a revised coefficient for estimating N2O emissions from legumes.
Nutr. Cycl. Agroecosyst., 73, 171-179.
Snowdon, P., Ryan, P. and Raison, J. (2005). Review of C:N ratios in vegetation, litter and soil under Australian
native forests and plantations. National Carbon Accounting System Technical Report No. 45, Australian
Greenhouse Office, Canberra.
Sawamoto, T., Nakajima, Y., Kasuya, M., Tsuruta, H. And Yagi, K. (2005). Evaluation of emission factors for
indirect N2O emission due to nitrogen leaching in agro-ecosystems. Geophys. Res. Lett. 32(3).
Smith, K.A.and Conen, F. (2004). Impacts of land management on fluxes of trace greenhouse gases. Soil Use
Manage., 20, 255-263.
Stehfest, E. and Bouwman, L. (2006). N2O and NO emission from agricultural fields and soils under natural
vegetation: summarizing available measurement data and modeling of global annual emissions. Nutr. Cycl.
Agroecosyst. 74, 207-228.
Van der Weerden, T.J., Sherlock, R.R., Williams, P.H. and Cameron, K.C. (1999). Nitrous oxide emissions and
methane oxidation by soil following cultivation of two different leguminous pastures. Biol. Fertil. Soils, 30,
52-60.

Volume 4: Agriculture, Forestry and Other Land Use
11.48 2019 Refinement to the 2006 IPCC Guidelines for National Greenhouse Gas Inventories
West, T.O. and McBride, A.C. (2005). The contribution of agricultural lime to carbon dioxide emission in the
United States: dissolution, transport, and net emissions. Agric. Ecosyst. Environ. 108, 145-154.