estimation of n2o emissions from agricultural soils and
TRANSCRIPT
Atmosphere 2020, 11, 552; doi:10.3390/atmos11060552 www.mdpi.com/journal/atmosphere
Article
Estimation of N2O Emissions from Agricultural Soils and Determination of Nitrogen Leakage Kristína Tonhauzer 1,2,*, Peter Tonhauzer 2, Janka Szemesová 2 and Bernard Šiška 1
1 Faculty of European Studies and Regional Development, The Slovak University of Agriculture in Nitra, Trieda Andreja Hlinku 609/2, 949 76 Nitra-Chrenová, Slovakia; [email protected]
2 Slovak Hydrometeorological Institute, Jeséniova 17, 83315 Bratislava, Slovakia; [email protected] (P.T.); [email protected] (J.S.)
* Correspondence: [email protected]; Tel.: +421-902-637-641
Received: 6 April 2020; Accepted: 22 May 2020; Published: 26 May 2020
Abstract: Leaching of nitrogen from the soil is a natural but unfavorable effect that generates N2O emissions. Exact quantification of nitrogen leakage is a challenging process. Intensive leakage occurs mainly when the soil is without vegetation and under specific climatic conditions. This paper aims to quantify the amount of nitrogen leakage from arable land and grassland, and to estimate N2O emissions in 2017. Estimating the country-specific fraction of leached nitrogen (FracLEACH) is important for the emission balance from this source. Emissions are underestimated when the fraction is low; on the contrary, a high fraction causes overestimation. The internationally recognized fraction is 30%, according to the 2006 Intergovernmental Panel on Climate Control (IPCC) Guidelines. This factor represents the fraction of nitrogen losses compared to total nitrogen inputs and sources. In this study, we analyzed the effects of climatic conditions on agricultural soils in Slovakia to evaluate the area of nitrogen loss through leaching.
Keywords: nitrogen; leakage; N2O; emissions; soils
1. Introduction
All forms of nitrogen emitted from the soil have an undeniable environmental impact on a regional and global scale. It is the subject not only of monitoring and scientific research but also of policy debates that result in national and international mitigation policies and measures. In particular, nitrogen emissions occur when the natural nitrogen cycle in the soil is disrupted. Excessive soil fertilization causes higher nitrogen loss, transfer into the environment, and altered water and air quality [1]. Irrigation and nitrogen fertilization play important roles in crop yield. An appropriate N application rate coupled with suitable irrigation schedules should be implemented to obtain high yields while reducing deep percolation and N leaching in intensively cropped farming practice [2].
Irrigation affects the water content in the soil profile and causes the movement of nitrates. Proper irrigation should not lead to nitrate leaching. Dissolved nitrates in the soil can increase depletion by plants and prevent flooding. Irrigation optimizes moisture conditions and the intensity of nitrification processes. Therefore, the potential for nitrate leaching from irrigated soil containing more nitrates is higher than in nonirrigated soil [1].
Leaching is an important part of the nitrogen cycle, with significant economic (crop yield) and environmental (eutrophication) impacts. Nitrogen leakage takes place due to its relatively large solubility in water and absorption due to the predominant negative charge of the solid phase of the soil [1].

Atmosphere 2020, 11, 552 2 of 13
Nitrates and nitrites cause increased contamination of surface and underground drinking water sources. The outcomes of water pollution by nitrates include human health risks and eutrophication of water, resulting in increased growth of cyanobacteria, algae, and higher plant forms [3].
The formation of gaseous nitrous oxide (N2O) in the soil is primarily caused by microbial nitrification and denitrification and depends mainly on the concentration of N, soil water content, and temperature [4,5]. Soil denitrification takes place in the presence of a suitable reducing agent, usually organic carbon. For most conditions, when the oxidant amount is limited, nitrogen is reduced to the level of molecular N2. If the availability of the oxidant outweighs the supply of the reducing agent, the reduction of nitrogen is incomplete, and the ratio of N2O/N2 increases. This means that the use of nitrogen fertilizers, which are needed for intensive farming, increases N2O emissions into the air [6].
Another source of emissions is the leaching and draining of nitrogen from the soil. It occurs when there is an excess of NO3– and its fixation in the vegetation system does not occur. NO3– is washed away by precipitation into surface streams. With the denitrification processes described above, NO is transformed into N2O emissions, especially in underground sources contaminated with nitrogen oxides [7,8].
Indirect N2O emission from agricultural nitrogen leaching into water pathways contributes to the global atmospheric N2O budget. However, there remains high uncertainty regarding this source in the bottom-up N2O inventory [9]. The emission factor of indirect N2O associated with N leaching and runoff (EF5; kg N2O–N per kg of NO3–N) incorporates three components: groundwater and surface drainage, rivers, and estuaries [9].
In terrestrial ecosystems, the additional nitrogen leads to enhanced amounts of nitrogen cycling between vegetation and soil, with the primary removal process by leaching as NO3 to groundwater and denitrification as N2 back to the atmosphere. Equation (1) shows the denitrification process [8]: NO → NO → NO → N O → N (1)
Plant and soil communities have evolved to sequester and recycle nitrogen, as it is an essential and often limiting nutrient [10].
Nitrogen leaching does not occur continuously and across the entire territory. The amount of precipitation must be higher than the evaporation, and the water content of the retention field capacity due to heavy rain or irrigation might temporally exceed field capacity [11]. The retention capacity of soil to retain water, or the ability to accumulate water, is one of the most important properties of soil and significantly influences the water cycle in nature and in the production capacity of the soil. This property depends on soil parameters, environmental characteristics, and soil depth. Soil characteristics are mainly grain size, mineralogical composition, quality and arrangement of soil horizons, quality of organic matter, structure, and content. Environmental features include surface topography, weather conditions, precipitation, and groundwater level [12].
Physical, chemical, and biological attributes of soil influence the leaching of nitrogen. The type and quality of soil determine the intensity of rainwater leakage with respect to irrigation water, and its capacity to retain water more or less prevents leakage. There is unquestionable evidence of increased nitrogen leaching from light, less humid, and shallow soils, and conversely, a barrier to leaching nitrogen in heavy, low permeable soils (clays) [13]. It is plausible that leaching is only possible when precipitation predominates over evapotranspiration or when groundwater temporarily enters the soil profile, especially in the spring [14]. According to the findings of Cardenas and his team, intense precipitation negate the effects of soil type on leaching, with most nitrate available for leaching being lost irrespective of soil type [13].
Fertilization is the most important anthropological factor of nitrogen leaching from the soil. Davies and Bradly [15] considered that increasing fertilizer doses leads to increased leaching intensity. The nitrogen dose, the fertilizer form, and the application time play important roles here. Nitrogen leaching can be significantly accelerated when fertilizers are applied in autumn and at increased doses [15].
Atmosphere 2020, 11, 552 3 of 13
2. Materials and Methods
According to Mosier et al. [16], the suggested FracLEACH value is 30%. FracLEACH represents the fraction of nitrogen losses in managed soils in regions where leaching occurs compared to total nitrogen inputs and sources [17]. This was recommended for calculation of N2O emissions through leaching in the 2006 Intergovernmental Panel on Climate Change (IPCC) Guidelines, which define that for areas with active irrigation and areas where total precipitation is higher than evaporation for a short time, the value of 30% of the proportion of nitrogen leached out of the utilized agricultural land (FracLEACH) should be used. For dryland regions, where precipitation and irrigation are lower than evapotranspiration throughout most of the year, leaching is unlikely to occur, and FracLEACH is equal to zero [17].
Including irrigated and wet areas modifies the default nitrogen leached from arable land and grassland FracLEACH to a national value according to the following equation: Frac = Frac + Frac × Frac (2)
where FracIRR is the proportion of irrigated areas to total agricultural land area, FracWET is the share of the wet area to the total area of arable land and grassland (%), and FracLEACHN is the national value of the proportion of leached nitrogen from cultivated soil (%).
2.1. Analysis of Irrigated Areas in Slovakia
The share of irrigated areas in Slovakia was derived from official statistics published by Hydromelioration, a state enterprise. The data were compared with Eurostat datasets. Identified data gaps and inconsistencies are shown in Table 1. The total area of utilized agricultural land was taken from the official statistics of the Statistical Office of the Slovak Republic. For the correct determination of the proportion of irrigated areas, distinguishing irrigation type was important. In the case of drip irrigation, water is gradually soaked into the soil and no nitrogen leaching occurs. Therefore, drip irrigation areas were excluded from the analysis [17]. From the statistics, it can be seen that the proportion of irrigated areas in Slovakia is decreasing due to the obsolescence of the irrigation network, with a decrease of 79.9% from 2002 to 2017. Statistical data concerning irrigated areas could not be fully verified because only Hydromelioration publishes this type of data in its annual reports; the Statistical Office did not publish such data, and Eurostat published only an incomplete proportion of irrigated areas (proportions are available for 2006, 2008, 2011, and 2014) based on its own methodology or estimation, with a lack of transparency.
For 2017, the total irrigated area in Slovakia was 54,421 hectares, representing only 3.6% of agricultural land [18]. According to Eurostat, the average in 28 European Union countries was 11.3%. Improving water efficiency and developing irrigation systems have been priorities of the Rural Development Program for 2014–2020. Farmers could apply for a nonrepayable financial contribution to restore their irrigation systems in 2017. An increase in the proportion of irrigated areas and the large year-on-year fluctuations in crop yield, which depend on climatic conditions, hence a lack of inadequate distribution of precipitation, can be expected in the future. The proportion of irrigated areas to total utilized agricultural areas is given in Table 1.
Table 1. Proportion of irrigated areas to total utilized agricultural areas.
Year Total Irrigated
Areas (ha) Utilized Agricultural
Area (ha) Share of Irrigated Areas to Total
Areas of Agricultural Use (FracIRR) Share of Irrigated Areas
According to Eurostat 2002 268,738 1,497,354 17.9% 2003 294,202 1,499,323 19.6% 2004 220,861 1,501,425 14.7% 2005 147,519 1,504,147 9.8% 2006 196,749 1,507,400 13.1% 2.4% 2007 226,548 1,507,698 15.0% 2008 225,436 1,507,278 15.0% 2.0% 2009 214,326 1,503,561 14.3% 2010 206,523 1,501,997 13.7%
Atmosphere 2020, 11, 552 4 of 13
Year Total Irrigated Areas (ha)
Utilized Agricultural Area (ha)
Share of Irrigated Areas to Total Areas of Agricultural Use (FracIRR)
Share of Irrigated Areas According to Eurostat
2011 194,215 1,500,905 12.9% 0.8% 2012 187,574 1,499,568 12.5% 2013 168,277 1,498,986 11.2% 2014 154,698 1,498,119 10.3% 1.3% 2015 62,239 1,495,789 4.2% 2016 60,818 1,494,900 4.1% 2017 54,421 1,494,566 3.6%
2.2. Estimation of Wet Areas in Slovakia
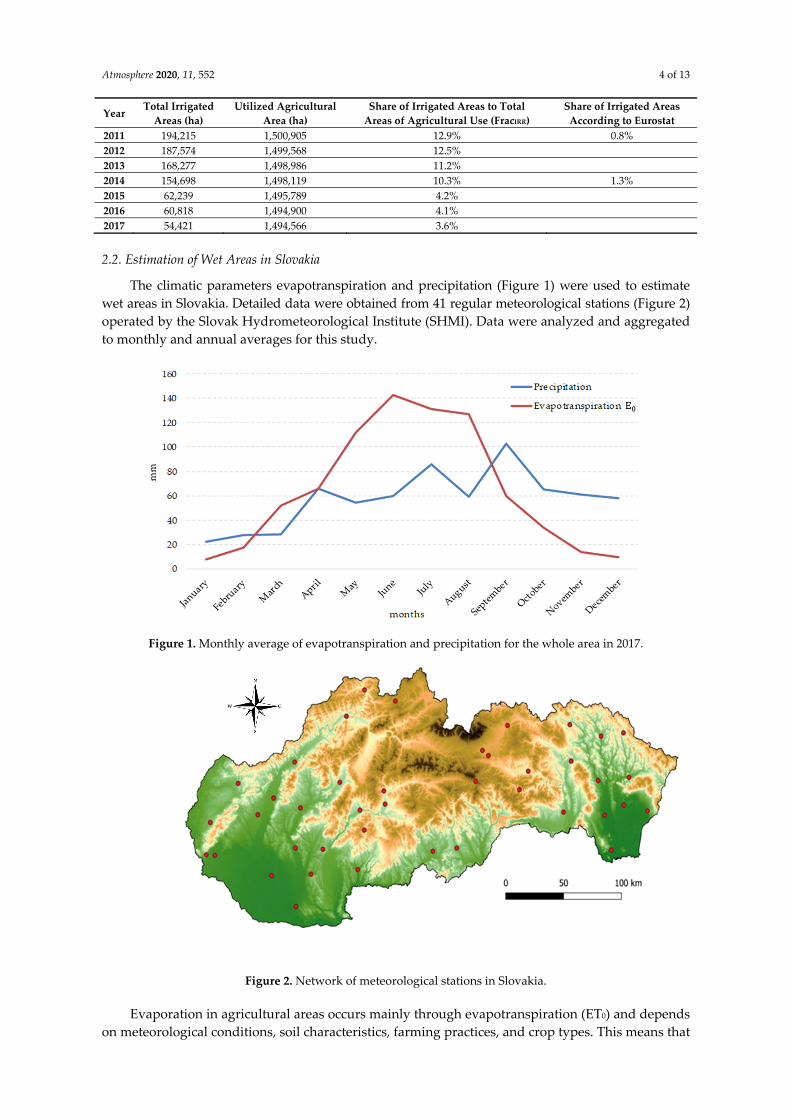
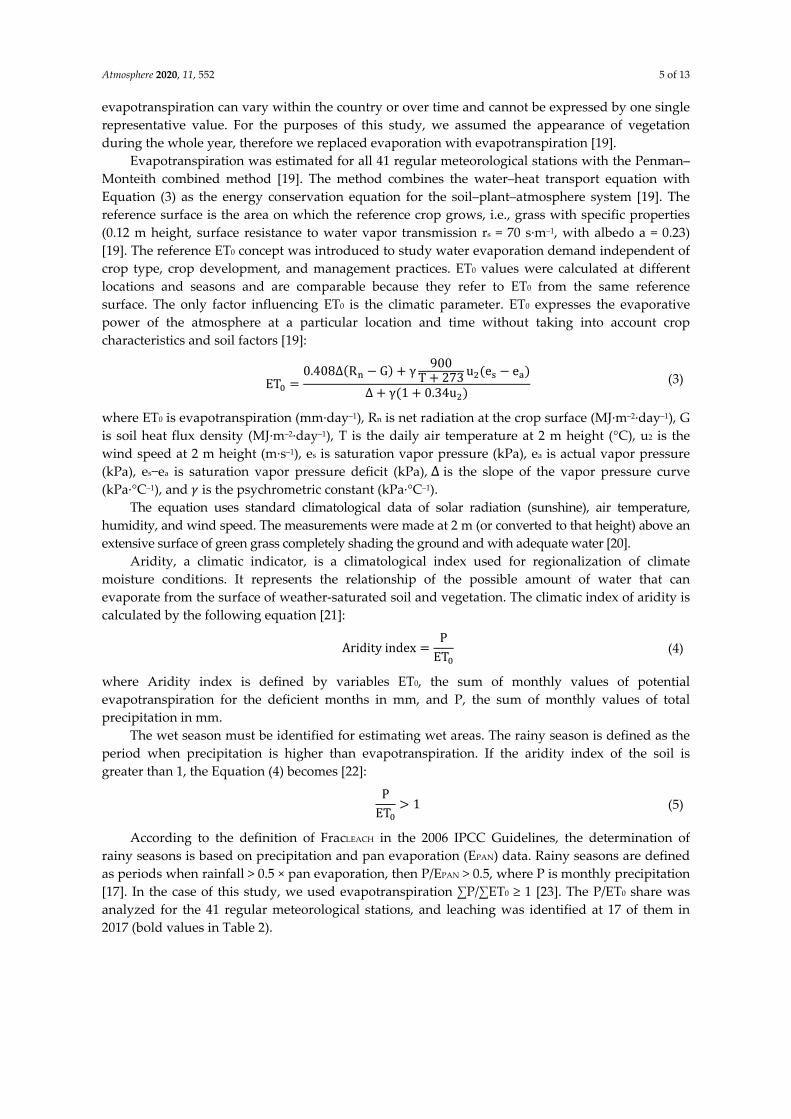
The climatic parameters evapotranspiration and precipitation (Figure 1) were used to estimate wet areas in Slovakia. Detailed data were obtained from 41 regular meteorological stations (Figure 2) operated by the Slovak Hydrometeorological Institute (SHMI). Data were analyzed and aggregated to monthly and annual averages for this study.
Figure 1. Monthly average of evapotranspiration and precipitation for the whole area in 2017.
Figure 2. Network of meteorological stations in Slovakia.
Evaporation in agricultural areas occurs mainly through evapotranspiration (ET0) and depends on meteorological conditions, soil characteristics, farming practices, and crop types. This means that
Atmosphere 2020, 11, 552 5 of 13
evapotranspiration can vary within the country or over time and cannot be expressed by one single representative value. For the purposes of this study, we assumed the appearance of vegetation during the whole year, therefore we replaced evaporation with evapotranspiration [19].
Evapotranspiration was estimated for all 41 regular meteorological stations with the Penman–Monteith combined method [19]. The method combines the water–heat transport equation with Equation (3) as the energy conservation equation for the soil–plant–atmosphere system [19]. The reference surface is the area on which the reference crop grows, i.e., grass with specific properties (0.12 m height, surface resistance to water vapor transmission rs = 70 s·m–1, with albedo a = 0.23) [19]. The reference ET0 concept was introduced to study water evaporation demand independent of crop type, crop development, and management practices. ET0 values were calculated at different locations and seasons and are comparable because they refer to ET0 from the same reference surface. The only factor influencing ET0 is the climatic parameter. ET0 expresses the evaporative power of the atmosphere at a particular location and time without taking into account crop characteristics and soil factors [19]:
ET = 0.408∆ R G + γ 900T + 273 u e e∆ + γ 1 + 0.34u (3)
where ET0 is evapotranspiration (mm·day–1), Rn is net radiation at the crop surface (MJ·m–2·day–1), G is soil heat flux density (MJ·m–2·day–1), T is the daily air temperature at 2 m height (°C), u2 is the wind speed at 2 m height (m·s–1), es is saturation vapor pressure (kPa), ea is actual vapor pressure (kPa), es−ea is saturation vapor pressure deficit (kPa), ∆ is the slope of the vapor pressure curve (kPa·°C–1), and 𝛾 is the psychrometric constant (kPa·°C–1).
The equation uses standard climatological data of solar radiation (sunshine), air temperature, humidity, and wind speed. The measurements were made at 2 m (or converted to that height) above an extensive surface of green grass completely shading the ground and with adequate water [20].
Aridity, a climatic indicator, is a climatological index used for regionalization of climate moisture conditions. It represents the relationship of the possible amount of water that can evaporate from the surface of weather-saturated soil and vegetation. The climatic index of aridity is calculated by the following equation [21]: Aridity index = PET (4)
where Aridity index is defined by variables ET0, the sum of monthly values of potential evapotranspiration for the deficient months in mm, and P, the sum of monthly values of total precipitation in mm.
The wet season must be identified for estimating wet areas. The rainy season is defined as the period when precipitation is higher than evapotranspiration. If the aridity index of the soil is greater than 1, the Equation (4) becomes [22]: PET 1 (5)
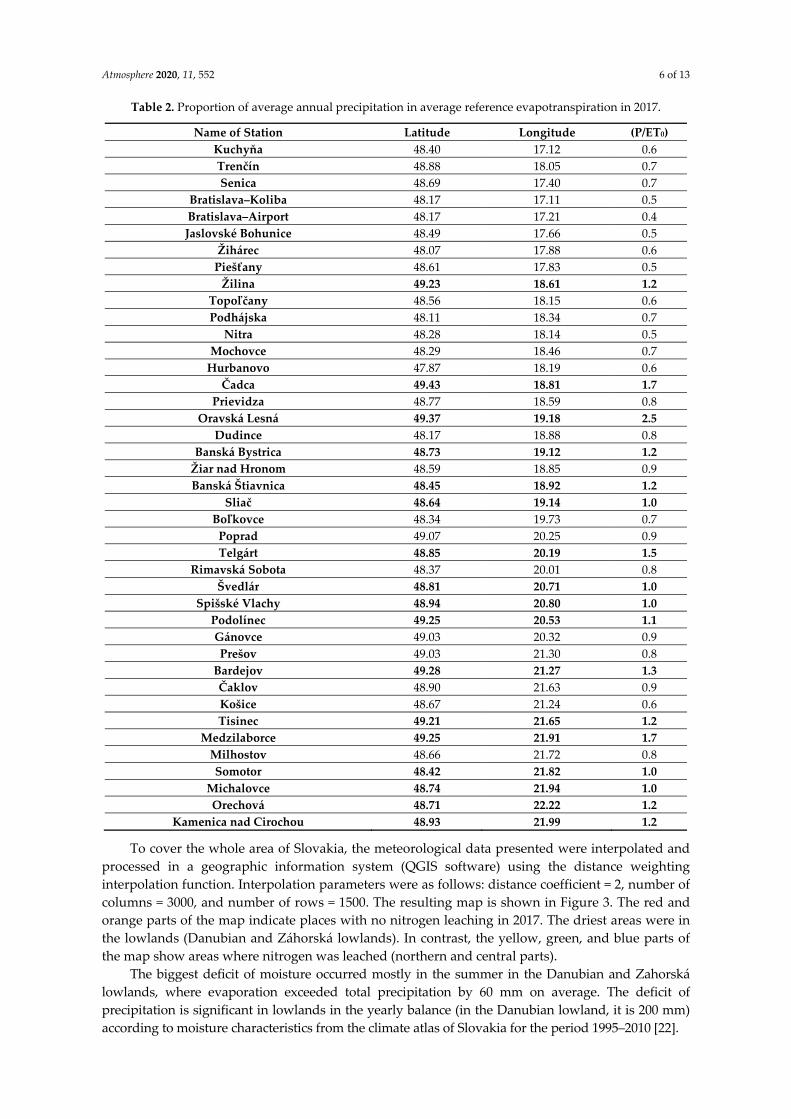
According to the definition of FracLEACH in the 2006 IPCC Guidelines, the determination of rainy seasons is based on precipitation and pan evaporation (EPAN) data. Rainy seasons are defined as periods when rainfall > 0.5 × pan evaporation, then P/EPAN > 0.5, where P is monthly precipitation [17]. In the case of this study, we used evapotranspiration ∑P/∑ET0 ≥ 1 [23]. The P/ET0 share was analyzed for the 41 regular meteorological stations, and leaching was identified at 17 of them in 2017 (bold values in Table 2).
Atmosphere 2020, 11, 552 6 of 13
Table 2. Proportion of average annual precipitation in average reference evapotranspiration in 2017.
Name of Station Latitude Longitude (P/ET0) Kuchyňa 48.40 17.12 0.6 Trenčín 48.88 18.05 0.7 Senica 48.69 17.40 0.7
Bratislava–Koliba 48.17 17.11 0.5 Bratislava–Airport 48.17 17.21 0.4 Jaslovské Bohunice 48.49 17.66 0.5
Žihárec 48.07 17.88 0.6 Piešťany 48.61 17.83 0.5
Žilina 49.23 18.61 1.2 Topoľčany 48.56 18.15 0.6 Podhájska 48.11 18.34 0.7
Nitra 48.28 18.14 0.5 Mochovce 48.29 18.46 0.7
Hurbanovo 47.87 18.19 0.6 Čadca 49.43 18.81 1.7
Prievidza 48.77 18.59 0.8 Oravská Lesná 49.37 19.18 2.5
Dudince 48.17 18.88 0.8 Banská Bystrica 48.73 19.12 1.2
Žiar nad Hronom 48.59 18.85 0.9 Banská Štiavnica 48.45 18.92 1.2
Sliač 48.64 19.14 1.0 Boľkovce 48.34 19.73 0.7
Poprad 49.07 20.25 0.9 Telgárt 48.85 20.19 1.5
Rimavská Sobota 48.37 20.01 0.8 Švedlár 48.81 20.71 1.0
Spišské Vlachy 48.94 20.80 1.0 Podolínec 49.25 20.53 1.1 Gánovce 49.03 20.32 0.9 Prešov 49.03 21.30 0.8
Bardejov 49.28 21.27 1.3 Čaklov 48.90 21.63 0.9 Košice 48.67 21.24 0.6 Tisinec 49.21 21.65 1.2
Medzilaborce 49.25 21.91 1.7 Milhostov 48.66 21.72 0.8 Somotor 48.42 21.82 1.0
Michalovce 48.74 21.94 1.0 Orechová 48.71 22.22 1.2
Kamenica nad Cirochou 48.93 21.99 1.2
To cover the whole area of Slovakia, the meteorological data presented were interpolated and processed in a geographic information system (QGIS software) using the distance weighting interpolation function. Interpolation parameters were as follows: distance coefficient = 2, number of columns = 3000, and number of rows = 1500. The resulting map is shown in Figure 3. The red and orange parts of the map indicate places with no nitrogen leaching in 2017. The driest areas were in the lowlands (Danubian and Záhorská lowlands). In contrast, the yellow, green, and blue parts of the map show areas where nitrogen was leached (northern and central parts).
The biggest deficit of moisture occurred mostly in the summer in the Danubian and Zahorská lowlands, where evaporation exceeded total precipitation by 60 mm on average. The deficit of precipitation is significant in lowlands in the yearly balance (in the Danubian lowland, it is 200 mm) according to moisture characteristics from the climate atlas of Slovakia for the period 1995–2010 [22].

Atmosphere 2020, 11, 552 7 of 13
Figure 3. Ratio of average precipitation to average reference evapotranspiration (P/ET0) in 2017.
In the raster image (Figure 3), areas with ∑P/∑ET0 ≥ 1 were extracted by using the contour function and used to trim the underlying layers by available geoprocessing tools. A highly accurate database called the Land Parcel Identification System (LPIS) was used as an underlying layer. LPIS is a part of the control mechanism under the Common Agricultural Policy [24]. It plays a significant role in verifying eligibility for area-based subsidies, monitoring farmers’ cross-compliance with selected environmental rules, and managing the Rural Development Programmes [25].
2.3. Estimation of N2O Emissions from Leached Nitrogen
Agricultural soil, a significant source of nitrous oxide (N2O) emissions in Slovakia, accounted for 72% of emissions in the country in 2017. N2O emissions from agricultural soil consist of direct emissions from the application of animal manure and fertilizer and indirect emissions from nitrogen leaching and runoff from ammonia and nitrogen oxides (NH3 and NOx) [26].
The accurate way to calculate N2O emissions in agriculture is based on nitrogen flow. Nitrogen is an essential element for livestock and crop growth. The main pathways of nitrogen from the soil are demonstrated in Figure 4. The agricultural sector has strongly altered nitrogen cycles. Nitrogen exceeding plant and animal needs may have a greater chance of being transferred to the atmosphere and aquatic ecosystems, thus the addition of N can result in increased nitrogen saturation in the environment [27].
Figure 4. Simplified view of the nitrogen cycle in crop production. Estimated global N flows are quantified (inputs and losses, Tg·N·yr–1) [28,29].
Atmosphere 2020, 11, 552 8 of 13
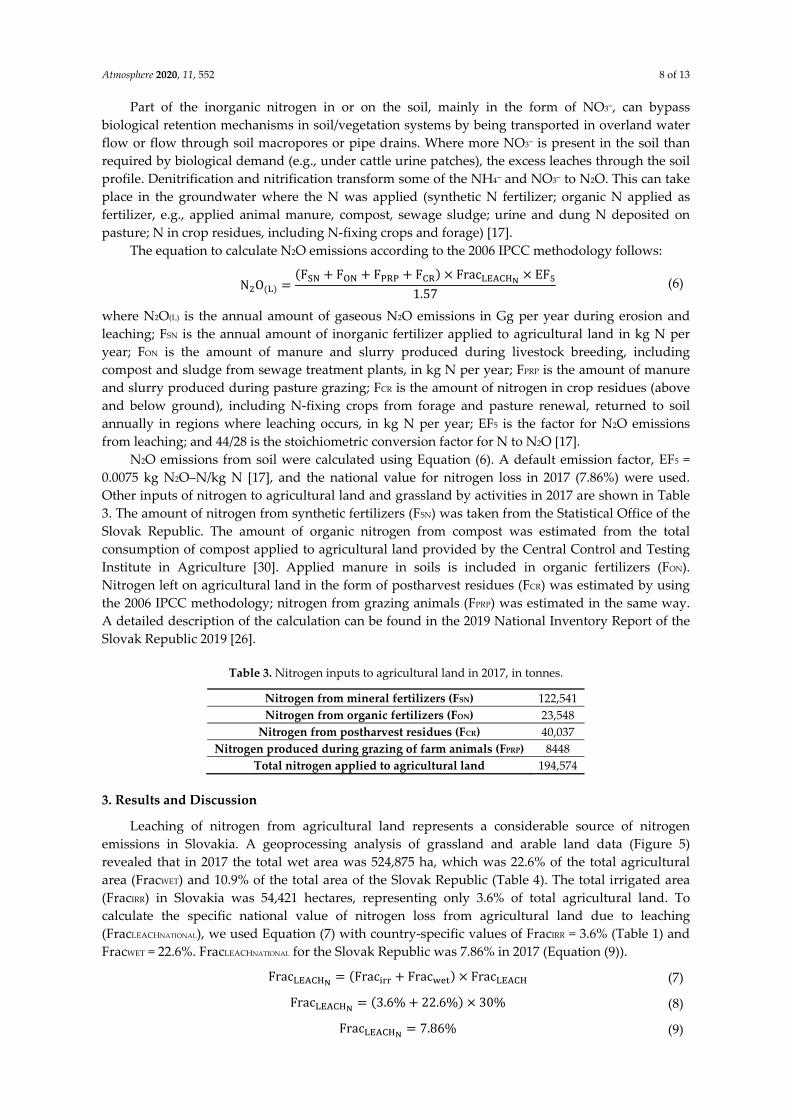
Part of the inorganic nitrogen in or on the soil, mainly in the form of NO3–, can bypass biological retention mechanisms in soil/vegetation systems by being transported in overland water flow or flow through soil macropores or pipe drains. Where more NO3– is present in the soil than required by biological demand (e.g., under cattle urine patches), the excess leaches through the soil profile. Denitrification and nitrification transform some of the NH4– and NO3– to N2O. This can take place in the groundwater where the N was applied (synthetic N fertilizer; organic N applied as fertilizer, e.g., applied animal manure, compost, sewage sludge; urine and dung N deposited on pasture; N in crop residues, including N-fixing crops and forage) [17].
The equation to calculate N2O emissions according to the 2006 IPCC methodology follows: N O = F + F + F + F × Frac × EF1.57 (6)
where N2O(L) is the annual amount of gaseous N2O emissions in Gg per year during erosion and leaching; FSN is the annual amount of inorganic fertilizer applied to agricultural land in kg N per year; FON is the amount of manure and slurry produced during livestock breeding, including compost and sludge from sewage treatment plants, in kg N per year; FPRP is the amount of manure and slurry produced during pasture grazing; FCR is the amount of nitrogen in crop residues (above and below ground), including N-fixing crops from forage and pasture renewal, returned to soil annually in regions where leaching occurs, in kg N per year; EF5 is the factor for N2O emissions from leaching; and 44/28 is the stoichiometric conversion factor for N to N2O [17].
N2O emissions from soil were calculated using Equation (6). A default emission factor, EF5 = 0.0075 kg N2O–N/kg N [17], and the national value for nitrogen loss in 2017 (7.86%) were used. Other inputs of nitrogen to agricultural land and grassland by activities in 2017 are shown in Table 3. The amount of nitrogen from synthetic fertilizers (FSN) was taken from the Statistical Office of the Slovak Republic. The amount of organic nitrogen from compost was estimated from the total consumption of compost applied to agricultural land provided by the Central Control and Testing Institute in Agriculture [30]. Applied manure in soils is included in organic fertilizers (FON). Nitrogen left on agricultural land in the form of postharvest residues (FCR) was estimated by using the 2006 IPCC methodology; nitrogen from grazing animals (FPRP) was estimated in the same way. A detailed description of the calculation can be found in the 2019 National Inventory Report of the Slovak Republic 2019 [26].
Table 3. Nitrogen inputs to agricultural land in 2017, in tonnes.
Nitrogen from mineral fertilizers (FSN) 122,541 Nitrogen from organic fertilizers (FON) 23,548
Nitrogen from postharvest residues (FCR) 40,037 Nitrogen produced during grazing of farm animals (FPRP) 8448
Total nitrogen applied to agricultural land 194,574
3. Results and Discussion
Leaching of nitrogen from agricultural land represents a considerable source of nitrogen emissions in Slovakia. A geoprocessing analysis of grassland and arable land data (Figure 5) revealed that in 2017 the total wet area was 524,875 ha, which was 22.6% of the total agricultural area (FracWET) and 10.9% of the total area of the Slovak Republic (Table 4). The total irrigated area (FracIRR) in Slovakia was 54,421 hectares, representing only 3.6% of total agricultural land. To calculate the specific national value of nitrogen loss from agricultural land due to leaching (FracLEACHNATIONAL), we used Equation (7) with country-specific values of FracIRR = 3.6% (Table 1) and FracWET = 22.6%. FracLEACHNATIONAL for the Slovak Republic was 7.86% in 2017 (Equation (9)). Frac = Frac + Frac × Frac (7) Frac = 3.6% + 22.6% × 30% (8) Frac = 7.86% (9)
Atmosphere 2020, 11, 552 9 of 13
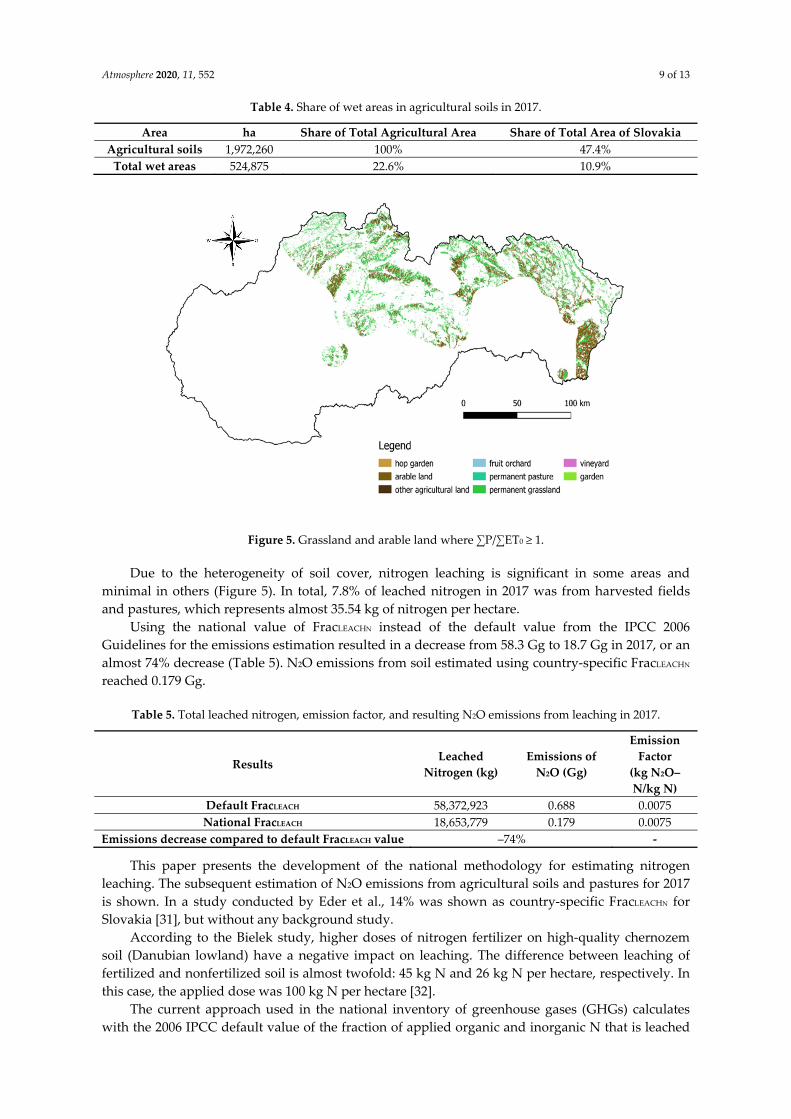
Table 4. Share of wet areas in agricultural soils in 2017.
Area ha Share of Total Agricultural Area Share of Total Area of Slovakia Agricultural soils 1,972,260 100% 47.4%
Total wet areas 524,875 22.6% 10.9%
Figure 5. Grassland and arable land where ∑P/∑ET0 ≥ 1.
Due to the heterogeneity of soil cover, nitrogen leaching is significant in some areas and minimal in others (Figure 5). In total, 7.8% of leached nitrogen in 2017 was from harvested fields and pastures, which represents almost 35.54 kg of nitrogen per hectare.
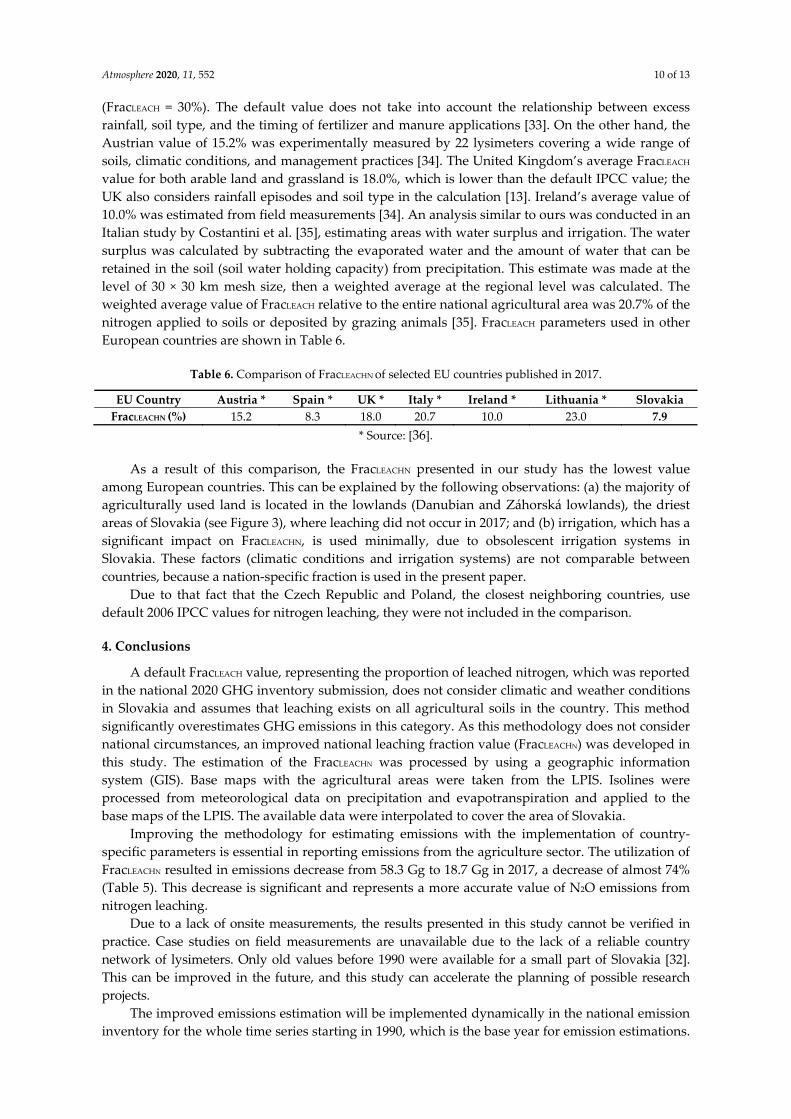
Using the national value of FracLEACHN instead of the default value from the IPCC 2006 Guidelines for the emissions estimation resulted in a decrease from 58.3 Gg to 18.7 Gg in 2017, or an almost 74% decrease (Table 5). N2O emissions from soil estimated using country-specific FracLEACHN reached 0.179 Gg.
Table 5. Total leached nitrogen, emission factor, and resulting N2O emissions from leaching in 2017.
Results Leached Nitrogen (kg)
Emissions of N2O (Gg)
Emission Factor
(kg N2O–N/kg N)
Default FracLEACH 58,372,923 0.688 0.0075 National FracLEACH 18,653,779 0.179 0.0075
Emissions decrease compared to default FracLEACH value –74% -
This paper presents the development of the national methodology for estimating nitrogen leaching. The subsequent estimation of N2O emissions from agricultural soils and pastures for 2017 is shown. In a study conducted by Eder et al., 14% was shown as country-specific FracLEACHN for Slovakia [31], but without any background study.
According to the Bielek study, higher doses of nitrogen fertilizer on high-quality chernozem soil (Danubian lowland) have a negative impact on leaching. The difference between leaching of fertilized and nonfertilized soil is almost twofold: 45 kg N and 26 kg N per hectare, respectively. In this case, the applied dose was 100 kg N per hectare [32].
The current approach used in the national inventory of greenhouse gases (GHGs) calculates with the 2006 IPCC default value of the fraction of applied organic and inorganic N that is leached
Atmosphere 2020, 11, 552 10 of 13
(FracLEACH = 30%). The default value does not take into account the relationship between excess rainfall, soil type, and the timing of fertilizer and manure applications [33]. On the other hand, the Austrian value of 15.2% was experimentally measured by 22 lysimeters covering a wide range of soils, climatic conditions, and management practices [34]. The United Kingdom’s average FracLEACH value for both arable land and grassland is 18.0%, which is lower than the default IPCC value; the UK also considers rainfall episodes and soil type in the calculation [13]. Ireland’s average value of 10.0% was estimated from field measurements [34]. An analysis similar to ours was conducted in an Italian study by Costantini et al. [35], estimating areas with water surplus and irrigation. The water surplus was calculated by subtracting the evaporated water and the amount of water that can be retained in the soil (soil water holding capacity) from precipitation. This estimate was made at the level of 30 × 30 km mesh size, then a weighted average at the regional level was calculated. The weighted average value of FracLEACH relative to the entire national agricultural area was 20.7% of the nitrogen applied to soils or deposited by grazing animals [35]. FracLEACH parameters used in other European countries are shown in Table 6.
Table 6. Comparison of FracLEACHN of selected EU countries published in 2017.
EU Country Austria * Spain * UK * Italy * Ireland * Lithuania * Slovakia FracLEACHN (%) 15.2 8.3 18.0 20.7 10.0 23.0 7.9
* Source: [36].
As a result of this comparison, the FracLEACHN presented in our study has the lowest value among European countries. This can be explained by the following observations: (a) the majority of agriculturally used land is located in the lowlands (Danubian and Záhorská lowlands), the driest areas of Slovakia (see Figure 3), where leaching did not occur in 2017; and (b) irrigation, which has a significant impact on FracLEACHN, is used minimally, due to obsolescent irrigation systems in Slovakia. These factors (climatic conditions and irrigation systems) are not comparable between countries, because a nation-specific fraction is used in the present paper.
Due to that fact that the Czech Republic and Poland, the closest neighboring countries, use default 2006 IPCC values for nitrogen leaching, they were not included in the comparison.
4. Conclusions
A default FracLEACH value, representing the proportion of leached nitrogen, which was reported in the national 2020 GHG inventory submission, does not consider climatic and weather conditions in Slovakia and assumes that leaching exists on all agricultural soils in the country. This method significantly overestimates GHG emissions in this category. As this methodology does not consider national circumstances, an improved national leaching fraction value (FracLEACHN) was developed in this study. The estimation of the FracLEACHN was processed by using a geographic information system (GIS). Base maps with the agricultural areas were taken from the LPIS. Isolines were processed from meteorological data on precipitation and evapotranspiration and applied to the base maps of the LPIS. The available data were interpolated to cover the area of Slovakia.
Improving the methodology for estimating emissions with the implementation of country-specific parameters is essential in reporting emissions from the agriculture sector. The utilization of FracLEACHN resulted in emissions decrease from 58.3 Gg to 18.7 Gg in 2017, a decrease of almost 74% (Table 5). This decrease is significant and represents a more accurate value of N2O emissions from nitrogen leaching.
Due to a lack of onsite measurements, the results presented in this study cannot be verified in practice. Case studies on field measurements are unavailable due to the lack of a reliable country network of lysimeters. Only old values before 1990 were available for a small part of Slovakia [32]. This can be improved in the future, and this study can accelerate the planning of possible research projects.
The improved emissions estimation will be implemented dynamically in the national emission inventory for the whole time series starting in 1990, which is the base year for emission estimations.
Atmosphere 2020, 11, 552 11 of 13
Based on actual climatic parameters in the current year, the actual land database and the appropriate share of irrigated area, FracLEACHN, will be calculated for each year and updated annually.
Author Contributions: Conceptualization, K.T. and P.T.; methodology, K.T.; software, P.T.; validation, K.T., P.T. J.S. and B.Š; formal analysis, K.T.; investigation, K.T. and P.T.; resources, B.Š; data curation, K.T; writing—original draft preparation, K.T. and P.T.; writing—review and editing, J.S.; visualization, K.T. and P.T.; supervision, B.Š.; project administration, K.T.; funding acquisition, B.Š. All authors have read and agreed to the published version of the manuscript.
Funding: This research was supported by the Scientific Grant Agency of the Ministry of Education, Science, Research and Sport of the Slovak Republic by project no. VEGA 1/0767/17.
Conflicts of Interest: The authors declare no conflict of interest.
References
1. Bielek, P. Nitrogen in Agricultural Soils of the SR; The Research Institute of Soil Fertility Bratislava: Nitra, Slovakia, 1998; ISBN 80-85361-44-2.
2. Xu, J.; Cai, H.; Wang, X.; Ma, C.; Lu, Y.; Ding, Y.; Wang, X.; Chen, H.; Wang, Y.; Saddique, Q. Exploring optimal irrigation and nitrogen fertilization in a winter wheat-summer maize rotation system for improving crop yield and reducing water and nitrogen leaching. Agric. Water Manag. 2020, 228, doi:10.1016/j.agwat.2019.105904.
3. Khan, M.; Mohammad, F. Eutrophication: Challenges and Solutions. In Eutrophication: Causes, Consequences and Control; Ansari, A., Gill, S., Eds.; Springer: Dordrecht, The Netherlands, 2020; doi:10.1007/978-94-007-7814-6_1.
4. Bouwman, A.F. Exchange of Greenhouse Gases between Terrestrial Ecosystems and the Atmosphere. In Soils and the Greenhouse Effect; Bouwman, A.F., Ed.; John Wiley and Sons: New York, NY, USA, 1990; pp. 61–127.
5. Smith, K.A.; Thomson, P.E.; Clayton, H.; McTaggart, I.P.; Conen, F. Effects of temperature, water content and nitrogen fertilisation on emissions of nitrous oxide by soils. Atmos. Environ. 1998, 32, 3301–3309, doi:10.1016/S1352-2310(97)00492-5.
6. Brasseur, G.P.; Orlando, J.; Tyndall, G. Atmospheric Chemistry and Global Change; Oxford University Press: Oxford, UK, 1999; ISBN 978-0195105216.
7. Brutin, D. Droplet Wetting and Evaporation; Aix-Marseille University: Marseille, France, 2015; ISBN 978-0-12-800722-8, doi:10.1016/C2013-0-18955-6).
8. Sahrawat, K.L.; Keeney, D.R. Nitrous Oxide Emission from Soils. In Advances in Soil Science; Stewart, B.A., Eds.; Springer: New York, NY, USA, 1986; Volume 4, doi:10.1016/S1352-2310(97)00492-5).
9. Tian, L.; Cai, Y.; Akiyama, H. A review of indirect N2O emission factors from agricultural nitrogen leaching and runoff to update of the default IPCC values. Environ. Pollut. 2019, 245, 300–306 doi:10.1016/j.envpol.2018.11.016.
10. Phoenix, G.K.; Booth, R.E.; Leake, J.R.; Read, D.J.; Grime, P.; Lee, J.A. Effects of enhanced nitrogen deposition and phosphorus limitation on nitrogen budgets of semi-natural grasslands. Glob. Chang. Biol. 2003, 9, 1309–1321, doi:10.1046/j.1365-2486.2003.00660.x.
11. The Food and Agriculture Organization of the United Nations, Crop Evapotranspiration—Guidelines for Computing Crop Water Requirements—FAO Irrigation and Drainage Paper. 1998. ISBN 92-5-104219-5 Available online: http://www.fao.org/3/x0490e/x0490e00.htm#Contents (accessed on 4 May 2020).
12. Mati, R.; Kotorová; D.; Naštáková, J. Evaluation and Pricing of Soil Water-Retention Capacities in the East Slovak lowland. Agriculture 2009, 4, 189–196. Available online: https://www.agriculture.sk/fileadmin/agriculture/files/2009/Issue_4/4-Mati-Kotorova-189-196.pdf (accessed on 13 October 2019).
13. Cardenas, L.M.; Gooday, R.; Brown, L.; Scholefield, D.; Cuttle, S.; Gilhespy, S.; Matthews, R.; Misselbrook, T.; Wang, J.; Li, C.; et al. Towards an improved inventory of N2O from Agriculture: Model evaluation of N2O emission factors and N fraction leached from different sources in UK agriculture. Atmos. Environ. 2013, 79, 340–348.
14. Bielek, P. The Soil Cultivation for Environmental Managers; the Slovak University of Agriculture in Nitra: Nitra, Slovakia, 2017; p. 318, ISBN 978-80-552-1682-9.
Atmosphere 2020, 11, 552 12 of 13
15. Davies, D.B.; Silvester-Bradly, R. The contribution of fertilizer nitrogen to leachable nitrogen in the UK. A review. J. Sci. Food Agric. 1995, 68, 399–406, doi:10.1002/jsfa.2740680402.
16. Mosier, A.; Kroeze, C.; Nevison, C.; Oenema, O.; Seitzinger, S.; van Cleemput, O. Closing the global N2O budget: Nitrous oxide emissions through the agricultural nitrogen cycle—OECD/IPCC/IEA phase II development of IPCC guidelines for national greenhouse gas inventory methodology. Nutr. Cycl. Agroecosyst. 1998, 52, 225–248, doi:10.1023/A:1009740530221.
17. The Intergovernmental Panel on Climate Change, Agriculture. 2006 IPCC Guidelines for National Greenhouse Gas Inventory. Volume 4 Agriculture, Forestry and Other Land Use Methodology; Chapter 11 N2O emissions from managed soils, and CO2 emissions from lime and urea application; Institute for Global Environmental Strategies: Hayama, Japan, 2006; ISBN4 87888-032-4, Available online: https://www.ipcc-nggip.iges.or.jp/public/2006gl/index.html (accessed on 21 May 2020).
18. The Statistical Office of Slovak Republic-Data Cube, Land Use Database, 1995–2017. Available online: http://datacube.statistics.sk/#!/view/sk/VBD_SLOVSTAT/pl2001rs/v_pl2001rs_00_00_00_sk (accessed on 2 April 2020).
19. The Food and Agriculture Organization of the United Nations, The ET0 Calculator, and Evapotranspiration from a Reference Surface, The Food and Agriculture Organization of the United Nations. Available online: http://www.fao.org/3/X0490E/x0490e08.htm (accessed on 13 October 2019).
20. Kannappan, K.; Murugappan, A.; Manikumari, N.; Manoharan, A. Reference Evapotranspiration Models for a Certain Location in Tamilnadu; Watershed Hydrology: New Delhi, India, 2003; p.58, ISBN 81-7764-547-1.
21. Gabriels, D. Aridity and Drought Indices, Dept. Soil Management, Ghent University, Belgium, Available online: http://indico.ictp.it/event/a06222/material/4/2.pdf (accessed on 18 May 2020).
22. SHMI, Climate Atlas of Slovakia. The Slovak Hydrometeorological Institute: Bratislava, Slovakia, 2015; p. 132 ISBN 978-80-88907-90-9
23. Hungarian Meteorological Service (OMSZ). National Inventory Report (Online). Available online: https://unfccc.int/process/transparency-and-reporting/reporting-and-review-under-the-convention/greenhouse-gas-inventories-annex-i-parties/submissions/national-inventory-submissions-2018 (accessed on 19 June 2019).
24. The Common Agricultural Policy, European Commission. Available online: https://ec.europa.eu/info/food-farming-fisheries/key-policies/common-agricultural-policy_en (accessed on 2 April 2020).
25. Kocur-Bera, K. Data compatibility between the Land and Building Cadastre (LBC) and the Land Parcel Identification System (LPIS) in the context of area-based payments: A case study in the Polish Region of Warmia and Mazur. Land Use Policy 2019, 80, 370–379, doi:10.1016/j.landusepol.2018.09.024.
26. The Slovak Hydrometeorological Institute (SHMÚ). National Inventory Report. Available online: https://unfccc.int/process-and-meetings/transparency-and-reporting/reporting-and-review-under-the-convention/greenhouse-gas-inventories-annex-i-parties/national-inventory-submissions-2018 (accessed on 19 June 2019).
27. Fowler, D.; Coyle, M.; Skiba, U.; Sutton, M.A.; Cape, J.N.; Reis, S.; Sheppard, L.J.; Jenkins, A.; Grizzetti, B.; Galloway, J.N.; et al. The global nitrogen cycle in the twenty-first century. Philos. Trans. R. Soc. B 2013, 368, doi:10.1098/rstb.2013.0164 ).
28. Mosier, A.; Syers, J.K.; Freney, J.R. (Eds.) Agriculture and the Nitrogen Cycle: Assessing the Impacts of Fertilizer Use on Food Production and the Environment; Island Press: Washington, DC, , 2004. Available online: https://ebookcentral-1proquest-1com-1f8y3dxhq0d47.hanproxy.cvtisr.sk/lib/cvtisr-ebooks/detail.action?docID=3317459 (accessed on 4 December 2019).
29. Smil, V. Nitrogen in crop production: An account of global flows. Glob. Biogeochem. Cycle 1999, 13, 647–662, doi:10.1029/1999GB900015).
30. The Central Control and Testing Institute in Agriculture. Available online: https://www.uksup.sk/odbor-pody-hnojiv-a-obnovitelnych-zdrojov-energii (accessed on 2 April 2020).
31. Eder, A.; Blöschl, G.; Feichtinger, F.; Herndl, M.; Klammler, G.; Hösch, J.; Erhart, E.; Strauss, P. Indirect nitrogen losses of managed soils contributing to greenhouse emissions of agricultural areas in Austria: Results from lysimeter studies. Nutr. Cycl. Agroecosyst. 2015, 101, 351–364, doi:10.1007/s10705-015-9682-9).

Atmosphere 2020, 11, 552 13 of 13
32. Bielek, P. Nitrogen transformations to carbon mineralization in soil. In Plant Nutrition for Sustainable Food Production and Environment; Ando, T., Fujita, K., Mae, T., Matsumoto, H., Mori, S., Sekiya, J., Eds.; Developments in Plant and Soil Sciences; Springer: Dordrecht, The Netherlands, 1997; Volume 78, pp. 763–764, doi:10.1007/978-94-009-0047-9_245.
33. Silgram, M.; Waring, R.; Anthony, S.; Webb, J. Intercomparison of national & IPCC methods for estimating N loss from agricultural land. Nutr. Cycl. Agroecosyst. 2001, 60, 189–195, doi:10.1023/A:1012695413780.
34. Ryan, M.; Brophy, C.; Connolly, J.; McNamara, K.; Carton, O.T. Monitoring of nitrogen leaching on a dairy farm during four drainage seasons. Ir. J. Agric. Food Res. 2006, 45, 115–134, Available online: https://t-stor.teagasc.ie/handle/11019/608 (accessed on 13 October 2019).
35. Costantini, E.A.C.; L’Abate, G. IT\GeoDataBase Pedoclimatico D’italia (Senza Elaborazioni HTM); EN\Soil and Climate GeoDataBase of Italy. Version 1.0. Consiglio per la Ricerca in Agricoltura e L’analisi Dell’economia Agraria (CREA). Database. 2004. Available online: http://www.soilmaps.it/download/cli-PEDOCLIMATE-ITALY_wgs84.zip http://www.dati.gov.it/iodl/2.0/ Metadata: http://ring.ciard.net/soil-and-climate-geodatabase-italy (accessed on 10 March 2020).
36. The European Environmental Agency. The Annual European Union Greenhouse Gas Inventory 1990–2017 and Inventory Report 2019. Available online: https://www.eea.europa.eu/publications/european-union-greenhouse-gas-inventory-2019 (accessed on 13 October 2019).
© 2020 by the authors. Licensee MDPI, Basel, Switzerland. This article is an open access article distributed under the terms and conditions of the Creative Commons Attribution (CC BY) license (http://creativecommons.org/licenses/by/4.0/).