tier 1 estimation of ghg emissions from organic soils in...
TRANSCRIPT

Tier 1 estimation of GHG emissions from organic soils in Cropland
Management (CM) and Grazing Land Management (GM) at EU level
JRC technical workshop 2014 on reporting LULUCF for CP2 with the IPCC 2013 KP Supplement
Simone Rossi, Roland Hiederer, Giacomo Grassi, Raul Abad Viñas
Joint Research Centre
Arona (Italy), 4-7 May 2014
Outline
1 - IPCC Tier1 Approach for emissions from soil
2 – Activity data: Characterizing land area
2.1 – Land use / activities
2.1.1 - Cropland Management (CM)
2.1.2 – Grazing land Management (GM)
2.1.3 - Available data
2.2 – Soil
2.2.1 - Differences in definitions FAO-IPCC
2.2.2 – Available data
2.3 – Climate
2.3.1 – Available data
2.4 – Delineation of CM and GM Organic Soils areas
2.4.1 – Issues of Spatial alignment of organic soil and Land Cover maps
3 – IPCC default Emission factors
4 – Examples and first results using different datasets
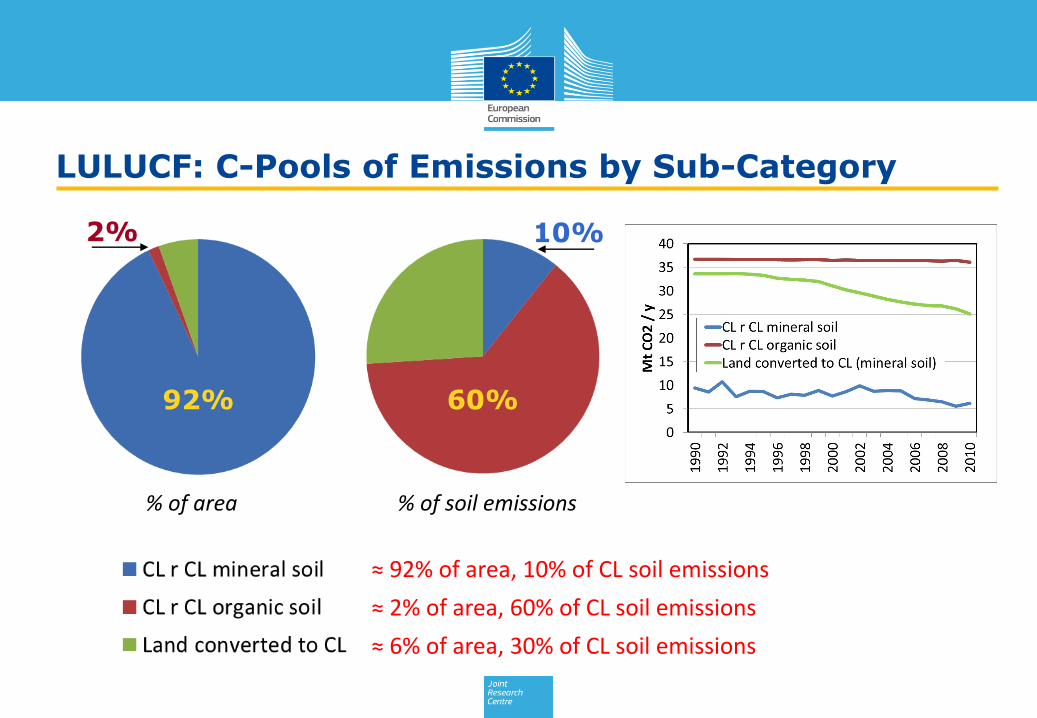
% of soil emissions
≈ 92% of area, 10% of CL soil emissions
≈ 2% of area, 60% of CL soil emissions
≈ 6% of area, 30% of CL soil emissions
% of area
92%
10% 2%
60%
LULUCF: C-Pools of Emissions by Sub-Category
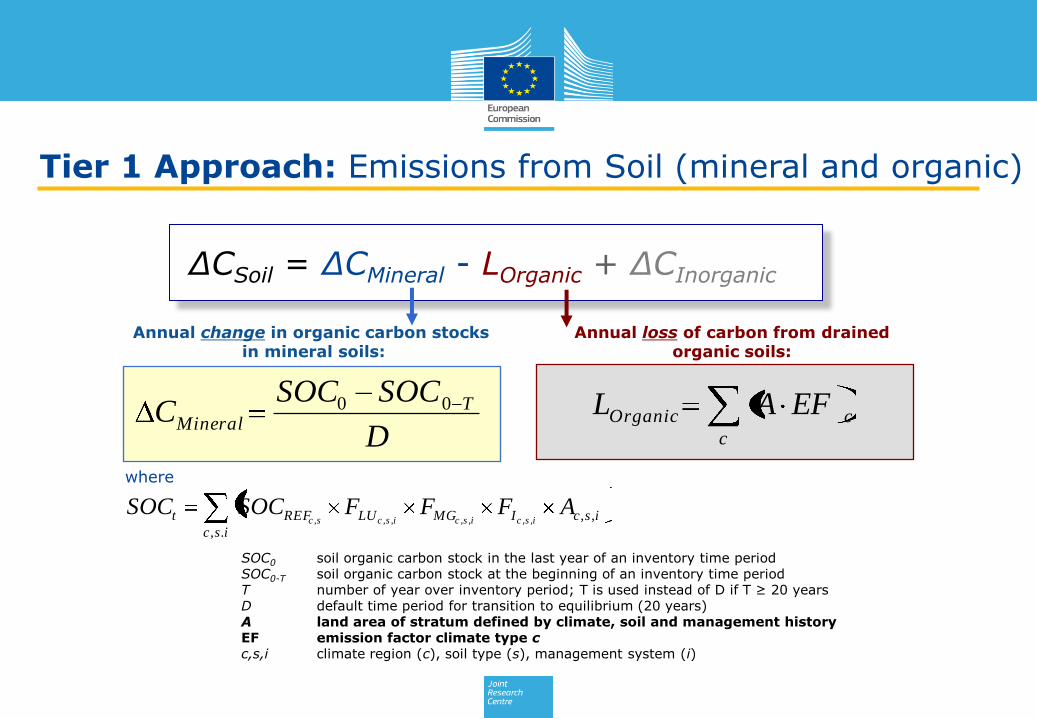
Tier 1 Approach: Emissions from Soil (mineral and organic)
ΔCSoil = ΔCMineral - LOrganic + ΔCInorganic
D
SOCSOCC T
Mineral00
isc
iscIMGLUREFt AFFFSOCSOCiscisciscsc
.,
,,,,,,,,,
where
SOC0 soil organic carbon stock in the last year of an inventory time period SOC0-T soil organic carbon stock at the beginning of an inventory time period T number of year over inventory period; T is used instead of D if T ≥ 20 years D default time period for transition to equilibrium (20 years) A land area of stratum defined by climate, soil and management history EF emission factor climate type c c,s,i climate region (c), soil type (s), management system (i)
Annual change in organic carbon stocks in mineral soils:
Annual loss of carbon from drained organic soils:
c
cOrganic EFAL
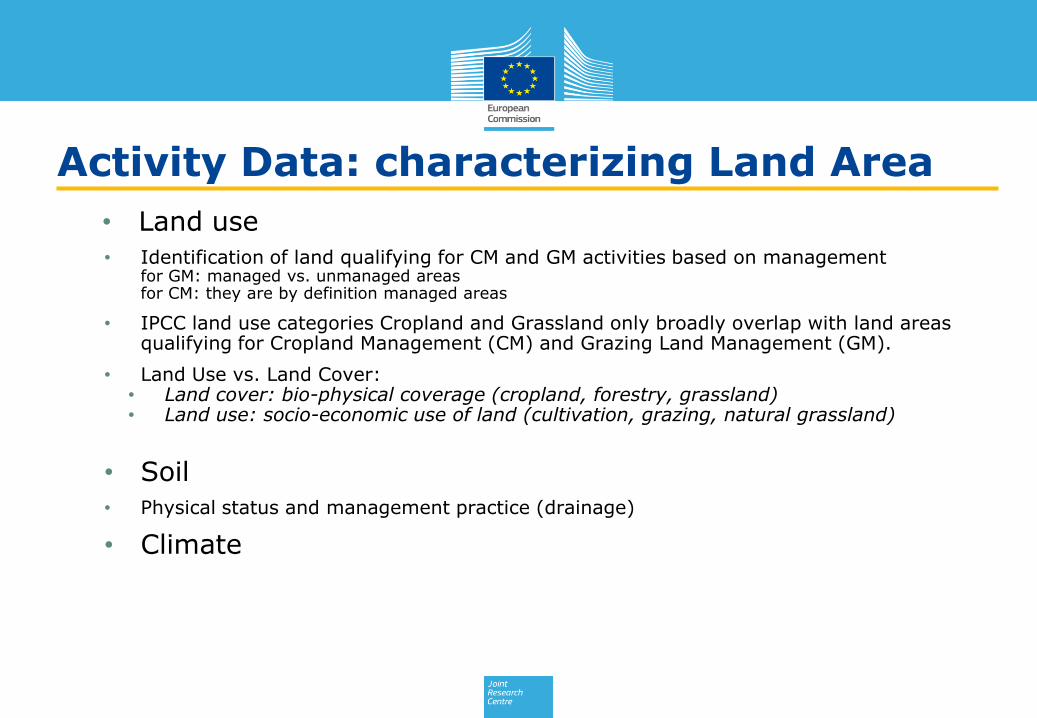
Activity Data: characterizing Land Area
• Land use
• Identification of land qualifying for CM and GM activities based on management for GM: managed vs. unmanaged areas for CM: they are by definition managed areas
• IPCC land use categories Cropland and Grassland only broadly overlap with land areas qualifying for Cropland Management (CM) and Grazing Land Management (GM).
• Land Use vs. Land Cover: • Land cover: bio-physical coverage (cropland, forestry, grassland) • Land use: socio-economic use of land (cultivation, grazing, natural grassland)
• Soil
• Physical status and management practice (drainage)
• Climate
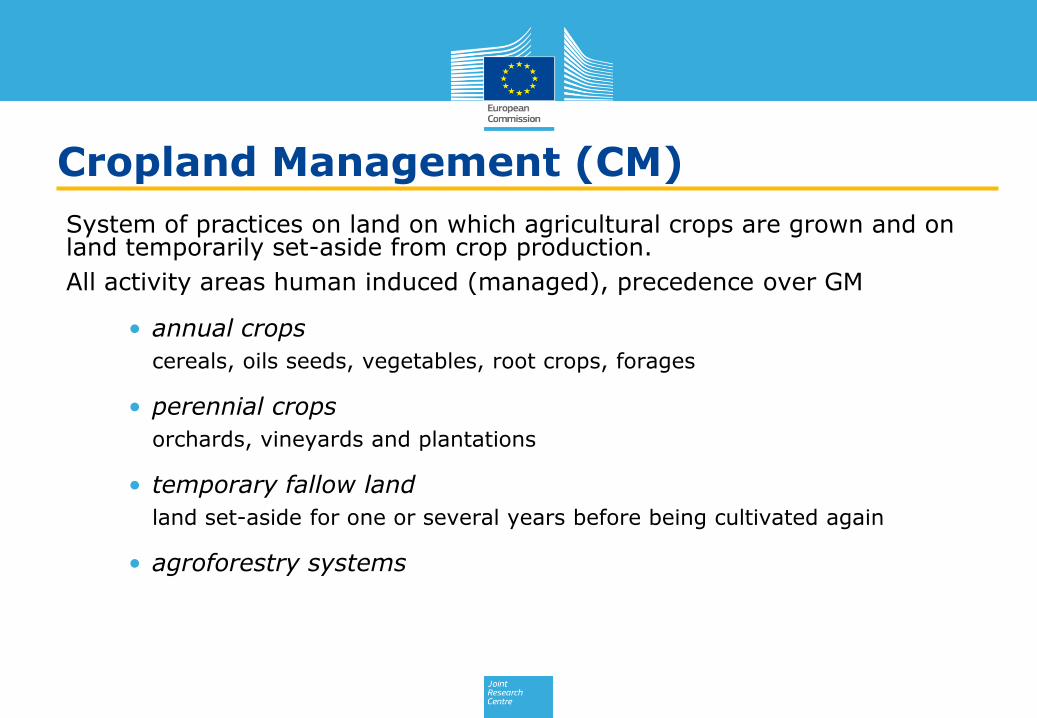
System of practices on land on which agricultural crops are grown and on land temporarily set-aside from crop production.
All activity areas human induced (managed), precedence over GM
• annual crops
cereals, oils seeds, vegetables, root crops, forages
• perennial crops
orchards, vineyards and plantations
• temporary fallow land
land set-aside for one or several years before being cultivated again
• agroforestry systems
Cropland Management (CM)

Grazing Land Management (GM)
“Grazing” used in a broader sense of “livestock production” covers:
• pastures used for grazing by livestock
• meadows used for forage for livestock (green fodder, hay, silage)
Decision on human-induced and precedence / hierarchy
• managed vs. not managed seasonal grazing in semi-natural areas, e.g. heath land.
• wetland or forest grassland in wetland areas, temporary grassland, grazing under forest.

Land use: available data for Europe
• National maps
• CORINE Land Cover map: 1990,2000, 2006 (no Greece), 2012
(under preparation) (100 m)
• Global Land Cover 2000 (1 Km)
• LPIS (if available!)
• ESA Globcover 2005-2006 and 2009 (300m)
• MODIS yearly Land Cover product (MCD12Q1) 2001-2012 (500m)
• FAO GLC-SHARE Database 2014 beta release (1 Km)
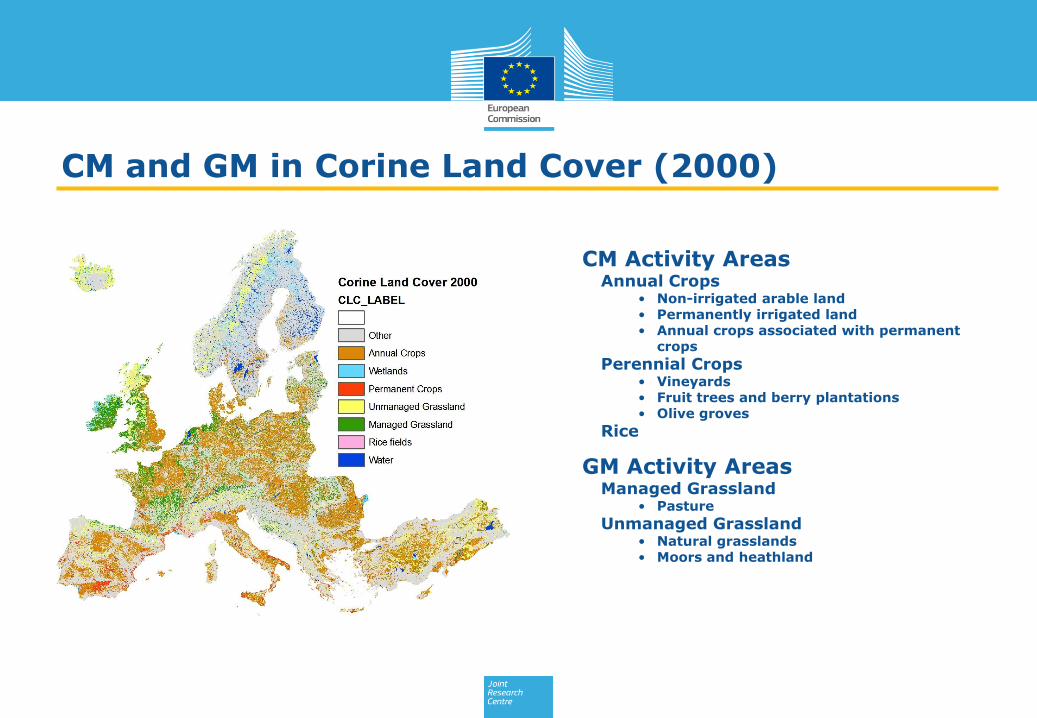
CM Activity Areas Annual Crops
• Non-irrigated arable land • Permanently irrigated land • Annual crops associated with permanent
crops
Perennial Crops • Vineyards • Fruit trees and berry plantations • Olive groves
Rice
GM Activity Areas Managed Grassland
• Pasture
Unmanaged Grassland • Natural grasslands • Moors and heathland
CM and GM in Corine Land Cover (2000)
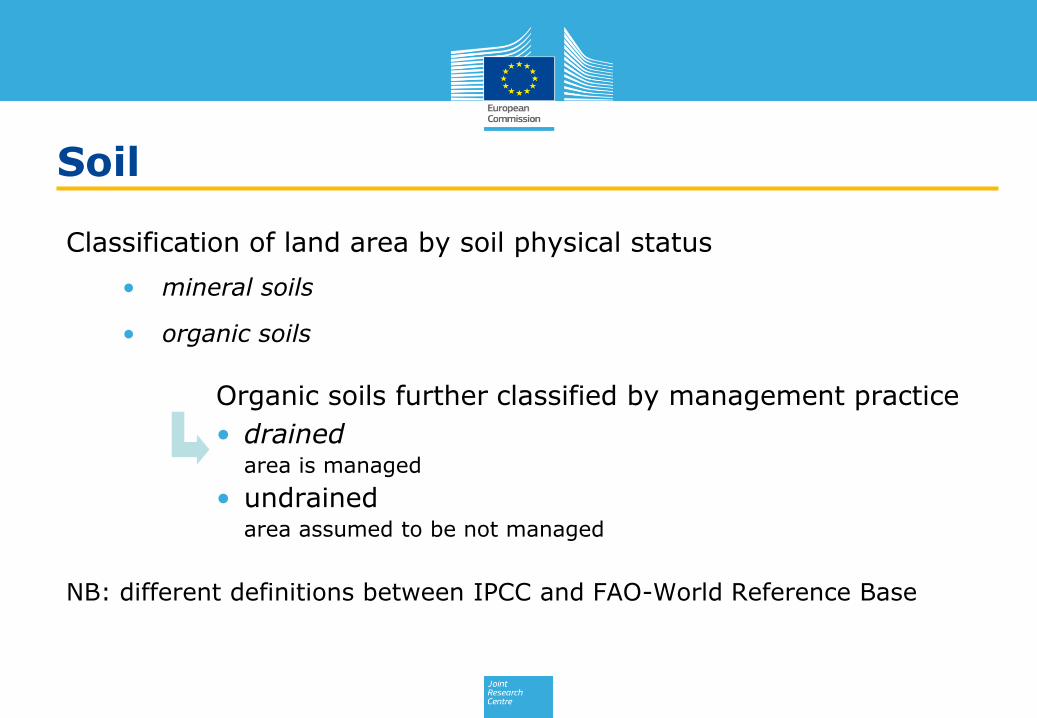
Soil
Classification of land area by soil physical status
• mineral soils
• organic soils
Organic soils further classified by management practice
• drained area is managed
• undrained area assumed to be not managed
NB: different definitions between IPCC and FAO-World Reference Base
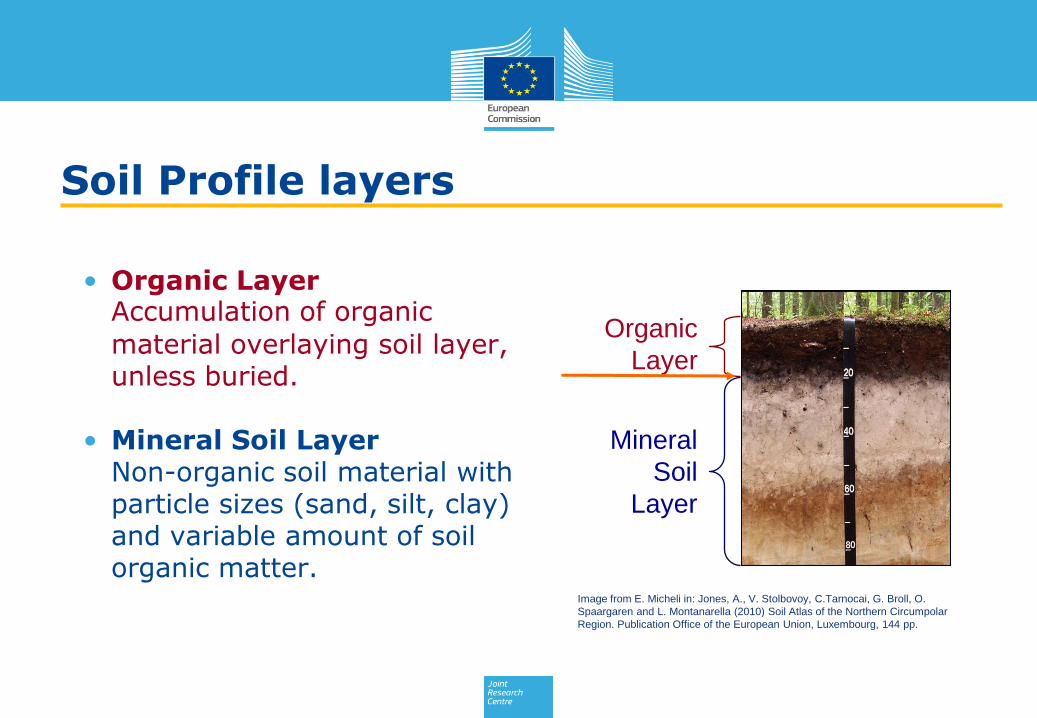
• Organic Layer Accumulation of organic
material overlaying soil layer, unless buried.
• Mineral Soil Layer Non-organic soil material with
particle sizes (sand, silt, clay) and variable amount of soil organic matter.
Mineral
Soil
Layer
Organic
Layer
Image from E. Micheli in: Jones, A., V. Stolbovoy, C.Tarnocai, G. Broll, O.
Spaargaren and L. Montanarella (2010) Soil Atlas of the Northern Circumpolar
Region. Publication Office of the European Union, Luxembourg, 144 pp.
Soil Profile layers
Soil: available data for Europe
• National data
• JRC European Soil Database (ESDB)
• FAO/ISRIC Harmonized World Soil Database (HWSD)
• EUROSTAT/JRC Land Use/Cover Area frame Survey (LUCAS)

Climate
• Climate zones layer based on IPCC (JRC)
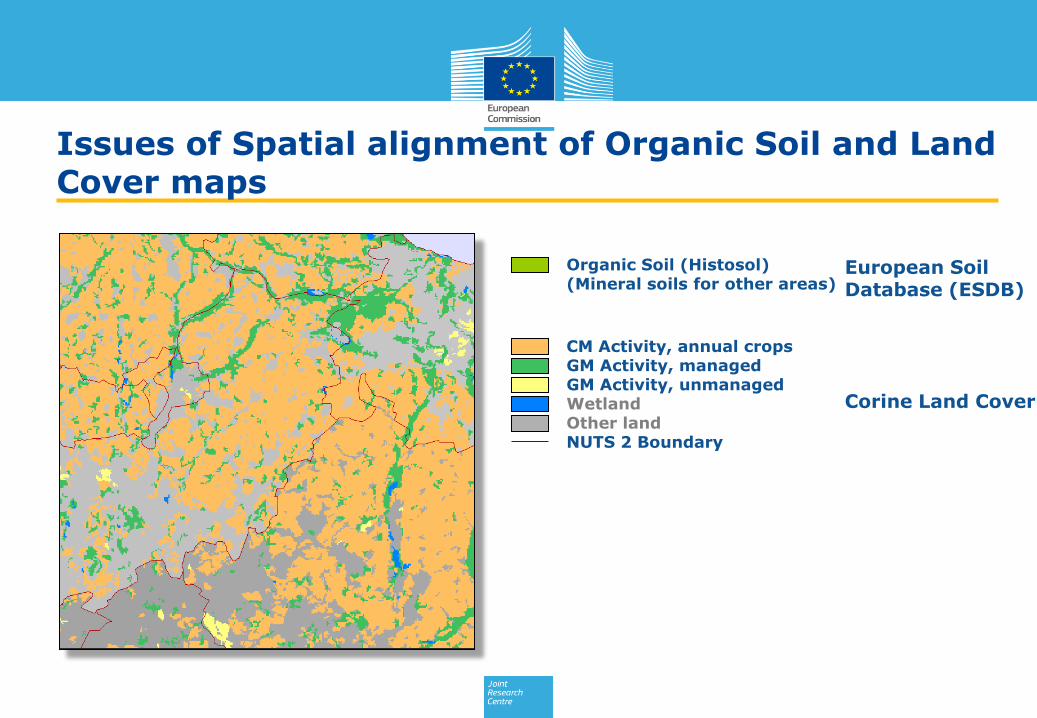
European Soil Database (ESDB) Corine Land Cover
Organic Soil (Histosol) (Mineral soils for other areas)
Issues of Spatial alignment of Organic Soil and Land Cover maps
CM Activity, annual crops GM Activity, managed GM Activity, unmanaged Wetland Other land NUTS 2 Boundary
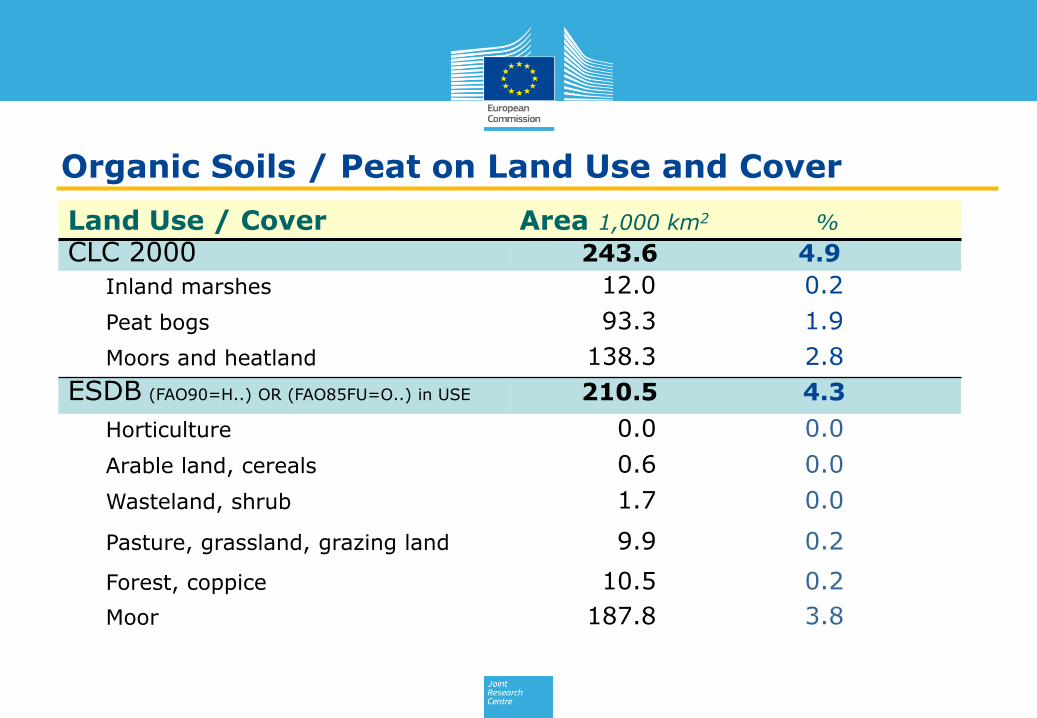
Organic Soils / Peat on Land Use and Cover
Land Use / Cover Area 1,000 km2 %
CLC 2000 243.6 4.9
Inland marshes 12.0 0.2
Peat bogs 93.3 1.9
Moors and heatland 138.3 2.8
ESDB (FAO90=H..) OR (FAO85FU=O..) in USE 210.5 4.3
Horticulture 0.0 0.0
Arable land, cereals 0.6 0.0
Wasteland, shrub 1.7 0.0
Pasture, grassland, grazing land 9.9 0.2
Forest, coppice 10.5 0.2
Moor 187.8 3.8
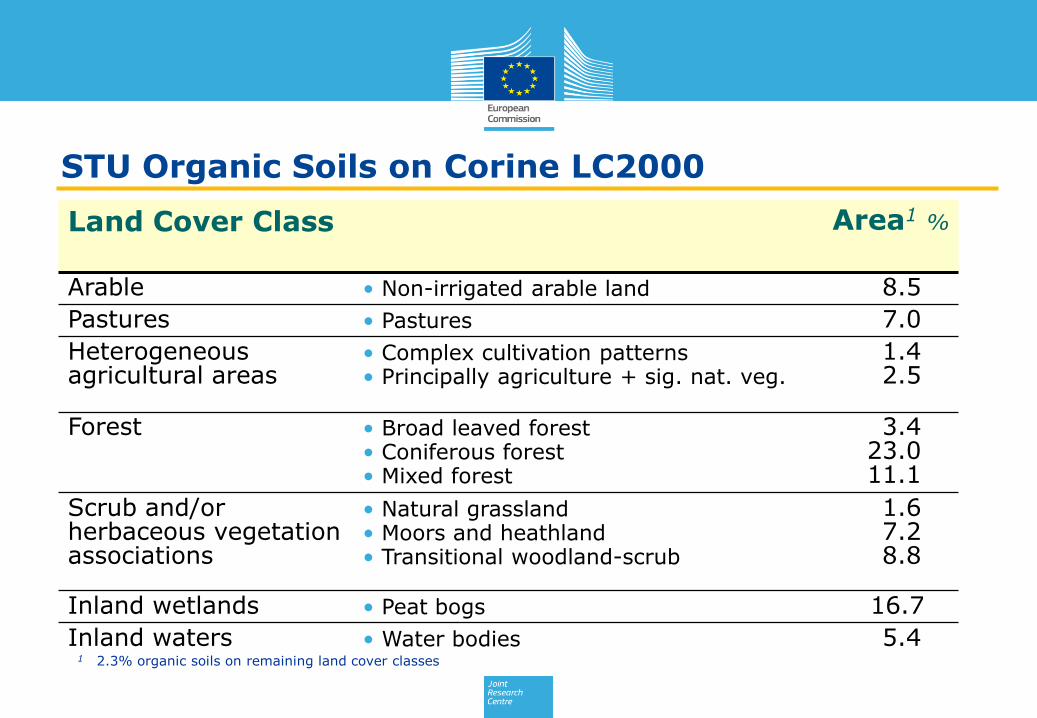
STU Organic Soils on Corine LC2000
Land Cover Class Area1 %
Arable • Non-irrigated arable land 8.5
Pastures • Pastures 7.0
Heterogeneous agricultural areas
• Complex cultivation patterns • Principally agriculture + sig. nat. veg.
1.4 2.5
Forest • Broad leaved forest • Coniferous forest • Mixed forest
3.4 23.0 11.1
Scrub and/or herbaceous vegetation associations
• Natural grassland • Moors and heathland • Transitional woodland-scrub
1.6 7.2 8.8
Inland wetlands • Peat bogs 16.7
Inland waters • Water bodies 5.4 1 2.3% organic soils on remaining land cover classes
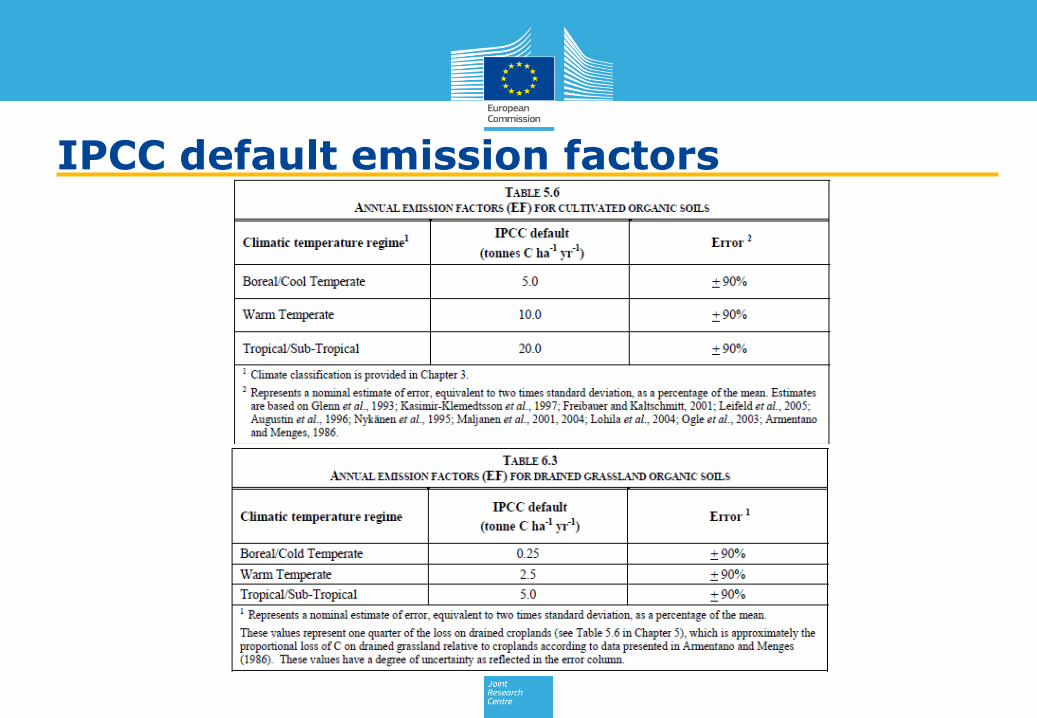
IPCC default emission factors
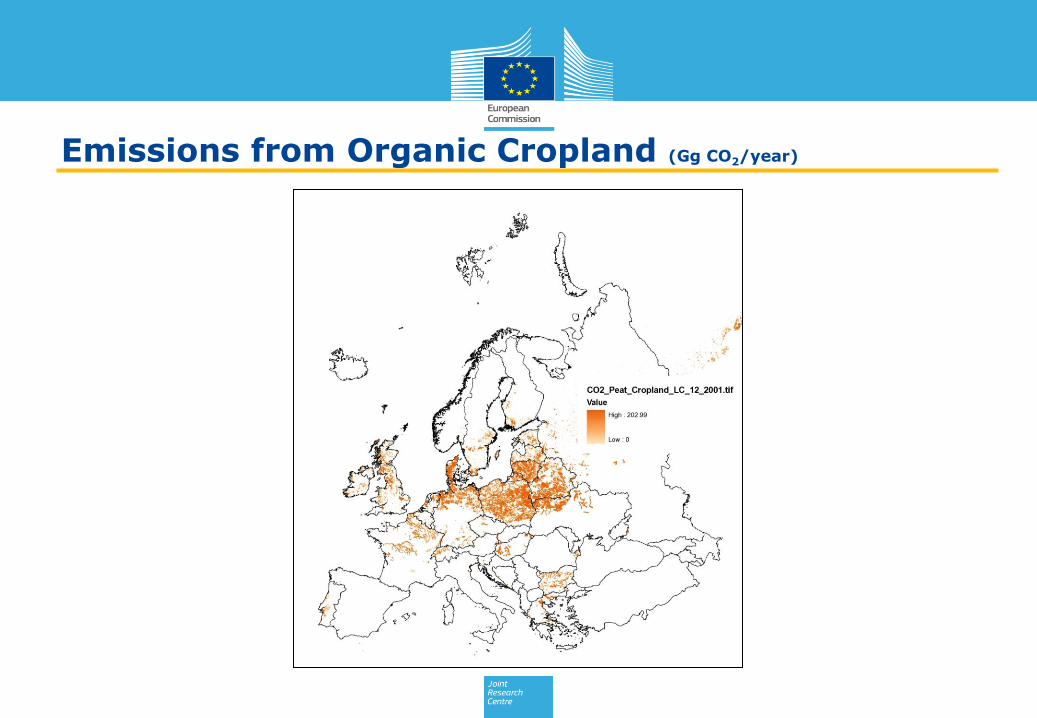
Emissions from Organic Cropland (Gg CO2/year)
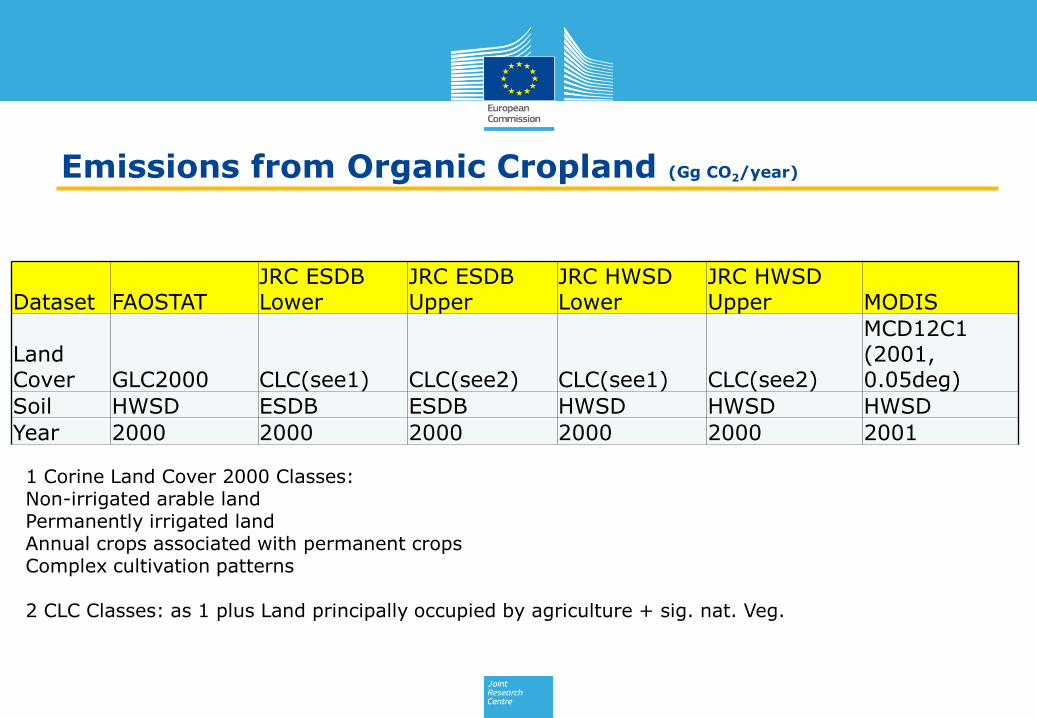
Dataset FAOSTAT JRC ESDB Lower
JRC ESDB Upper
JRC HWSD Lower
JRC HWSD Upper MODIS
Land Cover GLC2000 CLC(see1) CLC(see2) CLC(see1) CLC(see2)
MCD12C1 (2001, 0.05deg)
Soil HWSD ESDB ESDB HWSD HWSD HWSD
Year 2000 2000 2000 2000 2000 2001
Emissions from Organic Cropland (Gg CO2/year)
1 Corine Land Cover 2000 Classes: Non-irrigated arable land Permanently irrigated land Annual crops associated with permanent crops Complex cultivation patterns 2 CLC Classes: as 1 plus Land principally occupied by agriculture + sig. nat. Veg.
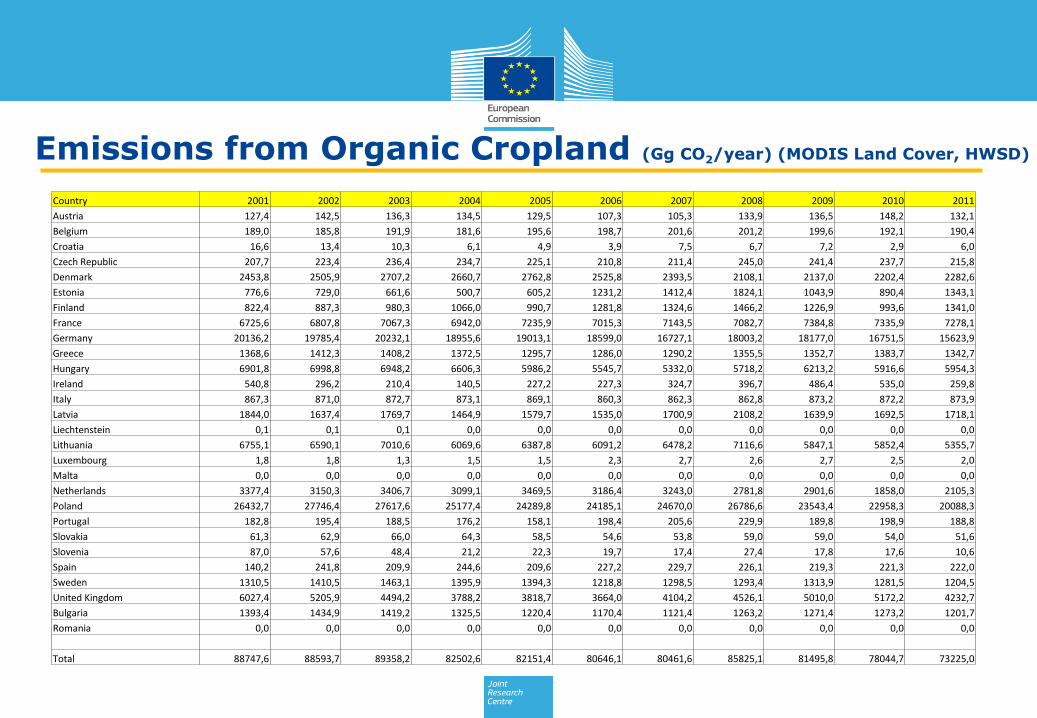
Country 2001 2002 2003 2004 2005 2006 2007 2008 2009 2010 2011
Austria 127,4 142,5 136,3 134,5 129,5 107,3 105,3 133,9 136,5 148,2 132,1
Belgium 189,0 185,8 191,9 181,6 195,6 198,7 201,6 201,2 199,6 192,1 190,4
Croatia 16,6 13,4 10,3 6,1 4,9 3,9 7,5 6,7 7,2 2,9 6,0
Czech Republic 207,7 223,4 236,4 234,7 225,1 210,8 211,4 245,0 241,4 237,7 215,8
Denmark 2453,8 2505,9 2707,2 2660,7 2762,8 2525,8 2393,5 2108,1 2137,0 2202,4 2282,6
Estonia 776,6 729,0 661,6 500,7 605,2 1231,2 1412,4 1824,1 1043,9 890,4 1343,1
Finland 822,4 887,3 980,3 1066,0 990,7 1281,8 1324,6 1466,2 1226,9 993,6 1341,0
France 6725,6 6807,8 7067,3 6942,0 7235,9 7015,3 7143,5 7082,7 7384,8 7335,9 7278,1
Germany 20136,2 19785,4 20232,1 18955,6 19013,1 18599,0 16727,1 18003,2 18177,0 16751,5 15623,9
Greece 1368,6 1412,3 1408,2 1372,5 1295,7 1286,0 1290,2 1355,5 1352,7 1383,7 1342,7
Hungary 6901,8 6998,8 6948,2 6606,3 5986,2 5545,7 5332,0 5718,2 6213,2 5916,6 5954,3
Ireland 540,8 296,2 210,4 140,5 227,2 227,3 324,7 396,7 486,4 535,0 259,8
Italy 867,3 871,0 872,7 873,1 869,1 860,3 862,3 862,8 873,2 872,2 873,9
Latvia 1844,0 1637,4 1769,7 1464,9 1579,7 1535,0 1700,9 2108,2 1639,9 1692,5 1718,1
Liechtenstein 0,1 0,1 0,1 0,0 0,0 0,0 0,0 0,0 0,0 0,0 0,0
Lithuania 6755,1 6590,1 7010,6 6069,6 6387,8 6091,2 6478,2 7116,6 5847,1 5852,4 5355,7
Luxembourg 1,8 1,8 1,3 1,5 1,5 2,3 2,7 2,6 2,7 2,5 2,0
Malta 0,0 0,0 0,0 0,0 0,0 0,0 0,0 0,0 0,0 0,0 0,0
Netherlands 3377,4 3150,3 3406,7 3099,1 3469,5 3186,4 3243,0 2781,8 2901,6 1858,0 2105,3
Poland 26432,7 27746,4 27617,6 25177,4 24289,8 24185,1 24670,0 26786,6 23543,4 22958,3 20088,3
Portugal 182,8 195,4 188,5 176,2 158,1 198,4 205,6 229,9 189,8 198,9 188,8
Slovakia 61,3 62,9 66,0 64,3 58,5 54,6 53,8 59,0 59,0 54,0 51,6
Slovenia 87,0 57,6 48,4 21,2 22,3 19,7 17,4 27,4 17,8 17,6 10,6
Spain 140,2 241,8 209,9 244,6 209,6 227,2 229,7 226,1 219,3 221,3 222,0
Sweden 1310,5 1410,5 1463,1 1395,9 1394,3 1218,8 1298,5 1293,4 1313,9 1281,5 1204,5
United Kingdom 6027,4 5205,9 4494,2 3788,2 3818,7 3664,0 4104,2 4526,1 5010,0 5172,2 4232,7
Bulgaria 1393,4 1434,9 1419,2 1325,5 1220,4 1170,4 1121,4 1263,2 1271,4 1273,2 1201,7
Romania 0,0 0,0 0,0 0,0 0,0 0,0 0,0 0,0 0,0 0,0 0,0
Total 88747,6 88593,7 89358,2 82502,6 82151,4 80646,1 80461,6 85825,1 81495,8 78044,7 73225,0
Emissions from Organic Cropland (Gg CO2/year) (MODIS Land Cover, HWSD)
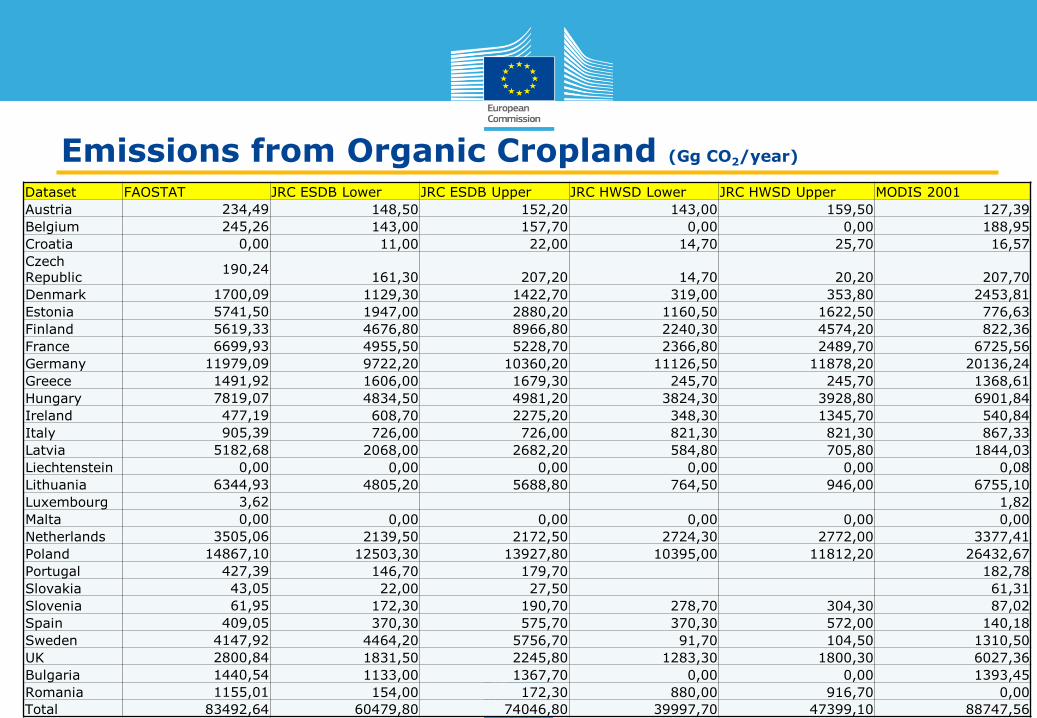
Emissions from Organic Cropland (Gg CO2/year)
Dataset FAOSTAT JRC ESDB Lower JRC ESDB Upper JRC HWSD Lower JRC HWSD Upper MODIS 2001
Austria 234,49 148,50 152,20 143,00 159,50 127,39
Belgium 245,26 143,00 157,70 0,00 0,00 188,95
Croatia 0,00 11,00 22,00 14,70 25,70 16,57
Czech Republic
190,24 161,30 207,20 14,70 20,20 207,70
Denmark 1700,09 1129,30 1422,70 319,00 353,80 2453,81
Estonia 5741,50 1947,00 2880,20 1160,50 1622,50 776,63
Finland 5619,33 4676,80 8966,80 2240,30 4574,20 822,36
France 6699,93 4955,50 5228,70 2366,80 2489,70 6725,56
Germany 11979,09 9722,20 10360,20 11126,50 11878,20 20136,24
Greece 1491,92 1606,00 1679,30 245,70 245,70 1368,61
Hungary 7819,07 4834,50 4981,20 3824,30 3928,80 6901,84
Ireland 477,19 608,70 2275,20 348,30 1345,70 540,84
Italy 905,39 726,00 726,00 821,30 821,30 867,33
Latvia 5182,68 2068,00 2682,20 584,80 705,80 1844,03
Liechtenstein 0,00 0,00 0,00 0,00 0,00 0,08
Lithuania 6344,93 4805,20 5688,80 764,50 946,00 6755,10
Luxembourg 3,62 1,82
Malta 0,00 0,00 0,00 0,00 0,00 0,00
Netherlands 3505,06 2139,50 2172,50 2724,30 2772,00 3377,41
Poland 14867,10 12503,30 13927,80 10395,00 11812,20 26432,67
Portugal 427,39 146,70 179,70 182,78
Slovakia 43,05 22,00 27,50 61,31
Slovenia 61,95 172,30 190,70 278,70 304,30 87,02
Spain 409,05 370,30 575,70 370,30 572,00 140,18
Sweden 4147,92 4464,20 5756,70 91,70 104,50 1310,50
UK 2800,84 1831,50 2245,80 1283,30 1800,30 6027,36
Bulgaria 1440,54 1133,00 1367,70 0,00 0,00 1393,45
Romania 1155,01 154,00 172,30 880,00 916,70 0,00
Total 83492,64 60479,80 74046,80 39997,70 47399,10 88747,56
0,00
5000,00
10000,00
15000,00
0,00 5000,00 10000,00 15000,00
JRC E
SD
B L
ow
er,
2000
FAOSTAT 2000
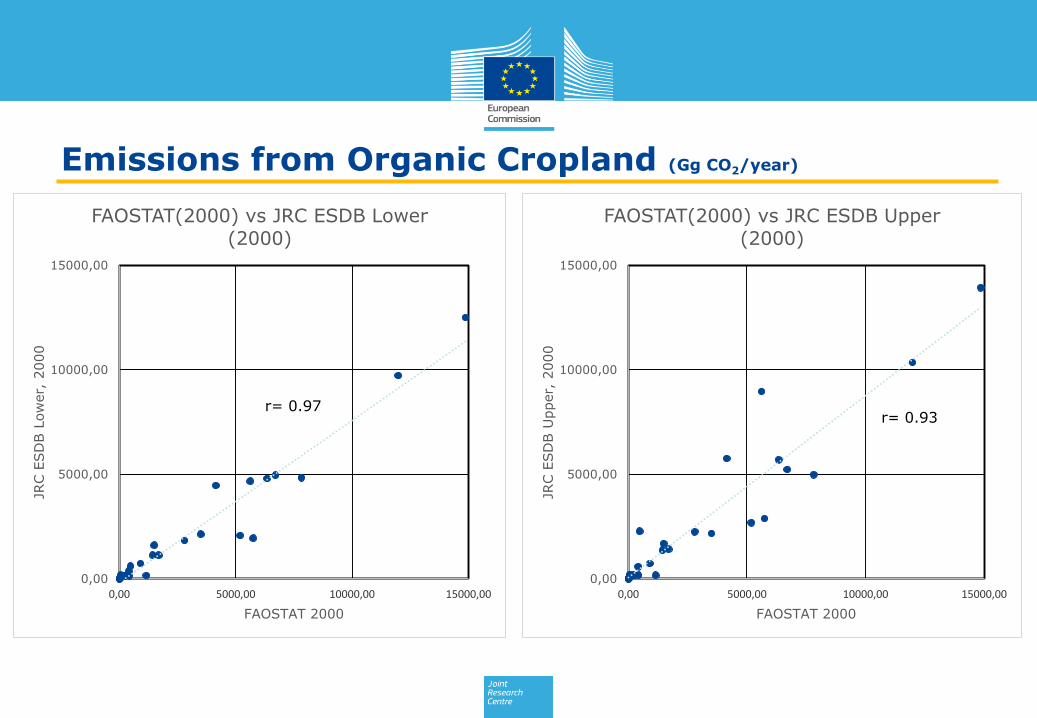
FAOSTAT(2000) vs JRC ESDB Lower (2000)
r= 0.97
0,00
5000,00
10000,00
15000,00
0,00 5000,00 10000,00 15000,00
JRC E
SD
B U
pper,
2000
FAOSTAT 2000
FAOSTAT(2000) vs JRC ESDB Upper (2000)
r= 0.93
Emissions from Organic Cropland (Gg CO2/year)

Pearson r MODIS 2001 FAOSTAT JRC ESDB Lower
JRC ESDB Upper
JRC HWSD Lower
JRC HWSD Upper
MODIS 2001 1 0.89 0.93 0.85 0.93 0,93
FAOSTAT 0.89 1 0.97 0.94 0.78 0.88
JRC ESDB Lower 0.93 0.97 1 0.90
JRC ESDB Upper 0.85 0.94 1 0.88
JRC HWSD Lower 0.93 0.78 0.90 1
JRC HWSD Upper 0.93 0.88 0.88 1
Emissions from Organic Cropland (Gg CO2/year)
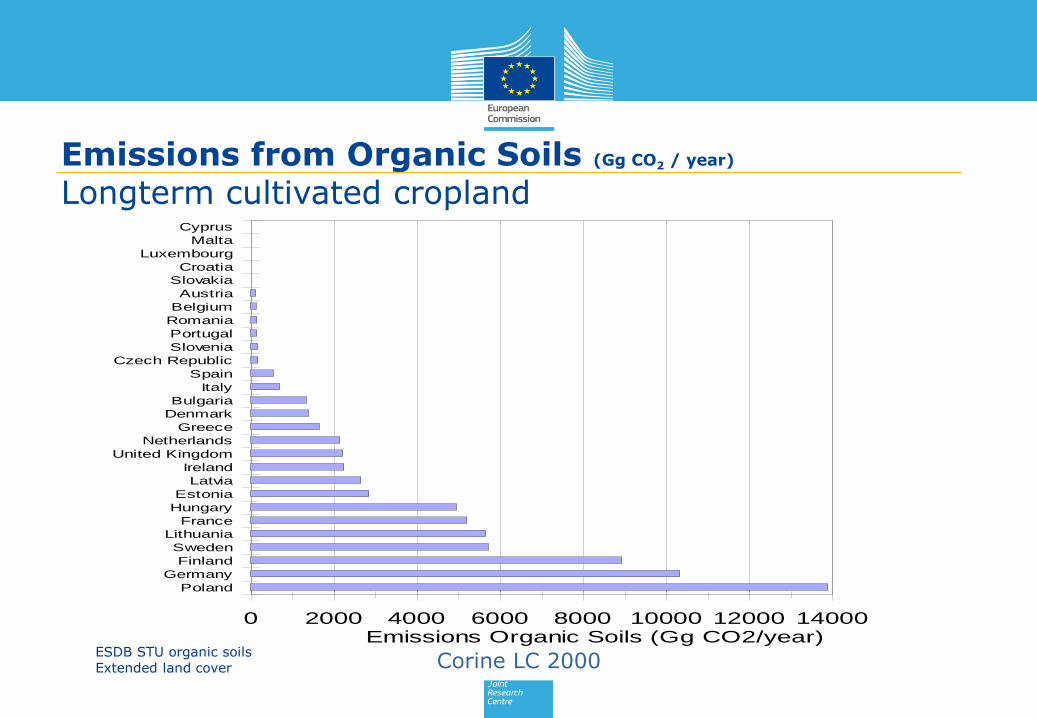
0 2000 4000 6000 8000 10000 12000 14000Emissions Organic Soils (Gg CO2/year)
Poland
Germany
Finland
Sweden
Lithuania
France
Hungary
Estonia
Latvia
Ireland
United Kingdom
Netherlands
Greece
Denmark
Bulgaria
Italy
Spain
Czech Republic
Slovenia
Portugal
Romania
Belgium
Austria
Slovakia
Croatia
Luxembourg
Malta
Cyprus
Emissions from Organic Soils (Gg CO2 / year)
Longterm cultivated cropland
Corine LC 2000 ESDB STU organic soils Extended land cover

Thank you for your attention