emissions control for lean gasoline engines · 3 managed by ut-battelle for the u.s. department of...
TRANSCRIPT
Emissions Control for Lean Gasoline Engines
ACE033 May 17, 2012
Todd J. Toops, James E. Parks (PI), Josh A. Pihl, Shean Huff, Vitaly Prikhodko Oak Ridge National Laboratory
Gurpreet Singh and Ken Howden Advanced Combustion Engines Program
U.S. Department of Energy
This presentation does not contain any proprietary, confidential, or otherwise restricted information

2 Managed by UT-Battelle for the U.S. Department of Energy
Project Overview Timeline
Budget
Barriers Addressed
Collaborators & Partners • Lean Gasoline
– FY11: $200k – FY12: $400k
• Fundamental Catalysis – FY11: $200k – FY12: $0k
• Umicore • General Motors • University of South Carolina • University of Wisconsin • Cross-Cut Lean Exhaust Emissions
Reduction Simulations (CLEERS)
• Barriers listed in VT Program Multi-Year Program Plan 2011-2015:
– 2.3.1B: Lack of cost-effective emission control
– 2.3.1C: Lack of modeling capability for combustion and emission control
– 2.3.1.D: Durability
• New project: – Combination of two related efforts – Refocused to address current DOE and
industry needs • Lean Gasoline: Started in FY10 • Fundamental Catalysis: Started in FY02

3 Managed by UT-Battelle for the U.S. Department of Energy
Objectives and Relevance
Enabling lean-gasoline vehicles to meet emissions regulations will achieve significant reduction in petroleum use
• Objective: – Address technical challenges to meeting emissions regulations – Investigate strategies to achieve cost-effective compliance
• minimize precious metal content while maximizing fuel economy
• Relevance: – U.S. passenger car fleet is dominated by gasoline-fueled vehicles. – Enabling introduction of more efficient lean gasoline engines can provide significant
reductions in overall petroleum use • thereby lowering dependence on foreign oil and reducing greenhouse gases
4 Managed by UT-Battelle for the U.S. Department of Energy
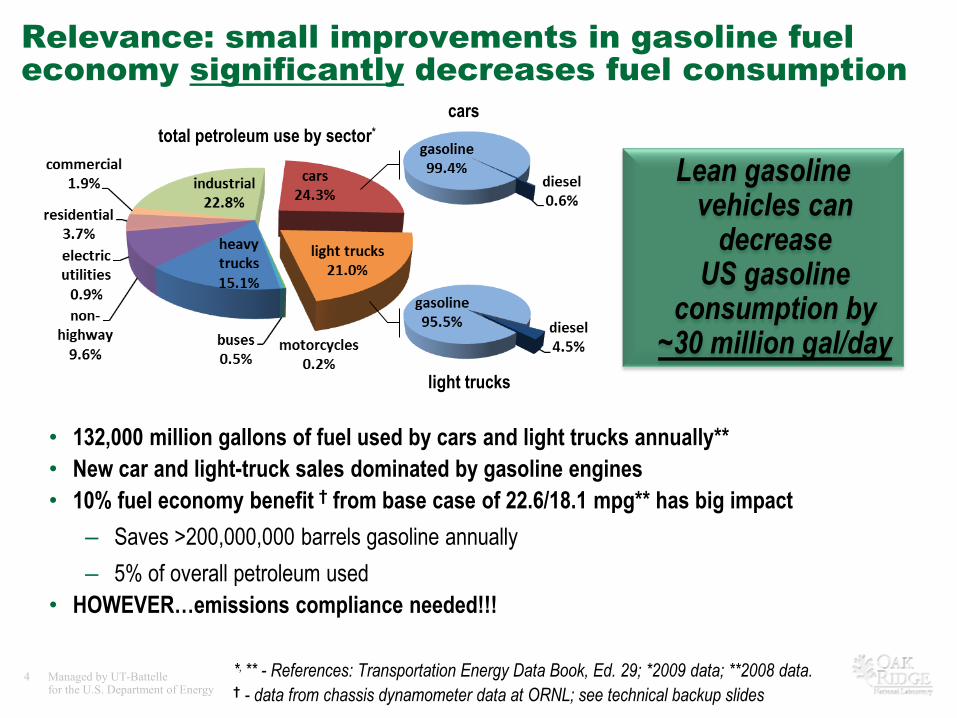
Relevance: small improvements in gasoline fuel economy significantly decreases fuel consumption
Lean gasoline vehicles can
decrease US gasoline
consumption by ~30 million gal/day
• 132,000 million gallons of fuel used by cars and light trucks annually** • New car and light-truck sales dominated by gasoline engines • 10% fuel economy benefit † from base case of 22.6/18.1 mpg** has big impact
– Saves >200,000,000 barrels gasoline annually – 5% of overall petroleum used
• HOWEVER…emissions compliance needed!!!
*, ** - References: Transportation Energy Data Book, Ed. 29; *2009 data; **2008 data. † - data from chassis dynamometer data at ORNL; see technical backup slides
total petroleum use by sector* cars
light trucks

5 Managed by UT-Battelle for the U.S. Department of Energy
Current and Future Milestones
FY13 FY14 FY15 FY16 FY17 Fuel economy gain over stoichiometric 7% 10% 10% 12% 15%
Total emissions control devices Pt* (g/Lengine) 8 7 6 5 4
* - will use Pt equivalent to account for different costs of Pt, Pd and Rh; 5-year average value fixed at beginning of project
• FY2011: Investigate performance, sulfation and desulfation of Ca-doped LNTs with a Ca-level between 3 and 9% (9/30/2011). – Complete; project merged with Lean Gasoline project
• FY2011: Analysis of lean-rich period modification for enabling lower volume LNTs to reduce the higher concentrations of NOx associated with lean gasoline engines (9/30/2011). – Complete
• FY2012: Measure the effect of oxygen storage capacity on NH3 formation by three way catalyst for use in passive SCR emission control strategy. (9/30/2012) – On track
• Future years will adopt a quantitative milestone approach to ensure progression towards goal
of low-cost emissions control solution for fuel efficient lean-burn gasoline vehicles 5-year Average
($/troy oz.) Pt-equivalent
Platinum $ 1,504 /troy oz. 1.0
Palladium $ 463 /troy oz. 0.3
Rhodium $ 3,582 /troy oz. 2.4
Gold $ 989 /troy oz. 0.7

6 Managed by UT-Battelle for the U.S. Department of Energy
Approach: Technology Options and Critical Issues Related to Cost and Performance • Goal: Enable Tier II Bin 2 Emission Compliance for Lean Gasoline Engine • Focus on NOx, CO, HC (PM may be issue for DI engines, but outside of project scope; new project starting) • Technologies: TWC = Three-Way Catalyst
LNT = Lean NOx Trap SCR = Selective Catalytic Reduction
Lean Gasoline SI Direct Injection Engine + TWC + LNT + SCR
NH3
LNT NH3 Optimization HC Slip Control
Lean Gasoline SI Direct Injection Engine + TWC + SCR
NH3
TWC NH3 Production HC Slip Control
Lean Gasoline SI Direct Injection Engine + TWC + SCR Urea Tank/Injector Cost
Customer Acceptance Not in Project Scope
Specific Key Issues: Cost, Durability, Fuel Penalty, Operating Temp., etc…
Lean Gasoline SI Direct Injection Engine + TWC + SCR Temperature Performance
HC Supply and Slip Control
Lean Gasoline SI Direct Injection Engine + TWC + LNT LNT Capacity and Cost
HC Slip Control H2/CO
7 Managed by UT-Battelle for the U.S. Department of Energy
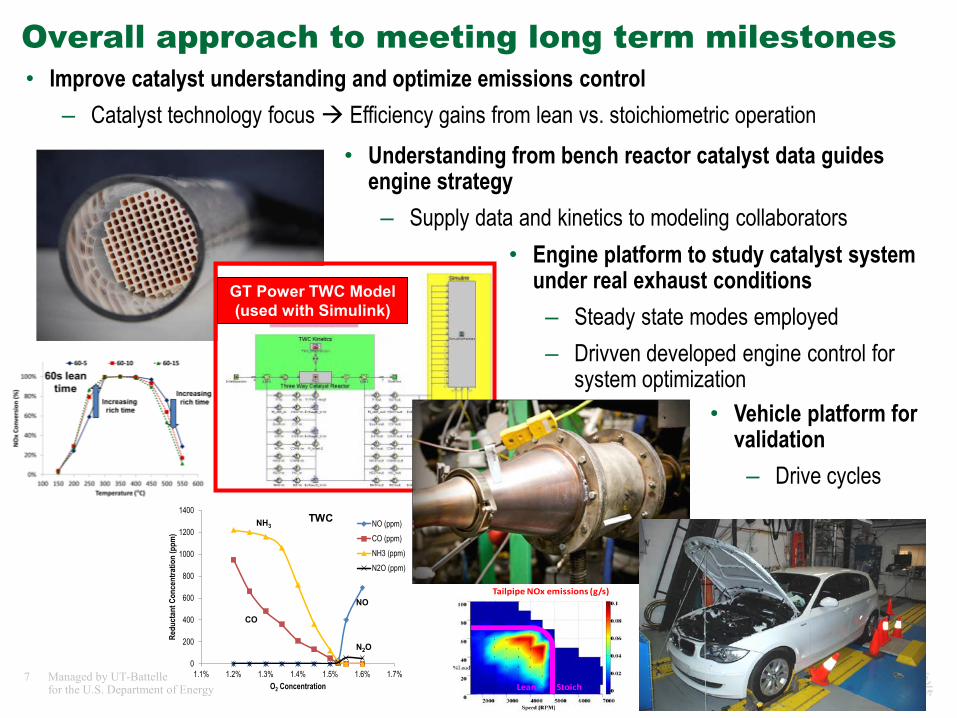
Overall approach to meeting long term milestones
• Engine platform to study catalyst system under real exhaust conditions – Steady state modes employed – Drivven developed engine control for
system optimization
• Improve catalyst understanding and optimize emissions control – Catalyst technology focus Efficiency gains from lean vs. stoichiometric operation
• Understanding from bench reactor catalyst data guides engine strategy – Supply data and kinetics to modeling collaborators
StoichLean
Tailpipe NOx emissions (g/s)
TWC
0
200
400
600
800
1000
1200
1400
1.1% 1.2% 1.3% 1.4% 1.5% 1.6% 1.7%
Redu
ctan
t Con
cent
ratio
n (p
pm)
O2 Concentration
NO (ppm)CO (ppm)NH3 (ppm)N2O (ppm)
CO
NH3
NO
N2O
GT Power TWC Model (used with Simulink)
• Vehicle platform for validation – Drive cycles

8 Managed by UT-Battelle for the U.S. Department of Energy
Collaborations and partners • Currently all collaborations are based on mutual interest
– No subcontracts between partners • General Motors
– Monthly teleconferences • Umicore
– Catalyst supplier for the commercial LNT and TWCs – Facilitating range of catalysts with varying PGM and
functionality – Monthly teleconferences
• University of South Carolina – Visiting graduate student operating and analyzing bench
reactor data • University of Wisconsin
– Modeling components; based on global kinetics • CLEERS
– share results and identify research needs

9 Managed by UT-Battelle for the U.S. Department of Energy
Summary of Technical Accomplishments • Progressed towards lean gasoline engine dynamometer platform
– Obtained two lean gasoline vehicles (BMW 120i) • Engine to be removed from one for full control in test cell • Other vehicle to be kept intact for chassis-studies
– Subcontract to Drivven to develop full pass controller in progress – Transient drive cycle data uploaded to CLEERS website
• Measured impact of lean/rich duration on NOx reduction and product yields – Maximized NOx conversion with constant fuel penalty with:
• short, concentrated rich dose for high temperatures T>450°C • long, low concentration rich dose for T<300°C
– Identified peak NH3 and N2O formation at 250°C – Established desulfation temperature: Peak desulfation at 550-580°C (sulfated to 3.4 g/L)
• Identified TWC NH3 production conditions for passive SCR approach – Two TWC technologies studied
• High PGM, Pd-based technology with no OSC (oxygen storage capacity) • Low PGM, Pd/Rh-based technology with OSC
– Demonstrated controlled NH3 production while rich with >98% CO/HC conversion
10 Managed by UT-Battelle for the U.S. Department of Energy
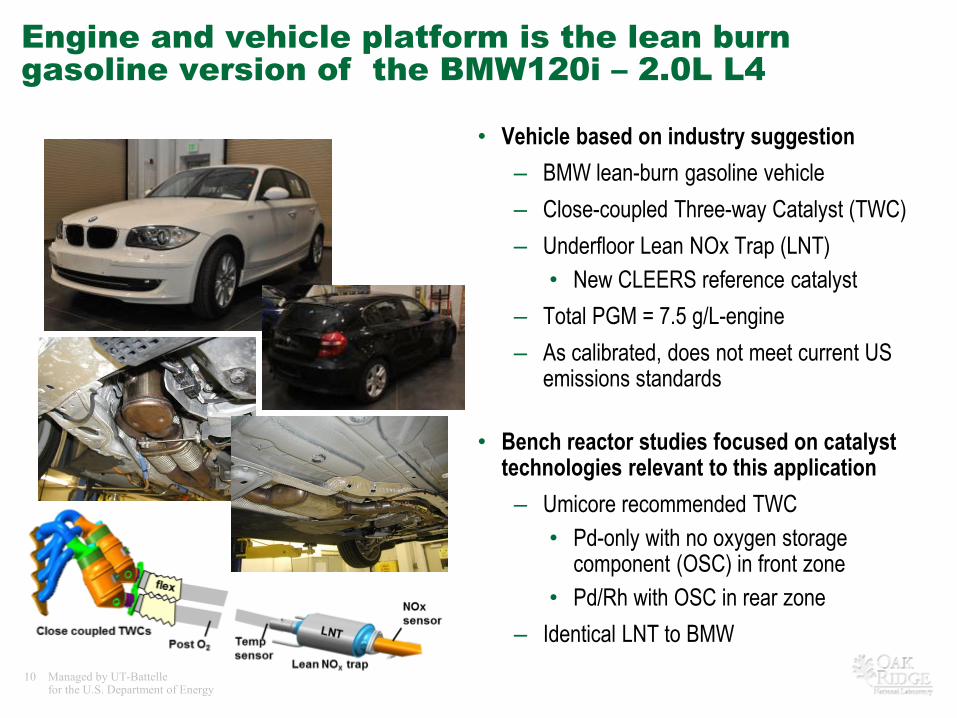
Engine and vehicle platform is the lean burn gasoline version of the BMW120i – 2.0L L4
• Vehicle based on industry suggestion – BMW lean-burn gasoline vehicle – Close-coupled Three-way Catalyst (TWC) – Underfloor Lean NOx Trap (LNT)
• New CLEERS reference catalyst – Total PGM = 7.5 g/L-engine – As calibrated, does not meet current US
emissions standards
• Bench reactor studies focused on catalyst technologies relevant to this application – Umicore recommended TWC
• Pd-only with no oxygen storage component (OSC) in front zone
• Pd/Rh with OSC in rear zone – Identical LNT to BMW

11 Managed by UT-Battelle for the U.S. Department of Energy
LNT: Lean/rich durations varied to establish impact on NOx reduction and NH3 formation
Lean / Rich times CO H2 C3H6
60 s lean/5 s rich 2.01% 0.67% 0.112% 60 s lean/10 s rich 1.01% 0.34% 0.056% 60 s lean/15 s rich 0.67% 0.22% 0.037%
120 s lean/5 s rich 2.83% 0.94% 0.157% 120 s lean/10 s rich 1.42% 0.47% 0.079% 120 s lean/15 s rich 0.94% 0.31% 0.052%
180 s lean/5 s rich 3.65% 1.22% 0.203% 180 s lean/10 s rich 1.82% 0.61% 0.101% 180 s lean/15 s rich 1.22% 0.41% 0.068%
• Investigate 3 lean times and 3 rich times for a total of nine conditions – Hold rich dose/fuel penalty constant for all cases – Stoichiometric reductant concentrations for nitrate reduction to carbonate + OSC reduction
• Develop understanding on tradeoffs of long and short durations – Is it better to have a short rich time with high reductant concentrations? – What is the impact on conversion and NH3 and N2O formation?
Example products during rich portion of 60s lean and 15s rich at 250ºC

12 Managed by UT-Battelle for the U.S. Department of Energy
Practical lean/rich timing variation impacts NOx conversion performance • Short lean times and long, low concentration
rich dose favored at T<350ºC – At 250ºC, NOx conversion varies from 25% to
85%...fuel penalty is constant – Slow NOx release and reduction kinetics
• Need fast, high concentration rich dose to convert stored NOx at T>400ºC
– Fast NOx release and reduction kinetics
Increasing rich time
Increasing rich time
60s lean time

13 Managed by UT-Battelle for the U.S. Department of Energy
NH3 generation occurs between 200 and 350ºC; potential of LNT+SCR
• Up to 45% NO fed goes to NH3 • Comparing NOx and NH3 slip at 250ºC
illustrates potential LNT+SCR system • Unfortunately, N2O yield also peaks at these
conditions
0%
10%
20%
30%
40%
50%
60%
100 150 200 250 300 350 400 450 500 550 600
NH3
Yie
ld (%
)
Temperature (C)
60-5 60-10 60-15
NH
3
NH3
0%
5%
10%
15%
20%
100 150 200 250 300 350 400 450 500 550 600
N2O
Yie
ld (%
)
Temperature (C)
60-5 60-10 60-15
N2O
Increasing rich time
N2O
( )( )
=
fedNOproducedNHYield
XNH
33
0%
20%
40%
60%
80%
100%
100 200 300 400 500 600
%NO
X Slip
ped
Temperature (
C)
60-5 60-10 60-15

14 Managed by UT-Battelle for the U.S. Department of Energy
Understanding NH3 generation over TWC may enable TWC+SCR system without Urea • Measure performance of TWCs as a function
of temperature and components – Overall NO, CO, C3H6 conversion – N2O and NH3 formation
• TWC sections studied independently
– High PGM Pd-only with no oxygen storage component (OSC) • 0/4.4/0 g Pt/Pd/Rh
– Low PGM Pd+Rh with OSC in rear zone • 0/0.8/0.21g Pt/Pd/Rh
• Including LNT into this study will give the
following catalyst types: – PGM-only – PGM + OSC – PGM + OSC + NOx storage
High PGM Pd-only No OSC
Low PGM Pd+Rh w/OSC
0%10%20%30%40%50%60%70%80%90%
100%
350 400 450 500 550 600 650 700
NH3 Y
ield
Midbed Catalyst Temperature (°C
)
Low PGM Pd+Rh
High PGM Pd-Only
SV = 75k h-1

15 Managed by UT-Battelle for the U.S. Department of Energy
TWC is effective and tunable NH3 generator • NH3 readily generated; varies with PGM
– For high PGM (Pd-only) TWC: • All NO fed converted to NH3 when very rich
– For low PGM (Pd+Rh) TWC: • NH3 production is still significant but reduced
• At all conditions, >95% CO conversion
– C3H6 not observed in effluent – >98% CO conversion for O2>1.35% (AFR ~14.4)
• N2O formation observed under lean
conditions and varies with PGM content – Up to 56 ppm with high PGM (Pd-only) TWC – Less than 10 ppm with low PGM (Pd+Rh) TWC
Midbed Temperatures: 460-500ºC
0
200
400
600
800
1000
1200
1400
1.1% 1.2% 1.3% 1.4% 1.5% 1.6% 1.7%
Gas C
once
ntra
tion
(ppm
)
O2 Concentration
High PGM (Pd-only)
NH3
NO
N2O
CO
0
200
400
600
800
1000
1200
1400
1.1% 1.2% 1.3% 1.4% 1.5% 1.6% 1.7%
Gas C
once
ntra
tion
(ppm
)
O2 Concentration
Low PGM (Pd+Rh)
NH3
NO
N2O
CO
~AFR O2 NO CO H2 C3H6
14.6 1.59% 0.12% 1.80% 0.60% 0.10% 14.4 1.34% 0.12% 1.80% 0.60% 0.10% 14.2 1.06% 0.12% 1.80% 0.60% 0.10%

16 Managed by UT-Battelle for the U.S. Department of Energy
NH3 production over LNT and TWC occurs at temperatures relevant to vehicle operation and NH3 storage on SCR
• Histogram of catalyst temperatures during drive cycle with BMW 120i – FTP (hot start) – 200-350ºC for LNT – 350-600ºC for TWC
• LNT: max NH3 yield at 250-300ºC • TWC: tunable NH3 production 350-600ºC
• NH3 production temperatures mesh well
with NH3 storage temperatures on SCR – More NH3 storage occurs under
rich/stoichiometric conditions – However switching from rich to lean will
result in NH3 release if over-saturated 0.0
0.20.40.60.81.01.21.41.61.8
550500450400350300250200
NH3 s
tora
ge ca
pacit
y (g/
l)
Temperature (°C
)
with Oxygen (lean)w/o Oxygen (rich/stoich.)

17 Managed by UT-Battelle for the U.S. Department of Energy
Lean Gasoline Engine Research Platform Development In Progress • Two BMW 120i lean gasoline engine vehicles were procured from Europe and are being
mapped for engine controller development – One vehicle’s engine will be pulled for installation on engine dynamometer
• Subcontract to Drivven for controller development in progress – End controller will have full control capability for research specific engine operation and OEM map operation
for general catalyst and reference studies
Tasks in Controller Development: 1. Procure Vehicles (complete) 2. Verify lean operation (complete) 3. Drivven visit for electronic signal probing (complete) 4. Shipment of one vehicle to Drivven (complete) 5. Calibration of sensors, injectors, etc. (in progress) 6. Harness wiring and mapping preparation (in progress) 7. Full mapping exercise on vehicle at ORNL (May-June 2012) 8. Control software development (June 2012) 9. Engine installation at ORNL (July 2012) 10. Controller installation at ORNL (July 2012) 11. Controller operation and verification (August 2012)

18 Managed by UT-Battelle for the U.S. Department of Energy
Additional future work • Study effects of catalyst composition by varying:
– PGM content, OSC content – Adding NOx storage capacity to TWC – Low temperature CO/HC oxidation
• Impact of lean/rich cycling on TWC – Investigating strategies for minimizing N2O formation
• Age catalysts and evaluate end of life performance – Define durability requirements, time and temperature as related to sulfur exposure and
desulfation requirements • Improve modeling capability to better guide research and meet milestones
• Finalize milestones and achieve year one target
FY13 FY14 FY15 FY16 FY17 Fuel economy gain over stoichiometric
7% 10% 10% 12% 15%
Total emissions control devices Pt* (g/Lengine)
8 7 6 5 4

19 Managed by UT-Battelle for the U.S. Department of Energy
Summary • Relevance: Enabling lean gasoline vehicles will impact significantly on US petroleum use
• Approach: Cost-effective emissions control facilitates introduction of lean-gasoline engines
– Employ multi-platform approach to optimize catalysts and lean engine operation – Employ annual cost and efficiency milestones to push technology
• Collaborations: Industrial (GM and Umicore) and Academic (U-So. Carolina and U-Wisconsin)
• Technical Accomplishments:
– Progressed towards lean gasoline engine dynamometer platform – Measured impact of LNT lean/rich duration on NOx reduction and product yields – Identified TWC NH3 production conditions for passive SCR approach
• Future Work:
– Complete and install DRIVVEN-developed engine controller for engine/chassis operation – Vary OSC and NOx storage component on LNT and TWCs under cycling conditions – Develop and employ aging routine to rapidly age catalysts to end of life – Meet first cost and efficiency milestone of the multi-year program

20 Managed by UT-Battelle for the U.S. Department of Energy
Technical back-up slides

21 Managed by UT-Battelle for the U.S. Department of Energy
4-15% Fuel Economy Benefit but Challenge of Emissions Exceeding U.S. Regulation Levels
• Vehicle designed to meet emissions levels required by European regulations
• NOx emission levels exceed U.S. Tier II Bin 5, 0.05 g/mile at 50k miles • Bin 2 0.02 g/mile
• NOx emissions during lean operation are
problematic • Data shown is from engine vehicle
evaluation at ORNL Drive
Cycle Fuel Economy Improvement*
NOx Emissions (g/mile)
FTP 10.0% 0.11
HFET 14.6% 0.11
US06 4.4% 0.35
Stoich Lean
Tailpipe NOx emissions (g/s)
*comparing stoichiometric operation to lean
Improved Lean NOx catalysis required for
deployment of lean gasoline
vehicles

22 Managed by UT-Battelle for the U.S. Department of Energy
Peak LNT desulfation at 550-580ºC and full performance recovery after desulfating to 700ºC
• Sulfation to 3.4 g/Lcat at 400ºC – 45 ppm SO2 accelerated – NOx conversion drops from 95%
to 77%
• LNT shows low desulfation temperature – Sulfur removal occurs readily
above 400ºC – Peaks at 550-580ºC – Slow release up to 700ºC
• Desulfation to 700ºC results in
complete performance recovery – Suggests targeting 700-750ºC for
aging conditions
400
450
500
550
600
650
700
750
020406080
100120140160180200
0 20 40 60 80
Temperature (°C
) Su
lfur (
ppm
)
Time (min)
SOx (ppm)
Temperature (°C)
0
0.2
0.4
0.6
0.8
1
150 200 250 300 350 400 450 500 550
NOx C
onve
rsio
n
Temperature (°C
)
InitialSulfated at 400°CDesulfated to 700°C

23 Managed by UT-Battelle for the U.S. Department of Energy
0%
20%
40%
60%
80%
100%
100 150 200 250 300 350 400 450 500 550 600
CO C
onve
rsio
n (%
)
Temperature (C)
60-5 60-10 60-15
0%
20%
40%
60%
80%
100%
100 150 200 250 300 350 400 450 500 550 600
CO C
onve
rsio
n (%
)
Temperature (C)
120-5 120-10 120-15
0%
20%
40%
60%
80%
100%
100 150 200 250 300 350 400 450 500 550 600
CO C
onve
rsio
n (%
)
Temperature (C)
180-5 180-10 180-15
Cycle averaged CO conversions • Essentially independent of lean rich
timing – at 300-500C, >80% conversion all conditions
• CO utilization decreases at higher temperatures
– Less NOx stored and fast release – Mismatch in reductant feed and NOx release

24 Managed by UT-Battelle for the U.S. Department of Energy
0%
20%
40%
60%
80%
100%
100 150 200 250 300 350 400 450 500 550 600
C3H6
Con
vers
ion
(%)
Temperature (C)
60-5 60-10 60-15
0%
20%
40%
60%
80%
100%
100 150 200 250 300 350 400 450 500 550 600
C3H6
Con
vers
ion
(%)
Temperature (C)
120-5 120-10 120-15
0%
20%
40%
60%
80%
100%
100 150 200 250 300 350 400 450 500 550 600
C3H6
Con
vers
ion
(%)
Temperature (C)
180-5 180-10 180-15
Cycle averaged C3H6 conversions • Similarly independent of lean/rich timing
– at T>300, >80% conversion all conditions • Except 180s lean / 5s rich
• Looks like a typical light off curve
• Represents propylene disappearance
rather than complete oxidation

25 Managed by UT-Battelle for the U.S. Department of Energy
0
20
40
60
80
100
100 200 300 400 500 600
H2
Temperature (ºC)
NOx c
onve
rsio
n (ºC
)
NOx conv
NH3
N2O
CO C3H6 C3H8
NH3 , N
2 O yield (%)
100 200 300 400 500 600 100 200 300 400 500 6000
20
40
60
80
100 200 300 400 500 600Temperature (ºC) Temperature (ºC) Temperature (ºC)
NOx conv NOx conv NOx conv
NH3 NH3
NH3 NH3 N2O
N2O N2O
Reductant type affects spatial distribution of NH3 chemistry controlling NH3 & N2O yields
• Light-off temperature is highly dependent on reductant type: H2 < CO < C3H6 < C3H8
– At light-off: near max conv. reached using whole LNT – Above light-off: max conv. using partial length of LNT
• NH3 & N2O yields peak at light-off T – Significant slip possible: NH3 ~70%; N2O ~20% – At light-off: reactions forming NH3 (reductant + stored NOx) & N2O (NH3 + stored NOx) maximized – Above light-off: NH3-consuming reactions without generating N2O increase (NH3 + CeO2;
decomposition)
NOx storage
NOx storage oxygen storage